Cambridge IGCSE Geography 0460 — 2008 Oct/Nov Paper 1 · Variant 1
0460/11/O/N/08 · 75 marks · ≈84 min
The question paper and its mark scheme, free to read here and free to download. This is Cambridge’s own paper, exactly as it was sat.
Question paper16 pages

Mark scheme12 pages
Answers below. Sit the paper first if you are practising.
Paper as text
Question paper, page 1
This document consists of 15 printed pages, 1 blank page and 1 Insert. SPA (KN) T47299/3 © UCLES 2008 [Turn over UNIVERSITY OF CAMBRIDGE INTERNATIONAL EXAMINATIONS International General Certificate of Secondary Education READ THESE INSTRUCTIONS FIRST If you have been given an Answer Booklet, follow the instructions on the front cover of the Booklet. Write your Centre number, candidate number and name on all the work you hand in. Write in dark blue or black pen. You may use a soft pencil for any diagrams, graphs, or rough working. Do not use staples, paper clips, highlighters, glue or correction fluid. Answer three questions. Sketch maps and diagrams should be drawn whenever they serve to illustrate an answer. The Insert contains Photograph A for Question 4 and Fig. 9 and Photographs B, C and D for Question 5. At the end of the examination, fasten all your work securely together. The number of marks is given in brackets [ ] at the end of each question or part question. * 2 9 4 4 9 5 7 9 4 5 * GEOGRAPHY 0460/01 Paper 1 October/November 2008 1 hour 45 minutes Additional Materials: Answer Booklet/Paper www.XtremePapers.com
Question paper, page 2
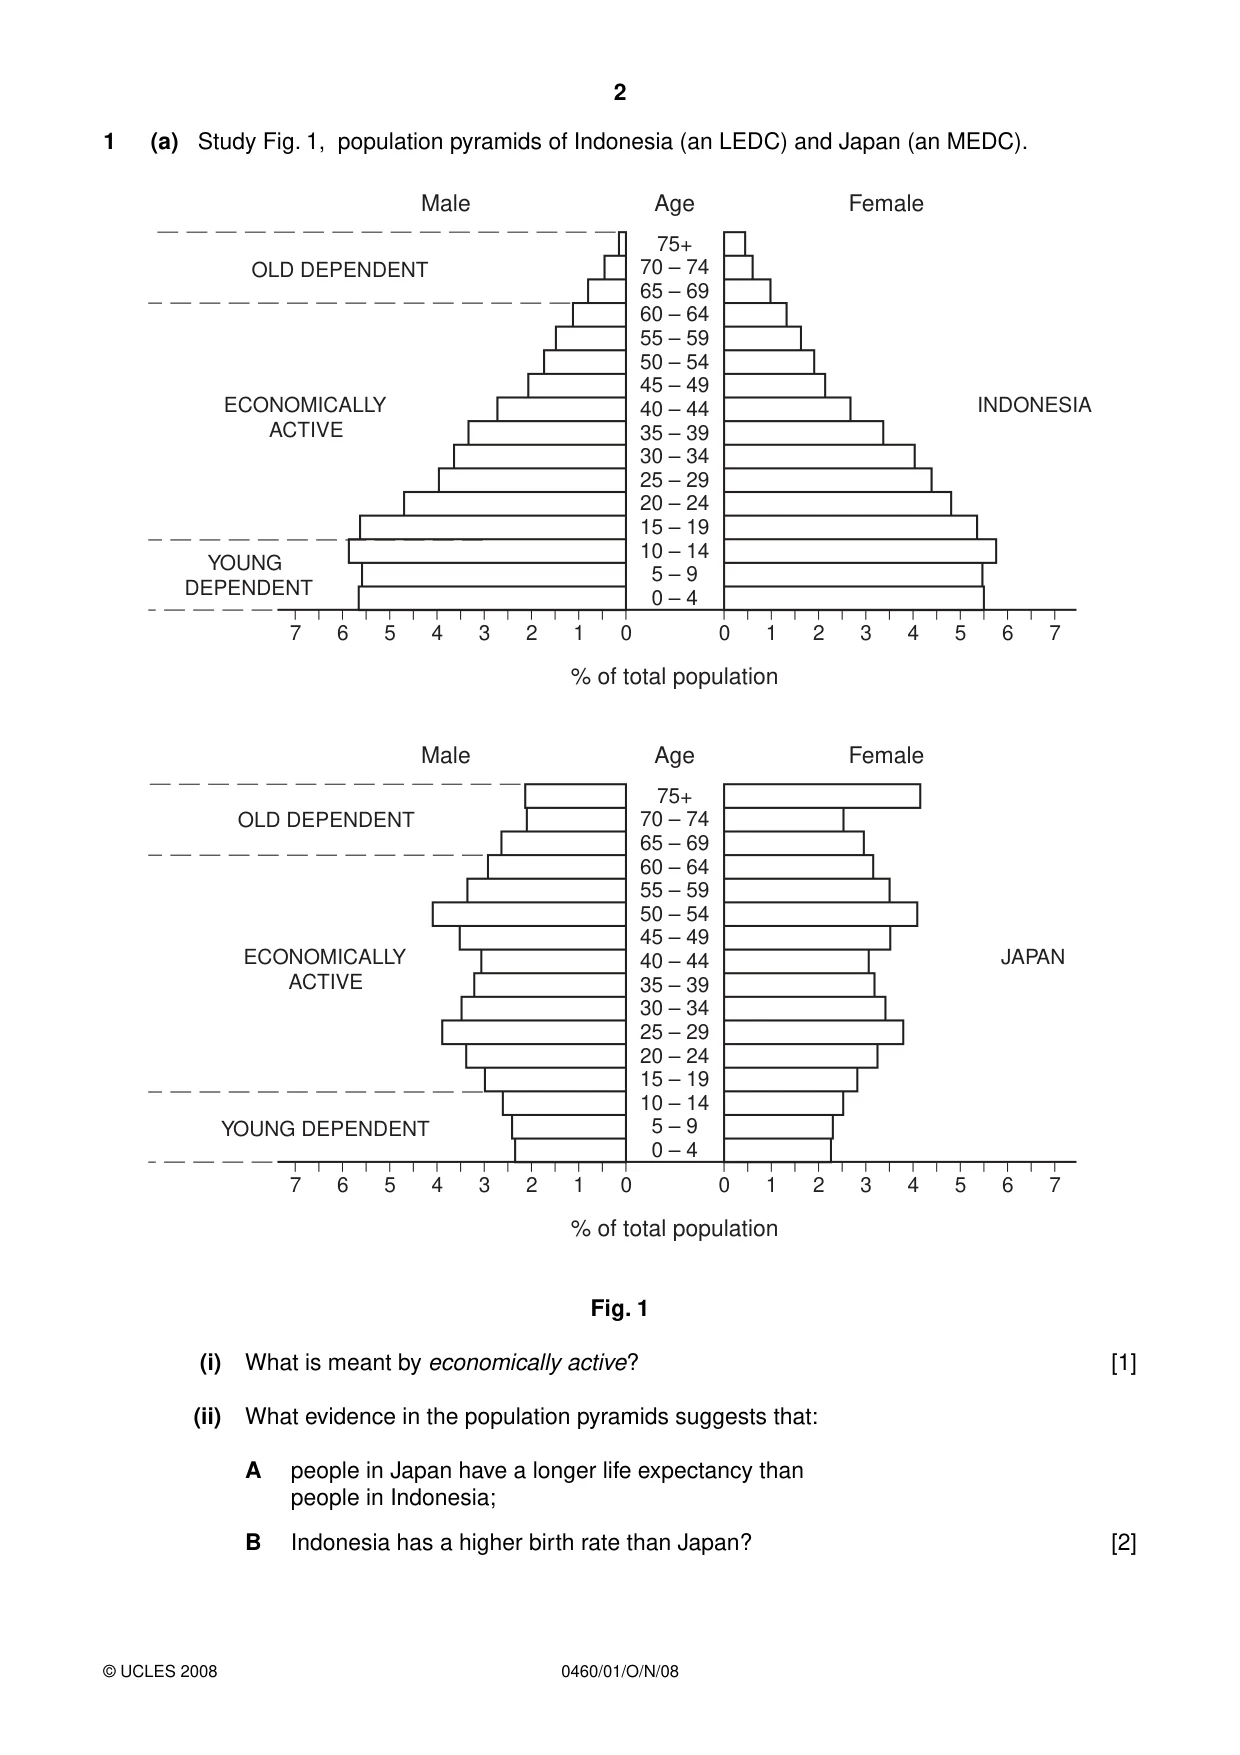
2 0460/01/O/N/08 © UCLES 2008 1 (a) Study Fig. 1, population pyramids of Indonesia (an LEDC) and Japan (an MEDC). 0 0 0 – 4 5 – 9 10 – 14 15 – 19 20 – 24 25 – 29 30 – 34 35 – 39 40 – 44 45 – 49 50 – 54 55 – 59 60 – 64 65 – 69 70 – 74 75+ Age % of total population Male OLD DEPENDENT YOUNG DEPENDENT ECONOMICALLY ACTIVE JAPAN Female 1 2 3 4 5 6 7 1 2 3 4 5 6 7 0 0 0 – 4 5 – 9 10 – 14 15 – 19 20 – 24 25 – 29 30 – 34 35 – 39 40 – 44 45 – 49 50 – 54 55 – 59 60 – 64 65 – 69 70 – 74 75+ Age % of total population Male OLD DEPENDENT YOUNG DEPENDENT ECONOMICALLY ACTIVE INDONESIA Female 1 2 3 4 5 6 7 1 2 3 4 5 6 7 Fig. 1 (i) What is meant by economically active? [1] (ii) What evidence in the population pyramids suggests that: A people in Japan have a longer life expectancy than people in Indonesia; B Indonesia has a higher birth rate than Japan? [2]
Question paper, page 3
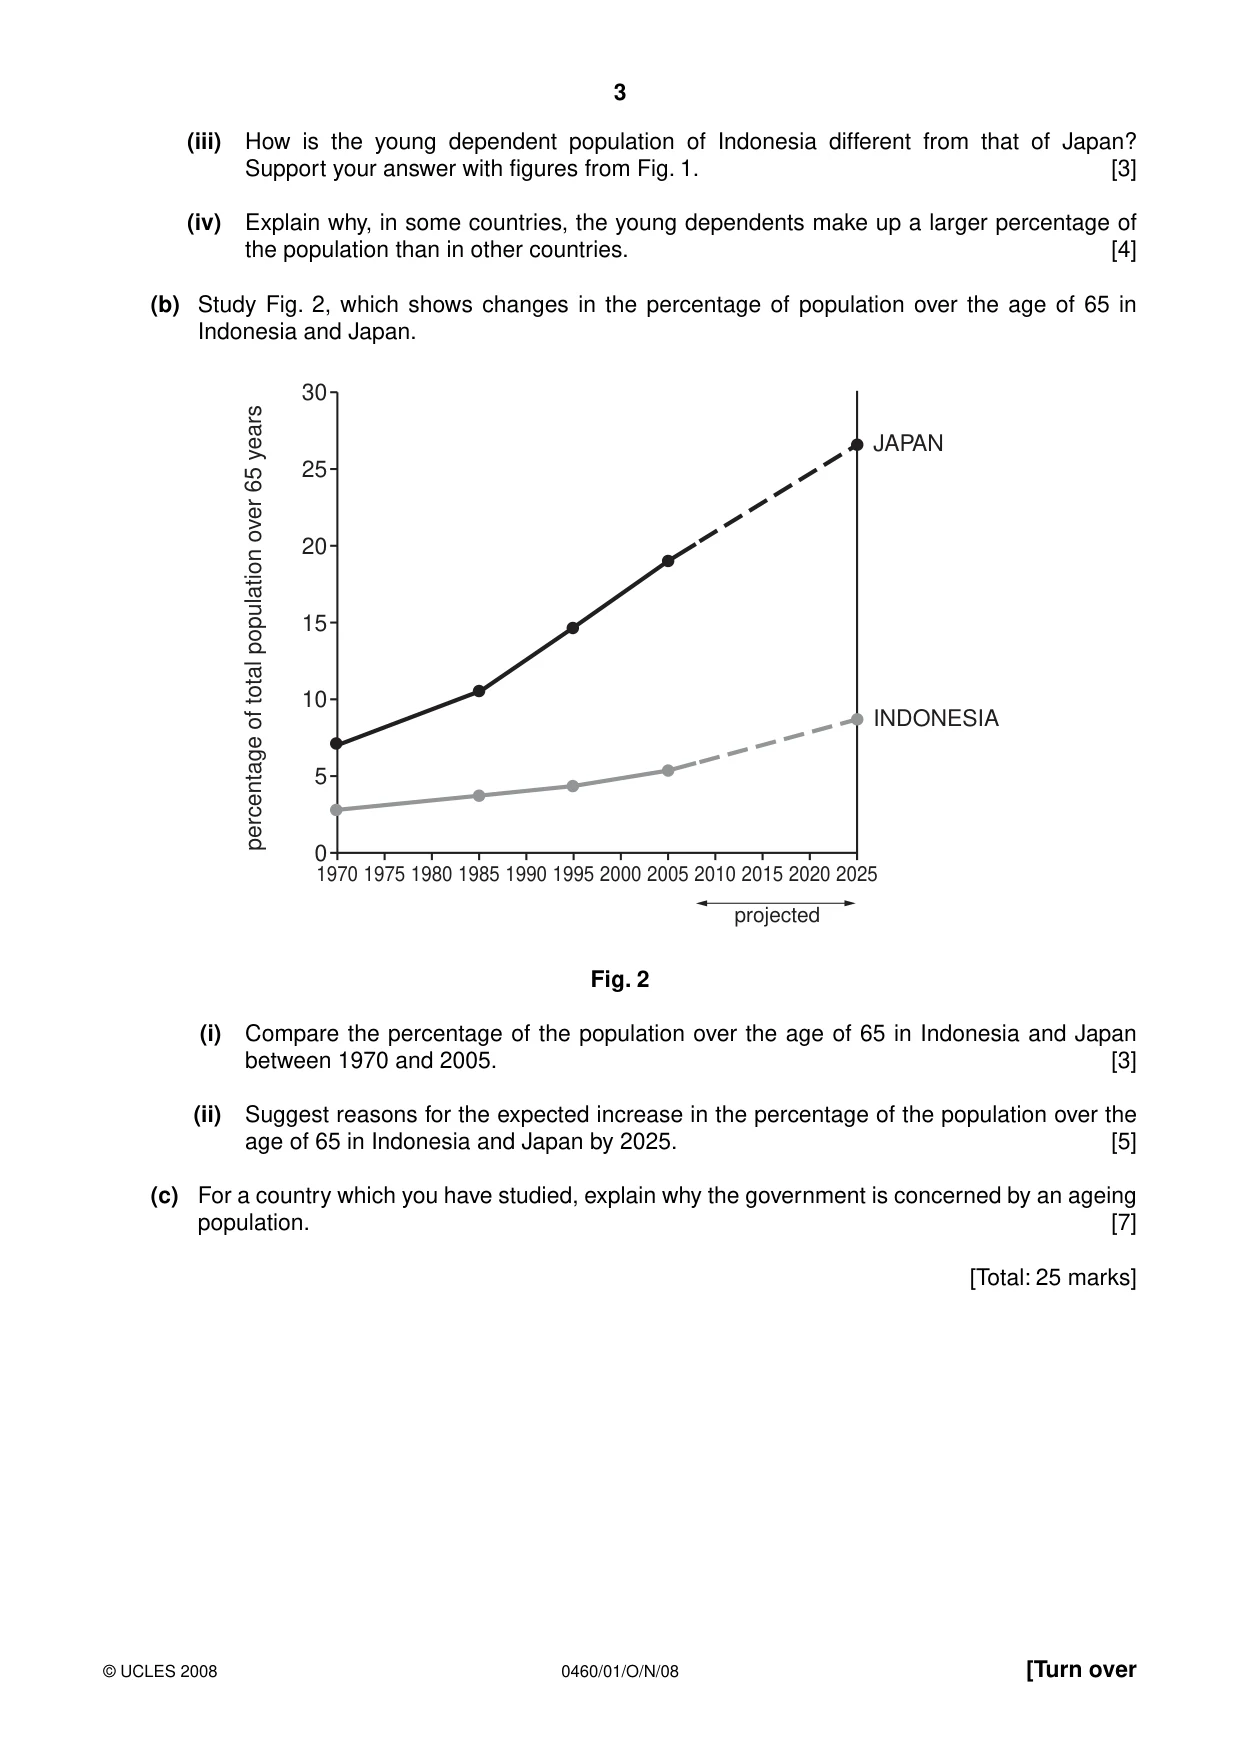
3 0460/01/O/N/08 © UCLES 2008 [Turn over (iii) How is the young dependent population of Indonesia different from that of Japan? Support your answer with figures from Fig. 1. [3] (iv) Explain why, in some countries, the young dependents make up a larger percentage of the population than in other countries. [4] (b) Study Fig. 2, which shows changes in the percentage of population over the age of 65 in Indonesia and Japan. 0 5 10 15 20 25 30 percentage of total population over 65 years 1970 1975 1980 1985 1990 1995 2000 2005 2010 2015 2020 2025 projected INDONESIA JAPAN Fig. 2 (i) Compare the percentage of the population over the age of 65 in Indonesia and Japan between 1970 and 2005. [3] (ii) Suggest reasons for the expected increase in the percentage of the population over the age of 65 in Indonesia and Japan by 2025. [5] (c) For a country which you have studied, explain why the government is concerned by an ageing population. [7] [Total: 25 marks]
Question paper, page 4
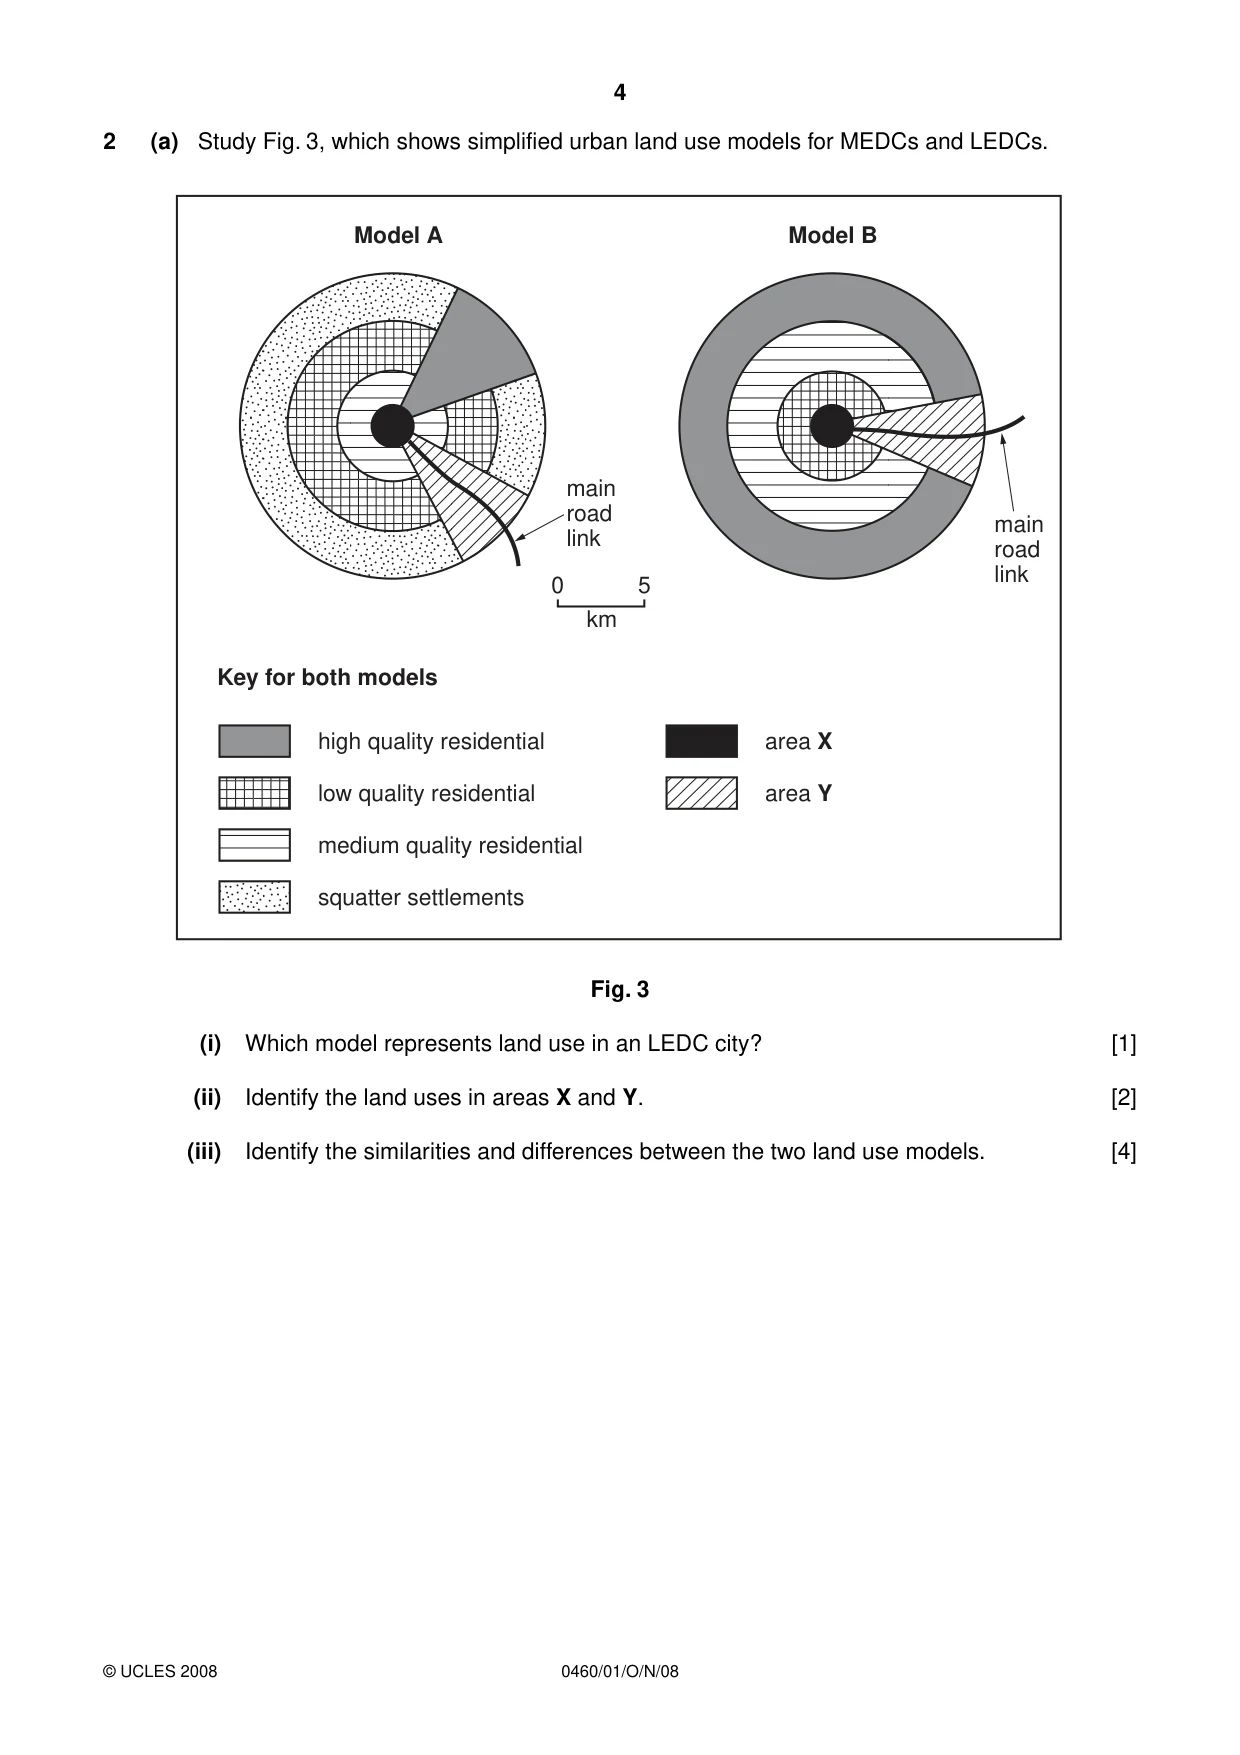
4 0460/01/O/N/08 © UCLES 2008 2 (a) Study Fig. 3, which shows simplified urban land use models for MEDCs and LEDCs. main road link main road link Model A Model B 0 5 km Key for both models high quality residential low quality residential area X area Y medium quality residential squatter settlements Fig. 3 (i) Which model represents land use in an LEDC city? [1] (ii) Identify the land uses in areas X and Y. [2] (iii) Identify the similarities and differences between the two land use models. [4]
Question paper, page 5
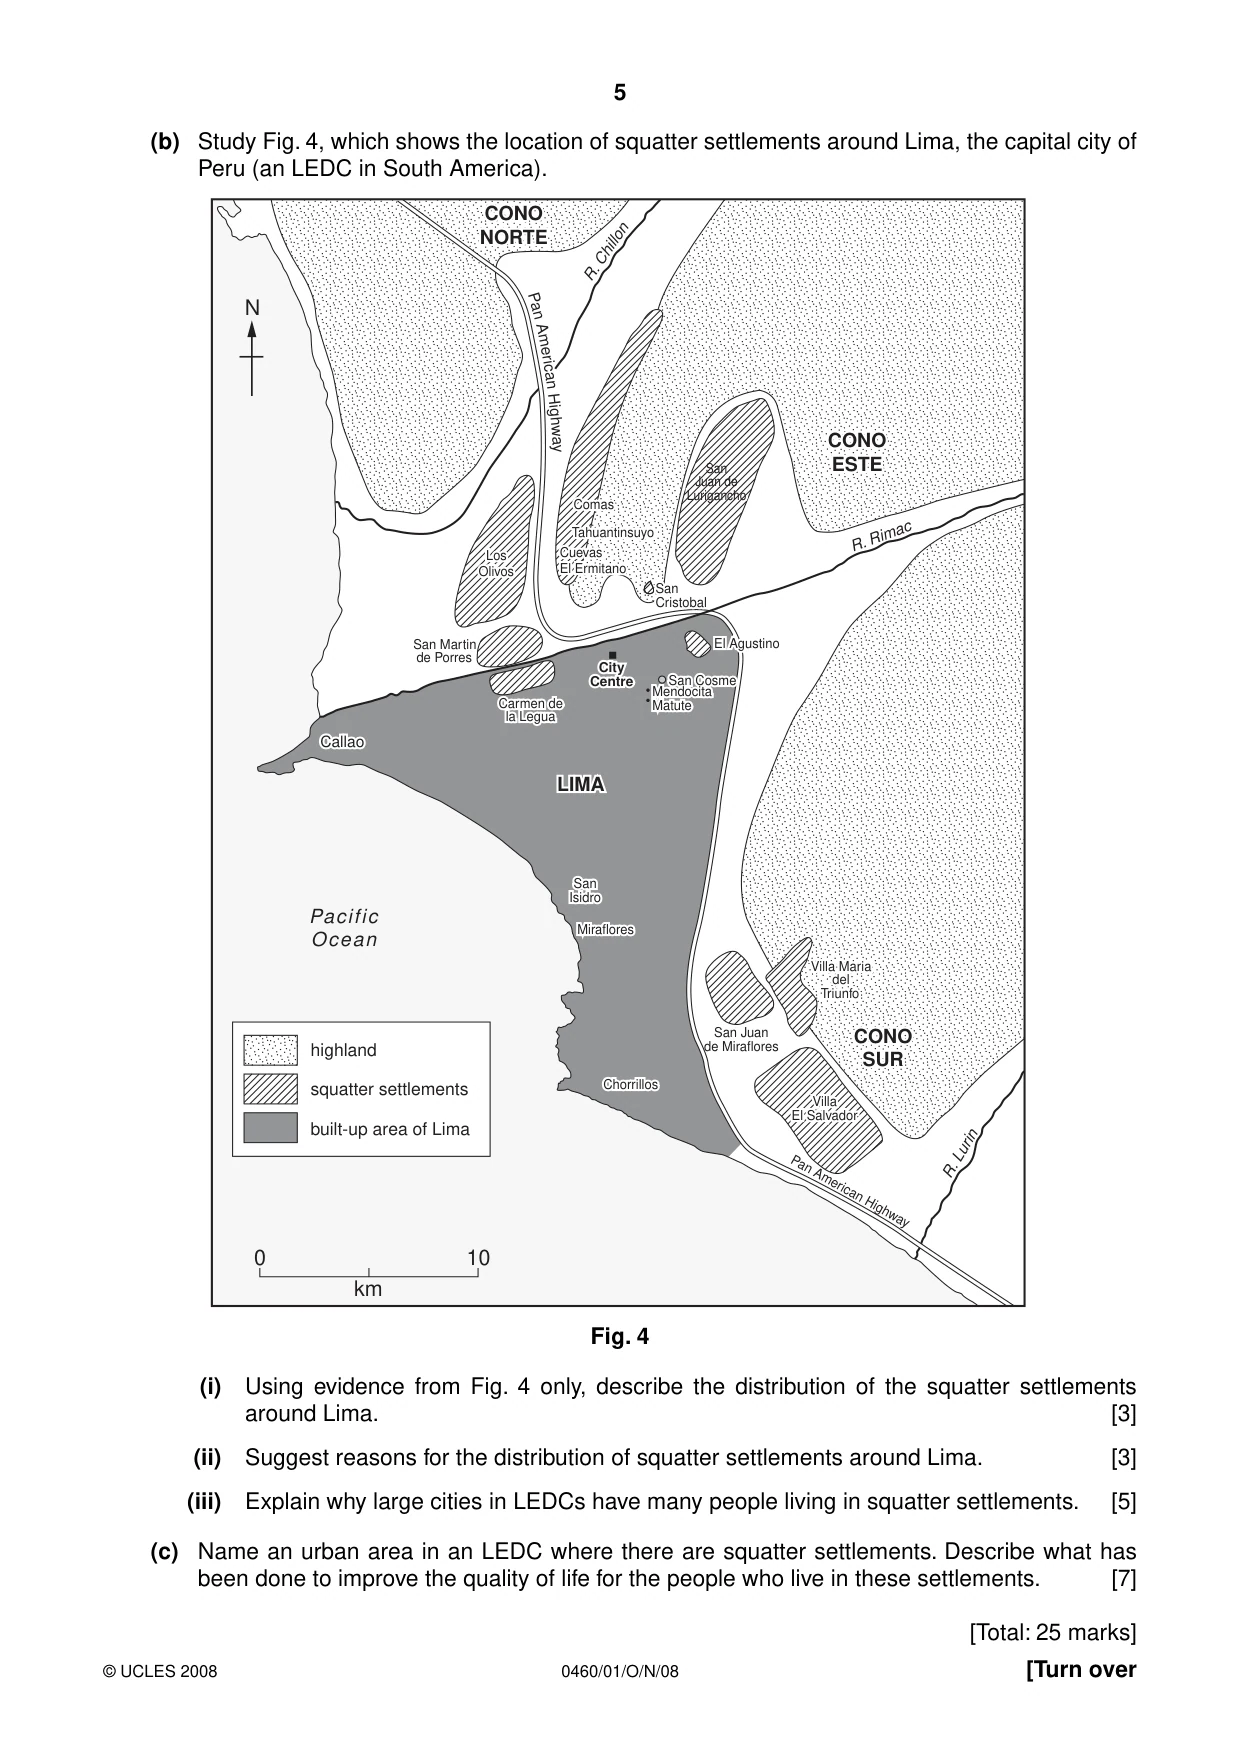
5 0460/01/O/N/08 © UCLES 2008 [Turn over (b) Study Fig. 4, which shows the location of squatter settlements around Lima, the capital city of Peru (an LEDC in South America). 0 10 km N CONO CONO NORTE NORTE CONO CONO ESTE ESTE R. Chillon Pa n A meric an Hig hway R. Rimac San San Cristobal Cristobal San San Juan de Juan de Lurigancho Lurigancho El Agustino El Agustino San Martin de Porres LIMA LIMA San Cosme San Cosme Mendocita Mendocita Matute Matute Carmen de Carmen de la Legua la Legua Callao Callao San San Isidro Isidro Miraflores Miraflores City City Centre Centre Chorrillos Chorrillos San Juan de Miraflores CONO CONO SUR SUR Villa Maria Villa Maria del del Triunfo Triunfo Pan American Highway R. Lurin Pacific Ocean CONO NORTE San Cristobal San Juan de Lurigancho CONO ESTE El Agustino CONO SUR Villa Maria del Triunfo LIMA San Cosme Mendocita Matute Carmen de la Legua Callao San Isidro Miraflores City Centre Chorrillos highland squatter settlements built-up area of Lima Los Los Olivos Olivos Los Olivos Villa Villa El Salvador El Salvador Villa El Salvador Tahuantinsuyo Tahuantinsuyo Tahuantinsuyo Comas Comas Comas Cuevas Cuevas El Ermitano El Ermitano Cuevas El Ermitano Fig. 4 (i) Using evidence from Fig. 4 only, describe the distribution of the squatter settlements around Lima. [3] (ii) Suggest reasons for the distribution of squatter settlements around Lima. [3] (iii) Explain why large cities in LEDCs have many people living in squatter settlements. [5] (c) Name an urban area in an LEDC where there are squatter settlements. Describe what has been done to improve the quality of life for the people who live in these settlements. [7] [Total: 25 marks]
Question paper, page 6
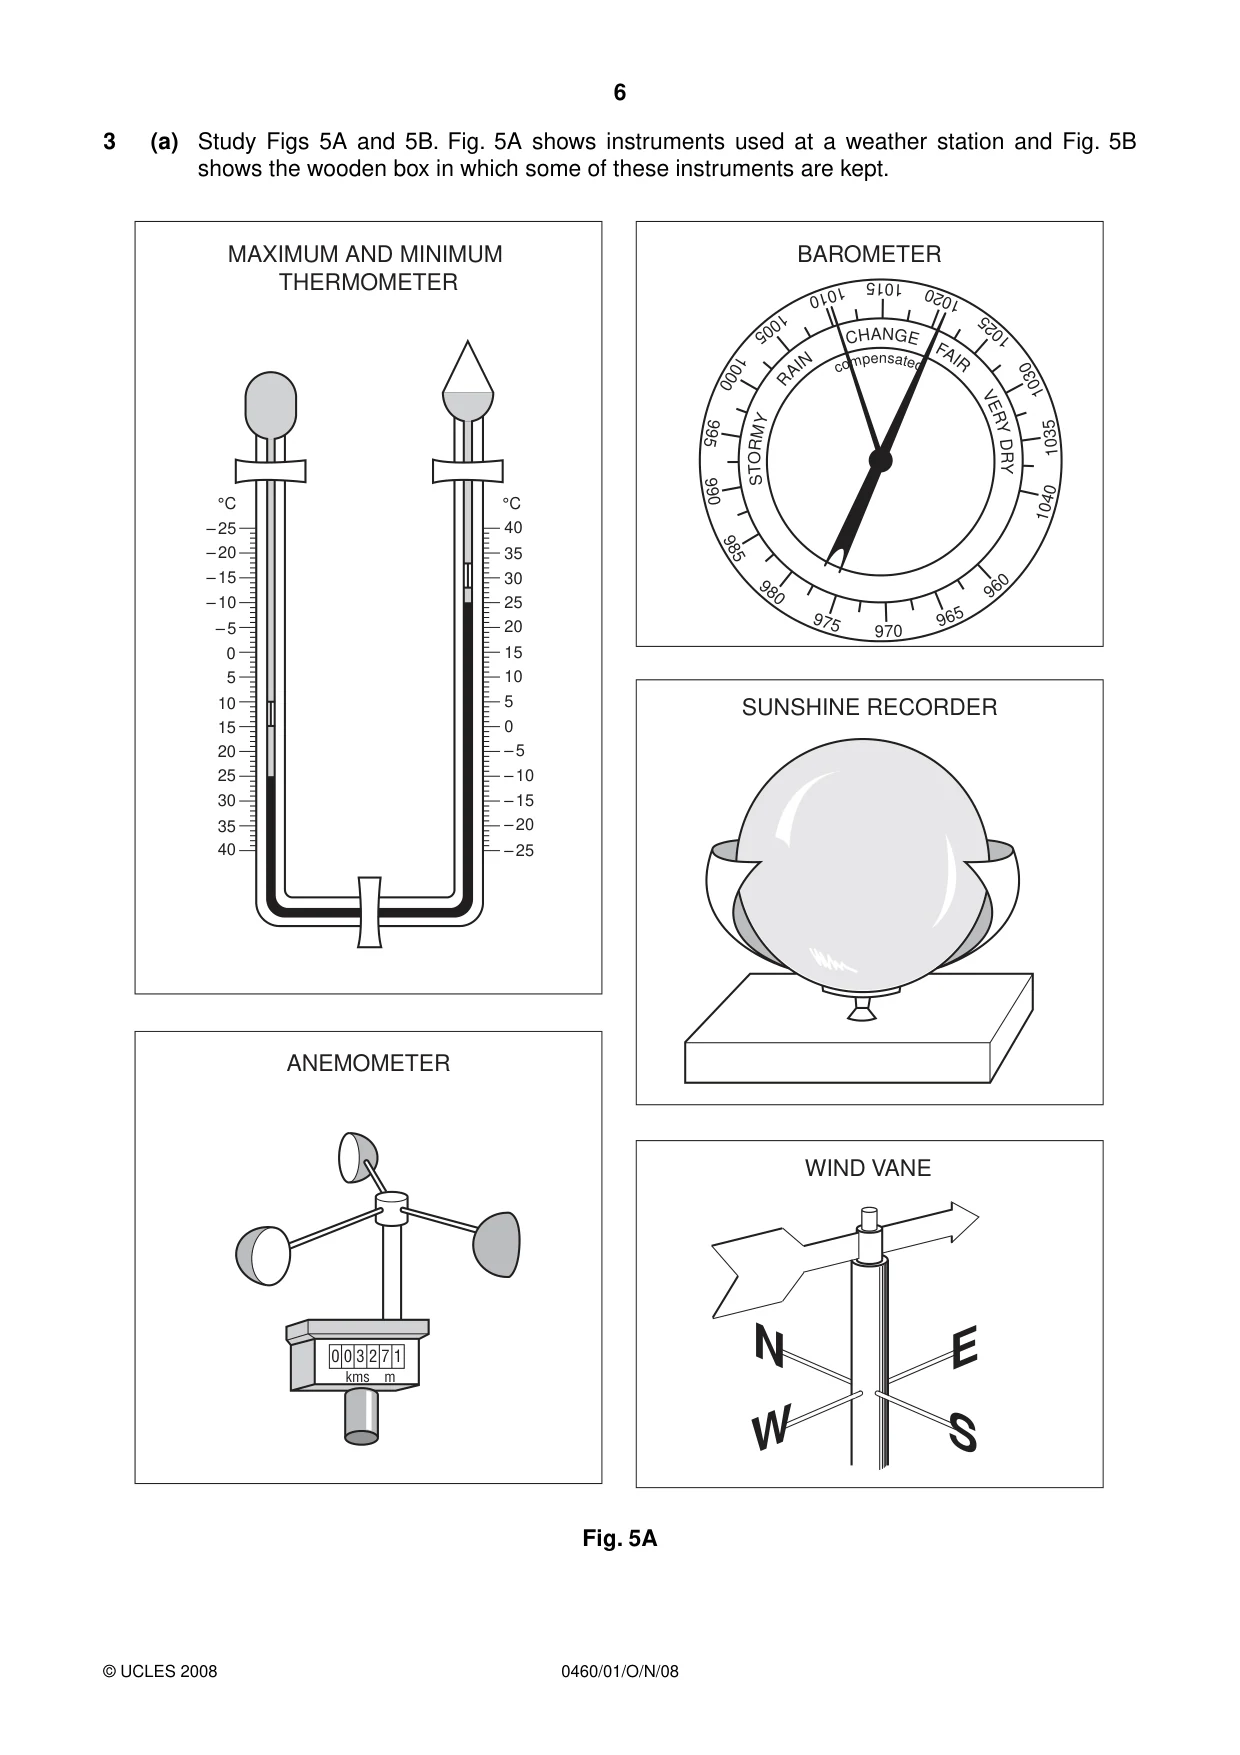
6 0460/01/O/N/08 © UCLES 2008 3 (a) Study Figs 5A and 5B. Fig. 5A shows instruments used at a weather station and Fig. 5B shows the wooden box in which some of these instruments are kept. – 25 – 20 – 15 – 10 – 5 0 5 10 15 20 25 30 35 40 40 35 30 25 20 15 10 5 0 – 5 – 10 – 15 – 20 – 25 °C °C E W S N MAXIMUM AND MINIMUM THERMOMETER ANEMOMETER BAROMETER SUNSHINE RECORDER 970 965 960 975 980 985 990 995 1000 1005 1010 1015 1020 1025 1030 1035 1040 S T O R M Y R A I N C H A N G E F A I R V E R Y D R Y c o m p e n s a t e d 0 0 3 2 7 1 kms m WIND VANE Fig. 5A
Question paper, page 7
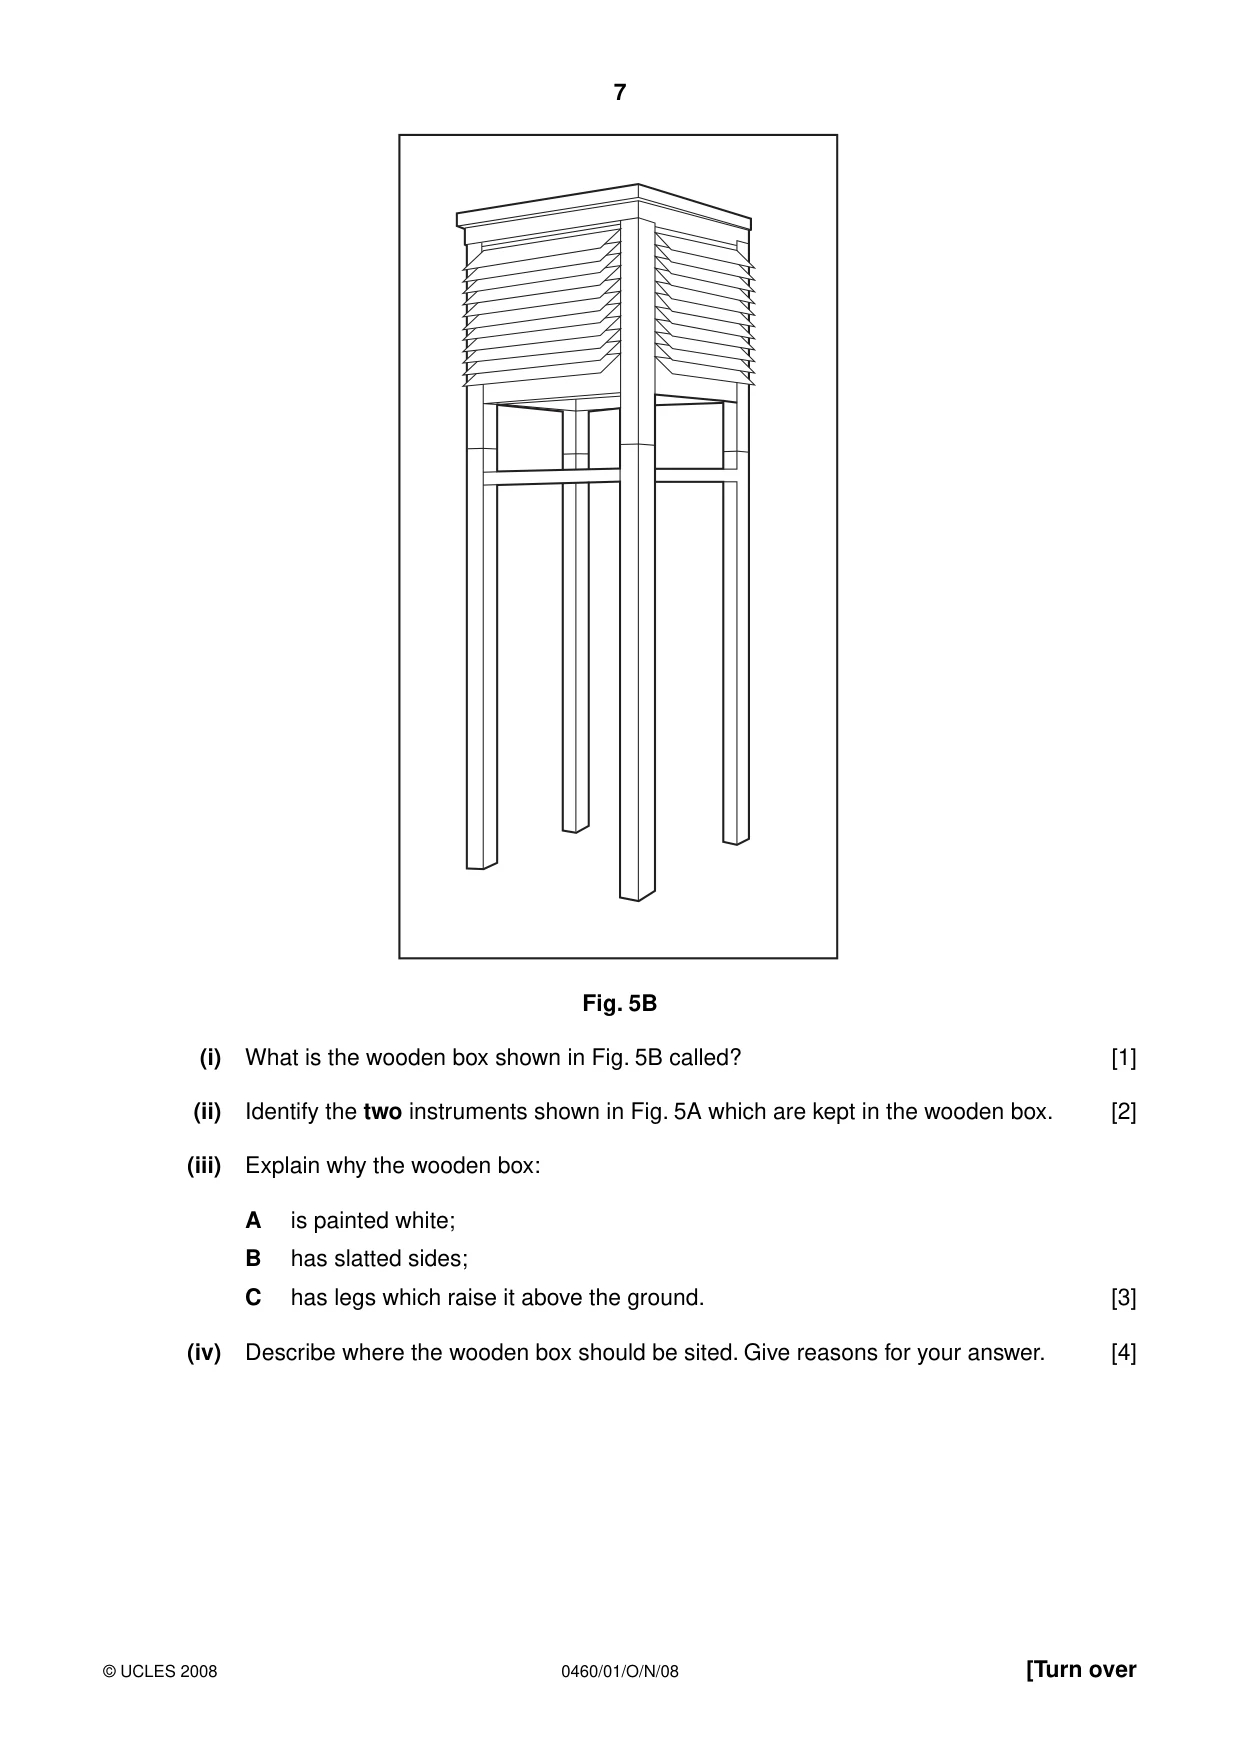
7 0460/01/O/N/08 © UCLES 2008 [Turn over Fig. 5B (i) What is the wooden box shown in Fig. 5B called? [1] (ii) Identify the two instruments shown in Fig. 5A which are kept in the wooden box. [2] (iii) Explain why the wooden box: A is painted white; B has slatted sides; C has legs which raise it above the ground. [3] (iv) Describe where the wooden box should be sited. Give reasons for your answer. [4]
Question paper, page 8
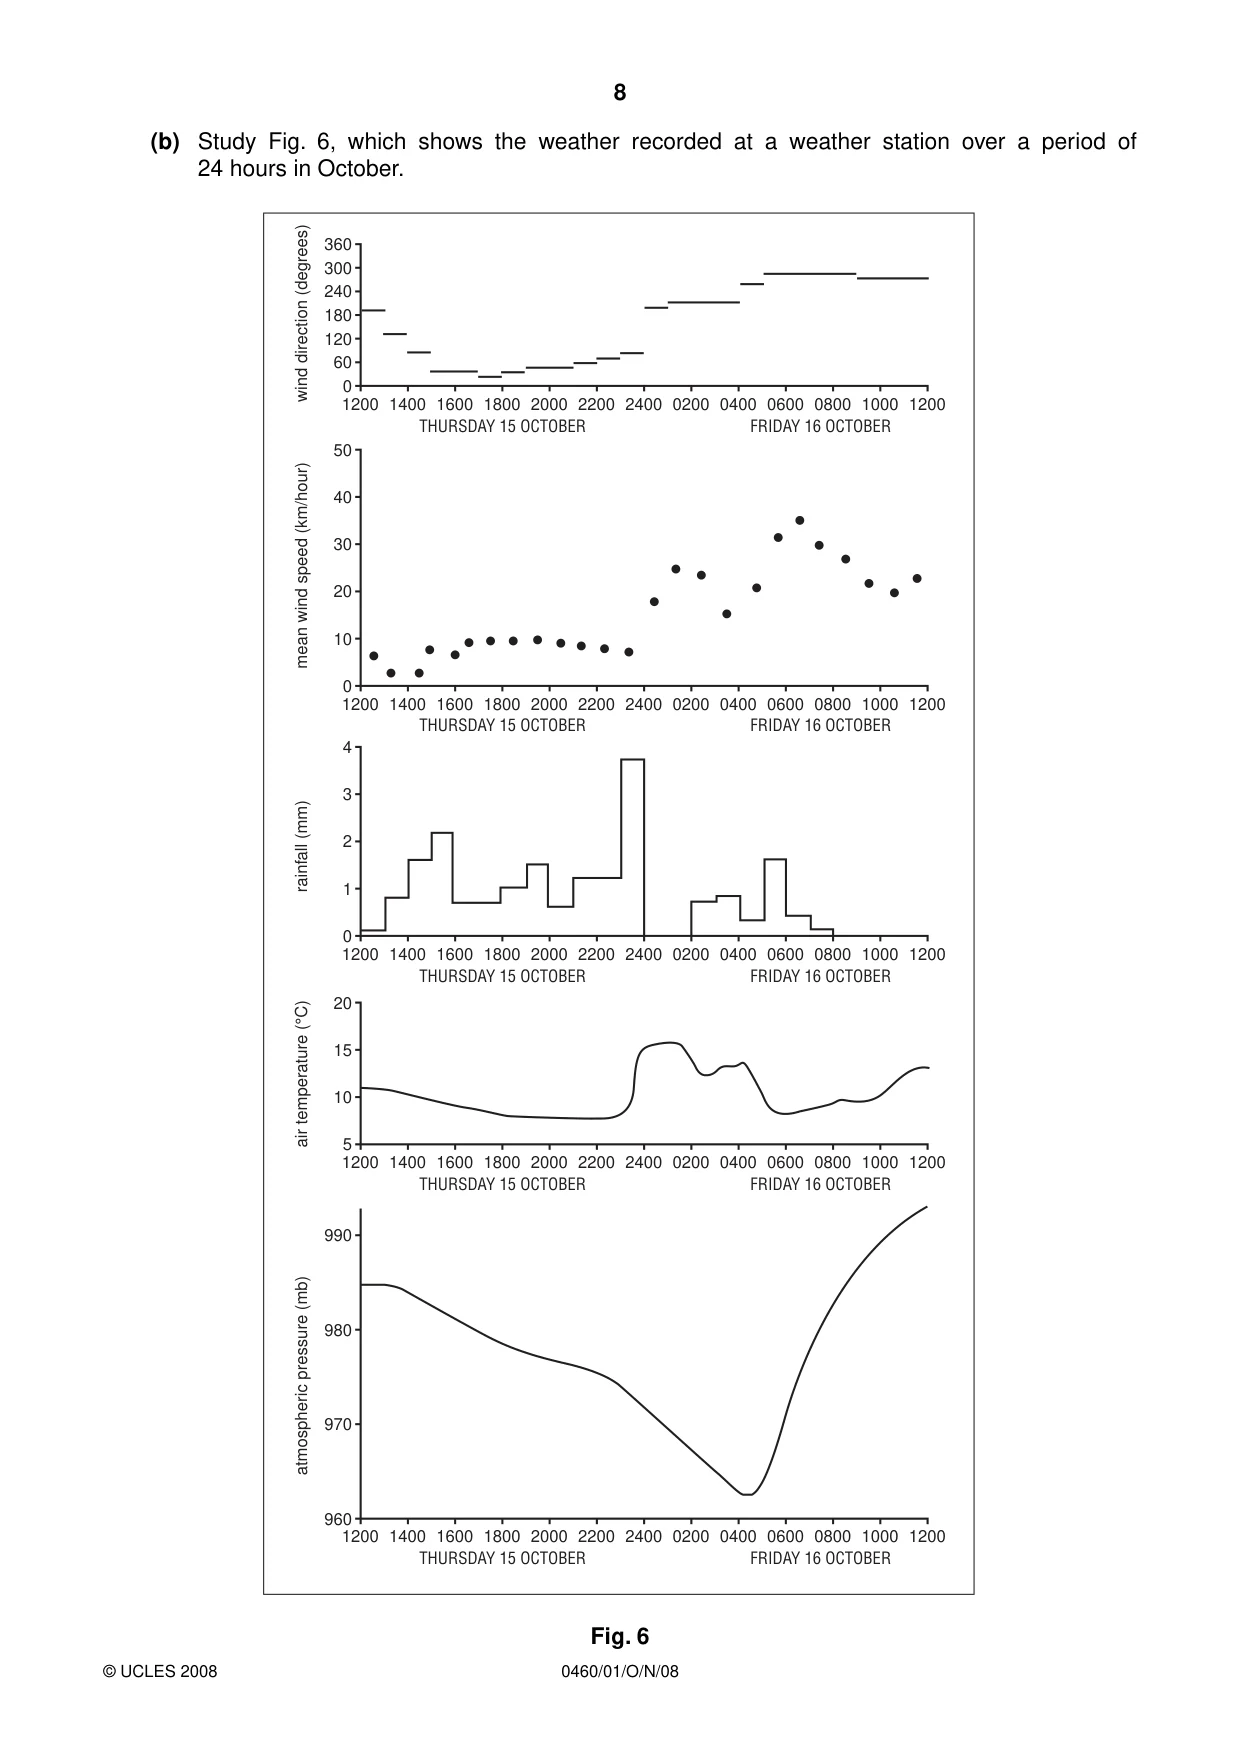
8 0460/01/O/N/08 © UCLES 2008 (b) Study Fig. 6, which shows the weather recorded at a weather station over a period of 24 hours in October. 1200 1400 1600 1800 2000 2200 2400 0200 0400 0600 0800 1000 1200 960 970 980 990 THURSDAY 15 OCTOBER FRIDAY 16 OCTOBER atmospheric pressure (mb) 1200 1400 1600 1800 2000 2200 2400 0200 0400 0600 0800 1000 1200 5 10 15 20 THURSDAY 15 OCTOBER FRIDAY 16 OCTOBER air temperature (°C) 1200 1400 1600 1800 2000 2200 2400 0200 0400 0600 0800 1000 1200 0 1 2 3 4 THURSDAY 15 OCTOBER FRIDAY 16 OCTOBER rainfall (mm) 1200 1400 1600 1800 2000 2200 2400 0200 0400 0600 0800 1000 1200 0 10 20 30 40 50 THURSDAY 15 OCTOBER FRIDAY 16 OCTOBER mean wind speed (km/hour) 1200 1400 1600 1800 2000 2200 2400 0200 0400 0600 0800 1000 1200 0 60 120 180 240 300 360 THURSDAY 15 OCTOBER FRIDAY 16 OCTOBER wind direction (degrees) Fig. 6
Question paper, page 9
9 0460/01/O/N/08 © UCLES 2008 [Turn over (i) Describe how the atmospheric pressure changed over the 24 hour period. [3] (ii) Compare the weather at 16.00 (15 October) and 02.00 hrs (16 October). [5] (c) Name an area which you have studied where drought occurs. Describe the problems experienced by people living in your chosen area. [7] [Total: 25 marks]
Question paper, page 10
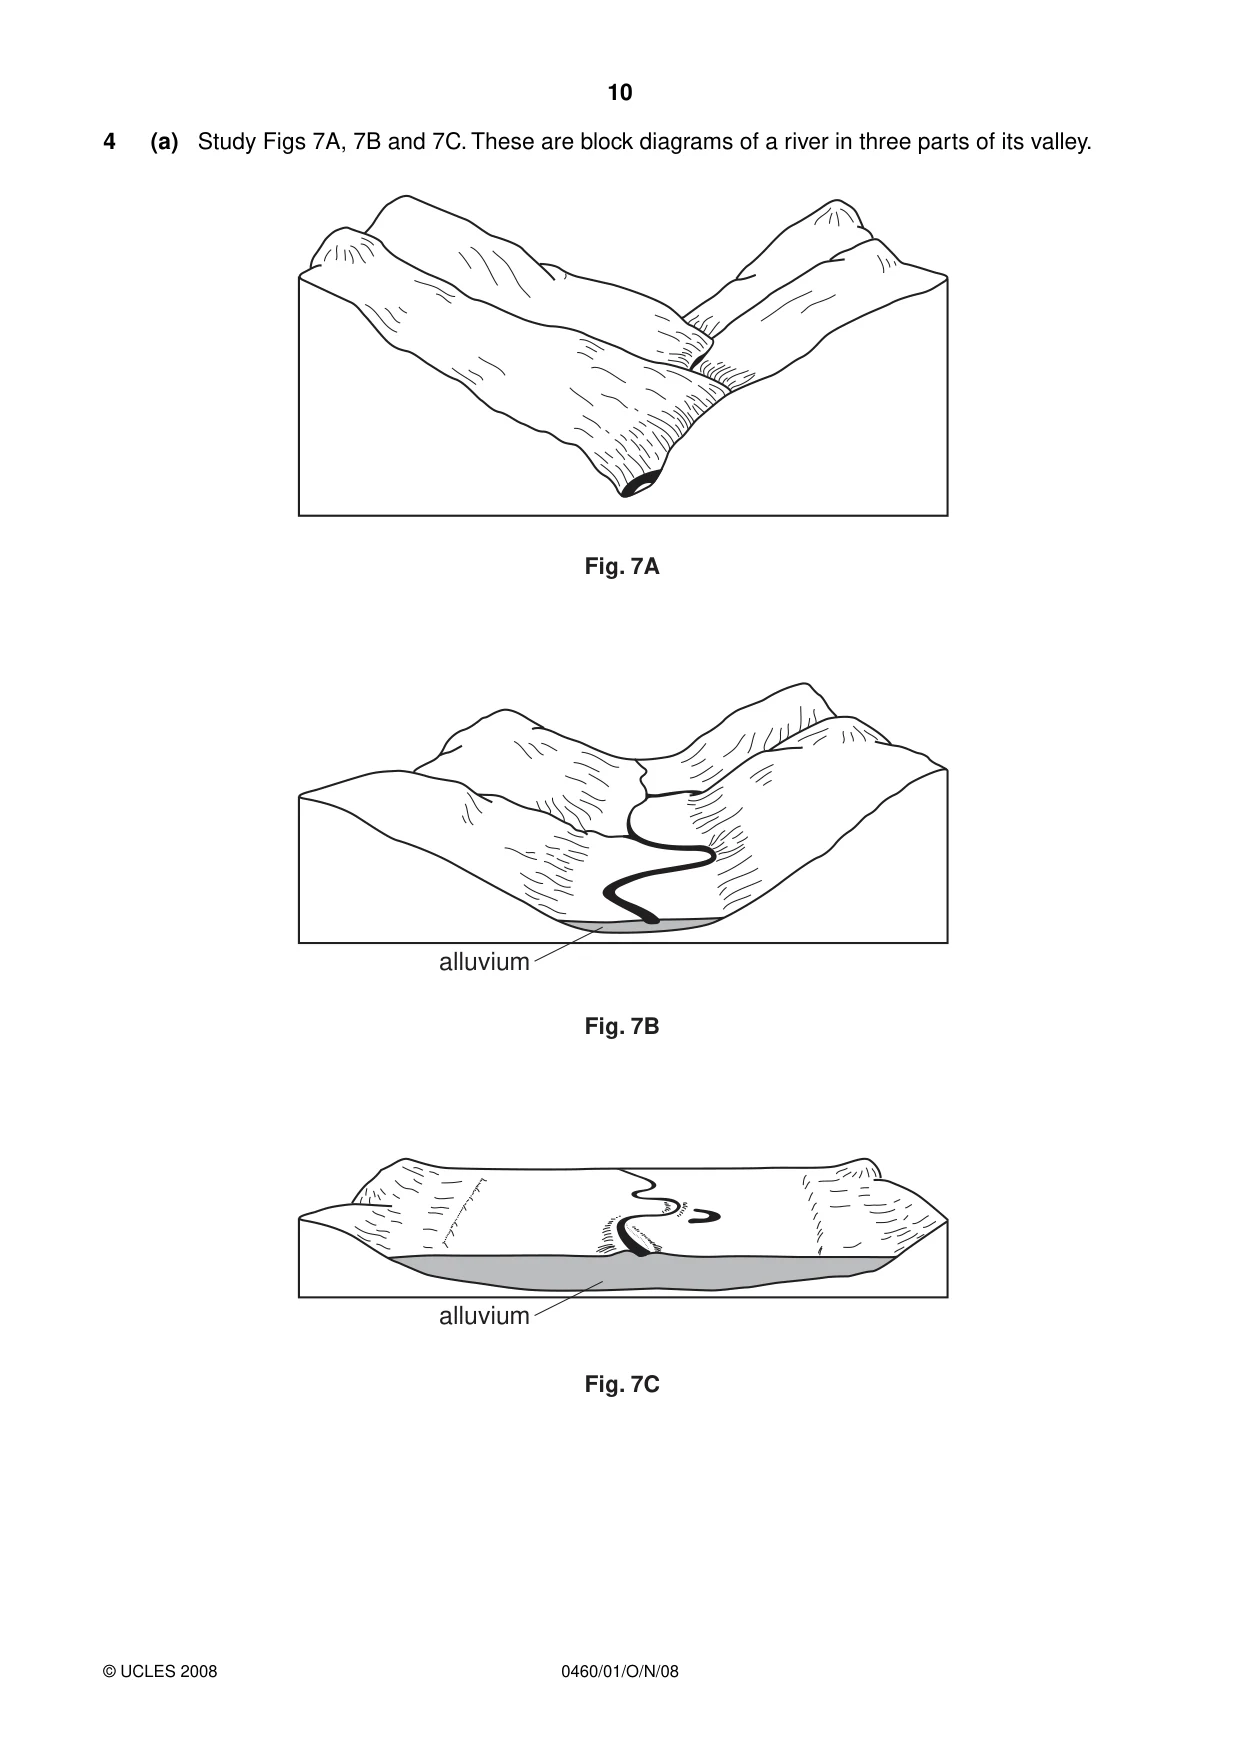
10 0460/01/O/N/08 © UCLES 2008 4 (a) Study Figs 7A, 7B and 7C. These are block diagrams of a river in three parts of its valley. alluvium alluvium Fig. 7A Fig. 7B Fig. 7C
Question paper, page 11
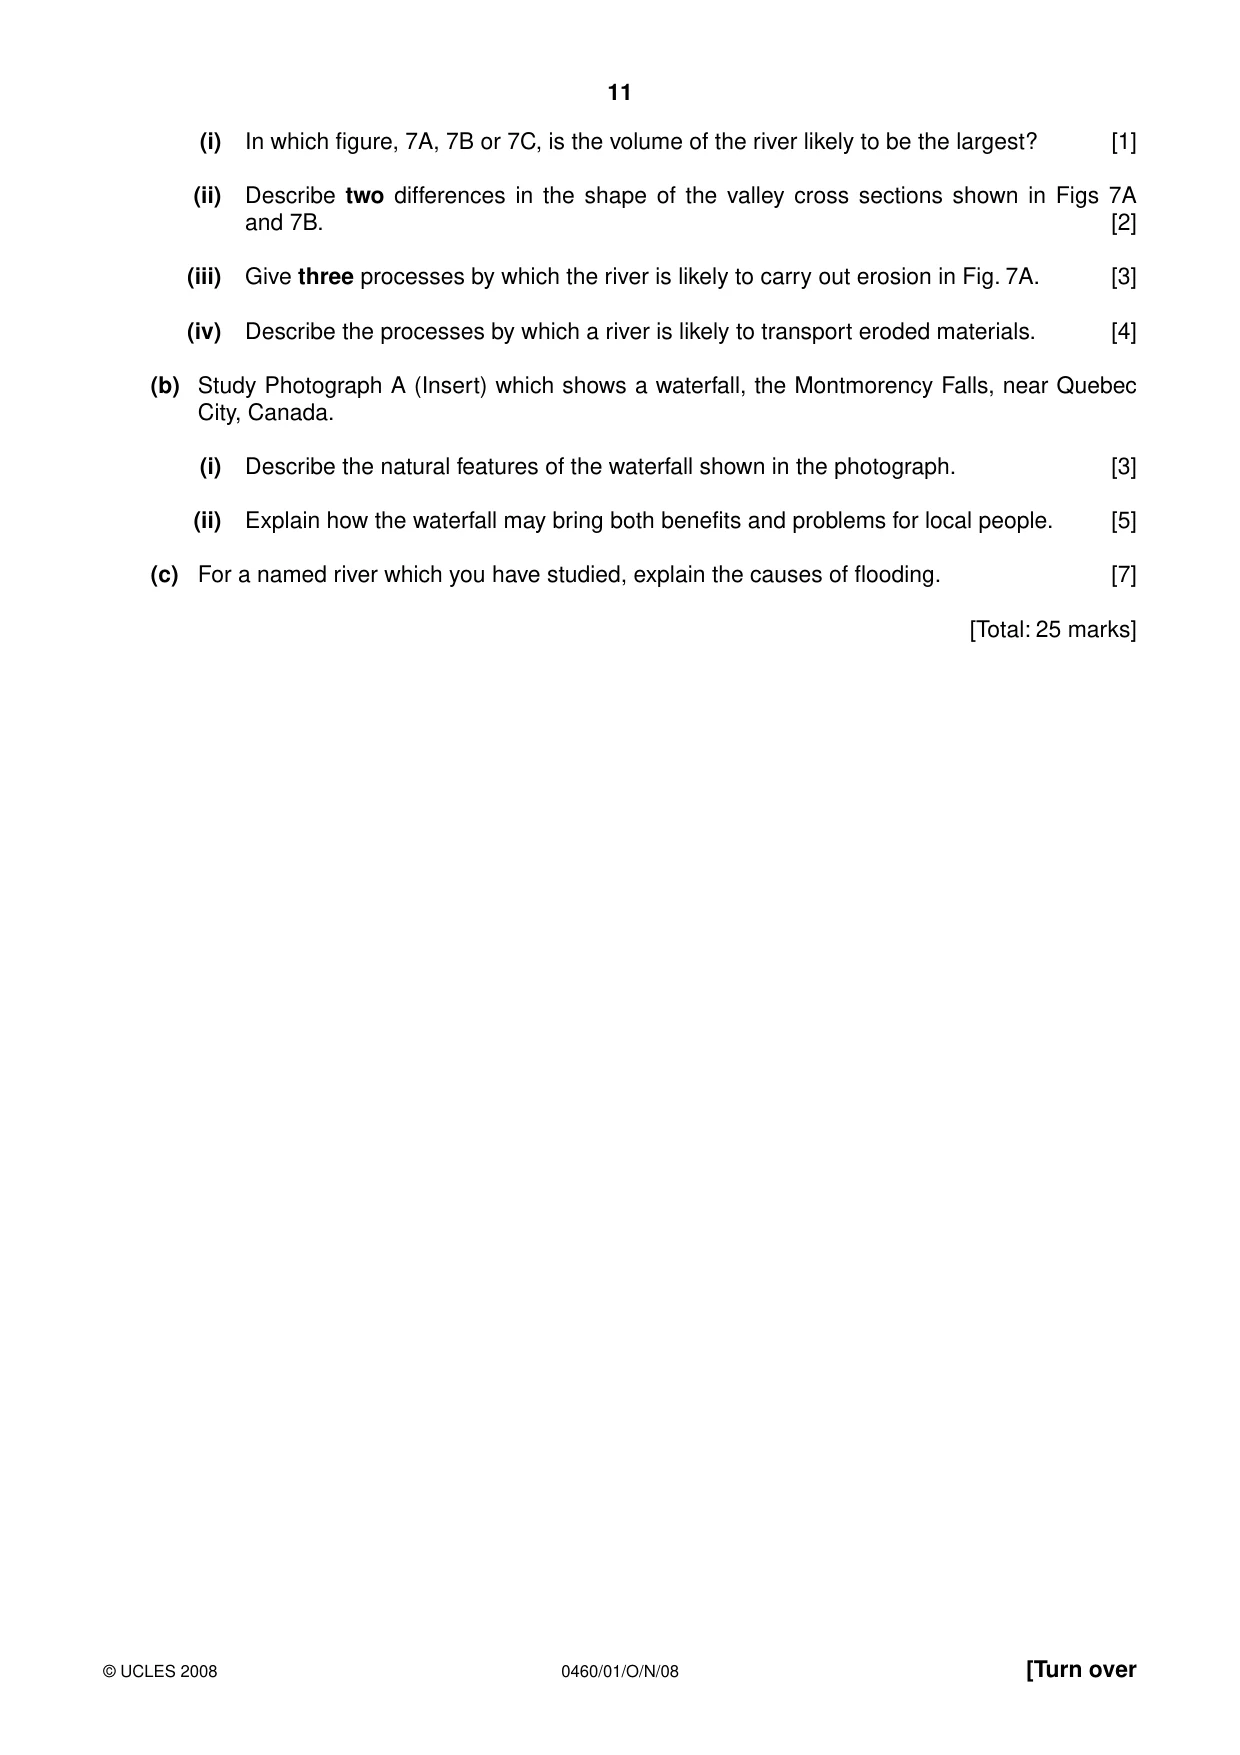
11 0460/01/O/N/08 © UCLES 2008 [Turn over (i) In which figure, 7A, 7B or 7C, is the volume of the river likely to be the largest? [1] (ii) Describe two differences in the shape of the valley cross sections shown in Figs 7A and 7B. [2] (iii) Give three processes by which the river is likely to carry out erosion in Fig. 7A. [3] (iv) Describe the processes by which a river is likely to transport eroded materials. [4] (b) Study Photograph A (Insert) which shows a waterfall, the Montmorency Falls, near Quebec City, Canada. (i) Describe the natural features of the waterfall shown in the photograph. [3] (ii) Explain how the waterfall may bring both benefits and problems for local people. [5] (c) For a named river which you have studied, explain the causes of flooding. [7] [Total: 25 marks]
Question paper, page 12
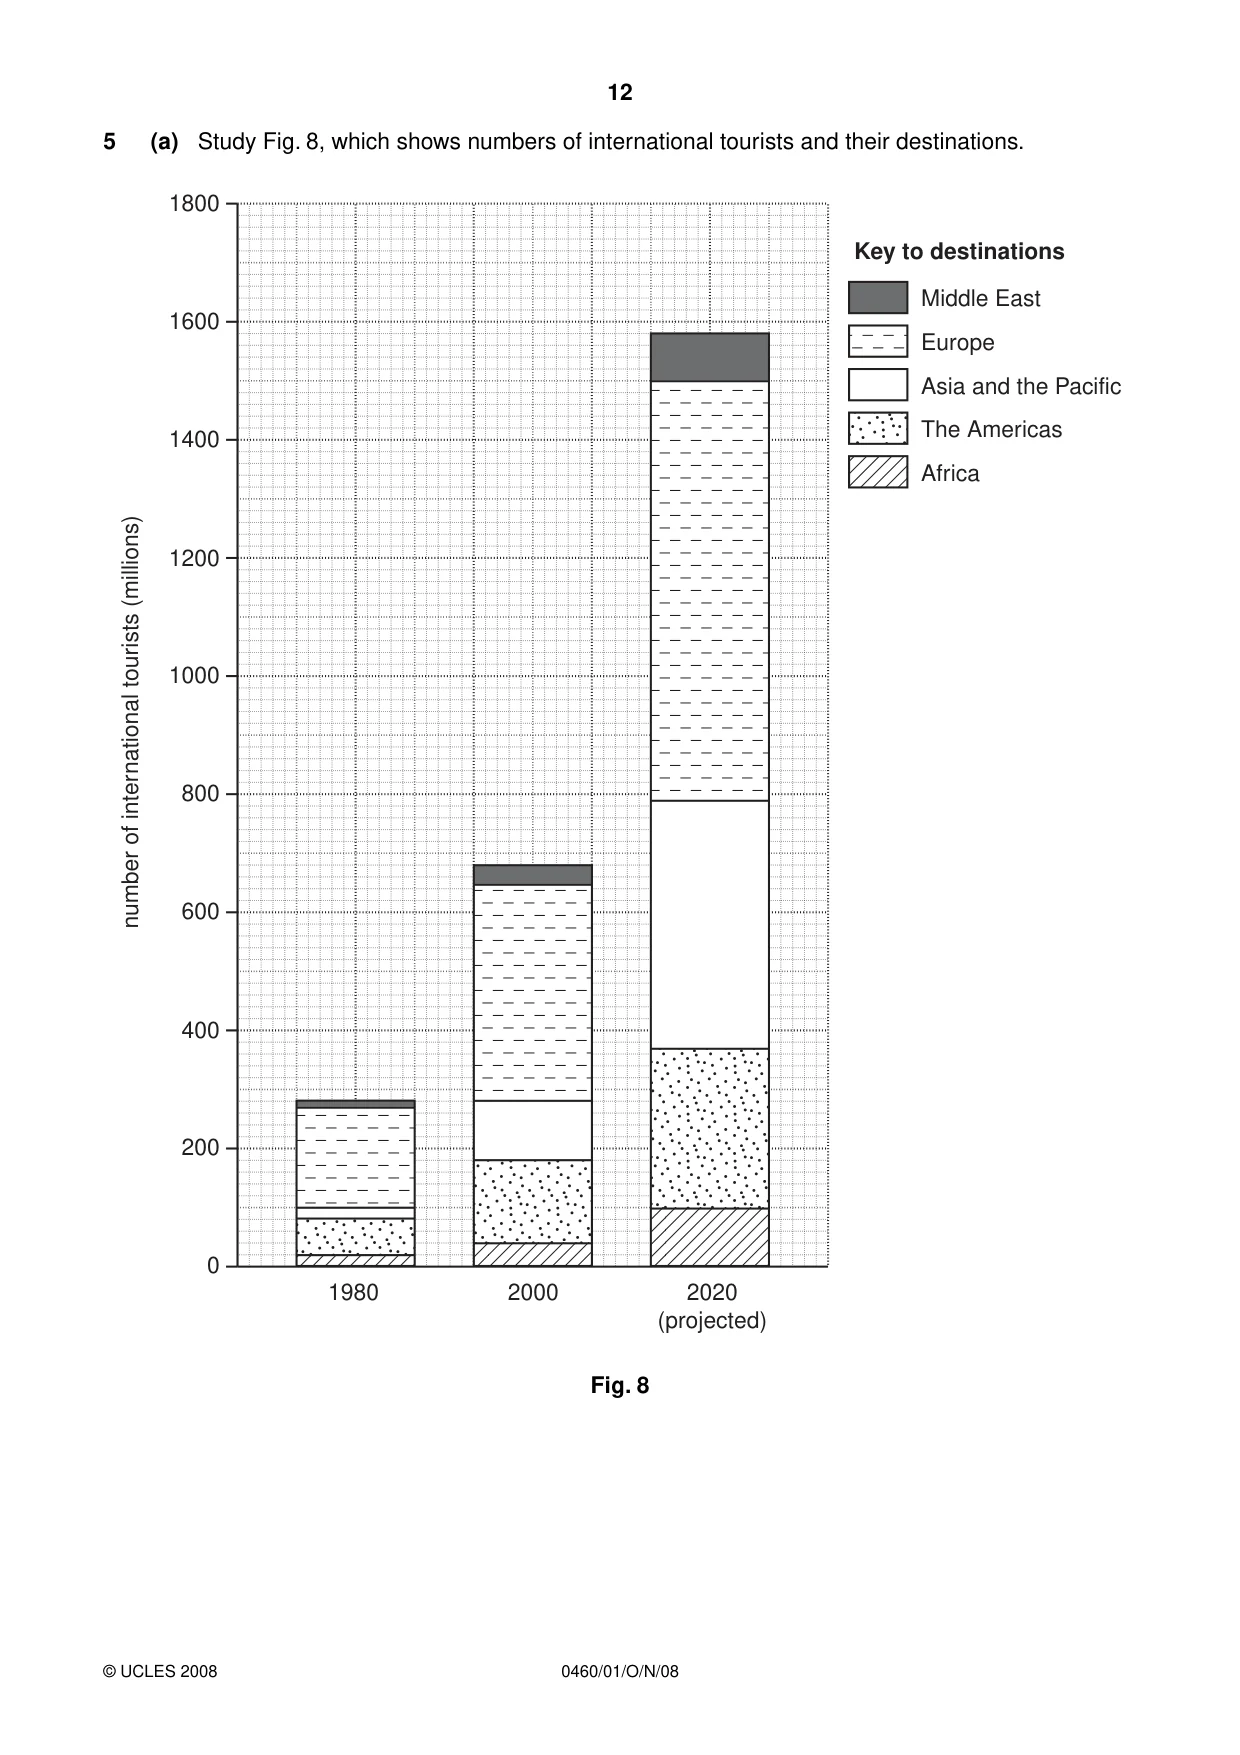
12 0460/01/O/N/08 © UCLES 2008 5 (a) Study Fig. 8, which shows numbers of international tourists and their destinations. 1800 Middle East Key to destinations 1600 1400 1200 1000 800 600 400 200 0 1980 2000 2020 (projected) number of international tourists (millions) Europe Asia and the Pacific The Americas Africa Fig. 8
Question paper, page 13
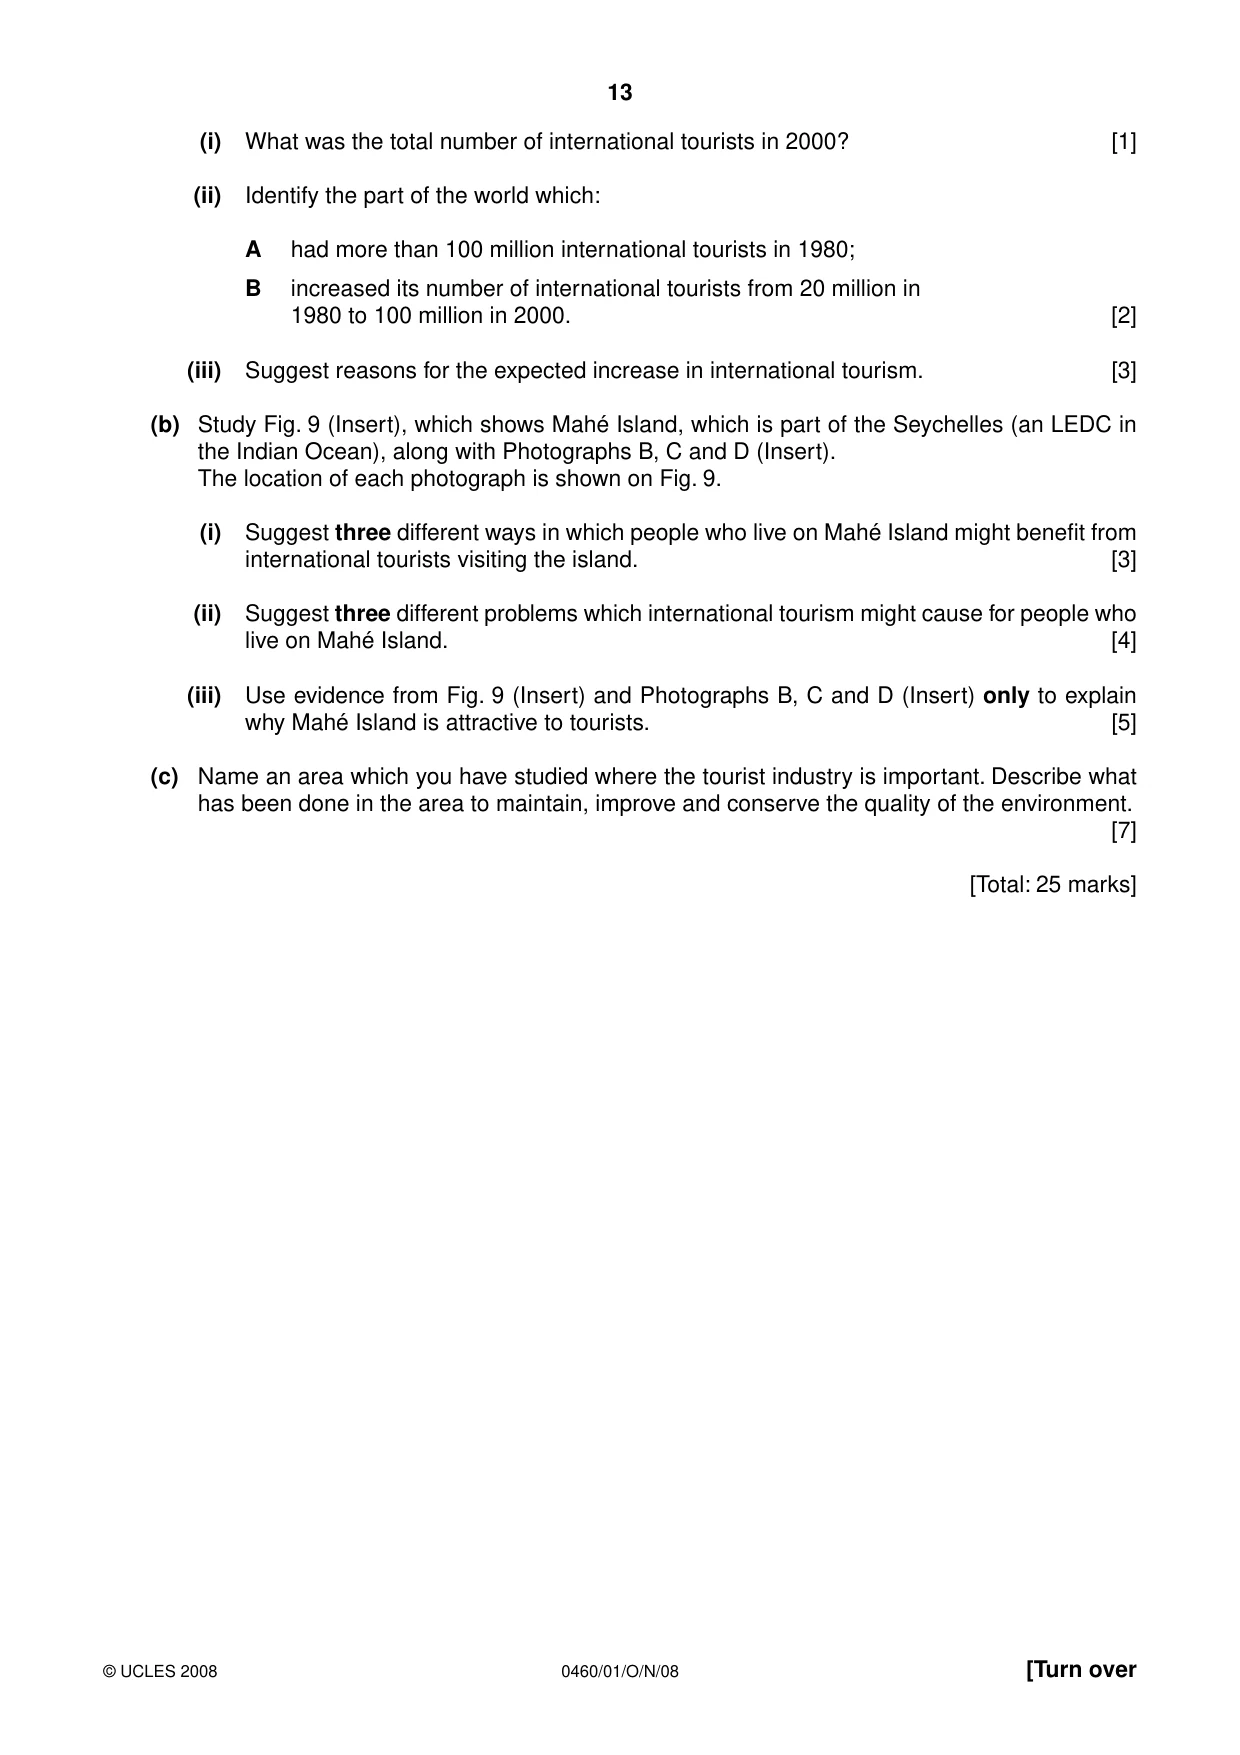
13 0460/01/O/N/08 © UCLES 2008 [Turn over (i) What was the total number of international tourists in 2000? [1] (ii) Identify the part of the world which: A had more than 100 million international tourists in 1980; B increased its number of international tourists from 20 million in 1980 to 100 million in 2000. [2] (iii) Suggest reasons for the expected increase in international tourism. [3] (b) Study Fig. 9 (Insert), which shows Mahé Island, which is part of the Seychelles (an LEDC in the Indian Ocean), along with Photographs B, C and D (Insert). The location of each photograph is shown on Fig. 9. (i) Suggest three different ways in which people who live on Mahé Island might benefit from international tourists visiting the island. [3] (ii) Suggest three different problems which international tourism might cause for people who live on Mahé Island. [4] (iii) Use evidence from Fig. 9 (Insert) and Photographs B, C and D (Insert) only to explain why Mahé Island is attractive to tourists. [5] (c) Name an area which you have studied where the tourist industry is important. Describe what has been done in the area to maintain, improve and conserve the quality of the environment. [7] [Total: 25 marks]
Question paper, page 14
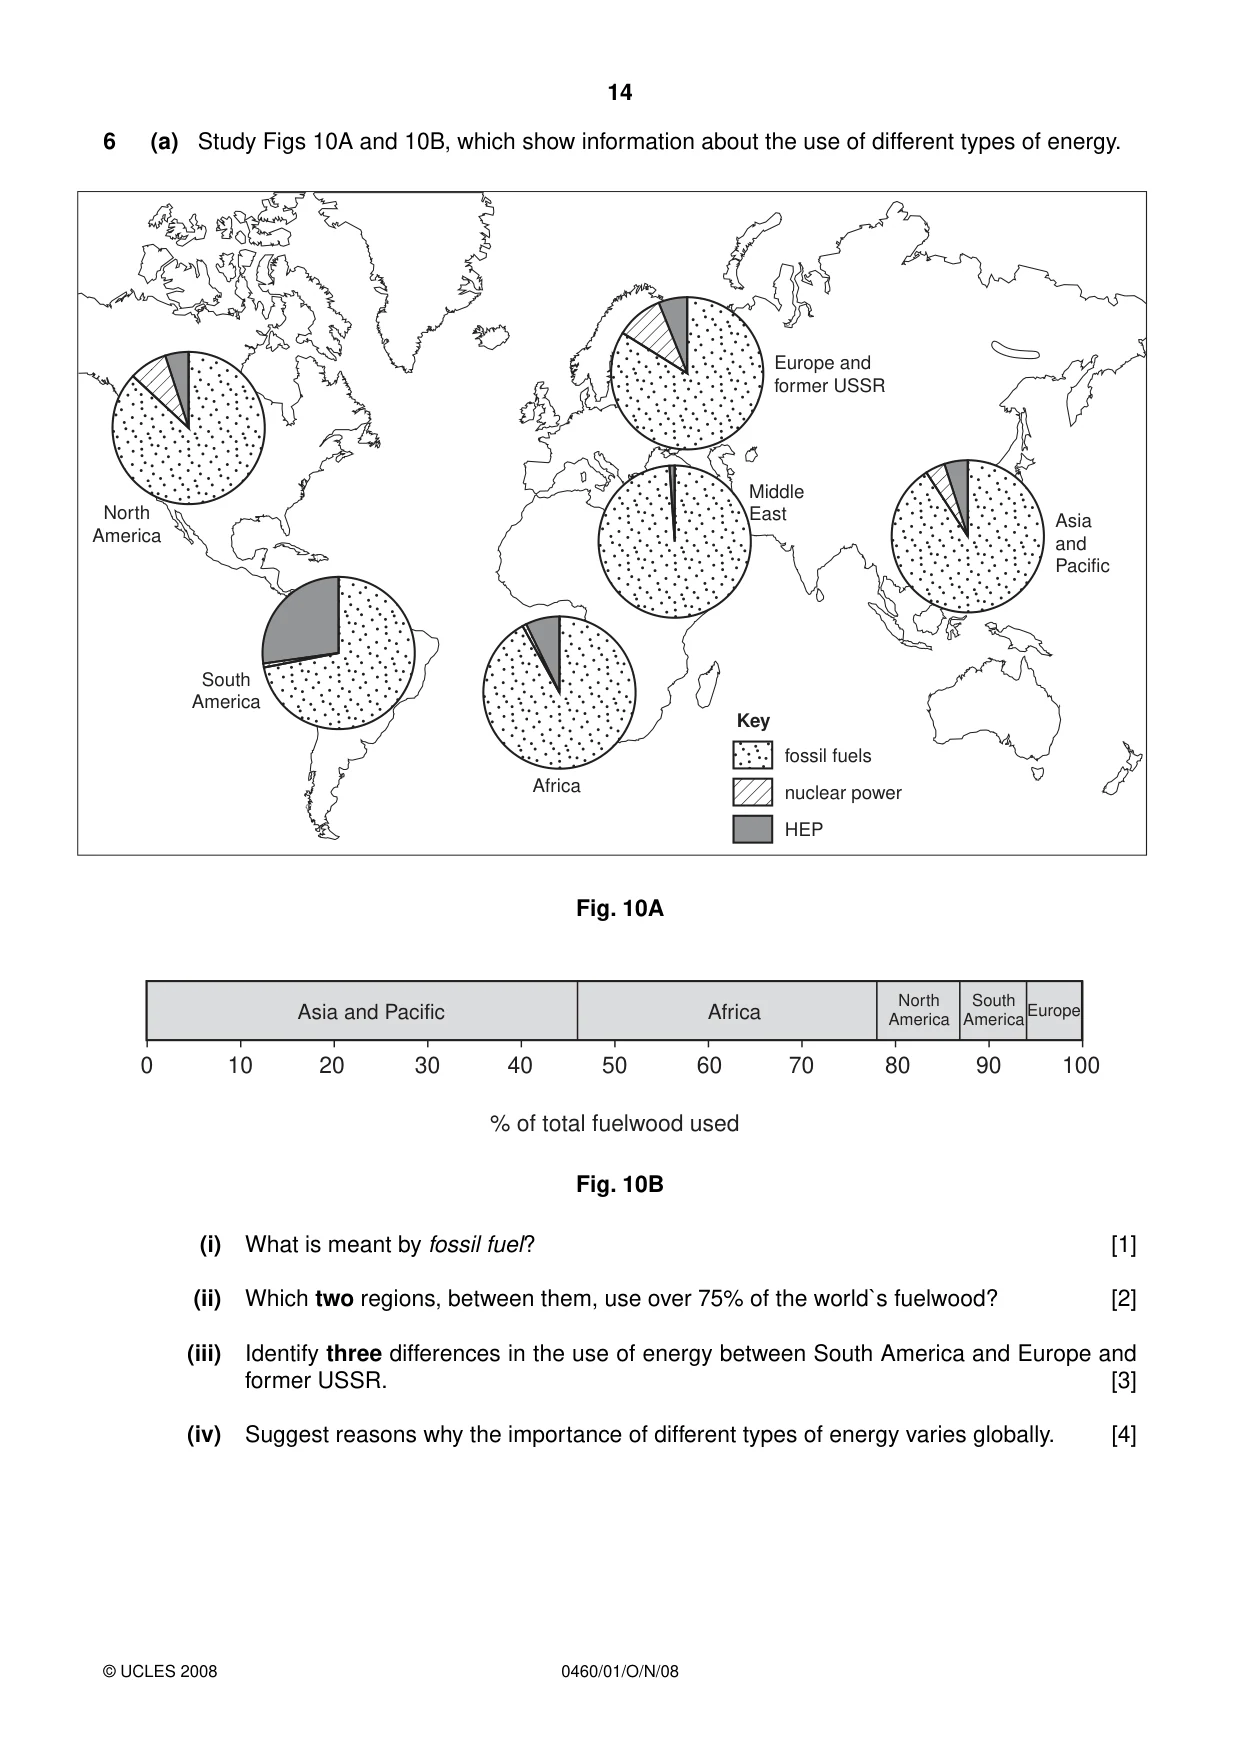
14 0460/01/O/N/08 © UCLES 2008 6 (a) Study Figs 10A and 10B, which show information about the use of different types of energy. Europe and former USSR Middle East North America South America Africa Asia and Pacific fossil fuels Key nuclear power HEP Fig. 10A 100 90 80 70 60 50 % of total fuelwood used 40 30 20 10 0 Asia and Pacific Africa South America North America Europe Fig. 10B (i) What is meant by fossil fuel? [1] (ii) Which two regions, between them, use over 75% of the world`s fuelwood? [2] (iii) Identify three differences in the use of energy between South America and Europe and former USSR. [3] (iv) Suggest reasons why the importance of different types of energy varies globally. [4]
Question paper, page 15
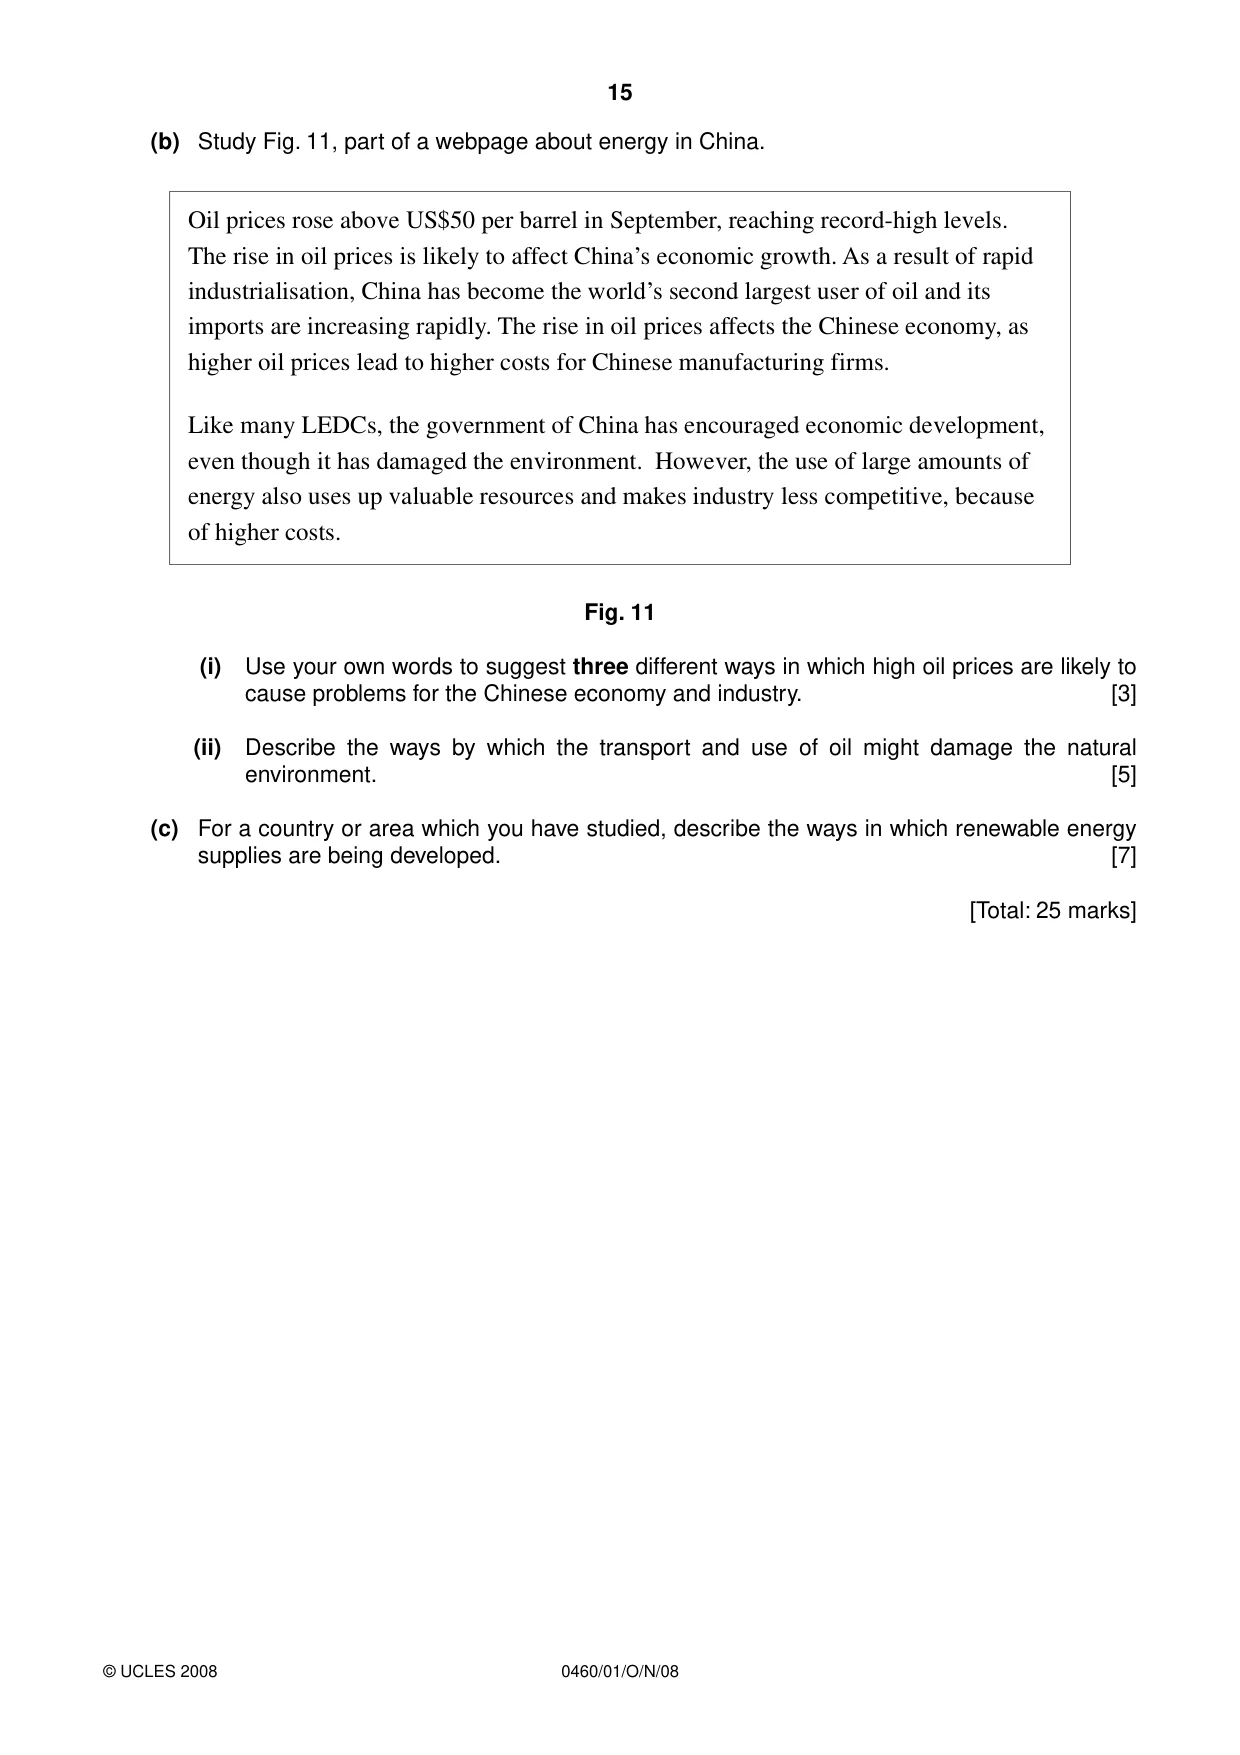
15 0460/01/O/N/08 © UCLES 2008 (b) Study Fig. 11, part of a webpage about energy in China. Oil prices rose above US$50 per barrel in September, reaching record-high levels. The rise in oil prices is likely to affect Chinaʼs economic growth. As a result of rapid industrialisation, China has become the worldʼs second largest user of oil and its imports are increasing rapidly. The rise in oil prices affects the Chinese economy, as higher oil prices lead to higher costs for Chinese manufacturing firms. Like many LEDCs, the government of China has encouraged economic development, even though it has damaged the environment. However, the use of large amounts of energy also uses up valuable resources and makes industry less competitive, because of higher costs. Fig. 11 (i) Use your own words to suggest three different ways in which high oil prices are likely to cause problems for the Chinese economy and industry. [3] (ii) Describe the ways by which the transport and use of oil might damage the natural environment. [5] (c) For a country or area which you have studied, describe the ways in which renewable energy supplies are being developed. [7] [Total: 25 marks]
Question paper, page 16
16 0460/01/O/N/08 © UCLES 2008 BLANK PAGE Copyright Acknowledgements: Question 4 Photograph A S. Sibley © UCLES. Question 5 Photograph B S. Sibley © UCLES. Question 5 Photograph C S. Sibley © UCLES. Question 5 Photograph D S. Sibley © UCLES. Question 5 Fig. 9 © Air Seychelles. Permission to reproduce items where third-party owned material protected by copyright is included has been sought and cleared where possible. Every reasonable effort has been made by the publisher (UCLES) to trace copyright holders, but if any items requiring clearance have unwittingly been included, the publisher will be pleased to make amends at the earliest possible opportunity. University of Cambridge International Examinations is part of the Cambridge Assessment Group. Cambridge Assessment is the brand name of University of Cambridge Local Examinations Syndicate (UCLES), which is itself a department of the University of Cambridge.
Mark scheme, page 1
UNIVERSITY OF CAMBRIDGE INTERNATIONAL EXAMINATIONS International General Certificate of Secondary Education MARK SCHEME for the October/November 2008 question paper 0460 GEOGRAPHY 0460/01 Paper 1, maximum raw mark 75 This mark scheme is published as an aid to teachers and candidates, to indicate the requirements of the examination. It shows the basis on which Examiners were instructed to award marks. It does not indicate the details of the discussions that took place at an Examiners’ meeting before marking began. All Examiners are instructed that alternative correct answers and unexpected approaches in candidates’ scripts must be given marks that fairly reflect the relevant knowledge and skills demonstrated. Mark schemes must be read in conjunction with the question papers and the report on the examination. • CIE will not enter into discussions or correspondence in connection with these mark schemes. CIE is publishing the mark schemes for the October/November 2008 question papers for most IGCSE, GCE Advanced Level and Advanced Subsidiary Level syllabuses and some Ordinary Level syllabuses. www.XtremePapers.com
Mark scheme, page 2
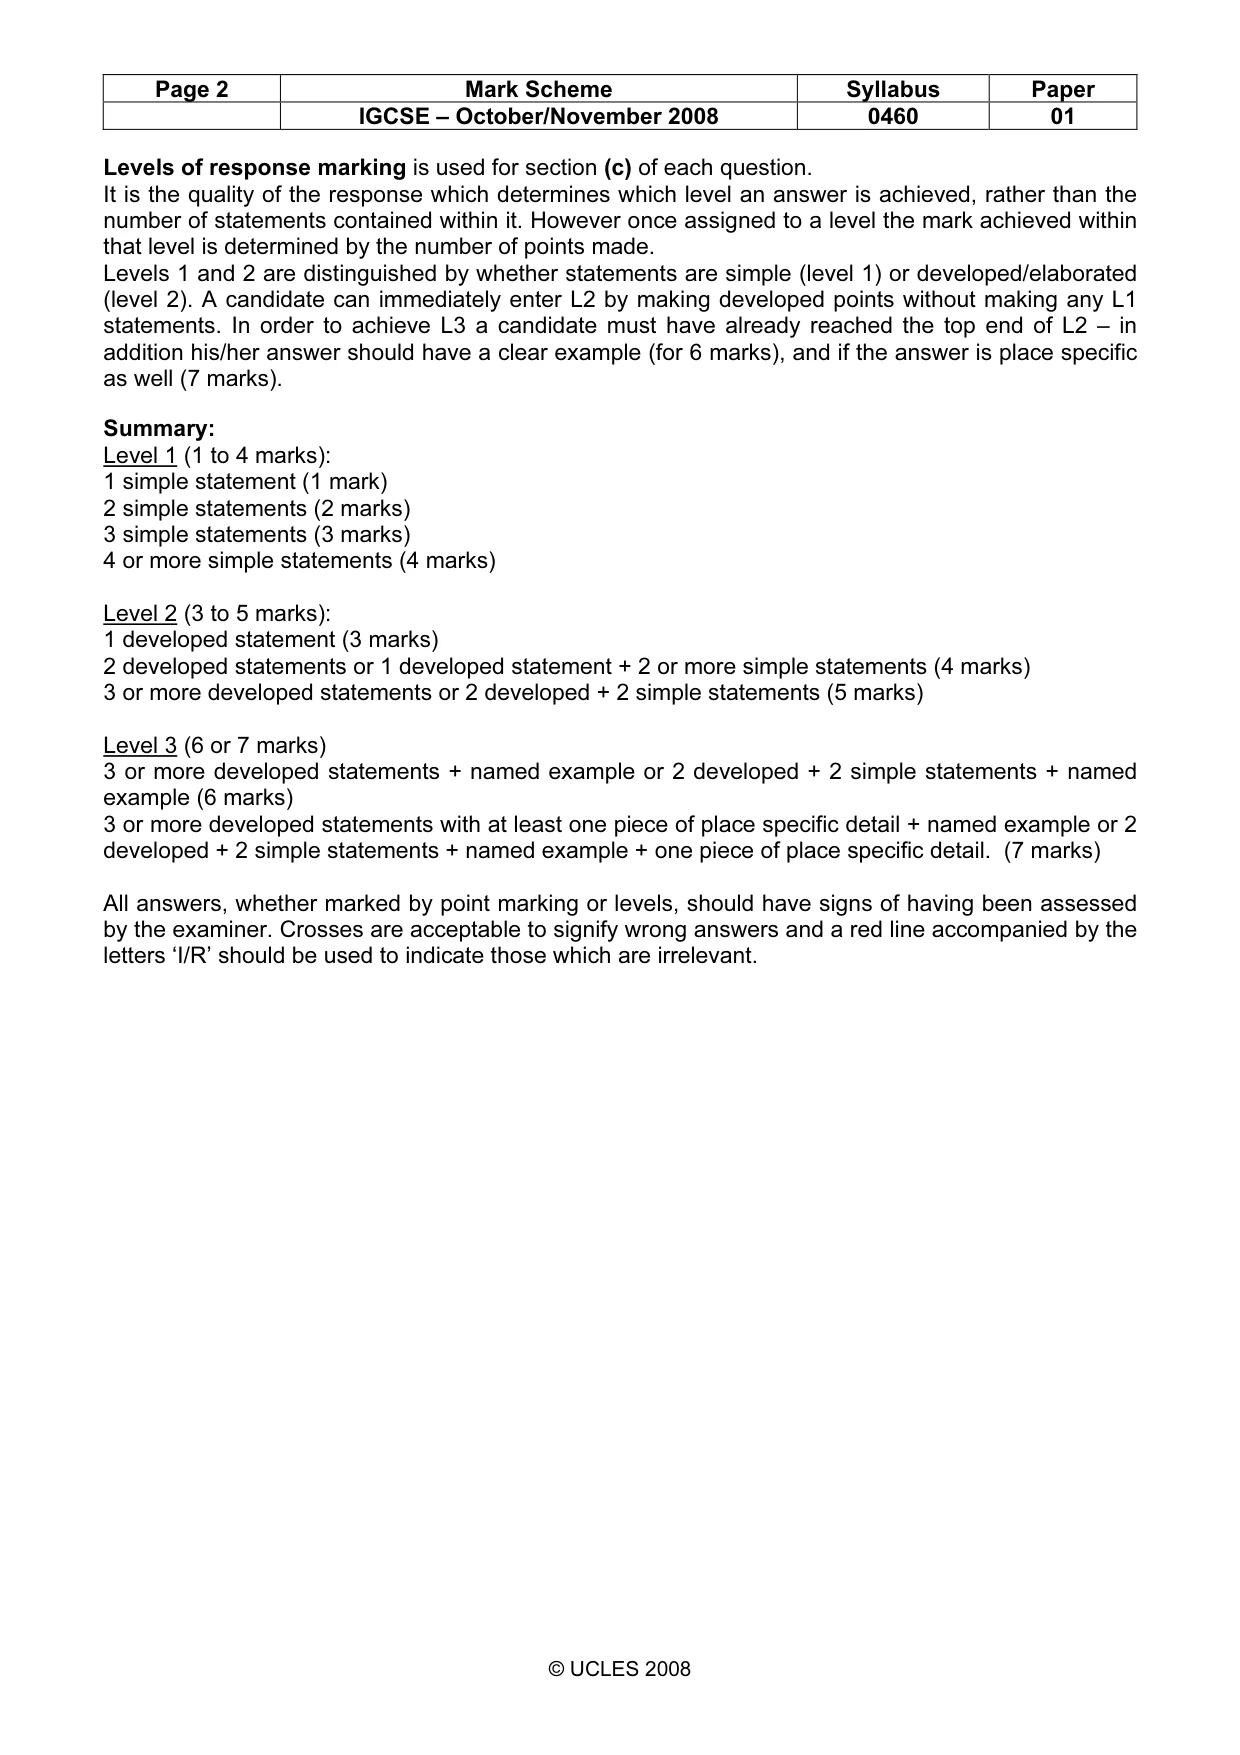
Page 2 Mark Scheme Syllabus Paper IGCSE – October/November 2008 0460 01 © UCLES 2008 Levels of response marking is used for section (c) of each question. It is the quality of the response which determines which level an answer is achieved, rather than the number of statements contained within it. However once assigned to a level the mark achieved within that level is determined by the number of points made. Levels 1 and 2 are distinguished by whether statements are simple (level 1) or developed/elaborated (level 2). A candidate can immediately enter L2 by making developed points without making any L1 statements. In order to achieve L3 a candidate must have already reached the top end of L2 – in addition his/her answer should have a clear example (for 6 marks), and if the answer is place specific as well (7 marks). Summary: Level 1 (1 to 4 marks): 1 simple statement (1 mark) 2 simple statements (2 marks) 3 simple statements (3 marks) 4 or more simple statements (4 marks) Level 2 (3 to 5 marks): 1 developed statement (3 marks) 2 developed statements or 1 developed statement + 2 or more simple statements (4 marks) 3 or more developed statements or 2 developed + 2 simple statements (5 marks) Level 3 (6 or 7 marks) 3 or more developed statements + named example or 2 developed + 2 simple statements + named example (6 marks) 3 or more developed statements with at least one piece of place specific detail + named example or 2 developed + 2 simple statements + named example + one piece of place specific detail. (7 marks) All answers, whether marked by point marking or levels, should have signs of having been assessed by the examiner. Crosses are acceptable to signify wrong answers and a red line accompanied by the letters ‘I/R’ should be used to indicate those which are irrelevant.
Mark scheme, page 3
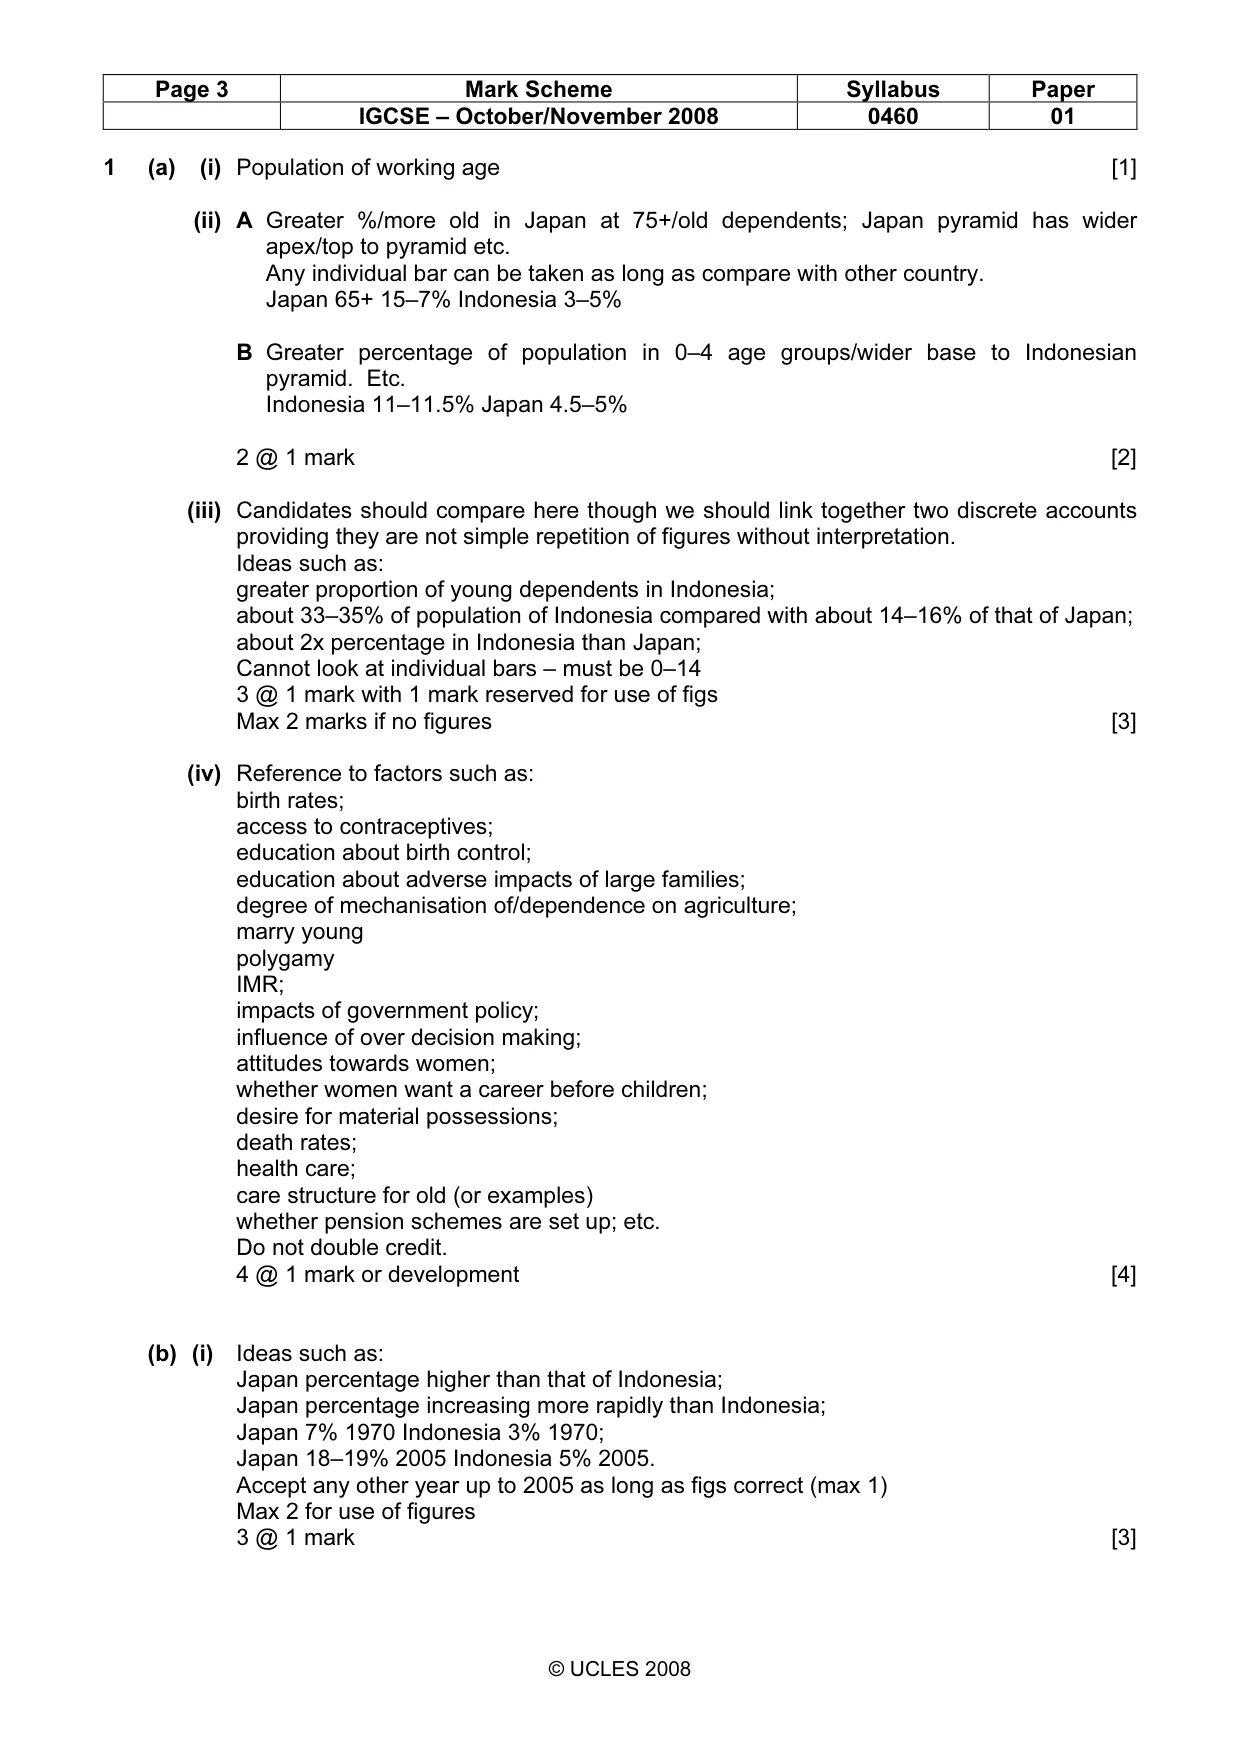
Page 3 Mark Scheme Syllabus Paper IGCSE – October/November 2008 0460 01 © UCLES 2008 1 (a) (i) Population of working age [1] (ii) A Greater %/more old in Japan at 75+/old dependents; Japan pyramid has wider apex/top to pyramid etc. Any individual bar can be taken as long as compare with other country. Japan 65+ 15–7% Indonesia 3–5% B Greater percentage of population in 0–4 age groups/wider base to Indonesian pyramid. Etc. Indonesia 11–11.5% Japan 4.5–5% 2 @ 1 mark [2] (iii) Candidates should compare here though we should link together two discrete accounts providing they are not simple repetition of figures without interpretation. Ideas such as: greater proportion of young dependents in Indonesia; about 33–35% of population of Indonesia compared with about 14–16% of that of Japan; about 2x percentage in Indonesia than Japan; Cannot look at individual bars – must be 0–14 3 @ 1 mark with 1 mark reserved for use of figs Max 2 marks if no figures [3] (iv) Reference to factors such as: birth rates; access to contraceptives; education about birth control; education about adverse impacts of large families; degree of mechanisation of/dependence on agriculture; marry young polygamy IMR; impacts of government policy; influence of over decision making; attitudes towards women; whether women want a career before children; desire for material possessions; death rates; health care; care structure for old (or examples) whether pension schemes are set up; etc. Do not double credit. 4 @ 1 mark or development [4] (b) (i) Ideas such as: Japan percentage higher than that of Indonesia; Japan percentage increasing more rapidly than Indonesia; Japan 7% 1970 Indonesia 3% 1970; Japan 18–19% 2005 Indonesia 5% 2005. Accept any other year up to 2005 as long as figs correct (max 1) Max 2 for use of figures 3 @ 1 mark [3]
Mark scheme, page 4
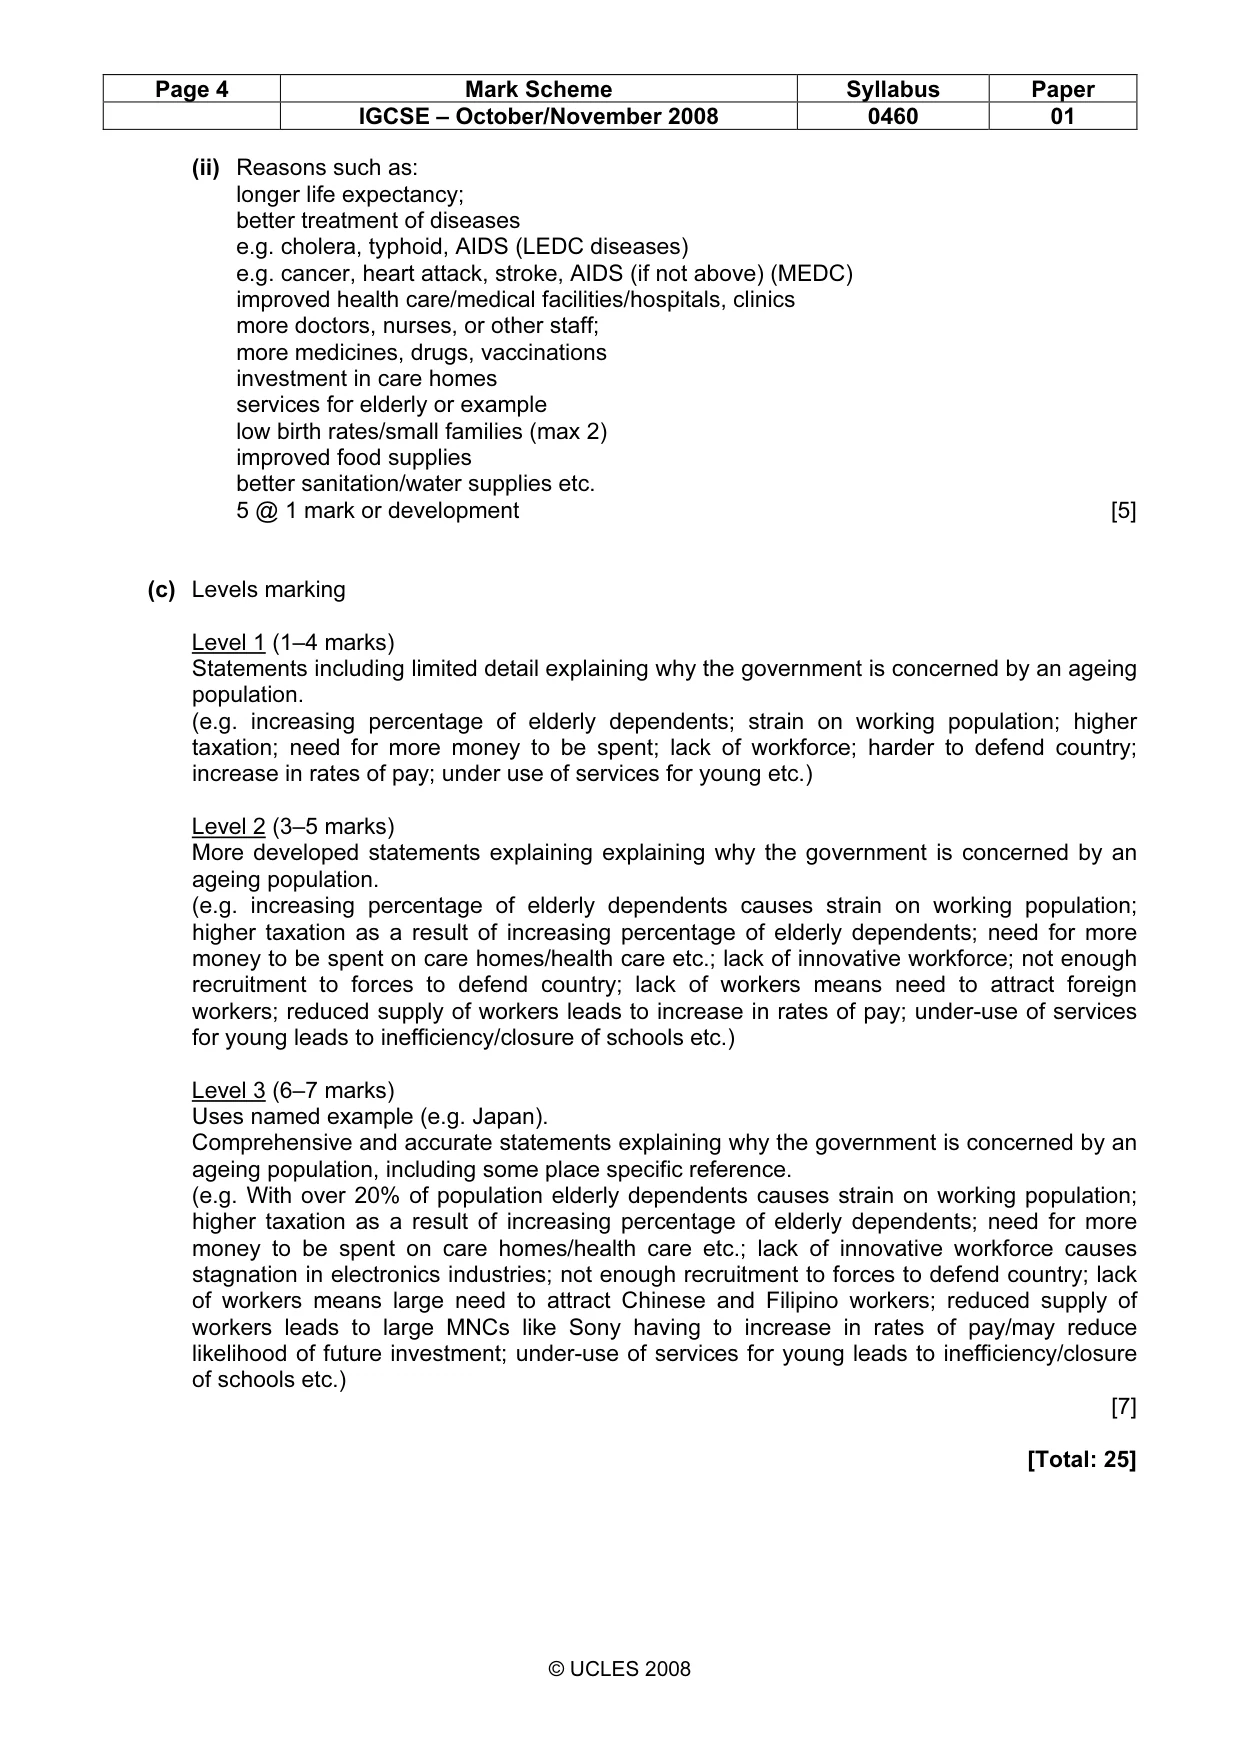
Page 4 Mark Scheme Syllabus Paper IGCSE – October/November 2008 0460 01 © UCLES 2008 (ii) Reasons such as: longer life expectancy; better treatment of diseases e.g. cholera, typhoid, AIDS (LEDC diseases) e.g. cancer, heart attack, stroke, AIDS (if not above) (MEDC) improved health care/medical facilities/hospitals, clinics more doctors, nurses, or other staff; more medicines, drugs, vaccinations investment in care homes services for elderly or example low birth rates/small families (max 2) improved food supplies better sanitation/water supplies etc. 5 @ 1 mark or development [5] (c) Levels marking Level 1 (1–4 marks) Statements including limited detail explaining why the government is concerned by an ageing population. (e.g. increasing percentage of elderly dependents; strain on working population; higher taxation; need for more money to be spent; lack of workforce; harder to defend country; increase in rates of pay; under use of services for young etc.) Level 2 (3–5 marks) More developed statements explaining explaining why the government is concerned by an ageing population. (e.g. increasing percentage of elderly dependents causes strain on working population; higher taxation as a result of increasing percentage of elderly dependents; need for more money to be spent on care homes/health care etc.; lack of innovative workforce; not enough recruitment to forces to defend country; lack of workers means need to attract foreign workers; reduced supply of workers leads to increase in rates of pay; under-use of services for young leads to inefficiency/closure of schools etc.) Level 3 (6–7 marks) Uses named example (e.g. Japan). Comprehensive and accurate statements explaining why the government is concerned by an ageing population, including some place specific reference. (e.g. With over 20% of population elderly dependents causes strain on working population; higher taxation as a result of increasing percentage of elderly dependents; need for more money to be spent on care homes/health care etc.; lack of innovative workforce causes stagnation in electronics industries; not enough recruitment to forces to defend country; lack of workers means large need to attract Chinese and Filipino workers; reduced supply of workers leads to large MNCs like Sony having to increase in rates of pay/may reduce likelihood of future investment; under-use of services for young leads to inefficiency/closure of schools etc.) [7] [Total: 25]
Mark scheme, page 5
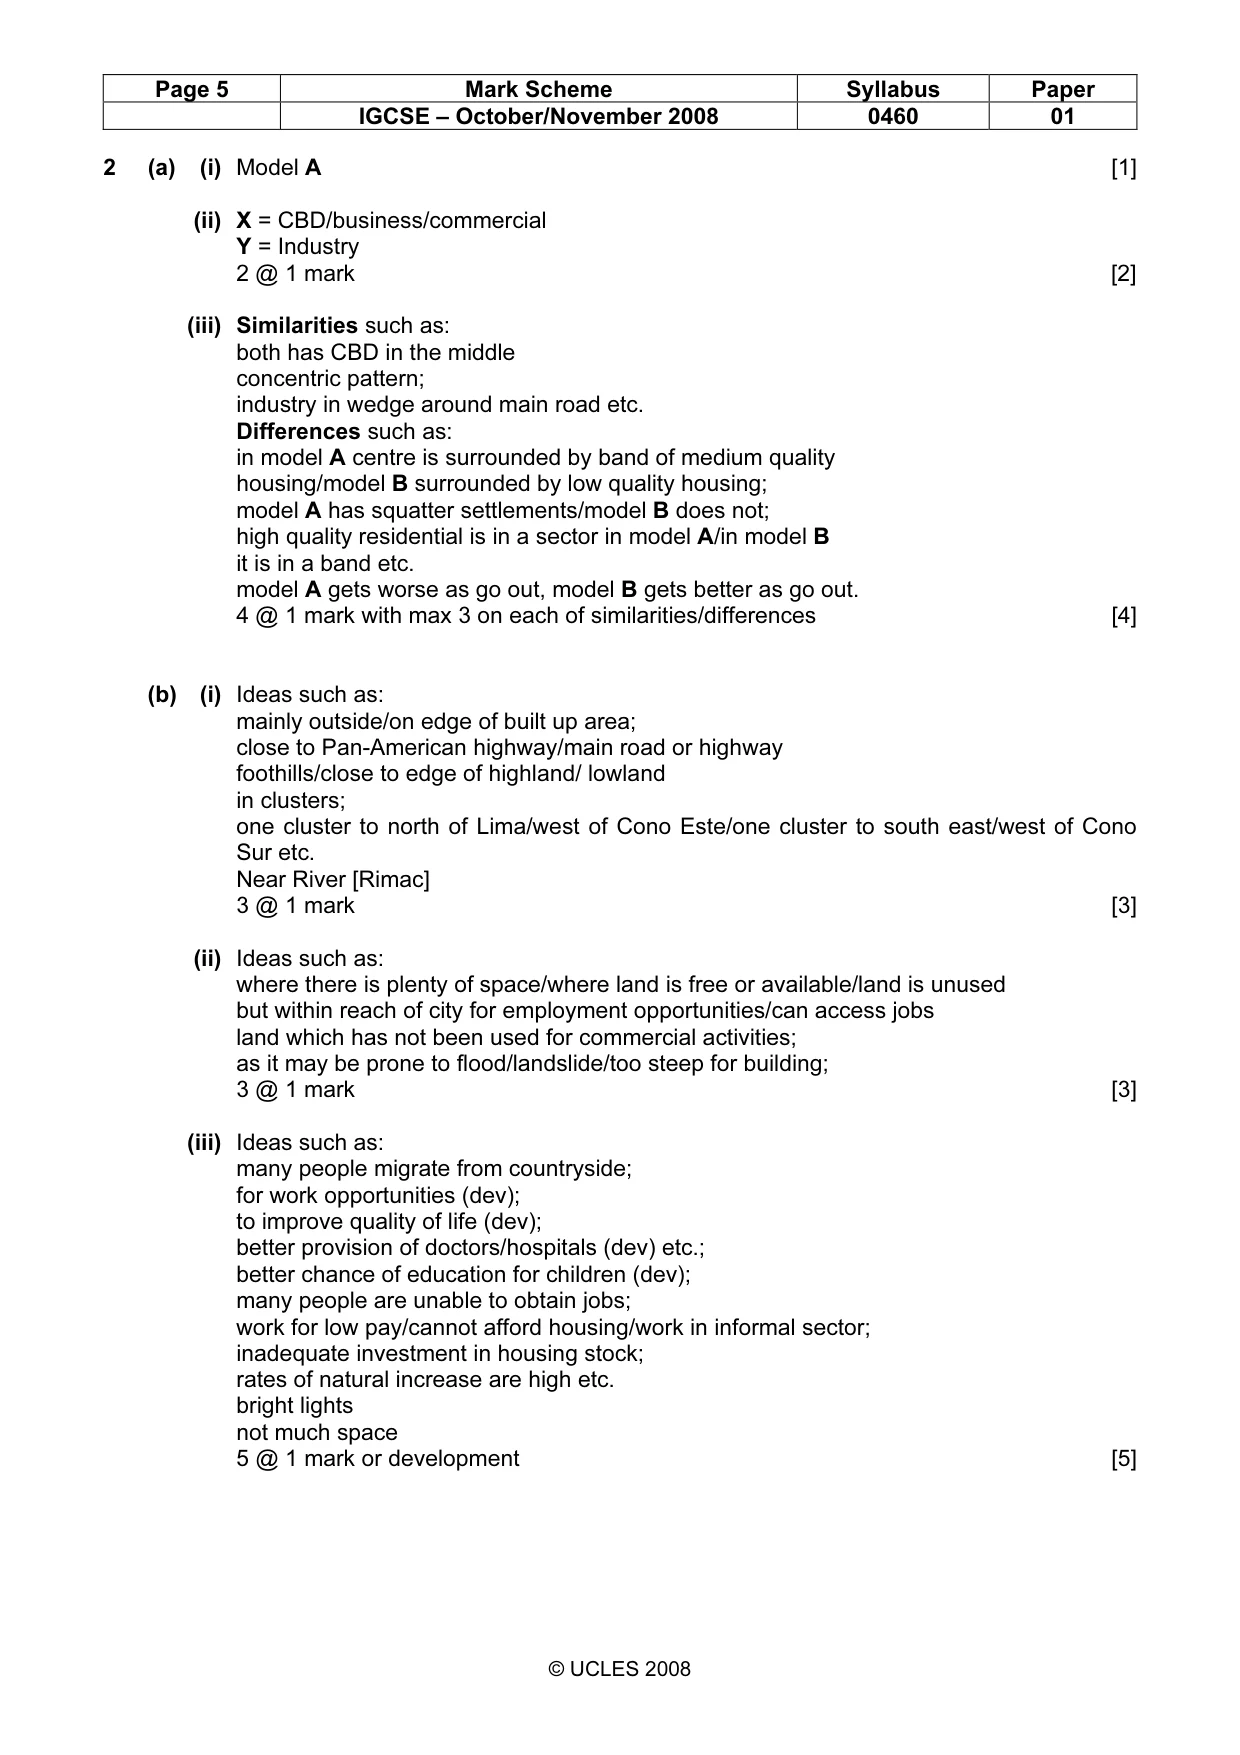
Page 5 Mark Scheme Syllabus Paper IGCSE – October/November 2008 0460 01 © UCLES 2008 2 (a) (i) Model A [1] (ii) X = CBD/business/commercial Y = Industry 2 @ 1 mark [2] (iii) Similarities such as: both has CBD in the middle concentric pattern; industry in wedge around main road etc. Differences such as: in model A centre is surrounded by band of medium quality housing/model B surrounded by low quality housing; model A has squatter settlements/model B does not; high quality residential is in a sector in model A/in model B it is in a band etc. model A gets worse as go out, model B gets better as go out. 4 @ 1 mark with max 3 on each of similarities/differences [4] (b) (i) Ideas such as: mainly outside/on edge of built up area; close to Pan-American highway/main road or highway foothills/close to edge of highland/ lowland in clusters; one cluster to north of Lima/west of Cono Este/one cluster to south east/west of Cono Sur etc. Near River [Rimac] 3 @ 1 mark [3] (ii) Ideas such as: where there is plenty of space/where land is free or available/land is unused but within reach of city for employment opportunities/can access jobs land which has not been used for commercial activities; as it may be prone to flood/landslide/too steep for building; 3 @ 1 mark [3] (iii) Ideas such as: many people migrate from countryside; for work opportunities (dev); to improve quality of life (dev); better provision of doctors/hospitals (dev) etc.; better chance of education for children (dev); many people are unable to obtain jobs; work for low pay/cannot afford housing/work in informal sector; inadequate investment in housing stock; rates of natural increase are high etc. bright lights not much space 5 @ 1 mark or development [5]
Mark scheme, page 6
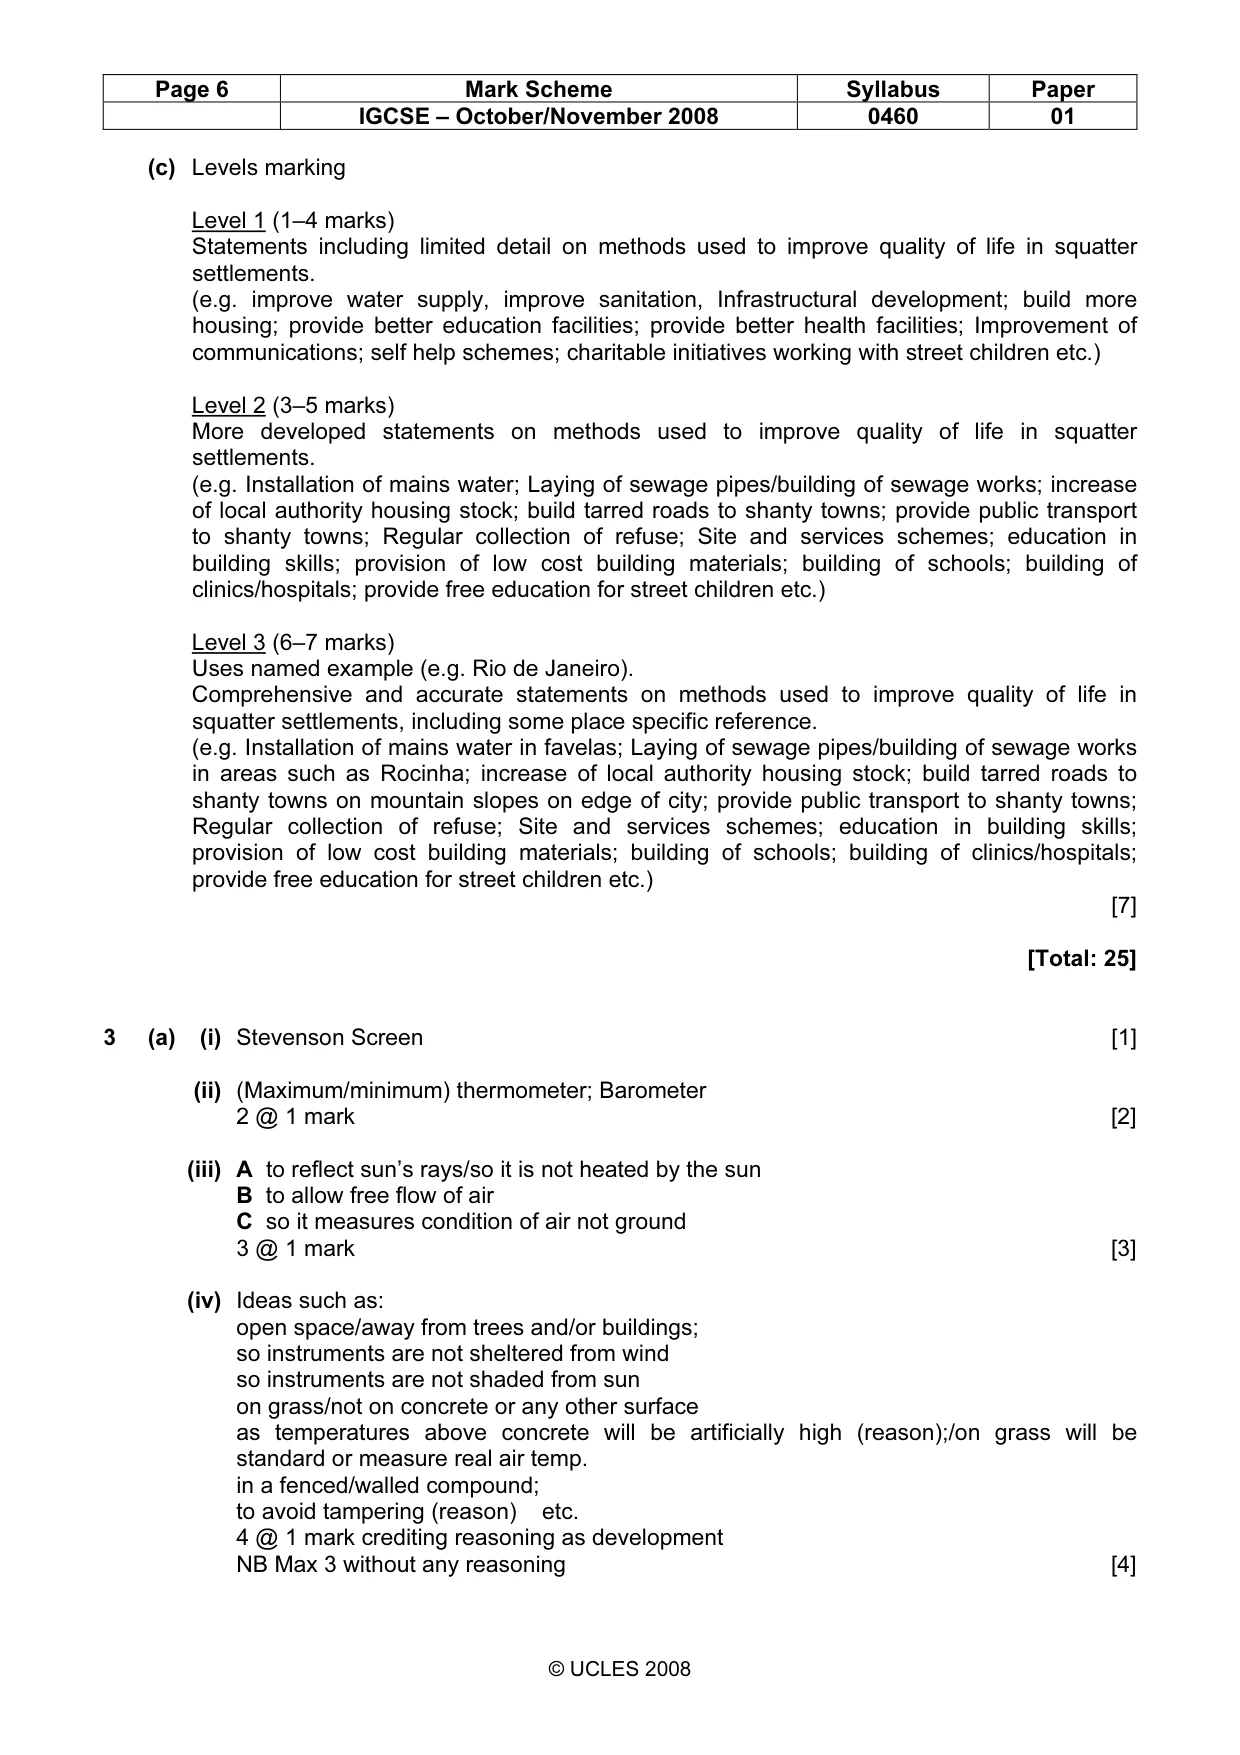
Page 6 Mark Scheme Syllabus Paper IGCSE – October/November 2008 0460 01 © UCLES 2008 (c) Levels marking Level 1 (1–4 marks) Statements including limited detail on methods used to improve quality of life in squatter settlements. (e.g. improve water supply, improve sanitation, Infrastructural development; build more housing; provide better education facilities; provide better health facilities; Improvement of communications; self help schemes; charitable initiatives working with street children etc.) Level 2 (3–5 marks) More developed statements on methods used to improve quality of life in squatter settlements. (e.g. Installation of mains water; Laying of sewage pipes/building of sewage works; increase of local authority housing stock; build tarred roads to shanty towns; provide public transport to shanty towns; Regular collection of refuse; Site and services schemes; education in building skills; provision of low cost building materials; building of schools; building of clinics/hospitals; provide free education for street children etc.) Level 3 (6–7 marks) Uses named example (e.g. Rio de Janeiro). Comprehensive and accurate statements on methods used to improve quality of life in squatter settlements, including some place specific reference. (e.g. Installation of mains water in favelas; Laying of sewage pipes/building of sewage works in areas such as Rocinha; increase of local authority housing stock; build tarred roads to shanty towns on mountain slopes on edge of city; provide public transport to shanty towns; Regular collection of refuse; Site and services schemes; education in building skills; provision of low cost building materials; building of schools; building of clinics/hospitals; provide free education for street children etc.) [7] [Total: 25] 3 (a) (i) Stevenson Screen [1] (ii) (Maximum/minimum) thermometer; Barometer 2 @ 1 mark [2] (iii) A to reflect sun’s rays/so it is not heated by the sun B to allow free flow of air C so it measures condition of air not ground 3 @ 1 mark [3] (iv) Ideas such as: open space/away from trees and/or buildings; so instruments are not sheltered from wind so instruments are not shaded from sun on grass/not on concrete or any other surface as temperatures above concrete will be artificially high (reason);/on grass will be standard or measure real air temp. in a fenced/walled compound; to avoid tampering (reason) etc. 4 @ 1 mark crediting reasoning as development NB Max 3 without any reasoning [4]
Mark scheme, page 7
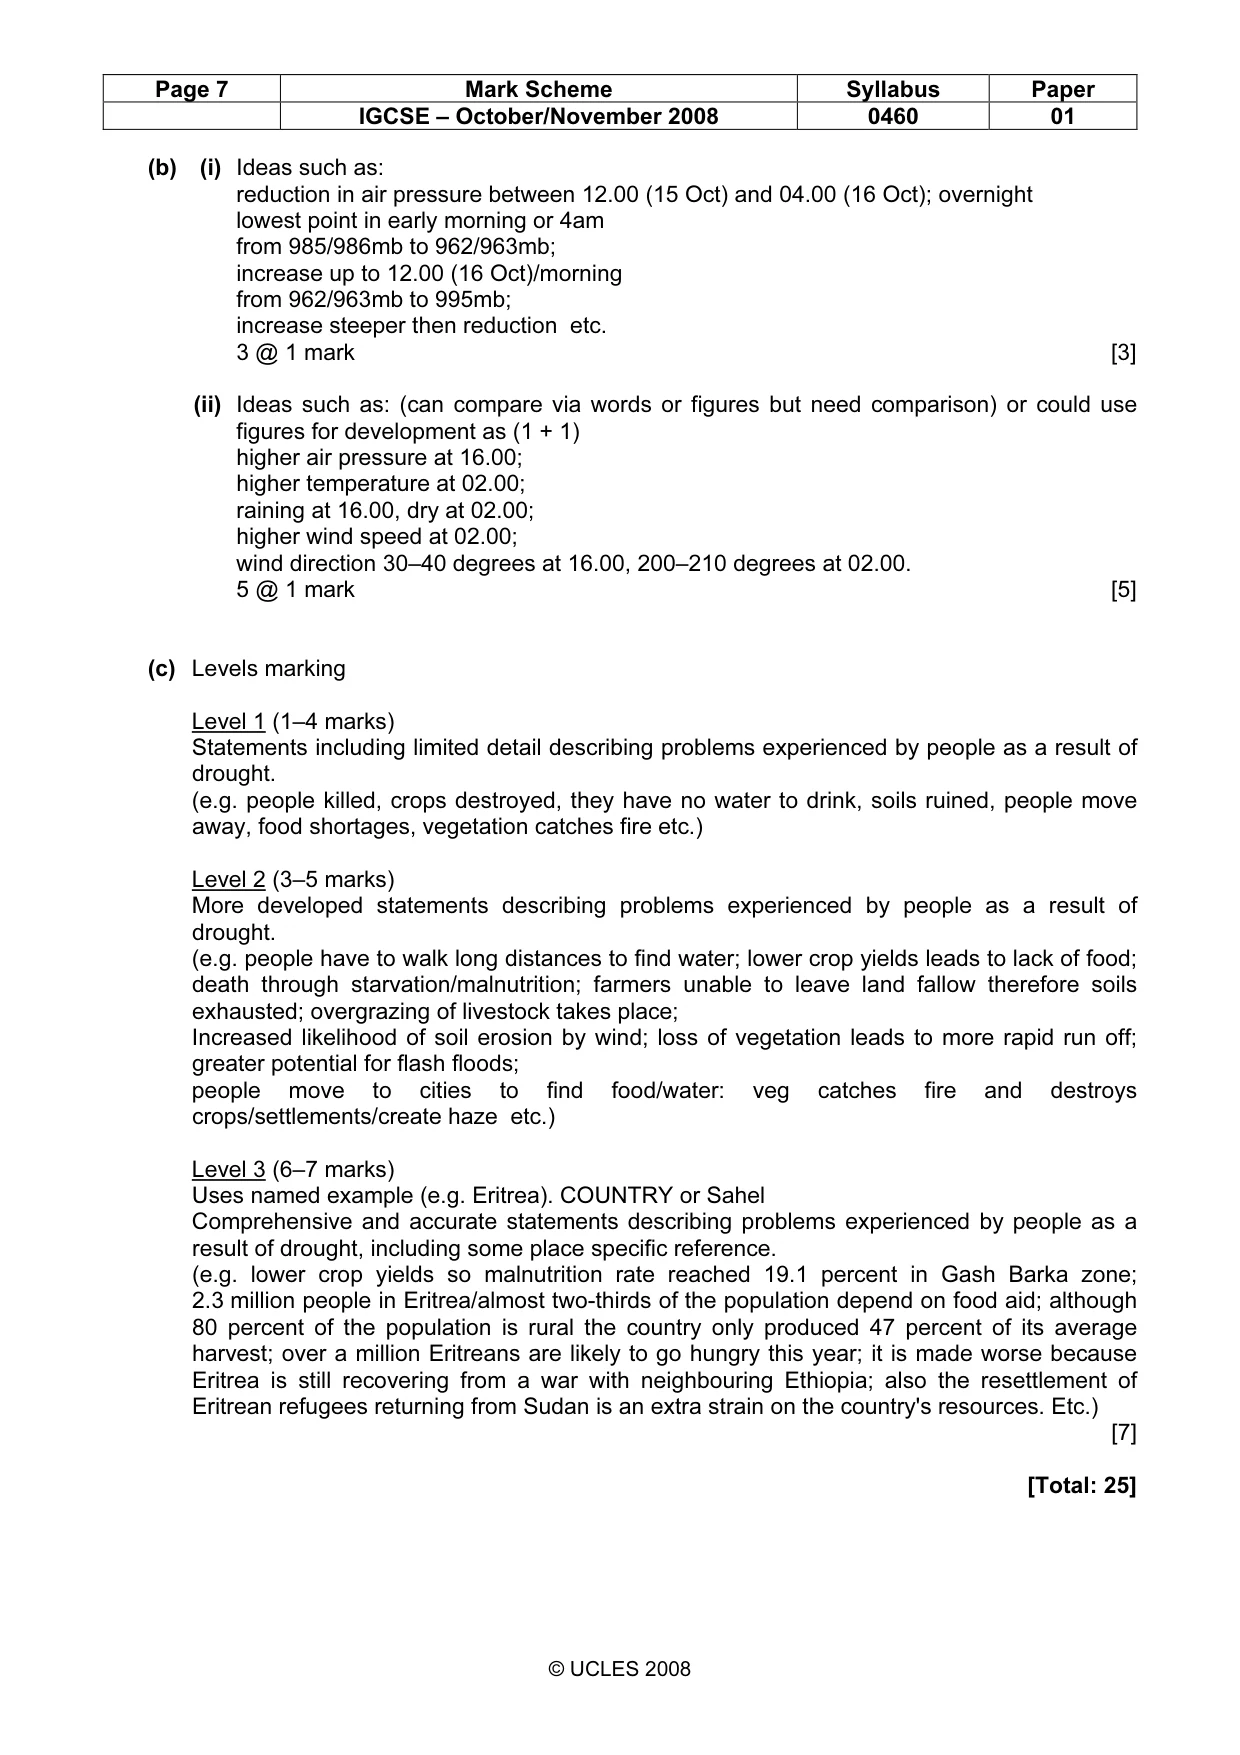
Page 7 Mark Scheme Syllabus Paper IGCSE – October/November 2008 0460 01 © UCLES 2008 (b) (i) Ideas such as: reduction in air pressure between 12.00 (15 Oct) and 04.00 (16 Oct); overnight lowest point in early morning or 4am from 985/986mb to 962/963mb; increase up to 12.00 (16 Oct)/morning from 962/963mb to 995mb; increase steeper then reduction etc. 3 @ 1 mark [3] (ii) Ideas such as: (can compare via words or figures but need comparison) or could use figures for development as (1 + 1) higher air pressure at 16.00; higher temperature at 02.00; raining at 16.00, dry at 02.00; higher wind speed at 02.00; wind direction 30–40 degrees at 16.00, 200–210 degrees at 02.00. 5 @ 1 mark [5] (c) Levels marking Level 1 (1–4 marks) Statements including limited detail describing problems experienced by people as a result of drought. (e.g. people killed, crops destroyed, they have no water to drink, soils ruined, people move away, food shortages, vegetation catches fire etc.) Level 2 (3–5 marks) More developed statements describing problems experienced by people as a result of drought. (e.g. people have to walk long distances to find water; lower crop yields leads to lack of food; death through starvation/malnutrition; farmers unable to leave land fallow therefore soils exhausted; overgrazing of livestock takes place; Increased likelihood of soil erosion by wind; loss of vegetation leads to more rapid run off; greater potential for flash floods; people move to cities to find food/water: veg catches fire and destroys crops/settlements/create haze etc.) Level 3 (6–7 marks) Uses named example (e.g. Eritrea). COUNTRY or Sahel Comprehensive and accurate statements describing problems experienced by people as a result of drought, including some place specific reference. (e.g. lower crop yields so malnutrition rate reached 19.1 percent in Gash Barka zone; 2.3 million people in Eritrea/almost two-thirds of the population depend on food aid; although 80 percent of the population is rural the country only produced 47 percent of its average harvest; over a million Eritreans are likely to go hungry this year; it is made worse because Eritrea is still recovering from a war with neighbouring Ethiopia; also the resettlement of Eritrean refugees returning from Sudan is an extra strain on the country's resources. Etc.) [7] [Total: 25]
Mark scheme, page 8
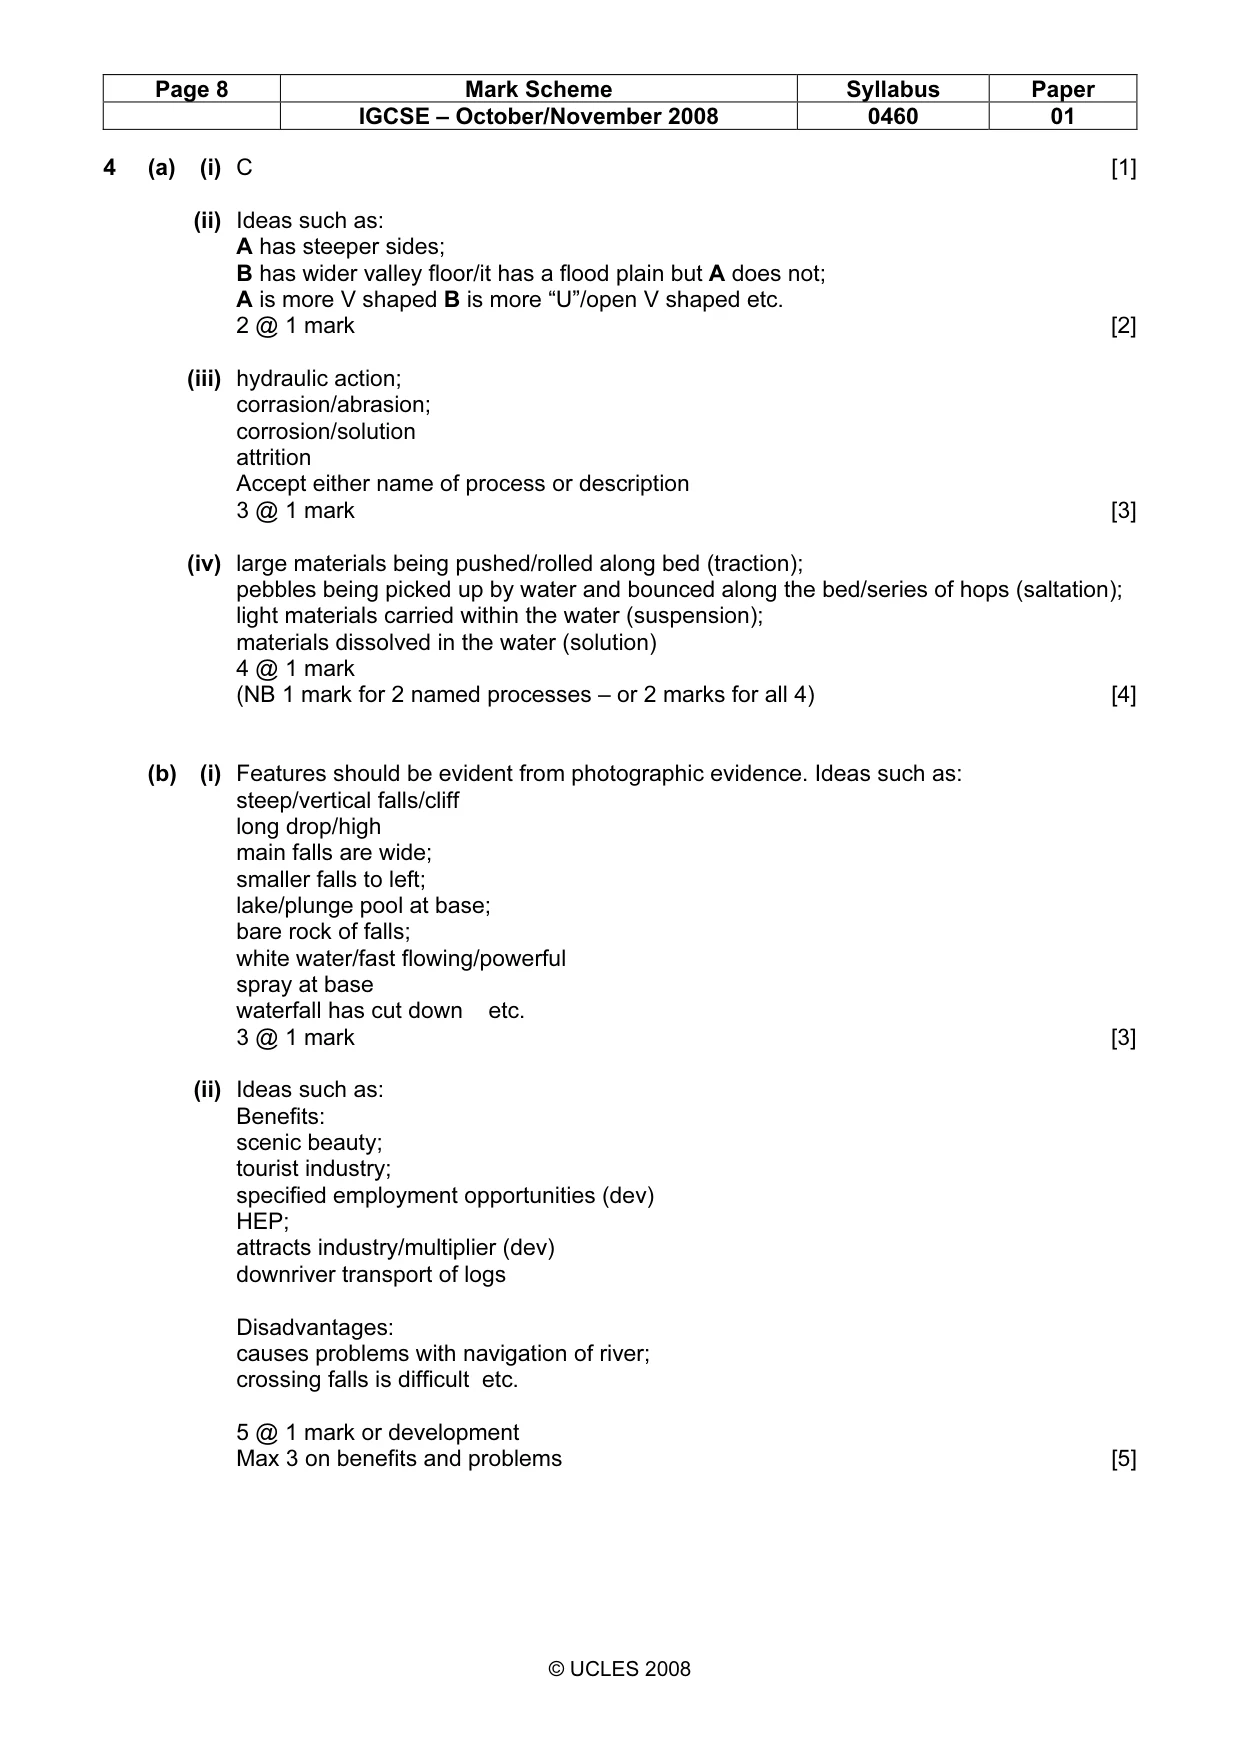
Page 8 Mark Scheme Syllabus Paper IGCSE – October/November 2008 0460 01 © UCLES 2008 4 (a) (i) C [1] (ii) Ideas such as: A has steeper sides; B has wider valley floor/it has a flood plain but A does not; A is more V shaped B is more “U”/open V shaped etc. 2 @ 1 mark [2] (iii) hydraulic action; corrasion/abrasion; corrosion/solution attrition Accept either name of process or description 3 @ 1 mark [3] (iv) large materials being pushed/rolled along bed (traction); pebbles being picked up by water and bounced along the bed/series of hops (saltation); light materials carried within the water (suspension); materials dissolved in the water (solution) 4 @ 1 mark (NB 1 mark for 2 named processes – or 2 marks for all 4) [4] (b) (i) Features should be evident from photographic evidence. Ideas such as: steep/vertical falls/cliff long drop/high main falls are wide; smaller falls to left; lake/plunge pool at base; bare rock of falls; white water/fast flowing/powerful spray at base waterfall has cut down etc. 3 @ 1 mark [3] (ii) Ideas such as: Benefits: scenic beauty; tourist industry; specified employment opportunities (dev) HEP; attracts industry/multiplier (dev) downriver transport of logs Disadvantages: causes problems with navigation of river; crossing falls is difficult etc. 5 @ 1 mark or development Max 3 on benefits and problems [5]
Mark scheme, page 9
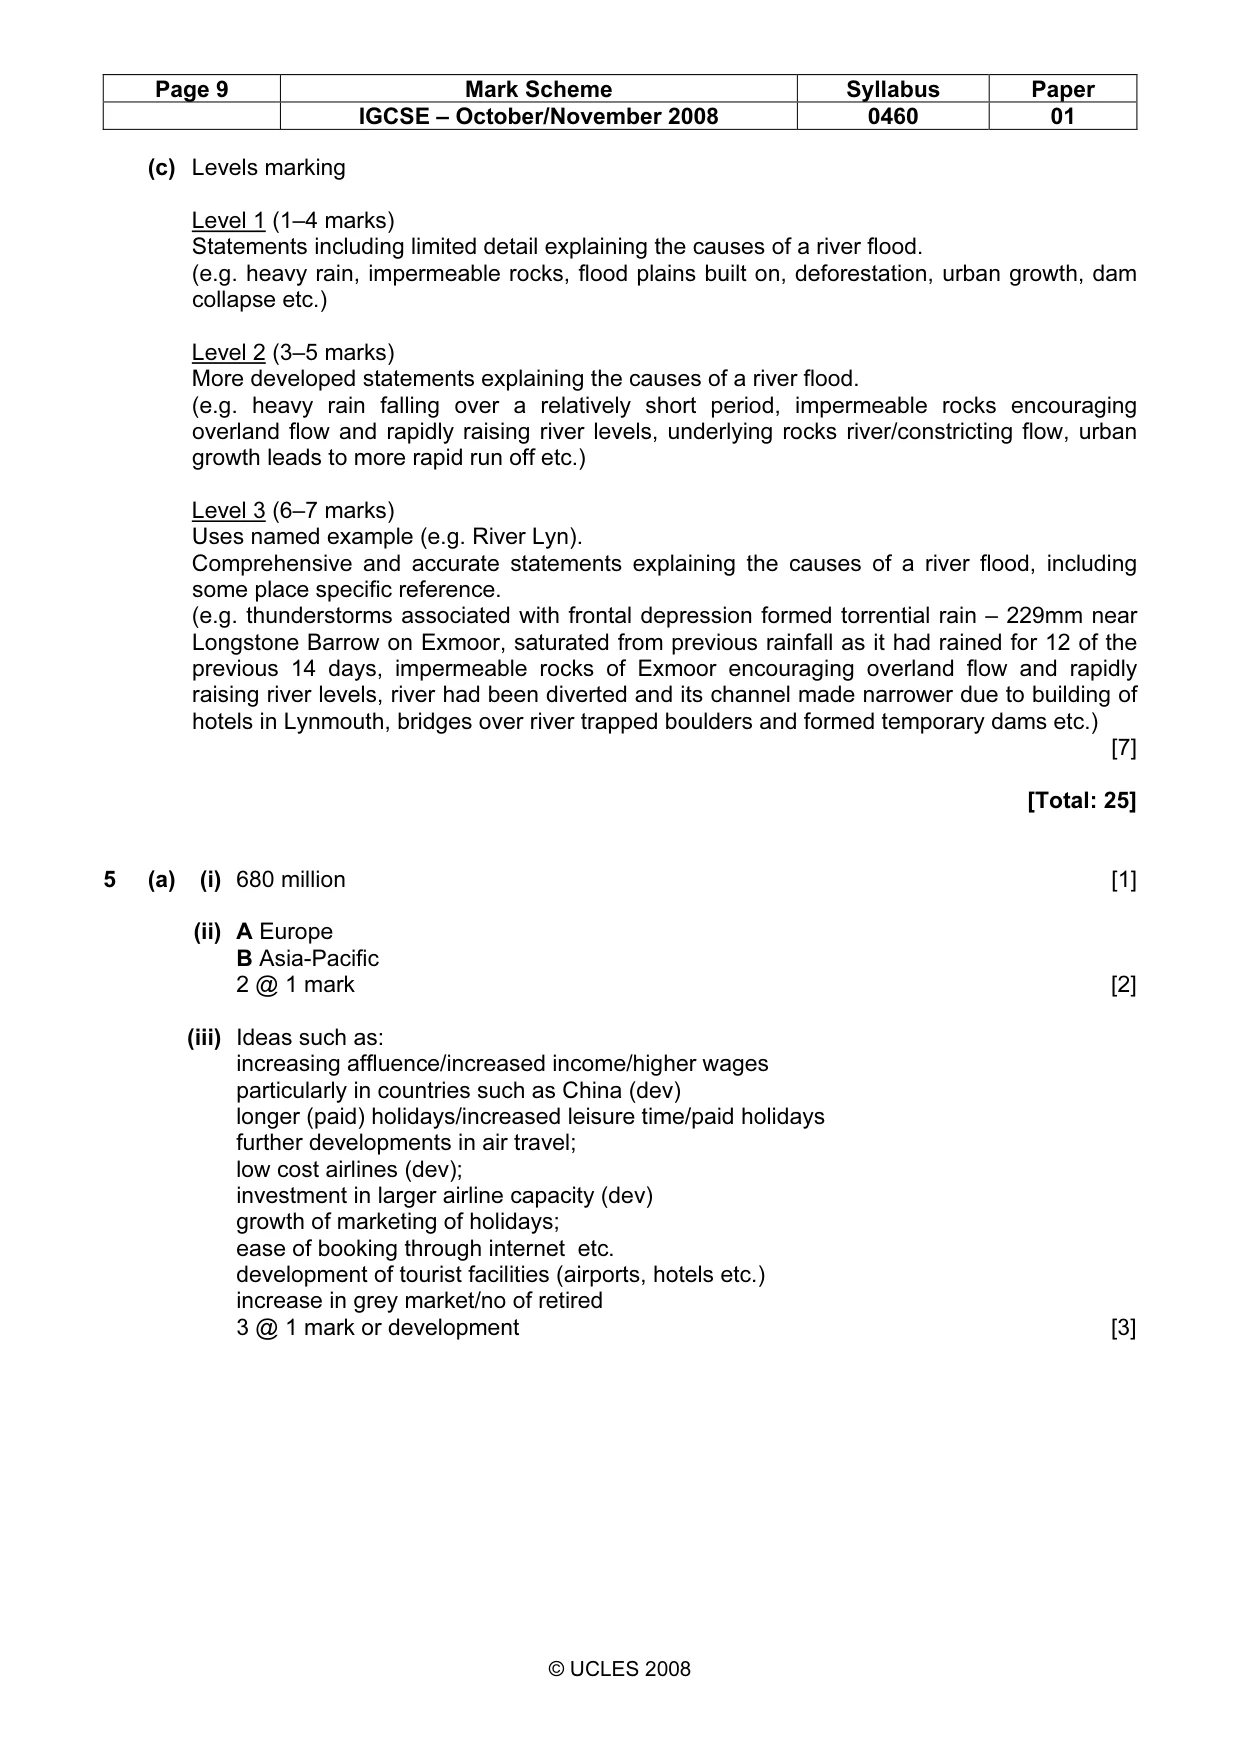
Page 9 Mark Scheme Syllabus Paper IGCSE – October/November 2008 0460 01 © UCLES 2008 (c) Levels marking Level 1 (1–4 marks) Statements including limited detail explaining the causes of a river flood. (e.g. heavy rain, impermeable rocks, flood plains built on, deforestation, urban growth, dam collapse etc.) Level 2 (3–5 marks) More developed statements explaining the causes of a river flood. (e.g. heavy rain falling over a relatively short period, impermeable rocks encouraging overland flow and rapidly raising river levels, underlying rocks river/constricting flow, urban growth leads to more rapid run off etc.) Level 3 (6–7 marks) Uses named example (e.g. River Lyn). Comprehensive and accurate statements explaining the causes of a river flood, including some place specific reference. (e.g. thunderstorms associated with frontal depression formed torrential rain – 229mm near Longstone Barrow on Exmoor, saturated from previous rainfall as it had rained for 12 of the previous 14 days, impermeable rocks of Exmoor encouraging overland flow and rapidly raising river levels, river had been diverted and its channel made narrower due to building of hotels in Lynmouth, bridges over river trapped boulders and formed temporary dams etc.) [7] [Total: 25] 5 (a) (i) 680 million [1] (ii) A Europe B Asia-Pacific 2 @ 1 mark [2] (iii) Ideas such as: increasing affluence/increased income/higher wages particularly in countries such as China (dev) longer (paid) holidays/increased leisure time/paid holidays further developments in air travel; low cost airlines (dev); investment in larger airline capacity (dev) growth of marketing of holidays; ease of booking through internet etc. development of tourist facilities (airports, hotels etc.) increase in grey market/no of retired 3 @ 1 mark or development [3]
Mark scheme, page 10
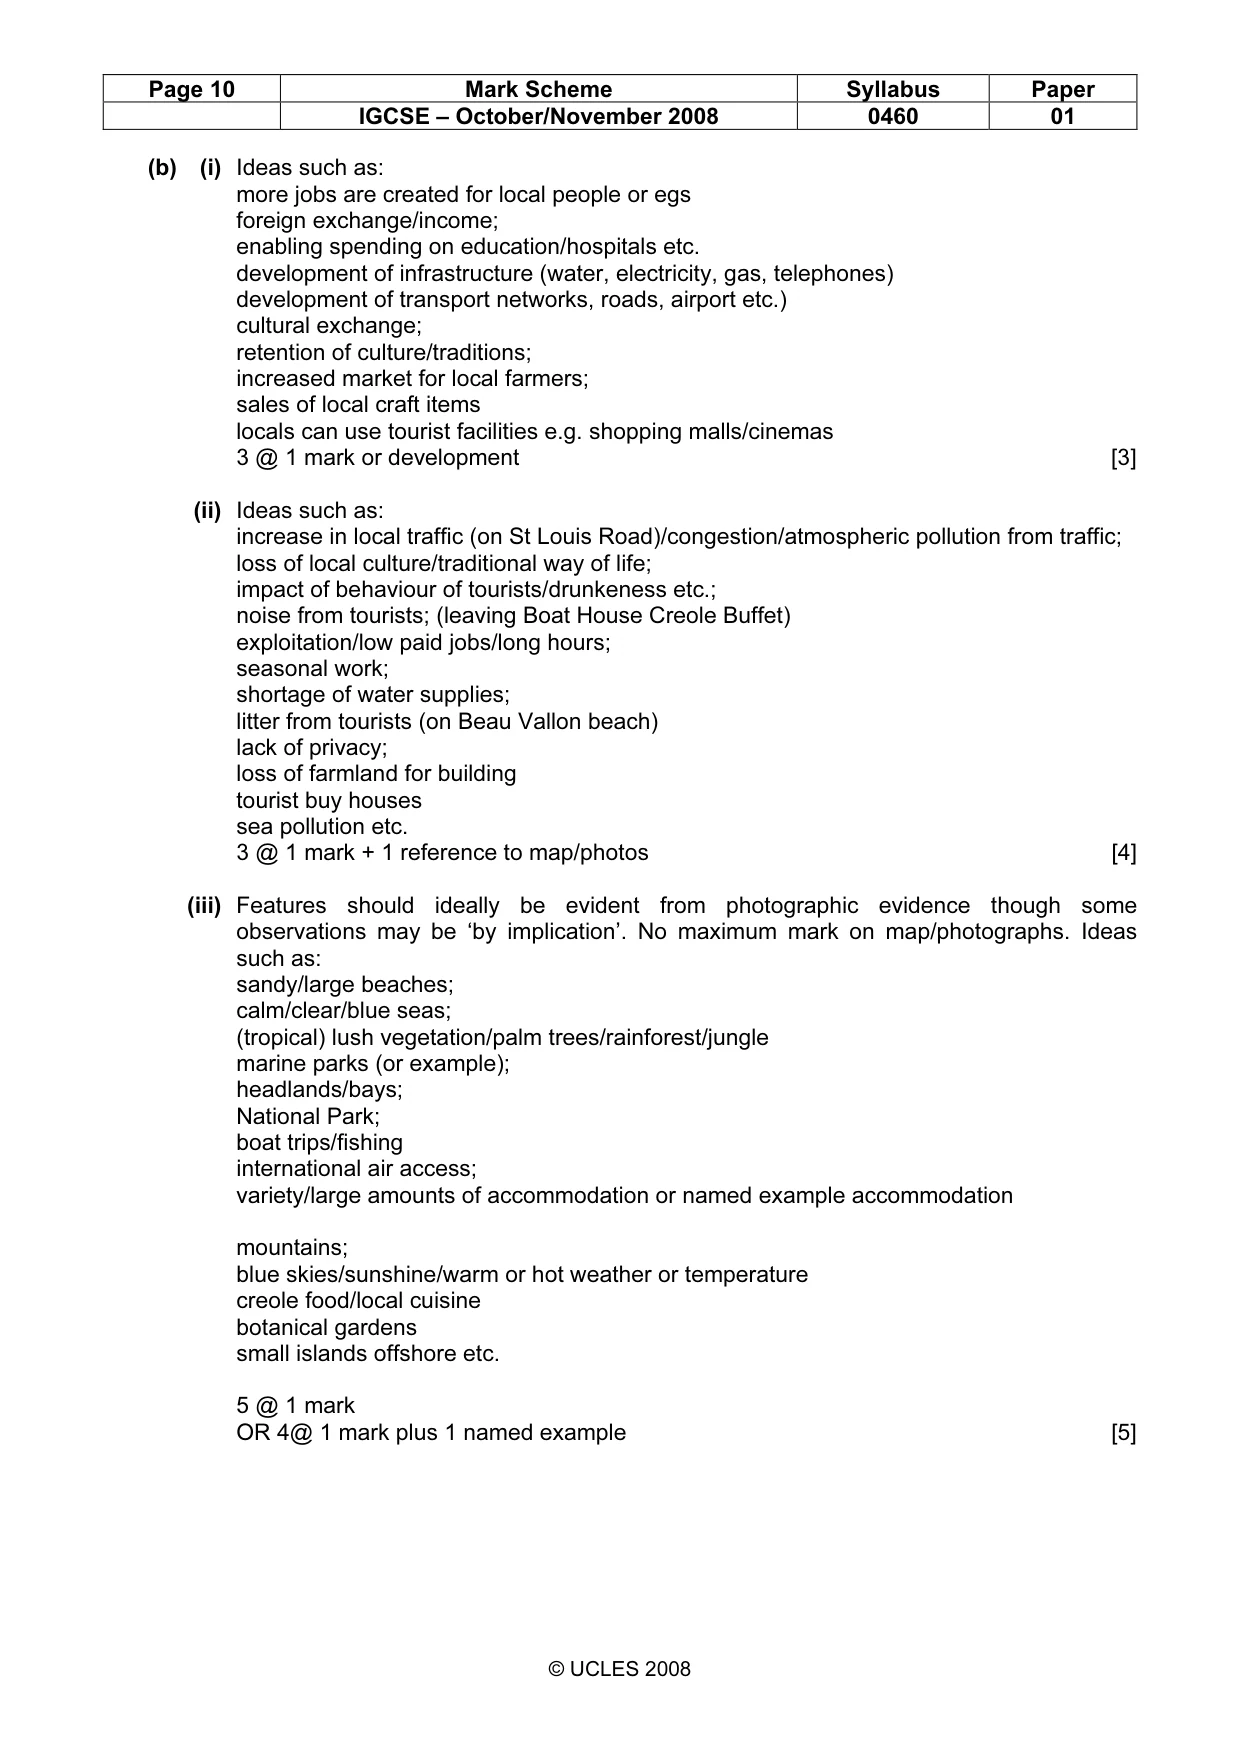
Page 10 Mark Scheme Syllabus Paper IGCSE – October/November 2008 0460 01 © UCLES 2008 (b) (i) Ideas such as: more jobs are created for local people or egs foreign exchange/income; enabling spending on education/hospitals etc. development of infrastructure (water, electricity, gas, telephones) development of transport networks, roads, airport etc.) cultural exchange; retention of culture/traditions; increased market for local farmers; sales of local craft items locals can use tourist facilities e.g. shopping malls/cinemas 3 @ 1 mark or development [3] (ii) Ideas such as: increase in local traffic (on St Louis Road)/congestion/atmospheric pollution from traffic; loss of local culture/traditional way of life; impact of behaviour of tourists/drunkeness etc.; noise from tourists; (leaving Boat House Creole Buffet) exploitation/low paid jobs/long hours; seasonal work; shortage of water supplies; litter from tourists (on Beau Vallon beach) lack of privacy; loss of farmland for building tourist buy houses sea pollution etc. 3 @ 1 mark + 1 reference to map/photos [4] (iii) Features should ideally be evident from photographic evidence though some observations may be ‘by implication’. No maximum mark on map/photographs. Ideas such as: sandy/large beaches; calm/clear/blue seas; (tropical) lush vegetation/palm trees/rainforest/jungle marine parks (or example); headlands/bays; National Park; boat trips/fishing international air access; variety/large amounts of accommodation or named example accommodation mountains; blue skies/sunshine/warm or hot weather or temperature creole food/local cuisine botanical gardens small islands offshore etc. 5 @ 1 mark OR 4@ 1 mark plus 1 named example [5]
Mark scheme, page 11
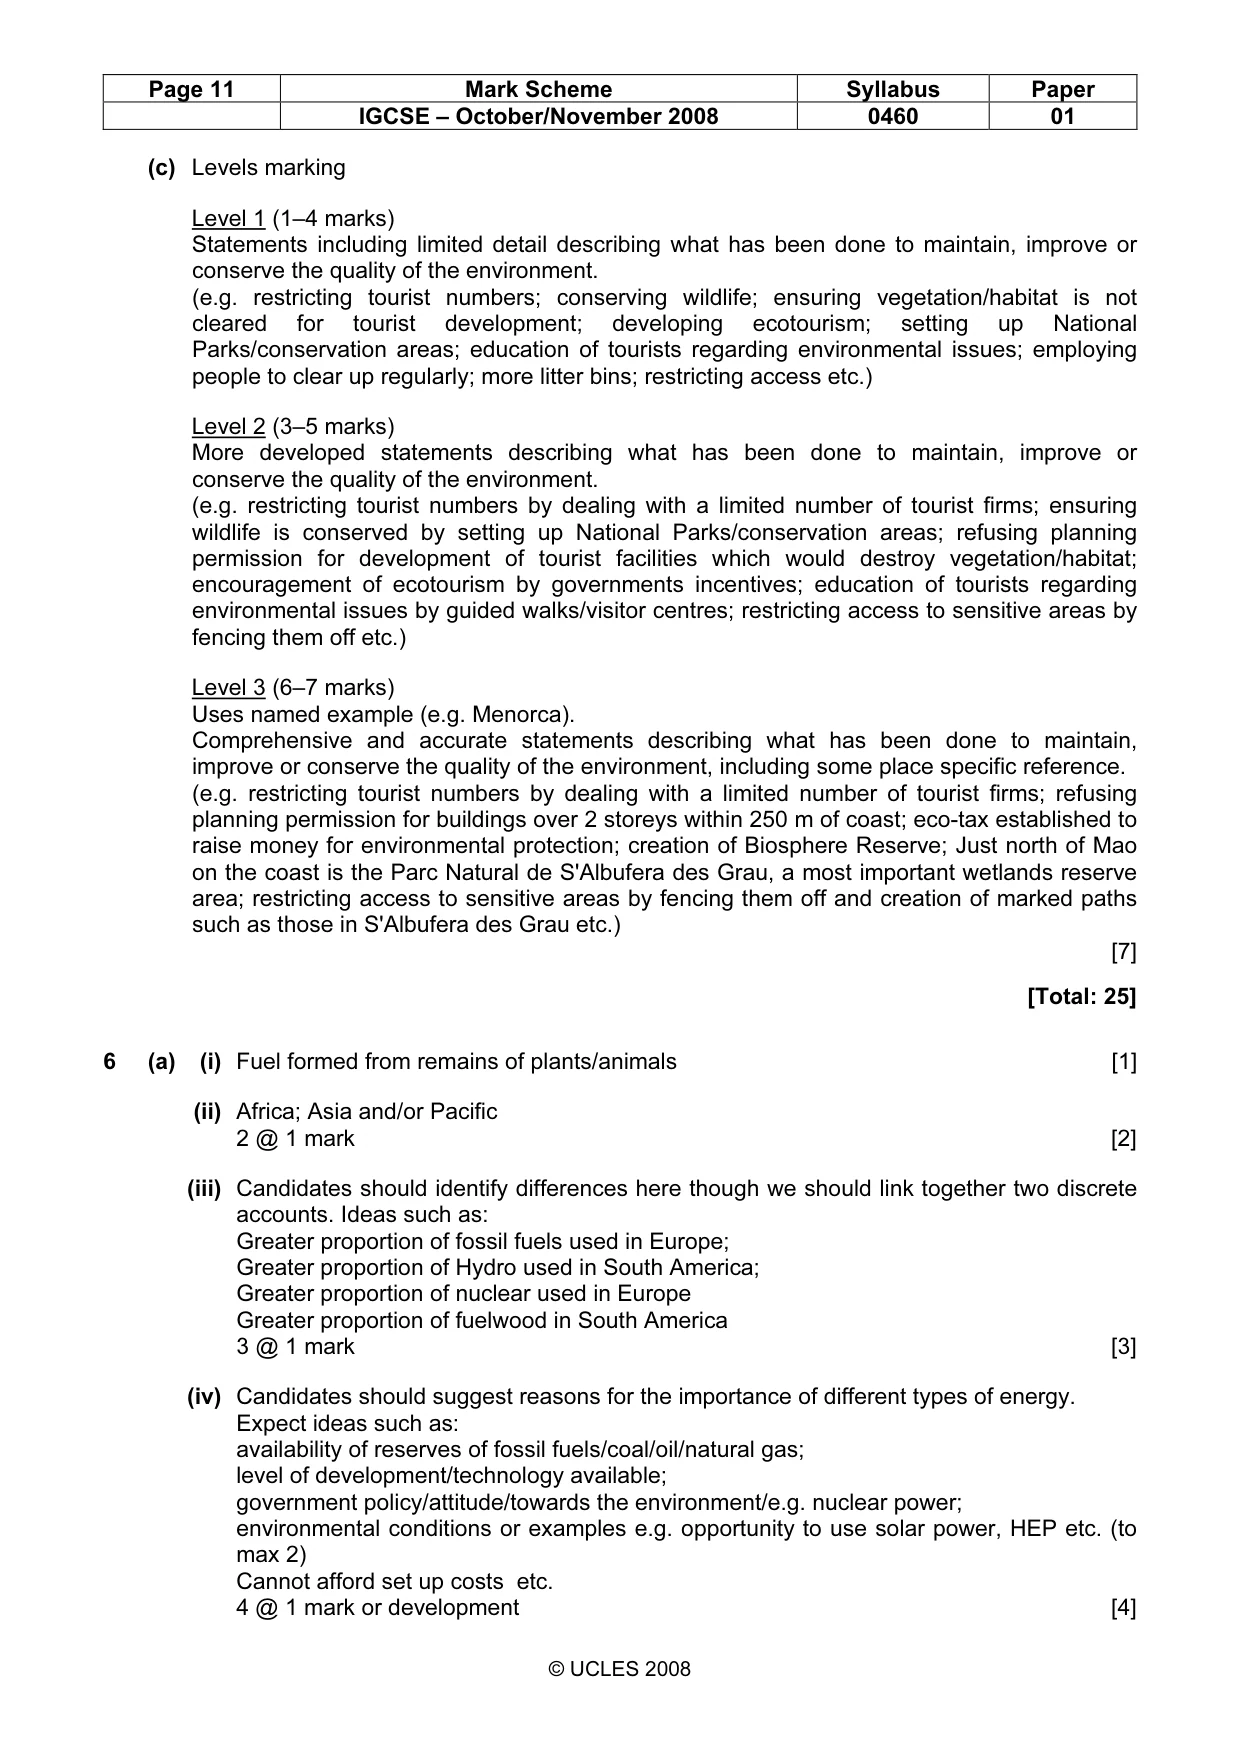
Page 11 Mark Scheme Syllabus Paper IGCSE – October/November 2008 0460 01 © UCLES 2008 (c) Levels marking Level 1 (1–4 marks) Statements including limited detail describing what has been done to maintain, improve or conserve the quality of the environment. (e.g. restricting tourist numbers; conserving wildlife; ensuring vegetation/habitat is not cleared for tourist development; developing ecotourism; setting up National Parks/conservation areas; education of tourists regarding environmental issues; employing people to clear up regularly; more litter bins; restricting access etc.) Level 2 (3–5 marks) More developed statements describing what has been done to maintain, improve or conserve the quality of the environment. (e.g. restricting tourist numbers by dealing with a limited number of tourist firms; ensuring wildlife is conserved by setting up National Parks/conservation areas; refusing planning permission for development of tourist facilities which would destroy vegetation/habitat; encouragement of ecotourism by governments incentives; education of tourists regarding environmental issues by guided walks/visitor centres; restricting access to sensitive areas by fencing them off etc.) Level 3 (6–7 marks) Uses named example (e.g. Menorca). Comprehensive and accurate statements describing what has been done to maintain, improve or conserve the quality of the environment, including some place specific reference. (e.g. restricting tourist numbers by dealing with a limited number of tourist firms; refusing planning permission for buildings over 2 storeys within 250 m of coast; eco-tax established to raise money for environmental protection; creation of Biosphere Reserve; Just north of Mao on the coast is the Parc Natural de S'Albufera des Grau, a most important wetlands reserve area; restricting access to sensitive areas by fencing them off and creation of marked paths such as those in S'Albufera des Grau etc.) [7] [Total: 25] 6 (a) (i) Fuel formed from remains of plants/animals [1] (ii) Africa; Asia and/or Pacific 2 @ 1 mark [2] (iii) Candidates should identify differences here though we should link together two discrete accounts. Ideas such as: Greater proportion of fossil fuels used in Europe; Greater proportion of Hydro used in South America; Greater proportion of nuclear used in Europe Greater proportion of fuelwood in South America 3 @ 1 mark [3] (iv) Candidates should suggest reasons for the importance of different types of energy. Expect ideas such as: availability of reserves of fossil fuels/coal/oil/natural gas; level of development/technology available; government policy/attitude/towards the environment/e.g. nuclear power; environmental conditions or examples e.g. opportunity to use solar power, HEP etc. (to max 2) Cannot afford set up costs etc. 4 @ 1 mark or development [4]
Mark scheme, page 12
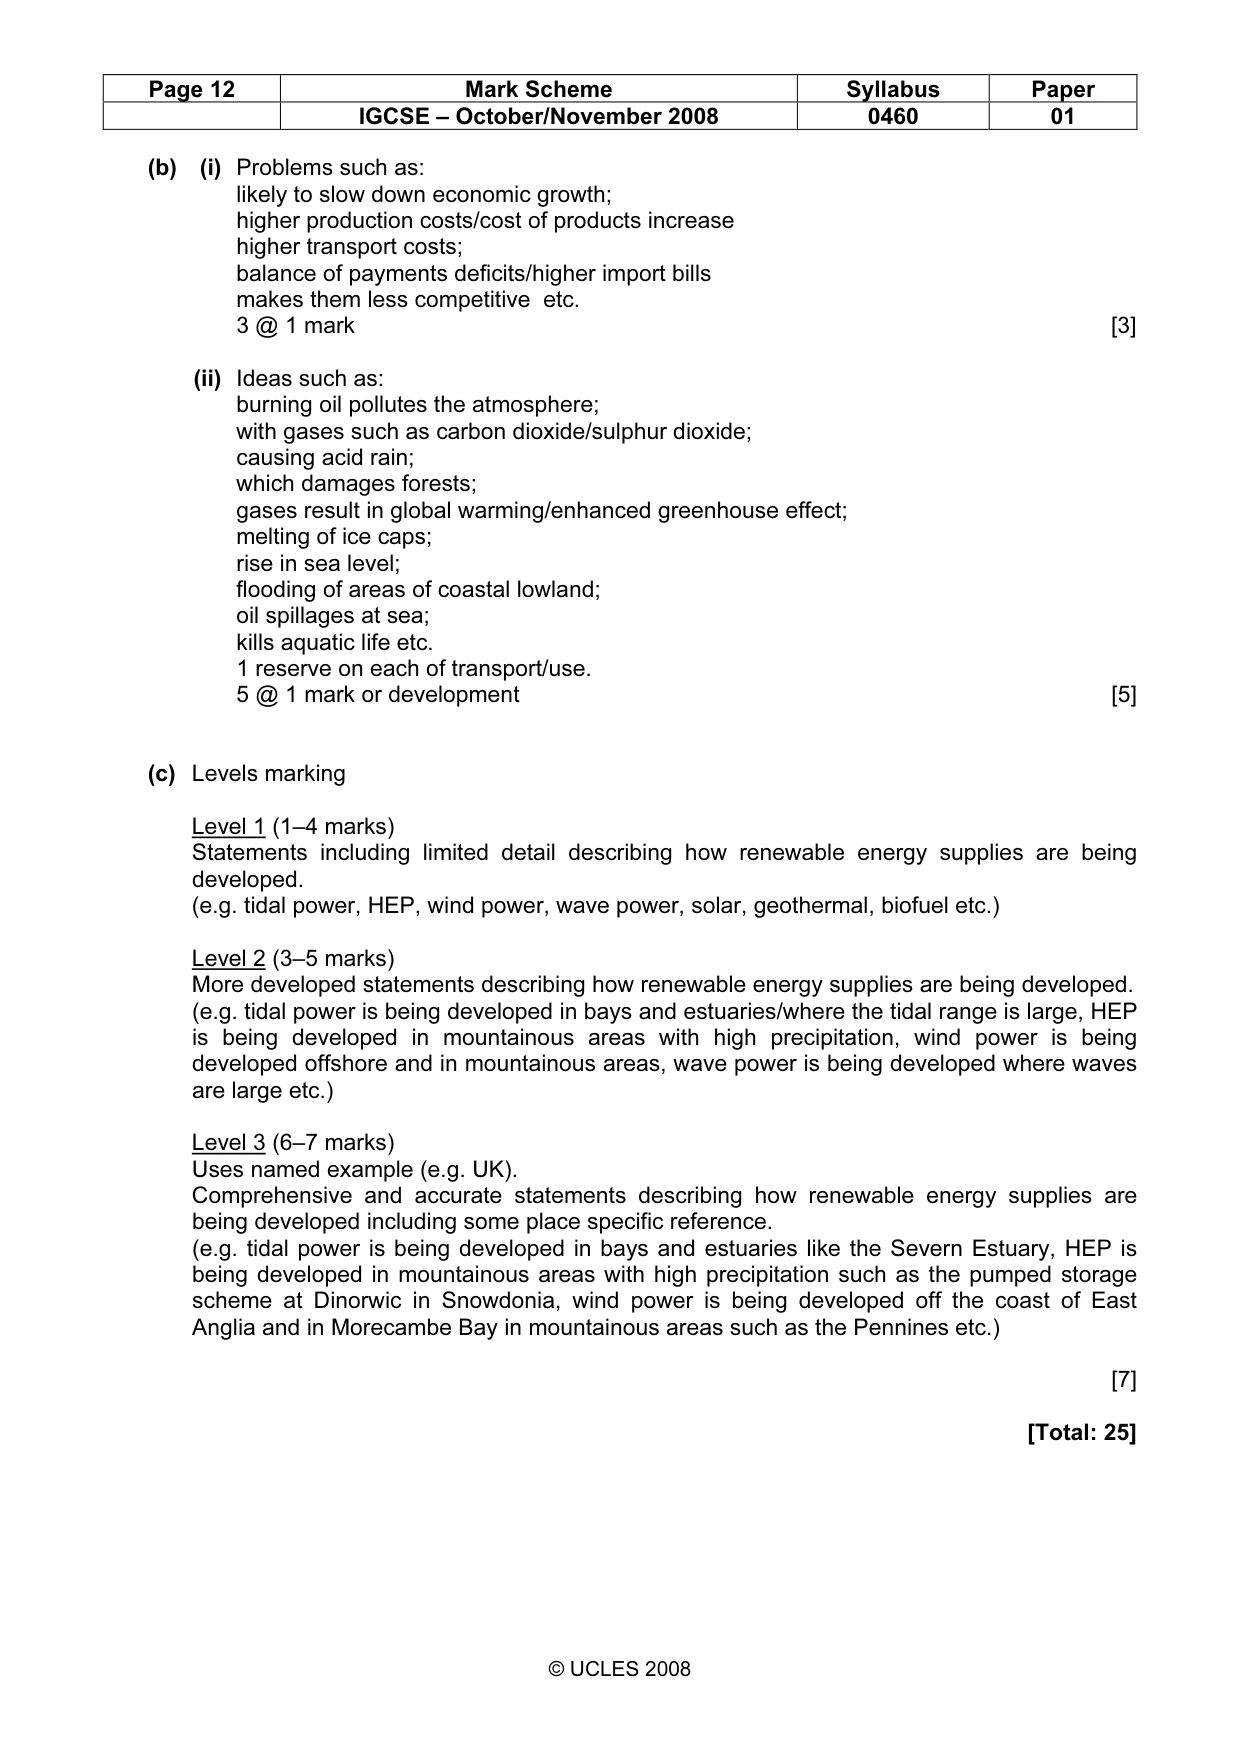
Page 12 Mark Scheme Syllabus Paper IGCSE – October/November 2008 0460 01 © UCLES 2008 (b) (i) Problems such as: likely to slow down economic growth; higher production costs/cost of products increase higher transport costs; balance of payments deficits/higher import bills makes them less competitive etc. 3 @ 1 mark [3] (ii) Ideas such as: burning oil pollutes the atmosphere; with gases such as carbon dioxide/sulphur dioxide; causing acid rain; which damages forests; gases result in global warming/enhanced greenhouse effect; melting of ice caps; rise in sea level; flooding of areas of coastal lowland; oil spillages at sea; kills aquatic life etc. 1 reserve on each of transport/use. 5 @ 1 mark or development [5] (c) Levels marking Level 1 (1–4 marks) Statements including limited detail describing how renewable energy supplies are being developed. (e.g. tidal power, HEP, wind power, wave power, solar, geothermal, biofuel etc.) Level 2 (3–5 marks) More developed statements describing how renewable energy supplies are being developed. (e.g. tidal power is being developed in bays and estuaries/where the tidal range is large, HEP is being developed in mountainous areas with high precipitation, wind power is being developed offshore and in mountainous areas, wave power is being developed where waves are large etc.) Level 3 (6–7 marks) Uses named example (e.g. UK). Comprehensive and accurate statements describing how renewable energy supplies are being developed including some place specific reference. (e.g. tidal power is being developed in bays and estuaries like the Severn Estuary, HEP is being developed in mountainous areas with high precipitation such as the pumped storage scheme at Dinorwic in Snowdonia, wind power is being developed off the coast of East Anglia and in Morecambe Bay in mountainous areas such as the Pennines etc.) [7] [Total: 25]
What you needed in this session
Cambridge’s own grade thresholds for 2008 Oct/Nov, Paper 1 · Variant 1. A higher threshold means an easier paper — the bar moves with how the cohort did.