Cambridge IGCSE Geography 0460 — 2008 May/June Paper 1 · Variant 1
0460/11/M/J/08 · 75 marks · ≈84 min
The question paper and its mark scheme, free to read here and free to download. This is Cambridge’s own paper, exactly as it was sat.
Question paper16 pages


Mark scheme15 pages
Answers below. Sit the paper first if you are practising.
Paper as text
Question paper, page 1
This document consists of 13 printed pages, 3 blank pages and 1 Insert. SP (SM/CGW) T47437/6 © UCLES 2008 [Turn over UNIVERSITY OF CAMBRIDGE INTERNATIONAL EXAMINATIONS International General Certificate of Secondary Education READ THESE INSTRUCTIONS FIRST If you have been given an Answer Booklet, follow the instructions on the front cover of the Booklet. Write your Centre number, candidate number and name on all the work you hand in. Write in dark blue or black pen. You may use a soft pencil for any diagrams, graphs or rough working. Do not use staples, paper clips, highlighters, glue or correction fluid. Answer three questions. Sketch maps and diagrams should be drawn whenever they serve to illustrate an answer. The Insert contains Photographs A, B and C for Question 2, Photograph D for Question 3 and Figs 8A and 8B for Question 5. At the end of the examination, fasten all your work securely together. The number of marks is given in brackets [ ] at the end of each question or part question. * 7 5 1 3 0 8 1 8 2 1 * GEOGRAPHY 0460/01 Paper 1 May/June 2008 1 hour 45 minutes Additional Materials: Answer Booklet/Paper Ruler www.XtremePapers.com
Question paper, page 2
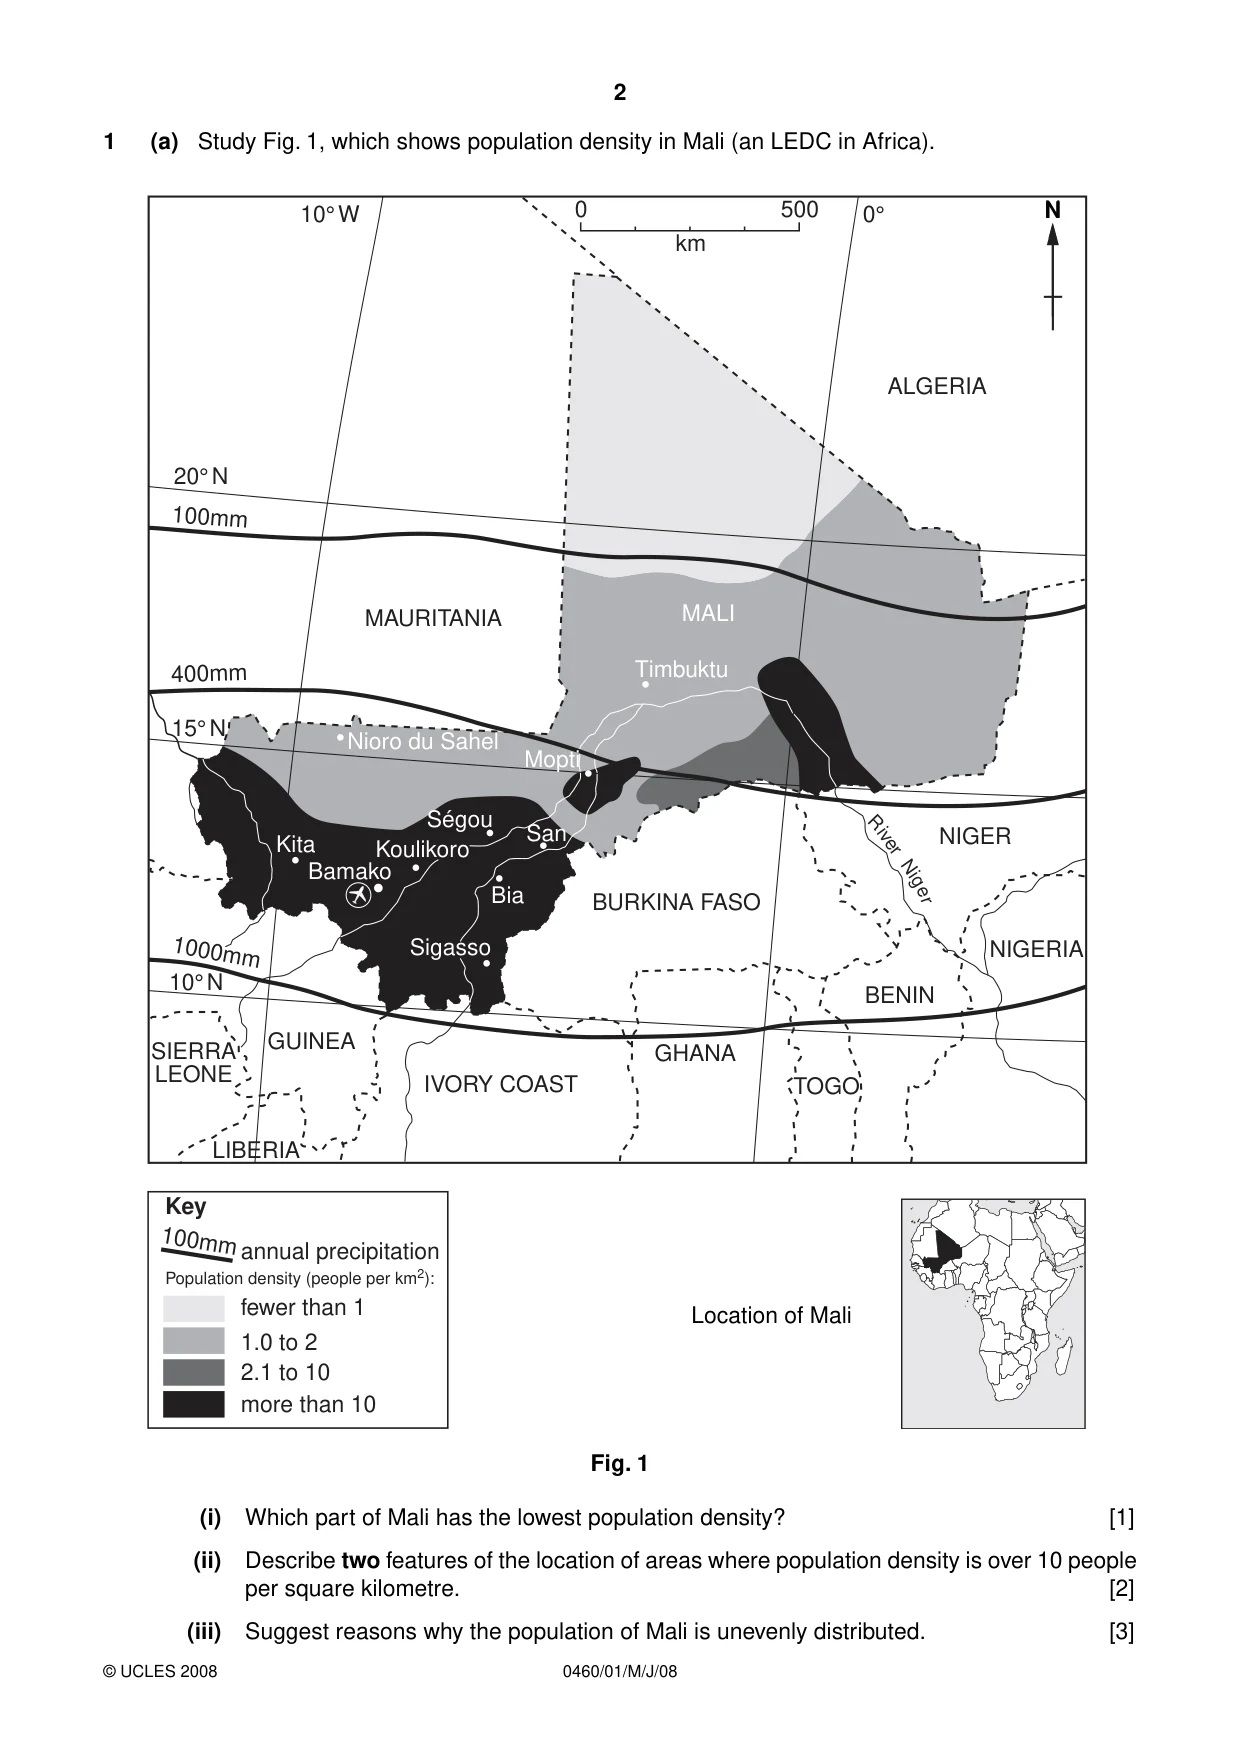
2 0460/01/M/J/08 © UCLES 2008 1 (a) Study Fig. 1, which shows population density in Mali (an LEDC in Africa). R ive r Ni g e r 10° W 0° N ALGERIA NIGER NIGERIA BENIN TOGO GHANA IVORY COAST LIBERIA GUINEA SIERRA LEONE BURKINA FASO MALI MAURITANIA Timbuktu 0 500 km 20° N 15° N 100mm 400mm 1000mm 10° N Ségou Kita Nioro du Sahel Bia Sigasso San Koulikoro Bamako Mopti N Key fewer than 1 1.0 to 2 2.1 to 10 more than 10 annual precipitation 100mm Population density (people per km2): Location of Mali Fig. 1 (i) Which part of Mali has the lowest population density? [1] (ii) Describe two features of the location of areas where population density is over 10 people per square kilometre. [2] (iii) Suggest reasons why the population of Mali is unevenly distributed. [3]
Question paper, page 3
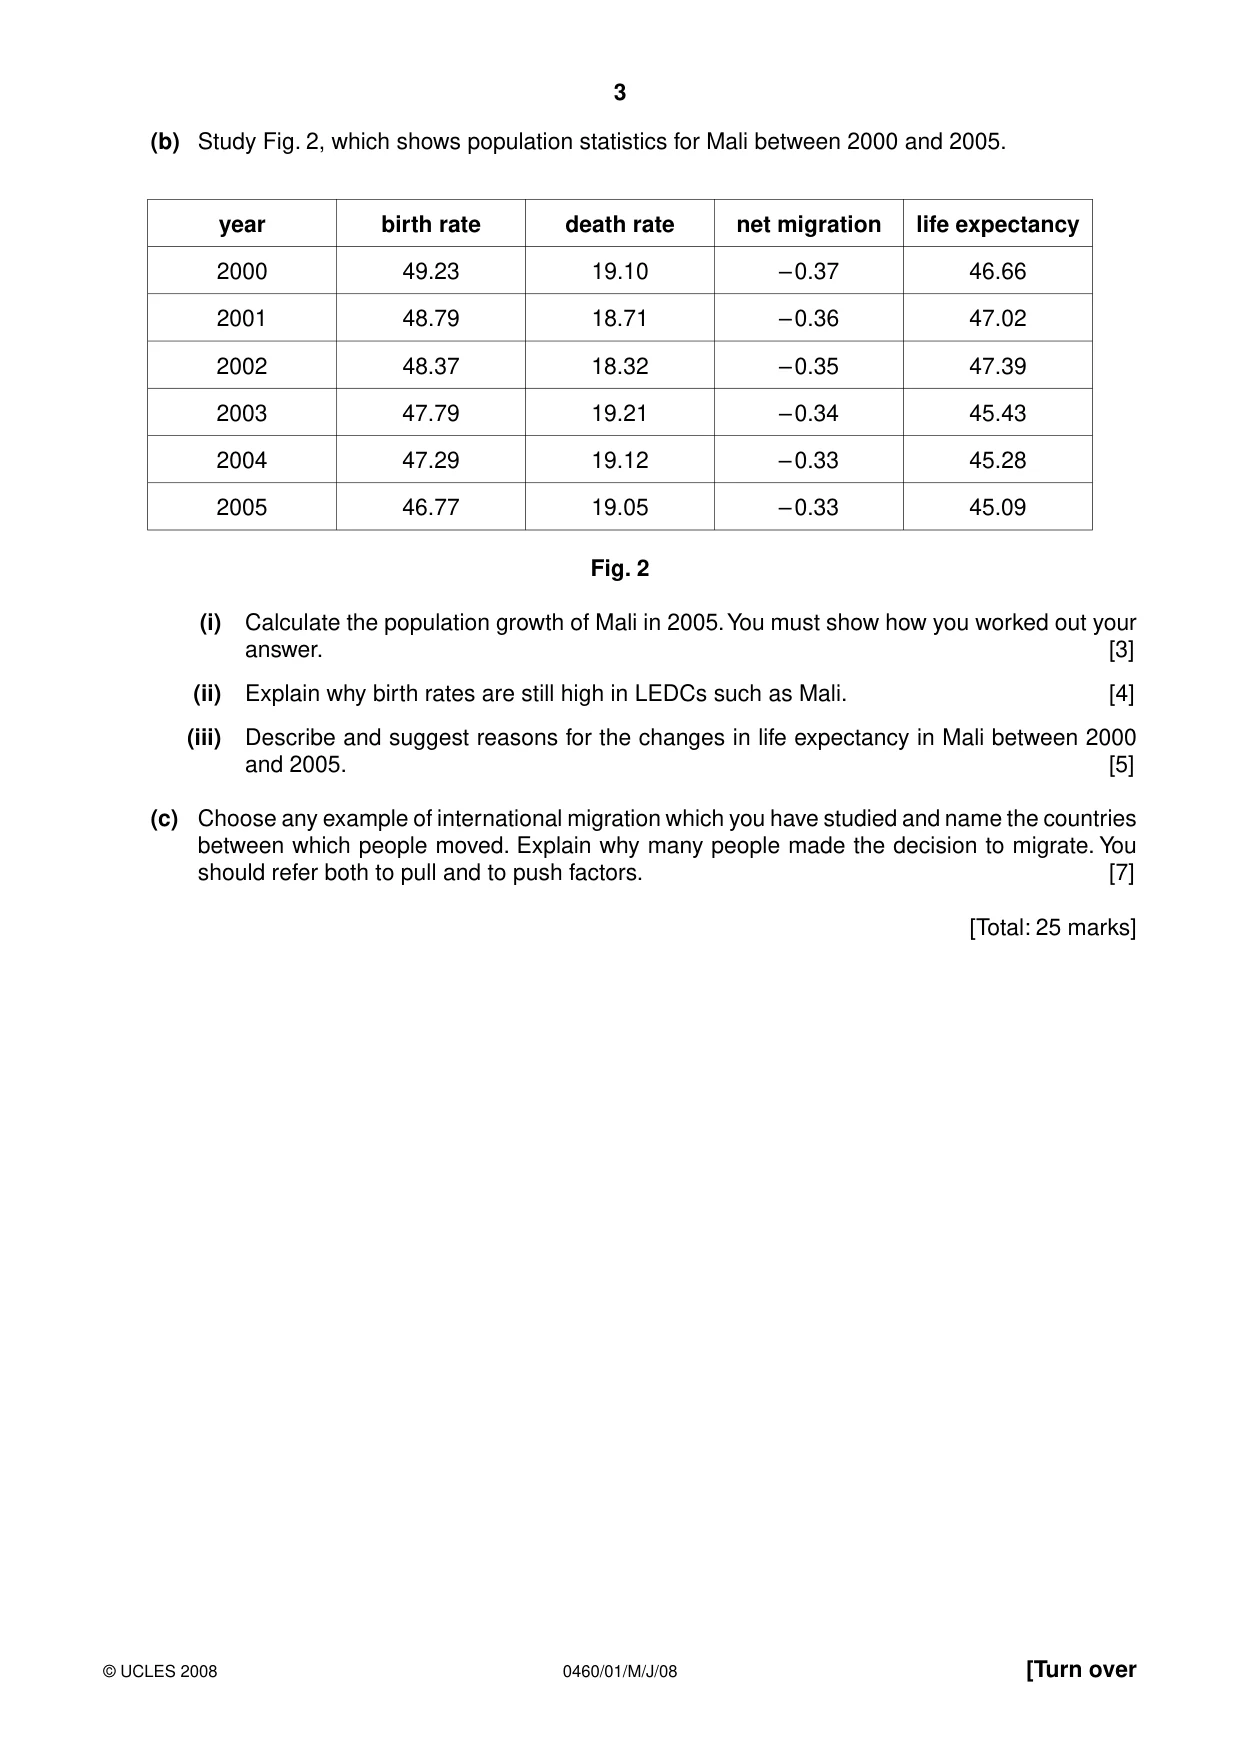
3 0460/01/M/J/08 © UCLES 2008 [Turn over (b) Study Fig. 2, which shows population statistics for Mali between 2000 and 2005. year birth rate death rate net migration life expectancy 2000 49.23 19.10 – 0.37 46.66 2001 48.79 18.71 – 0.36 47.02 2002 48.37 18.32 – 0.35 47.39 2003 47.79 19.21 – 0.34 45.43 2004 47.29 19.12 – 0.33 45.28 2005 46.77 19.05 – 0.33 45.09 Fig. 2 (i) Calculate the population growth of Mali in 2005. You must show how you worked out your answer. [3] (ii) Explain why birth rates are still high in LEDCs such as Mali. [4] (iii) Describe and suggest reasons for the changes in life expectancy in Mali between 2000 and 2005. [5] (c) Choose any example of international migration which you have studied and name the countries between which people moved. Explain why many people made the decision to migrate. You should refer both to pull and to push factors. [7] [Total: 25 marks]
Question paper, page 4
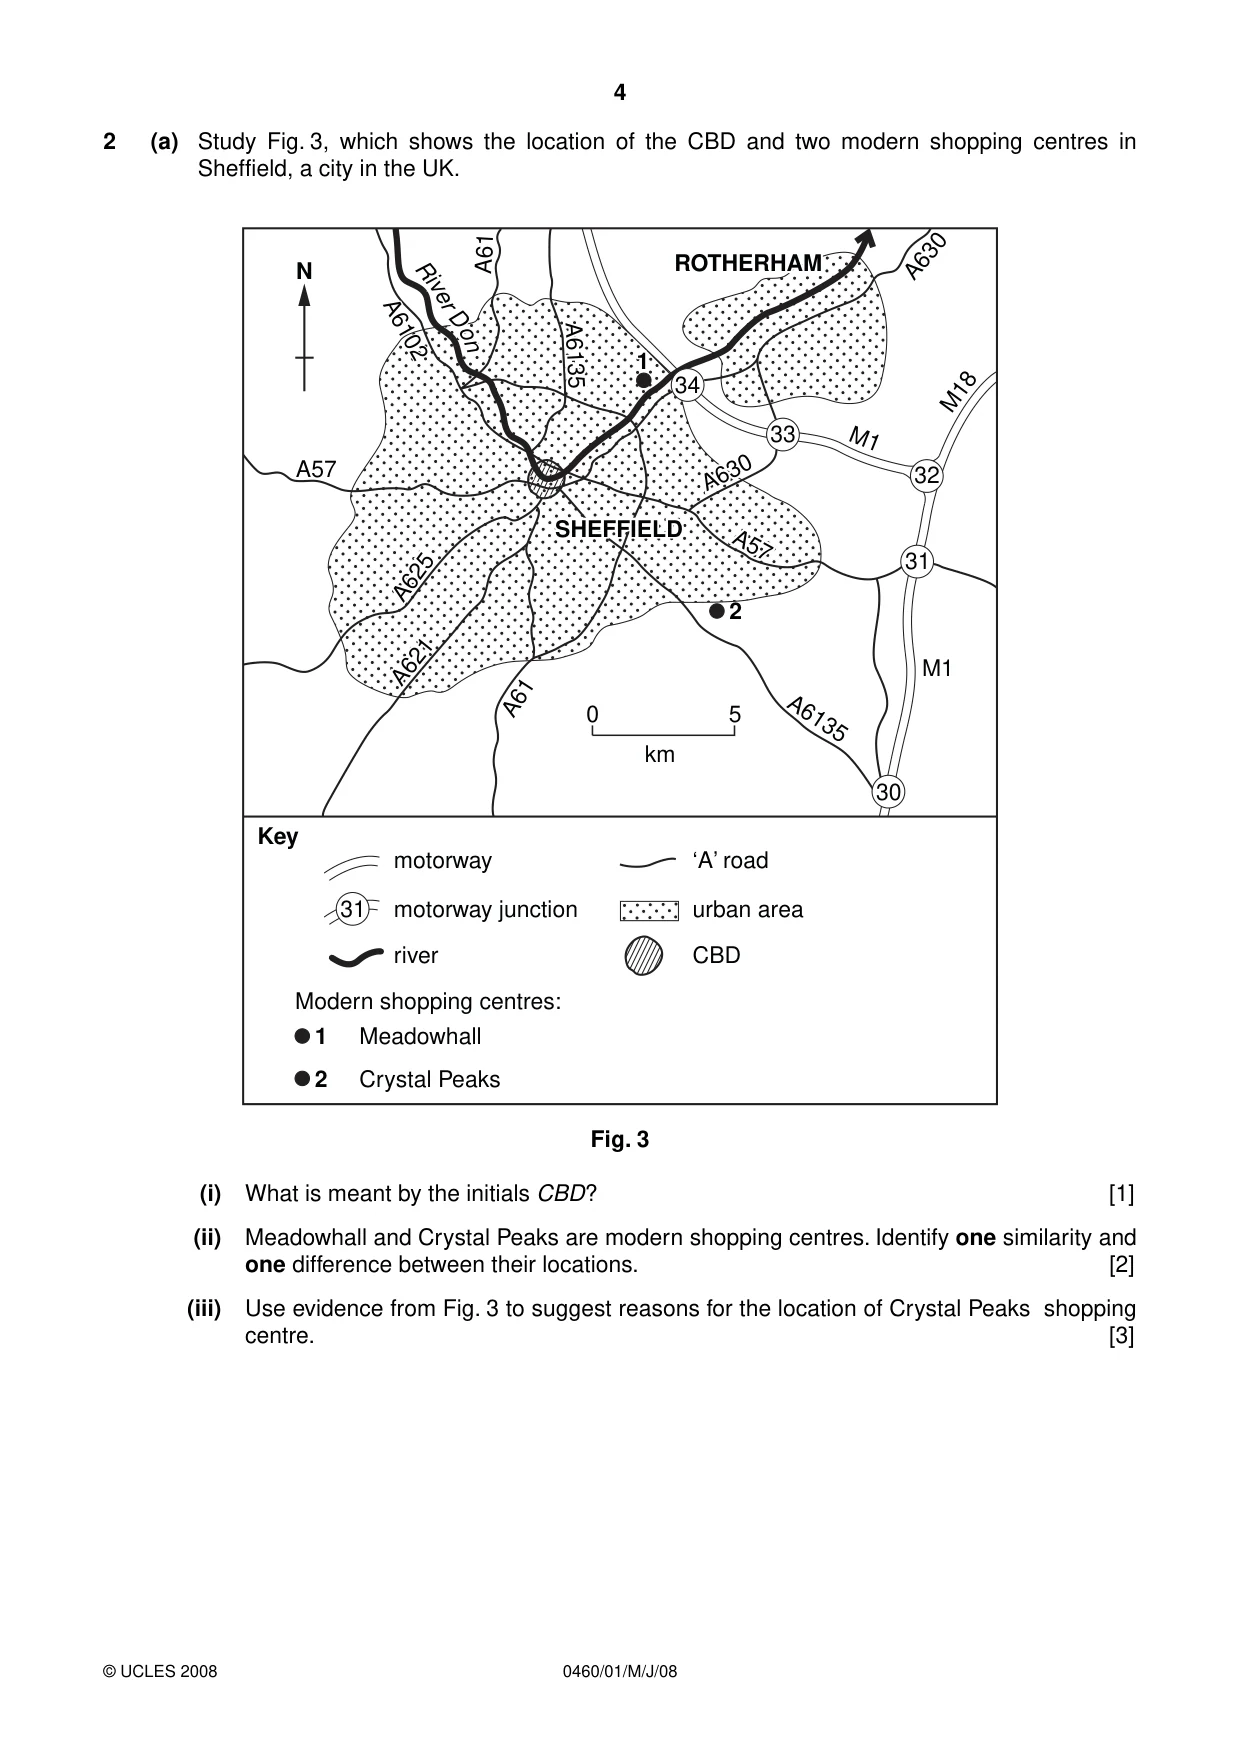
4 0460/01/M/J/08 © UCLES 2008 2 (a) Study Fig. 3, which shows the location of the CBD and two modern shopping centres in Sheffield, a city in the UK. A57 A61 A61 A6135 A57 A57 A621 A621 A621 A625 A625 A625 Ri v er D o n SHEFFIELD SHEFFIELD SHEFFIELD ROTHERHAM ROTHERHAM ROTHERHAM 2 2 Crystal Peaks 1 Meadowhall 0 5 km M1 M1 1 34 33 31 30 A57 M18 A630 A630 A630 A630 A6135 A6135 A6135 A6102 A6102 A6102 Ri v er D o n 32 31 motorway Key Modern shopping centres: motorway junction river ‘A’ road urban area CBD N Fig. 3 (i) What is meant by the initials CBD? [1] (ii) Meadowhall and Crystal Peaks are modern shopping centres. Identify one similarity and one difference between their locations. [2] (iii) Use evidence from Fig. 3 to suggest reasons for the location of Crystal Peaks shopping centre. [3]
Question paper, page 5
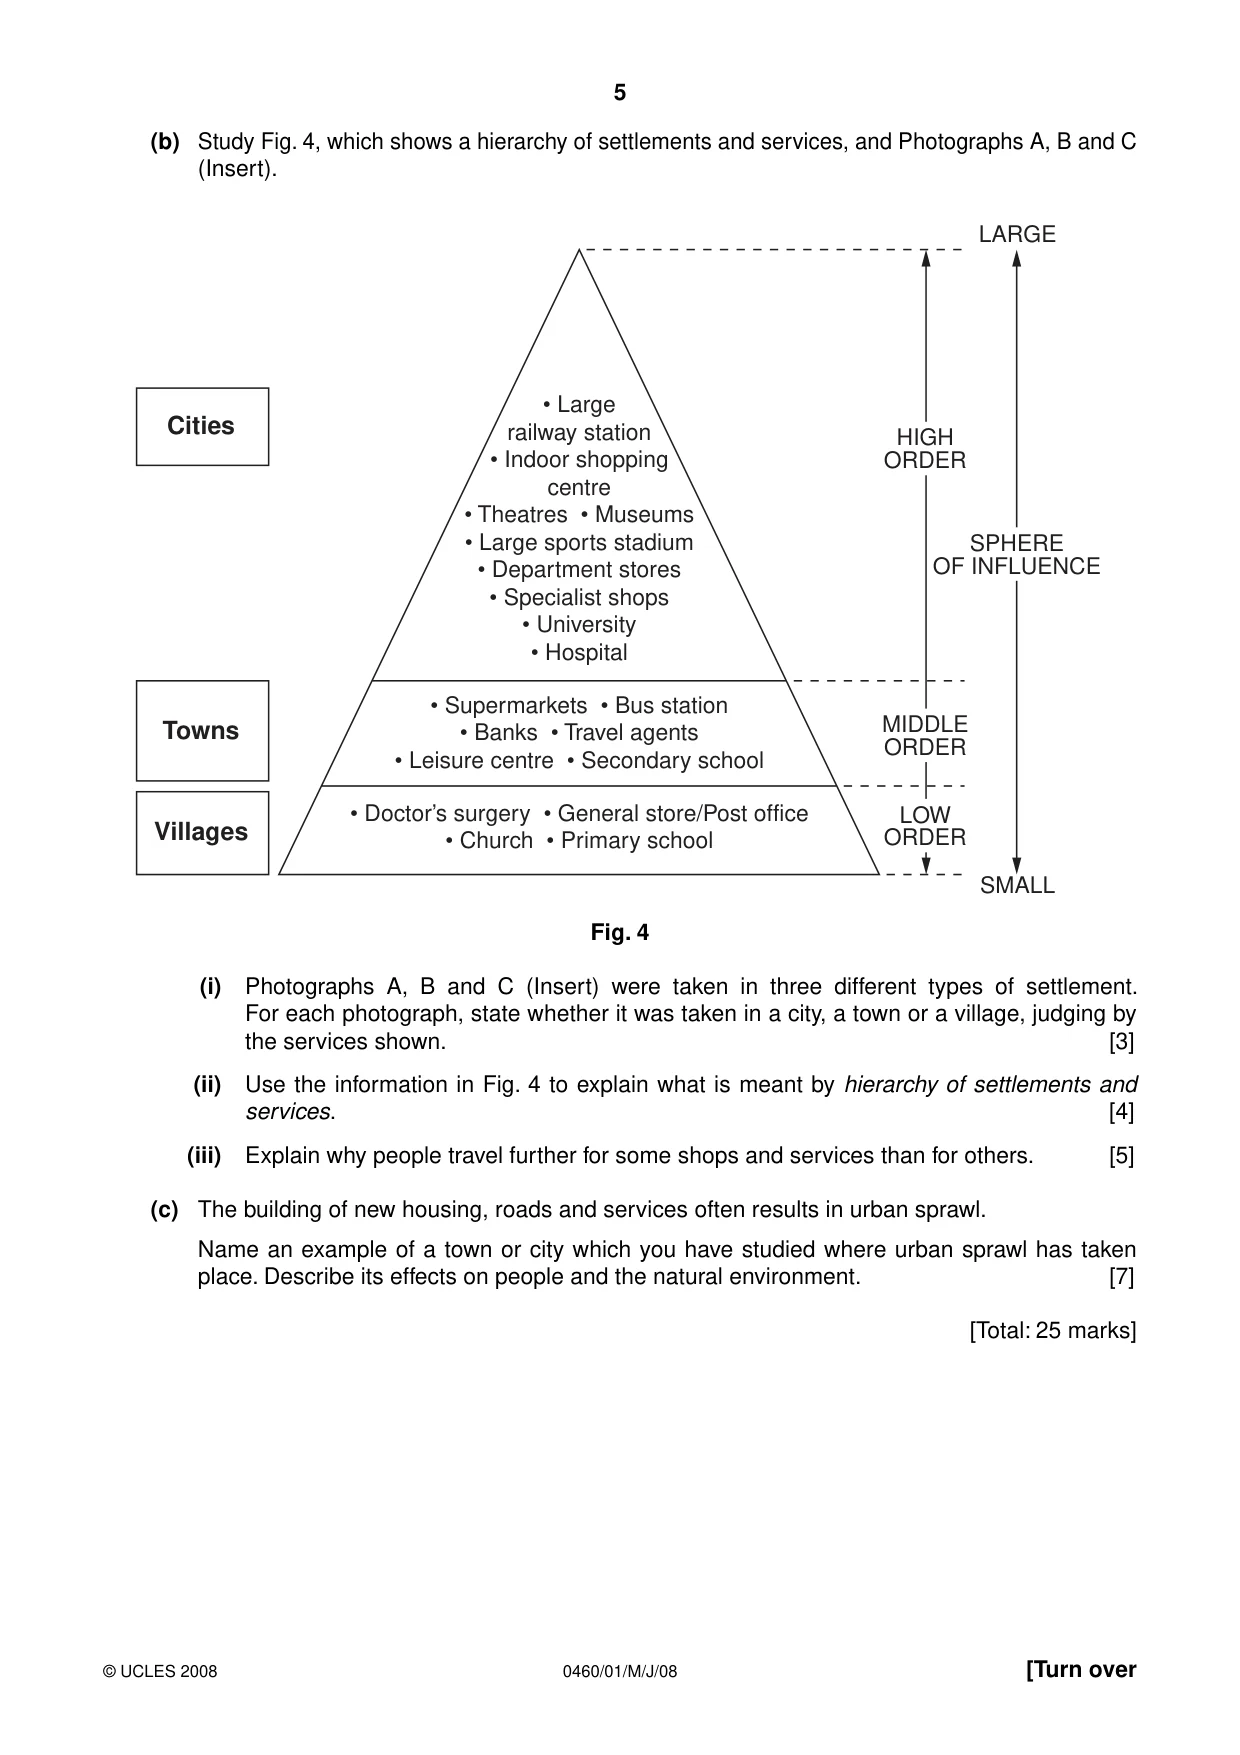
5 0460/01/M/J/08 © UCLES 2008 [Turn over (b) Study Fig. 4, which shows a hierarchy of settlements and services, and Photographs A, B and C (Insert). • Large railway station • Indoor shopping centre • Theatres • Museums • Large sports stadium • Department stores • Specialist shops • University • Hospital • Supermarkets • Bus station • Banks • Travel agents • Leisure centre • Secondary school • Doctor’s surgery • General store/Post office • Church • Primary school Villages Towns Cities HIGH ORDER SPHERE OF INFLUENCE MIDDLE ORDER LOW ORDER SMALL LARGE Fig. 4 (i) Photographs A, B and C (Insert) were taken in three different types of settlement. For each photograph, state whether it was taken in a city, a town or a village, judging by the services shown. [3] (ii) Use the information in Fig. 4 to explain what is meant by hierarchy of settlements and services. [4] (iii) Explain why people travel further for some shops and services than for others. [5] (c) The building of new housing, roads and services often results in urban sprawl. Name an example of a town or city which you have studied where urban sprawl has taken place. Describe its effects on people and the natural environment. [7] [Total: 25 marks]
Question paper, page 6
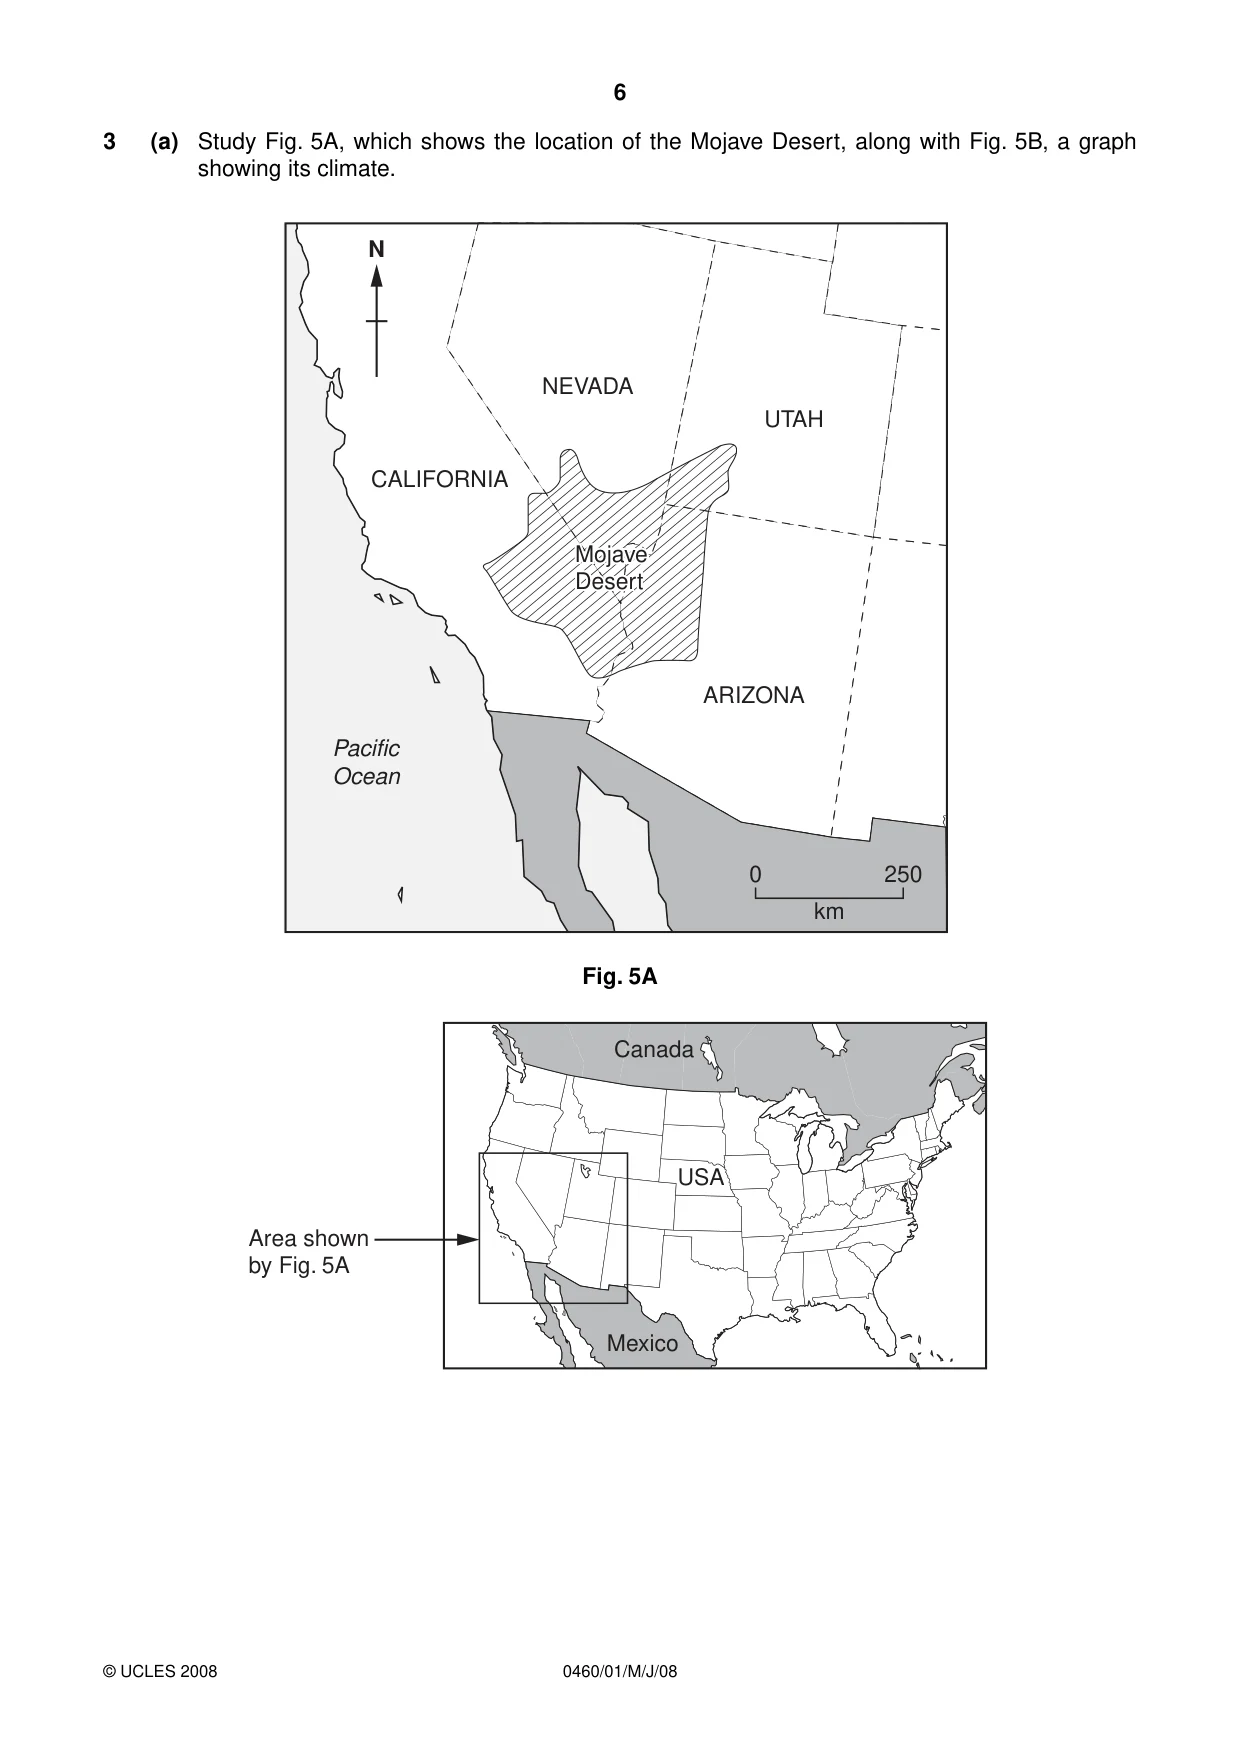
6 0460/01/M/J/08 © UCLES 2008 3 (a) Study Fig. 5A, which shows the location of the Mojave Desert, along with Fig. 5B, a graph showing its climate. CALIFORNIA NEVADA N UTAH ARIZONA Pacific Ocean Mojave Mojave Desert Desert Mojave Desert 0 250 km Fig. 5A Canada Mexico USA Area shown by Fig. 5A
Question paper, page 7
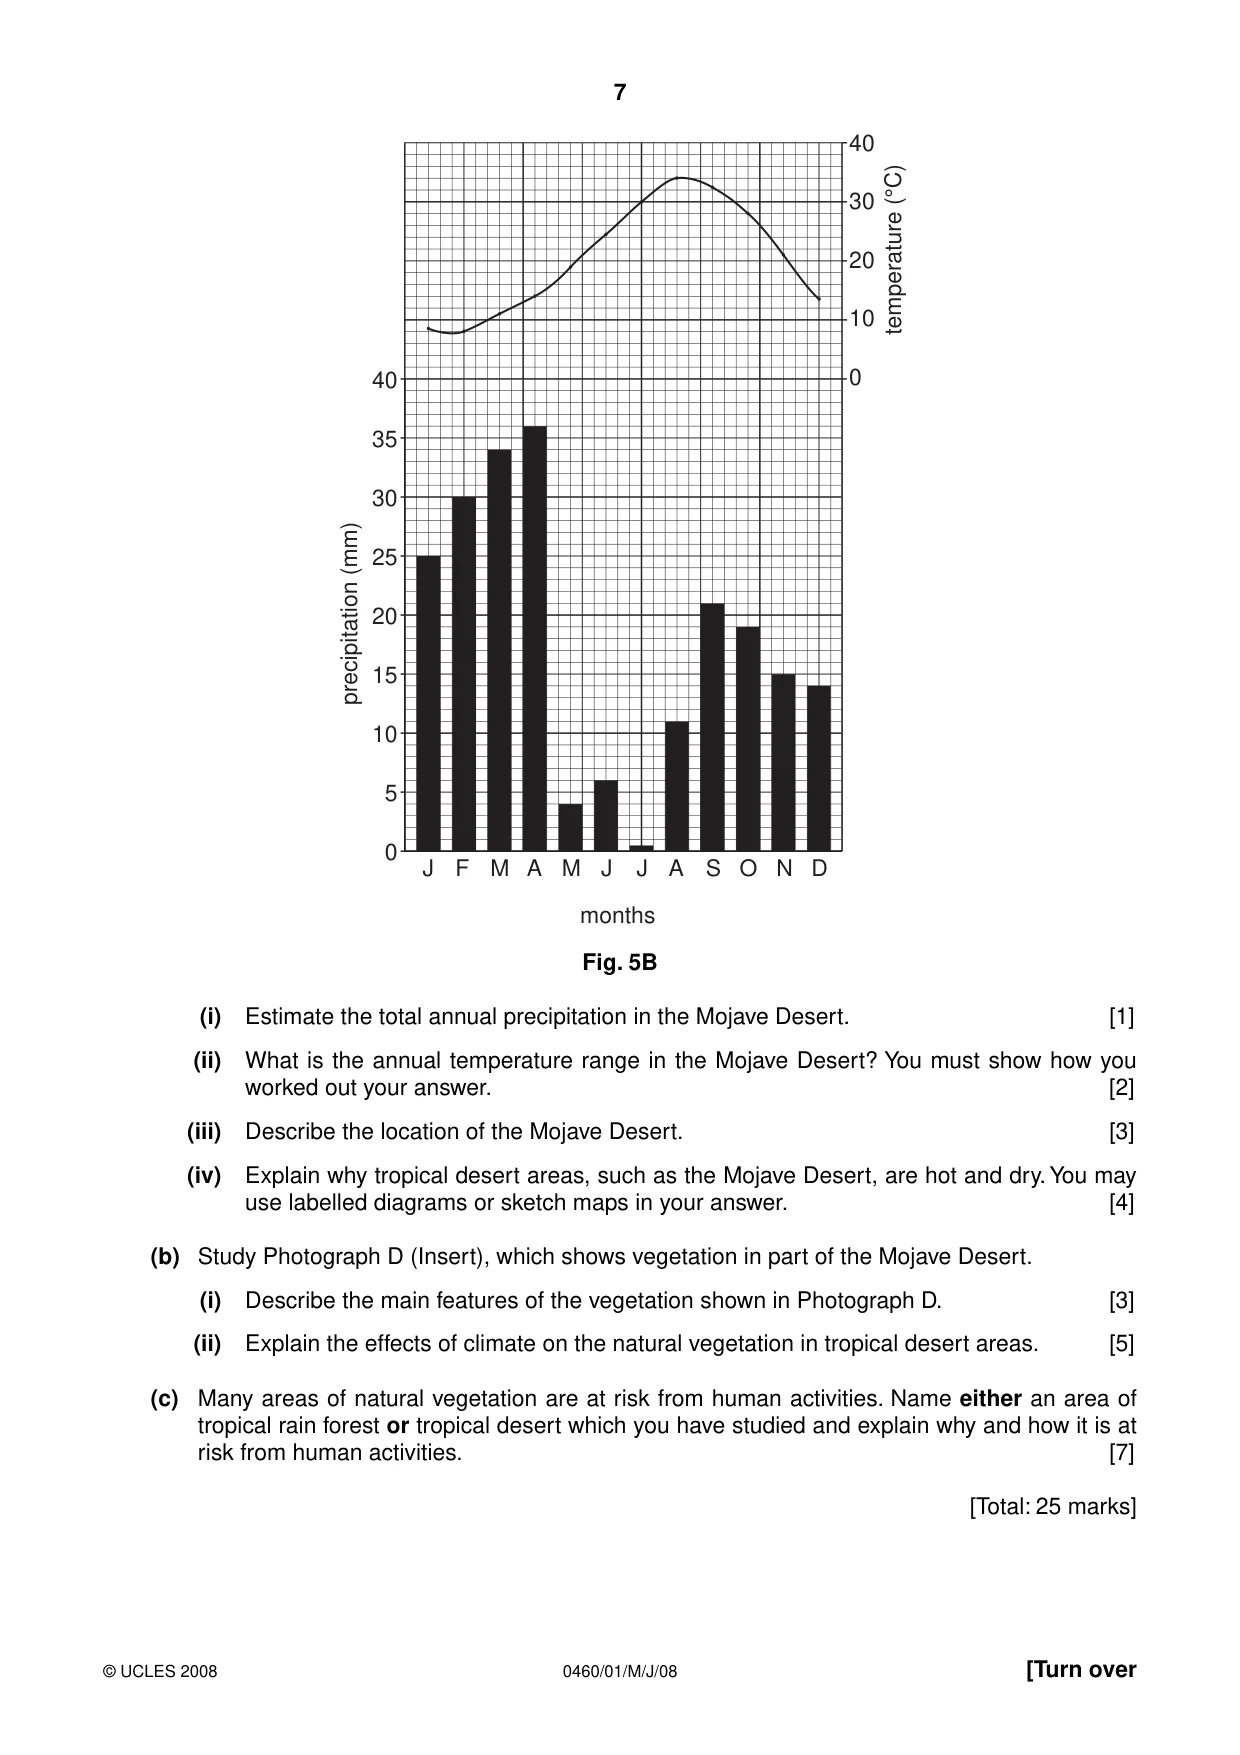
7 0460/01/M/J/08 © UCLES 2008 [Turn over 0 5 J F M A M J J A S O N D precipitation (mm) temperature (°C) 10 months 15 20 25 30 35 40 0 10 20 30 40 Fig. 5B (i) Estimate the total annual precipitation in the Mojave Desert. [1] (ii) What is the annual temperature range in the Mojave Desert? You must show how you worked out your answer. [2] (iii) Describe the location of the Mojave Desert. [3] (iv) Explain why tropical desert areas, such as the Mojave Desert, are hot and dry. You may use labelled diagrams or sketch maps in your answer. [4] (b) Study Photograph D (Insert), which shows vegetation in part of the Mojave Desert. (i) Describe the main features of the vegetation shown in Photograph D. [3] (ii) Explain the effects of climate on the natural vegetation in tropical desert areas. [5] (c) Many areas of natural vegetation are at risk from human activities. Name either an area of tropical rain forest or tropical desert which you have studied and explain why and how it is at risk from human activities. [7] [Total: 25 marks]
Question paper, page 8
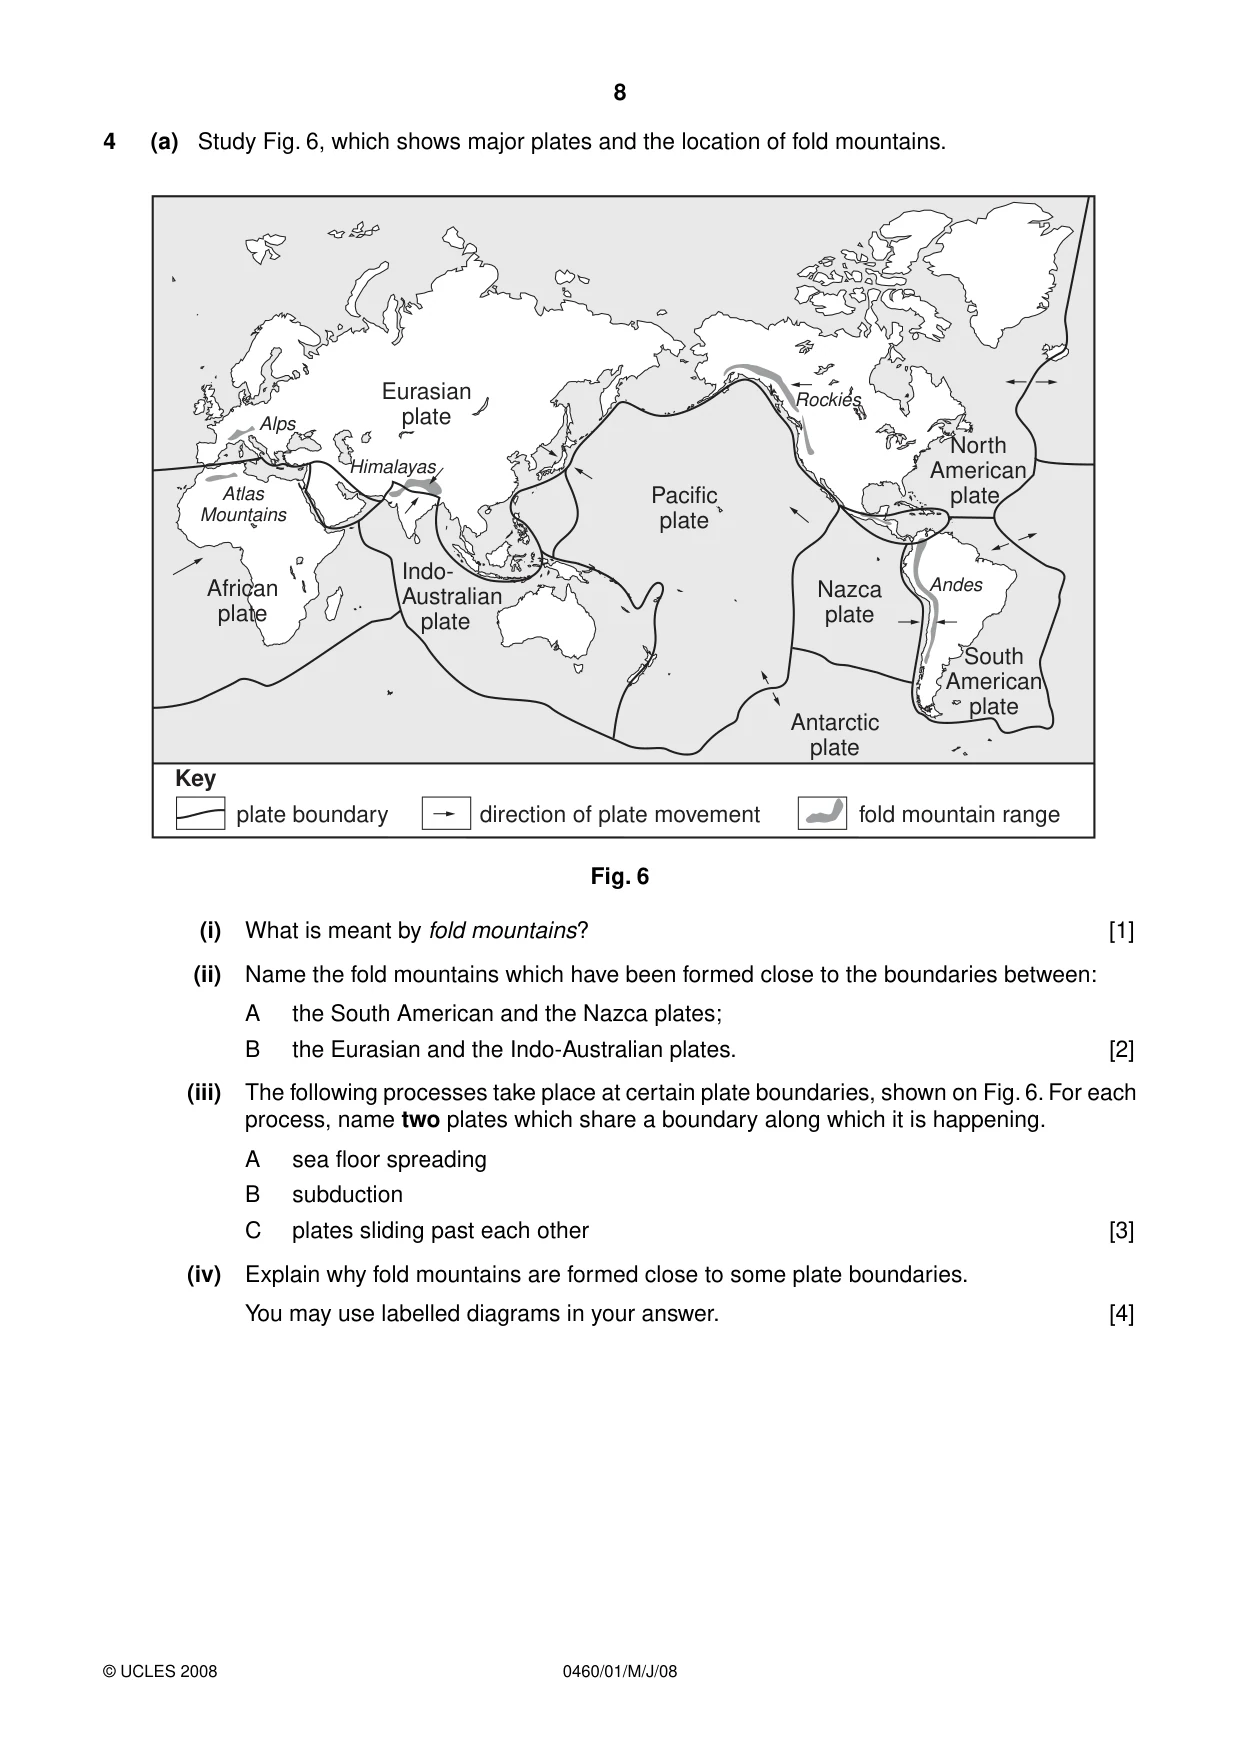
8 0460/01/M/J/08 © UCLES 2008 4 (a) Study Fig. 6, which shows major plates and the location of fold mountains. Pacific plate Eurasian plate African plate plate boundary Key direction of plate movement fold mountain range Indo- Australian plate Nazca plate Antarctic plate South American plate North American plate Rockies Andes Himalayas Alps Atlas Mountains Fig. 6 (i) What is meant by fold mountains? [1] (ii) Name the fold mountains which have been formed close to the boundaries between: A the South American and the Nazca plates; B the Eurasian and the Indo-Australian plates. [2] (iii) The following processes take place at certain plate boundaries, shown on Fig. 6. For each process, name two plates which share a boundary along which it is happening. A sea floor spreading B subduction C plates sliding past each other [3] (iv) Explain why fold mountains are formed close to some plate boundaries. You may use labelled diagrams in your answer. [4]
Question paper, page 9
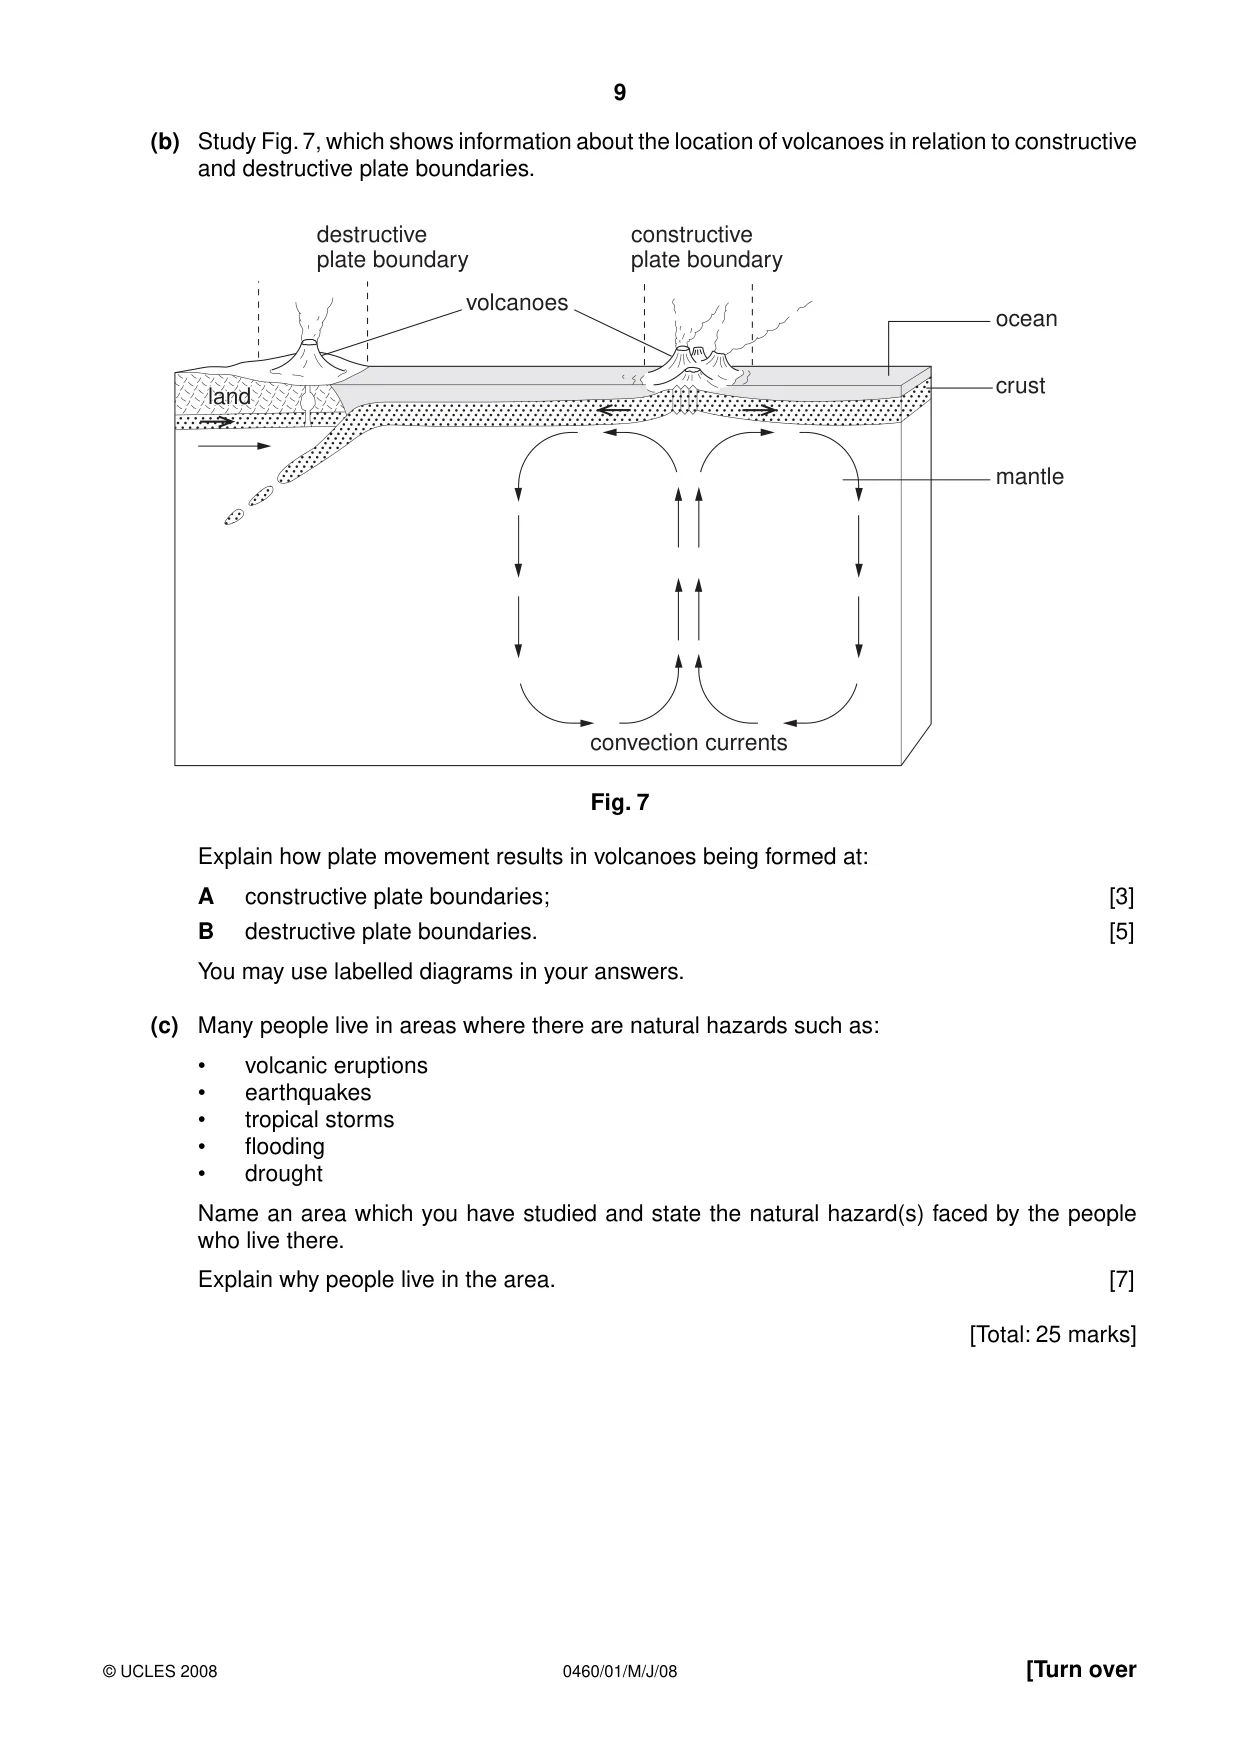
9 0460/01/M/J/08 © UCLES 2008 [Turn over (b) Study Fig. 7, which shows information about the location of volcanoes in relation to constructive and destructive plate boundaries. destructive plate boundary constructive plate boundary ocean crust mantle volcanoes convection currents land land land Fig. 7 Explain how plate movement results in volcanoes being formed at: A constructive plate boundaries; [3] B destructive plate boundaries. [5] You may use labelled diagrams in your answers. (c) Many people live in areas where there are natural hazards such as: • volcanic eruptions • earthquakes • tropical storms • flooding • drought Name an area which you have studied and state the natural hazard(s) faced by the people who live there. Explain why people live in the area. [7] [Total: 25 marks]
Question paper, page 10
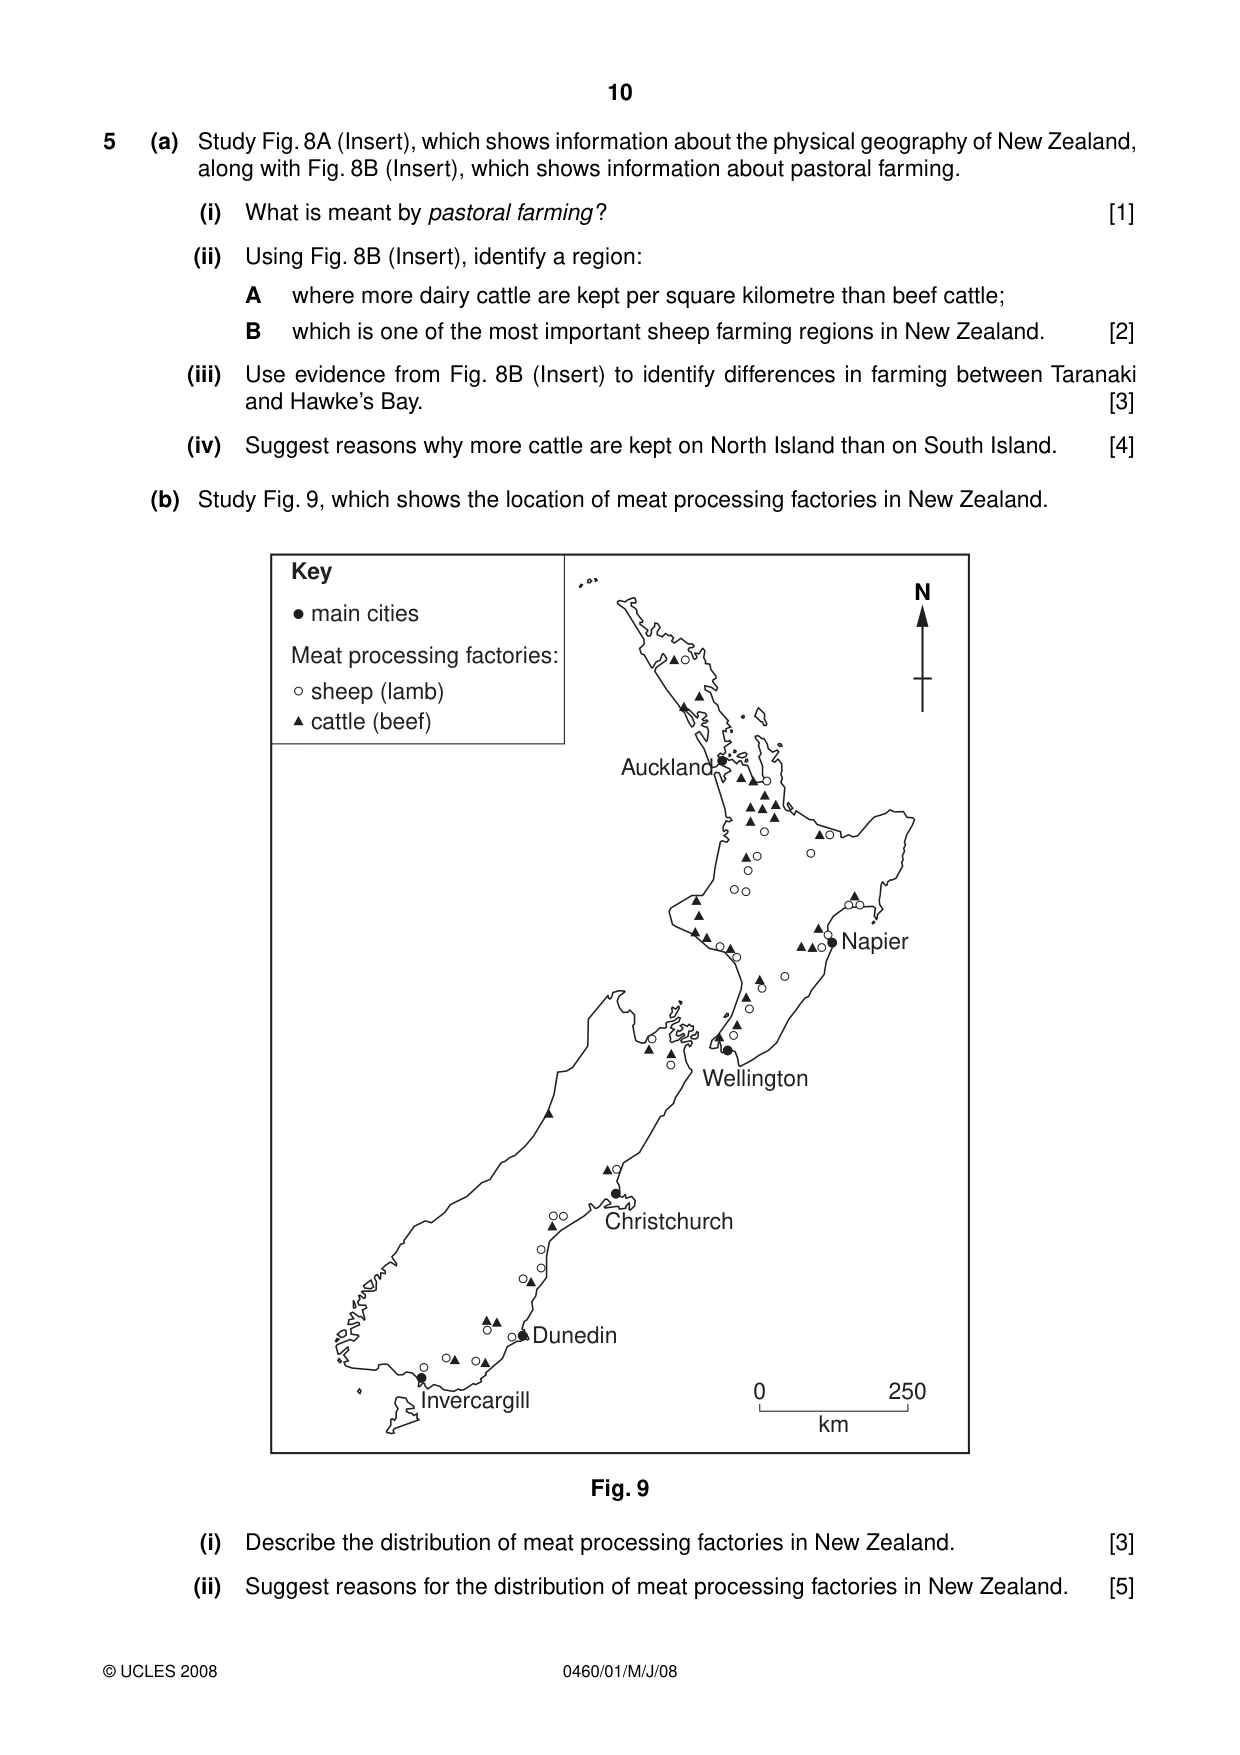
10 0460/01/M/J/08 © UCLES 2008 5 (a) Study Fig. 8A (Insert), which shows information about the physical geography of New Zealand, along with Fig. 8B (Insert), which shows information about pastoral farming. (i) What is meant by pastoral farming ? [1] (ii) Using Fig. 8B (Insert), identify a region: A where more dairy cattle are kept per square kilometre than beef cattle; B which is one of the most important sheep farming regions in New Zealand. [2] (iii) Use evidence from Fig. 8B (Insert) to identify differences in farming between Taranaki and Hawke’s Bay. [3] (iv) Suggest reasons why more cattle are kept on North Island than on South Island. [4] (b) Study Fig. 9, which shows the location of meat processing factories in New Zealand. Napier Wellington Christchurch 0 250 km Dunedin Invercargill Auckland Key Meat processing factories: sheep (lamb) cattle (beef) main cities N Fig. 9 (i) Describe the distribution of meat processing factories in New Zealand. [3] (ii) Suggest reasons for the distribution of meat processing factories in New Zealand. [5]
Question paper, page 11
11 0460/01/M/J/08 © UCLES 2008 [Turn over (c) Human activities cause both benefits and problems for people and the natural environment. Name an area you have studied where one of the following activities is important: • agriculture • manufacturing industry • energy production Describe the benefits and problems to people and the natural environment from this activity in your chosen area. [7] [Total: 25 marks]
Question paper, page 12
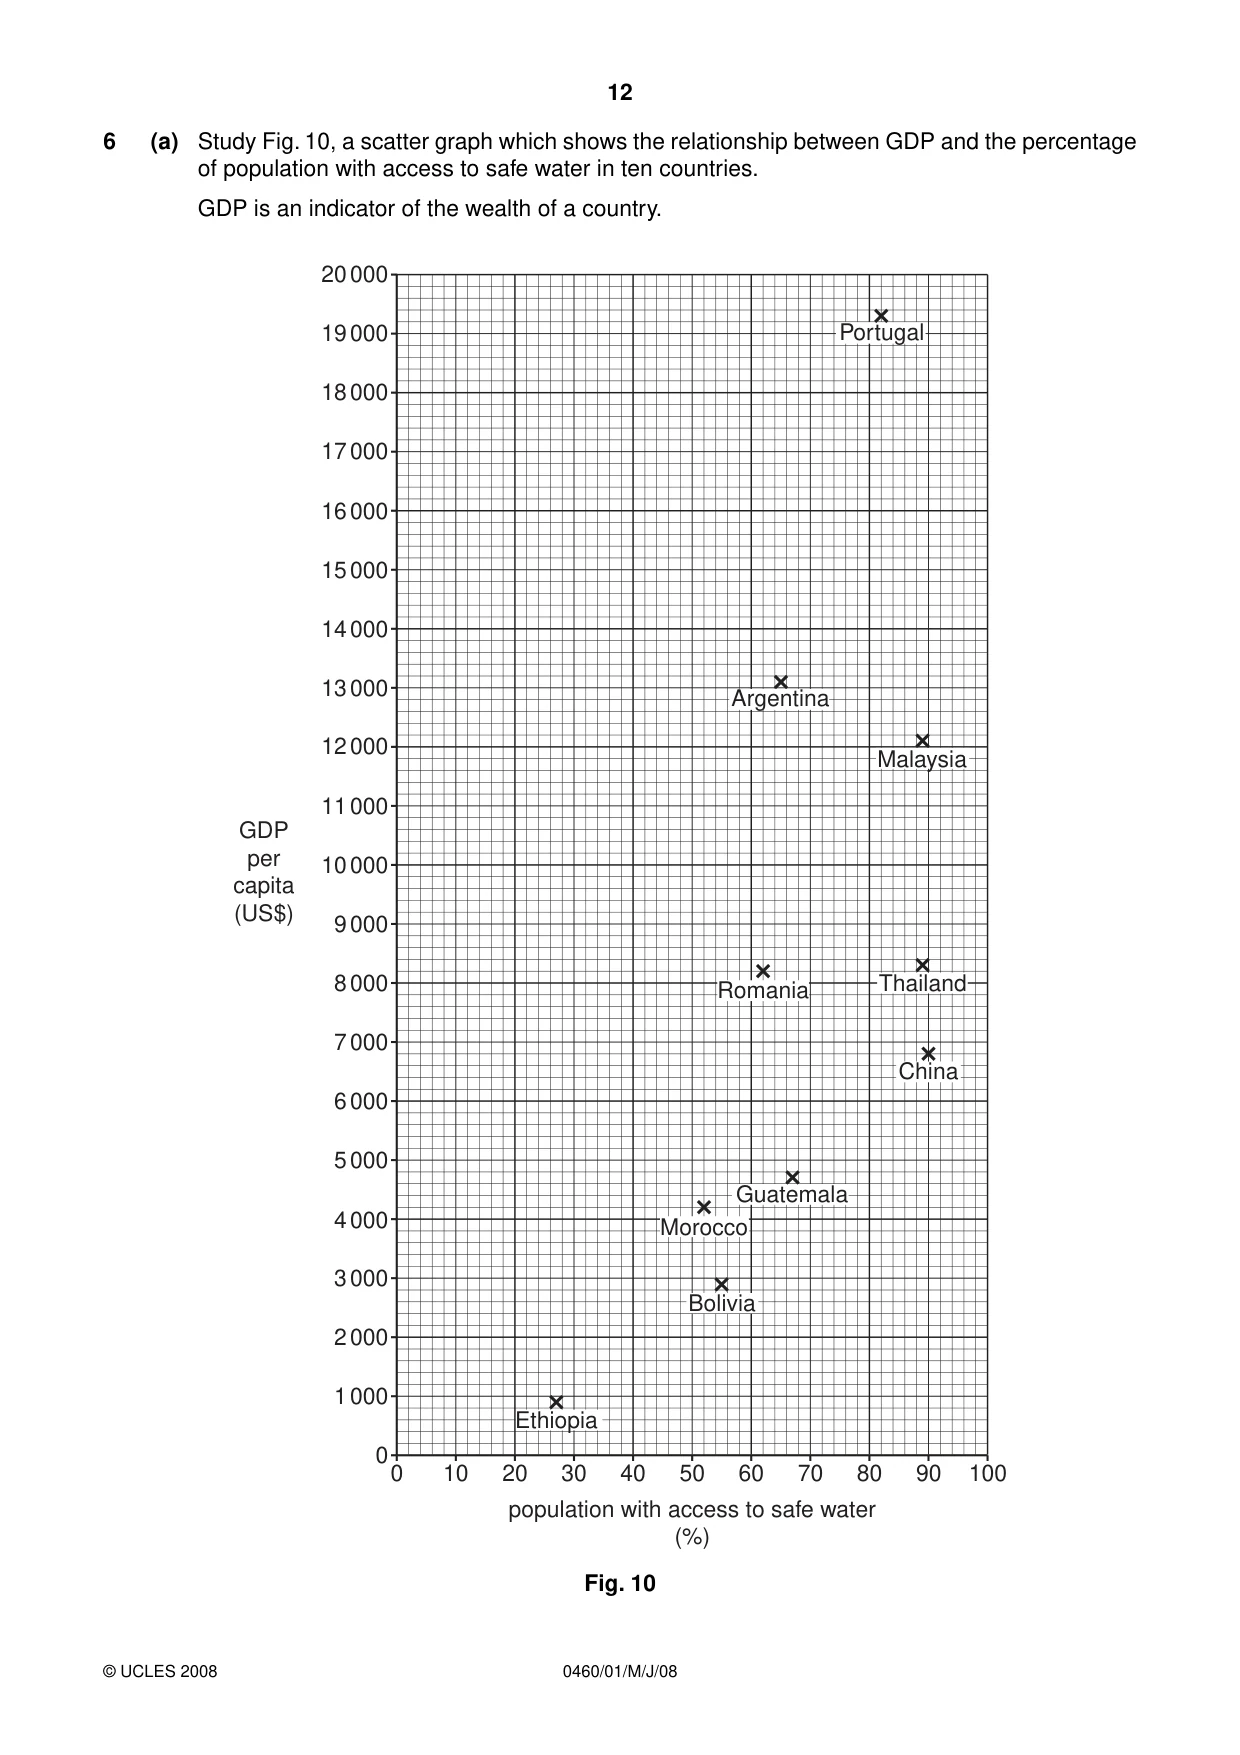
12 0460/01/M/J/08 © UCLES 2008 6 (a) Study Fig. 10, a scatter graph which shows the relationship between GDP and the percentage of population with access to safe water in ten countries. GDP is an indicator of the wealth of a country. 10 20 0 0 1 000 2 000 3 000 4 000 5 000 6 000 7 000 8 000 9 000 10 000 GDP per capita (US$) 11 000 12 000 13 000 14 000 15 000 16 000 17 000 18 000 19 000 20 000 30 40 50 population with access to safe water (%) 60 70 80 90 100 Portugal Argentina Malaysia Thailand Romania China Guatemala Morocco Bolivia Ethiopia Fig. 10
Question paper, page 13
13 0460/01/M/J/08 © UCLES 2008 (i) Which country has a GDP per capita of US$8 200 and 62% of its population has access to safe water? [1] (ii) What is the general relationship shown by Fig. 10 between GDP per capita and the percentage of population with access to safe water? Use examples and figures to illustrate your answer. [2] (iii) Suggest three reasons why there is better access to reliable supplies of safe water in some countries than there is in others. [3] (iv) Explain how providing reliable supplies of clean water in LEDCs improves the quality of life of the people. [4] (b) Study Fig. 11, which is an article from a website about drought in Portugal. Portugal is an MEDC in Europe. Drought threatens water supply for 10 percent of Portuguese Portugal is suffering its worst drought in decades. The country received an average of 542 millimetres of precipitation in 2004, compared with an average annual precipitation of 930 millimetres between 1961 and 1990. The dry weather, which has harmed crops and caused livestock to starve, continued into 2005, with the country experiencing precipitation levels which were less than 20% of normal levels in January. The regions most at risk are those in the centre and south of the country, which rely mostly on wells instead of dams for their water. In January the Environment Minister threatened to ration water in the southern province of Algarve, if the region did not receive enough rain by the end of the year. Tourism industry officials had condemned talk of water rationing, arguing it could frighten visitors away from the Algarve, the nation’s main tourist centre. Environmentalists estimate Portugal wastes some three billion litres of water each year. Fig. 11 (i) Use evidence from Fig. 11 to suggest three reasons why people are short of water in some regions of Portugal. [3] (ii) Describe methods which could be used to reduce water shortages. [5] (c) Name an area which you have studied where the tourist industry is important. Explain why the tourist industry has grown up in the area. You should refer in detail to the area’s physical and human attractions. [7] [Total: 25 marks]
Question paper, page 16
16 0460/01/M/J/08 BLANK PAGE Copyright Acknowledgements: Question 2 Photograph A S. Sibley © UCLES. Question 2 Photograph B S. Sibley © UCLES. Question 2 Photograph C S. Sibley © UCLES. Question 3 Photograph D S. Sibley © UCLES. Question 6 Fig. 11 © www.terradaily.com 7 September, 2006. Permission to reproduce items where third-party owned material protected by copyright is included has been sought and cleared where possible. Every reasonable effort has been made by the publisher (UCLES) to trace copyright holders, but if any items requiring clearance have unwittingly been included, the publisher will be pleased to make amends at the earliest possible opportunity. University of Cambridge International Examinations is part of the Cambridge Assessment Group. Cambridge Assessment is the brand name of University of Cambridge Local Examinations Syndicate (UCLES), which is itself a department of the University of Cambridge.
Mark scheme, page 1
UNIVERSITY OF CAMBRIDGE INTERNATIONAL EXAMINATIONS International General Certificate of Secondary Education MARK SCHEME for the May/June 2008 question paper 0460 GEOGRAPHY 0460/01 Paper 1, maximum raw mark 75 This mark scheme is published as an aid to teachers and candidates, to indicate the requirements of the examination. It shows the basis on which Examiners were instructed to award marks. It does not indicate the details of the discussions that took place at an Examiners’ meeting before marking began. All Examiners are instructed that alternative correct answers and unexpected approaches in candidates’ scripts must be given marks that fairly reflect the relevant knowledge and skills demonstrated. Mark schemes must be read in conjunction with the question papers and the report on the examination. • CIE will not enter into discussions or correspondence in connection with these mark schemes. CIE is publishing the mark schemes for the May/June 2008 question papers for most IGCSE, GCE Advanced Level and Advanced Subsidiary Level syllabuses and some Ordinary Level syllabuses. www.XtremePapers.com
Mark scheme, page 2
Page 2 Mark Scheme Syllabus Paper IGCSE – May/June 2008 0460 01 © UCLES 2008 The features of the marking scheme Each question carries 25 marks. Candidates cannot earn above the maximum marks available within each sub section. The marking scheme attempts to give guidance about the requirements of each answer and lists a number of responses which will earn marks along with the general principles to be applied when marking each question. It should be noted that candidates can earn marks if their answers are phrased differently provided they convey the same meaning as those in the mark scheme. THE CANDIDATES DO NOT NEED TO USE THE SAME WORDING TO EARN MARKS. The notation ‘etc.’ at the end of an answer in the mark scheme signifies that there may well be other correct responses or examples that can be given credit. Providing the statement is true, relevant to the question asked and not repetition of a previous point made credit should be given. A point made within one sub-section which is an answer to the question set in a different sub-section should not be given credit as each sub-section asks different questions which require independent answers. The mark scheme uses semi colons (;) to separate marks and diagonals to separate alternative answers. During coordination the mark scheme is modified to add points agreed after discussion or to delete any points not allowed. All examiners should ensure that their modified scheme is fully up-to-date before marking begins. Marking mechanics Point marking is used for sections (a) and (b) of each question, although marks are available in specified questions for development of appropriate points. Ticks should be used to clearly indicate the wording on a script where a mark has been allowed. Where a development point has been allowed the letter ‘D’ should be placed adjacent to the tick. The number of ticks should always be equal to the total number of marks awarded, the mark for each sub-section should be added up and placed in the margin at the end of the sub-section. The total mark for the entire question should be added and transferred to the front of the script. Where a candidate makes a point which is not quite sufficient for credit an upturned ‘V’ insert symbol should be used. If after careful consideration a mark is awarded which gives ‘benefit of doubt’ to the candidate the letter ‘J’ should be placed adjacent to the tick (i.e. the candidate has ‘just’ achieved the mark). Levels of response marking is used for section (c) of each question. Thus it is the quality of the response which determines which level an answer is achieved rather than the quantity of statements contained within it. However once assigned to a level the mark achieved within that level is determined by the number of points made. Levels 1 and 2 are distinguished by whether statements are simple (level 1) or developed/elaborated (level 2). A candidate can immediately enter L2 by making developed points without making any L1 statements. In order to achieve L3 a candidate must have already reached the top end of L2 – in addition his/her answer should have a clear example (for 6 marks), and if the answer is place specific as well (7 marks). Where statements are assigned levels by the examiner this should be indicated by the use of L1, L2 and L3 next to the statements. A summary of the overall level and mark awarded should be written at the end of the answer. Ticks should not be used on answers which are marked using levels of response marking.
Mark scheme, page 3
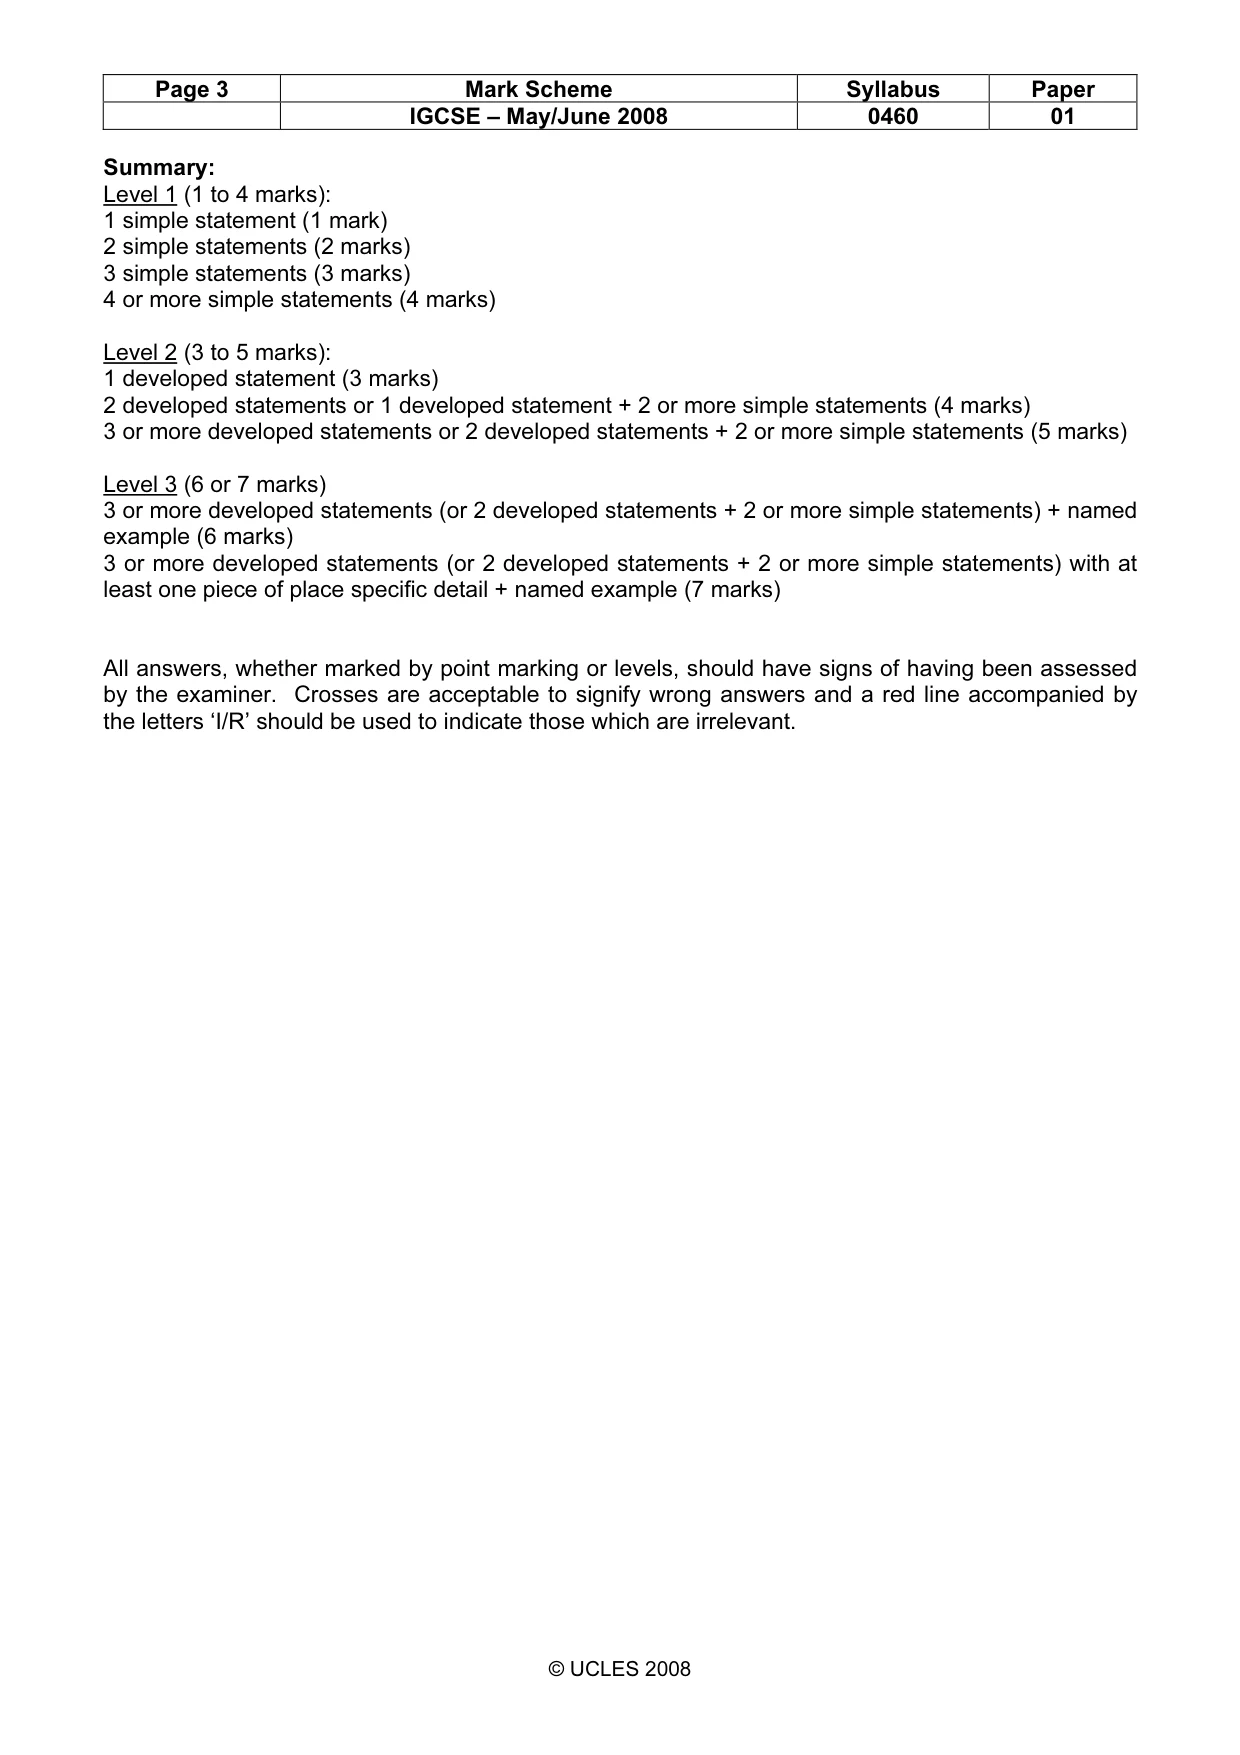
Page 3 Mark Scheme Syllabus Paper IGCSE – May/June 2008 0460 01 © UCLES 2008 Summary: Level 1 (1 to 4 marks): 1 simple statement (1 mark) 2 simple statements (2 marks) 3 simple statements (3 marks) 4 or more simple statements (4 marks) Level 2 (3 to 5 marks): 1 developed statement (3 marks) 2 developed statements or 1 developed statement + 2 or more simple statements (4 marks) 3 or more developed statements or 2 developed statements + 2 or more simple statements (5 marks) Level 3 (6 or 7 marks) 3 or more developed statements (or 2 developed statements + 2 or more simple statements) + named example (6 marks) 3 or more developed statements (or 2 developed statements + 2 or more simple statements) with at least one piece of place specific detail + named example (7 marks) All answers, whether marked by point marking or levels, should have signs of having been assessed by the examiner. Crosses are acceptable to signify wrong answers and a red line accompanied by the letters ‘I/R’ should be used to indicate those which are irrelevant.
Mark scheme, page 4
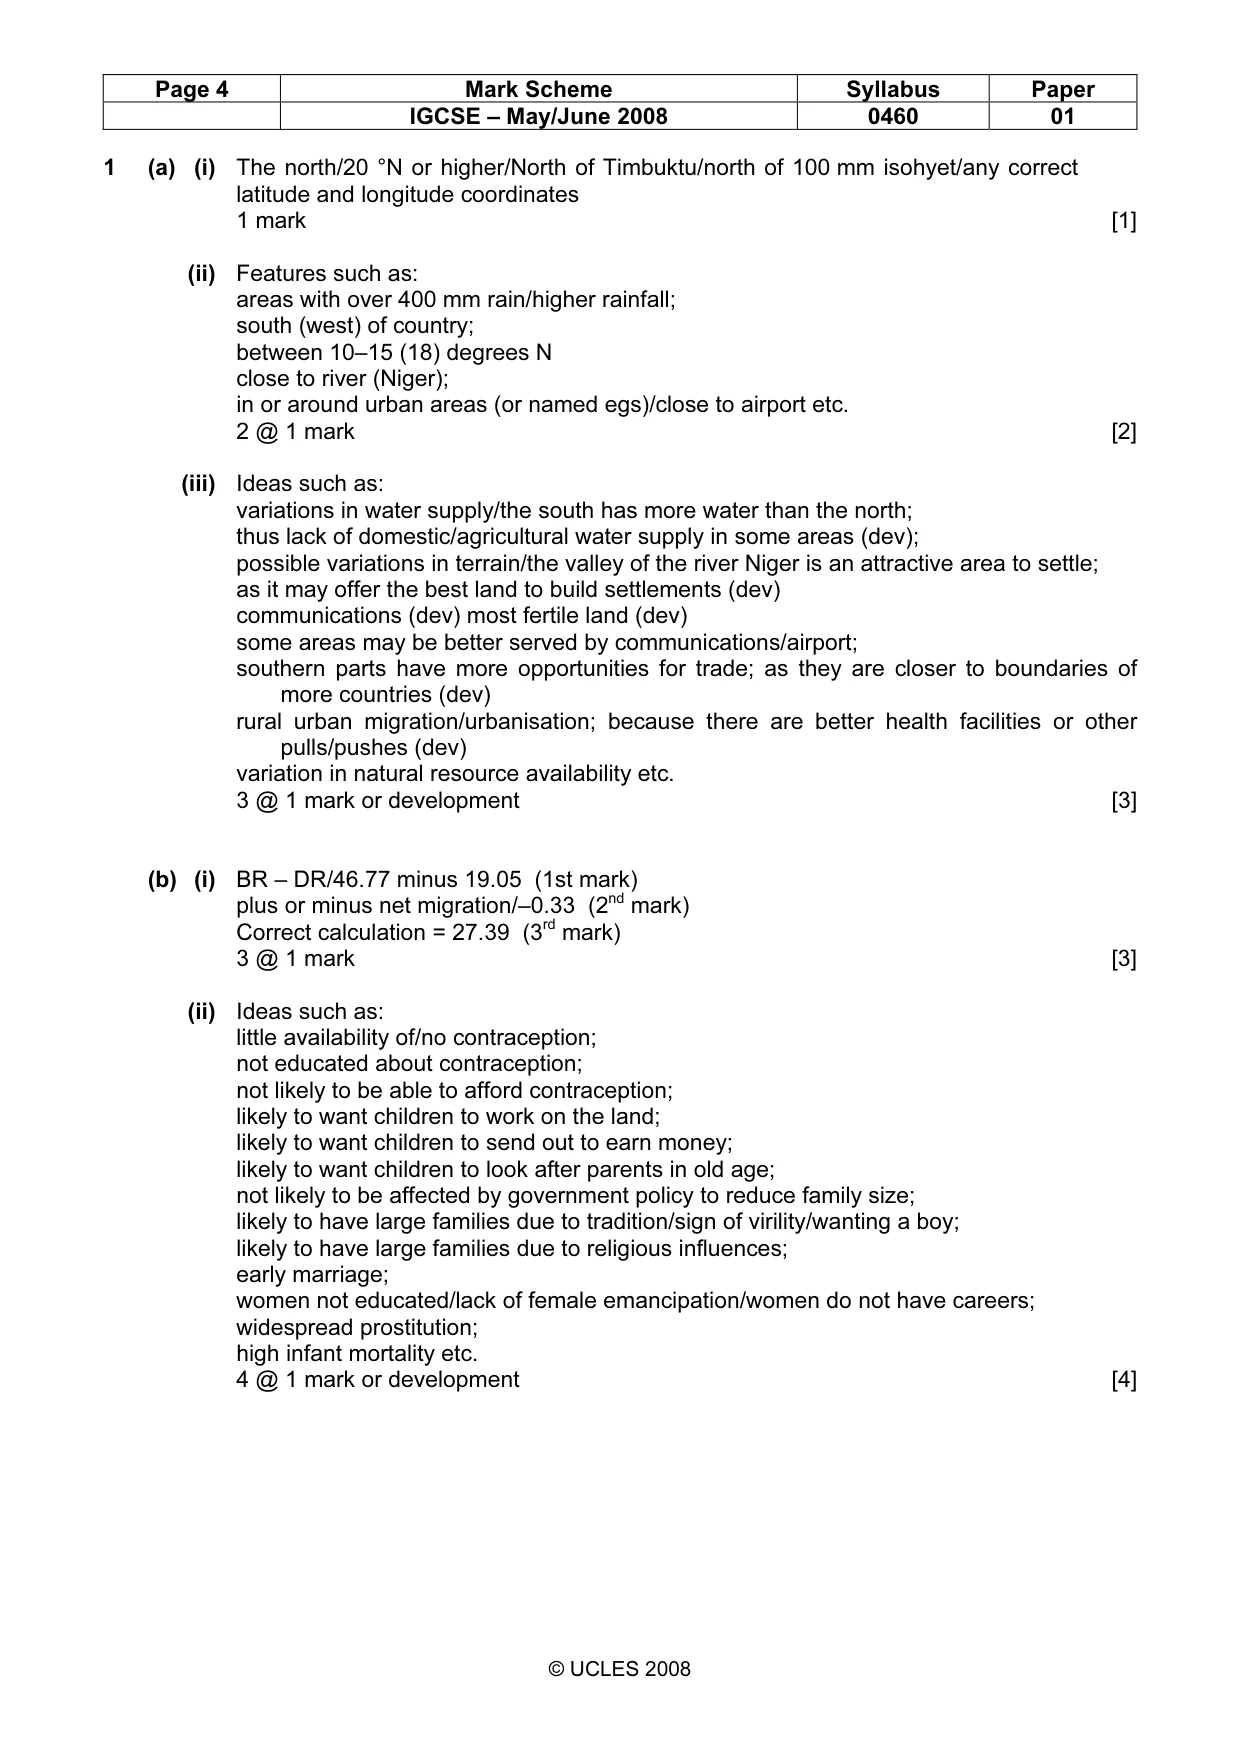
Page 4 Mark Scheme Syllabus Paper IGCSE – May/June 2008 0460 01 © UCLES 2008 1 (a) (i) The north/20 °N or higher/North of Timbuktu/north of 100 mm isohyet/any correct latitude and longitude coordinates 1 mark [1] (ii) Features such as: areas with over 400 mm rain/higher rainfall; south (west) of country; between 10–15 (18) degrees N close to river (Niger); in or around urban areas (or named egs)/close to airport etc. 2 @ 1 mark [2] (iii) Ideas such as: variations in water supply/the south has more water than the north; thus lack of domestic/agricultural water supply in some areas (dev); possible variations in terrain/the valley of the river Niger is an attractive area to settle; as it may offer the best land to build settlements (dev) communications (dev) most fertile land (dev) some areas may be better served by communications/airport; southern parts have more opportunities for trade; as they are closer to boundaries of more countries (dev) rural urban migration/urbanisation; because there are better health facilities or other pulls/pushes (dev) variation in natural resource availability etc. 3 @ 1 mark or development [3] (b) (i) BR – DR/46.77 minus 19.05 (1st mark) plus or minus net migration/–0.33 (2nd mark) Correct calculation = 27.39 (3rd mark) 3 @ 1 mark [3] (ii) Ideas such as: little availability of/no contraception; not educated about contraception; not likely to be able to afford contraception; likely to want children to work on the land; likely to want children to send out to earn money; likely to want children to look after parents in old age; not likely to be affected by government policy to reduce family size; likely to have large families due to tradition/sign of virility/wanting a boy; likely to have large families due to religious influences; early marriage; women not educated/lack of female emancipation/women do not have careers; widespread prostitution; high infant mortality etc. 4 @ 1 mark or development [4]
Mark scheme, page 5
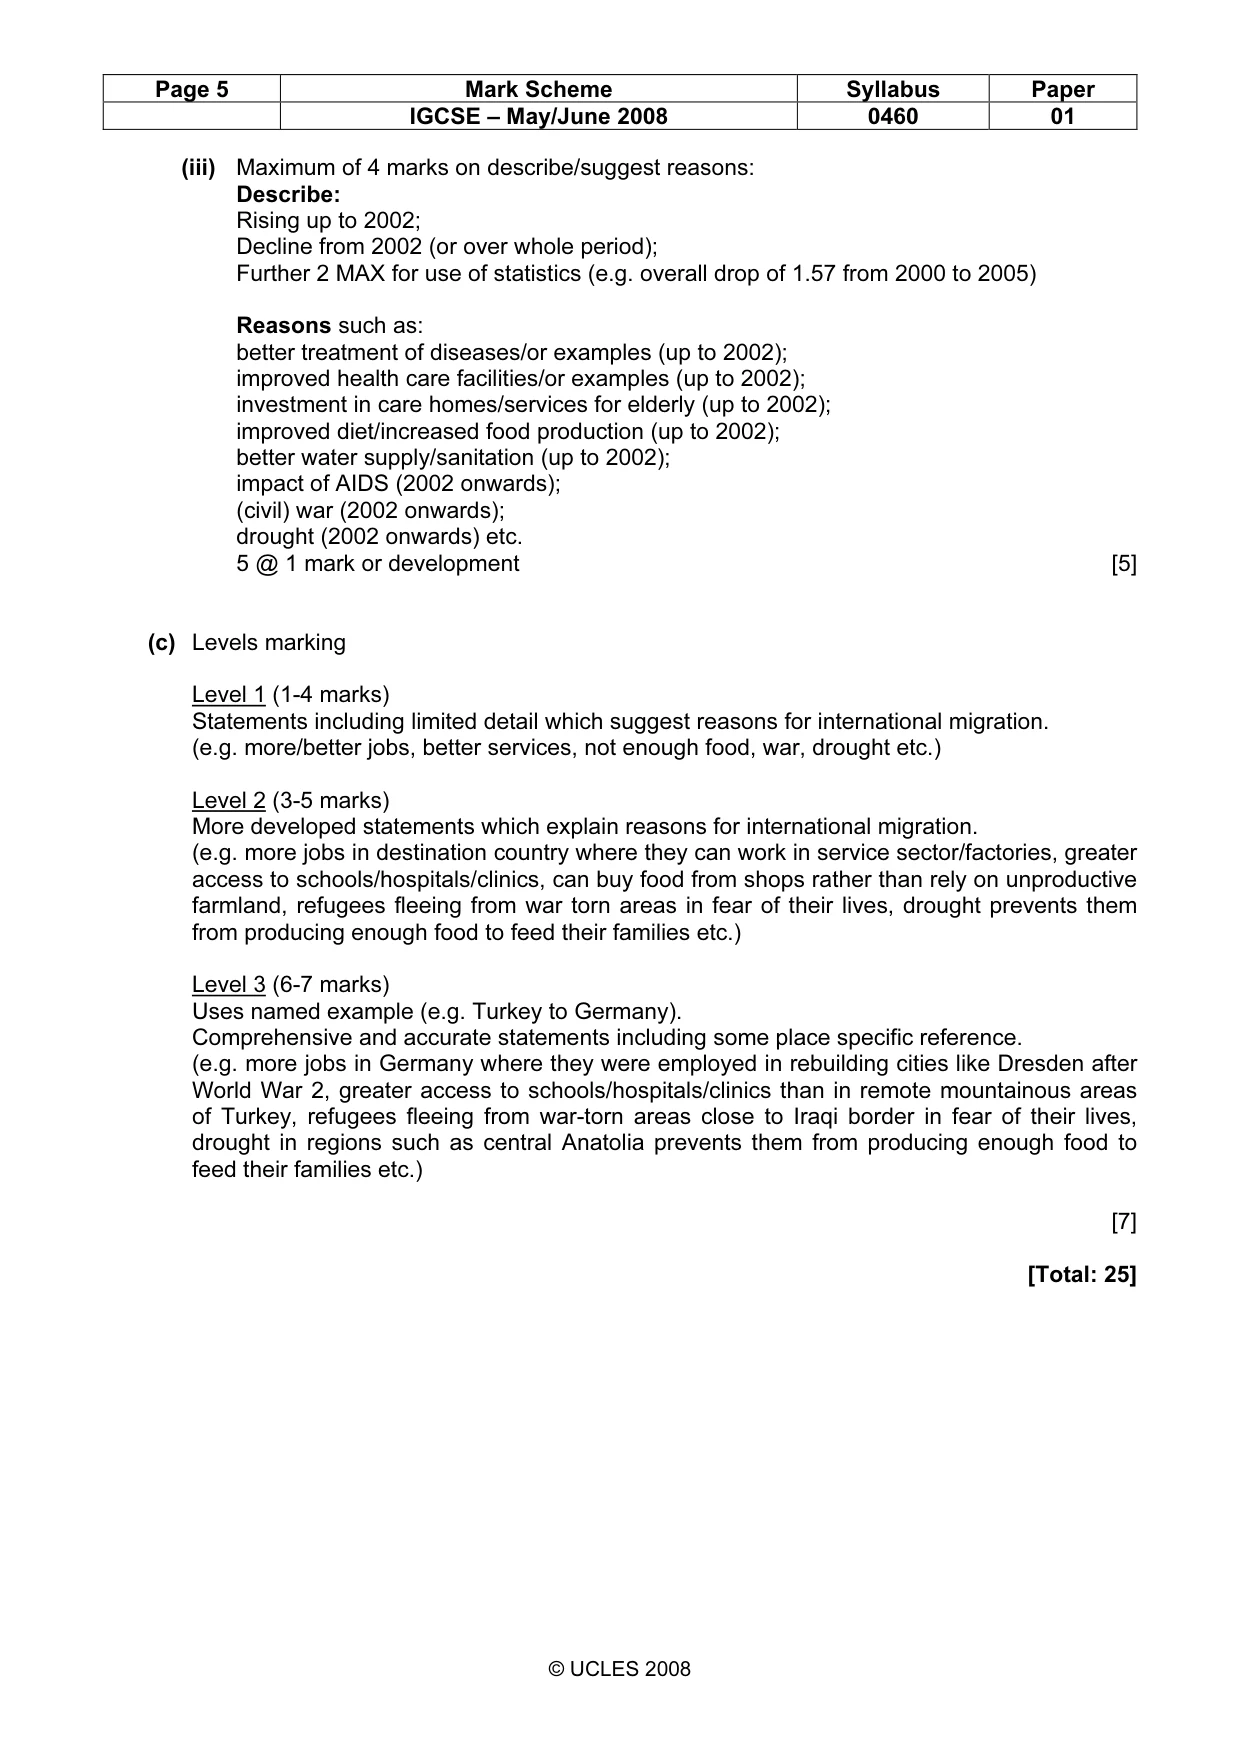
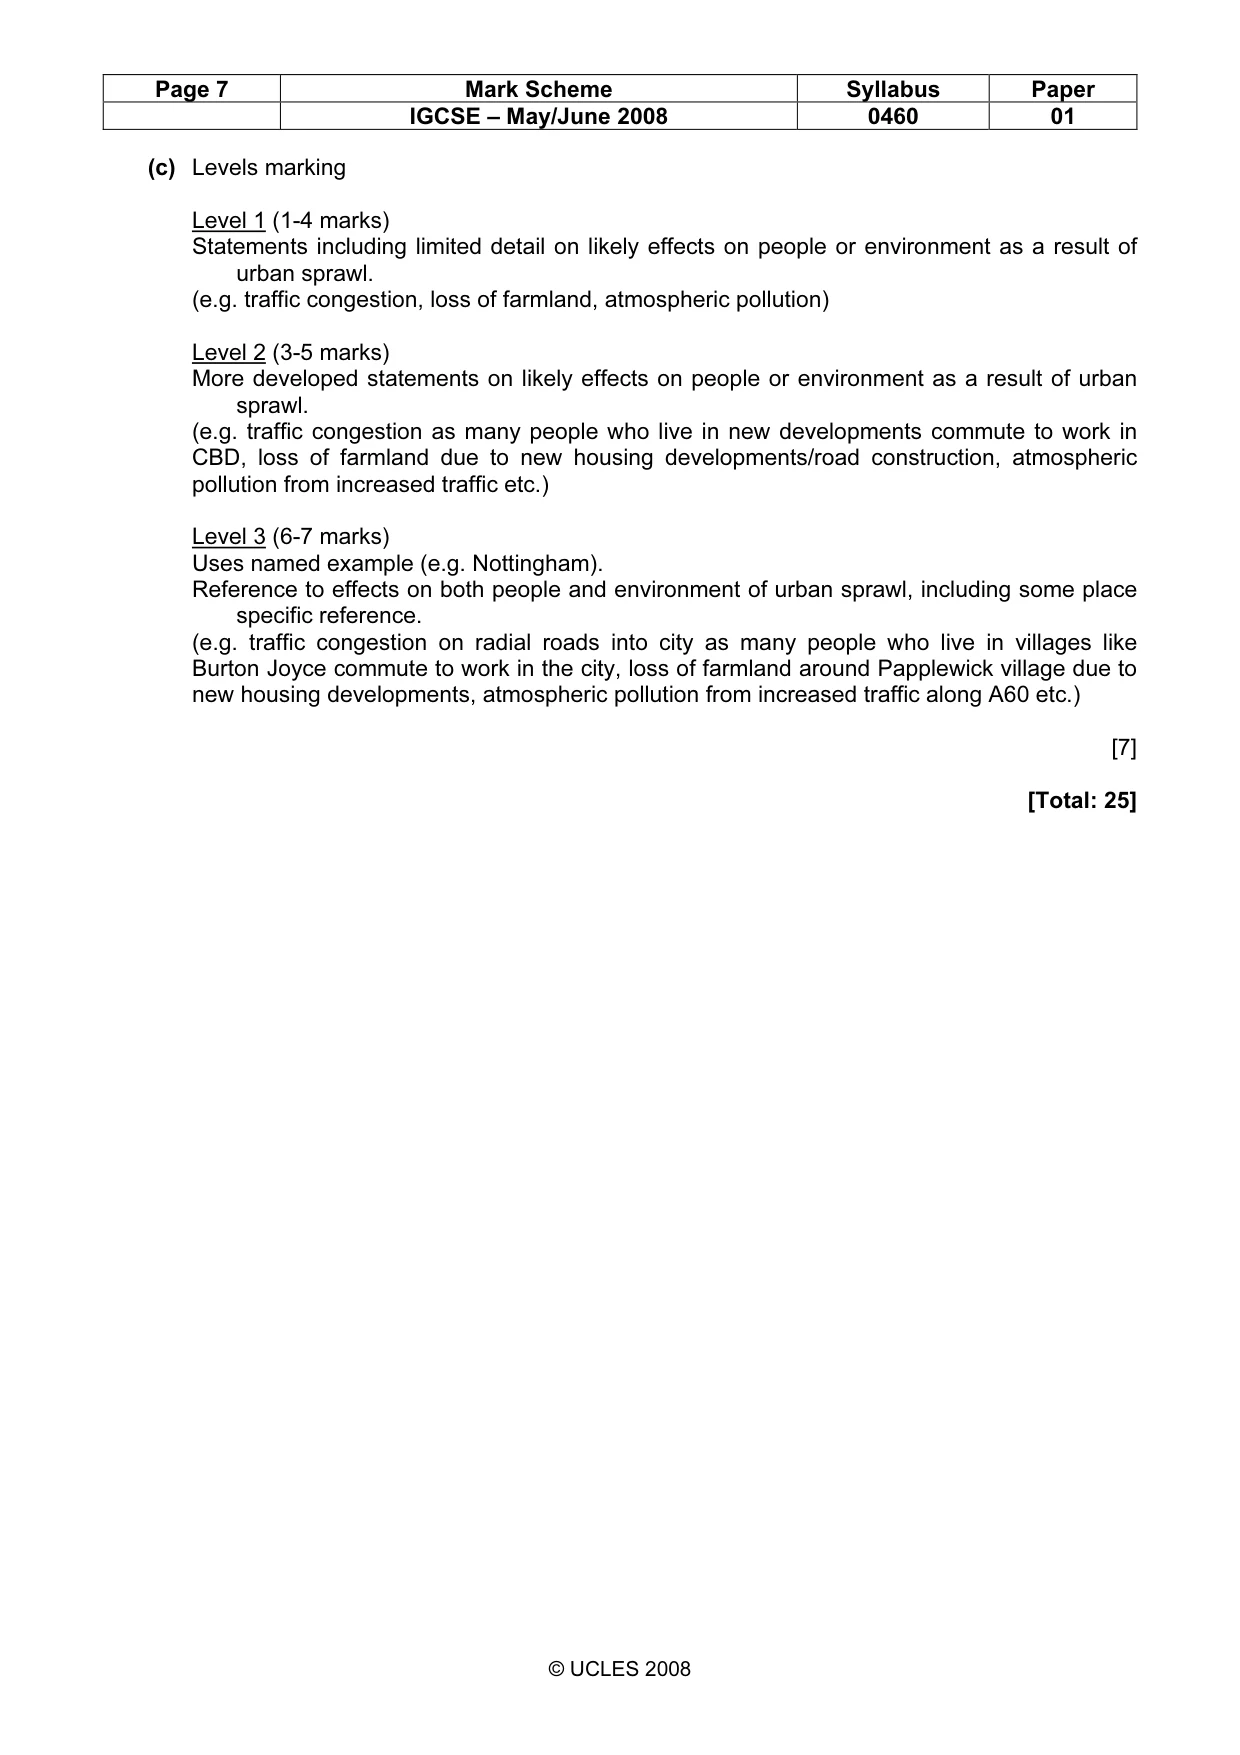
Page 5 Mark Scheme Syllabus Paper IGCSE – May/June 2008 0460 01 © UCLES 2008 (iii) Maximum of 4 marks on describe/suggest reasons: Describe: Rising up to 2002; Decline from 2002 (or over whole period); Further 2 MAX for use of statistics (e.g. overall drop of 1.57 from 2000 to 2005) Reasons such as: better treatment of diseases/or examples (up to 2002); improved health care facilities/or examples (up to 2002); investment in care homes/services for elderly (up to 2002); improved diet/increased food production (up to 2002); better water supply/sanitation (up to 2002); impact of AIDS (2002 onwards); (civil) war (2002 onwards); drought (2002 onwards) etc. 5 @ 1 mark or development [5] (c) Levels marking Level 1 (1-4 marks) Statements including limited detail which suggest reasons for international migration. (e.g. more/better jobs, better services, not enough food, war, drought etc.) Level 2 (3-5 marks) More developed statements which explain reasons for international migration. (e.g. more jobs in destination country where they can work in service sector/factories, greater access to schools/hospitals/clinics, can buy food from shops rather than rely on unproductive farmland, refugees fleeing from war torn areas in fear of their lives, drought prevents them from producing enough food to feed their families etc.) Level 3 (6-7 marks) Uses named example (e.g. Turkey to Germany). Comprehensive and accurate statements including some place specific reference. (e.g. more jobs in Germany where they were employed in rebuilding cities like Dresden after World War 2, greater access to schools/hospitals/clinics than in remote mountainous areas of Turkey, refugees fleeing from war-torn areas close to Iraqi border in fear of their lives, drought in regions such as central Anatolia prevents them from producing enough food to feed their families etc.) [7] [Total: 25]
Mark scheme, page 6
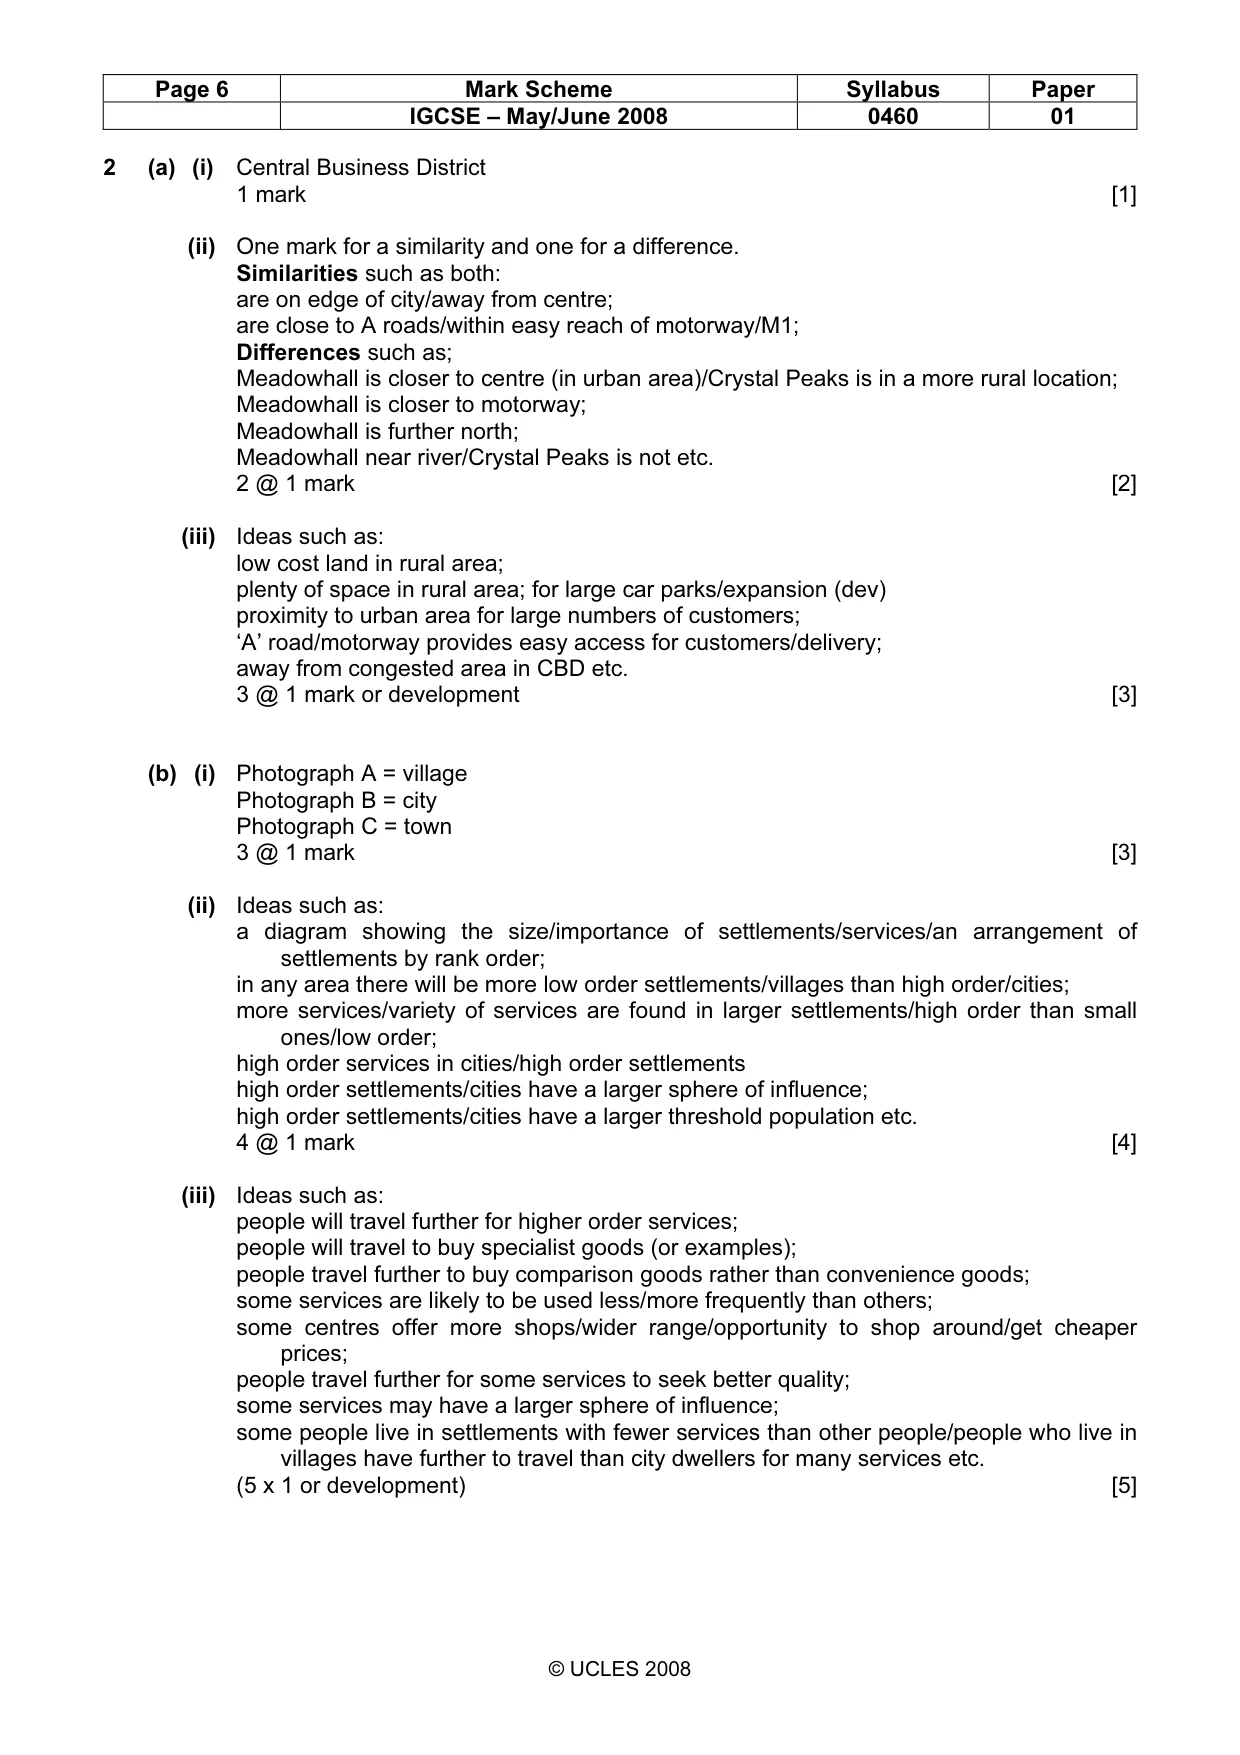
Page 6 Mark Scheme Syllabus Paper IGCSE – May/June 2008 0460 01 © UCLES 2008 2 (a) (i) Central Business District 1 mark [1] (ii) One mark for a similarity and one for a difference. Similarities such as both: are on edge of city/away from centre; are close to A roads/within easy reach of motorway/M1; Differences such as; Meadowhall is closer to centre (in urban area)/Crystal Peaks is in a more rural location; Meadowhall is closer to motorway; Meadowhall is further north; Meadowhall near river/Crystal Peaks is not etc. 2 @ 1 mark [2] (iii) Ideas such as: low cost land in rural area; plenty of space in rural area; for large car parks/expansion (dev) proximity to urban area for large numbers of customers; ‘A’ road/motorway provides easy access for customers/delivery; away from congested area in CBD etc. 3 @ 1 mark or development [3] (b) (i) Photograph A = village Photograph B = city Photograph C = town 3 @ 1 mark [3] (ii) Ideas such as: a diagram showing the size/importance of settlements/services/an arrangement of settlements by rank order; in any area there will be more low order settlements/villages than high order/cities; more services/variety of services are found in larger settlements/high order than small ones/low order; high order services in cities/high order settlements high order settlements/cities have a larger sphere of influence; high order settlements/cities have a larger threshold population etc. 4 @ 1 mark [4] (iii) Ideas such as: people will travel further for higher order services; people will travel to buy specialist goods (or examples); people travel further to buy comparison goods rather than convenience goods; some services are likely to be used less/more frequently than others; some centres offer more shops/wider range/opportunity to shop around/get cheaper prices; people travel further for some services to seek better quality; some services may have a larger sphere of influence; some people live in settlements with fewer services than other people/people who live in villages have further to travel than city dwellers for many services etc. (5 x 1 or development) [5]
Mark scheme, page 7
Page 7 Mark Scheme Syllabus Paper IGCSE – May/June 2008 0460 01 © UCLES 2008 (c) Levels marking Level 1 (1-4 marks) Statements including limited detail on likely effects on people or environment as a result of urban sprawl. (e.g. traffic congestion, loss of farmland, atmospheric pollution) Level 2 (3-5 marks) More developed statements on likely effects on people or environment as a result of urban sprawl. (e.g. traffic congestion as many people who live in new developments commute to work in CBD, loss of farmland due to new housing developments/road construction, atmospheric pollution from increased traffic etc.) Level 3 (6-7 marks) Uses named example (e.g. Nottingham). Reference to effects on both people and environment of urban sprawl, including some place specific reference. (e.g. traffic congestion on radial roads into city as many people who live in villages like Burton Joyce commute to work in the city, loss of farmland around Papplewick village due to new housing developments, atmospheric pollution from increased traffic along A60 etc.) [7] [Total: 25]
Mark scheme, page 8
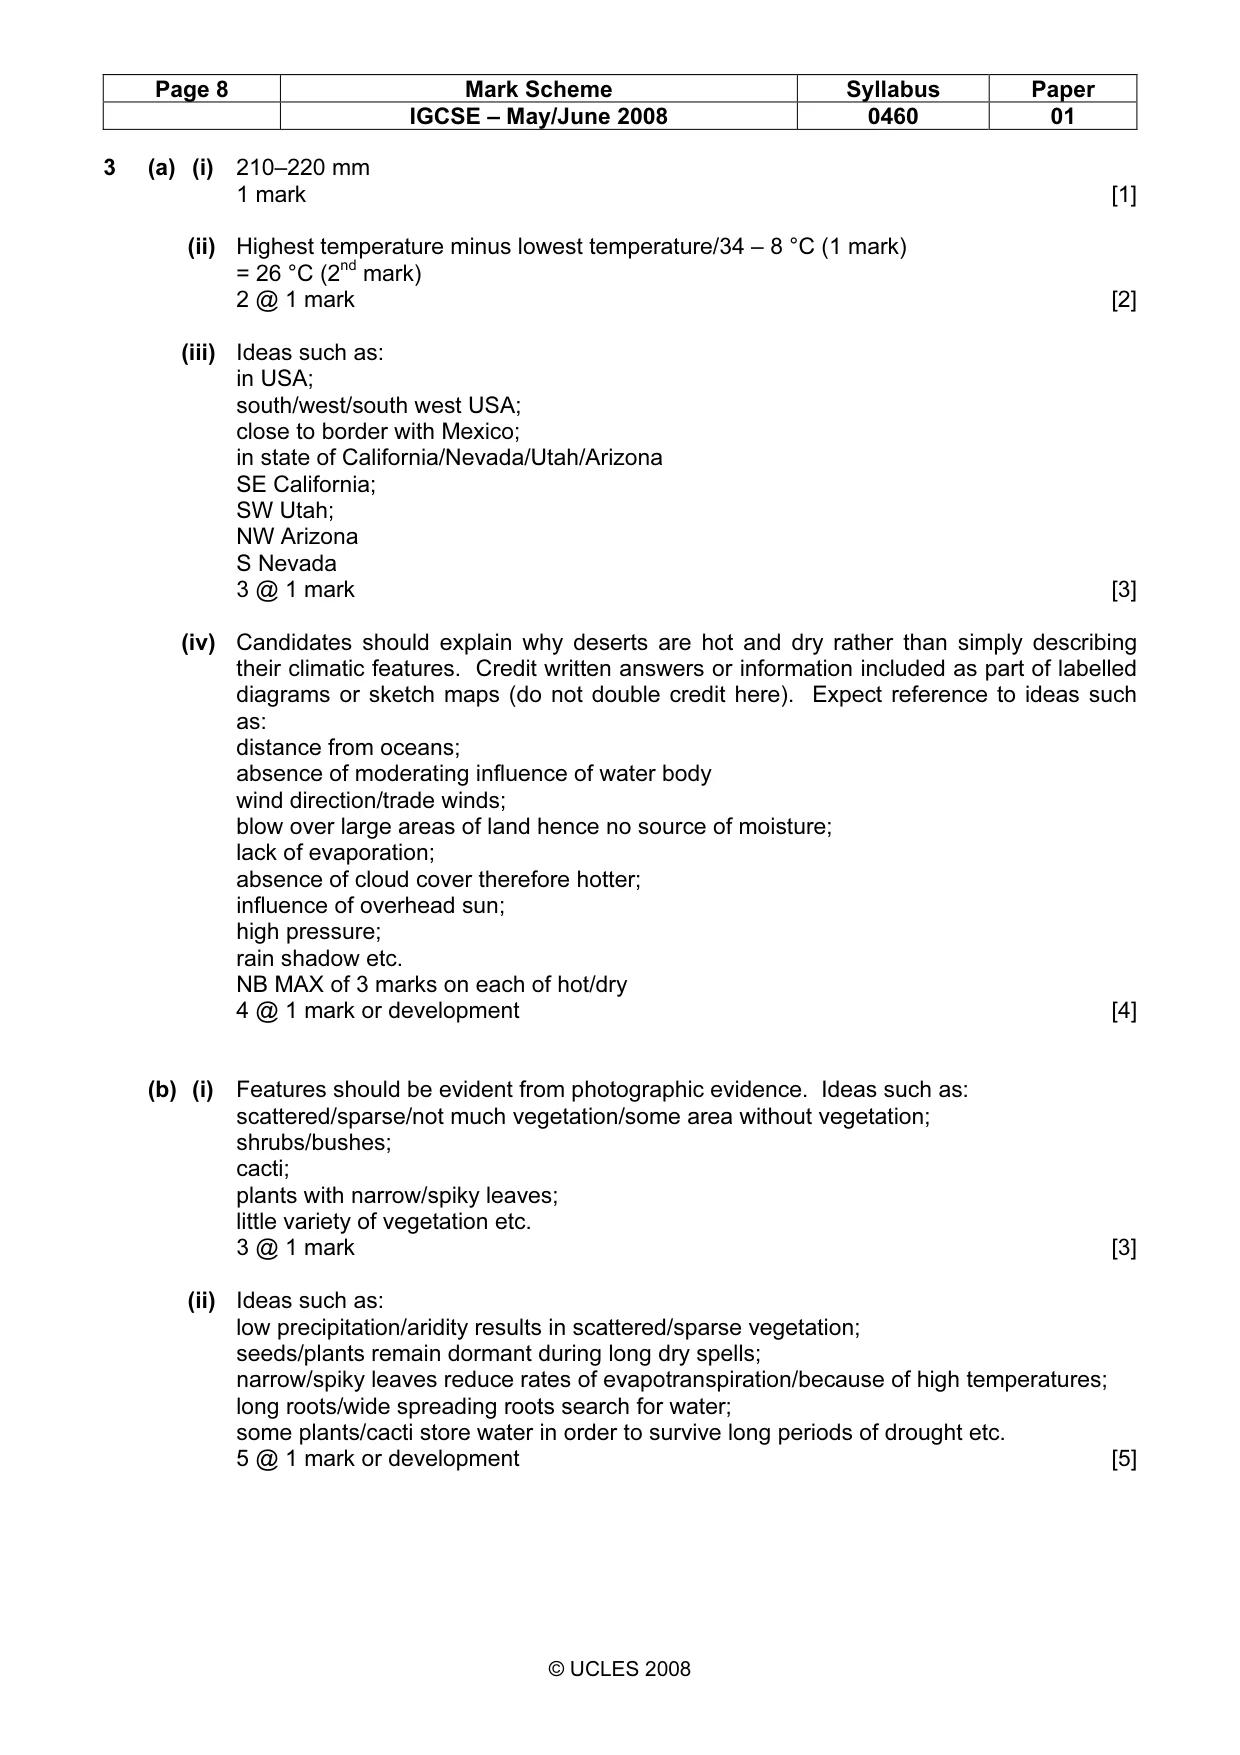
Page 8 Mark Scheme Syllabus Paper IGCSE – May/June 2008 0460 01 © UCLES 2008 3 (a) (i) 210–220 mm 1 mark [1] (ii) Highest temperature minus lowest temperature/34 – 8 °C (1 mark) = 26 °C (2nd mark) 2 @ 1 mark [2] (iii) Ideas such as: in USA; south/west/south west USA; close to border with Mexico; in state of California/Nevada/Utah/Arizona SE California; SW Utah; NW Arizona S Nevada 3 @ 1 mark [3] (iv) Candidates should explain why deserts are hot and dry rather than simply describing their climatic features. Credit written answers or information included as part of labelled diagrams or sketch maps (do not double credit here). Expect reference to ideas such as: distance from oceans; absence of moderating influence of water body wind direction/trade winds; blow over large areas of land hence no source of moisture; lack of evaporation; absence of cloud cover therefore hotter; influence of overhead sun; high pressure; rain shadow etc. NB MAX of 3 marks on each of hot/dry 4 @ 1 mark or development [4] (b) (i) Features should be evident from photographic evidence. Ideas such as: scattered/sparse/not much vegetation/some area without vegetation; shrubs/bushes; cacti; plants with narrow/spiky leaves; little variety of vegetation etc. 3 @ 1 mark [3] (ii) Ideas such as: low precipitation/aridity results in scattered/sparse vegetation; seeds/plants remain dormant during long dry spells; narrow/spiky leaves reduce rates of evapotranspiration/because of high temperatures; long roots/wide spreading roots search for water; some plants/cacti store water in order to survive long periods of drought etc. 5 @ 1 mark or development [5]
Mark scheme, page 9
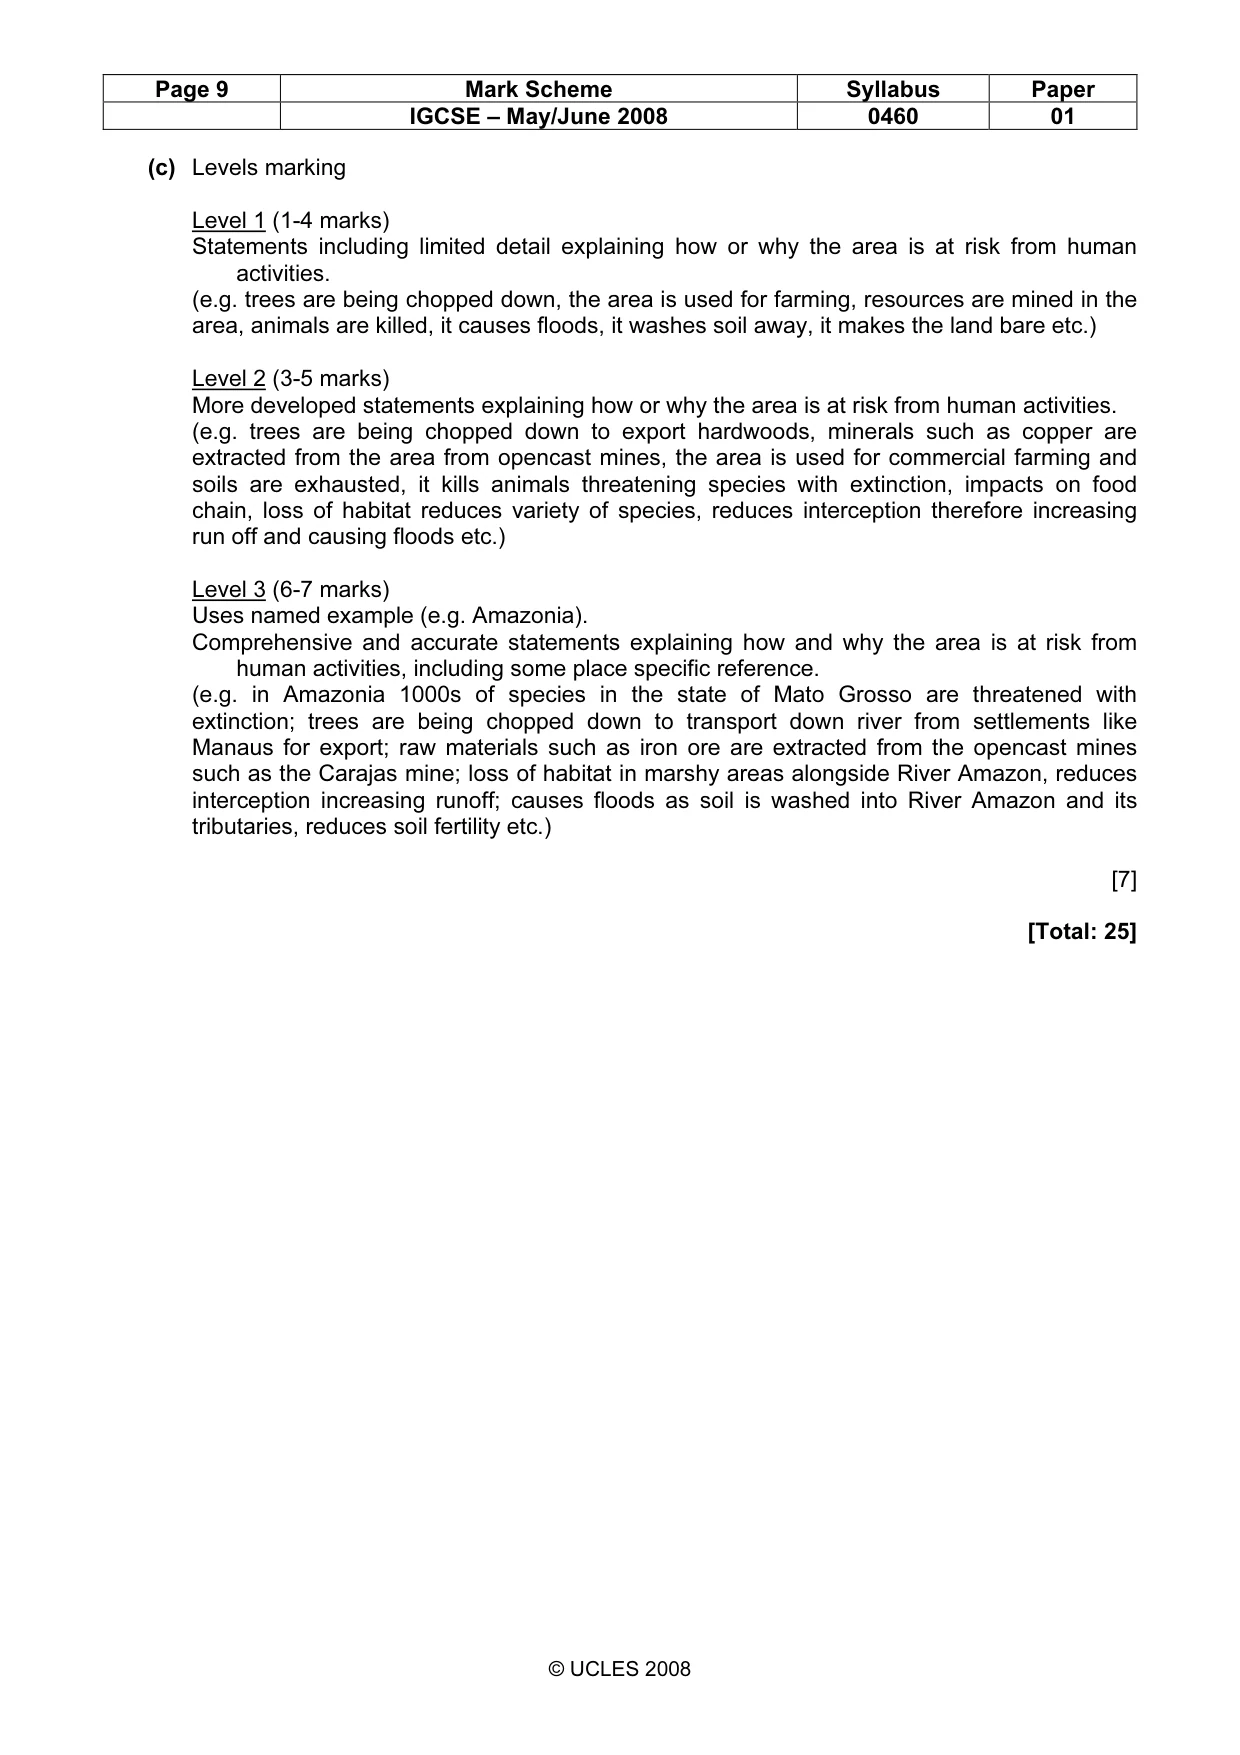
Page 9 Mark Scheme Syllabus Paper IGCSE – May/June 2008 0460 01 © UCLES 2008 (c) Levels marking Level 1 (1-4 marks) Statements including limited detail explaining how or why the area is at risk from human activities. (e.g. trees are being chopped down, the area is used for farming, resources are mined in the area, animals are killed, it causes floods, it washes soil away, it makes the land bare etc.) Level 2 (3-5 marks) More developed statements explaining how or why the area is at risk from human activities. (e.g. trees are being chopped down to export hardwoods, minerals such as copper are extracted from the area from opencast mines, the area is used for commercial farming and soils are exhausted, it kills animals threatening species with extinction, impacts on food chain, loss of habitat reduces variety of species, reduces interception therefore increasing run off and causing floods etc.) Level 3 (6-7 marks) Uses named example (e.g. Amazonia). Comprehensive and accurate statements explaining how and why the area is at risk from human activities, including some place specific reference. (e.g. in Amazonia 1000s of species in the state of Mato Grosso are threatened with extinction; trees are being chopped down to transport down river from settlements like Manaus for export; raw materials such as iron ore are extracted from the opencast mines such as the Carajas mine; loss of habitat in marshy areas alongside River Amazon, reduces interception increasing runoff; causes floods as soil is washed into River Amazon and its tributaries, reduces soil fertility etc.) [7] [Total: 25]
Mark scheme, page 10
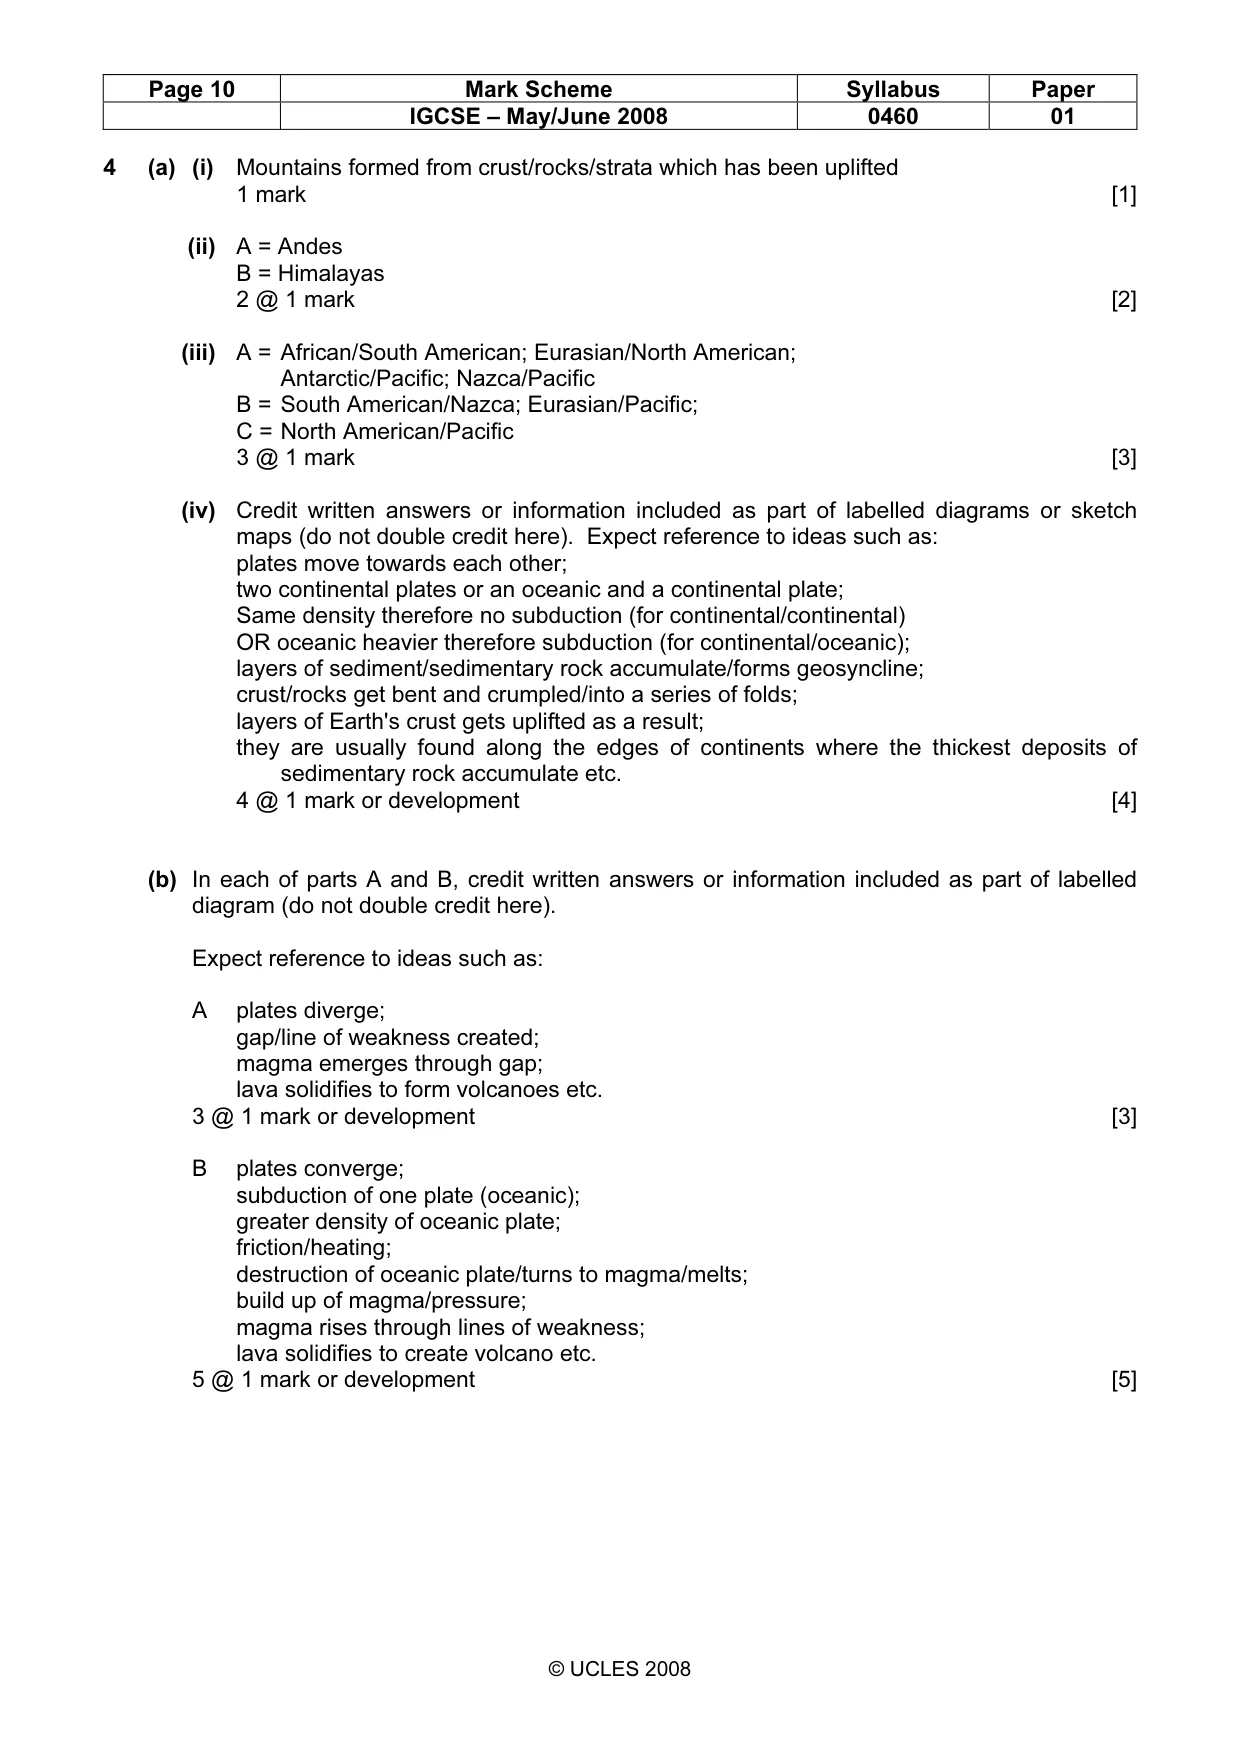
Page 10 Mark Scheme Syllabus Paper IGCSE – May/June 2008 0460 01 © UCLES 2008 4 (a) (i) Mountains formed from crust/rocks/strata which has been uplifted 1 mark [1] (ii) A = Andes B = Himalayas 2 @ 1 mark [2] (iii) A = African/South American; Eurasian/North American; Antarctic/Pacific; Nazca/Pacific B = South American/Nazca; Eurasian/Pacific; C = North American/Pacific 3 @ 1 mark [3] (iv) Credit written answers or information included as part of labelled diagrams or sketch maps (do not double credit here). Expect reference to ideas such as: plates move towards each other; two continental plates or an oceanic and a continental plate; Same density therefore no subduction (for continental/continental) OR oceanic heavier therefore subduction (for continental/oceanic); layers of sediment/sedimentary rock accumulate/forms geosyncline; crust/rocks get bent and crumpled/into a series of folds; layers of Earth's crust gets uplifted as a result; they are usually found along the edges of continents where the thickest deposits of sedimentary rock accumulate etc. 4 @ 1 mark or development [4] (b) In each of parts A and B, credit written answers or information included as part of labelled diagram (do not double credit here). Expect reference to ideas such as: A plates diverge; gap/line of weakness created; magma emerges through gap; lava solidifies to form volcanoes etc. 3 @ 1 mark or development [3] B plates converge; subduction of one plate (oceanic); greater density of oceanic plate; friction/heating; destruction of oceanic plate/turns to magma/melts; build up of magma/pressure; magma rises through lines of weakness; lava solidifies to create volcano etc. 5 @ 1 mark or development [5]
Mark scheme, page 11
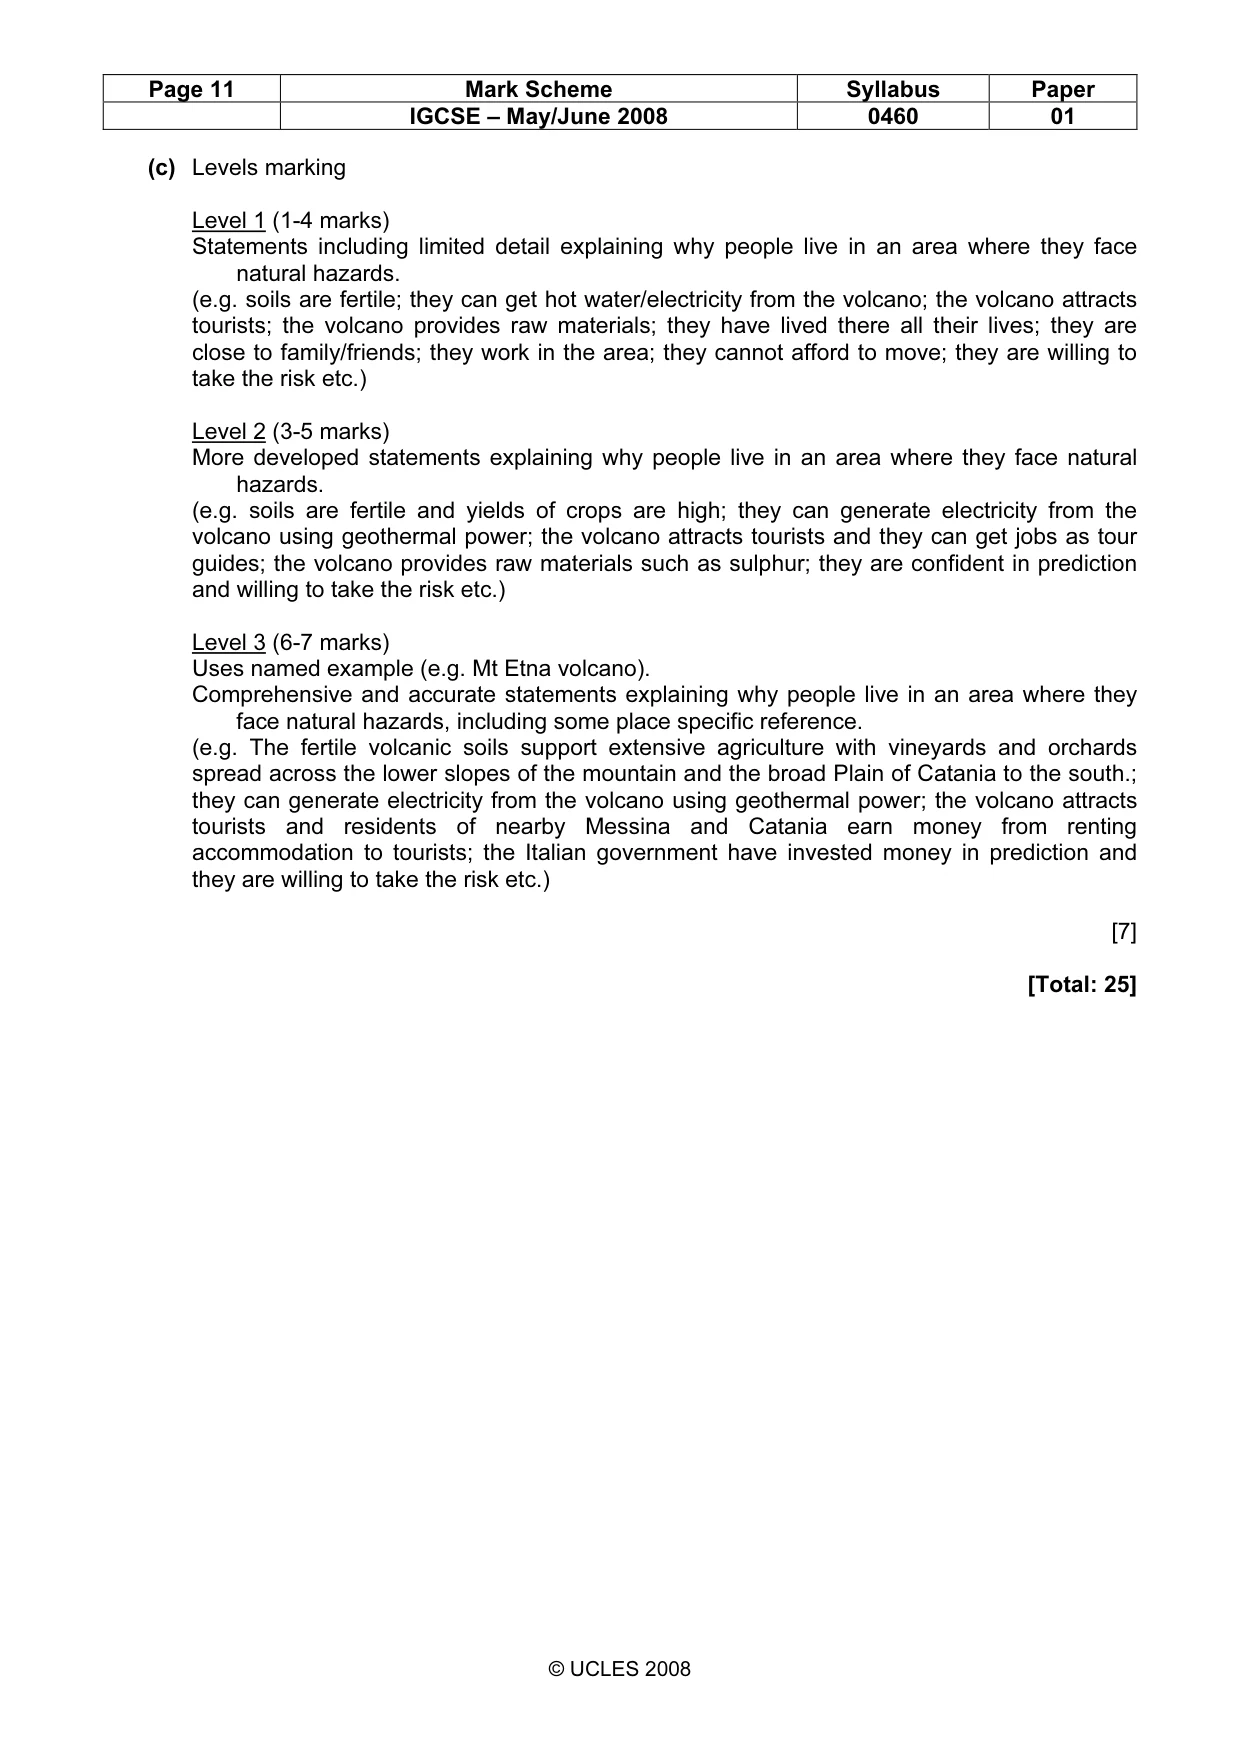
Page 11 Mark Scheme Syllabus Paper IGCSE – May/June 2008 0460 01 © UCLES 2008 (c) Levels marking Level 1 (1-4 marks) Statements including limited detail explaining why people live in an area where they face natural hazards. (e.g. soils are fertile; they can get hot water/electricity from the volcano; the volcano attracts tourists; the volcano provides raw materials; they have lived there all their lives; they are close to family/friends; they work in the area; they cannot afford to move; they are willing to take the risk etc.) Level 2 (3-5 marks) More developed statements explaining why people live in an area where they face natural hazards. (e.g. soils are fertile and yields of crops are high; they can generate electricity from the volcano using geothermal power; the volcano attracts tourists and they can get jobs as tour guides; the volcano provides raw materials such as sulphur; they are confident in prediction and willing to take the risk etc.) Level 3 (6-7 marks) Uses named example (e.g. Mt Etna volcano). Comprehensive and accurate statements explaining why people live in an area where they face natural hazards, including some place specific reference. (e.g. The fertile volcanic soils support extensive agriculture with vineyards and orchards spread across the lower slopes of the mountain and the broad Plain of Catania to the south.; they can generate electricity from the volcano using geothermal power; the volcano attracts tourists and residents of nearby Messina and Catania earn money from renting accommodation to tourists; the Italian government have invested money in prediction and they are willing to take the risk etc.) [7] [Total: 25]
Mark scheme, page 12
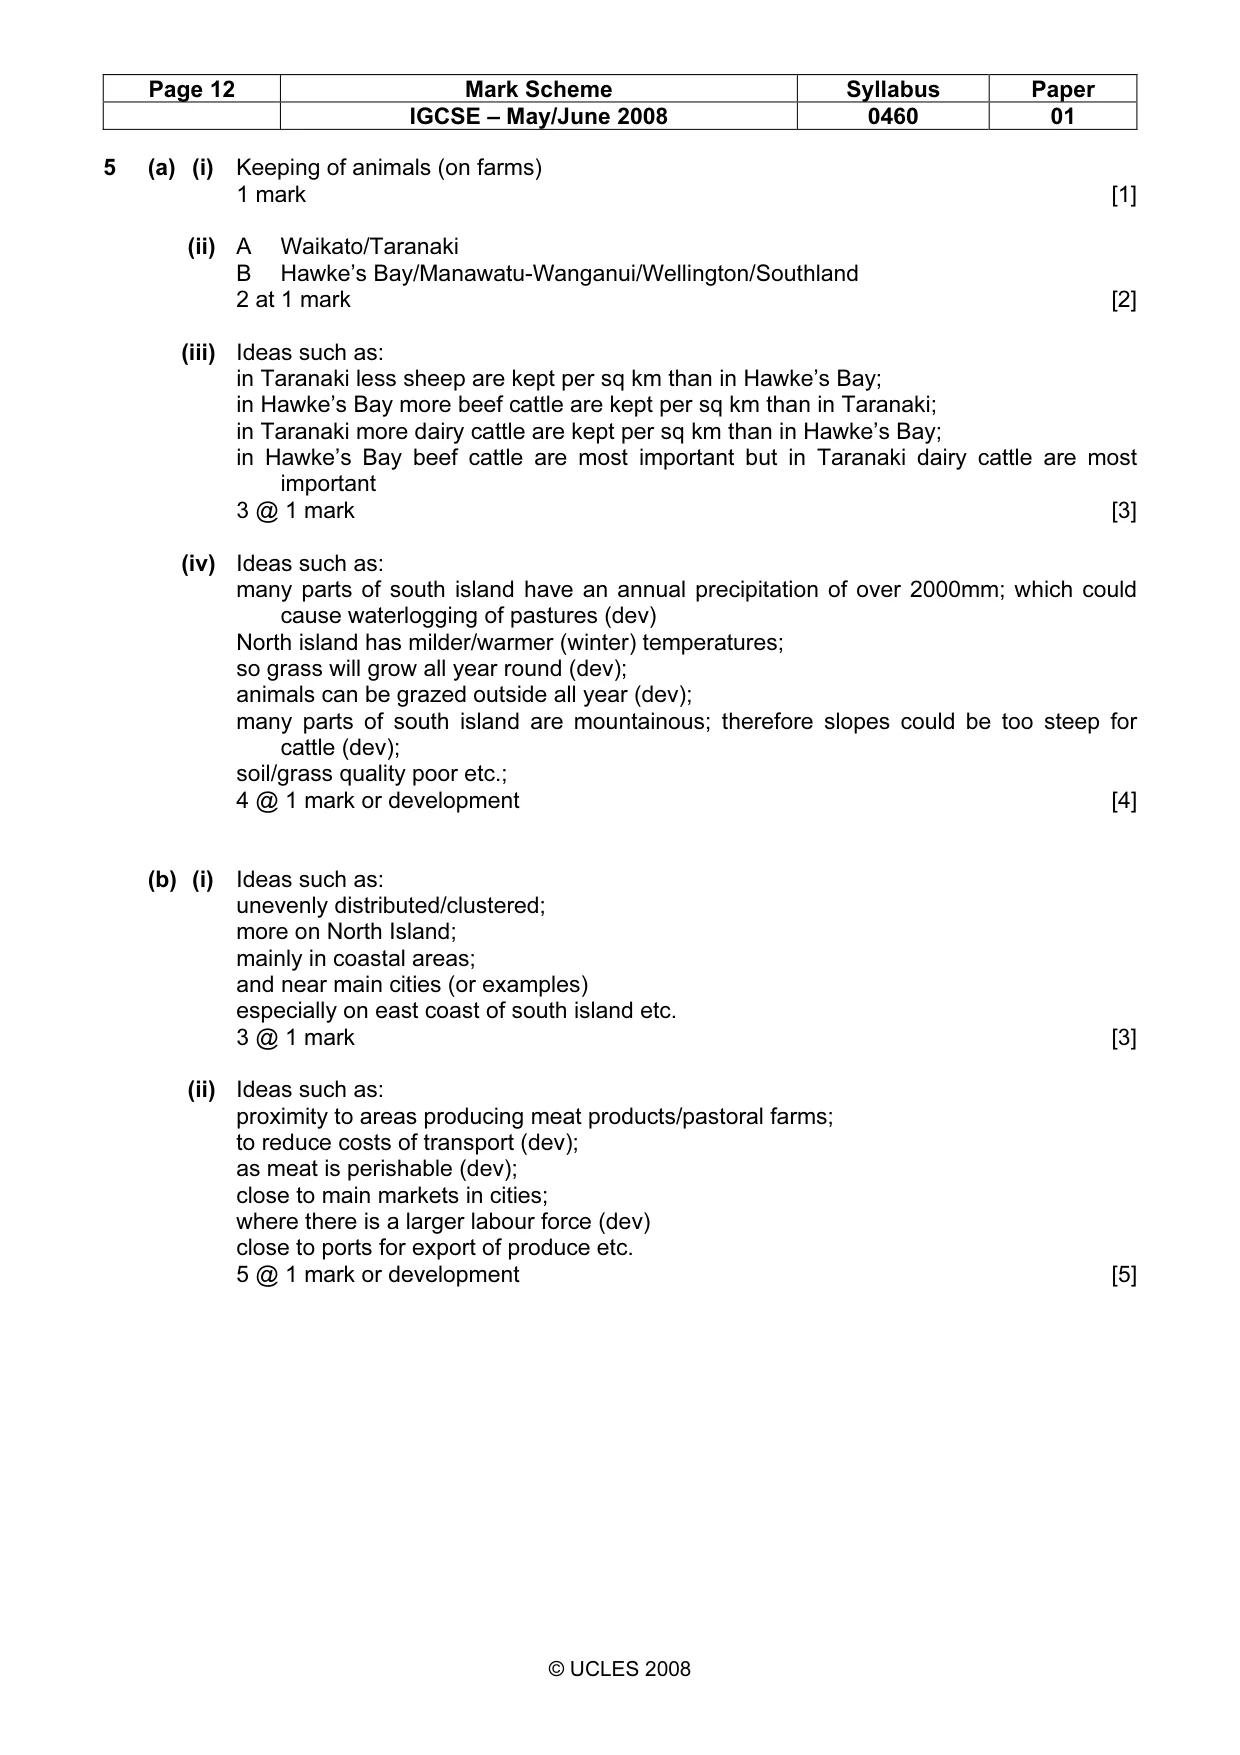
Page 12 Mark Scheme Syllabus Paper IGCSE – May/June 2008 0460 01 © UCLES 2008 5 (a) (i) Keeping of animals (on farms) 1 mark [1] (ii) A Waikato/Taranaki B Hawke’s Bay/Manawatu-Wanganui/Wellington/Southland 2 at 1 mark [2] (iii) Ideas such as: in Taranaki less sheep are kept per sq km than in Hawke’s Bay; in Hawke’s Bay more beef cattle are kept per sq km than in Taranaki; in Taranaki more dairy cattle are kept per sq km than in Hawke’s Bay; in Hawke’s Bay beef cattle are most important but in Taranaki dairy cattle are most important 3 @ 1 mark [3] (iv) Ideas such as: many parts of south island have an annual precipitation of over 2000mm; which could cause waterlogging of pastures (dev) North island has milder/warmer (winter) temperatures; so grass will grow all year round (dev); animals can be grazed outside all year (dev); many parts of south island are mountainous; therefore slopes could be too steep for cattle (dev); soil/grass quality poor etc.; 4 @ 1 mark or development [4] (b) (i) Ideas such as: unevenly distributed/clustered; more on North Island; mainly in coastal areas; and near main cities (or examples) especially on east coast of south island etc. 3 @ 1 mark [3] (ii) Ideas such as: proximity to areas producing meat products/pastoral farms; to reduce costs of transport (dev); as meat is perishable (dev); close to main markets in cities; where there is a larger labour force (dev) close to ports for export of produce etc. 5 @ 1 mark or development [5]
Mark scheme, page 13
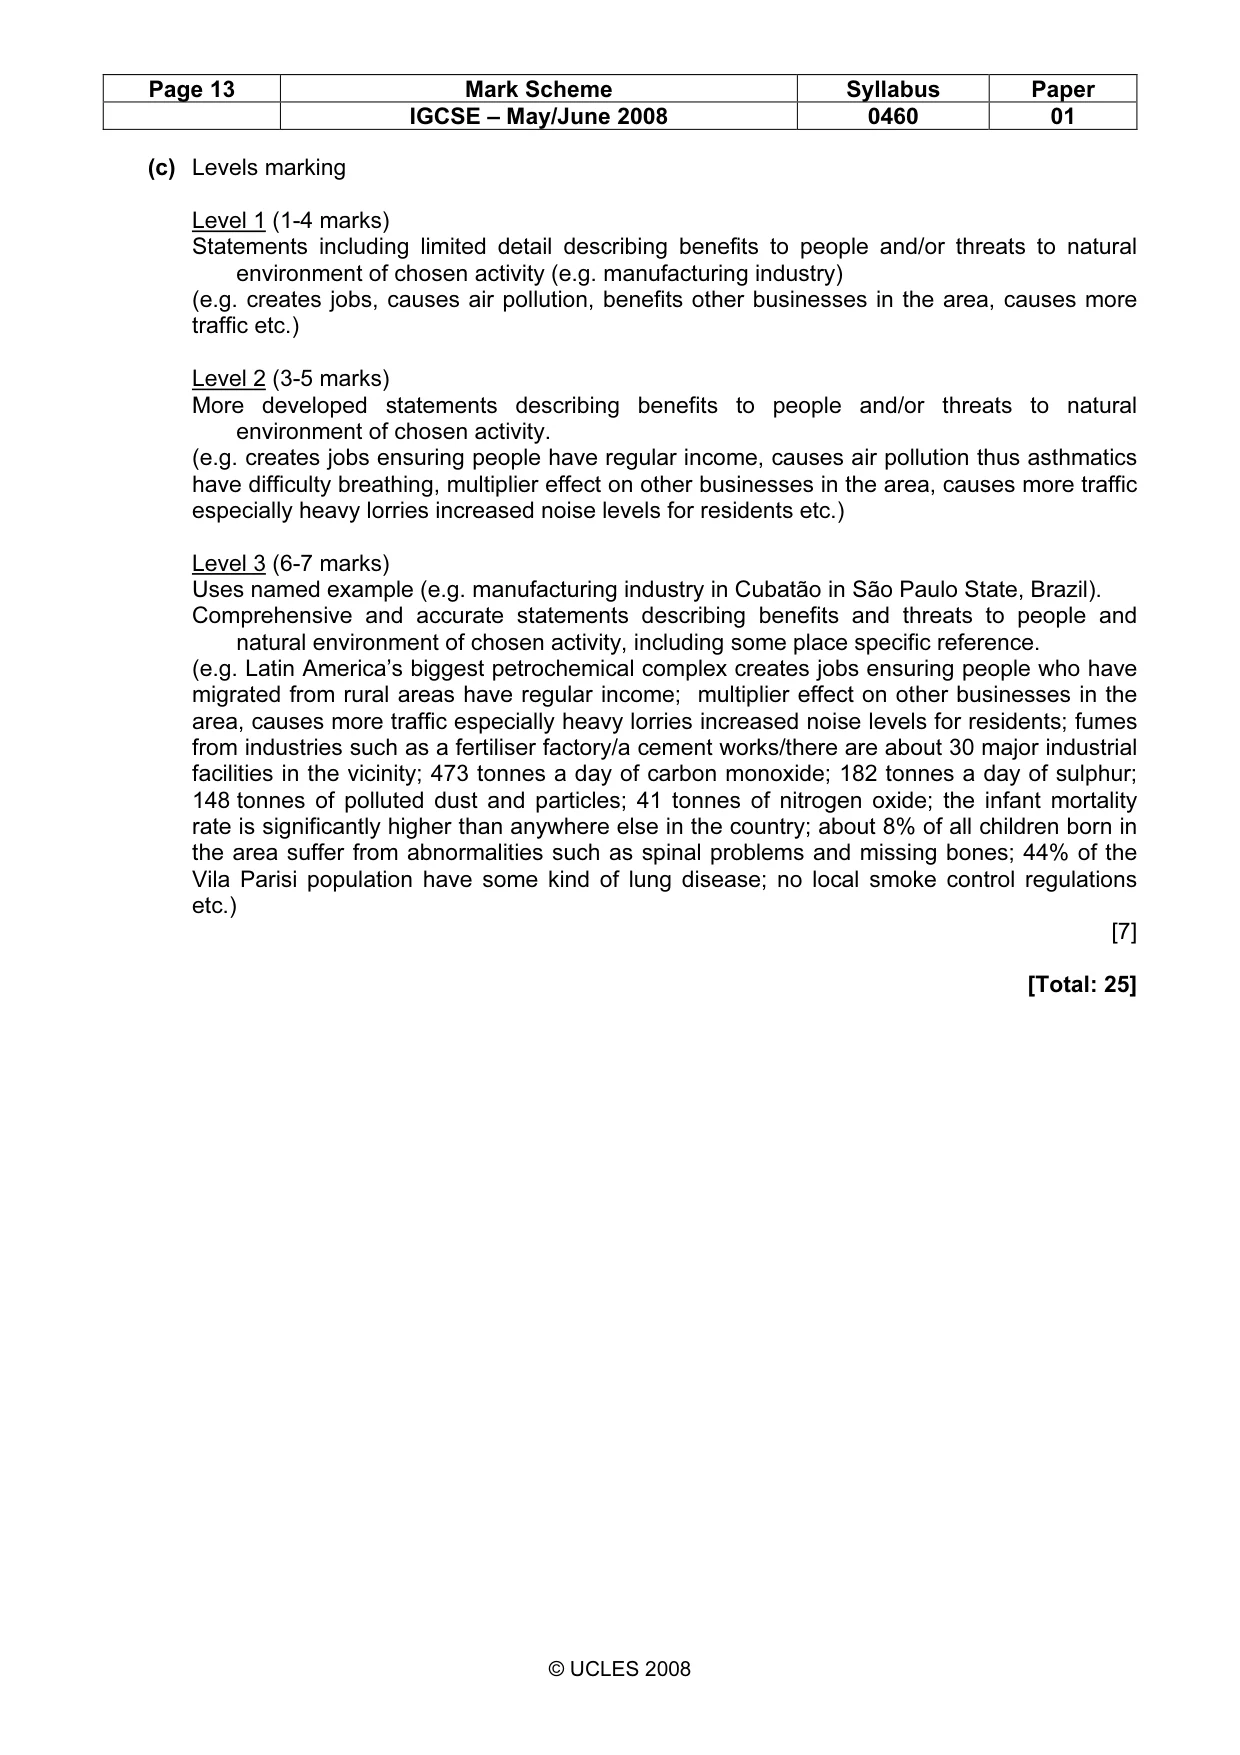
Page 13 Mark Scheme Syllabus Paper IGCSE – May/June 2008 0460 01 © UCLES 2008 (c) Levels marking Level 1 (1-4 marks) Statements including limited detail describing benefits to people and/or threats to natural environment of chosen activity (e.g. manufacturing industry) (e.g. creates jobs, causes air pollution, benefits other businesses in the area, causes more traffic etc.) Level 2 (3-5 marks) More developed statements describing benefits to people and/or threats to natural environment of chosen activity. (e.g. creates jobs ensuring people have regular income, causes air pollution thus asthmatics have difficulty breathing, multiplier effect on other businesses in the area, causes more traffic especially heavy lorries increased noise levels for residents etc.) Level 3 (6-7 marks) Uses named example (e.g. manufacturing industry in Cubatão in São Paulo State, Brazil). Comprehensive and accurate statements describing benefits and threats to people and natural environment of chosen activity, including some place specific reference. (e.g. Latin America’s biggest petrochemical complex creates jobs ensuring people who have migrated from rural areas have regular income; multiplier effect on other businesses in the area, causes more traffic especially heavy lorries increased noise levels for residents; fumes from industries such as a fertiliser factory/a cement works/there are about 30 major industrial facilities in the vicinity; 473 tonnes a day of carbon monoxide; 182 tonnes a day of sulphur; 148 tonnes of polluted dust and particles; 41 tonnes of nitrogen oxide; the infant mortality rate is significantly higher than anywhere else in the country; about 8% of all children born in the area suffer from abnormalities such as spinal problems and missing bones; 44% of the Vila Parisi population have some kind of lung disease; no local smoke control regulations etc.) [7] [Total: 25]
Mark scheme, page 14
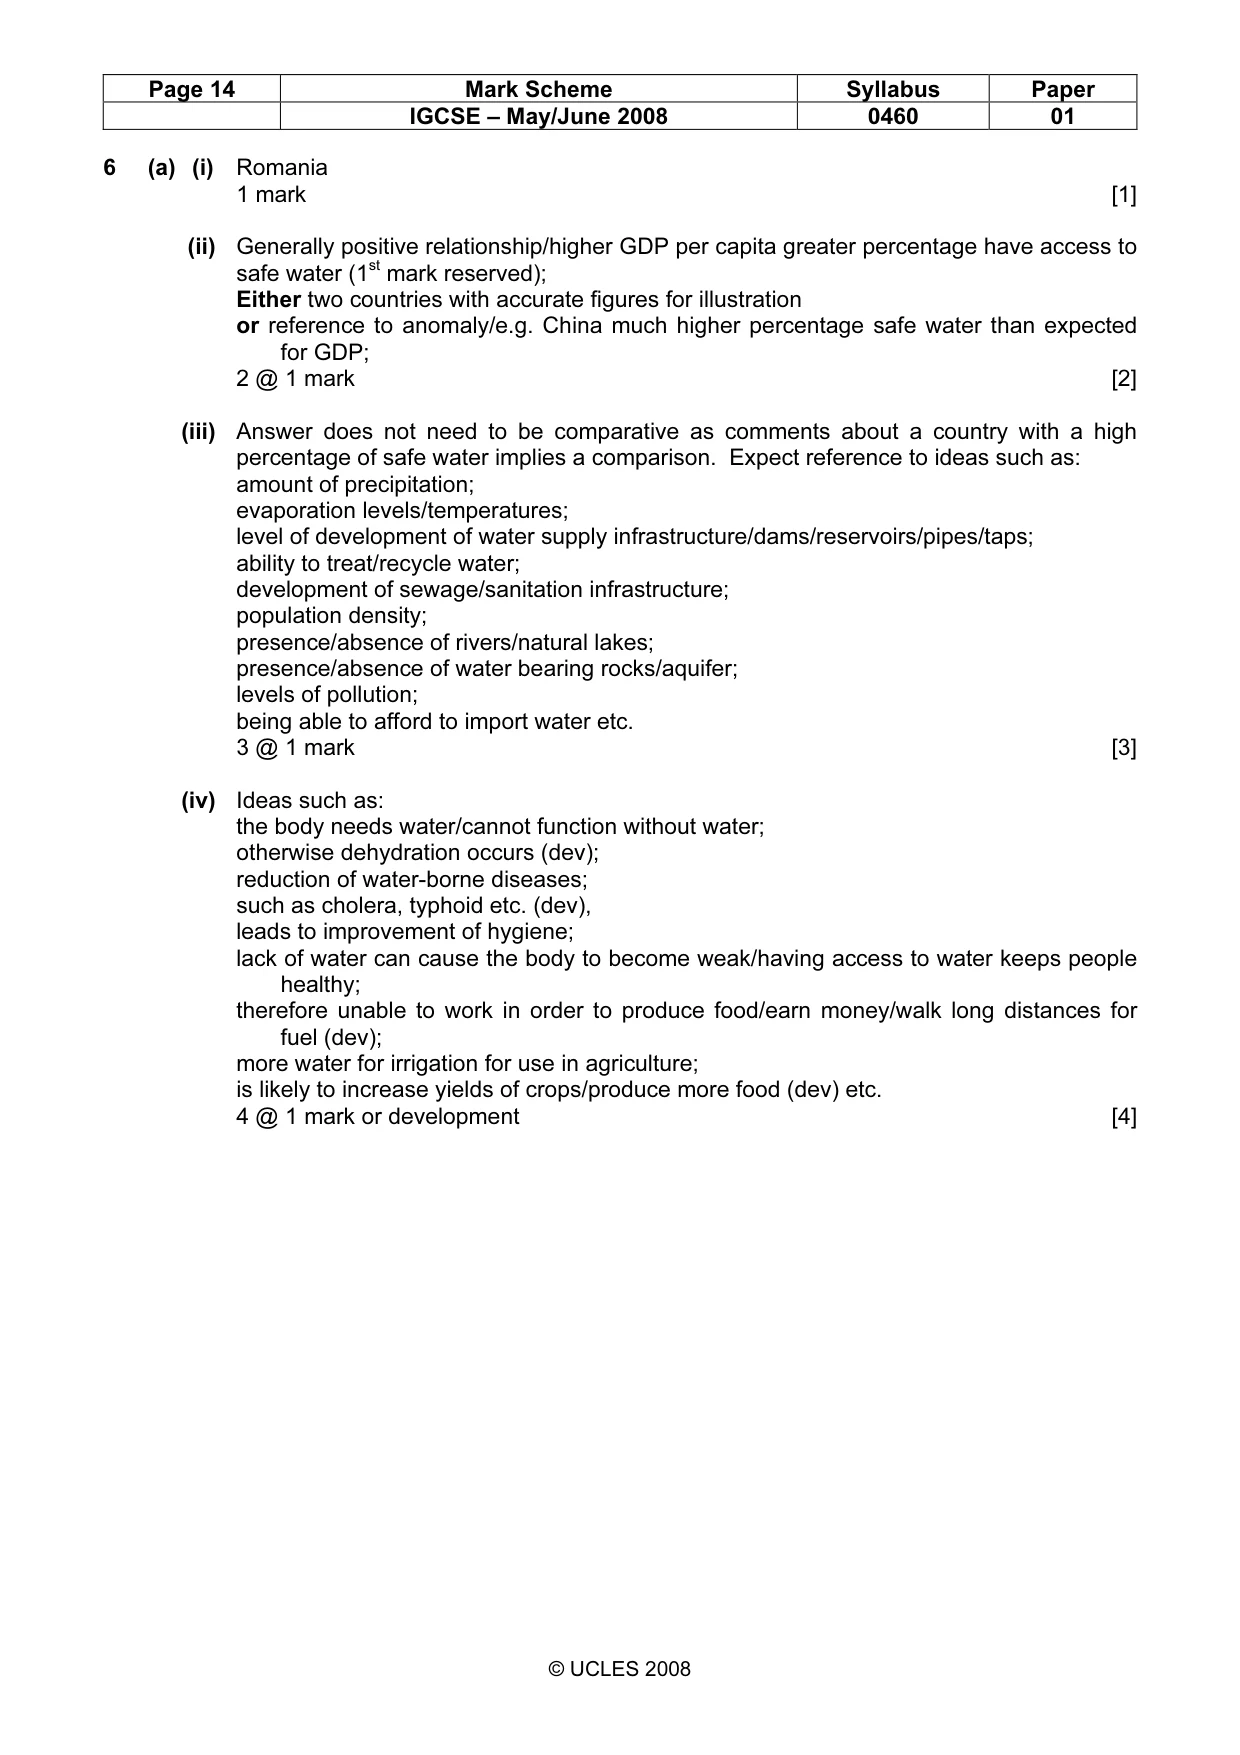
Page 14 Mark Scheme Syllabus Paper IGCSE – May/June 2008 0460 01 © UCLES 2008 6 (a) (i) Romania 1 mark [1] (ii) Generally positive relationship/higher GDP per capita greater percentage have access to safe water (1st mark reserved); Either two countries with accurate figures for illustration or reference to anomaly/e.g. China much higher percentage safe water than expected for GDP; 2 @ 1 mark [2] (iii) Answer does not need to be comparative as comments about a country with a high percentage of safe water implies a comparison. Expect reference to ideas such as: amount of precipitation; evaporation levels/temperatures; level of development of water supply infrastructure/dams/reservoirs/pipes/taps; ability to treat/recycle water; development of sewage/sanitation infrastructure; population density; presence/absence of rivers/natural lakes; presence/absence of water bearing rocks/aquifer; levels of pollution; being able to afford to import water etc. 3 @ 1 mark [3] (iv) Ideas such as: the body needs water/cannot function without water; otherwise dehydration occurs (dev); reduction of water-borne diseases; such as cholera, typhoid etc. (dev), leads to improvement of hygiene; lack of water can cause the body to become weak/having access to water keeps people healthy; therefore unable to work in order to produce food/earn money/walk long distances for fuel (dev); more water for irrigation for use in agriculture; is likely to increase yields of crops/produce more food (dev) etc. 4 @ 1 mark or development [4]
Mark scheme, page 15
Page 15 Mark Scheme Syllabus Paper IGCSE – May/June 2008 0460 01 © UCLES 2008 (b) (i) Ideas such as: long lasting drought/low rainfall; lack of dams/reservoirs/dependence on wells; large demand from tourist industry water is wasted 3 @ 1 mark [3] (ii) Methods such as: dam/reservoir/pipeline building; desalination plants; more boreholes/wells; cloud seeding; rationing; increase cost of water; cover wells; afforestation; treatment plants/use grey water/recycling; import water etc. specific examples of water conservation methods to max 2; 5 @ 1 mark or development [5] (c) Levels marking Level 1 (1-4 marks) Statements including limited detail explaining why tourism has developed in an area, referring to physical and/or human attractions. (e.g. a hot climate; scenic beauty; beaches; tropical vegetation; Interesting culture; historical buildings etc.) Level 2 (3-5 marks) More developed statements explaining why tourism has developed in an area, referring to physical and/or human attractions. (e.g. a hot climate with summer average temperatures at least 25 °C; sandy beaches; clear blue seas; tropical vegetation with palm trees; historical buildings such as cathedrals etc.) Level 3 (6-7 marks) Uses named example (e.g. Mallorca). Comprehensive and accurate statements explaining why tourism has developed in an area, referring to physical and human attractions, including some place specific reference. (e.g. a Mediterranean climate with hot, dry summers with average temperatures at least 25 °C and mild winters with no frost and snow; sandy beaches at resorts like Alcudia; historical buildings such as the cathedral at Palma; theme parks/water parks etc.) [7] [Total: 25]
What you needed in this session
Cambridge’s own grade thresholds for 2008 May/June, Paper 1 · Variant 1. A higher threshold means an easier paper — the bar moves with how the cohort did.