Cambridge IGCSE Geography 0460 — 2007 Oct/Nov Paper 1 · Variant 1
0460/11/O/N/07 · 75 marks · ≈84 min
The question paper and its mark scheme, free to read here and free to download. This is Cambridge’s own paper, exactly as it was sat.
Question paper16 pages

Mark scheme13 pages
Answers below. Sit the paper first if you are practising.
Paper as text
Question paper, page 1
This document consists of 15 printed pages and 1 blank page and 1 Insert. SP (KN) T49883/7(R) © UCLES 2007 [Turn over UNIVERSITY OF CAMBRIDGE INTERNATIONAL EXAMINATIONS International General Certificate of Secondary Education READ THESE INSTRUCTIONS FIRST If you have been given an Answer Booklet, follow the instructions on the front cover of the Booklet. Write your Centre number, candidate number and name on all the work you hand in. Write in dark blue or black pen. You may use a soft pencil for any diagrams, graphs or rough working. Do not use staples, paper clips, highlighters, glue or correction fluid. Answer three questions. Sketch maps and diagrams should be drawn whenever they serve to illustrate an answer. The Insert contains Photographs A and B for Question 1, Figs 3A, 3B and 3C for Question 2 and Fig. 8 for Question 5. At the end of the examination, fasten all your work securely together. The number of marks is given in brackets [ ] at the end of each question or part question. * 7 0 6 0 4 7 5 1 4 8 * GEOGRAPHY 0460/01 Paper 1 October/November 2007 1 hour 45 minutes Additional Materials: Answer Booklet/Paper www.XtremePapers.com
Question paper, page 2
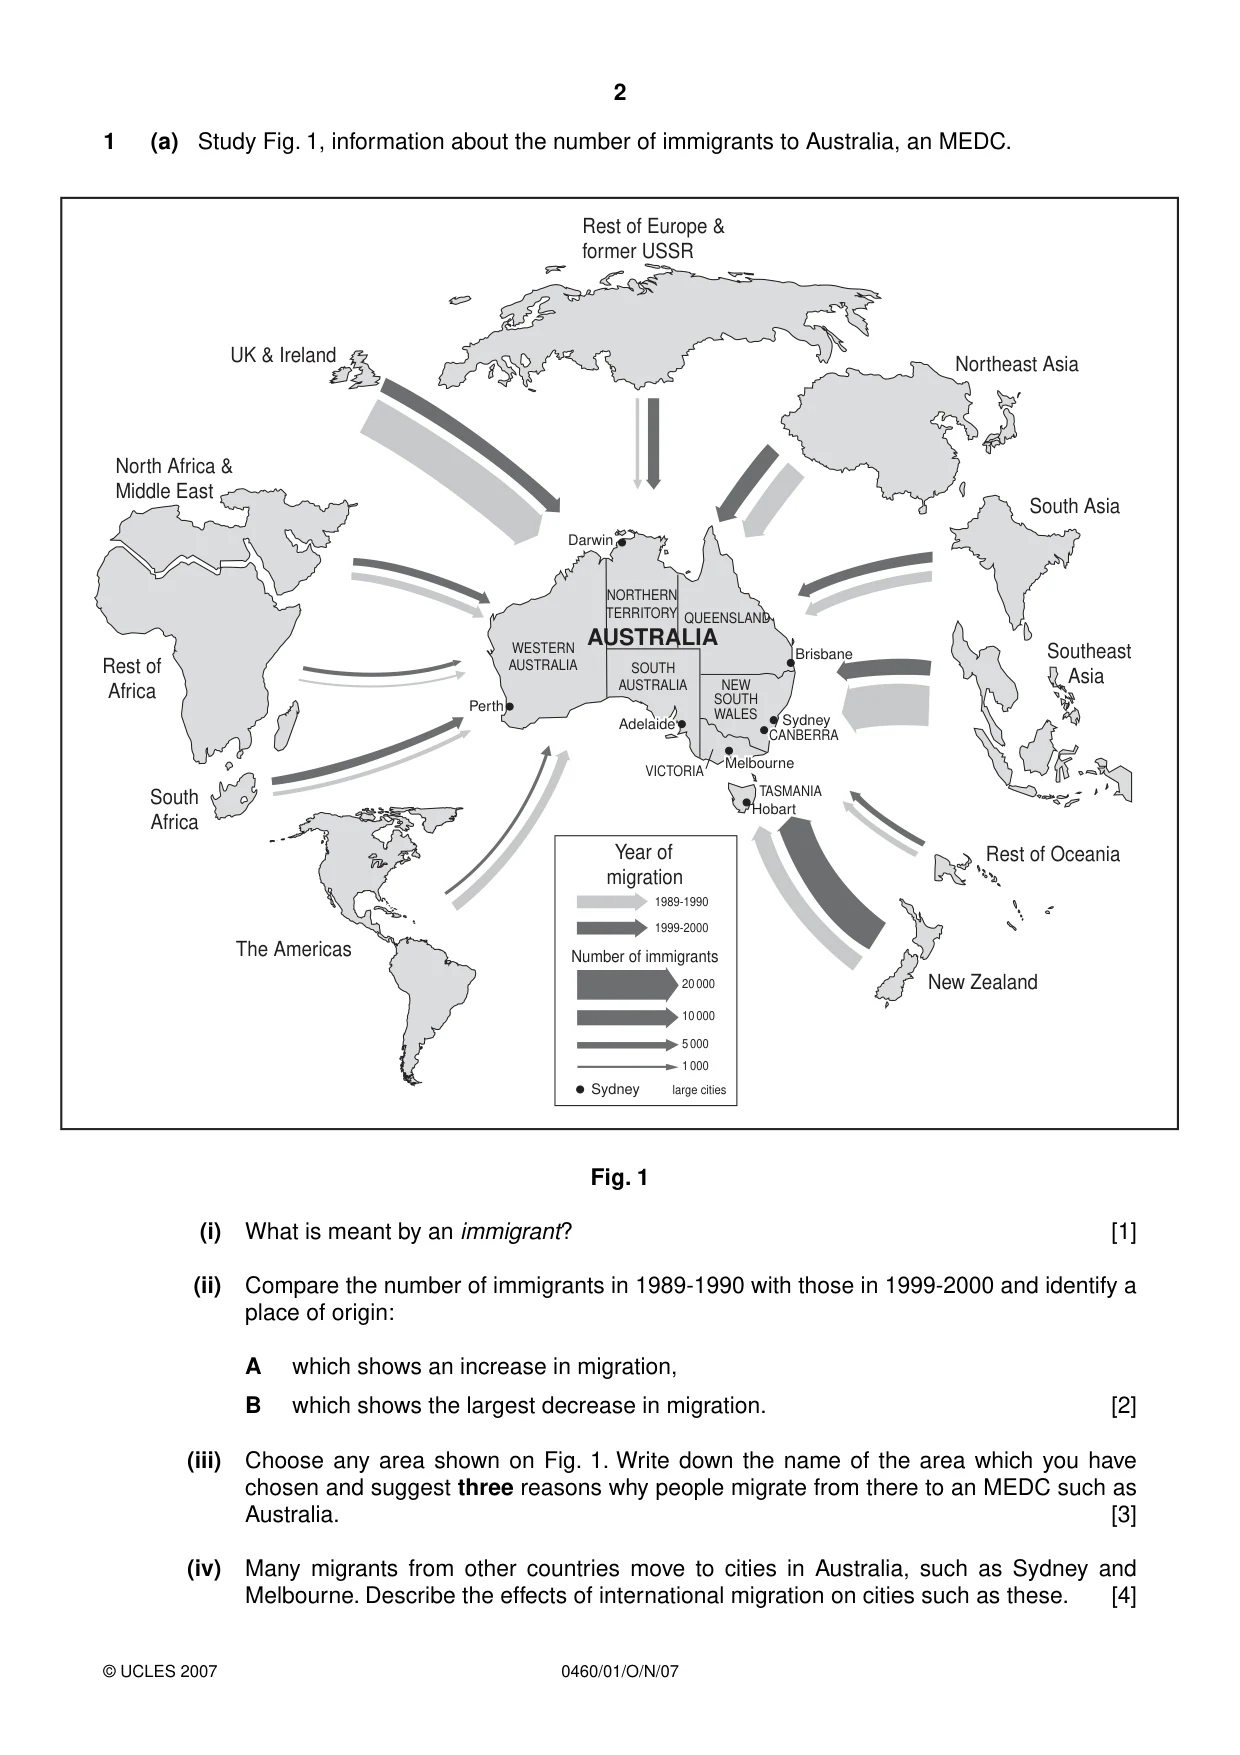
2 0460/01/O/N/07 © UCLES 2007 1 (a) Study Fig. 1, information about the number of immigrants to Australia, an MEDC. Darwin Perth Brisbane Hobart CANBERRA CANBERRA CANBERRA Adelaide Adelaide Melbourne Melbourne Adelaide Melbourne NORTHERN TERRITORY NEW SOUTH WALES SOUTH AUSTRALIA WESTERN AUSTRALIA VICTORIA TASMANIA QUEENSLAND AUSTRALIA Sydney UK & Ireland North Africa & Middle East Rest of Africa South Africa The Americas Rest of Europe & former USSR Northeast Asia Southeast Asia Rest of Oceania New Zealand South Asia Year of migration Number of immigrants 1989-1990 1999-2000 20 000 10 000 5 000 1 000 Sydney large cities Fig. 1 (i) What is meant by an immigrant? [1] (ii) Compare the number of immigrants in 1989-1990 with those in 1999-2000 and identify a place of origin: A which shows an increase in migration, B which shows the largest decrease in migration. [2] (iii) Choose any area shown on Fig. 1. Write down the name of the area which you have chosen and suggest three reasons why people migrate from there to an MEDC such as Australia. [3] (iv) Many migrants from other countries move to cities in Australia, such as Sydney and Melbourne. Describe the effects of international migration on cities such as these. [4]
Question paper, page 3
3 0460/01/O/N/07 © UCLES 2007 [Turn over (b) Study Photographs A and B (Insert), which show parts of an area of sparse population density in an LEDC. (i) Use evidence from the photographs to explain why the area shown is sparsely populated. [3] (ii) Explain why towns may grow up in areas which are otherwise sparsely populated. [5] (c) The size of the population in an area may change as a result of natural increase. For an area which you have studied, explain why the rate of natural population growth is high. [7]
Question paper, page 4
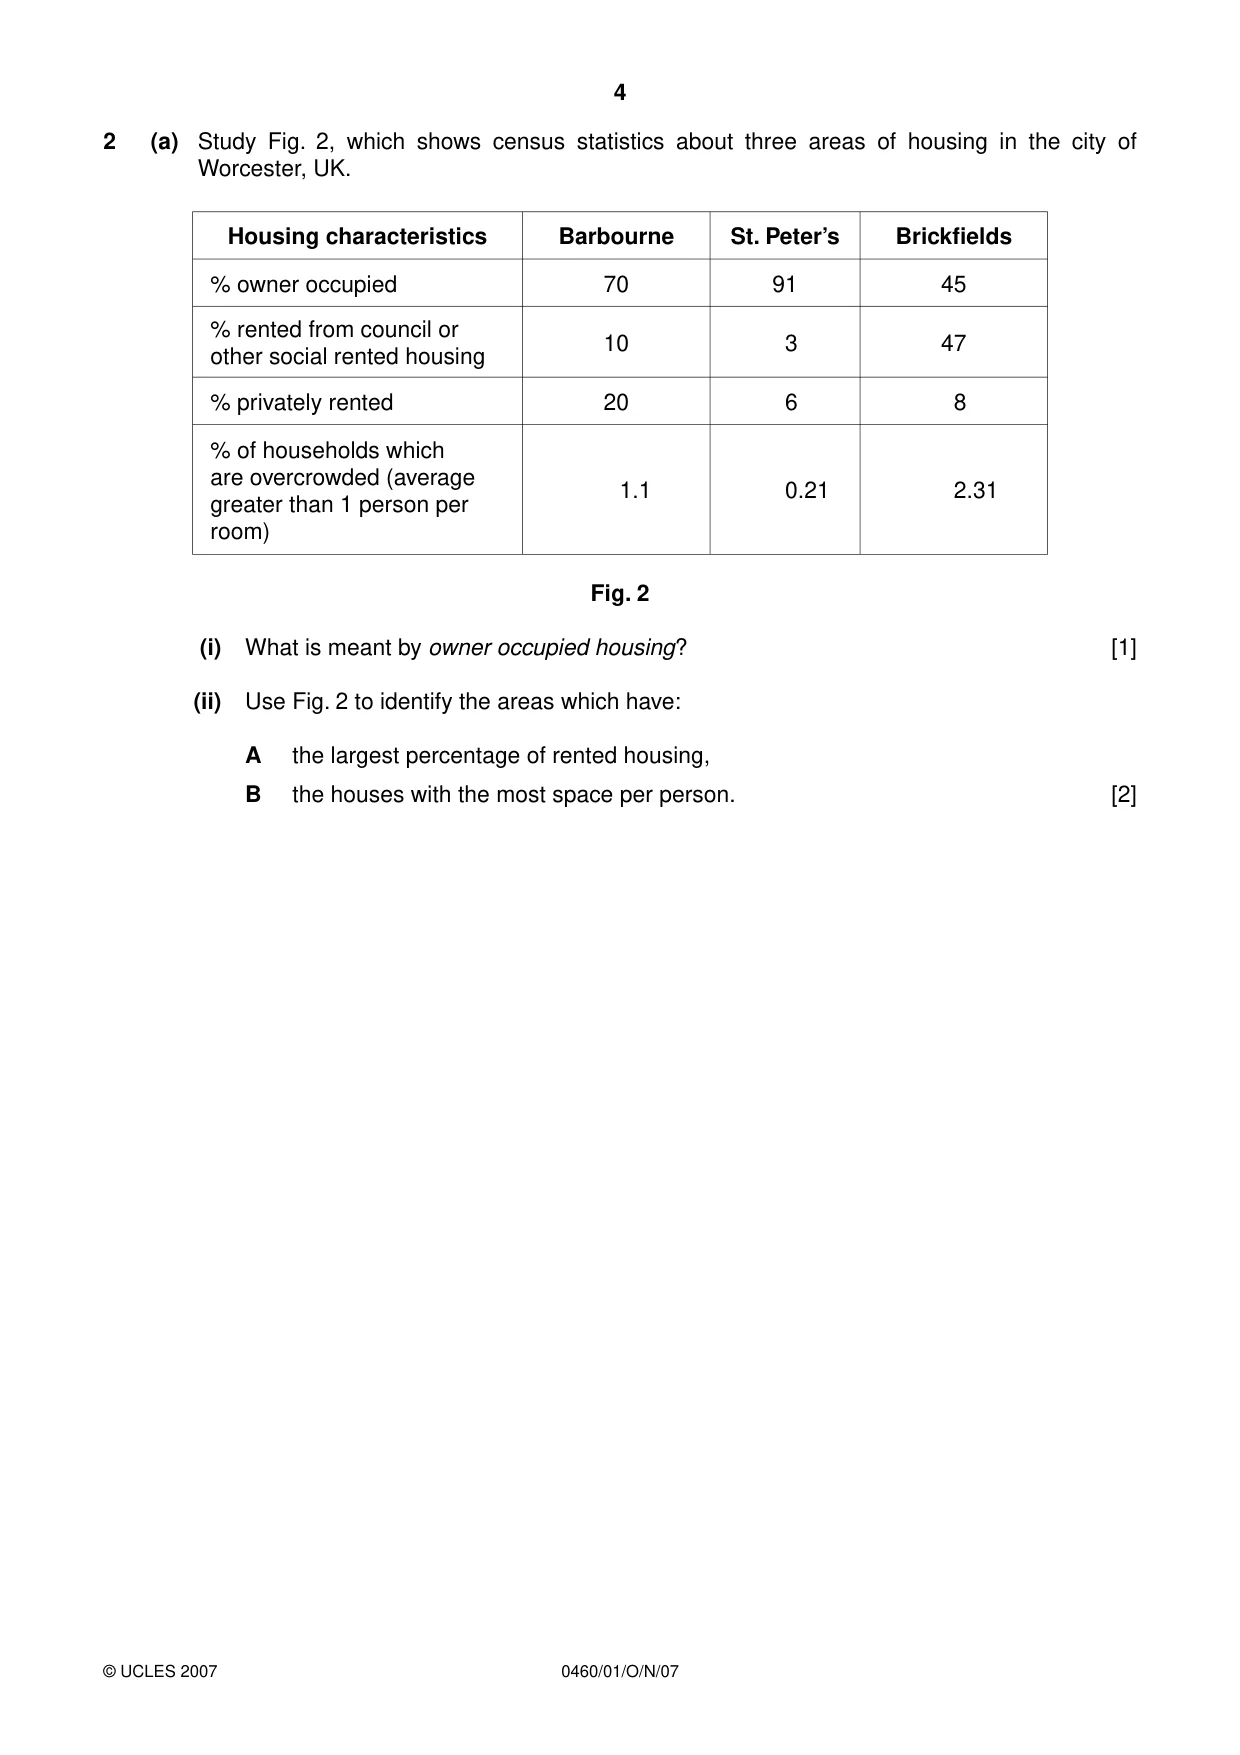
4 0460/01/O/N/07 © UCLES 2007 2 (a) Study Fig. 2, which shows census statistics about three areas of housing in the city of Worcester, UK. Housing characteristics Barbourne St. Peter’s Brickfields % owner occupied 70 91 45 % rented from council or other social rented housing 10 3 47 % privately rented 20 6 8 % of households which are overcrowded (average greater than 1 person per room) 1.1 0.21 2.31 Fig. 2 (i) What is meant by owner occupied housing? [1] (ii) Use Fig. 2 to identify the areas which have: A the largest percentage of rented housing, B the houses with the most space per person. [2]
Question paper, page 5
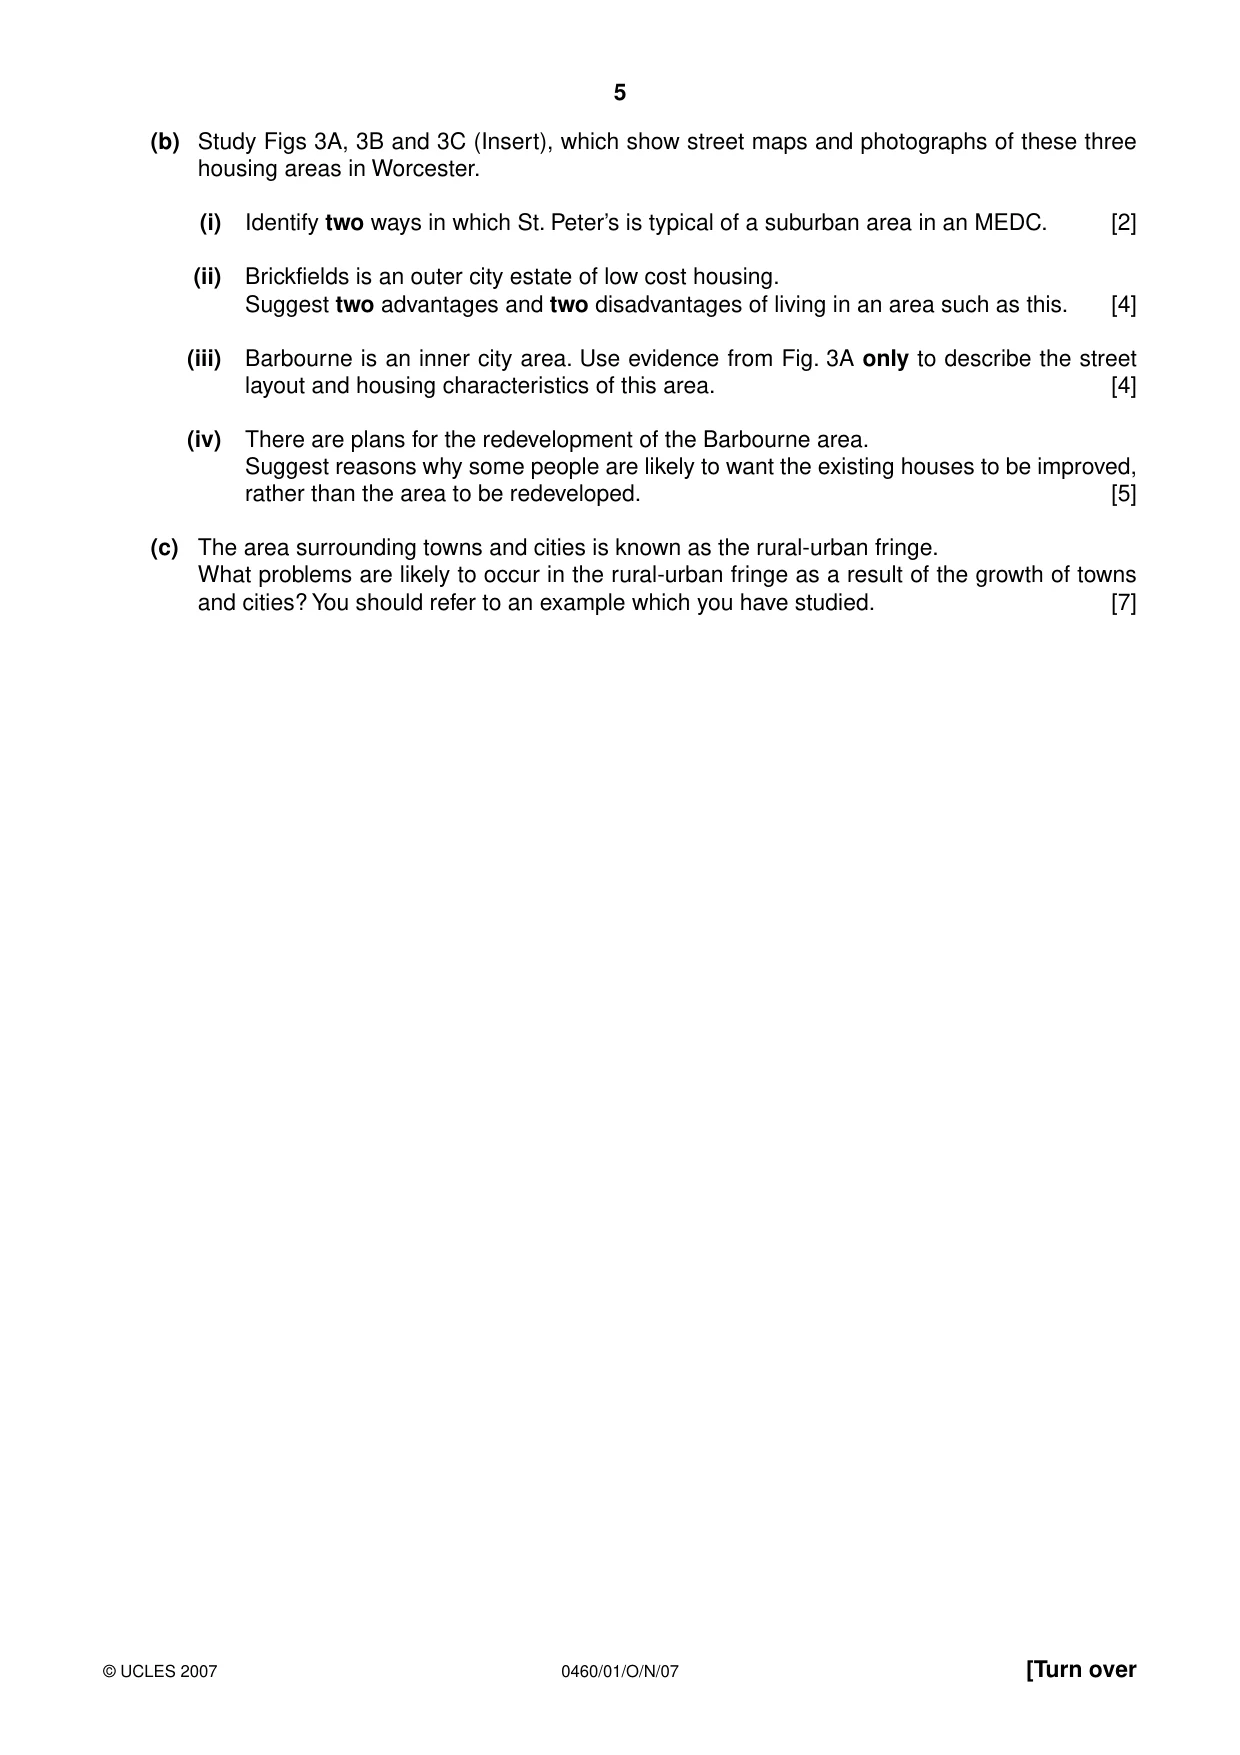
5 0460/01/O/N/07 © UCLES 2007 [Turn over (b) Study Figs 3A, 3B and 3C (Insert), which show street maps and photographs of these three housing areas in Worcester. (i) Identify two ways in which St. Peter’s is typical of a suburban area in an MEDC. [2] (ii) Brickfields is an outer city estate of low cost housing. Suggest two advantages and two disadvantages of living in an area such as this. [4] (iii) Barbourne is an inner city area. Use evidence from Fig. 3A only to describe the street layout and housing characteristics of this area. [4] (iv) There are plans for the redevelopment of the Barbourne area. Suggest reasons why some people are likely to want the existing houses to be improved, rather than the area to be redeveloped. [5] (c) The area surrounding towns and cities is known as the rural-urban fringe. What problems are likely to occur in the rural-urban fringe as a result of the growth of towns and cities? You should refer to an example which you have studied. [7]
Question paper, page 6
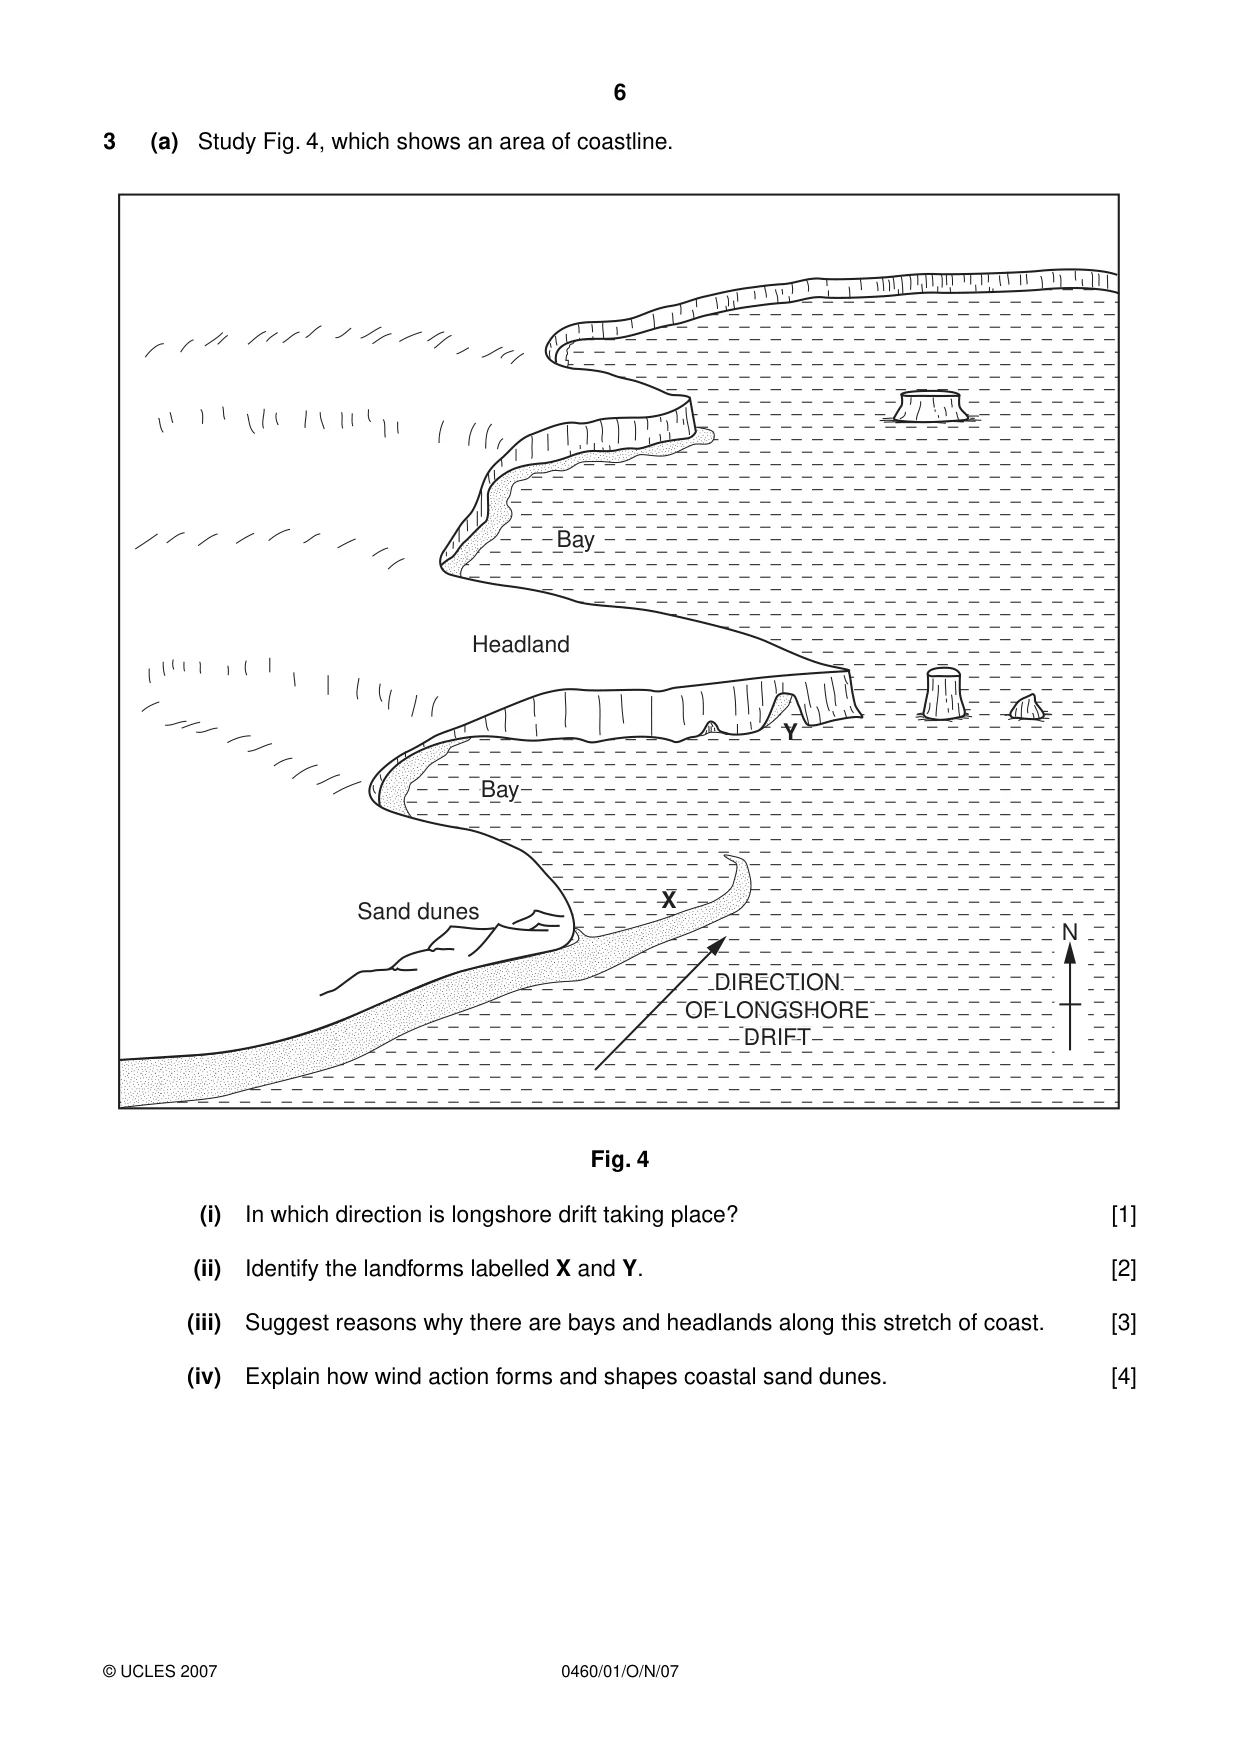
6 0460/01/O/N/07 © UCLES 2007 3 (a) Study Fig. 4, which shows an area of coastline. Sand dunes Headland Bay Bay Bay Bay X Y DIRECTION DIRECTION OF LONGSHORE OF LONGSHORE DRIFT DRIFT DIRECTION OF LONGSHORE DRIFT N Bay Bay Fig. 4 (i) In which direction is longshore drift taking place? [1] (ii) Identify the landforms labelled X and Y. [2] (iii) Suggest reasons why there are bays and headlands along this stretch of coast. [3] (iv) Explain how wind action forms and shapes coastal sand dunes. [4]
Question paper, page 7
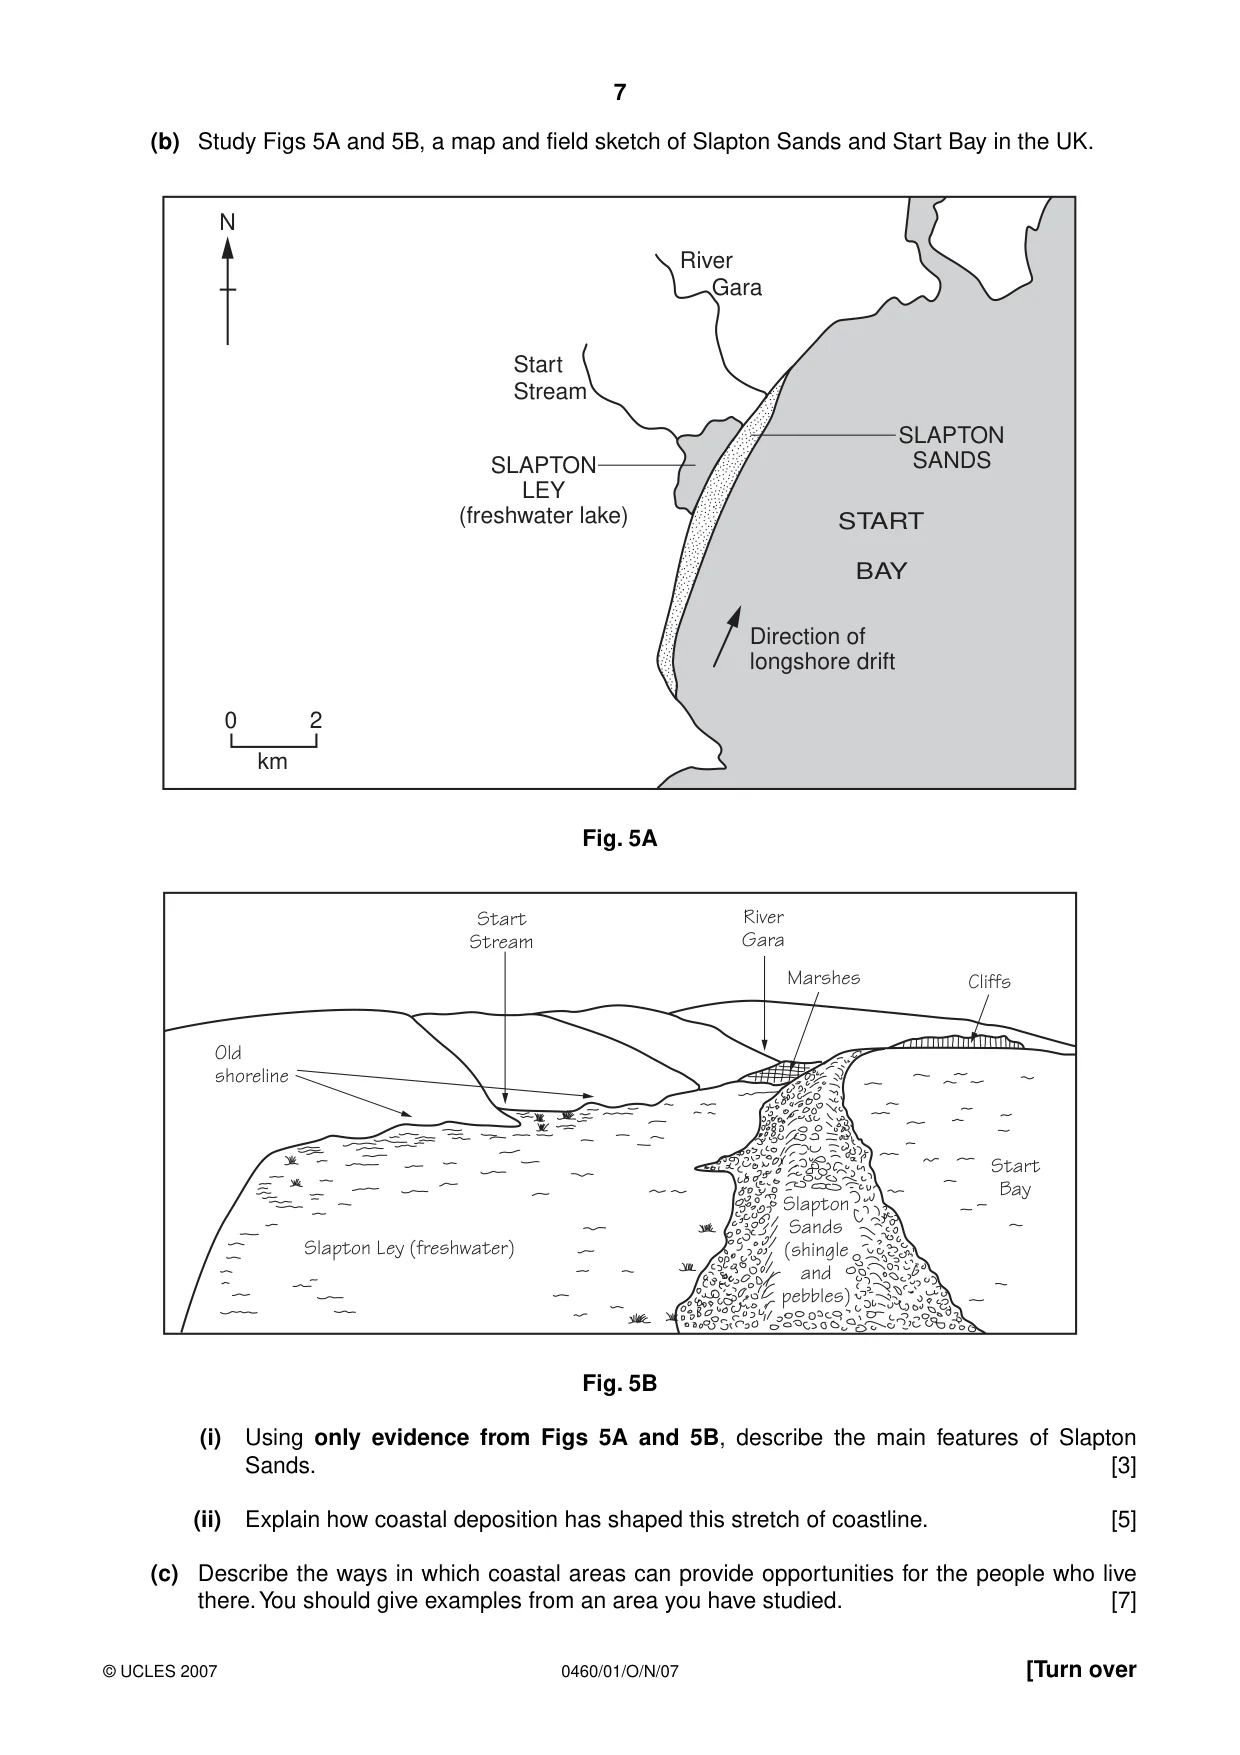
7 0460/01/O/N/07 © UCLES 2007 [Turn over (b) Study Figs 5A and 5B, a map and field sketch of Slapton Sands and Start Bay in the UK. River Gara Start Stream N SLAPTON LEY (freshwater lake) SLAPTON SANDS Direction of longshore drift START BAY 0 2 km Fig. 5A Start Stream Old shoreline River Gara Marshes Cliffs Start Bay Slapton Ley (freshwater) Slapton Sands (shingle and pebbles) Fig. 5B (i) Using only evidence from Figs 5A and 5B, describe the main features of Slapton Sands. [3] (ii) Explain how coastal deposition has shaped this stretch of coastline. [5] (c) Describe the ways in which coastal areas can provide opportunities for the people who live there. You should give examples from an area you have studied. [7]
Question paper, page 9
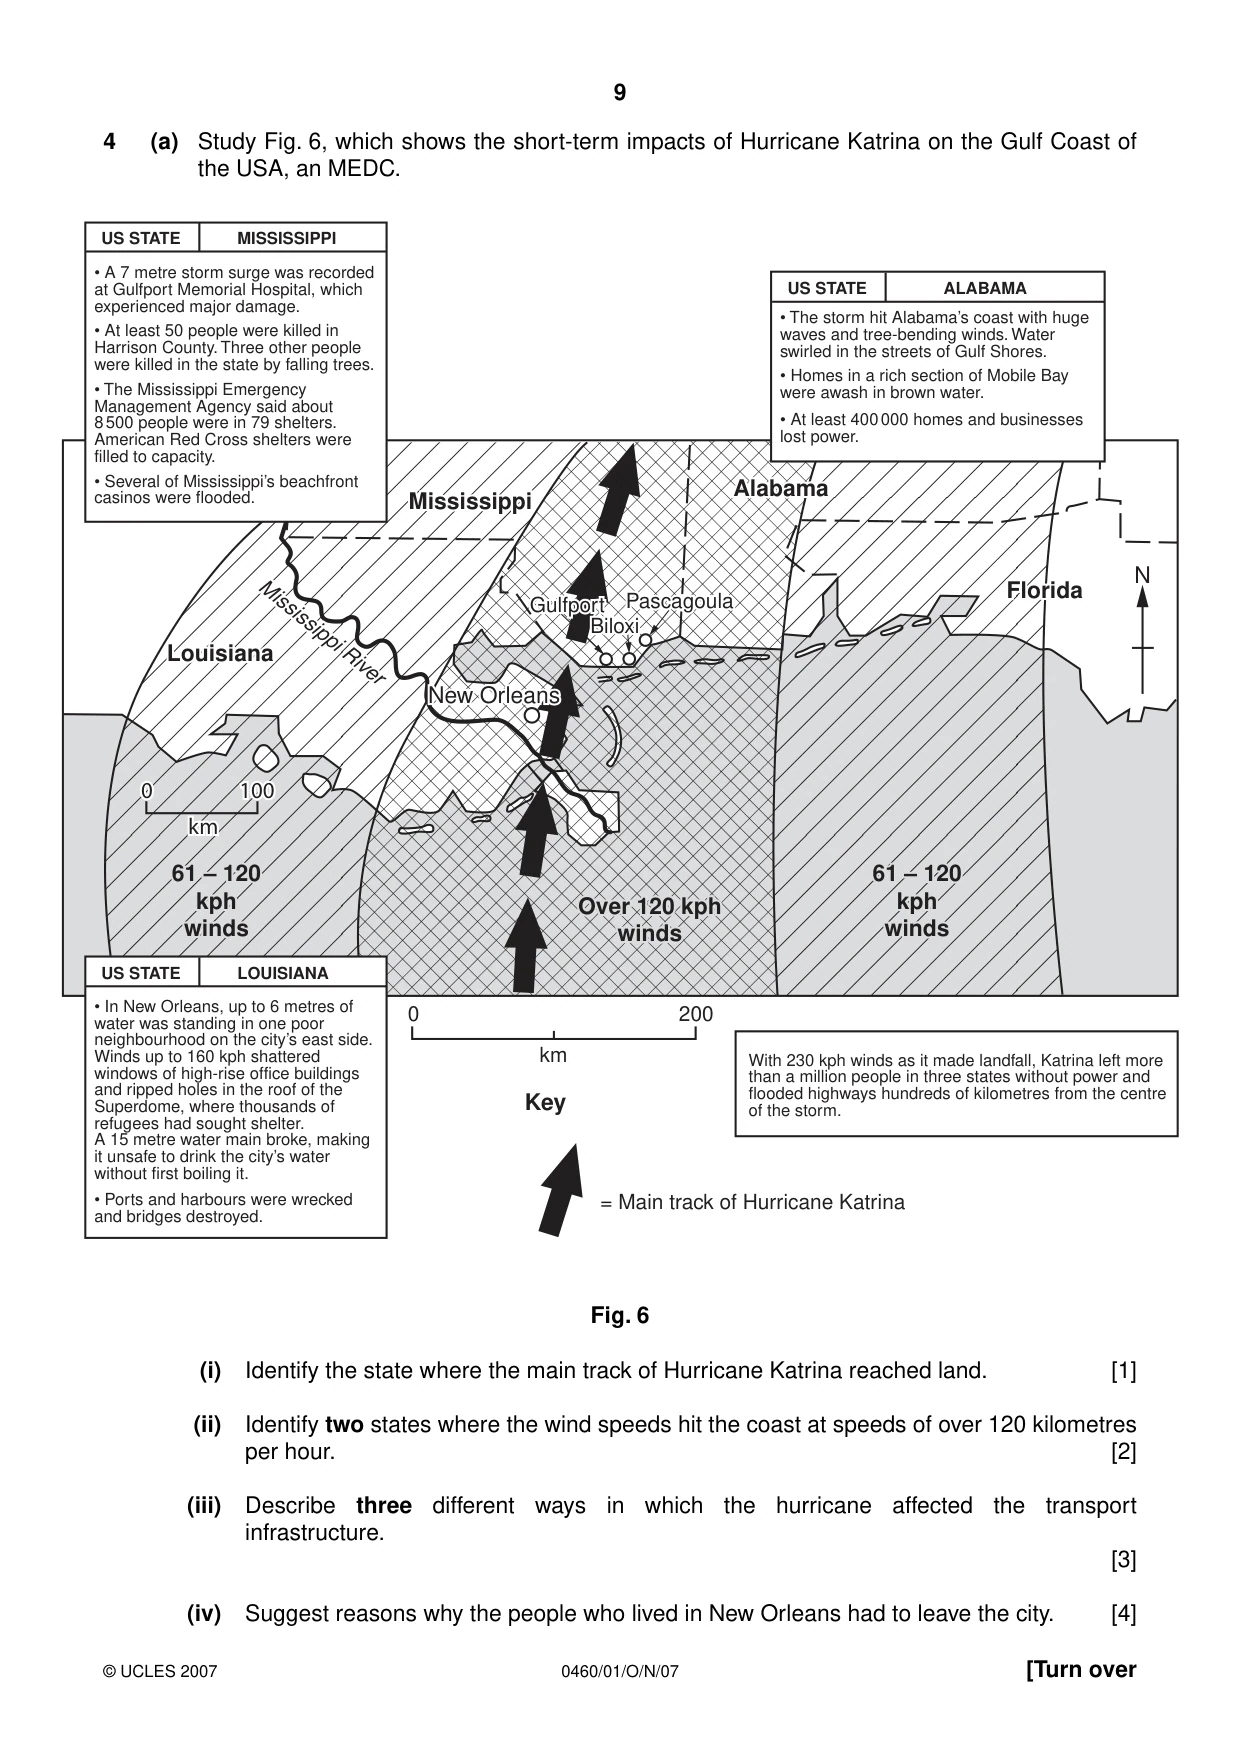
9 0460/01/O/N/07 © UCLES 2007 [Turn over 4 (a) Study Fig. 6, which shows the short-term impacts of Hurricane Katrina on the Gulf Coast of the USA, an MEDC. Louisiana Louisiana Mississippi Mississippi 0 0 100 100 km km Mississippi River Mississippi River Louisiana 61 – 120 61 – 120 kph kph winds winds Mississippi 0 100 km Mississippi River Florida Florida Florida Alabama Alabama Alabama New Orleans New Orleans Gulfport Gulfport Biloxi Biloxi Pascagoula Pascagoula Pascagoula Gulfport Biloxi New Orleans US STATE MISSISSIPPI • A 7 metre storm surge was recorded at Gulfport Memorial Hospital, which experienced major damage. • At least 50 people were killed in Harrison County. Three other people were killed in the state by falling trees. ALABAMA • The storm hit Alabama’s coast with huge waves and tree-bending winds. Water swirled in the streets of Gulf Shores. • Homes in a rich section of Mobile Bay were awash in brown water. • At least 400 000 homes and businesses lost power. • The Mississippi Emergency Management Agency said about 8 500 people were in 79 shelters. American Red Cross shelters were filled to capacity. • Several of Mississippi’s beachfront casinos were flooded. • In New Orleans, up to 6 metres of water was standing in one poor neighbourhood on the city’s east side. Winds up to 160 kph shattered windows of high-rise office buildings and ripped holes in the roof of the Superdome, where thousands of refugees had sought shelter. A 15 metre water main broke, making it unsafe to drink the city’s water without first boiling it. With 230 kph winds as it made landfall, Katrina left more than a million people in three states without power and flooded highways hundreds of kilometres from the centre of the storm. • Ports and harbours were wrecked and bridges destroyed. = Main track of Hurricane Katrina 0 200 km 61 – 120 kph winds 61 – 120 61 – 120 kph kph winds winds 61 – 120 kph winds Over 120 kph Over 120 kph winds winds Over 120 kph winds US STATE LOUISIANA US STATE Key N Fig. 6 (i) Identify the state where the main track of Hurricane Katrina reached land. [1] (ii) Identify two states where the wind speeds hit the coast at speeds of over 120 kilometres per hour. [2] (iii) Describe three different ways in which the hurricane affected the transport infrastructure. [3] (iv) Suggest reasons why the people who lived in New Orleans had to leave the city. [4]
Question paper, page 10
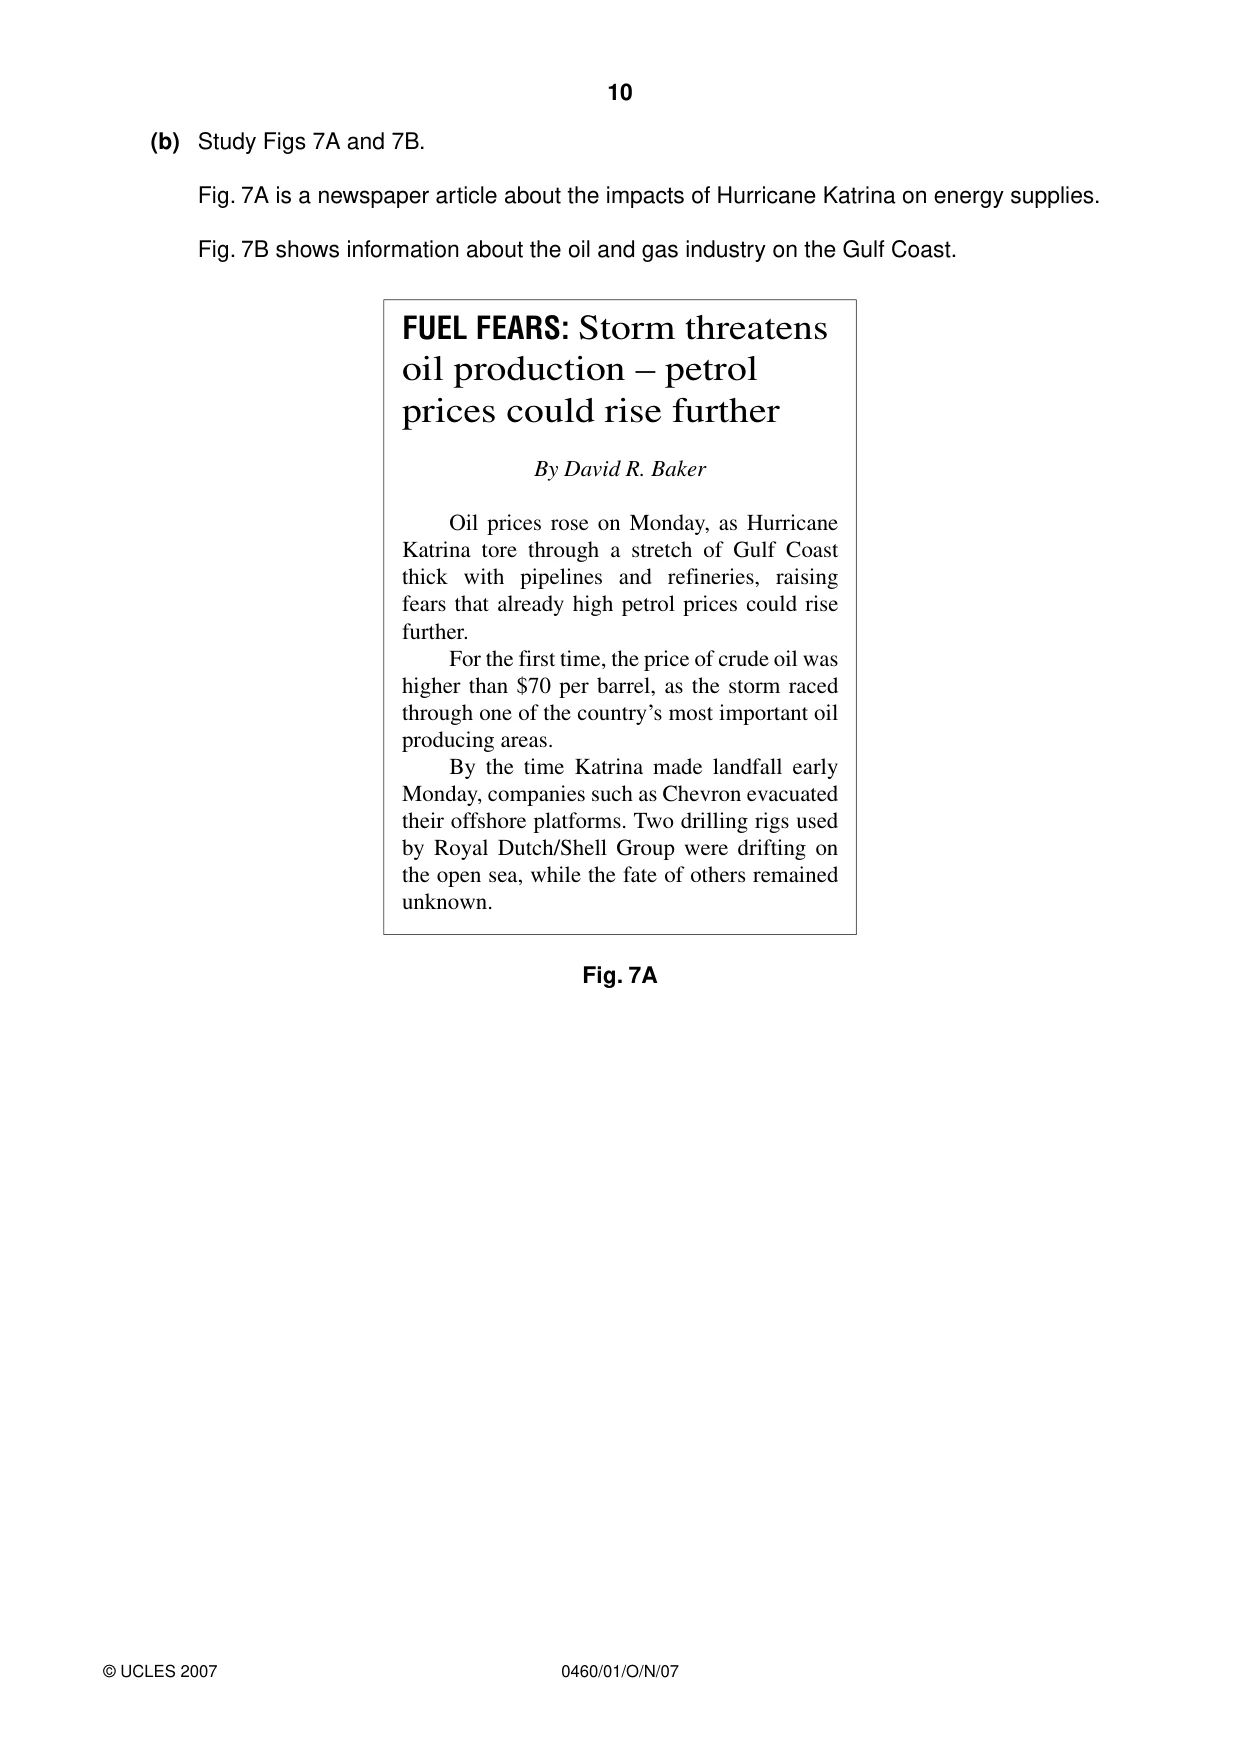
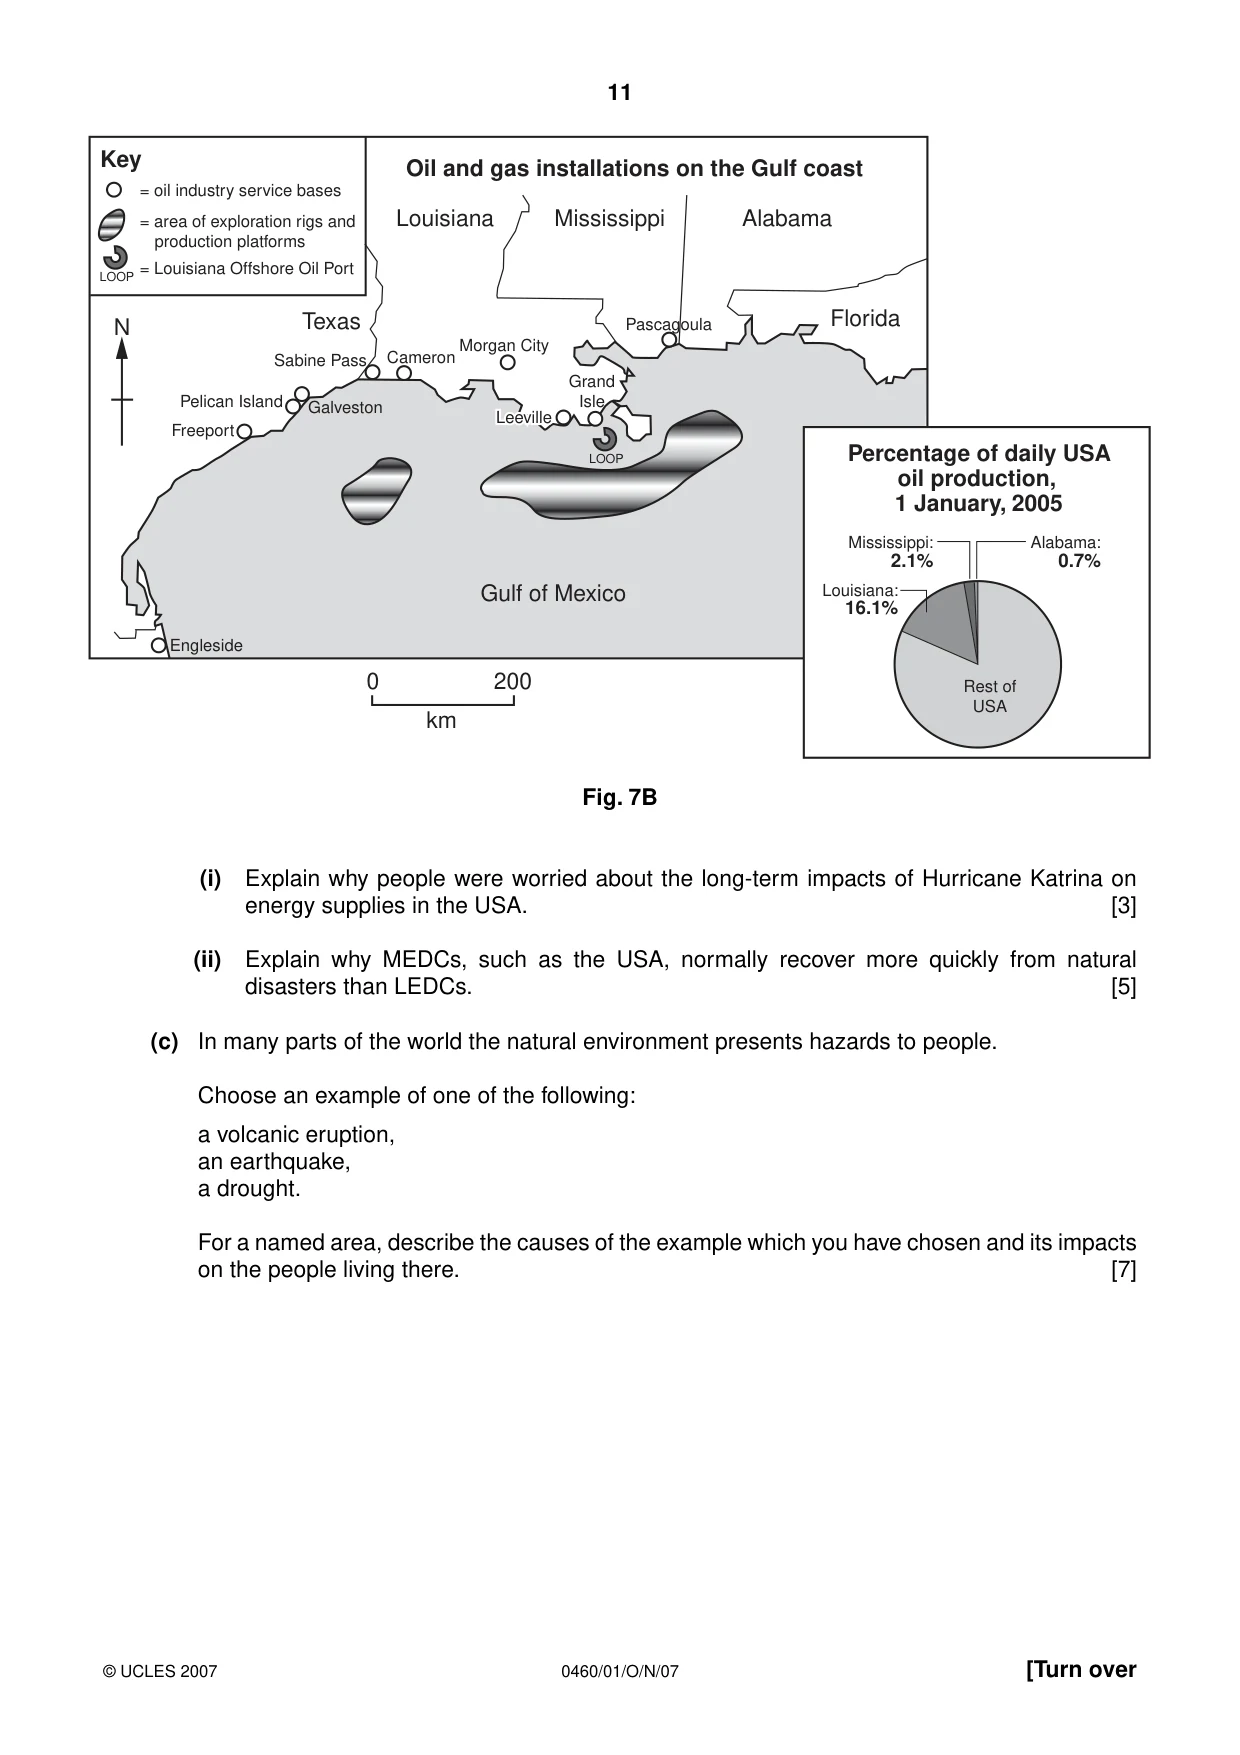
10 0460/01/O/N/07 © UCLES 2007 (b) Study Figs 7A and 7B. Fig. 7A is a newspaper article about the impacts of Hurricane Katrina on energy supplies. Fig. 7B shows information about the oil and gas industry on the Gulf Coast. FUEL FEARS: Storm threatens oil production – petrol prices could rise further By David R. Baker Oil prices rose on Monday, as Hurricane Katrina tore through a stretch of Gulf Coast thick with pipelines and refineries, raising fears that already high petrol prices could rise further. For the first time, the price of crude oil was higher than $70 per barrel, as the storm raced through one of the countryʼs most important oil producing areas. By the time Katrina made landfall early Monday, companies such as Chevron evacuated their offshore platforms. Two drilling rigs used by Royal Dutch/Shell Group were drifting on the open sea, while the fate of others remained unknown. Fig. 7A
Question paper, page 11
11 0460/01/O/N/07 © UCLES 2007 [Turn over Engleside Freeport Pelican Island Galveston Sabine Pass Cameron Grand Isle Pascagoula Morgan City Leeville Leeville Texas Louisiana Mississippi Gulf of Mexico 0 200 km Alabama Key = oil industry service bases = area of exploration rigs and production platforms = Louisiana Offshore Oil Port LOOP LOOP Oil and gas installations on the Gulf coast Florida Leeville Percentage of daily USA oil production, 1 January, 2005 Alabama: 0.7% Rest of USA Mississippi: 2.1% Louisiana: 16.1% N Fig. 7B (i) Explain why people were worried about the long-term impacts of Hurricane Katrina on energy supplies in the USA. [3] (ii) Explain why MEDCs, such as the USA, normally recover more quickly from natural disasters than LEDCs. [5] (c) In many parts of the world the natural environment presents hazards to people. Choose an example of one of the following: a volcanic eruption, an earthquake, a drought. For a named area, describe the causes of the example which you have chosen and its impacts on the people living there. [7]
Question paper, page 12
12 0460/01/O/N/07 © UCLES 2007 5 (a) Study Fig. 8 (Insert), a map showing information about food consumption in different parts of the world. (i) Name a continent where most countries have an average daily consumption of more than 3000 calories per person. [1] (ii) Countries with a low average calorie intake may suffer food shortages. Describe the distribution of countries which have an average daily consumption of less than 2500 calories per person. [2] (iii) Explain how food shortages can be caused by: A the natural environment, [3] B economic and political factors. [4]
Question paper, page 13
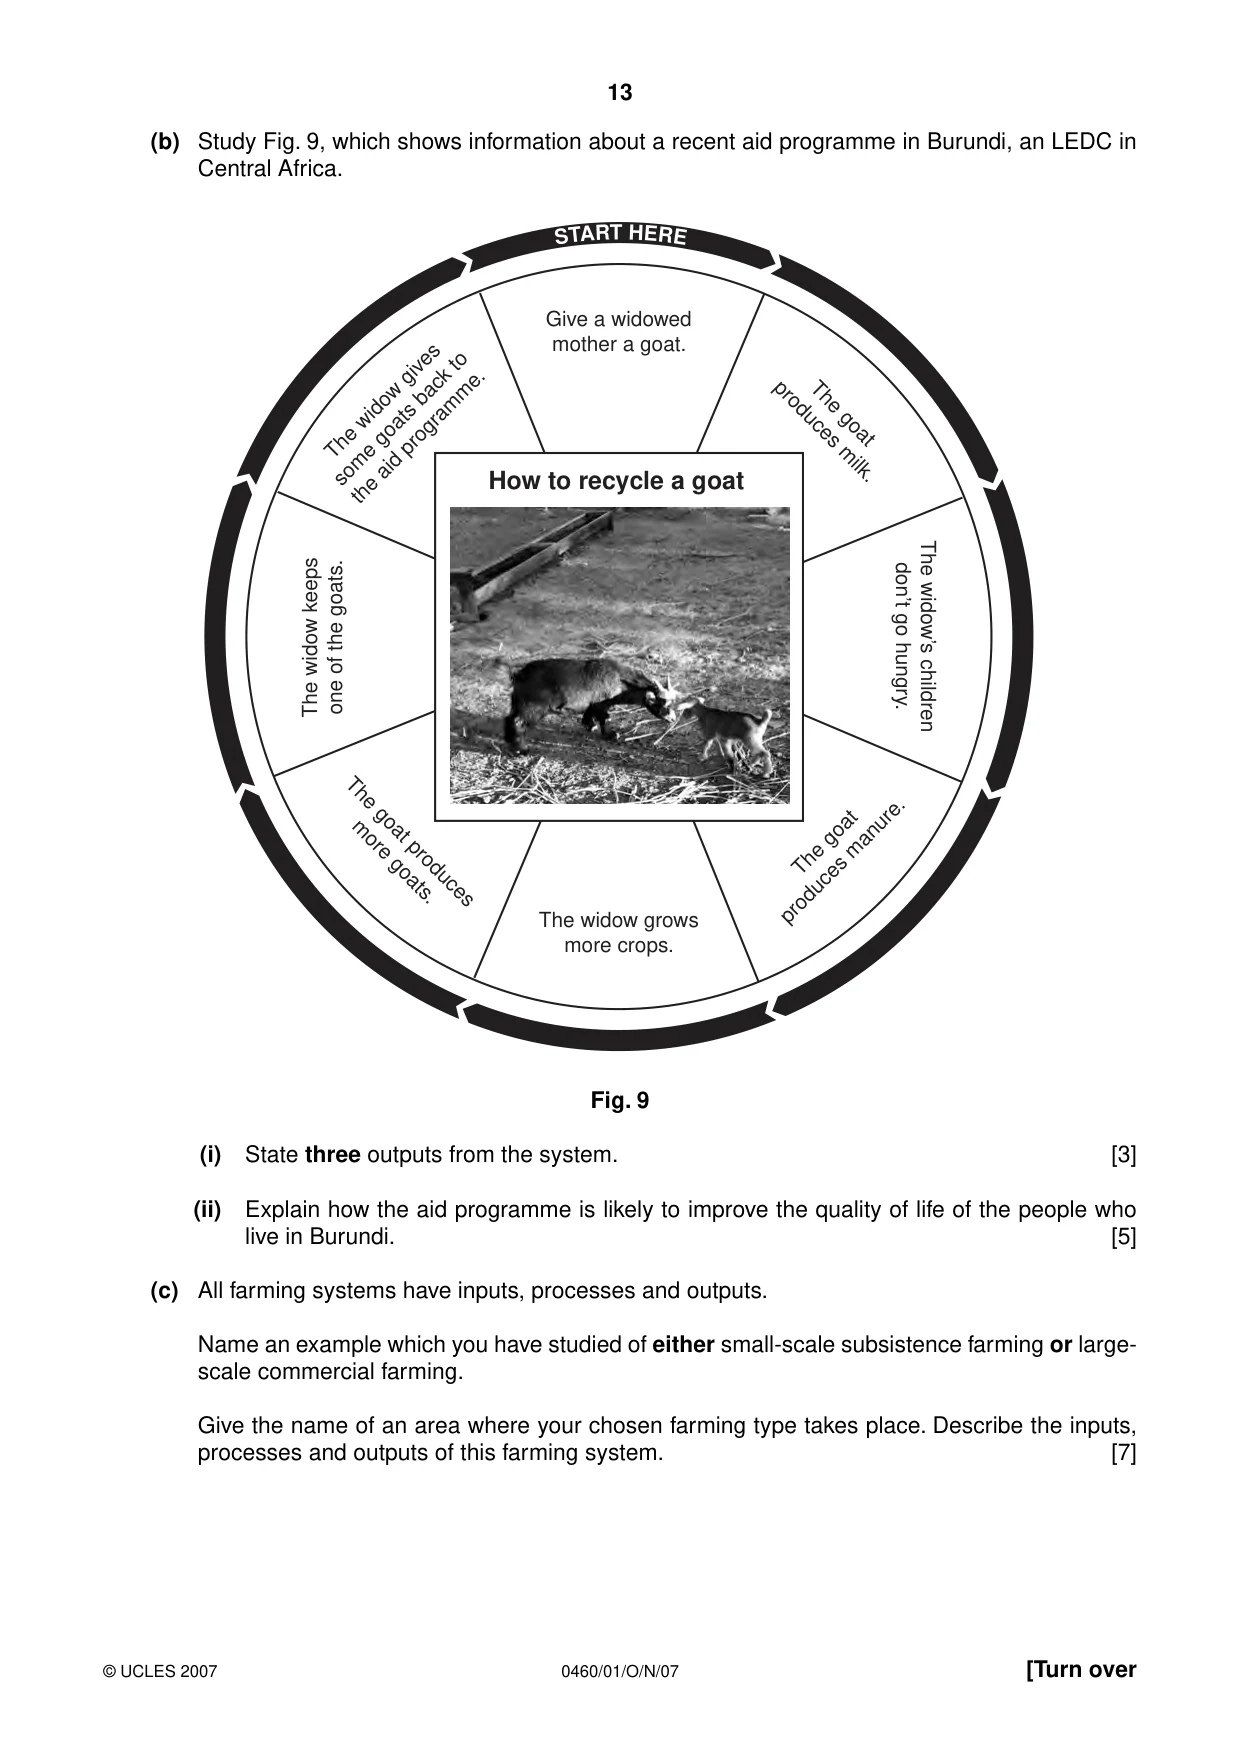
13 0460/01/O/N/07 © UCLES 2007 [Turn over (b) Study Fig. 9, which shows information about a recent aid programme in Burundi, an LEDC in Central Africa. ST AR T HE RE Give a widowed mother a goat. The widow grows more crops. The widow gives some goats back to the aid programme. The goat produces manure. The goat produces milk. The goat produces more goats. The widow’s children don’t go hungry. The widow keeps one of the goats. How to recycle a goat Fig. 9 (i) State three outputs from the system. [3] (ii) Explain how the aid programme is likely to improve the quality of life of the people who live in Burundi. [5] (c) All farming systems have inputs, processes and outputs. Name an example which you have studied of either small-scale subsistence farming or large- scale commercial farming. Give the name of an area where your chosen farming type takes place. Describe the inputs, processes and outputs of this farming system. [7]
Question paper, page 14
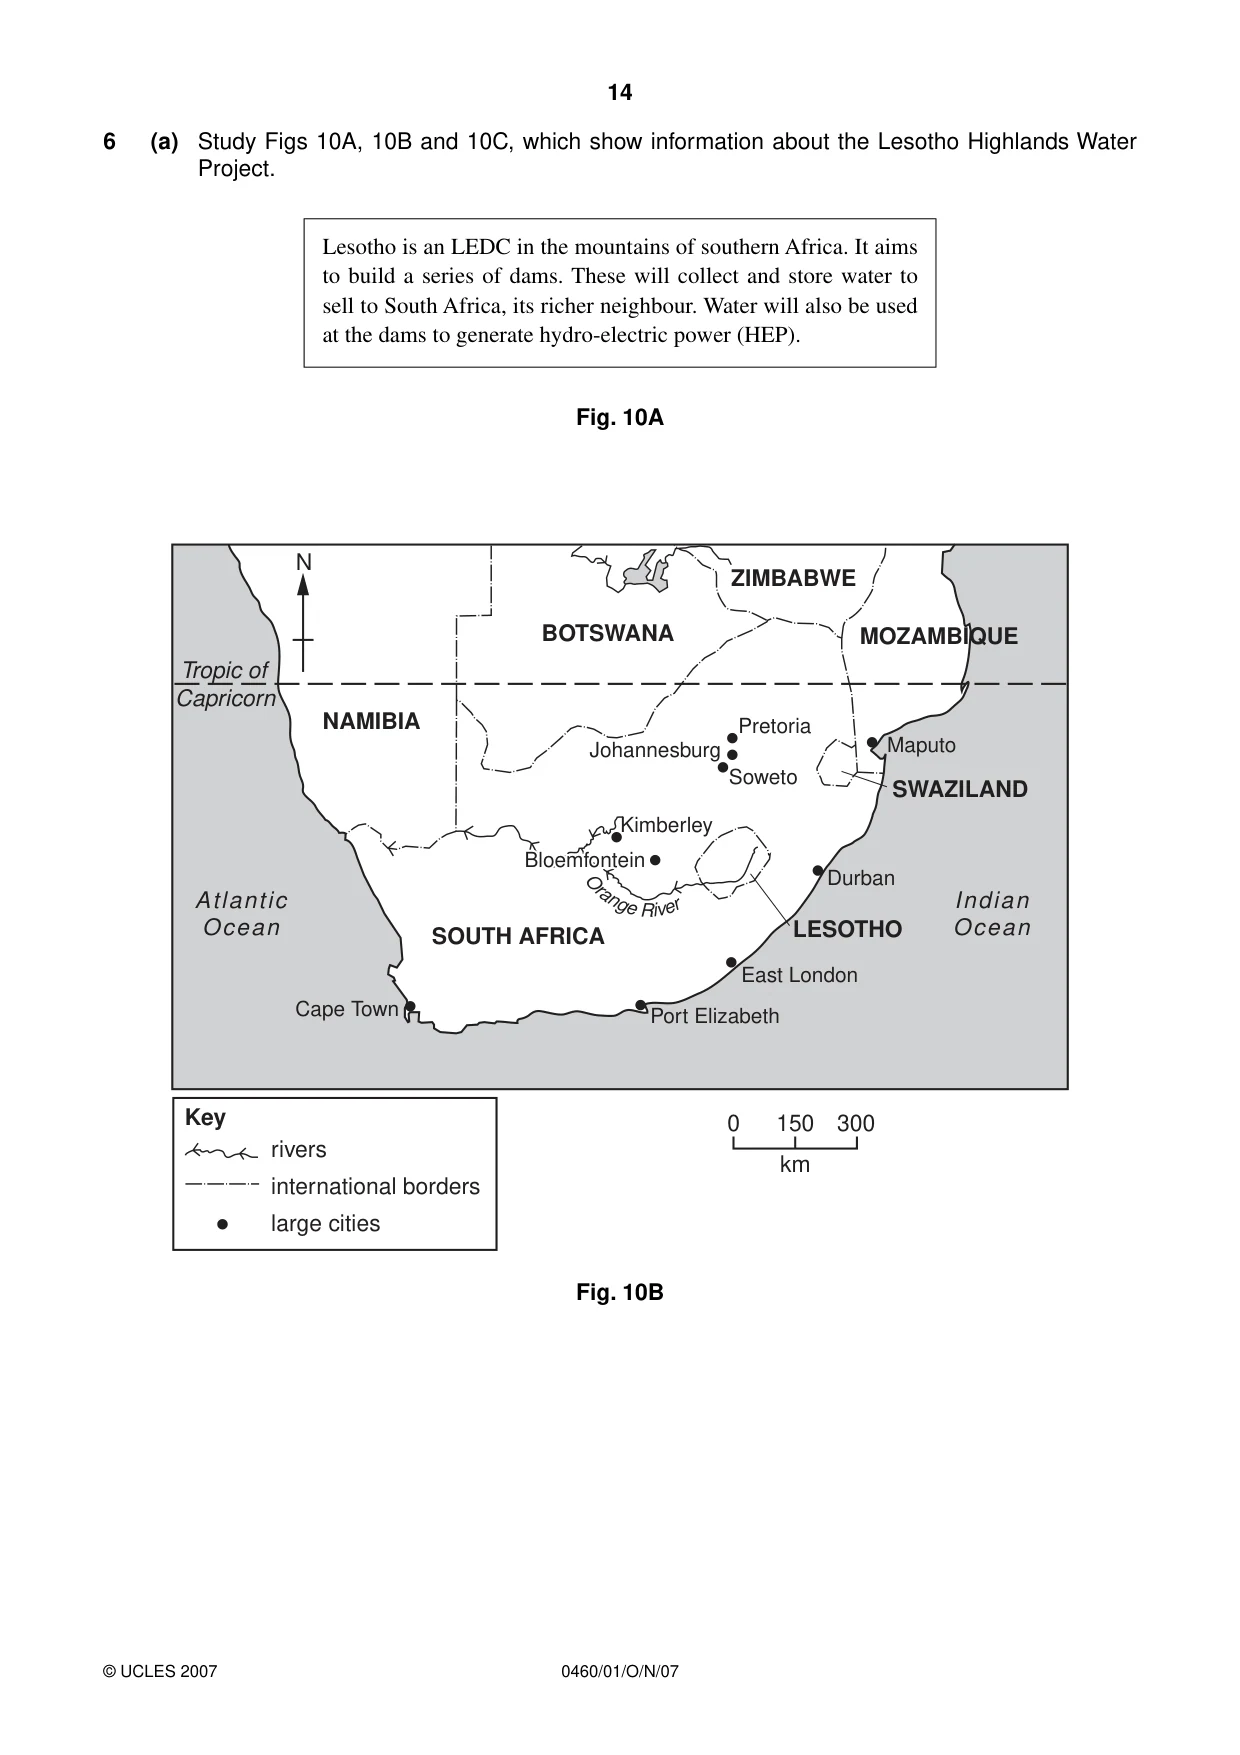
14 0460/01/O/N/07 © UCLES 2007 6 (a) Study Figs 10A, 10B and 10C, which show information about the Lesotho Highlands Water Project. Lesotho is an LEDC in the mountains of southern Africa. It aims to build a series of dams. These will collect and store water to sell to South Africa, its richer neighbour. Water will also be used at the dams to generate hydro-electric power (HEP). Fig. 10A N NAMIBIA BOTSWANA SWAZILAND MOZAMBIQUE SOUTH AFRICA ZIMBABWE Tropic of Capricorn Atlantic Ocean Indian Ocean Cape Town Johannesburg Port Elizabeth East London Durban Maputo Soweto Bloemfontein Bloemfontein Kimberley Pretoria LESOTHO O r a n g e R i v e r Bloemfontein 0 150 km 300 Key rivers international borders large cities Fig. 10B
Question paper, page 15
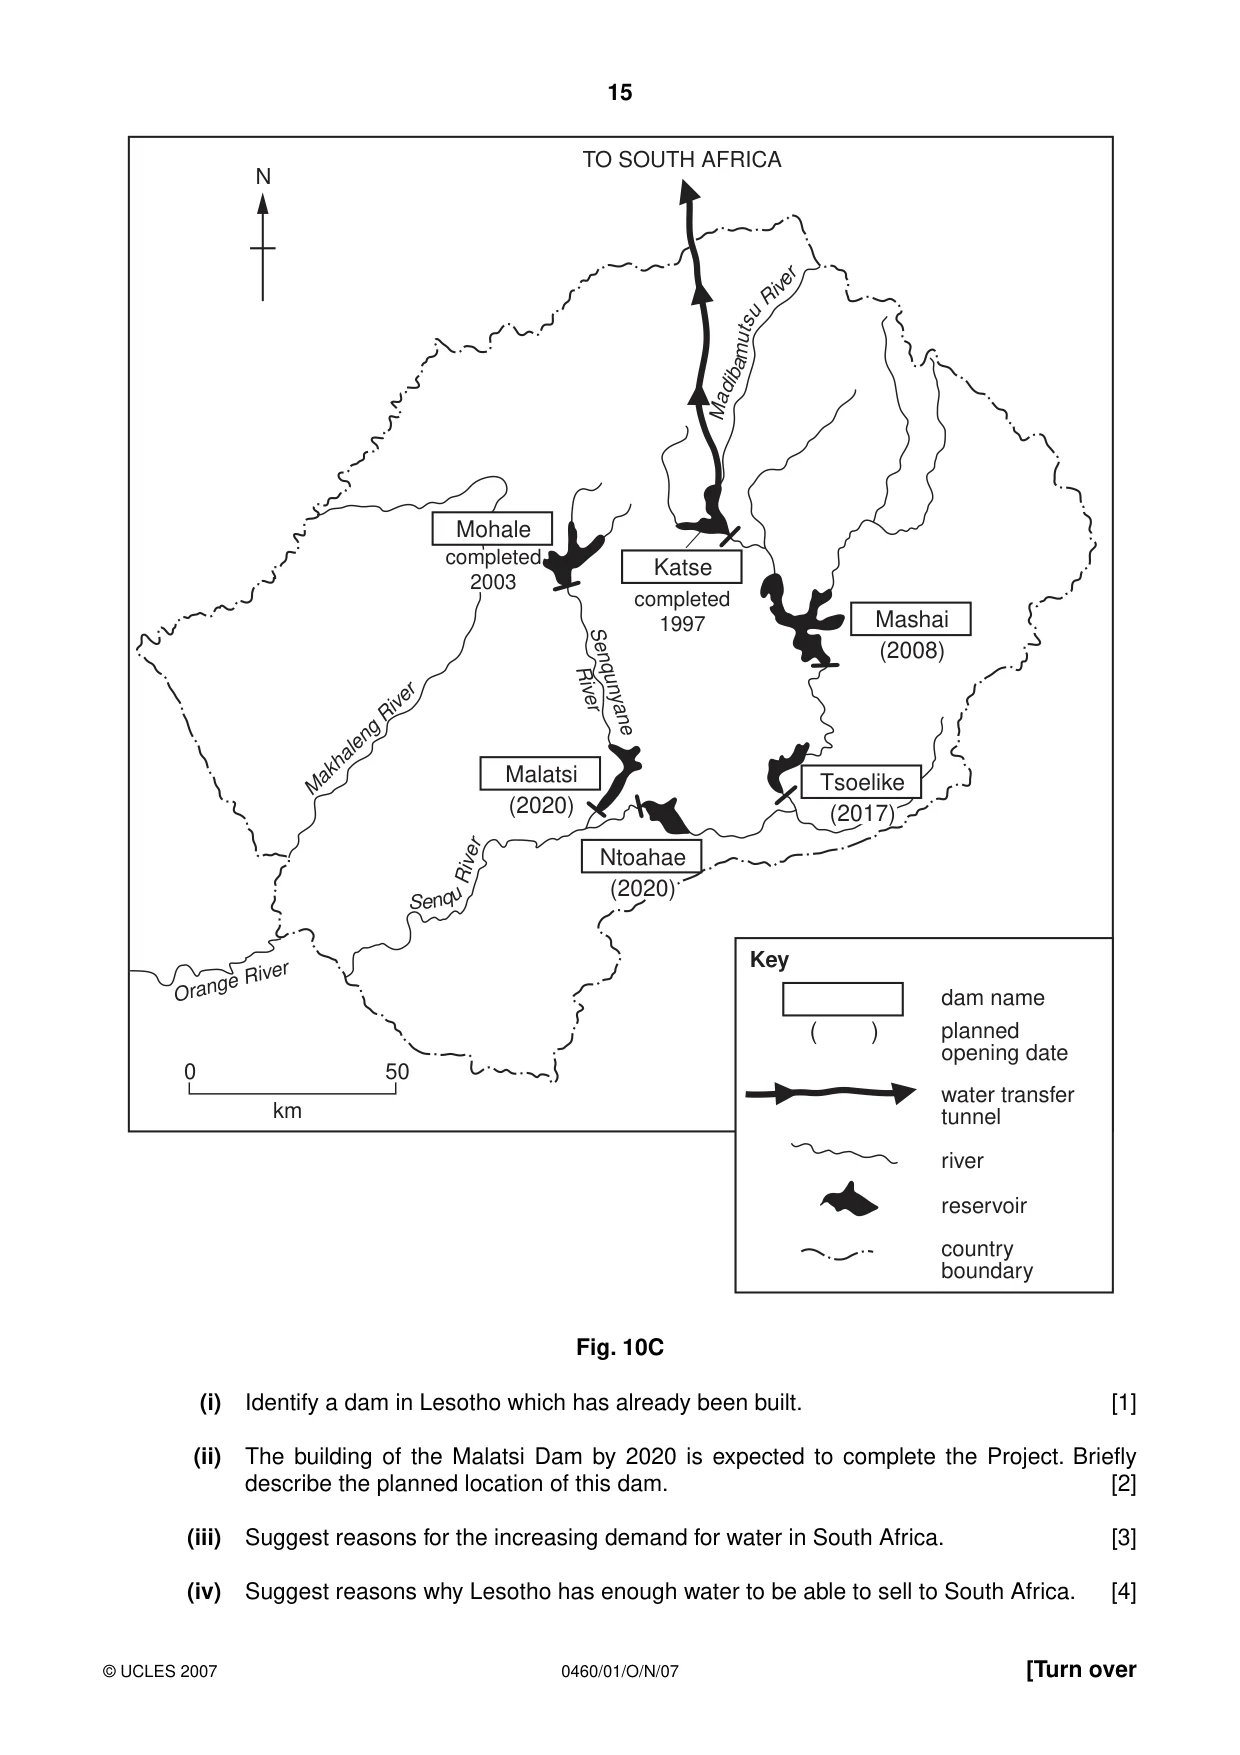
15 0460/01/O/N/07 © UCLES 2007 [Turn over 0 km 50 Orange River Makhaleng River completed 2003 Katse completed 1997 Mashai (2008) Malatsi (2020) ( ) Ntoahae (2020) Senqunyane River N TO SOUTH AFRICA Key dam name planned opening date water transfer tunnel river reservoir country boundary Mohale S e nq u Ri v e r M a dib a m u t s u Ri v e r Tsoelike (2017) Fig. 10C (i) Identify a dam in Lesotho which has already been built. [1] (ii) The building of the Malatsi Dam by 2020 is expected to complete the Project. Briefly describe the planned location of this dam. [2] (iii) Suggest reasons for the increasing demand for water in South Africa. [3] (iv) Suggest reasons why Lesotho has enough water to be able to sell to South Africa. [4]
Question paper, page 16
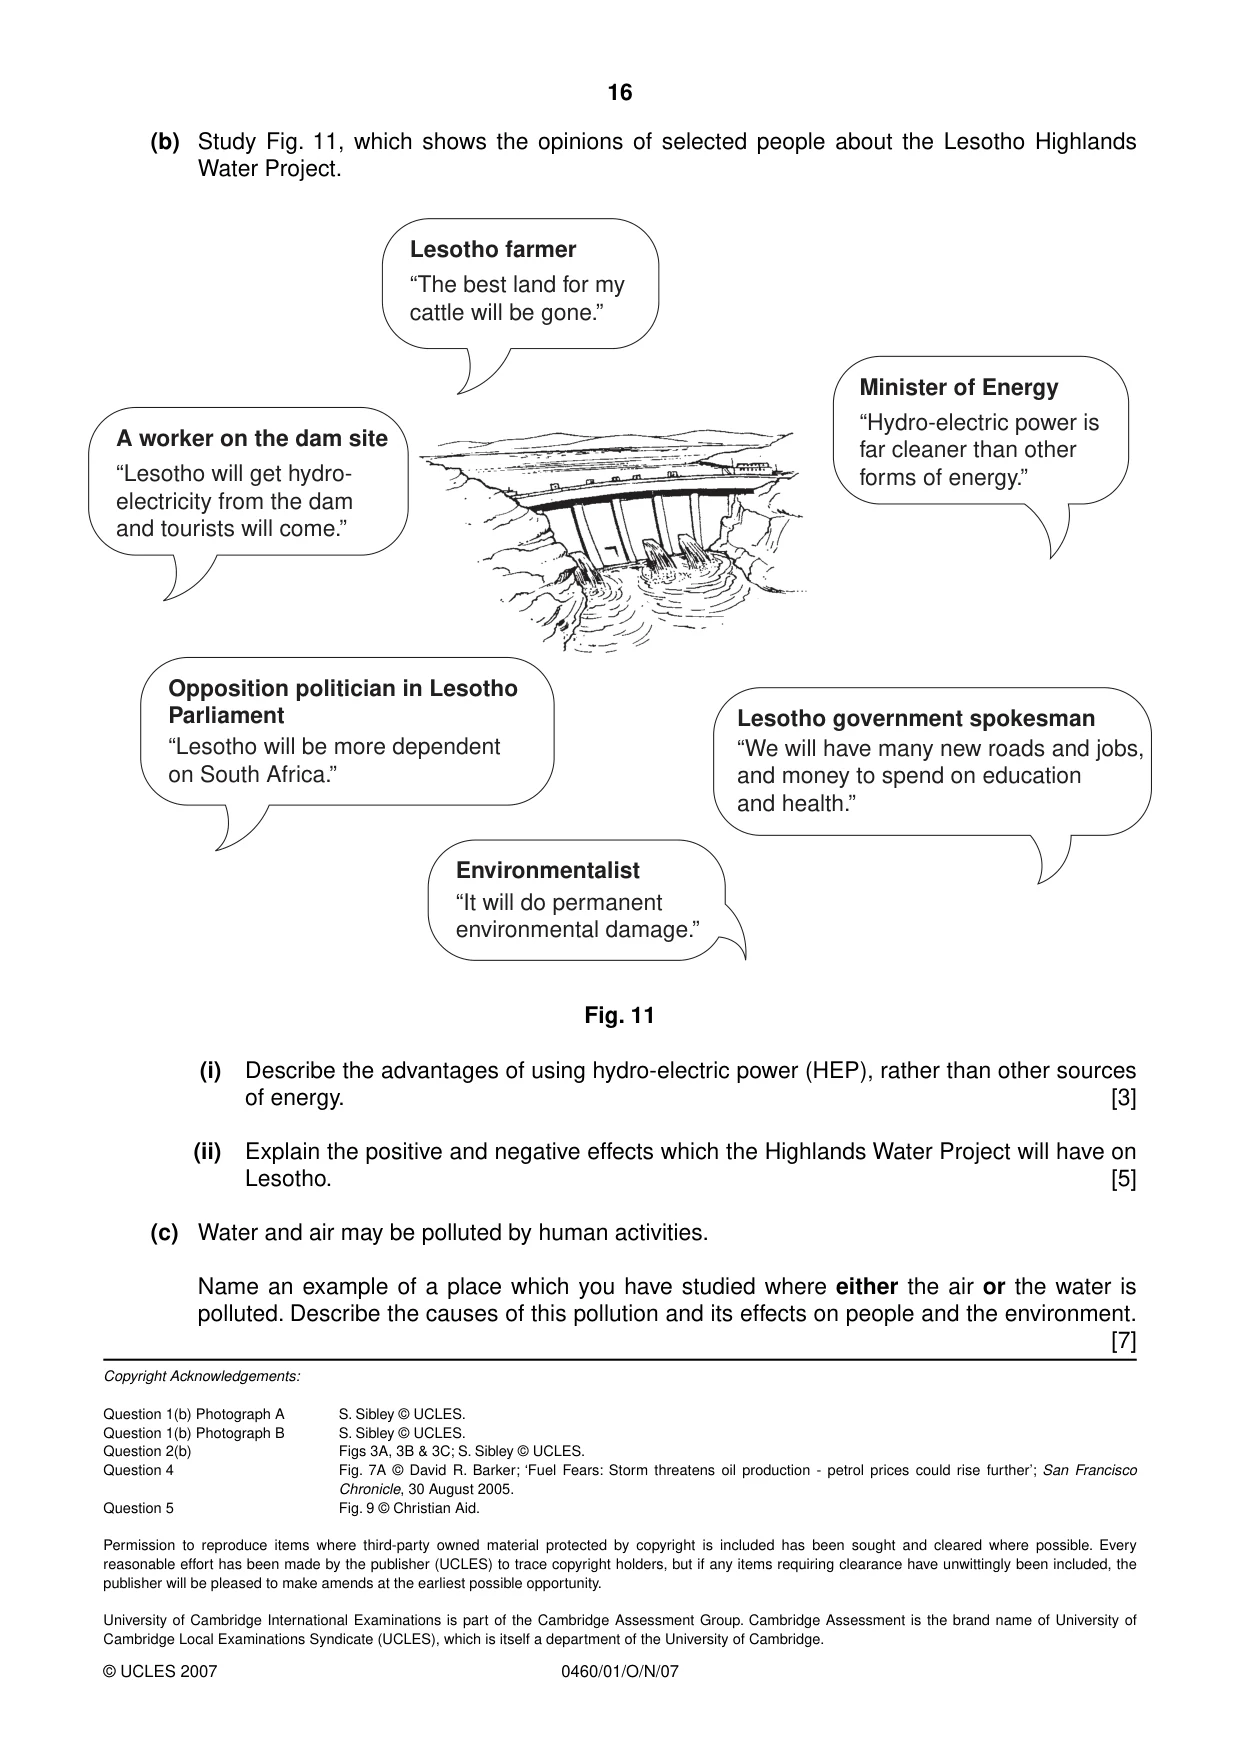
16 0460/01/O/N/07 © UCLES 2007 (b) Study Fig. 11, which shows the opinions of selected people about the Lesotho Highlands Water Project. Opposition politician in Lesotho Parliament “Lesotho will be more dependent on South Africa.” A worker on the dam site “Lesotho will get hydro- electricity from the dam and tourists will come.” Lesotho farmer “The best land for my cattle will be gone.” Minister of Energy “Hydro-electric power is far cleaner than other forms of energy.” Lesotho government spokesman “We will have many new roads and jobs, and money to spend on education and health.” Environmentalist “It will do permanent environmental damage.” Fig. 11 (i) Describe the advantages of using hydro-electric power (HEP), rather than other sources of energy. [3] (ii) Explain the positive and negative effects which the Highlands Water Project will have on Lesotho. [5] (c) Water and air may be polluted by human activities. Name an example of a place which you have studied where either the air or the water is polluted. Describe the causes of this pollution and its effects on people and the environment. [7] Copyright Acknowledgements: Question 1(b) Photograph A S. Sibley © UCLES. Question 1(b) Photograph B S. Sibley © UCLES. Question 2(b) Figs 3A, 3B & 3C; S. Sibley © UCLES. Question 4 Fig. 7A © David R. Barker; ‘Fuel Fears: Storm threatens oil production - petrol prices could rise further’; San Francisco Chronicle, 30 August 2005. Question 5 Fig. 9 © Christian Aid. Permission to reproduce items where third-party owned material protected by copyright is included has been sought and cleared where possible. Every reasonable effort has been made by the publisher (UCLES) to trace copyright holders, but if any items requiring clearance have unwittingly been included, the publisher will be pleased to make amends at the earliest possible opportunity. University of Cambridge International Examinations is part of the Cambridge Assessment Group. Cambridge Assessment is the brand name of University of Cambridge Local Examinations Syndicate (UCLES), which is itself a department of the University of Cambridge.
Mark scheme, page 1
UNIVERSITY OF CAMBRIDGE INTERNATIONAL EXAMINATIONS International General Certificate of Secondary Education MARK SCHEME for the October/November 2007 question paper 0460 GEOGRAPHY 0460/01 Paper 1, maximum raw mark 75 This mark scheme is published as an aid to teachers and candidates, to indicate the requirements of the examination. It shows the basis on which Examiners were instructed to award marks. It does not indicate the details of the discussions that took place at an Examiners’ meeting before marking began. All Examiners are instructed that alternative correct answers and unexpected approaches in candidates’ scripts must be given marks that fairly reflect the relevant knowledge and skills demonstrated. Mark schemes must be read in conjunction with the question papers and the report on the examination. • CIE will not enter into discussions or correspondence in connection with these mark schemes. CIE is publishing the mark schemes for the October/November 2007 question papers for most IGCSE, GCE Advanced Level and Advanced Subsidiary Level syllabuses and some Ordinary Level syllabuses. www.XtremePapers.com
Mark scheme, page 2
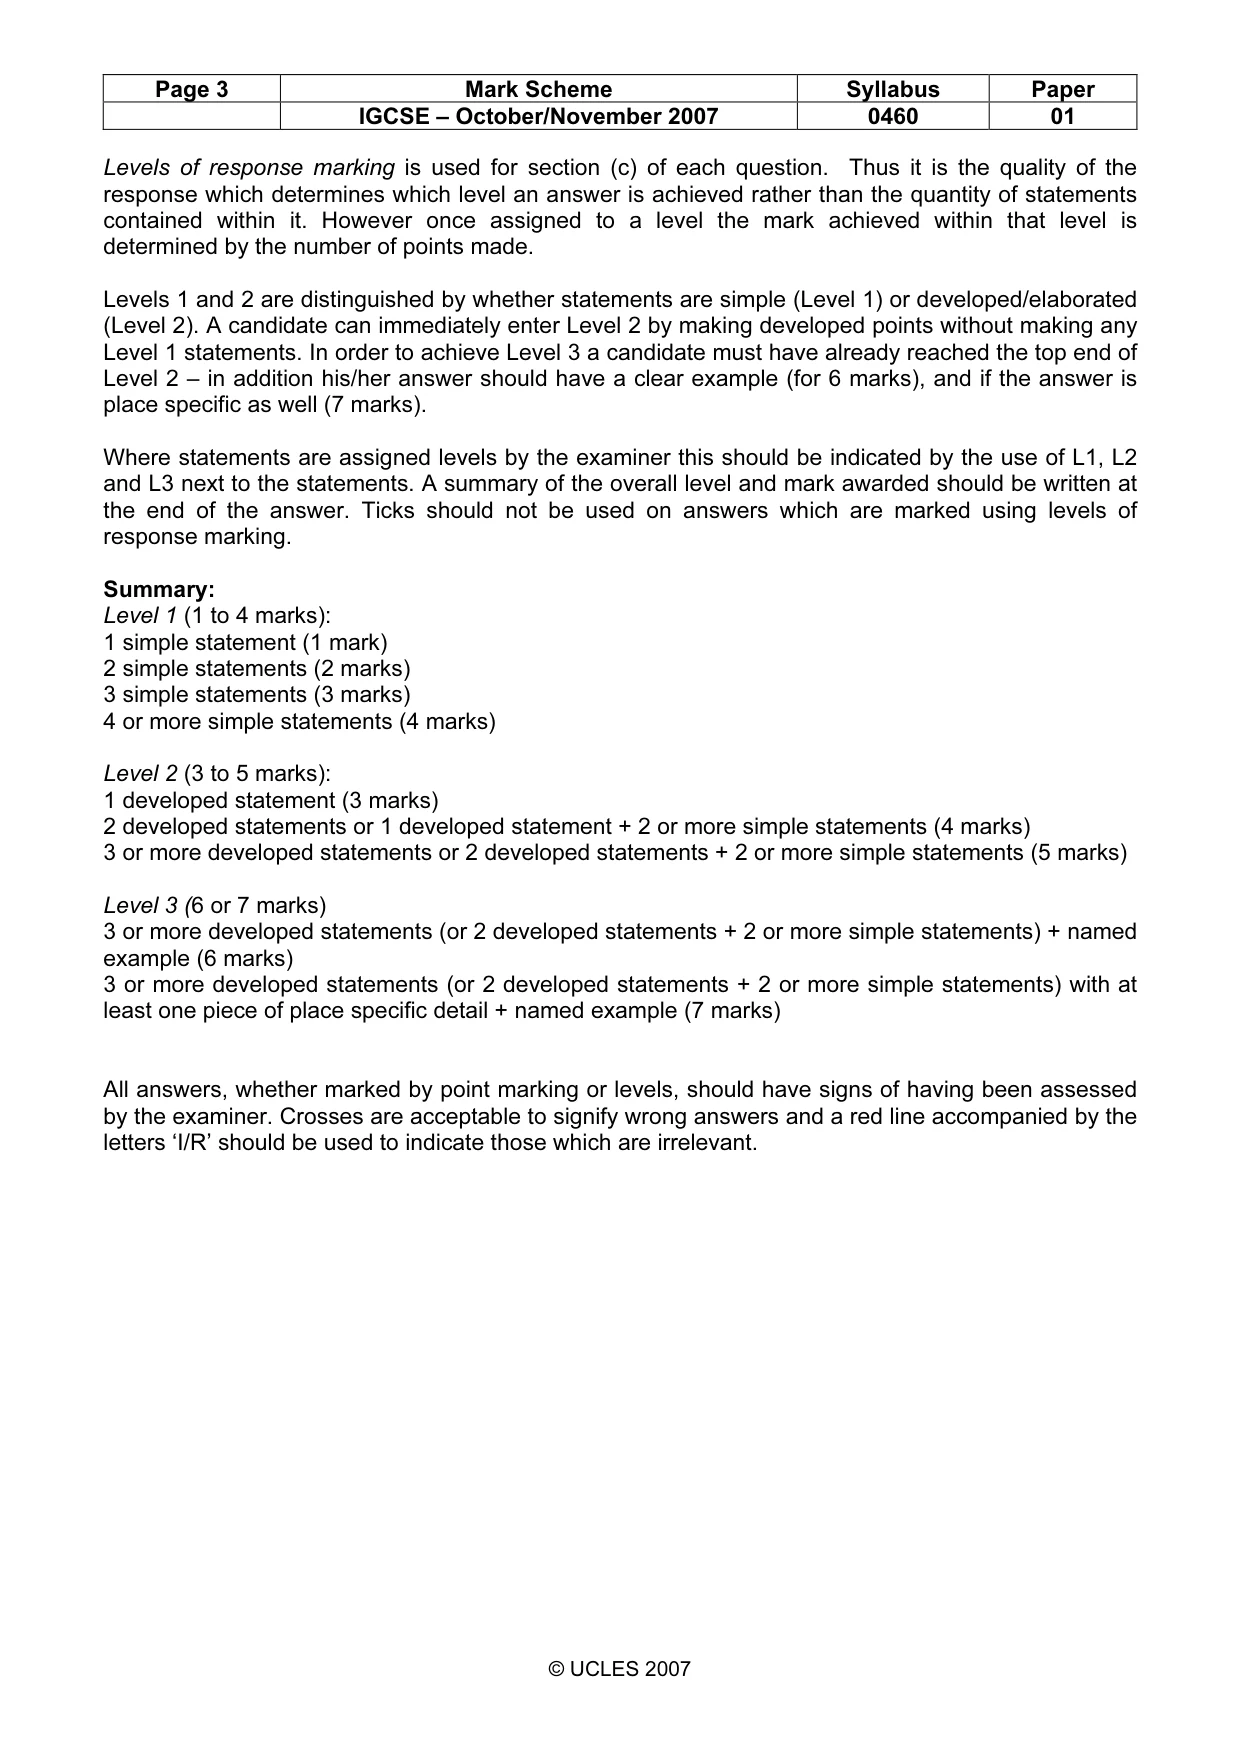
Page 2 Mark Scheme Syllabus Paper IGCSE – October/November 2007 0460 01 © UCLES 2007 The features of the mark scheme Each question carries 25 marks. Candidates cannot earn above the maximum marks available within each sub section. The mark scheme attempts to give guidance about the requirements of each answer and lists a number of responses which will earn marks along with the general principles to be applied when marking each question. It should be noted that candidates can earn marks if their answers are phrased differently provided they convey the same meaning as those in the mark scheme. THE CANDIDATES DO NOT NEED TO USE THE SAME WORDING TO EARN MARKS. The notation ‘etc.’ at the end of an answer in the mark scheme signifies that there may well be other correct responses or examples that can be given credit. Providing the statement is true, relevant to the question asked and not repetition of a previous point made credit should be given. A point made within one sub-section which is an answer to the question set in a different sub-section should not be given credit as each sub-section asks different questions which require independent answers. The mark scheme uses semi colons (;) to separate marks and diagonals to separate alternative answers. Marking mechanics. Point marking is used for sections (a) and (b) of each question, although marks are available in specified questions for development of appropriate points. Ticks should be used to clearly indicate the wording on a script where a mark has been allowed. Where a development point has been allowed the letter ‘D’ should be placed adjacent to the tick. The number of ticks should always be equal to the total number of marks awarded, the mark for each sub-section should be added up and placed in the margin at the end of the sub-section. The total mark for the entire question should be added and transferred to the front of the script. Where a candidate makes a point which is not quite sufficient for credit an upturned ‘V’ insert symbol should be used. If after careful consideration a mark is awarded which gives ‘benefit of doubt’ to the candidate the letter ‘J’ should be placed adjacent to the tick (i.e. the candidate has ‘just’ achieved the mark).
Mark scheme, page 3
Page 3 Mark Scheme Syllabus Paper IGCSE – October/November 2007 0460 01 © UCLES 2007 Levels of response marking is used for section (c) of each question. Thus it is the quality of the response which determines which level an answer is achieved rather than the quantity of statements contained within it. However once assigned to a level the mark achieved within that level is determined by the number of points made. Levels 1 and 2 are distinguished by whether statements are simple (Level 1) or developed/elaborated (Level 2). A candidate can immediately enter Level 2 by making developed points without making any Level 1 statements. In order to achieve Level 3 a candidate must have already reached the top end of Level 2 – in addition his/her answer should have a clear example (for 6 marks), and if the answer is place specific as well (7 marks). Where statements are assigned levels by the examiner this should be indicated by the use of L1, L2 and L3 next to the statements. A summary of the overall level and mark awarded should be written at the end of the answer. Ticks should not be used on answers which are marked using levels of response marking. Summary: Level 1 (1 to 4 marks): 1 simple statement (1 mark) 2 simple statements (2 marks) 3 simple statements (3 marks) 4 or more simple statements (4 marks) Level 2 (3 to 5 marks): 1 developed statement (3 marks) 2 developed statements or 1 developed statement + 2 or more simple statements (4 marks) 3 or more developed statements or 2 developed statements + 2 or more simple statements (5 marks) Level 3 (6 or 7 marks) 3 or more developed statements (or 2 developed statements + 2 or more simple statements) + named example (6 marks) 3 or more developed statements (or 2 developed statements + 2 or more simple statements) with at least one piece of place specific detail + named example (7 marks) All answers, whether marked by point marking or levels, should have signs of having been assessed by the examiner. Crosses are acceptable to signify wrong answers and a red line accompanied by the letters ‘I/R’ should be used to indicate those which are irrelevant.
Mark scheme, page 4
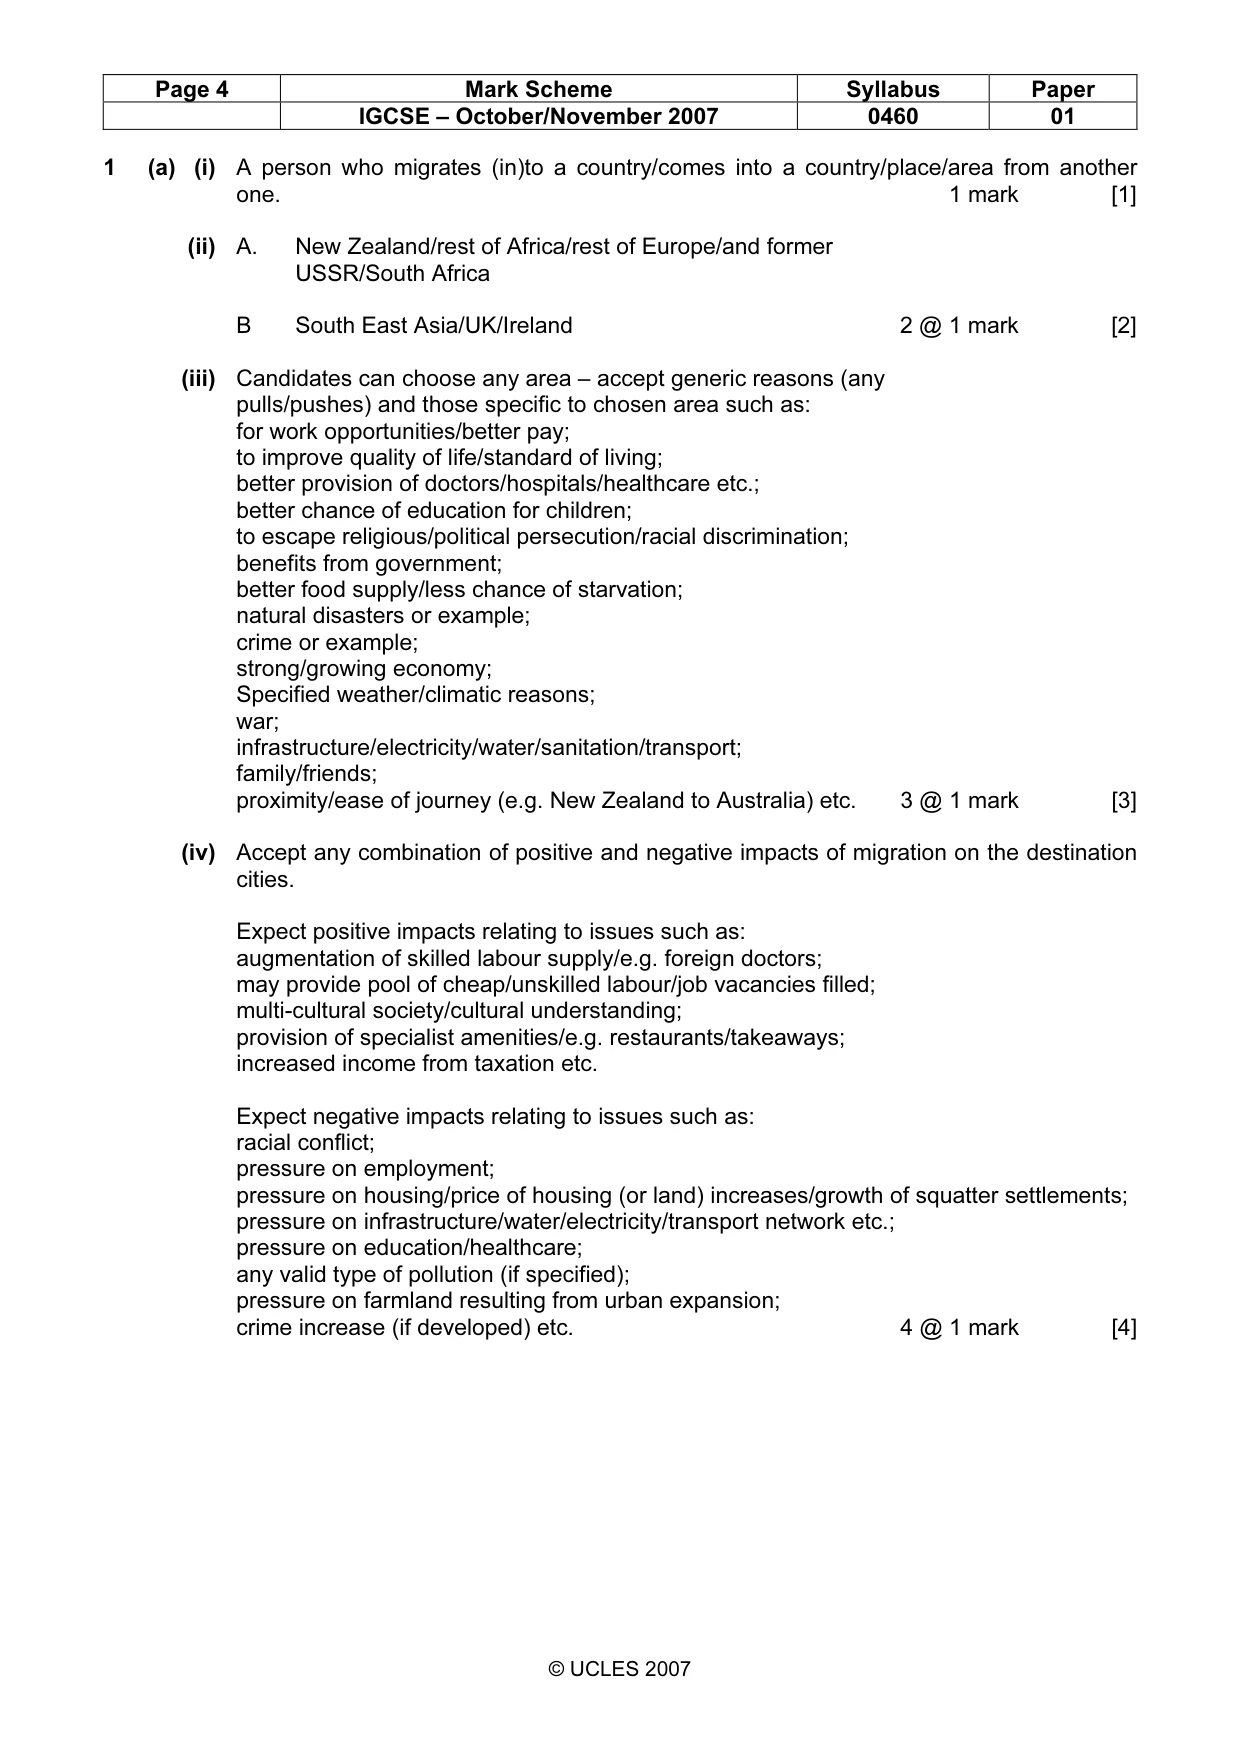
Page 4 Mark Scheme Syllabus Paper IGCSE – October/November 2007 0460 01 © UCLES 2007 1 (a) (i) A person who migrates (in)to a country/comes into a country/place/area from another one. 1 mark [1] (ii) A. New Zealand/rest of Africa/rest of Europe/and former USSR/South Africa B South East Asia/UK/Ireland 2 @ 1 mark [2] (iii) Candidates can choose any area – accept generic reasons (any pulls/pushes) and those specific to chosen area such as: for work opportunities/better pay; to improve quality of life/standard of living; better provision of doctors/hospitals/healthcare etc.; better chance of education for children; to escape religious/political persecution/racial discrimination; benefits from government; better food supply/less chance of starvation; natural disasters or example; crime or example; strong/growing economy; Specified weather/climatic reasons; war; infrastructure/electricity/water/sanitation/transport; family/friends; proximity/ease of journey (e.g. New Zealand to Australia) etc. 3 @ 1 mark [3] (iv) Accept any combination of positive and negative impacts of migration on the destination cities. Expect positive impacts relating to issues such as: augmentation of skilled labour supply/e.g. foreign doctors; may provide pool of cheap/unskilled labour/job vacancies filled; multi-cultural society/cultural understanding; provision of specialist amenities/e.g. restaurants/takeaways; increased income from taxation etc. Expect negative impacts relating to issues such as: racial conflict; pressure on employment; pressure on housing/price of housing (or land) increases/growth of squatter settlements; pressure on infrastructure/water/electricity/transport network etc.; pressure on education/healthcare; any valid type of pollution (if specified); pressure on farmland resulting from urban expansion; crime increase (if developed) etc. 4 @ 1 mark [4]
Mark scheme, page 5
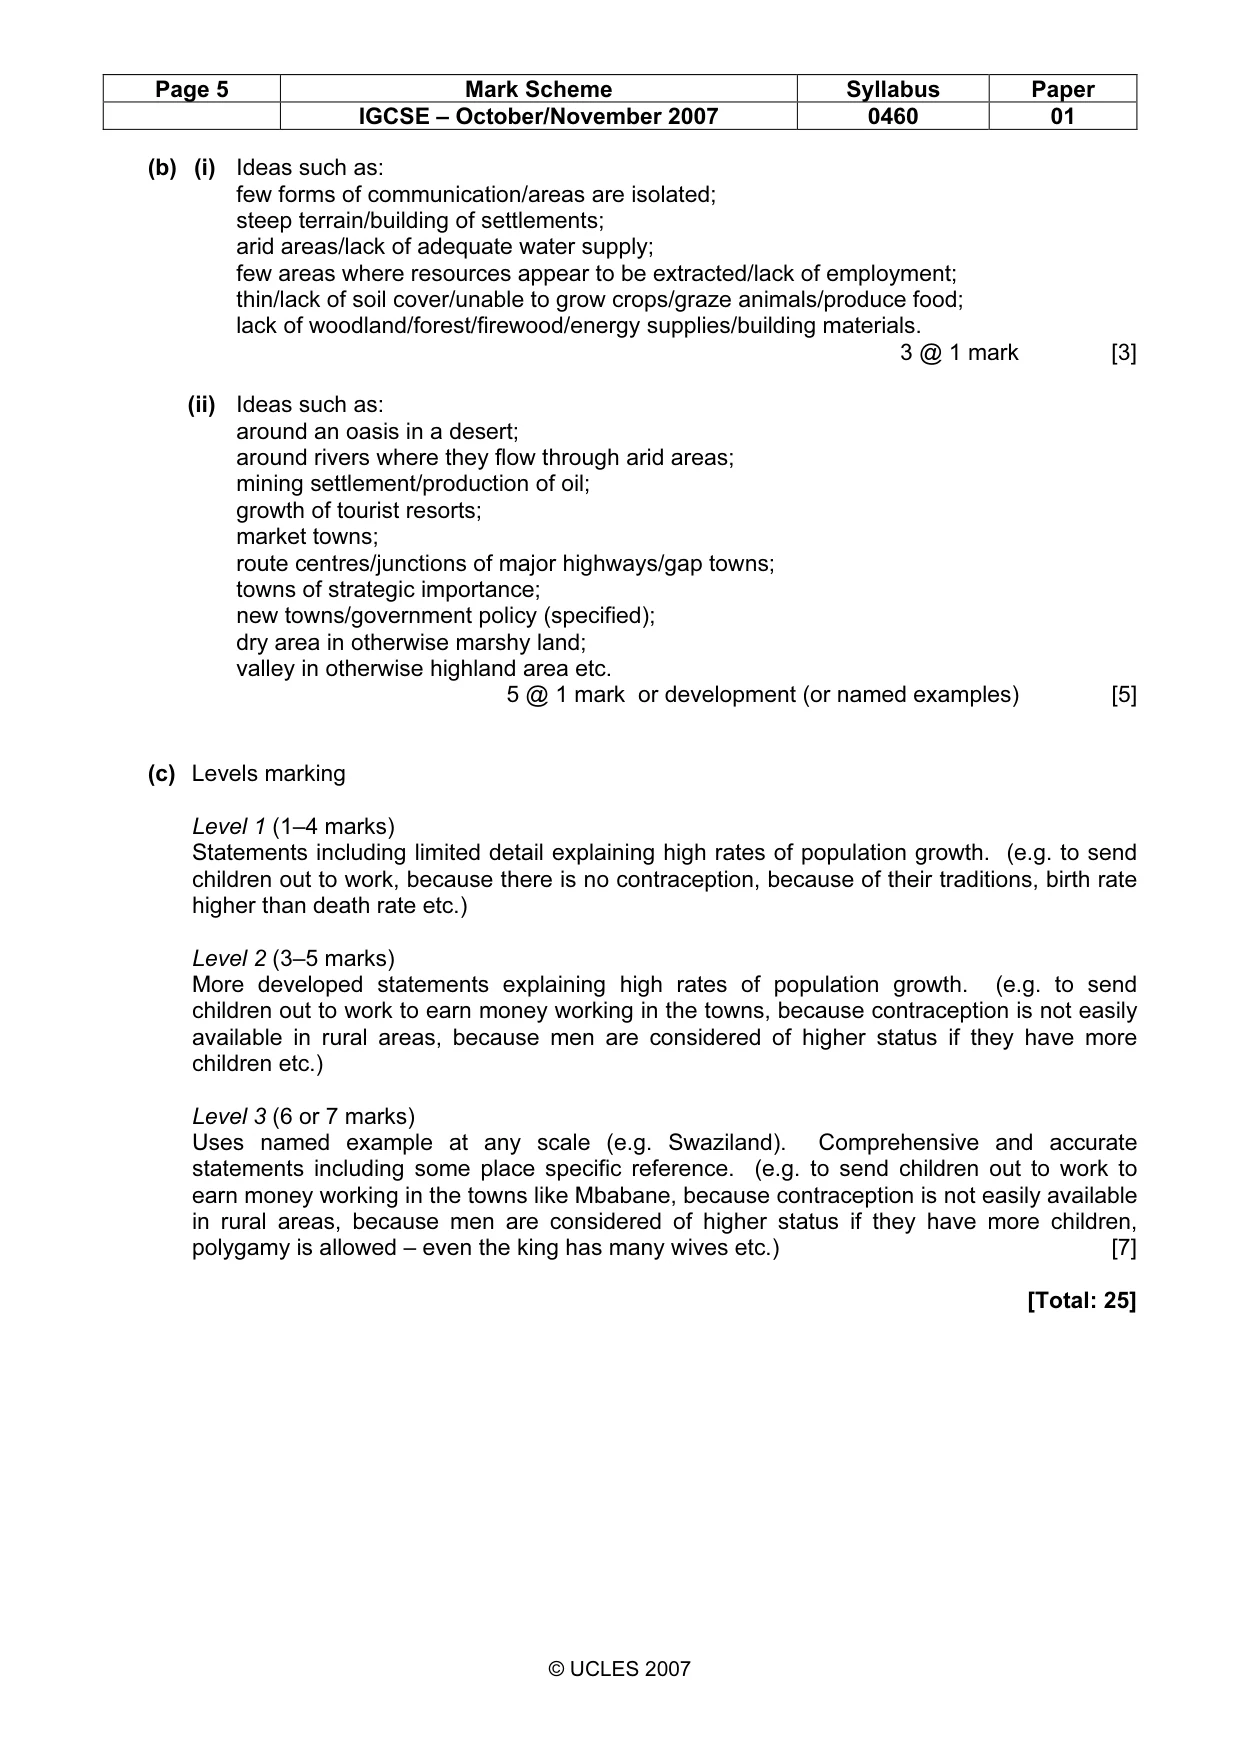
Page 5 Mark Scheme Syllabus Paper IGCSE – October/November 2007 0460 01 © UCLES 2007 (b) (i) Ideas such as: few forms of communication/areas are isolated; steep terrain/building of settlements; arid areas/lack of adequate water supply; few areas where resources appear to be extracted/lack of employment; thin/lack of soil cover/unable to grow crops/graze animals/produce food; lack of woodland/forest/firewood/energy supplies/building materials. 3 @ 1 mark [3] (ii) Ideas such as: around an oasis in a desert; around rivers where they flow through arid areas; mining settlement/production of oil; growth of tourist resorts; market towns; route centres/junctions of major highways/gap towns; towns of strategic importance; new towns/government policy (specified); dry area in otherwise marshy land; valley in otherwise highland area etc. 5 @ 1 mark or development (or named examples) [5] (c) Levels marking Level 1 (1–4 marks) Statements including limited detail explaining high rates of population growth. (e.g. to send children out to work, because there is no contraception, because of their traditions, birth rate higher than death rate etc.) Level 2 (3–5 marks) More developed statements explaining high rates of population growth. (e.g. to send children out to work to earn money working in the towns, because contraception is not easily available in rural areas, because men are considered of higher status if they have more children etc.) Level 3 (6 or 7 marks) Uses named example at any scale (e.g. Swaziland). Comprehensive and accurate statements including some place specific reference. (e.g. to send children out to work to earn money working in the towns like Mbabane, because contraception is not easily available in rural areas, because men are considered of higher status if they have more children, polygamy is allowed – even the king has many wives etc.) [7] [Total: 25]
Mark scheme, page 6
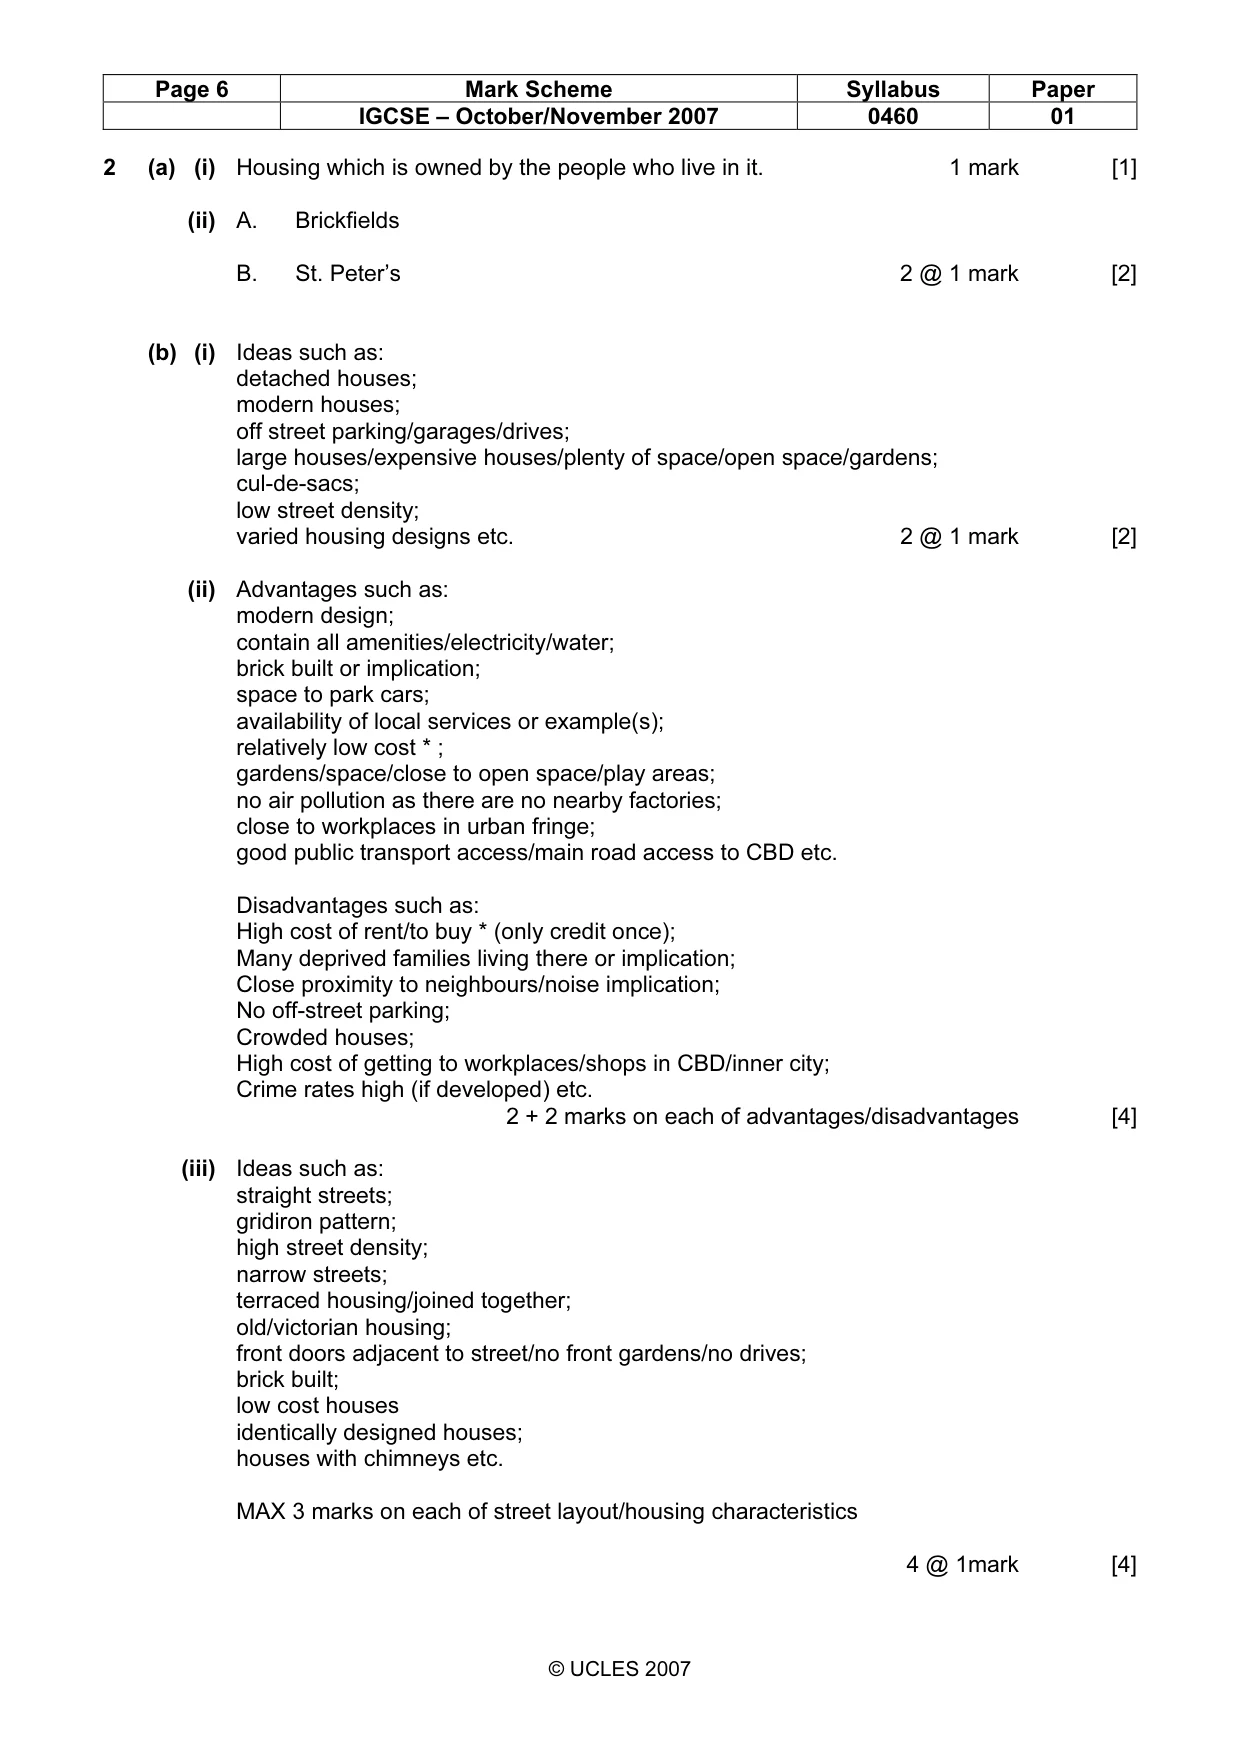
Page 6 Mark Scheme Syllabus Paper IGCSE – October/November 2007 0460 01 © UCLES 2007 2 (a) (i) Housing which is owned by the people who live in it. 1 mark [1] (ii) A. Brickfields B. St. Peter’s 2 @ 1 mark [2] (b) (i) Ideas such as: detached houses; modern houses; off street parking/garages/drives; large houses/expensive houses/plenty of space/open space/gardens; cul-de-sacs; low street density; varied housing designs etc. 2 @ 1 mark [2] (ii) Advantages such as: modern design; contain all amenities/electricity/water; brick built or implication; space to park cars; availability of local services or example(s); relatively low cost * ; gardens/space/close to open space/play areas; no air pollution as there are no nearby factories; close to workplaces in urban fringe; good public transport access/main road access to CBD etc. Disadvantages such as: High cost of rent/to buy * (only credit once); Many deprived families living there or implication; Close proximity to neighbours/noise implication; No off-street parking; Crowded houses; High cost of getting to workplaces/shops in CBD/inner city; Crime rates high (if developed) etc. 2 + 2 marks on each of advantages/disadvantages [4] (iii) Ideas such as: straight streets; gridiron pattern; high street density; narrow streets; terraced housing/joined together; old/victorian housing; front doors adjacent to street/no front gardens/no drives; brick built; low cost houses identically designed houses; houses with chimneys etc. MAX 3 marks on each of street layout/housing characteristics 4 @ 1mark [4]
Mark scheme, page 7
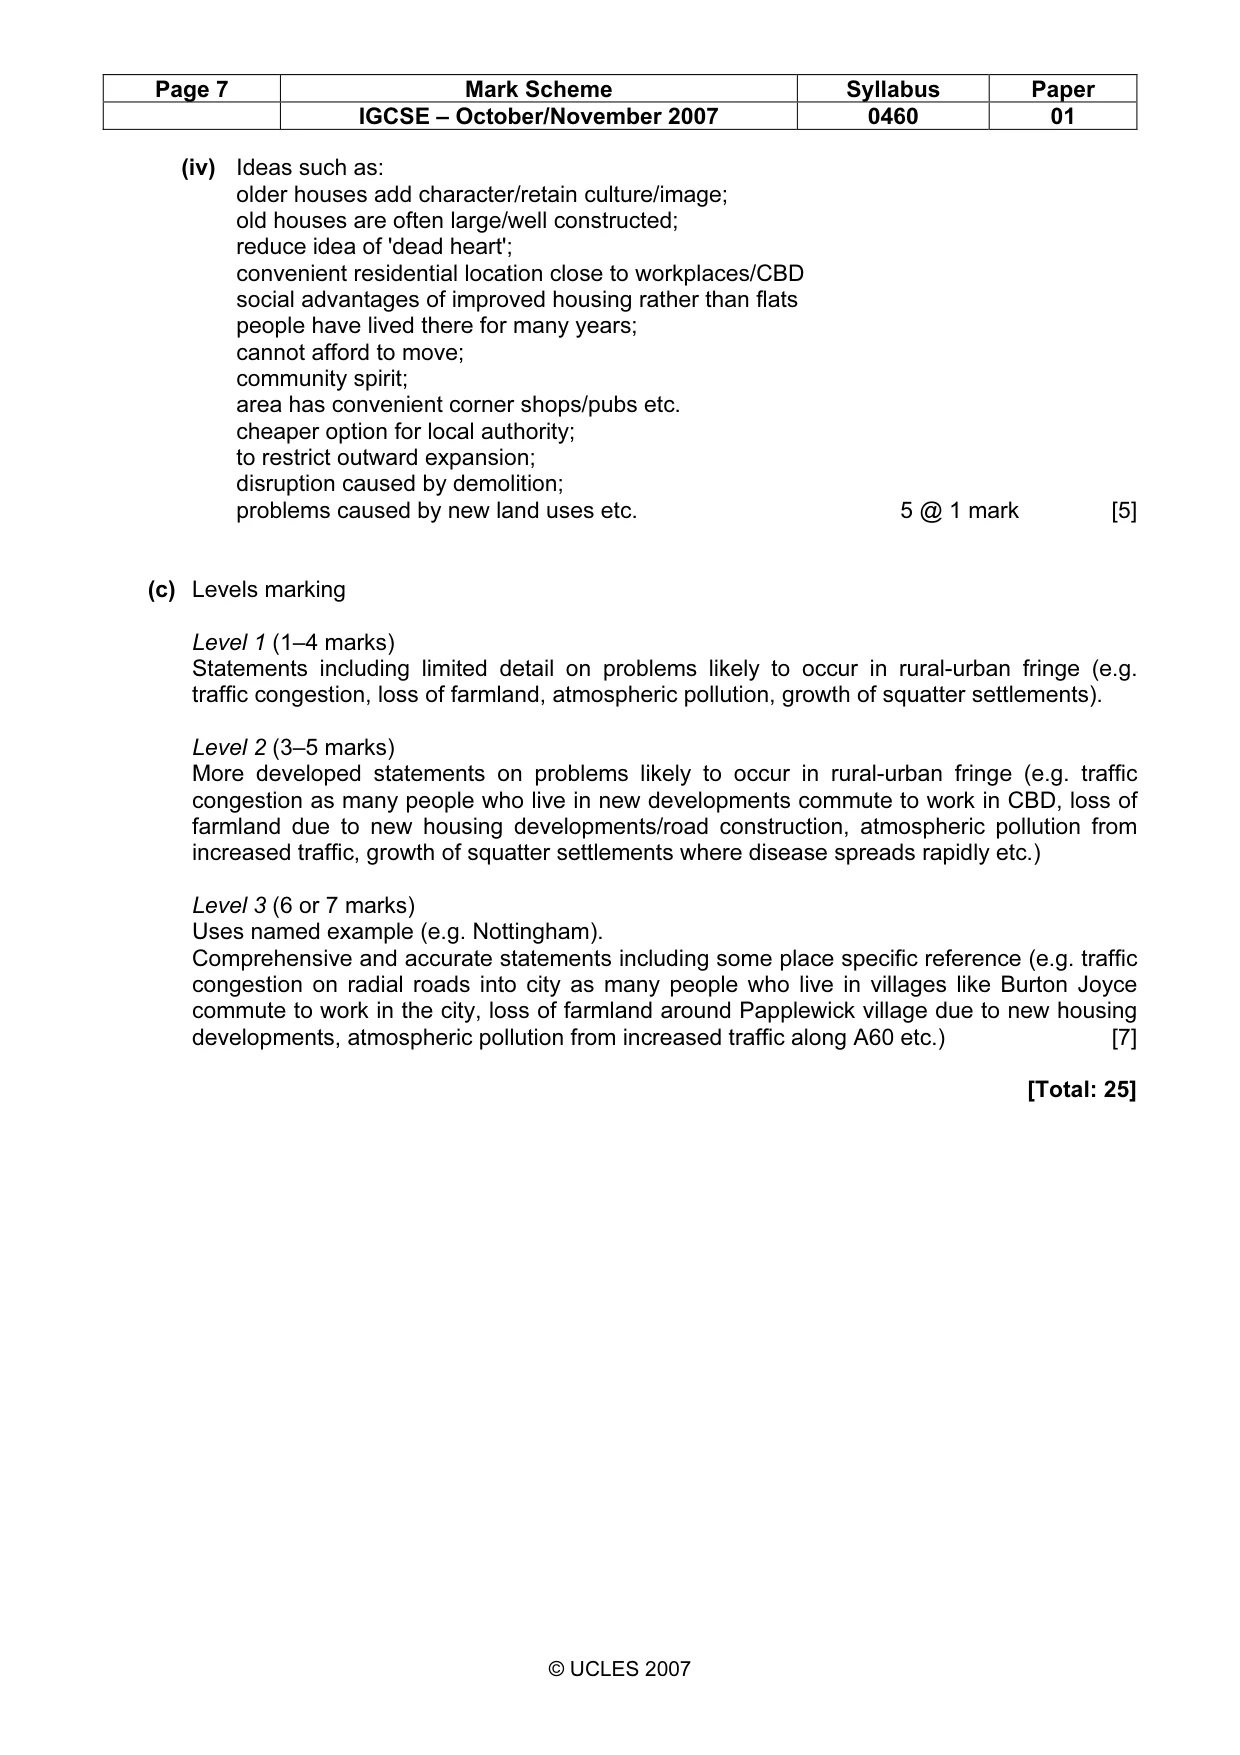
Page 7 Mark Scheme Syllabus Paper IGCSE – October/November 2007 0460 01 © UCLES 2007 (iv) Ideas such as: older houses add character/retain culture/image; old houses are often large/well constructed; reduce idea of 'dead heart'; convenient residential location close to workplaces/CBD social advantages of improved housing rather than flats people have lived there for many years; cannot afford to move; community spirit; area has convenient corner shops/pubs etc. cheaper option for local authority; to restrict outward expansion; disruption caused by demolition; problems caused by new land uses etc. 5 @ 1 mark [5] (c) Levels marking Level 1 (1–4 marks) Statements including limited detail on problems likely to occur in rural-urban fringe (e.g. traffic congestion, loss of farmland, atmospheric pollution, growth of squatter settlements). Level 2 (3–5 marks) More developed statements on problems likely to occur in rural-urban fringe (e.g. traffic congestion as many people who live in new developments commute to work in CBD, loss of farmland due to new housing developments/road construction, atmospheric pollution from increased traffic, growth of squatter settlements where disease spreads rapidly etc.) Level 3 (6 or 7 marks) Uses named example (e.g. Nottingham). Comprehensive and accurate statements including some place specific reference (e.g. traffic congestion on radial roads into city as many people who live in villages like Burton Joyce commute to work in the city, loss of farmland around Papplewick village due to new housing developments, atmospheric pollution from increased traffic along A60 etc.) [7] [Total: 25]
Mark scheme, page 8
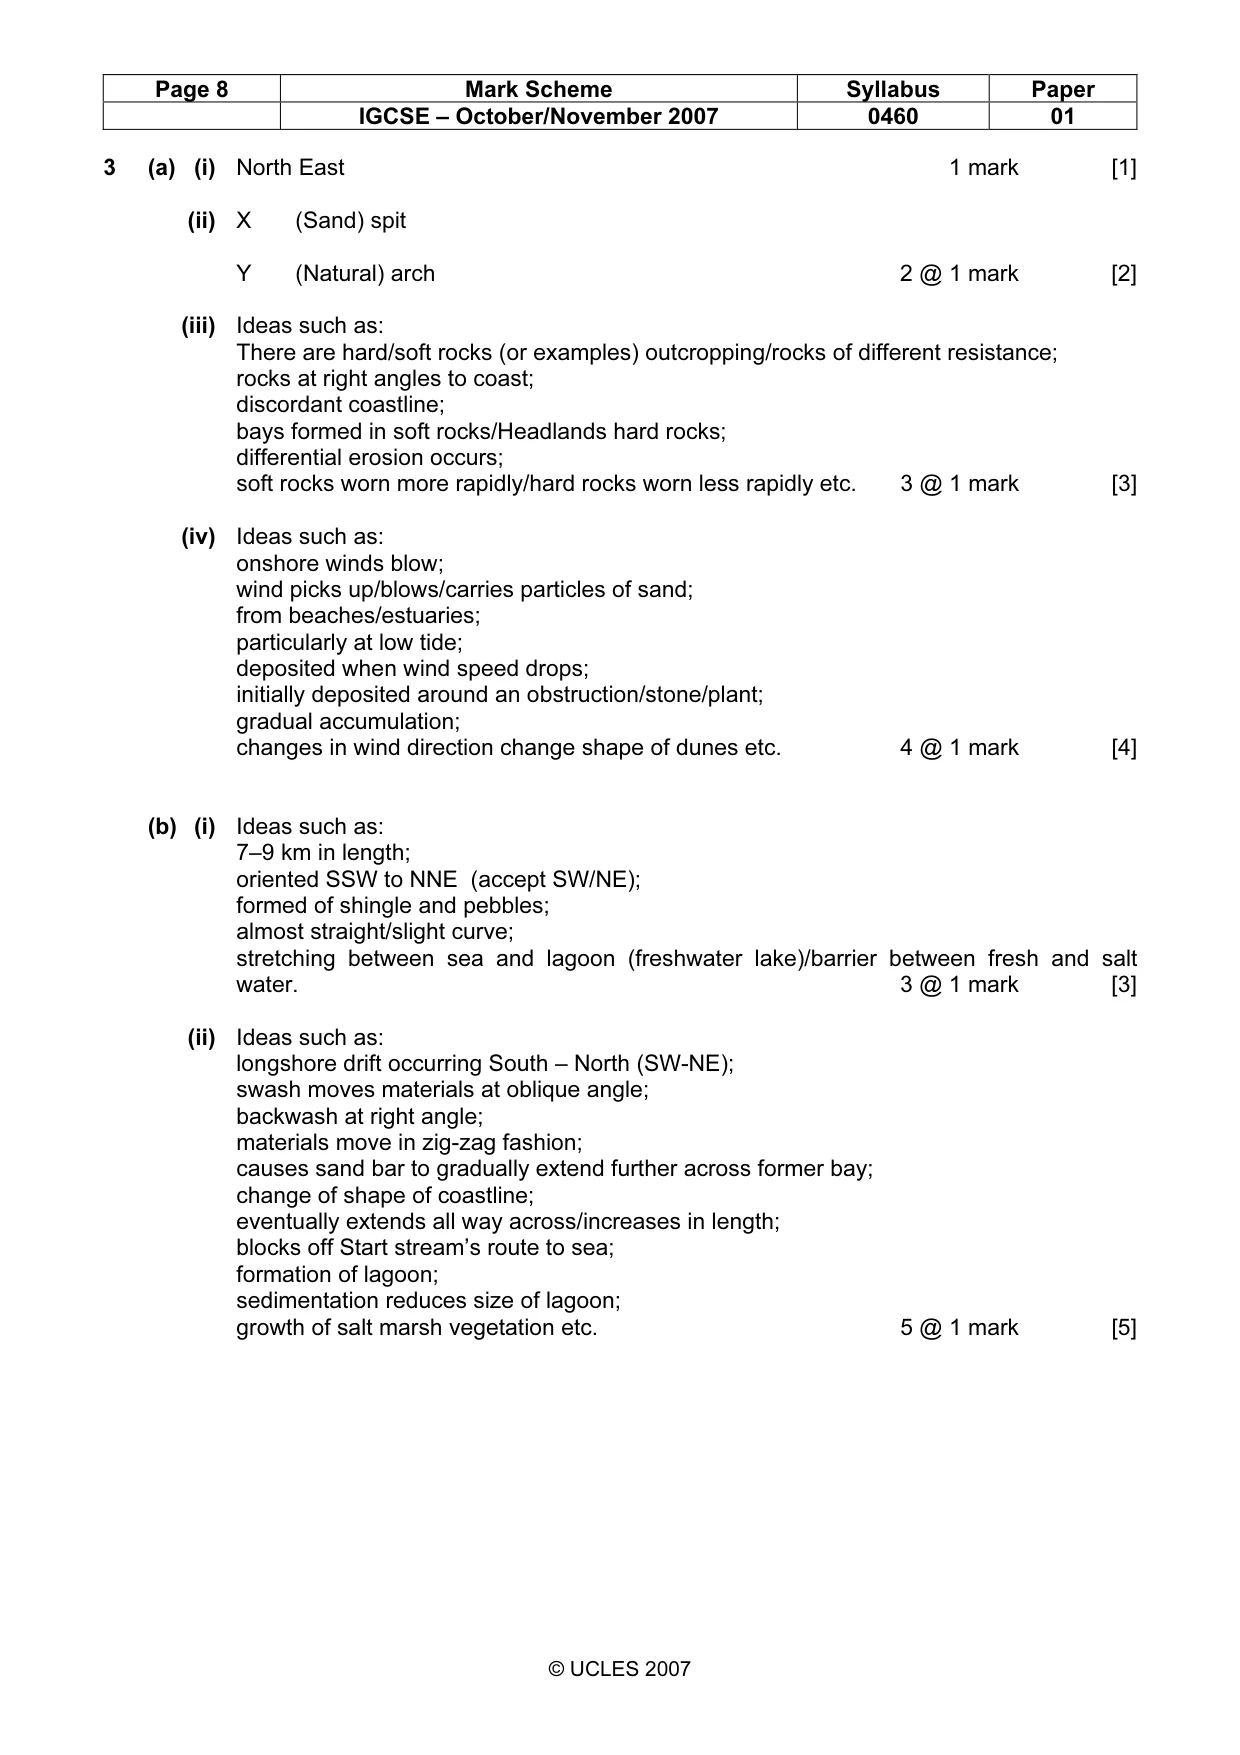
Page 8 Mark Scheme Syllabus Paper IGCSE – October/November 2007 0460 01 © UCLES 2007 3 (a) (i) North East 1 mark [1] (ii) X (Sand) spit Y (Natural) arch 2 @ 1 mark [2] (iii) Ideas such as: There are hard/soft rocks (or examples) outcropping/rocks of different resistance; rocks at right angles to coast; discordant coastline; bays formed in soft rocks/Headlands hard rocks; differential erosion occurs; soft rocks worn more rapidly/hard rocks worn less rapidly etc. 3 @ 1 mark [3] (iv) Ideas such as: onshore winds blow; wind picks up/blows/carries particles of sand; from beaches/estuaries; particularly at low tide; deposited when wind speed drops; initially deposited around an obstruction/stone/plant; gradual accumulation; changes in wind direction change shape of dunes etc. 4 @ 1 mark [4] (b) (i) Ideas such as: 7–9 km in length; oriented SSW to NNE (accept SW/NE); formed of shingle and pebbles; almost straight/slight curve; stretching between sea and lagoon (freshwater lake)/barrier between fresh and salt water. 3 @ 1 mark [3] (ii) Ideas such as: longshore drift occurring South – North (SW-NE); swash moves materials at oblique angle; backwash at right angle; materials move in zig-zag fashion; causes sand bar to gradually extend further across former bay; change of shape of coastline; eventually extends all way across/increases in length; blocks off Start stream’s route to sea; formation of lagoon; sedimentation reduces size of lagoon; growth of salt marsh vegetation etc. 5 @ 1 mark [5]
Mark scheme, page 9
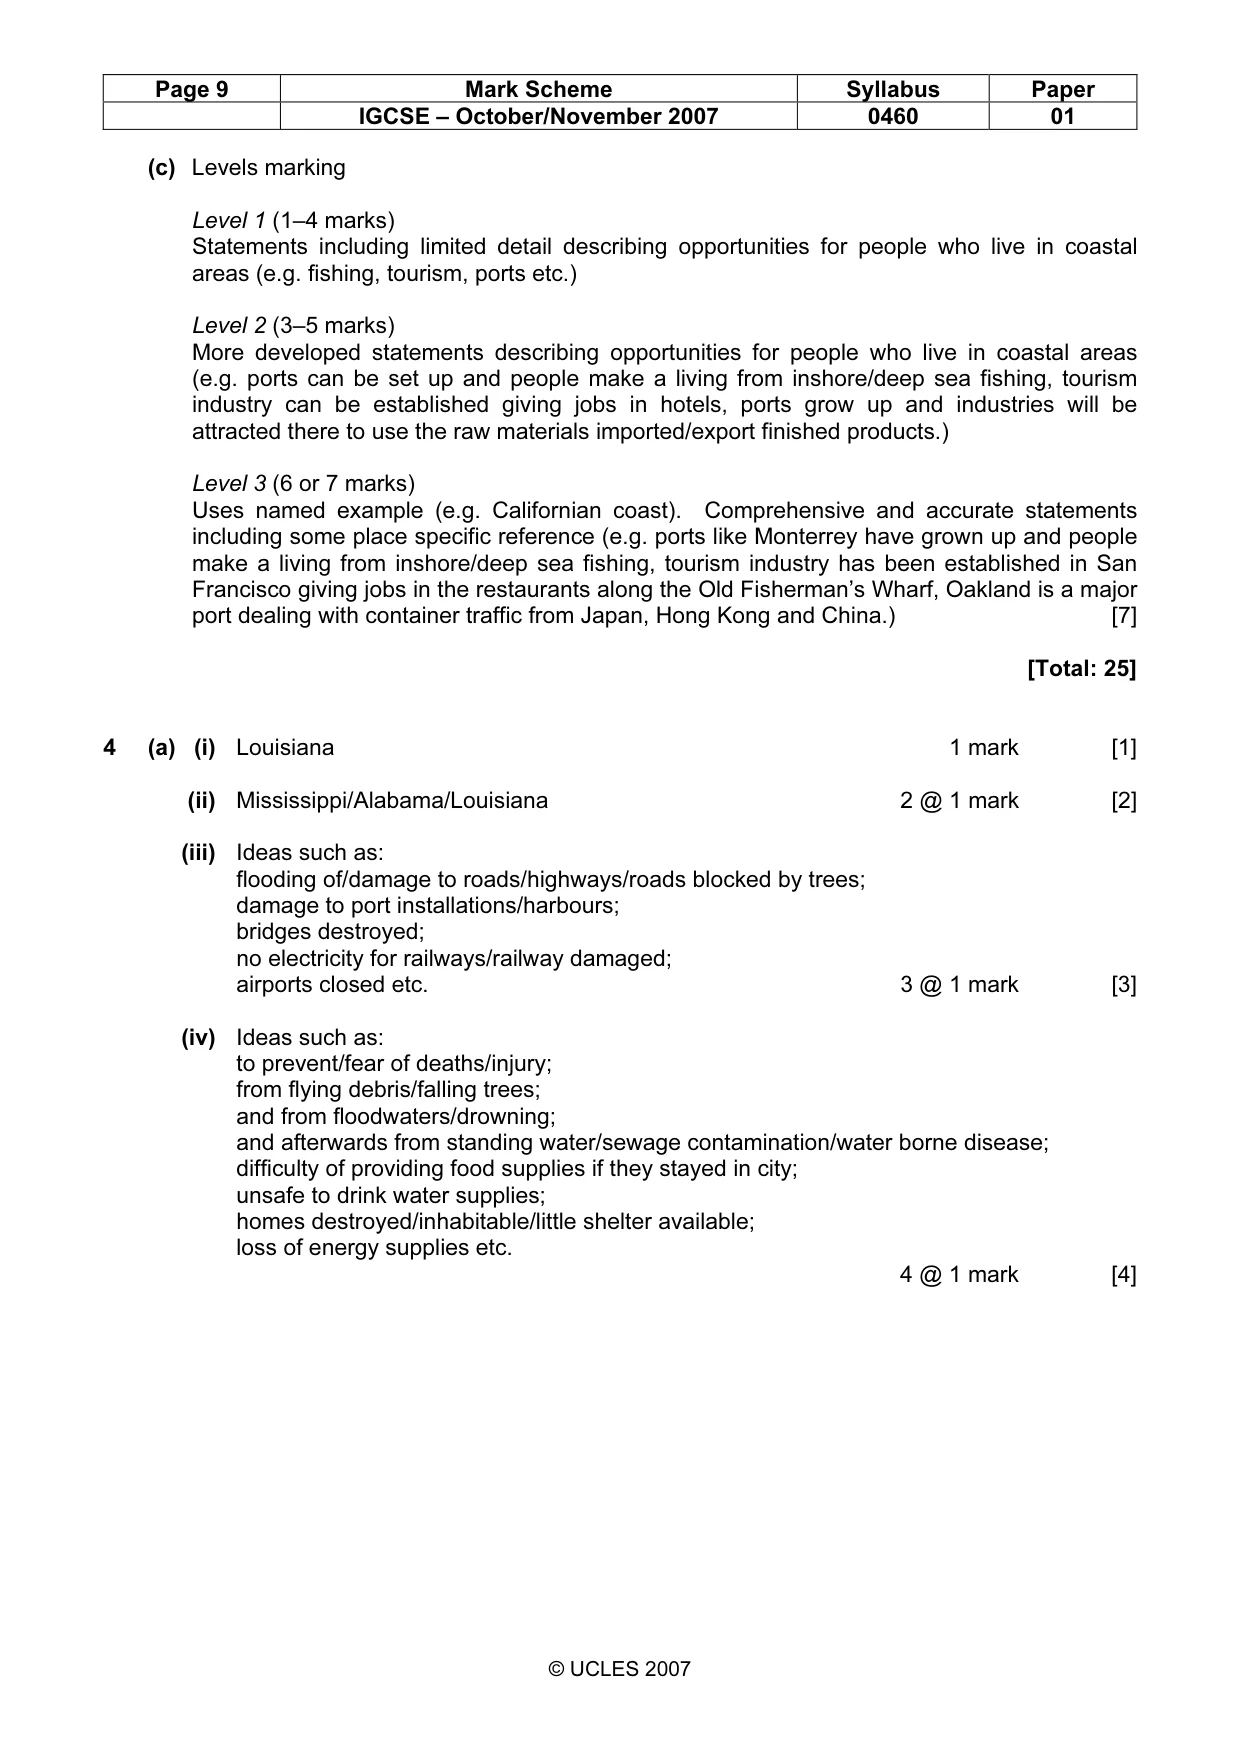
Page 9 Mark Scheme Syllabus Paper IGCSE – October/November 2007 0460 01 © UCLES 2007 (c) Levels marking Level 1 (1–4 marks) Statements including limited detail describing opportunities for people who live in coastal areas (e.g. fishing, tourism, ports etc.) Level 2 (3–5 marks) More developed statements describing opportunities for people who live in coastal areas (e.g. ports can be set up and people make a living from inshore/deep sea fishing, tourism industry can be established giving jobs in hotels, ports grow up and industries will be attracted there to use the raw materials imported/export finished products.) Level 3 (6 or 7 marks) Uses named example (e.g. Californian coast). Comprehensive and accurate statements including some place specific reference (e.g. ports like Monterrey have grown up and people make a living from inshore/deep sea fishing, tourism industry has been established in San Francisco giving jobs in the restaurants along the Old Fisherman’s Wharf, Oakland is a major port dealing with container traffic from Japan, Hong Kong and China.) [7] [Total: 25] 4 (a) (i) Louisiana 1 mark [1] (ii) Mississippi/Alabama/Louisiana 2 @ 1 mark [2] (iii) Ideas such as: flooding of/damage to roads/highways/roads blocked by trees; damage to port installations/harbours; bridges destroyed; no electricity for railways/railway damaged; airports closed etc. 3 @ 1 mark [3] (iv) Ideas such as: to prevent/fear of deaths/injury; from flying debris/falling trees; and from floodwaters/drowning; and afterwards from standing water/sewage contamination/water borne disease; difficulty of providing food supplies if they stayed in city; unsafe to drink water supplies; homes destroyed/inhabitable/little shelter available; loss of energy supplies etc. 4 @ 1 mark [4]
Mark scheme, page 10
Page 10 Mark Scheme Syllabus Paper IGCSE – October/November 2007 0460 01 © UCLES 2007 (b) (i) Ideas such as: the area provides almost 20% (Loiusiana 16.1%) of The USAs oil/it is an important oil producing area; may force up prices of oil/gasoline/petrol; damage to rigs and production platforms; storage facilities on land may be damaged; damage to service bases; loss of electricity prevents pumping along pipelines; pipes/refineries damaged/production halted; need to import more oil/US oil supplies reduced etc. 3 @ 1 mark [3] (ii) Ideas such as in MEDCs: buildings are likely to be stronger; therefore there is likely to be less destruction; they are more likely to have finances to be able to rebuild/insurance cover; and expertise/technology/equipment; and not have to be so dependent on emergency international aid; prediction/warning systems/monitoring more likely to be in place; emergency services better prepared; drills/planning for disaster/prepared/educated re. protection etc. 5 @ 1 mark [5] (c) Levels marking Level 1 (1–4 marks) Statements including limited detail describing causes and/or effects impacts of a volcanic eruption, earthquake or drought (e.g. plates move, people killed, housing destroyed, roads and railways damaged etc.) Level 2 (3–5 marks) More developed statements describing causes and/or effects impacts of a volcanic eruption, earthquake or drought (e.g. plates converge and subduction occurs, people killed by hot lava/suffocation by toxic fumes, 61 deaths, housing buried by lava/layers of dust, communications disrupted by lava covering roads/railways, devastation of lumbering industry by destruction of forests etc.) Level 3 (6–7 marks) Uses named example (e.g. Mt St Helens volcanic eruption). Comprehensive and accurate statements including some place specific reference (e.g. Convergence of North American and Juan de Fuca plates, 61 deaths/suffocation by toxic fumes , logging camps destroyed, communications disrupted by floodwaters washing away roads/railway bridges, loss of fish in a hatchery on Toutle River etc.) [7] [Total: 25]
Mark scheme, page 11
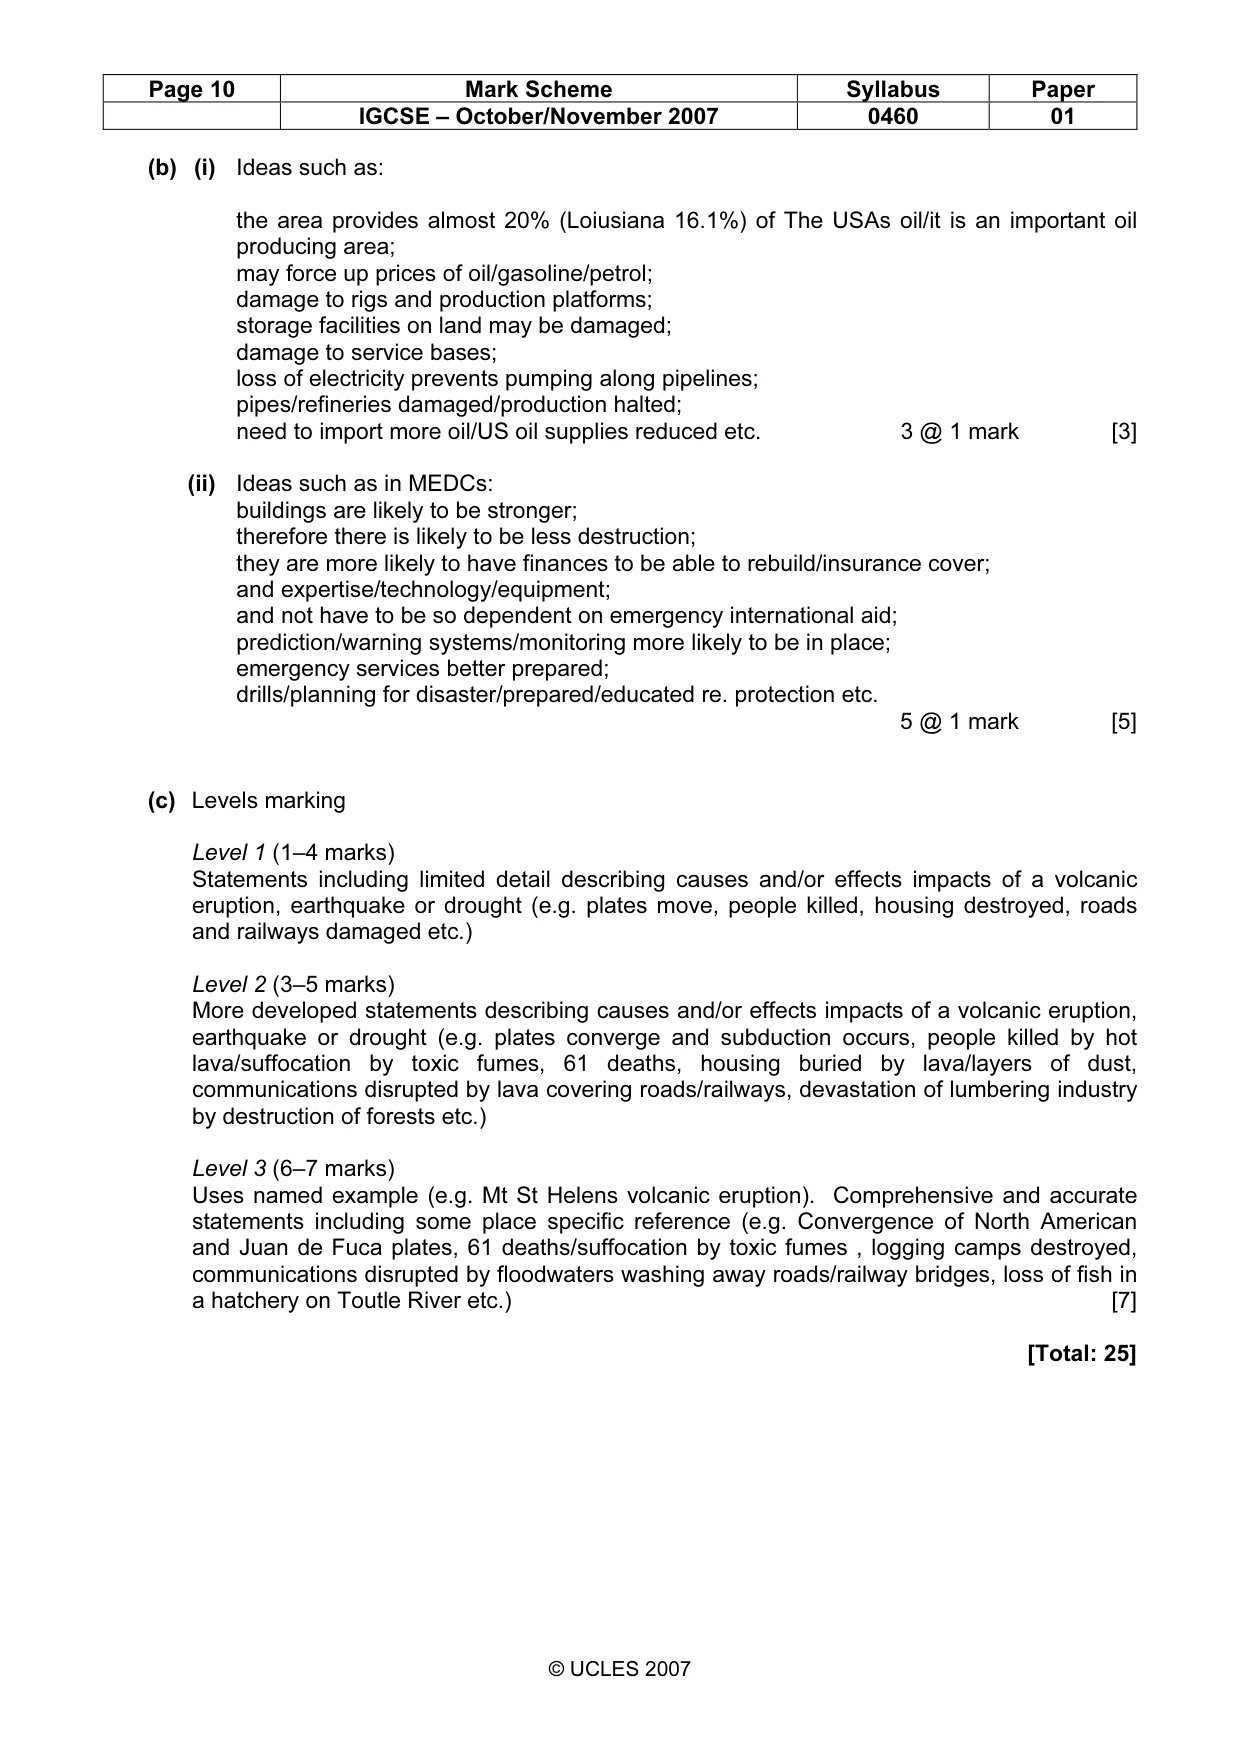
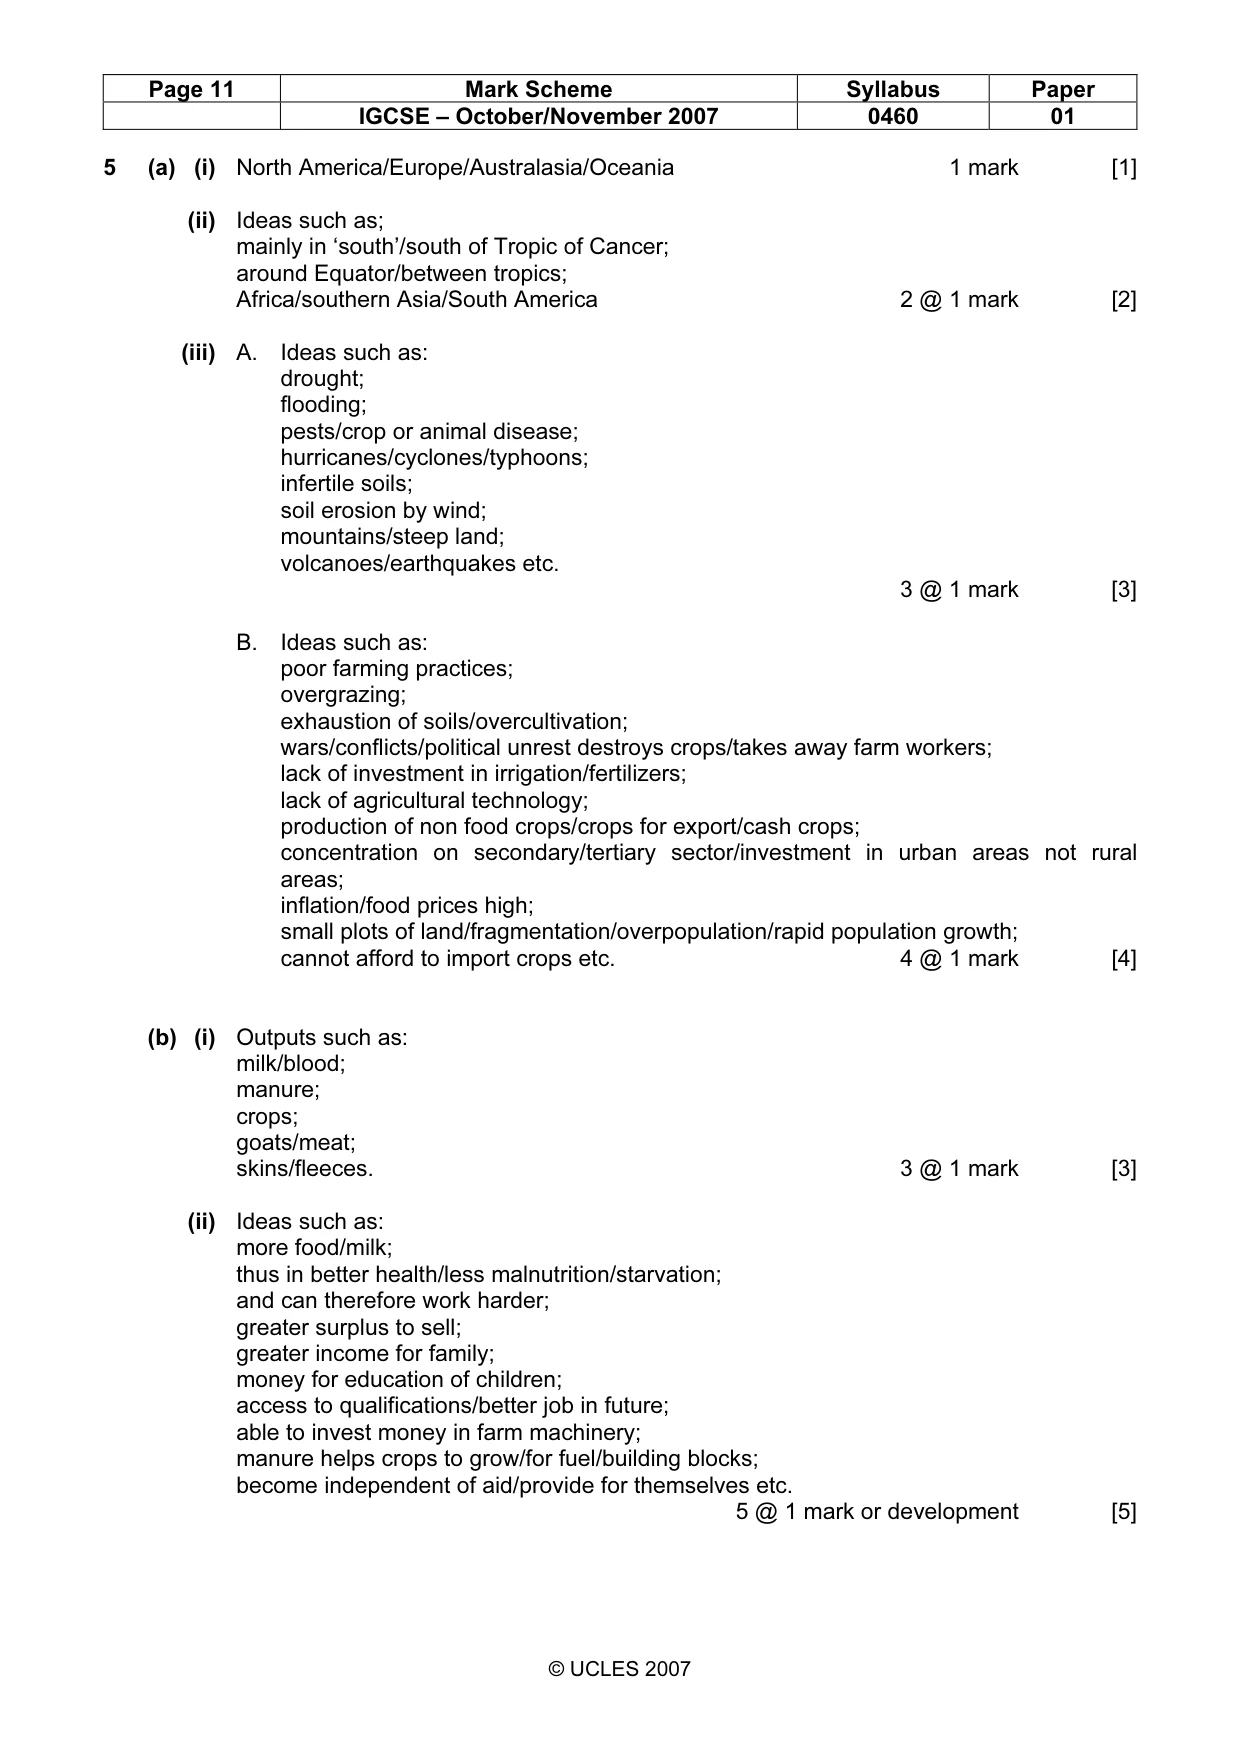
Page 11 Mark Scheme Syllabus Paper IGCSE – October/November 2007 0460 01 © UCLES 2007 5 (a) (i) North America/Europe/Australasia/Oceania 1 mark [1] (ii) Ideas such as; mainly in ‘south’/south of Tropic of Cancer; around Equator/between tropics; Africa/southern Asia/South America 2 @ 1 mark [2] (iii) A. Ideas such as: drought; flooding; pests/crop or animal disease; hurricanes/cyclones/typhoons; infertile soils; soil erosion by wind; mountains/steep land; volcanoes/earthquakes etc. 3 @ 1 mark [3] B. Ideas such as: poor farming practices; overgrazing; exhaustion of soils/overcultivation; wars/conflicts/political unrest destroys crops/takes away farm workers; lack of investment in irrigation/fertilizers; lack of agricultural technology; production of non food crops/crops for export/cash crops; concentration on secondary/tertiary sector/investment in urban areas not rural areas; inflation/food prices high; small plots of land/fragmentation/overpopulation/rapid population growth; cannot afford to import crops etc. 4 @ 1 mark [4] (b) (i) Outputs such as: milk/blood; manure; crops; goats/meat; skins/fleeces. 3 @ 1 mark [3] (ii) Ideas such as: more food/milk; thus in better health/less malnutrition/starvation; and can therefore work harder; greater surplus to sell; greater income for family; money for education of children; access to qualifications/better job in future; able to invest money in farm machinery; manure helps crops to grow/for fuel/building blocks; become independent of aid/provide for themselves etc. 5 @ 1 mark or development [5]
Mark scheme, page 12
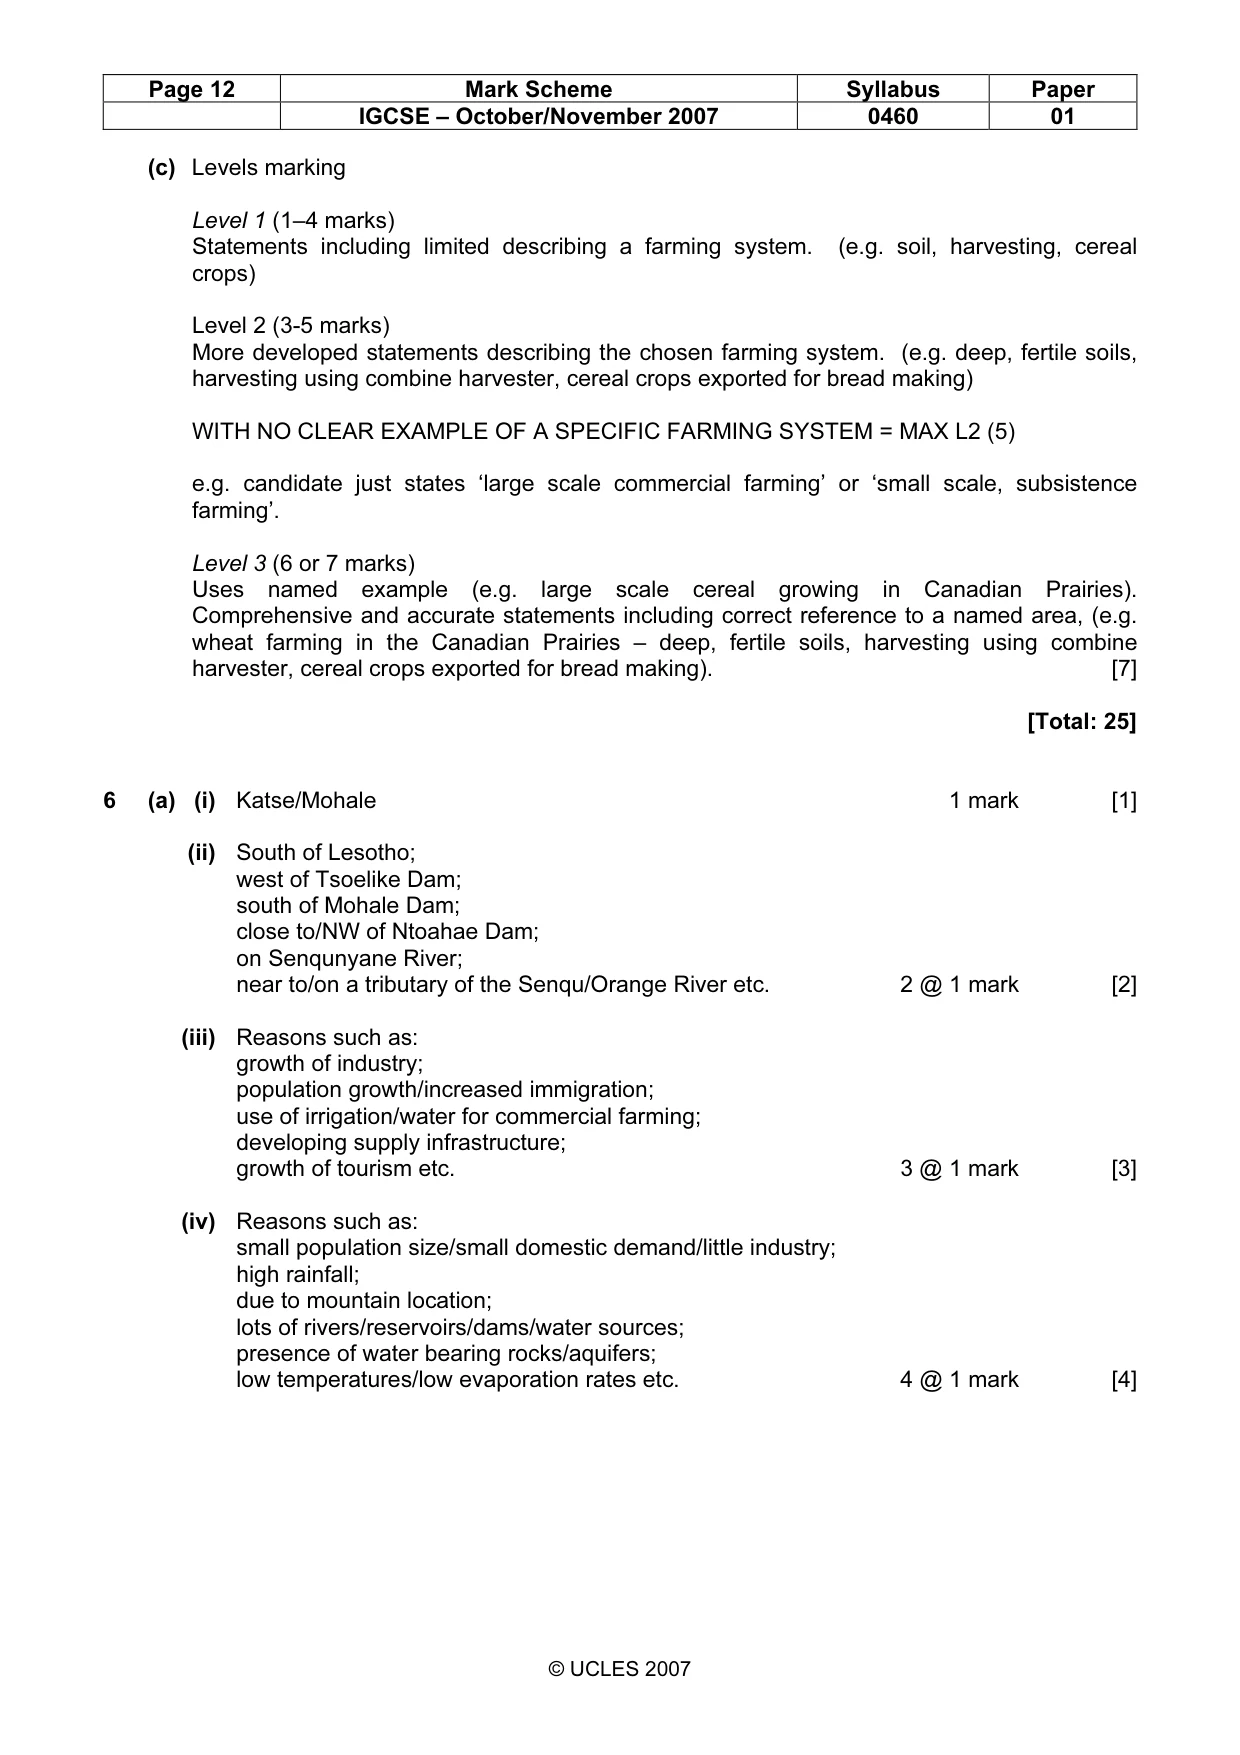
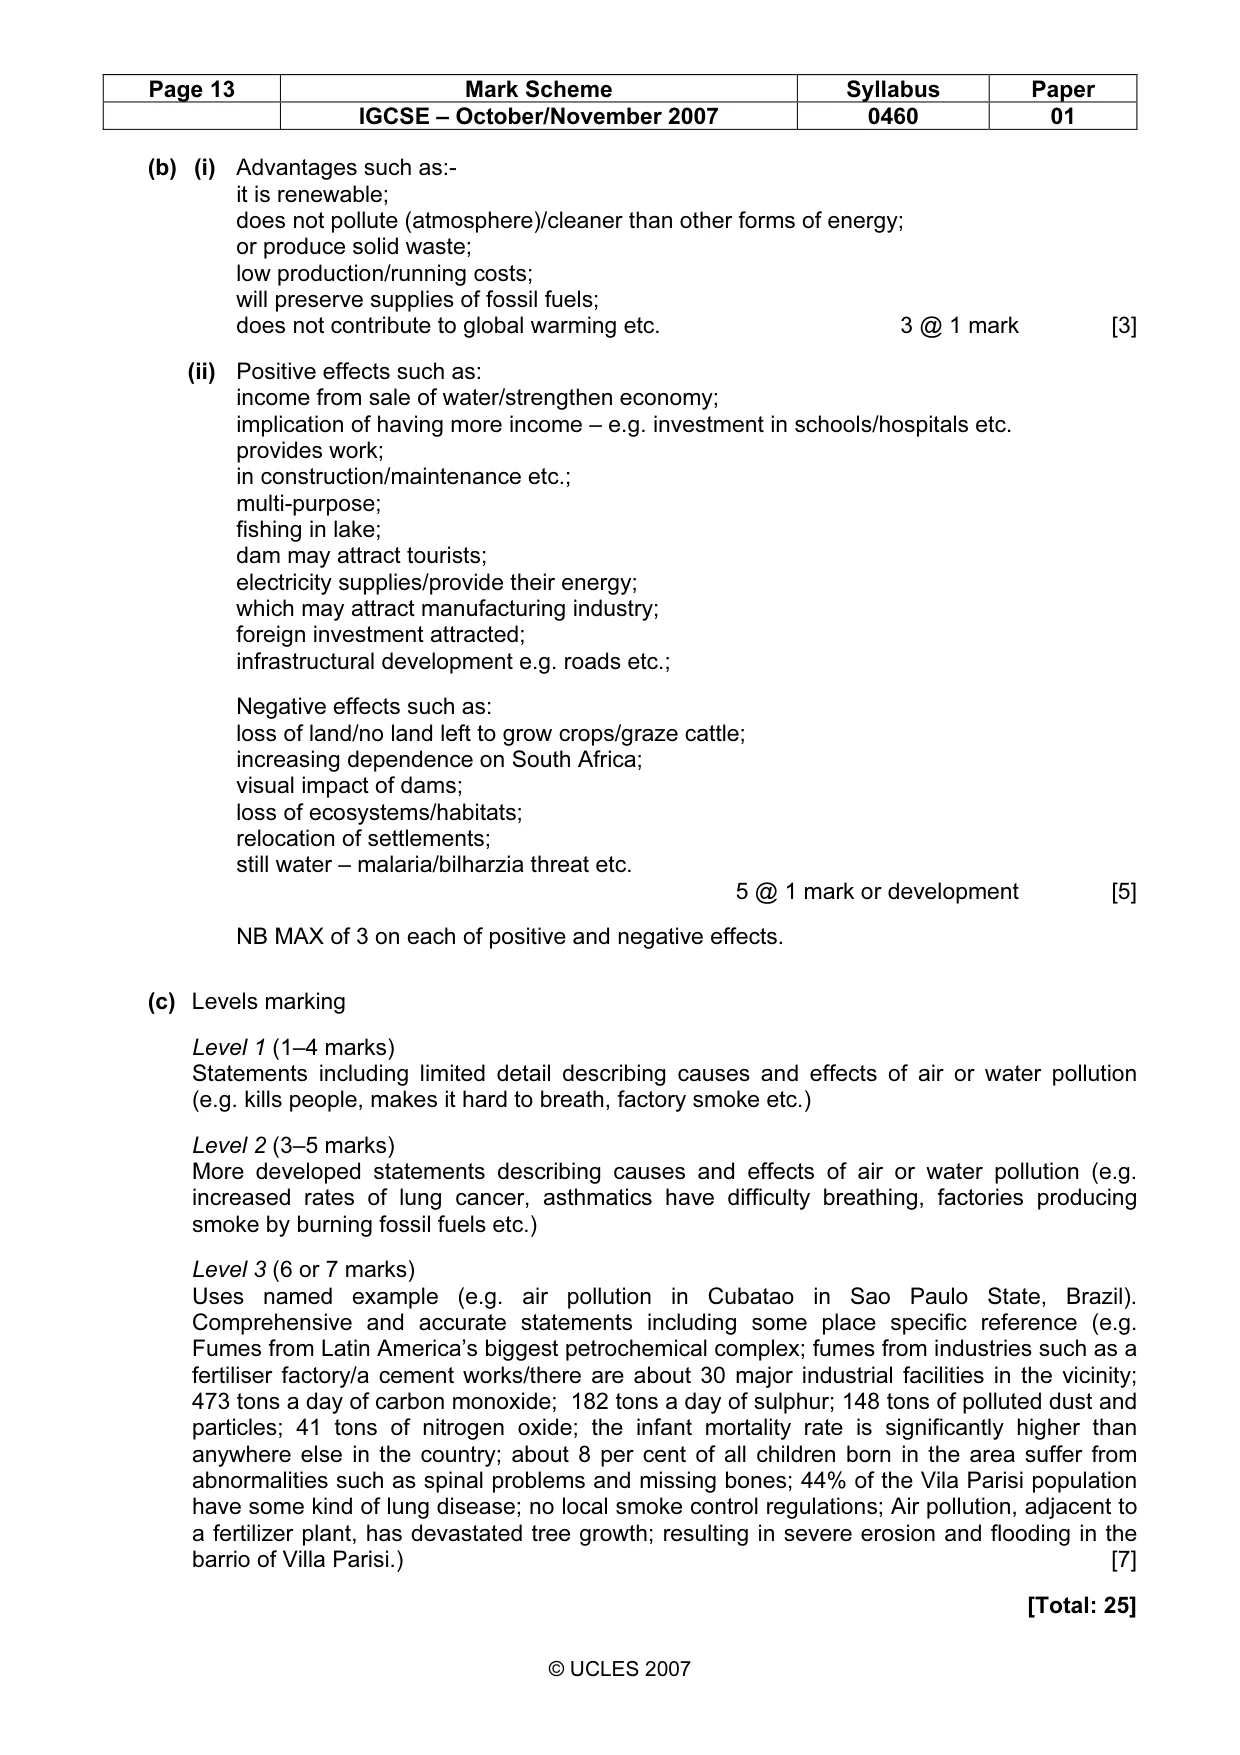
Page 12 Mark Scheme Syllabus Paper IGCSE – October/November 2007 0460 01 © UCLES 2007 (c) Levels marking Level 1 (1–4 marks) Statements including limited describing a farming system. (e.g. soil, harvesting, cereal crops) Level 2 (3-5 marks) More developed statements describing the chosen farming system. (e.g. deep, fertile soils, harvesting using combine harvester, cereal crops exported for bread making) WITH NO CLEAR EXAMPLE OF A SPECIFIC FARMING SYSTEM = MAX L2 (5) e.g. candidate just states ‘large scale commercial farming’ or ‘small scale, subsistence farming’. Level 3 (6 or 7 marks) Uses named example (e.g. large scale cereal growing in Canadian Prairies). Comprehensive and accurate statements including correct reference to a named area, (e.g. wheat farming in the Canadian Prairies – deep, fertile soils, harvesting using combine harvester, cereal crops exported for bread making). [7] [Total: 25] 6 (a) (i) Katse/Mohale 1 mark [1] (ii) South of Lesotho; west of Tsoelike Dam; south of Mohale Dam; close to/NW of Ntoahae Dam; on Senqunyane River; near to/on a tributary of the Senqu/Orange River etc. 2 @ 1 mark [2] (iii) Reasons such as: growth of industry; population growth/increased immigration; use of irrigation/water for commercial farming; developing supply infrastructure; growth of tourism etc. 3 @ 1 mark [3] (iv) Reasons such as: small population size/small domestic demand/little industry; high rainfall; due to mountain location; lots of rivers/reservoirs/dams/water sources; presence of water bearing rocks/aquifers; low temperatures/low evaporation rates etc. 4 @ 1 mark [4]
Mark scheme, page 13
Page 13 Mark Scheme Syllabus Paper IGCSE – October/November 2007 0460 01 © UCLES 2007 (b) (i) Advantages such as:- it is renewable; does not pollute (atmosphere)/cleaner than other forms of energy; or produce solid waste; low production/running costs; will preserve supplies of fossil fuels; does not contribute to global warming etc. 3 @ 1 mark [3] (ii) Positive effects such as: income from sale of water/strengthen economy; implication of having more income – e.g. investment in schools/hospitals etc. provides work; in construction/maintenance etc.; multi-purpose; fishing in lake; dam may attract tourists; electricity supplies/provide their energy; which may attract manufacturing industry; foreign investment attracted; infrastructural development e.g. roads etc.; Negative effects such as: loss of land/no land left to grow crops/graze cattle; increasing dependence on South Africa; visual impact of dams; loss of ecosystems/habitats; relocation of settlements; still water – malaria/bilharzia threat etc. 5 @ 1 mark or development [5] NB MAX of 3 on each of positive and negative effects. (c) Levels marking Level 1 (1–4 marks) Statements including limited detail describing causes and effects of air or water pollution (e.g. kills people, makes it hard to breath, factory smoke etc.) Level 2 (3–5 marks) More developed statements describing causes and effects of air or water pollution (e.g. increased rates of lung cancer, asthmatics have difficulty breathing, factories producing smoke by burning fossil fuels etc.) Level 3 (6 or 7 marks) Uses named example (e.g. air pollution in Cubatao in Sao Paulo State, Brazil). Comprehensive and accurate statements including some place specific reference (e.g. Fumes from Latin America’s biggest petrochemical complex; fumes from industries such as a fertiliser factory/a cement works/there are about 30 major industrial facilities in the vicinity; 473 tons a day of carbon monoxide; 182 tons a day of sulphur; 148 tons of polluted dust and particles; 41 tons of nitrogen oxide; the infant mortality rate is significantly higher than anywhere else in the country; about 8 per cent of all children born in the area suffer from abnormalities such as spinal problems and missing bones; 44% of the Vila Parisi population have some kind of lung disease; no local smoke control regulations; Air pollution, adjacent to a fertilizer plant, has devastated tree growth; resulting in severe erosion and flooding in the barrio of Villa Parisi.) [7] [Total: 25]
What you needed in this session
Cambridge’s own grade thresholds for 2007 Oct/Nov, Paper 1 · Variant 1. A higher threshold means an easier paper — the bar moves with how the cohort did.