Cambridge IGCSE Geography 0460 — 2007 May/June Paper 1 · Variant 1
0460/11/M/J/07 · 75 marks · ≈84 min
The question paper and its mark scheme, free to read here and free to download. This is Cambridge’s own paper, exactly as it was sat.
Question paper16 pages

Mark scheme13 pages
Answers below. Sit the paper first if you are practising.
Paper as text
Question paper, page 1
This document consists of 14 printed pages, 2 blank pages and 1 Insert. SP (SLM/CGW) T24718/6 © UCLES 2007 [Turn over UNIVERSITY OF CAMBRIDGE INTERNATIONAL EXAMINATIONS International General Certificate of Secondary Education READ THESE INSTRUCTIONS FIRST If you have been given an Answer Booklet, follow the instructions on the front cover of the Booklet. Write your Centre number, candidate number and name on all the work you hand in. Write in dark blue or black pen. You may use a soft pencil for any diagrams, graphs or rough working. Do not use staples, paper clips, highlighters, glue or correction fluid. Answer three questions. Sketch maps and diagrams should be drawn whenever they serve to illustrate an answer. The Insert contains Fig. 3 for Question 2, Photographs A, B and C for Question 3 and Photograph D for Question 4. At the end of the examination, fasten all your work securely together. The number of marks is given in brackets [ ] at the end of each question or part question. * 1 7 3 8 9 7 4 5 1 2 * GEOGRAPHY 0460/01 Paper 1 May/June 2007 1 hour 45 minutes Additional Materials: Answer Booklet/Paper Ruler www.XtremePapers.com
Question paper, page 3
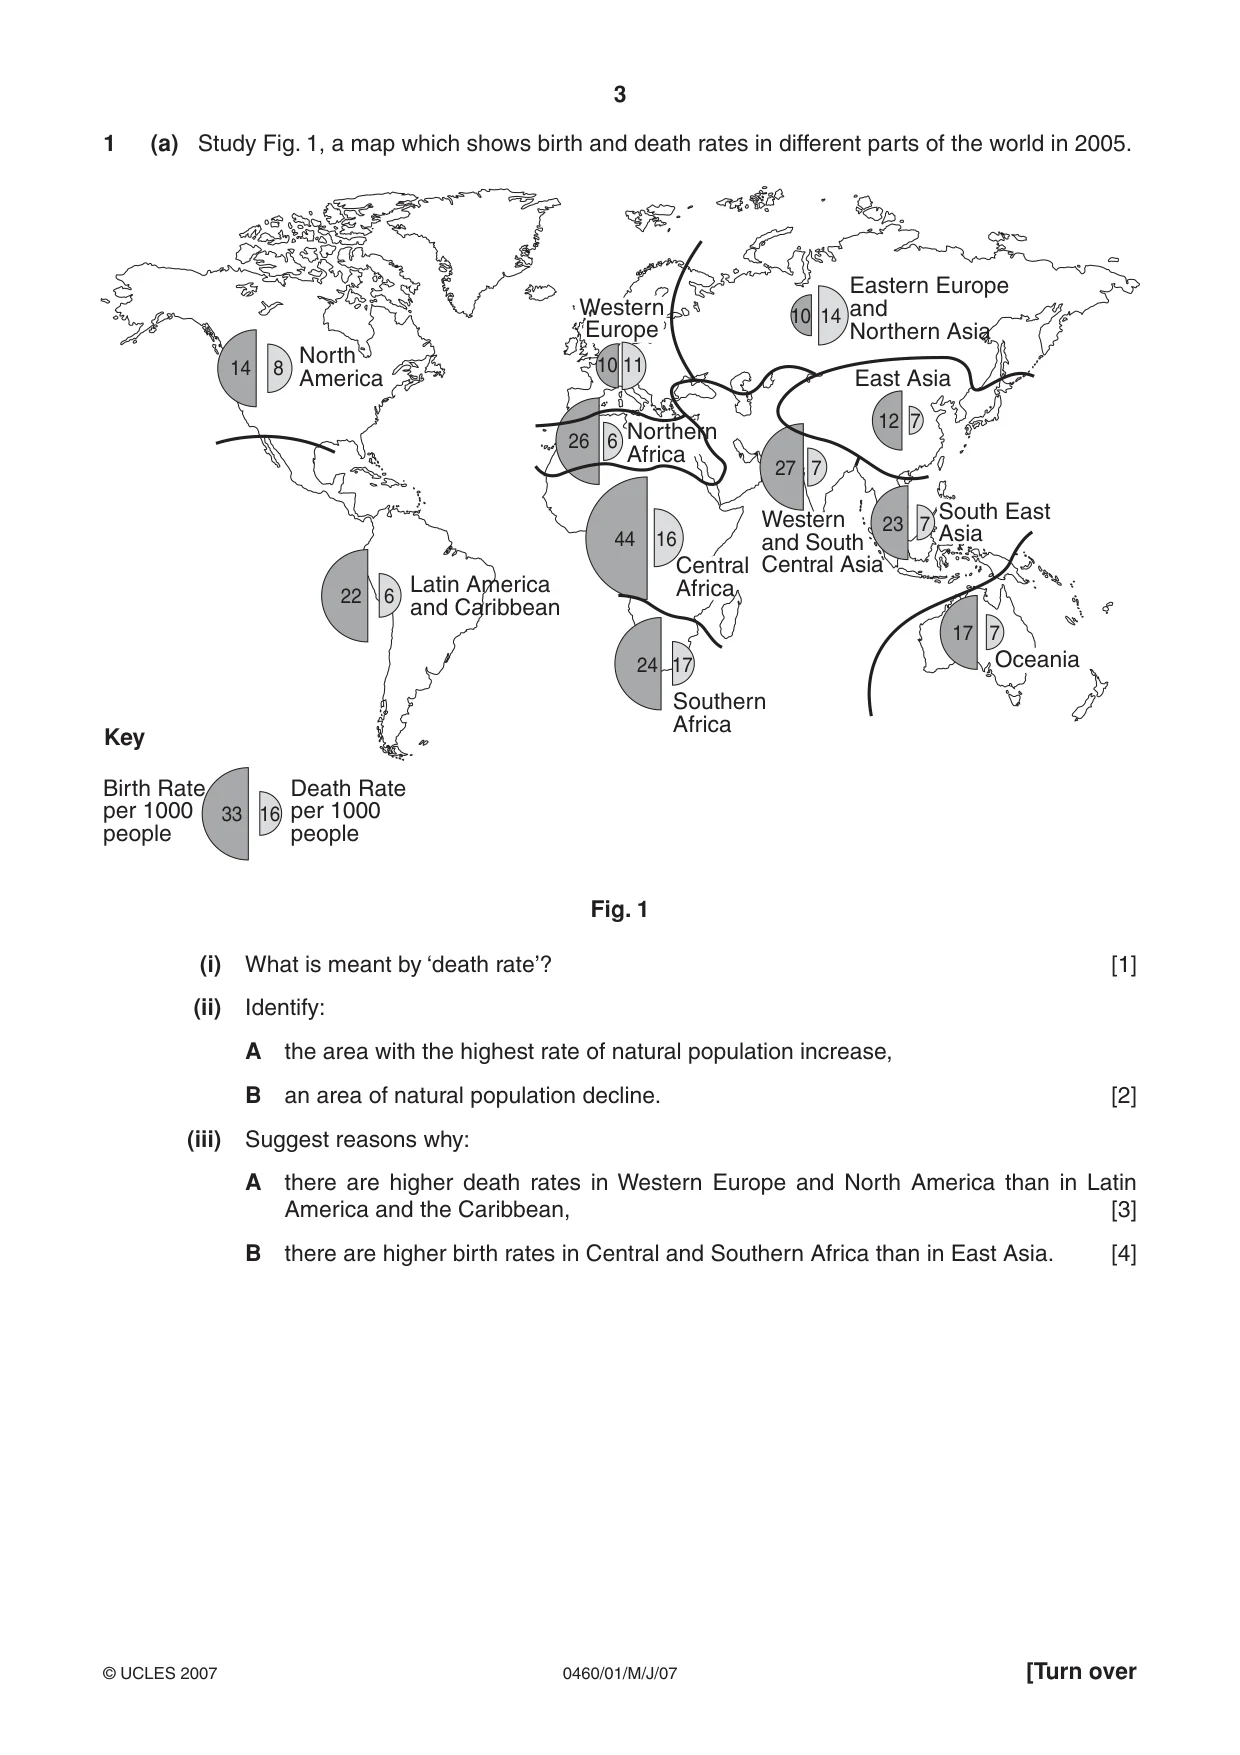
3 0460/01/M/J/07 © UCLES 2007 [Turn over 1 (a) Study Fig. 1, a map which shows birth and death rates in different parts of the world in 2005. East Asia 10 26 6 44 16 27 7 12 7 14 10 23 7 17 7 24 17 22 6 33 16 14 8 11 Latin America and Caribbean North America Southern Africa Oceania Eastern Europe and Northern Asia South East Asia Northern Africa Western Europe Birth Rate per 1000 people Death Rate per 1000 people Key Central Africa Western and South Central Asia Fig. 1 (i) What is meant by ‘death rate’? [1] (ii) Identify: A the area with the highest rate of natural population increase, B an area of natural population decline. [2] (iii) Suggest reasons why: A there are higher death rates in Western Europe and North America than in Latin America and the Caribbean, [3] B there are higher birth rates in Central and Southern Africa than in East Asia. [4]
Question paper, page 4
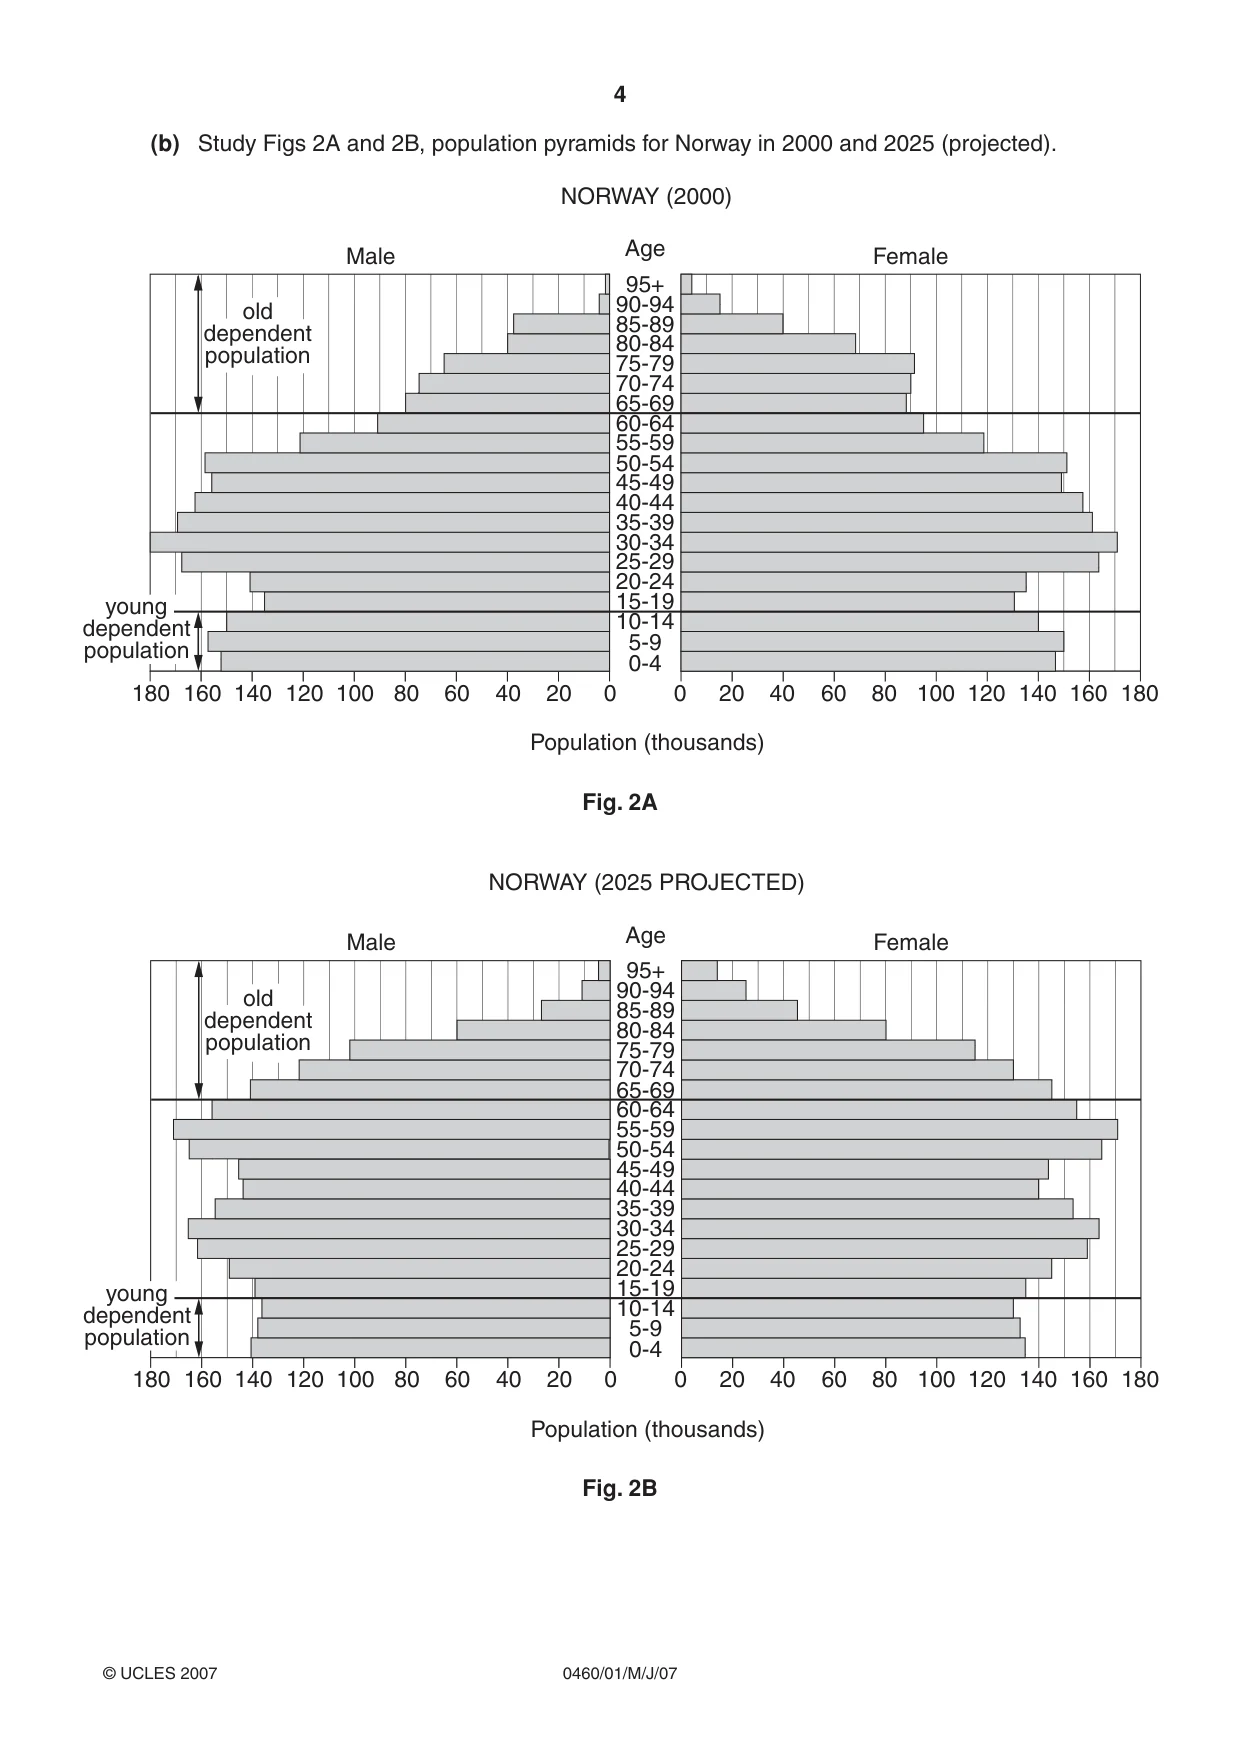
4 0460/01/M/J/07 © UCLES 2007 (b) Study Figs 2A and 2B, population pyramids for Norway in 2000 and 2025 (projected). 180 140 100 60 160 120 80 20 40 0 0 40 80 120 20 60 100 160 140 180 0-4 5-9 10-14 15-19 20-24 25-29 30-34 35-39 40-44 45-49 50-54 55-59 60-64 65-69 70-74 75-79 80-84 85-89 90-94 95+ Male Population (thousands) Female NORWAY (2000) old dependent population young dependent population Age Fig. 2A 180 140 100 60 160 120 80 20 40 0 0 40 80 120 20 60 100 160 140 180 0-4 5-9 10-14 15-19 20-24 25-29 30-34 35-39 40-44 45-49 50-54 55-59 60-64 65-69 70-74 75-79 80-84 85-89 90-94 95+ Age Male Population (thousands) Female NORWAY (2025 PROJECTED) old dependent population young dependent population Fig. 2B
Question paper, page 5
5 0460/01/M/J/07 © UCLES 2007 [Turn over (i) What evidence in the population pyramids suggests that Norway has an ageing population? Support your answer with figures. [3] (ii) Describe the likely effects of an ageing population in an MEDC such as Norway. [5] (c) Overpopulation occurs when there are too many people living in an area for the resources which are available. What problems are caused by overpopulation? You should refer to a country or area which you have studied. [7]
Question paper, page 6
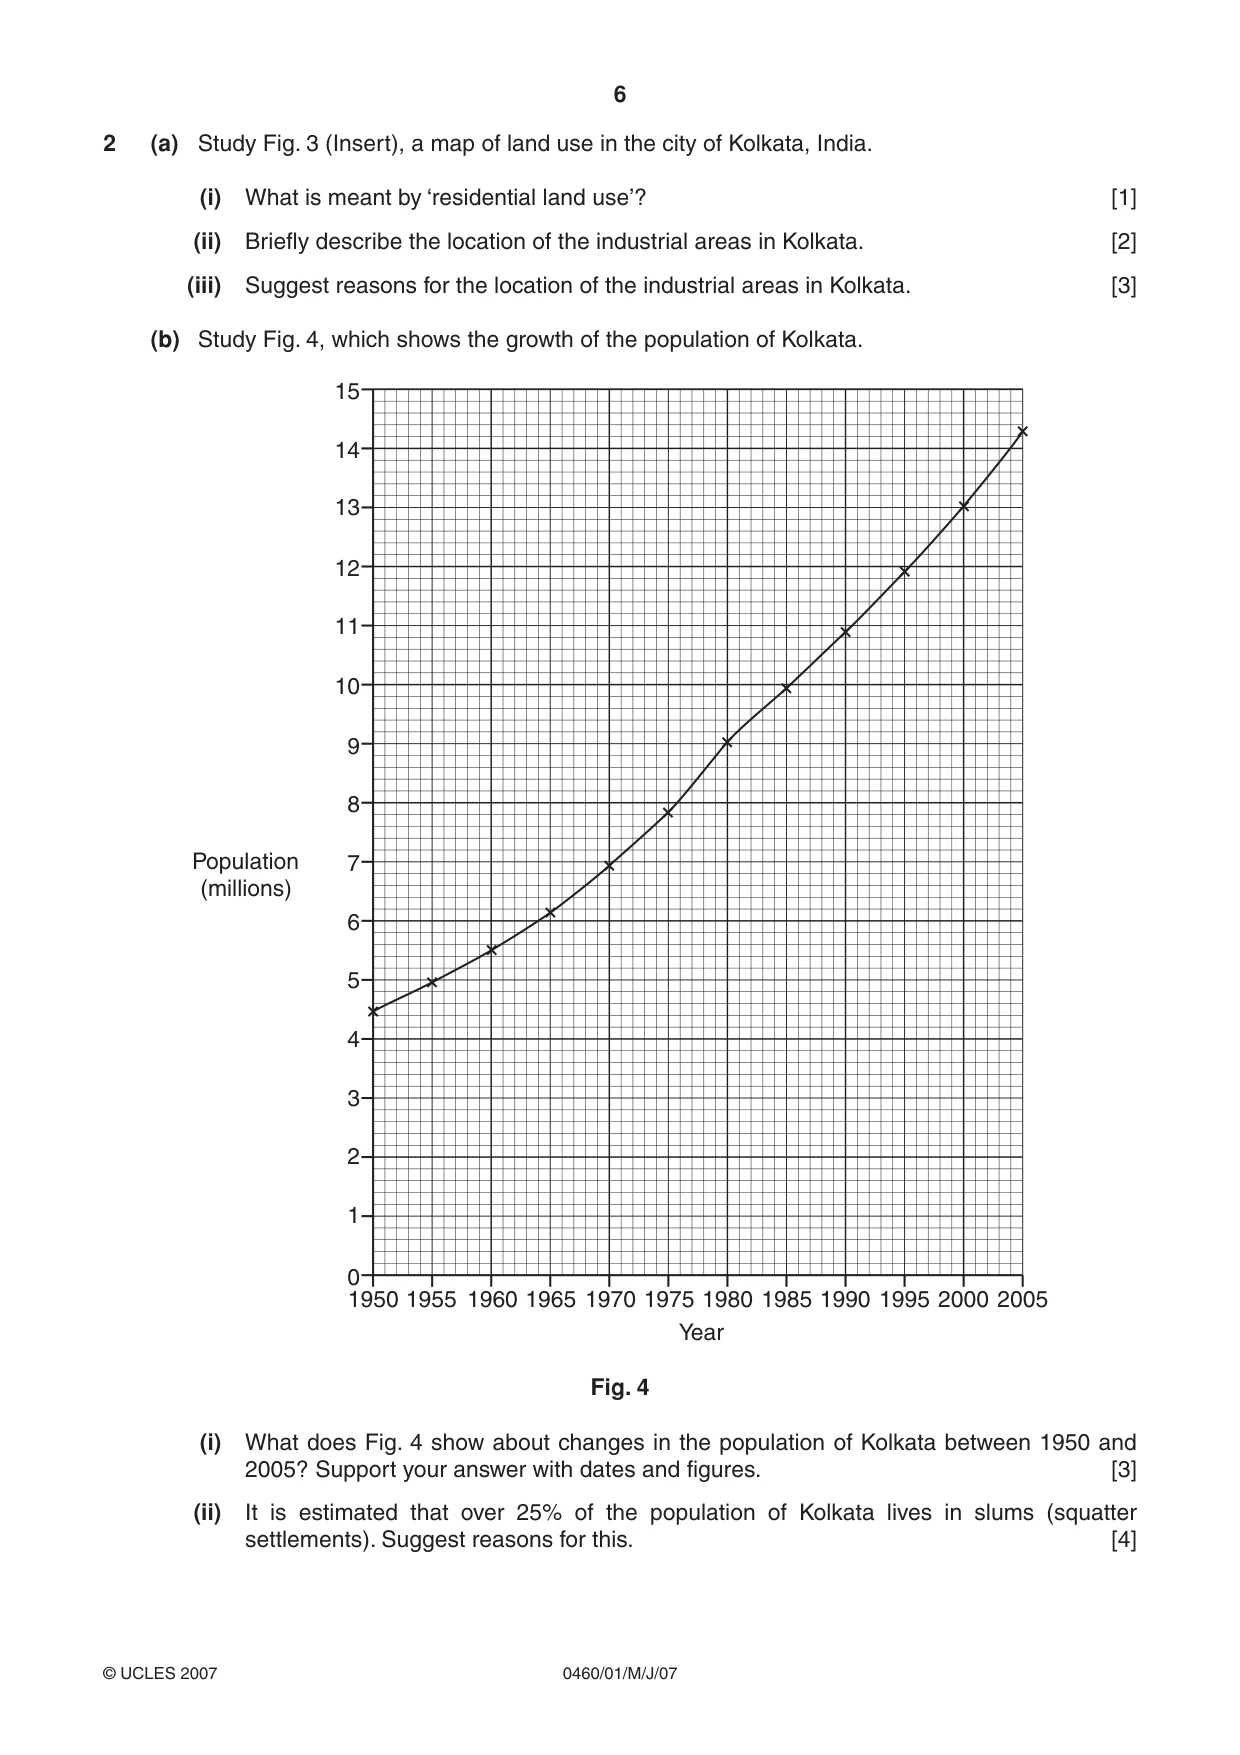
6 0460/01/M/J/07 © UCLES 2007 2 (a) Study Fig. 3 (Insert), a map of land use in the city of Kolkata, India. (i) What is meant by ‘residential land use’? [1] (ii) Briefly describe the location of the industrial areas in Kolkata. [2] (iii) Suggest reasons for the location of the industrial areas in Kolkata. [3] (b) Study Fig. 4, which shows the growth of the population of Kolkata. 1950 1 2 3 4 5 6 7 8 9 10 11 12 13 14 0 1955 1960 1965 1970 1975 Year Population (millions) 1980 1985 1990 1995 2000 2005 15 Fig. 4 (i) What does Fig. 4 show about changes in the population of Kolkata between 1950 and 2005? Support your answer with dates and figures. [3] (ii) It is estimated that over 25% of the population of Kolkata lives in slums (squatter settlements). Suggest reasons for this. [4]
Question paper, page 7
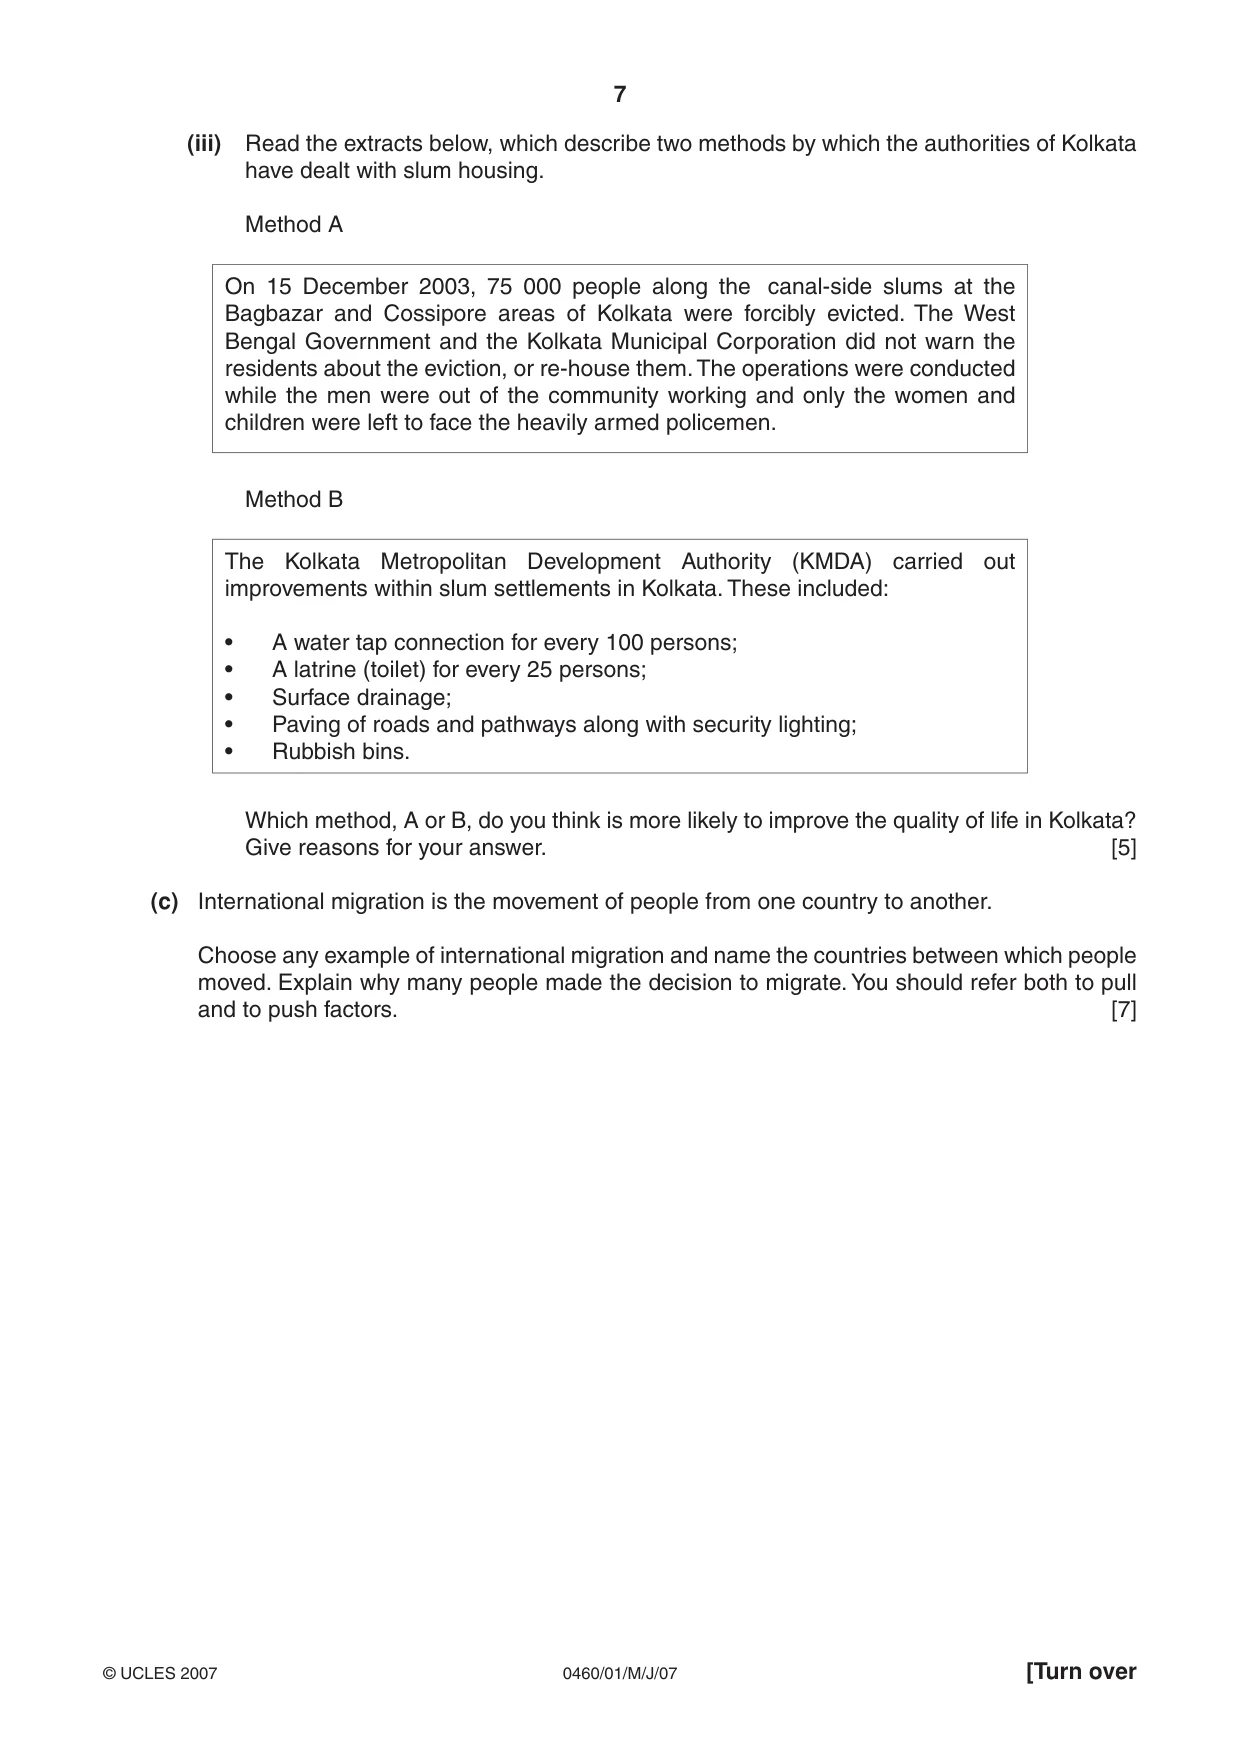
7 0460/01/M/J/07 © UCLES 2007 [Turn over (iii) Read the extracts below, which describe two methods by which the authorities of Kolkata have dealt with slum housing. Method A On 15 December 2003, 75 000 people along the canal-side slums at the Bagbazar and Cossipore areas of Kolkata were forcibly evicted. The West Bengal Government and the Kolkata Municipal Corporation did not warn the residents about the eviction, or re-house them. The operations were conducted while the men were out of the community working and only the women and children were left to face the heavily armed policemen. Method B The Kolkata Metropolitan Development Authority (KMDA) carried out improvements within slum settlements in Kolkata. These included: • A water tap connection for every 100 persons; • A latrine (toilet) for every 25 persons; • Surface drainage; • Paving of roads and pathways along with security lighting; • Rubbish bins. Which method, A or B, do you think is more likely to improve the quality of life in Kolkata? Give reasons for your answer. [5] (c) International migration is the movement of people from one country to another. Choose any example of international migration and name the countries between which people moved. Explain why many people made the decision to migrate. You should refer both to pull and to push factors. [7]
Question paper, page 8
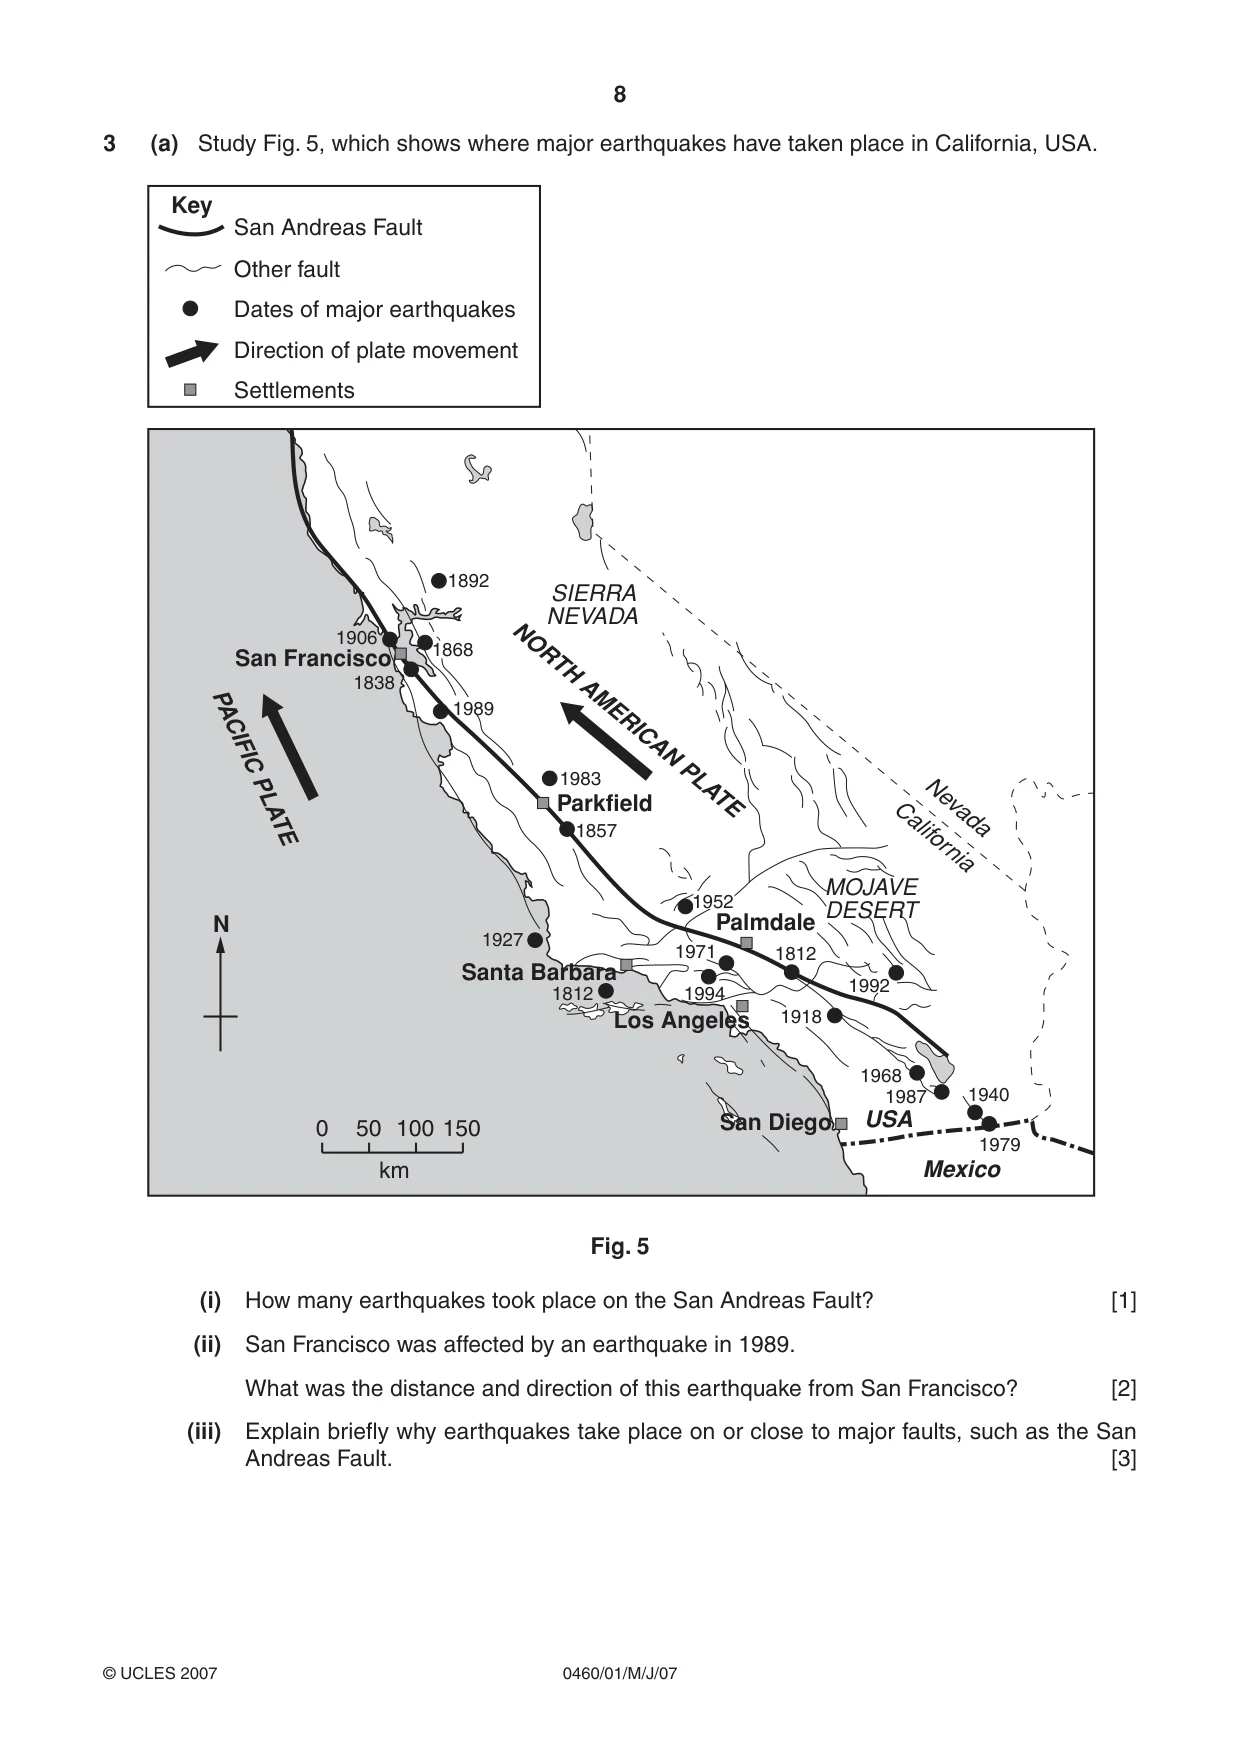
8 0460/01/M/J/07 © UCLES 2007 3 (a) Study Fig. 5, which shows where major earthquakes have taken place in California, USA. 1892 1868 1989 1838 1906 1983 1857 1927 0 50 100 150 km 1992 1918 1968 1940 1979 1987 1812 MOJAVE DESERT SIERRA NEVADA 1994 1971 1812 Santa Barbara San Francisco N PACIFIC PLATE NORTH AMERICAN PLATE Nevada California Parkfield Palmdale Los Angeles San Diego Mexico USA San Andreas Fault Key Other fault Dates of major earthquakes Direction of plate movement Settlements 1952 Fig. 5 (i) How many earthquakes took place on the San Andreas Fault? [1] (ii) San Francisco was affected by an earthquake in 1989. What was the distance and direction of this earthquake from San Francisco? [2] (iii) Explain briefly why earthquakes take place on or close to major faults, such as the San Andreas Fault. [3]
Question paper, page 9
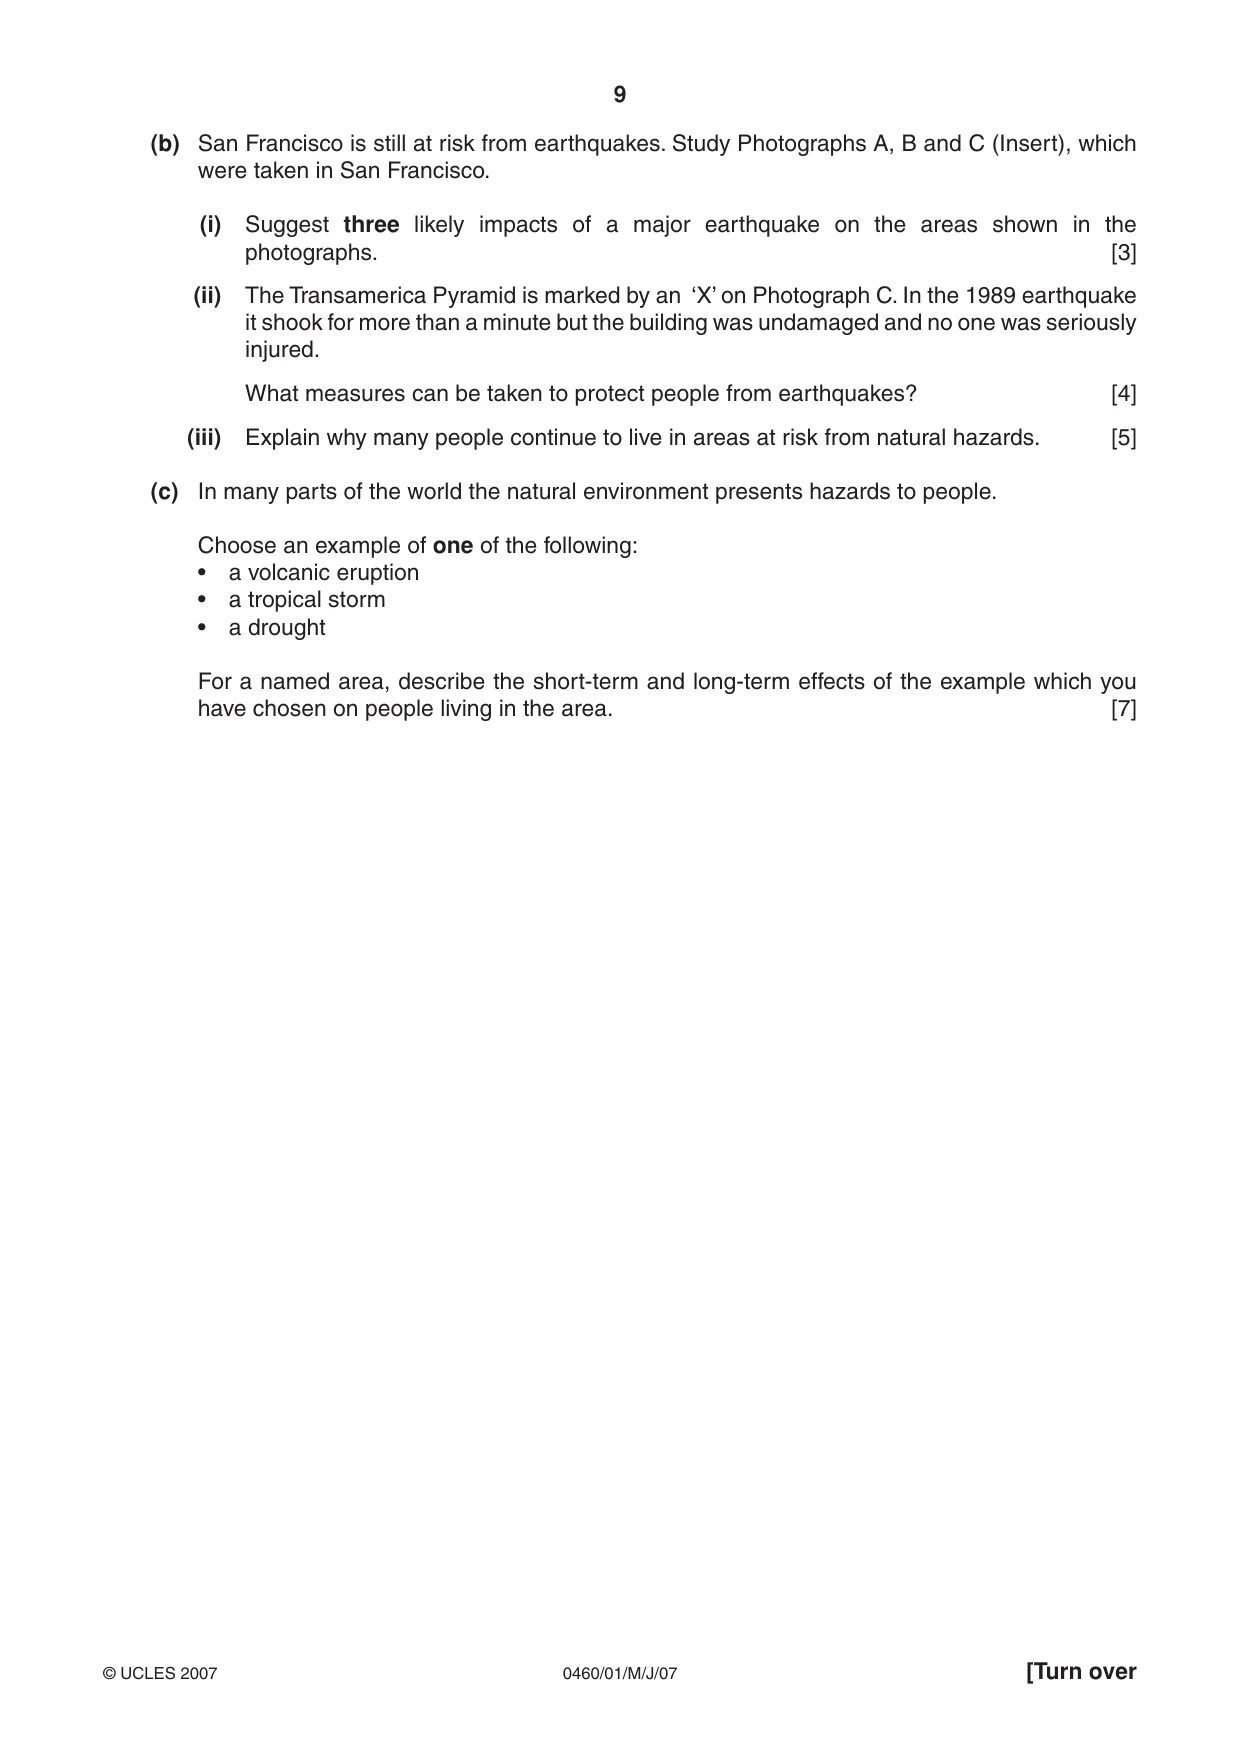
9 0460/01/M/J/07 © UCLES 2007 [Turn over (b) San Francisco is still at risk from earthquakes. Study Photographs A, B and C (Insert), which were taken in San Francisco. (i) Suggest three likely impacts of a major earthquake on the areas shown in the photographs. [3] (ii) The Transamerica Pyramid is marked by an ‘X’ on Photograph C. In the 1989 earthquake it shook for more than a minute but the building was undamaged and no one was seriously injured. What measures can be taken to protect people from earthquakes? [4] (iii) Explain why many people continue to live in areas at risk from natural hazards. [5] (c) In many parts of the world the natural environment presents hazards to people. Choose an example of one of the following: • a volcanic eruption • a tropical storm • a drought For a named area, describe the short-term and long-term effects of the example which you have chosen on people living in the area. [7]
Question paper, page 10
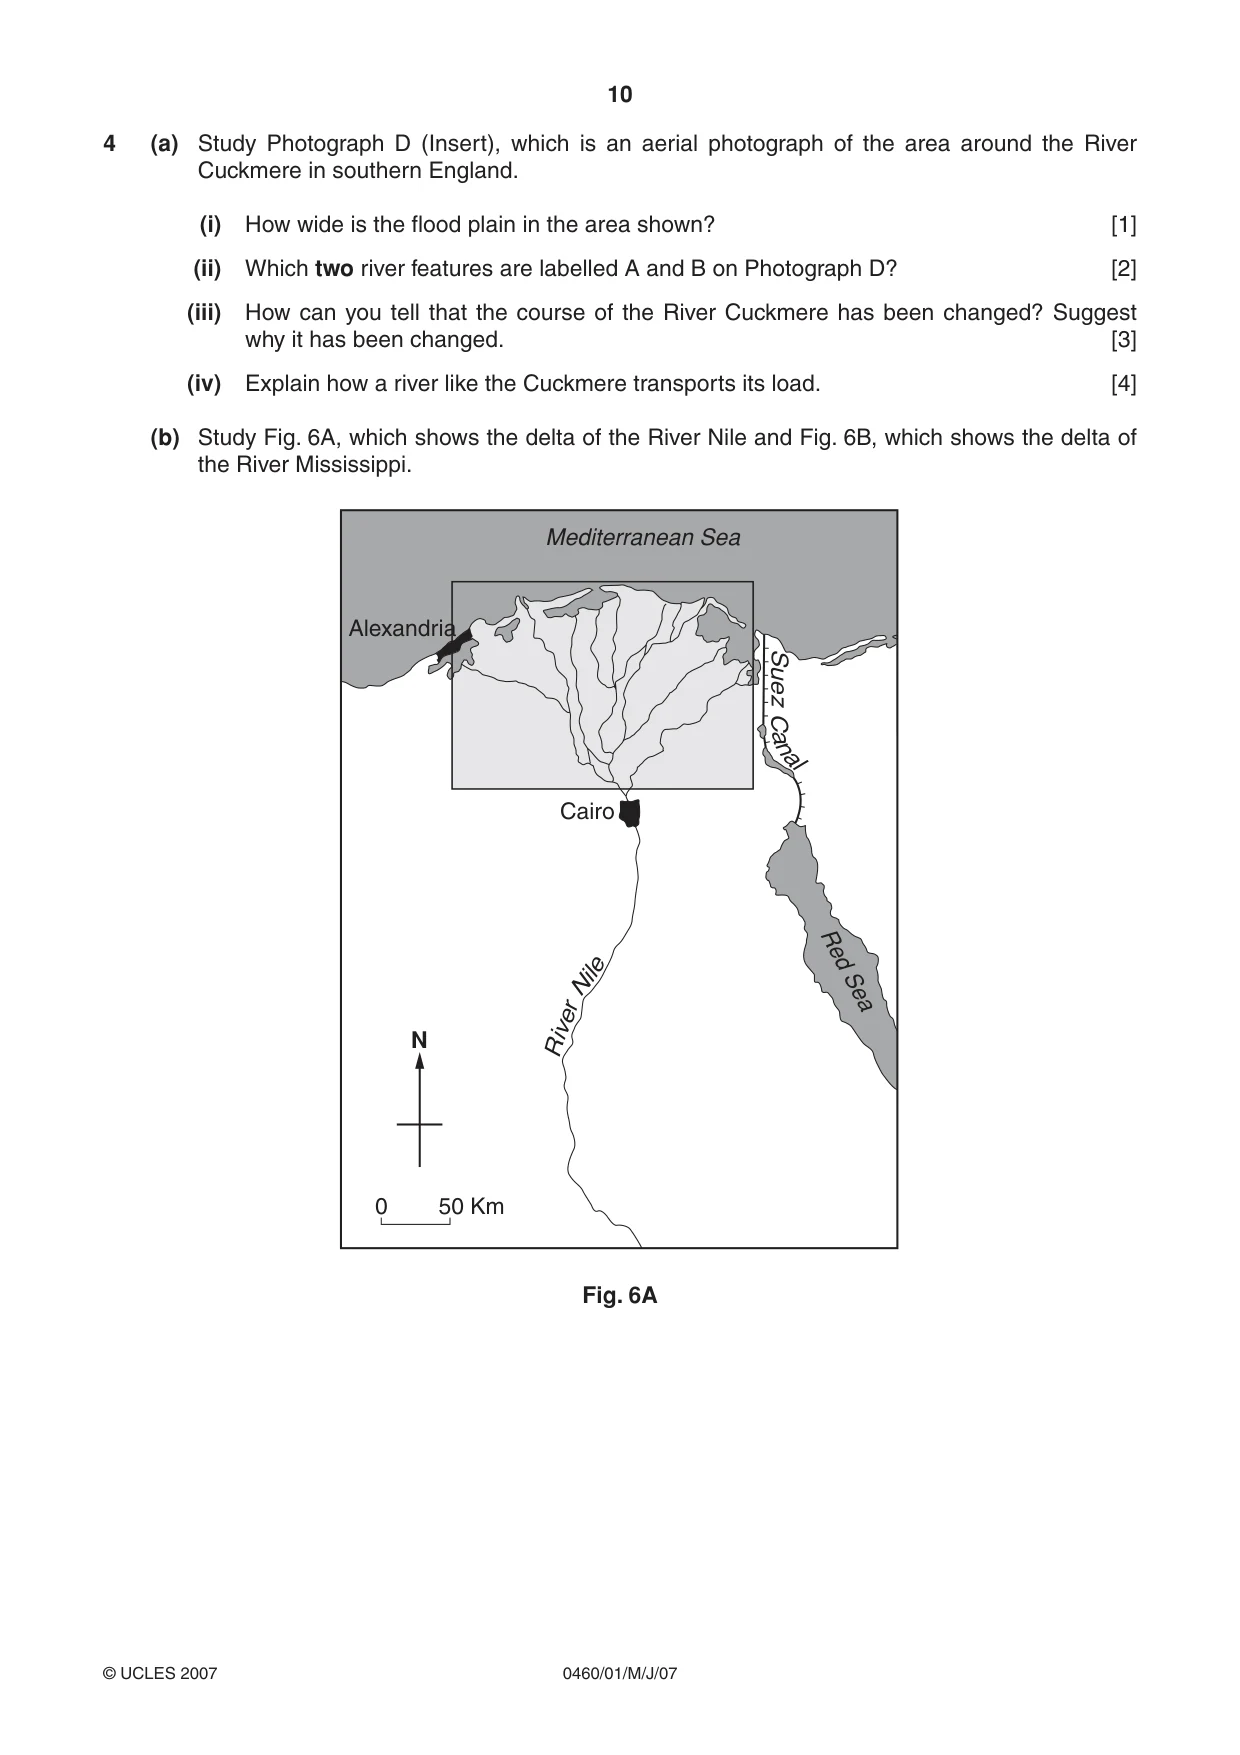
10 0460/01/M/J/07 © UCLES 2007 4 (a) Study Photograph D (Insert), which is an aerial photograph of the area around the River Cuckmere in southern England. (i) How wide is the flood plain in the area shown? [1] (ii) Which two river features are labelled A and B on Photograph D? [2] (iii) How can you tell that the course of the River Cuckmere has been changed? Suggest why it has been changed. [3] (iv) Explain how a river like the Cuckmere transports its load. [4] (b) Study Fig. 6A, which shows the delta of the River Nile and Fig. 6B, which shows the delta of the River Mississippi. Mediterranean Sea Alexandria Cairo 0 50 Km Red Sea R ive r N i l e Suez C a n al N Fig. 6A
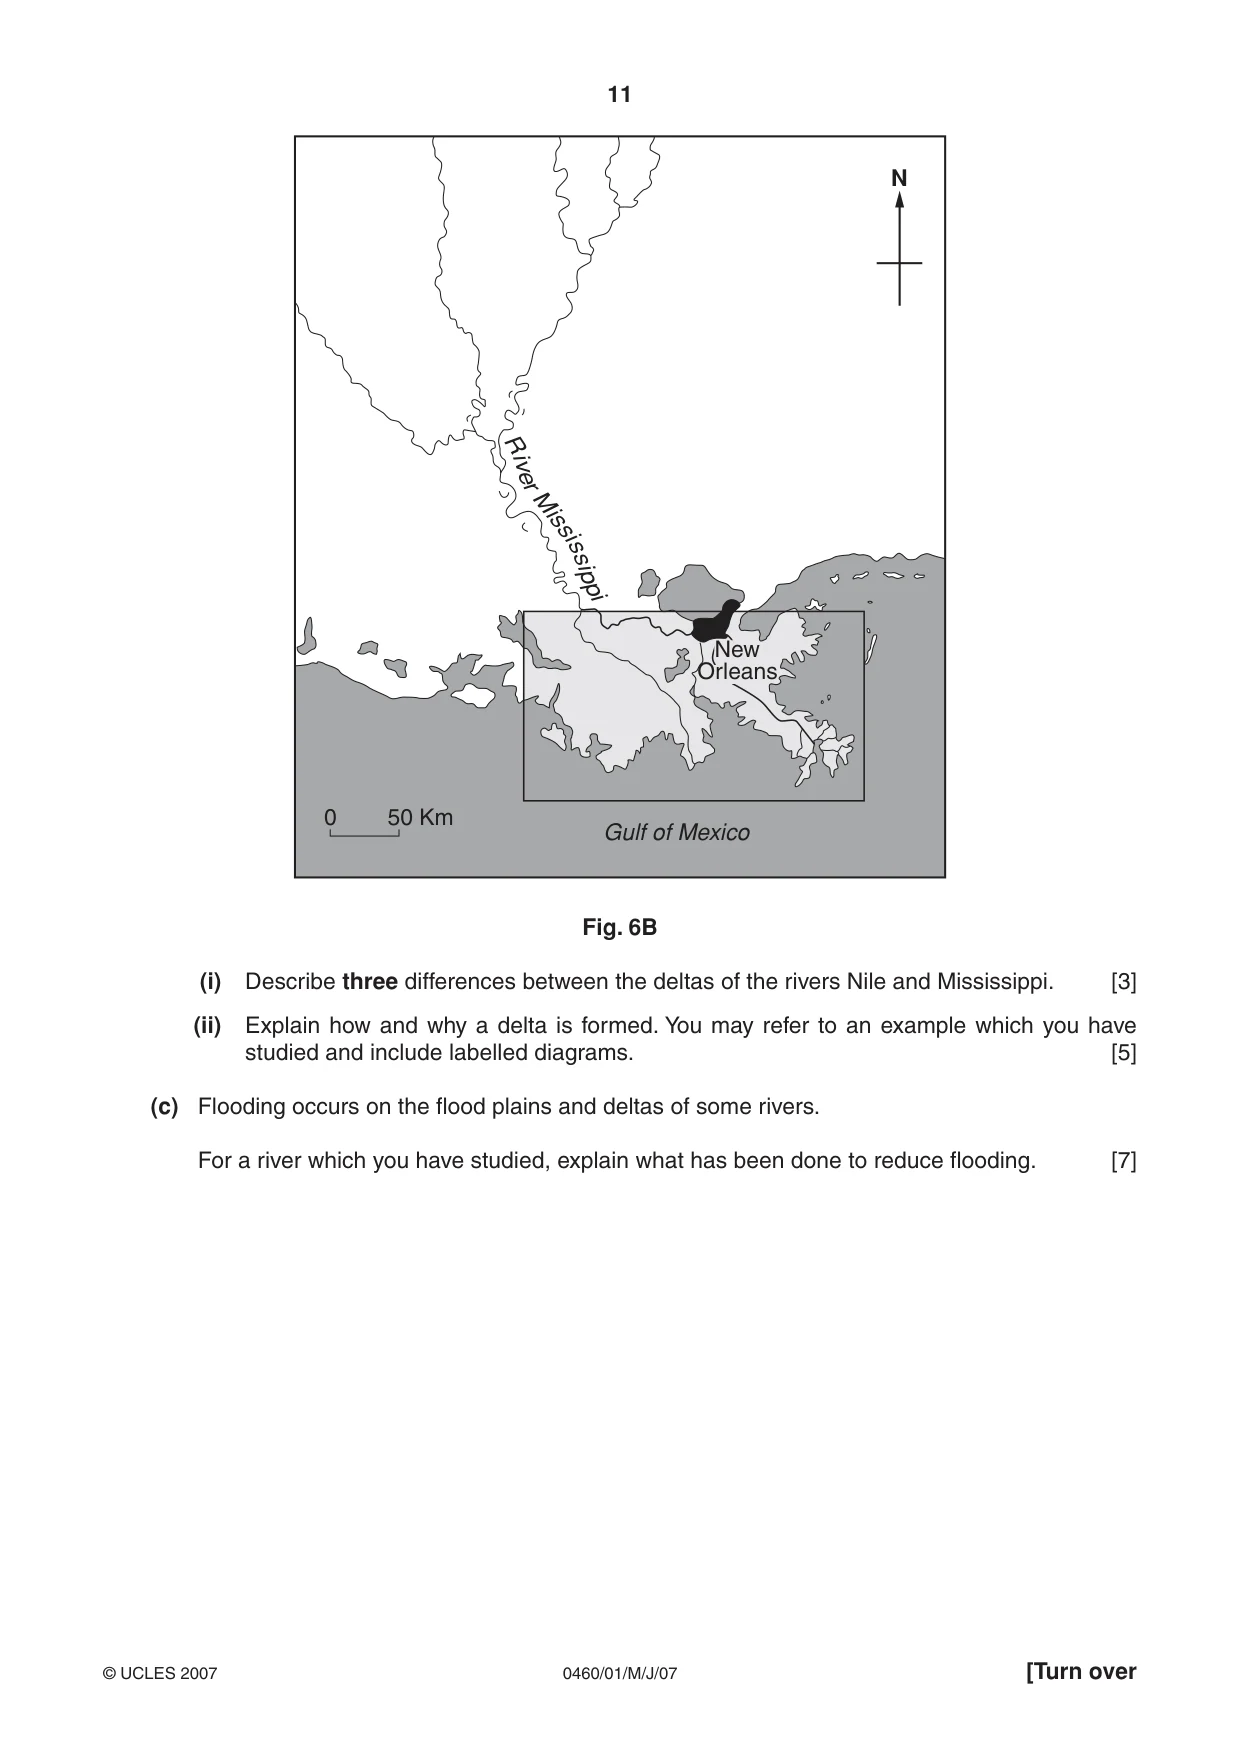
Question paper, page 11
11 0460/01/M/J/07 © UCLES 2007 [Turn over Gulf of Mexico R iv e r Mis si s sip p i N 0 50 Km New Orleans Fig. 6B (i) Describe three differences between the deltas of the rivers Nile and Mississippi. [3] (ii) Explain how and why a delta is formed. You may refer to an example which you have studied and include labelled diagrams. [5] (c) Flooding occurs on the flood plains and deltas of some rivers. For a river which you have studied, explain what has been done to reduce flooding. [7]
Question paper, page 12
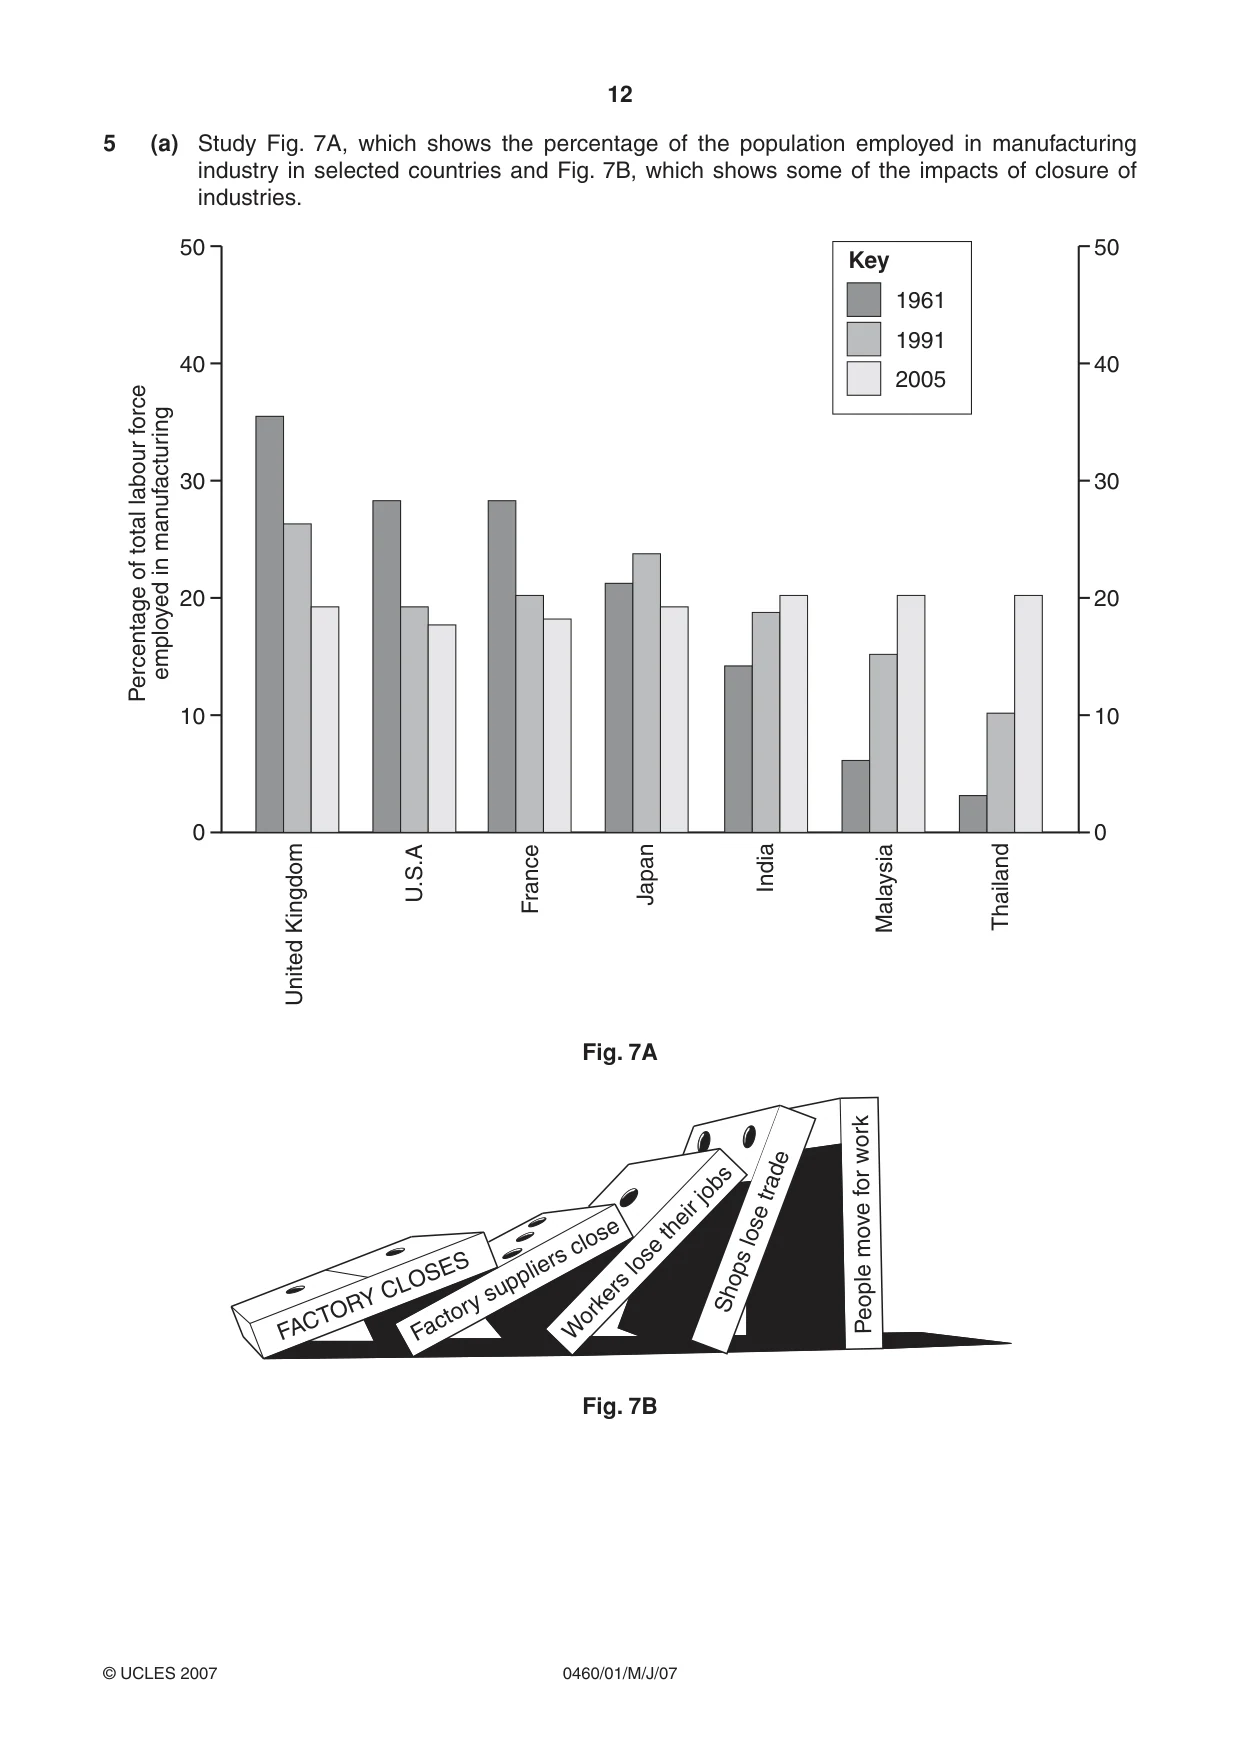
12 0460/01/M/J/07 © UCLES 2007 5 (a) Study Fig. 7A, which shows the percentage of the population employed in manufacturing industry in selected countries and Fig. 7B, which shows some of the impacts of closure of industries. 0 10 Percentage of total labour force employed in manufacturing 20 30 40 50 0 10 20 United Kingdom U.S.A France Japan India Malaysia Thailand 30 40 1961 Key 1991 2005 50 Fig. 7A FACTORY CLOSES Factory suppliers close Workers lose their jobs Shops lose trade People move for work Fig. 7B
Question paper, page 13
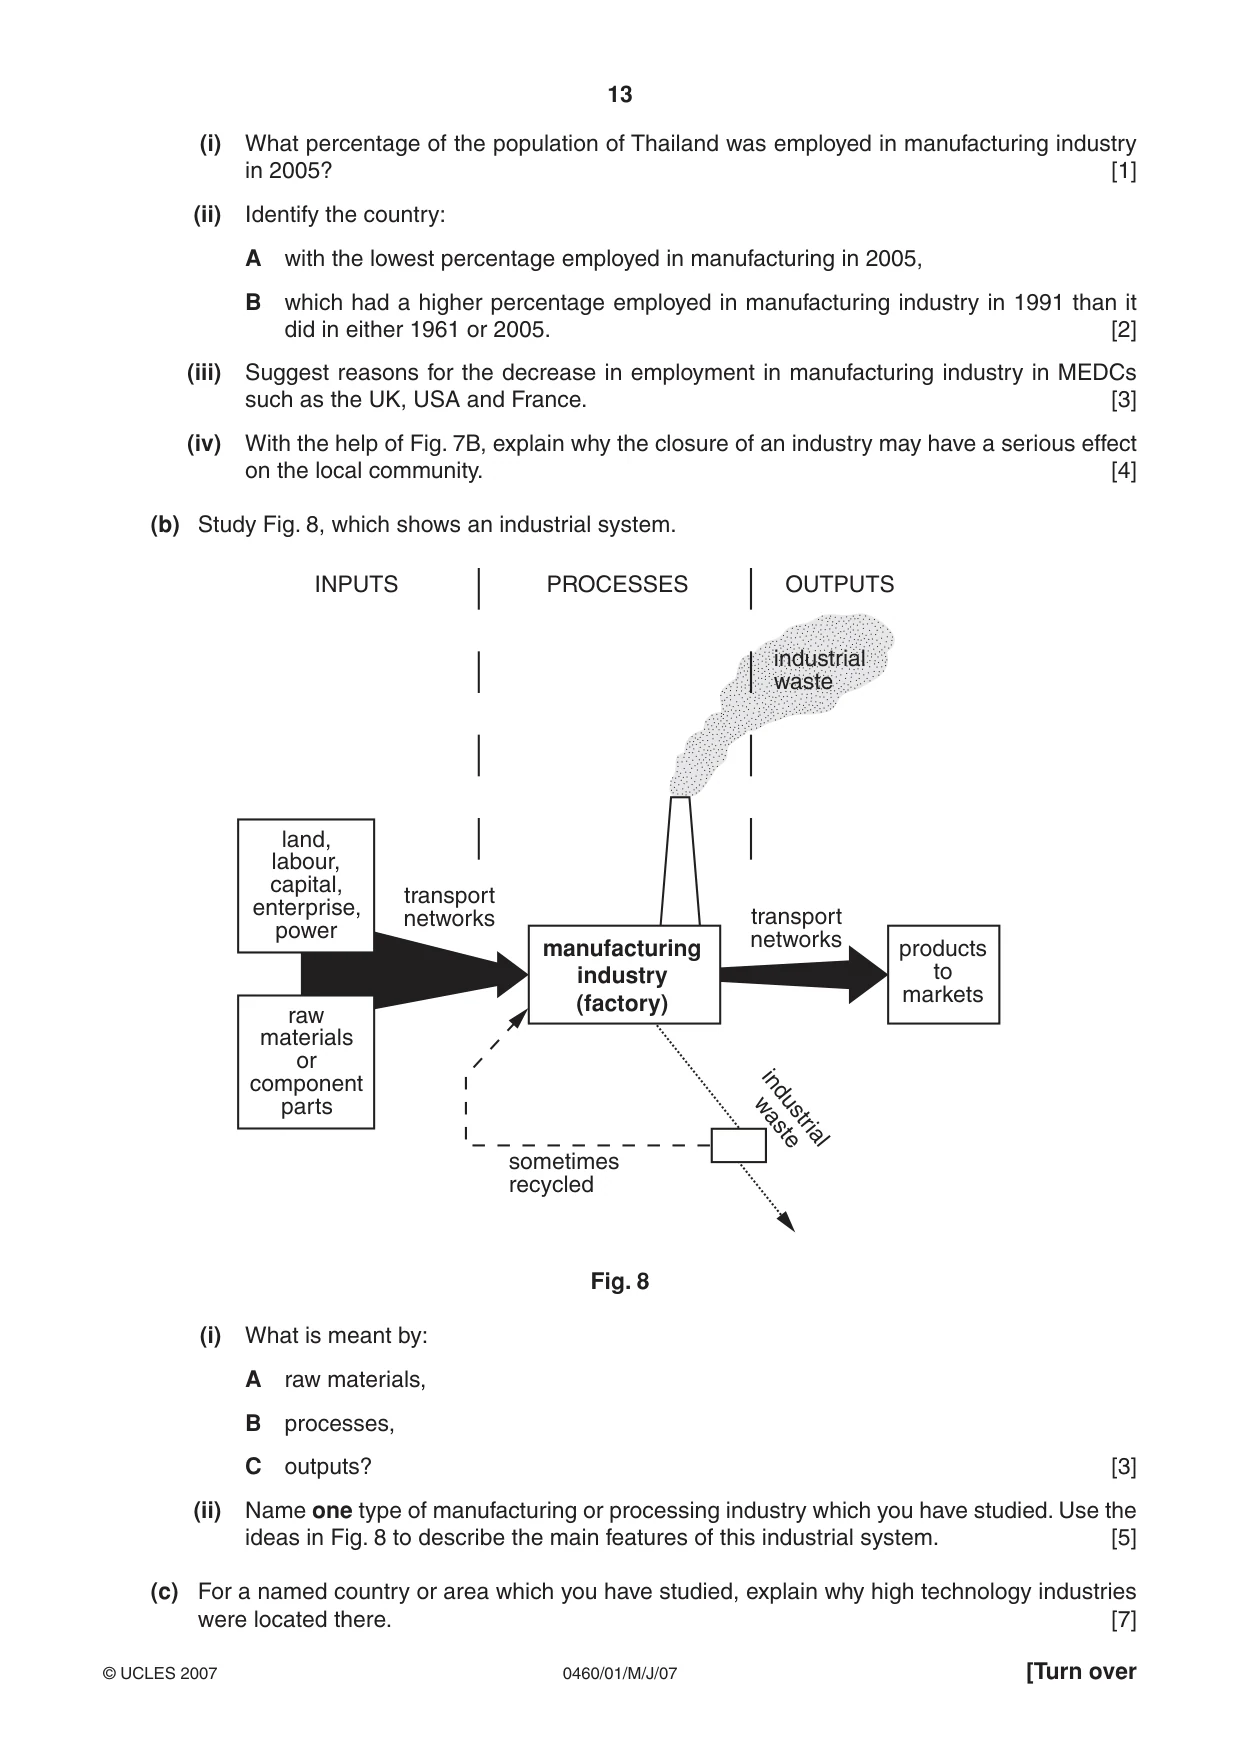
13 0460/01/M/J/07 © UCLES 2007 [Turn over (i) What percentage of the population of Thailand was employed in manufacturing industry in 2005? [1] (ii) Identify the country: A with the lowest percentage employed in manufacturing in 2005, B which had a higher percentage employed in manufacturing industry in 1991 than it did in either 1961 or 2005. [2] (iii) Suggest reasons for the decrease in employment in manufacturing industry in MEDCs such as the UK, USA and France. [3] (iv) With the help of Fig. 7B, explain why the closure of an industry may have a serious effect on the local community. [4] (b) Study Fig. 8, which shows an industrial system. manufacturing industry (factory) products to markets industrial waste transport networks PROCESSES OUTPUTS INPUTS industrial waste transport networks sometimes recycled land, labour, capital, enterprise, power raw materials or component parts Fig. 8 (i) What is meant by: A raw materials, B processes, C outputs? [3] (ii) Name one type of manufacturing or processing industry which you have studied. Use the ideas in Fig. 8 to describe the main features of this industrial system. [5] (c) For a named country or area which you have studied, explain why high technology industries were located there. [7]
Question paper, page 14
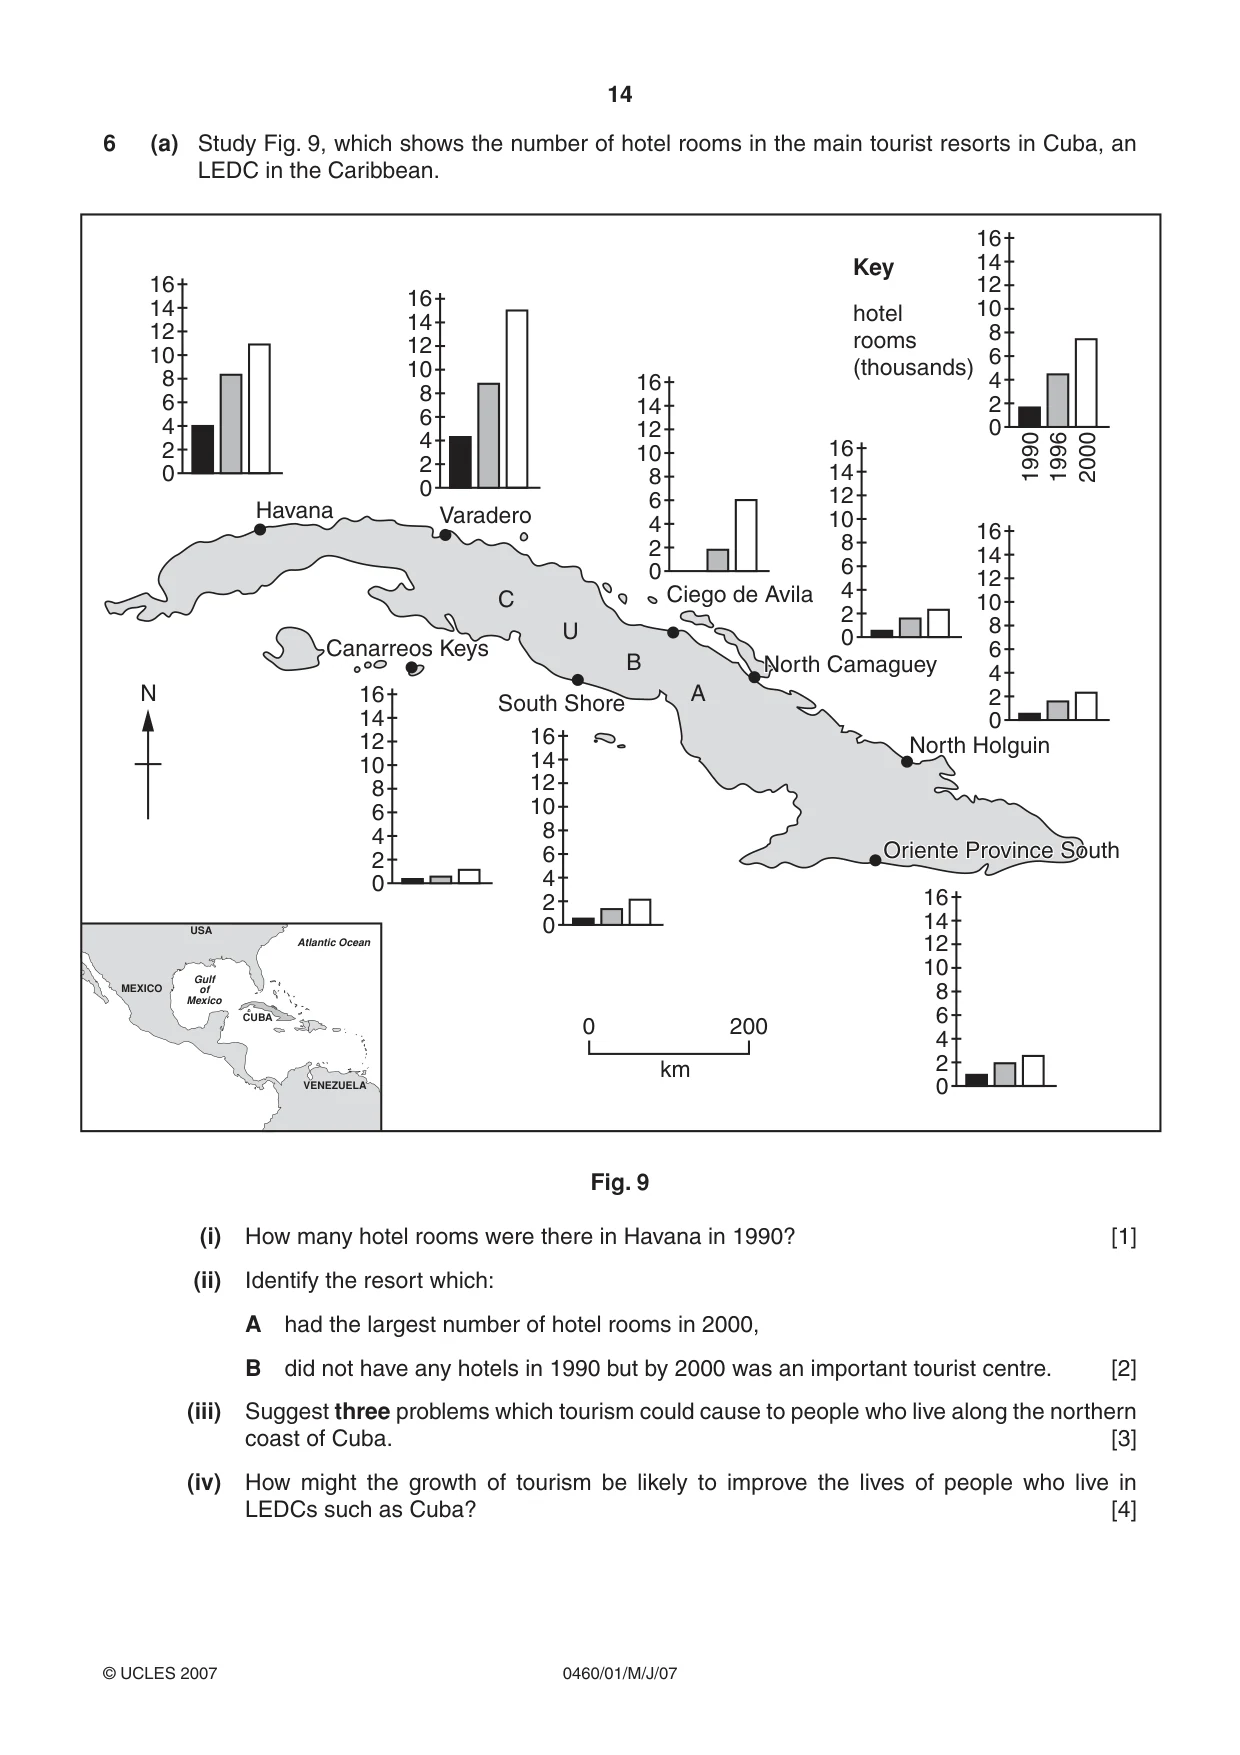
14 0460/01/M/J/07 © UCLES 2007 6 (a) Study Fig. 9, which shows the number of hotel rooms in the main tourist resorts in Cuba, an LEDC in the Caribbean. C U B Havana N 0 2 4 6 8 10 12 14 16 Varadero South Shore North Camaguey North Camaguey Canarreos Keys A North Camaguey Ciego de Avila North Holguin Oriente Province South Oriente Province South Oriente Province South 0 2 4 6 8 10 12 14 16 0 2 4 6 8 10 12 14 16 0 2 4 6 8 10 12 14 16 0 2 4 6 8 10 12 14 16 0 1990 1996 2000 2 4 6 8 10 12 14 16 Key hotel rooms (thousands) 0 2 4 6 8 10 12 14 16 0 0 200 km 2 4 6 8 10 12 14 16 0 CUBA MEXICO VENEZUELA USA Gulf of Mexico Atlantic Ocean 2 4 6 8 10 12 14 16 Fig. 9 (i) How many hotel rooms were there in Havana in 1990? [1] (ii) Identify the resort which: A had the largest number of hotel rooms in 2000, B did not have any hotels in 1990 but by 2000 was an important tourist centre. [2] (iii) Suggest three problems which tourism could cause to people who live along the northern coast of Cuba. [3] (iv) How might the growth of tourism be likely to improve the lives of people who live in LEDCs such as Cuba? [4]
Question paper, page 15
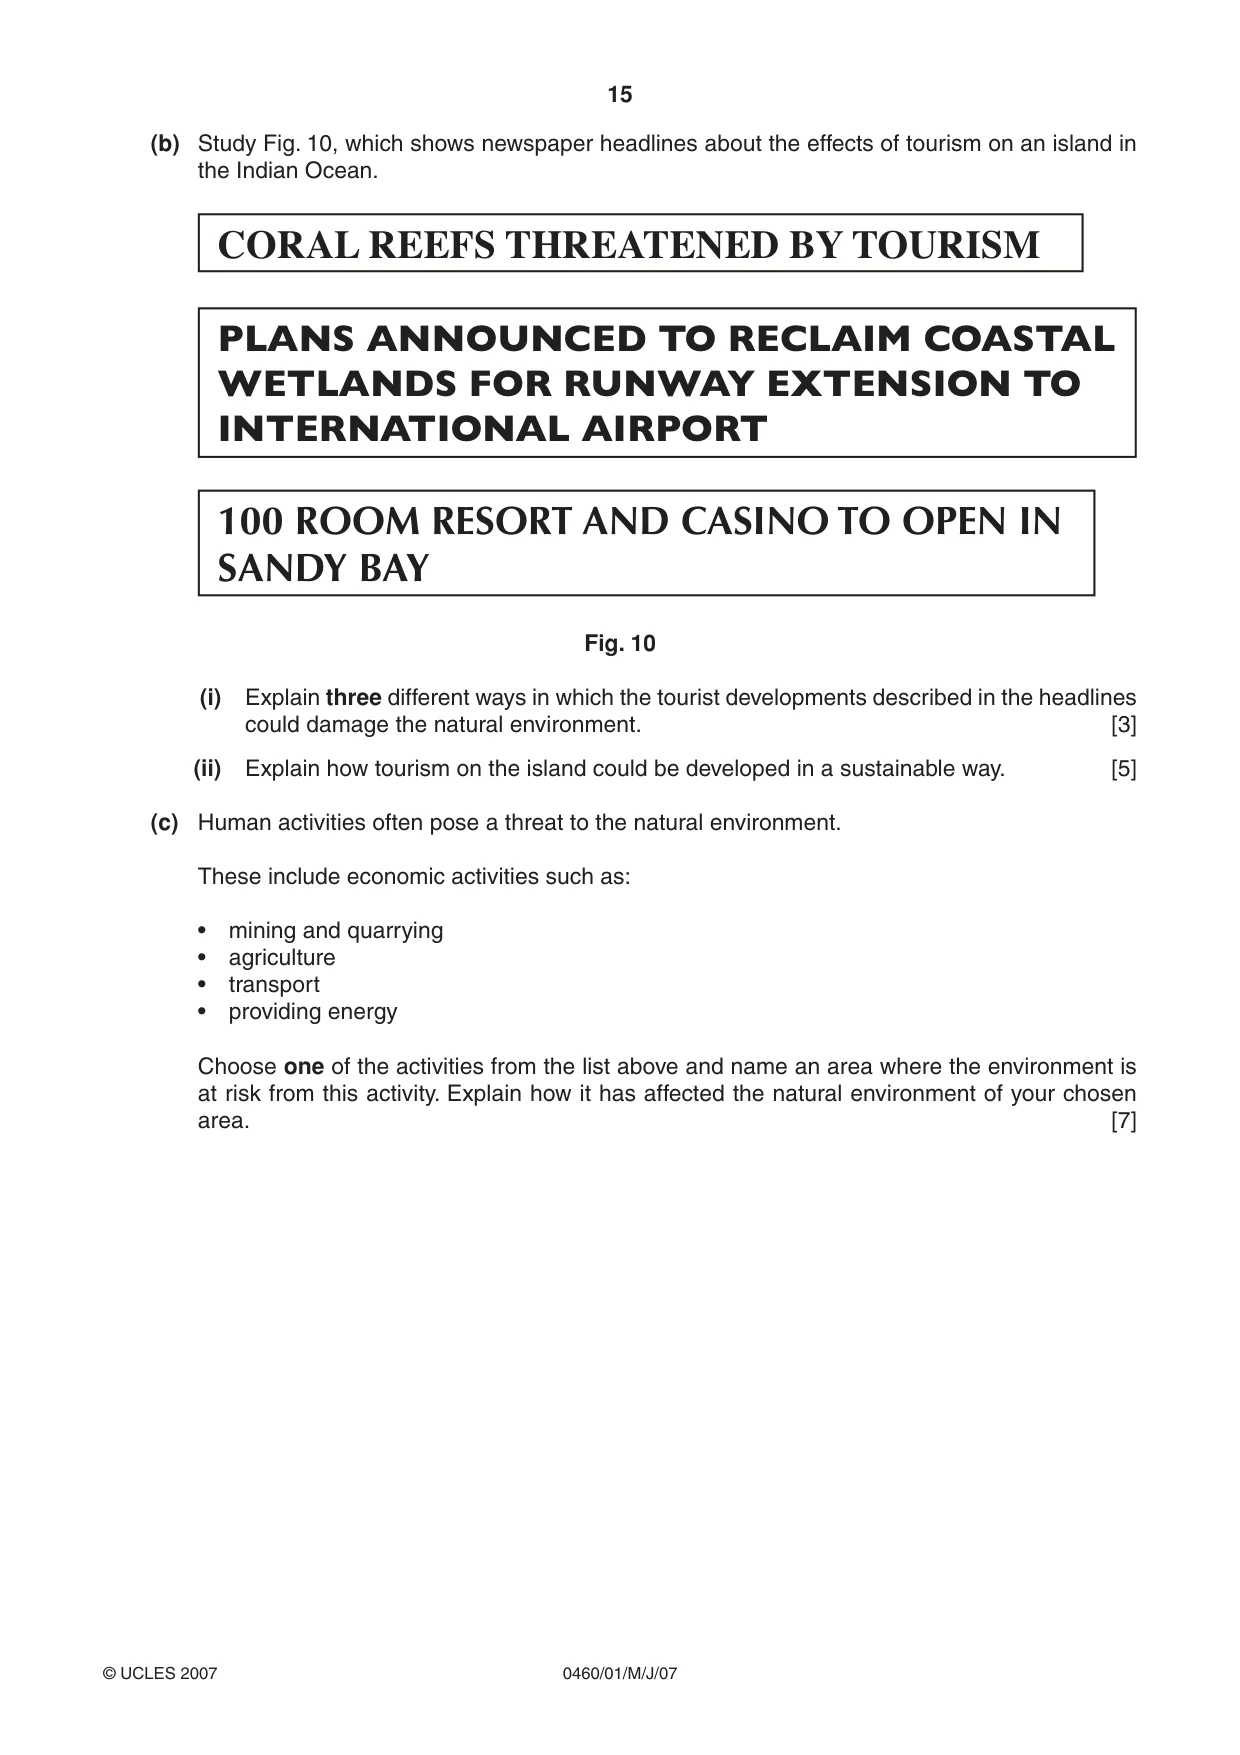
15 0460/01/M/J/07 © UCLES 2007 (b) Study Fig. 10, which shows newspaper headlines about the effects of tourism on an island in the Indian Ocean. CORAL REEFS THREATENED BY TOURISM PLANS ANNOUNCED TO RECLAIM COASTAL WETLANDS FOR RUNWAY EXTENSION TO INTERNATIONAL AIRPORT 100 ROOM RESORT AND CASINO TO OPEN IN SANDY BAY Fig. 10 (i) Explain three different ways in which the tourist developments described in the headlines could damage the natural environment. [3] (ii) Explain how tourism on the island could be developed in a sustainable way. [5] (c) Human activities often pose a threat to the natural environment. These include economic activities such as: • mining and quarrying • agriculture • transport • providing energy Choose one of the activities from the list above and name an area where the environment is at risk from this activity. Explain how it has affected the natural environment of your chosen area. [7]
Question paper, page 16
16 0460/01/M/J/07 BLANK PAGE Copyright Acknowledgements: Question 1 Fig. 1 © UN Population Reference Bureau. Question 1 Fig. 2A & Fig. 2B © http://www.census.gov/cgi-bin/ipc/idbpyrs.pl?cty=NO&out=s&ymax=250 Photograph A S. Sibley © UCLES. Photograph B S. Sibley © UCLES. Photograph C S. Sibley © UCLES. Permission to reproduce items where third-party owned material protected by copyright is included has been sought and cleared where possible. Every reasonable effort has been made by the publisher (UCLES) to trace copyright holders, but if any items requiring clearance have unwittingly been included, the publisher will be pleased to make amends at the earliest possible opportunity. University of Cambridge International Examinations is part of the Cambridge Assessment Group. Cambridge Assessment is the brand name of University of Cambridge Local Examinations Syndicate (UCLES), which is itself a department of the University of Cambridge.
Mark scheme, page 1
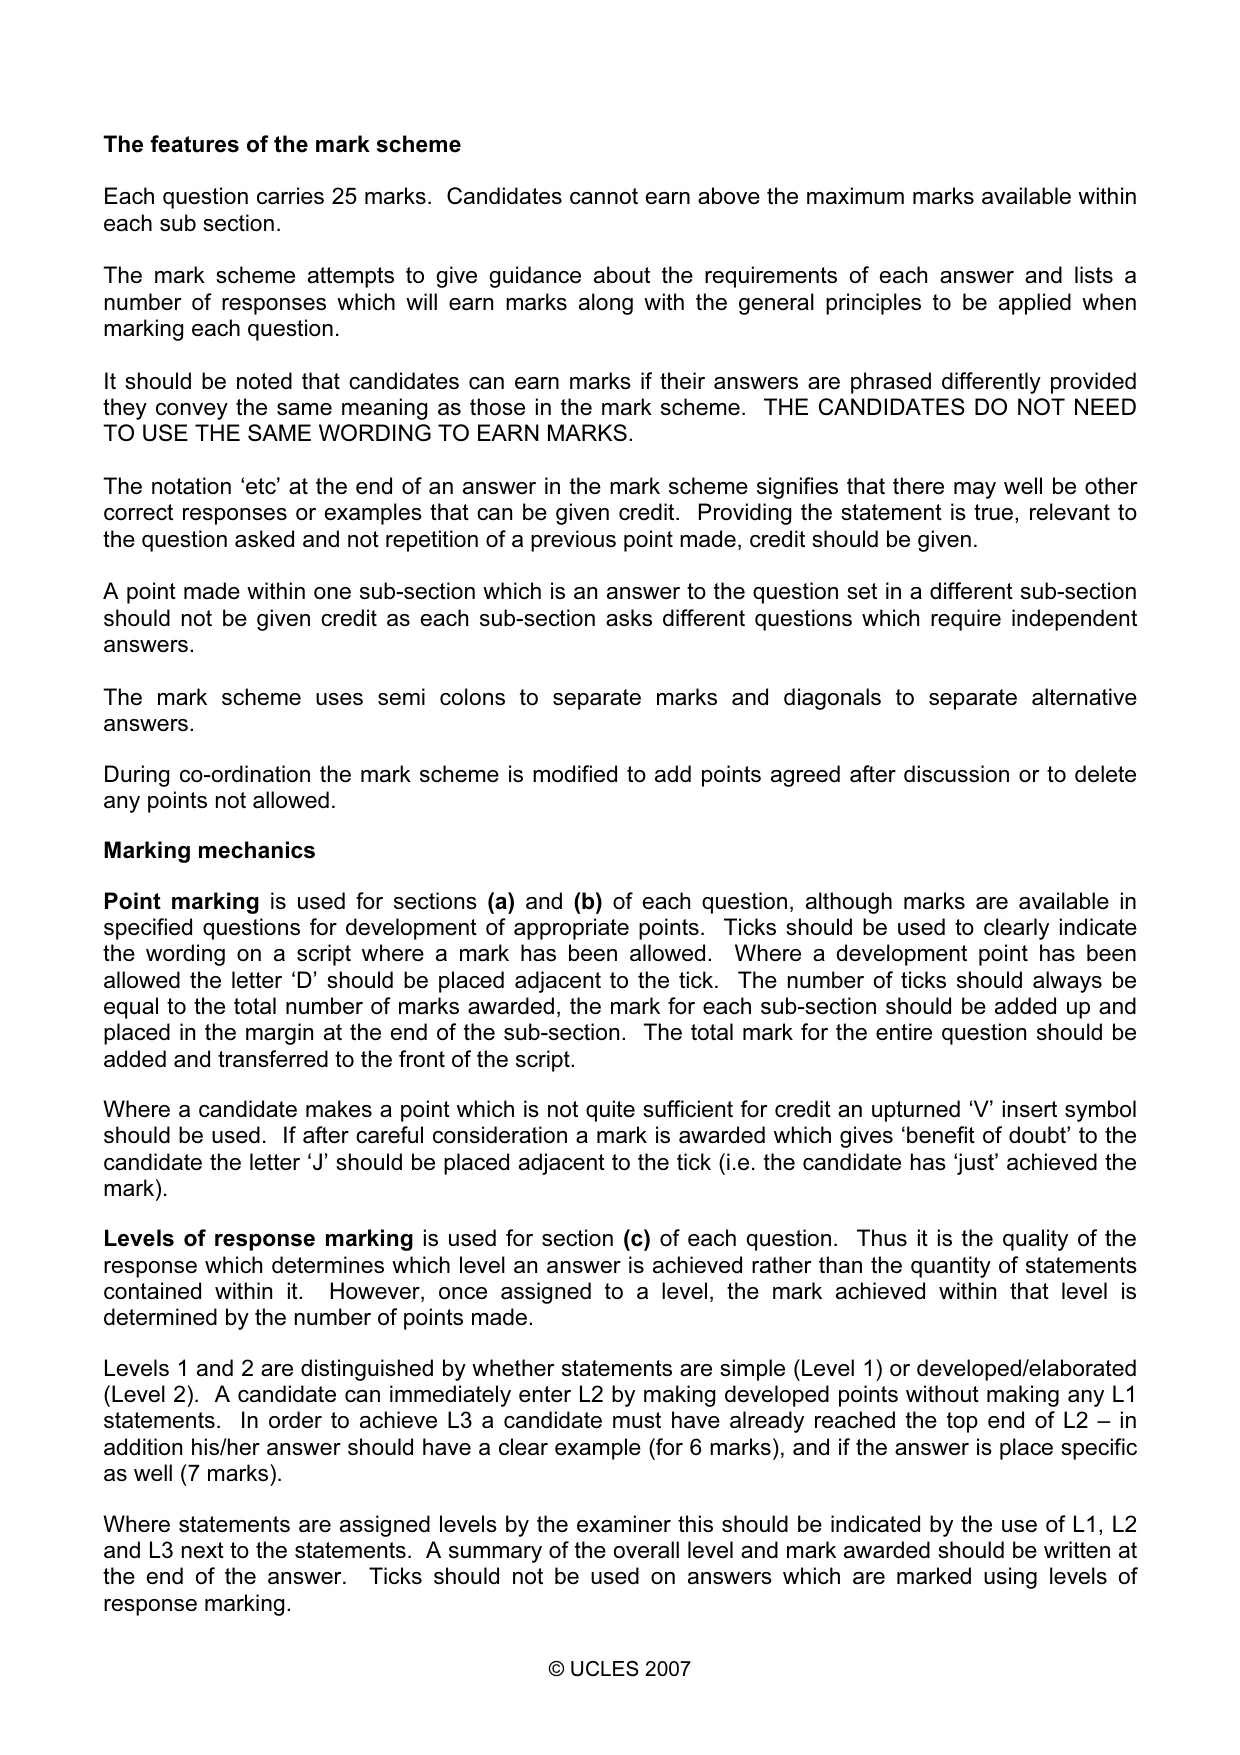
UNIVERSITY OF CAMBRIDGE INTERNATIONAL EXAMINATIONS International General Certificate of Secondary Education MARK SCHEME for the May/June 2007 question paper 0460 GEOGRAPHY 0460/01 Paper 1, maximum raw mark 75 This mark scheme is published as an aid to teachers and candidates, to indicate the requirements of the examination. It shows the basis on which Examiners were instructed to award marks. It does not indicate the details of the discussions that took place at an Examiners’ meeting before marking began. All Examiners are instructed that alternative correct answers and unexpected approaches in candidates’ scripts must be given marks that fairly reflect the relevant knowledge and skills demonstrated. Mark schemes must be read in conjunction with the question papers and the report on the examination. • CIE will not enter into discussions or correspondence in connection with these mark schemes. CIE is publishing the mark schemes for the May/June 2007 question papers for most IGCSE, GCE Advanced Level and Advanced Subsidiary Level syllabuses and some Ordinary Level syllabuses. www.XtremePapers.com
Mark scheme, page 2
© UCLES 2007 The features of the mark scheme Each question carries 25 marks. Candidates cannot earn above the maximum marks available within each sub section. The mark scheme attempts to give guidance about the requirements of each answer and lists a number of responses which will earn marks along with the general principles to be applied when marking each question. It should be noted that candidates can earn marks if their answers are phrased differently provided they convey the same meaning as those in the mark scheme. THE CANDIDATES DO NOT NEED TO USE THE SAME WORDING TO EARN MARKS. The notation ‘etc’ at the end of an answer in the mark scheme signifies that there may well be other correct responses or examples that can be given credit. Providing the statement is true, relevant to the question asked and not repetition of a previous point made, credit should be given. A point made within one sub-section which is an answer to the question set in a different sub-section should not be given credit as each sub-section asks different questions which require independent answers. The mark scheme uses semi colons to separate marks and diagonals to separate alternative answers. During co-ordination the mark scheme is modified to add points agreed after discussion or to delete any points not allowed. Marking mechanics Point marking is used for sections (a) and (b) of each question, although marks are available in specified questions for development of appropriate points. Ticks should be used to clearly indicate the wording on a script where a mark has been allowed. Where a development point has been allowed the letter ‘D’ should be placed adjacent to the tick. The number of ticks should always be equal to the total number of marks awarded, the mark for each sub-section should be added up and placed in the margin at the end of the sub-section. The total mark for the entire question should be added and transferred to the front of the script. Where a candidate makes a point which is not quite sufficient for credit an upturned ‘V’ insert symbol should be used. If after careful consideration a mark is awarded which gives ‘benefit of doubt’ to the candidate the letter ‘J’ should be placed adjacent to the tick (i.e. the candidate has ‘just’ achieved the mark). Levels of response marking is used for section (c) of each question. Thus it is the quality of the response which determines which level an answer is achieved rather than the quantity of statements contained within it. However, once assigned to a level, the mark achieved within that level is determined by the number of points made. Levels 1 and 2 are distinguished by whether statements are simple (Level 1) or developed/elaborated (Level 2). A candidate can immediately enter L2 by making developed points without making any L1 statements. In order to achieve L3 a candidate must have already reached the top end of L2 – in addition his/her answer should have a clear example (for 6 marks), and if the answer is place specific as well (7 marks). Where statements are assigned levels by the examiner this should be indicated by the use of L1, L2 and L3 next to the statements. A summary of the overall level and mark awarded should be written at the end of the answer. Ticks should not be used on answers which are marked using levels of response marking.
Mark scheme, page 3
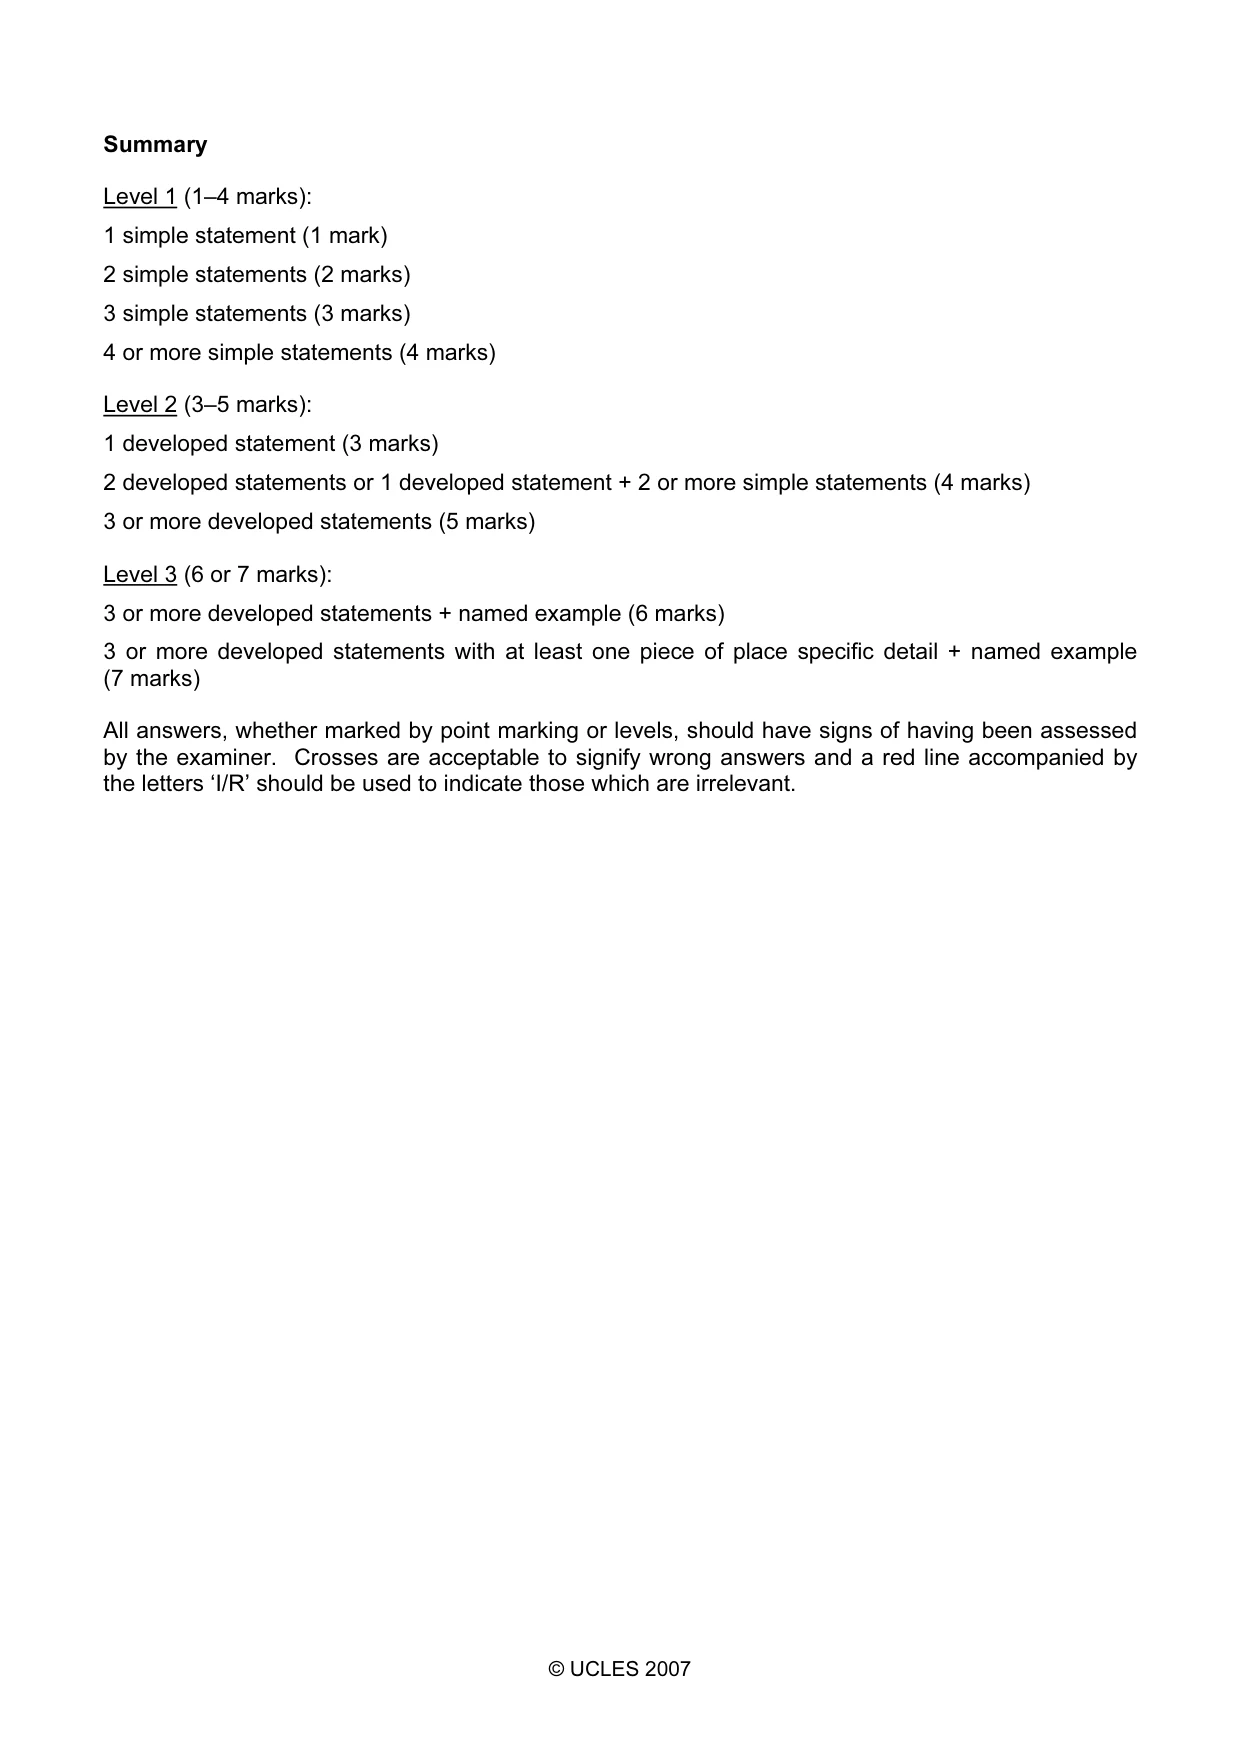
© UCLES 2007 Summary Level 1 (1–4 marks): 1 simple statement (1 mark) 2 simple statements (2 marks) 3 simple statements (3 marks) 4 or more simple statements (4 marks) Level 2 (3–5 marks): 1 developed statement (3 marks) 2 developed statements or 1 developed statement + 2 or more simple statements (4 marks) 3 or more developed statements (5 marks) Level 3 (6 or 7 marks): 3 or more developed statements + named example (6 marks) 3 or more developed statements with at least one piece of place specific detail + named example (7 marks) All answers, whether marked by point marking or levels, should have signs of having been assessed by the examiner. Crosses are acceptable to signify wrong answers and a red line accompanied by the letters ‘I/R’ should be used to indicate those which are irrelevant.
Mark scheme, page 4
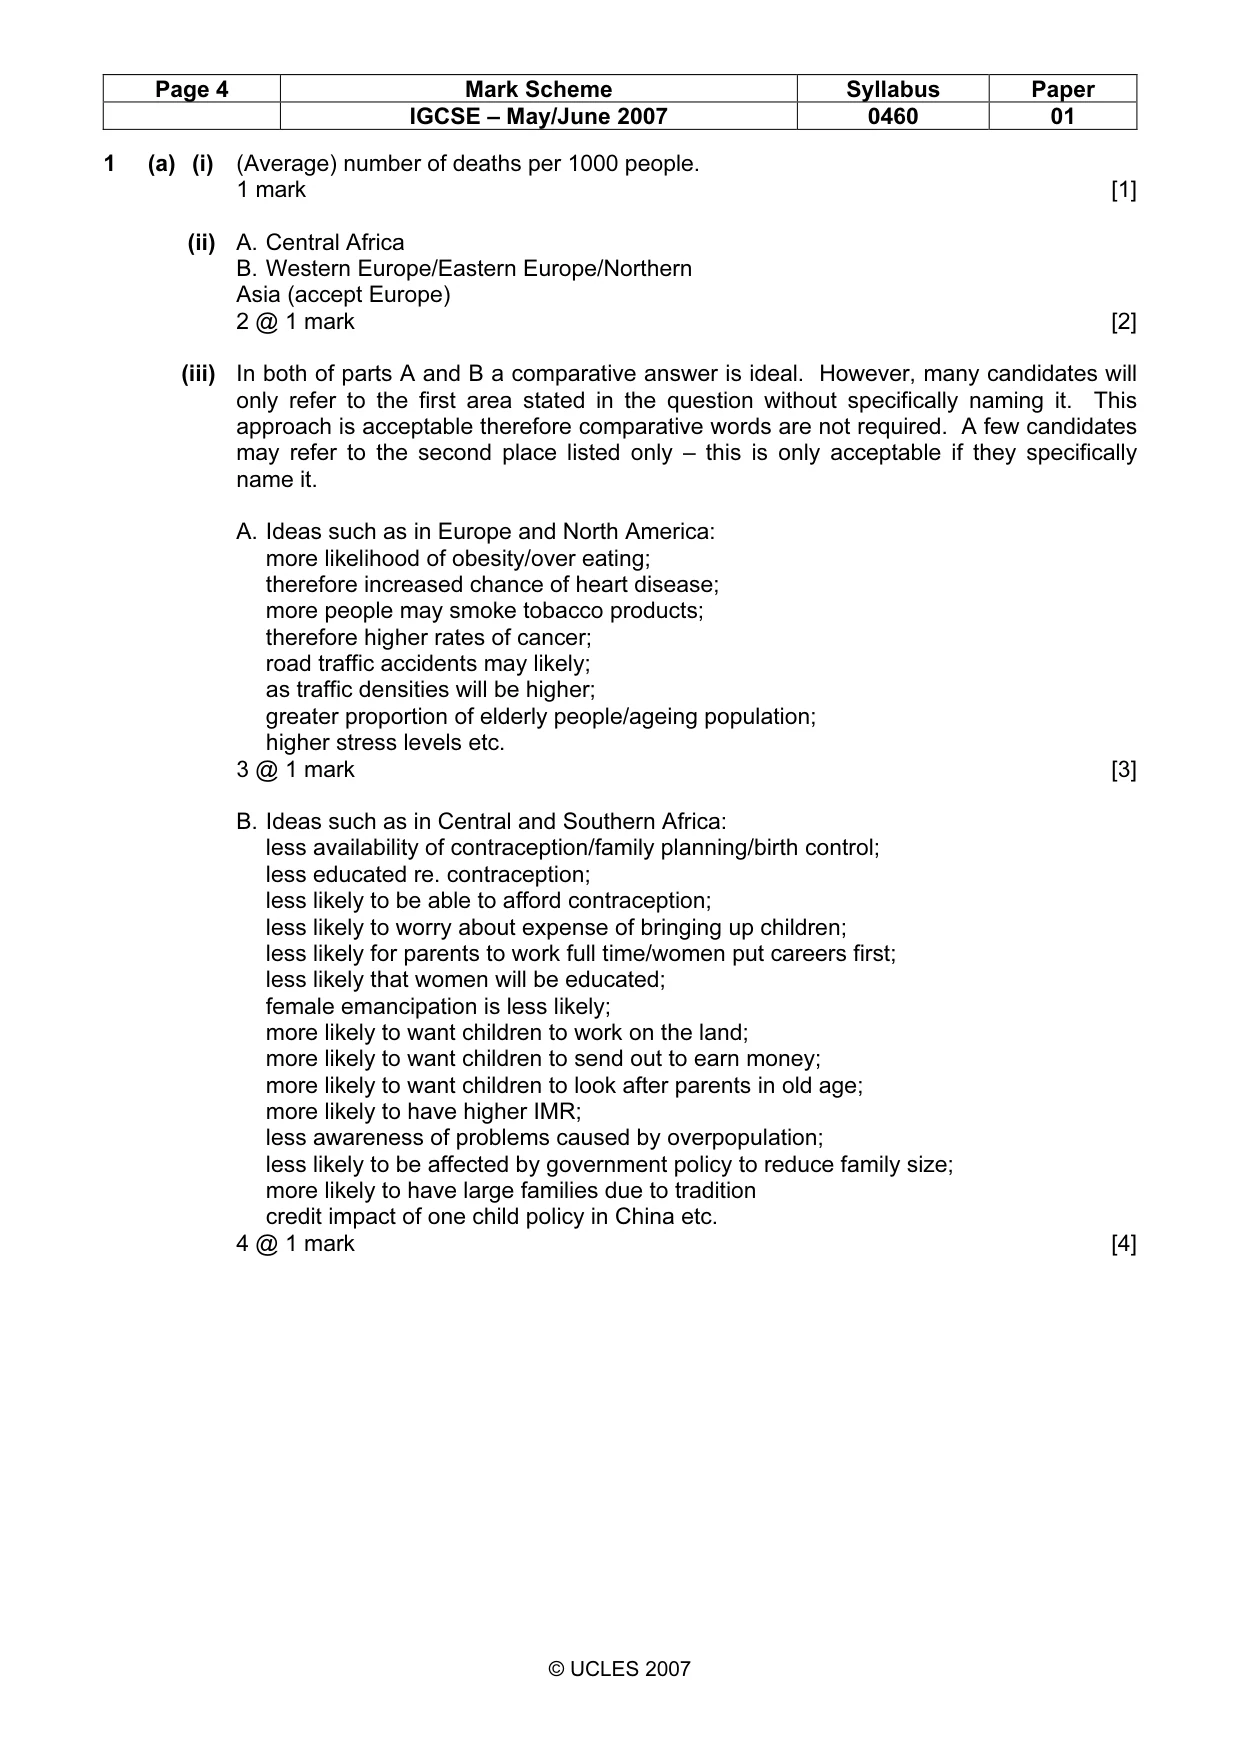
Page 4 Mark Scheme Syllabus Paper IGCSE – May/June 2007 0460 01 © UCLES 2007 1 (a) (i) (Average) number of deaths per 1000 people. 1 mark [1] (ii) A. Central Africa B. Western Europe/Eastern Europe/Northern Asia (accept Europe) 2 @ 1 mark [2] (iii) In both of parts A and B a comparative answer is ideal. However, many candidates will only refer to the first area stated in the question without specifically naming it. This approach is acceptable therefore comparative words are not required. A few candidates may refer to the second place listed only – this is only acceptable if they specifically name it. A. Ideas such as in Europe and North America: more likelihood of obesity/over eating; therefore increased chance of heart disease; more people may smoke tobacco products; therefore higher rates of cancer; road traffic accidents may likely; as traffic densities will be higher; greater proportion of elderly people/ageing population; higher stress levels etc. 3 @ 1 mark [3] B. Ideas such as in Central and Southern Africa: less availability of contraception/family planning/birth control; less educated re. contraception; less likely to be able to afford contraception; less likely to worry about expense of bringing up children; less likely for parents to work full time/women put careers first; less likely that women will be educated; female emancipation is less likely; more likely to want children to work on the land; more likely to want children to send out to earn money; more likely to want children to look after parents in old age; more likely to have higher IMR; less awareness of problems caused by overpopulation; less likely to be affected by government policy to reduce family size; more likely to have large families due to tradition credit impact of one child policy in China etc. 4 @ 1 mark [4]
Mark scheme, page 5
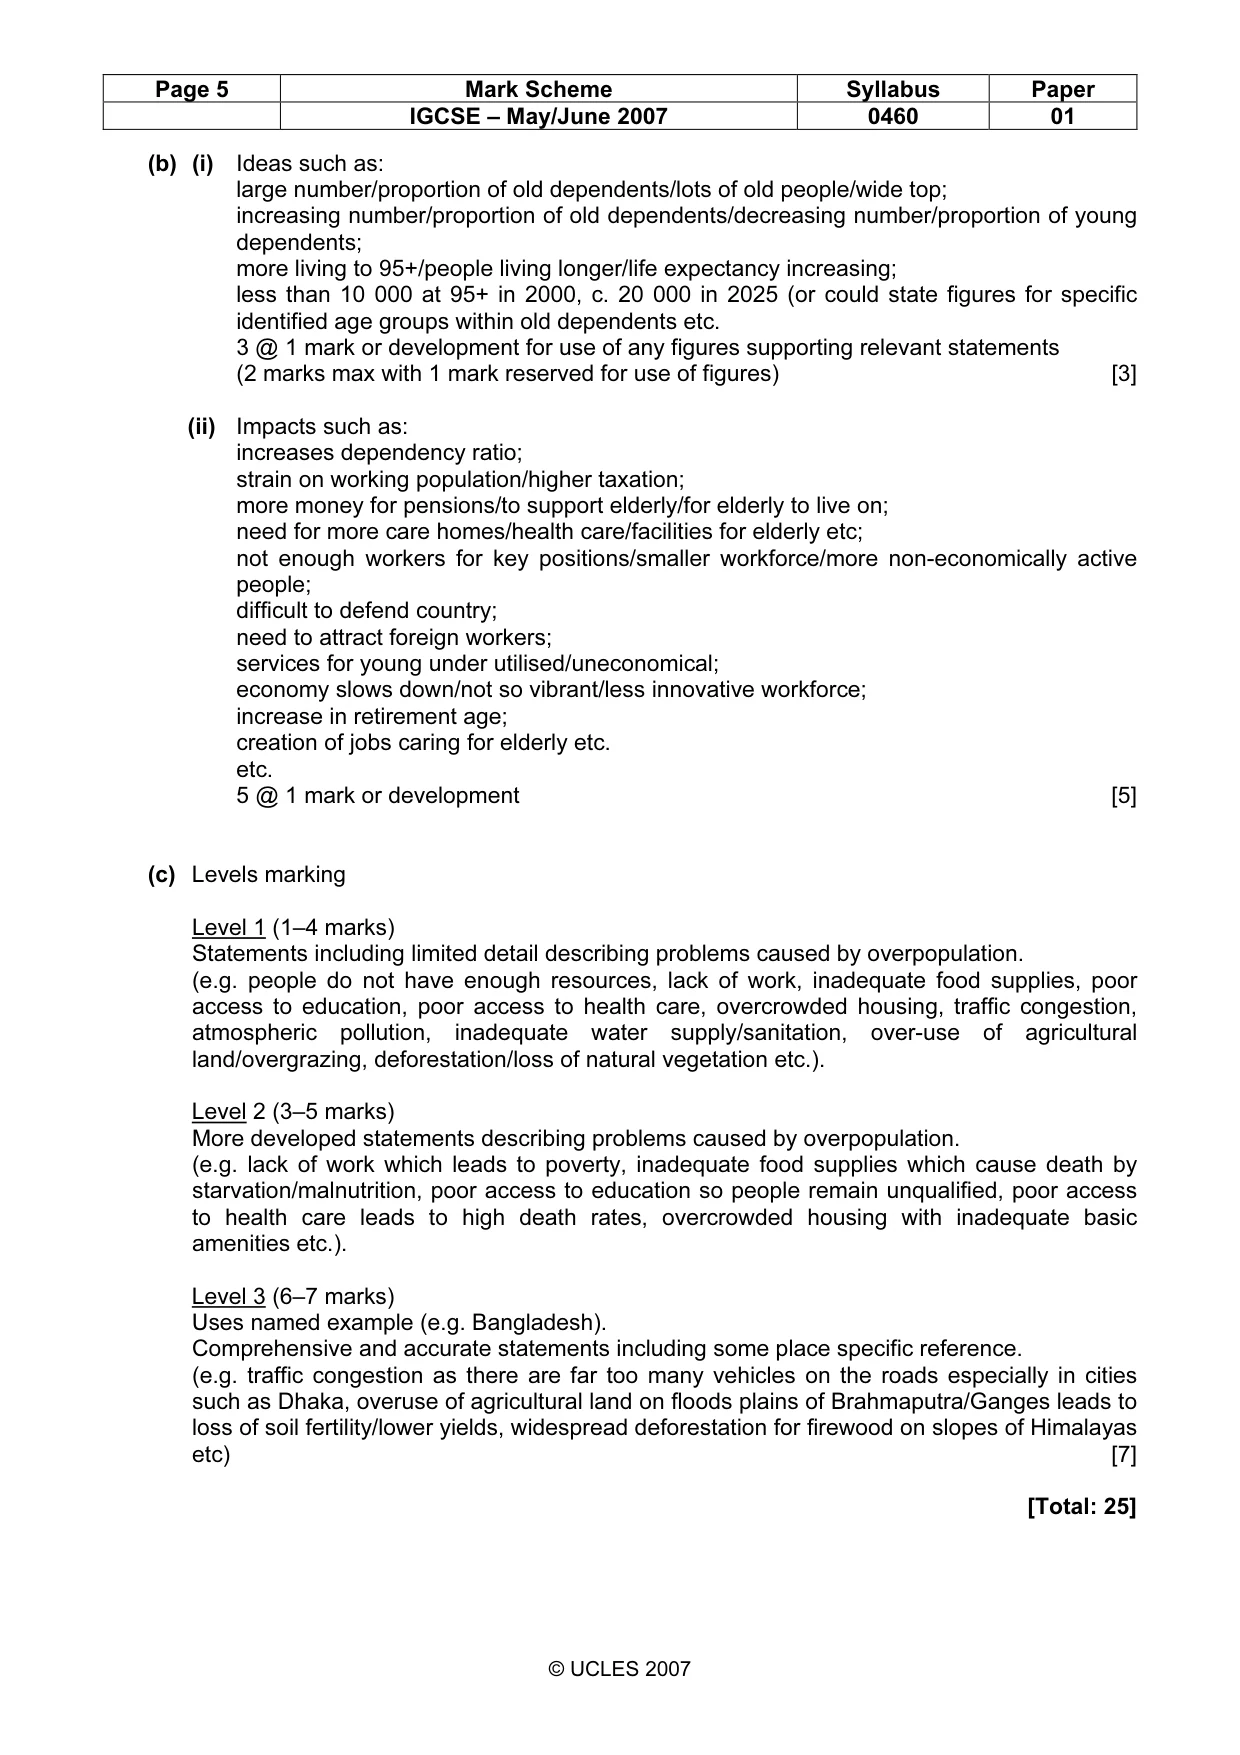
Page 5 Mark Scheme Syllabus Paper IGCSE – May/June 2007 0460 01 © UCLES 2007 (b) (i) Ideas such as: large number/proportion of old dependents/lots of old people/wide top; increasing number/proportion of old dependents/decreasing number/proportion of young dependents; more living to 95+/people living longer/life expectancy increasing; less than 10 000 at 95+ in 2000, c. 20 000 in 2025 (or could state figures for specific identified age groups within old dependents etc. 3 @ 1 mark or development for use of any figures supporting relevant statements (2 marks max with 1 mark reserved for use of figures) [3] (ii) Impacts such as: increases dependency ratio; strain on working population/higher taxation; more money for pensions/to support elderly/for elderly to live on; need for more care homes/health care/facilities for elderly etc; not enough workers for key positions/smaller workforce/more non-economically active people; difficult to defend country; need to attract foreign workers; services for young under utilised/uneconomical; economy slows down/not so vibrant/less innovative workforce; increase in retirement age; creation of jobs caring for elderly etc. etc. 5 @ 1 mark or development [5] (c) Levels marking Level 1 (1–4 marks) Statements including limited detail describing problems caused by overpopulation. (e.g. people do not have enough resources, lack of work, inadequate food supplies, poor access to education, poor access to health care, overcrowded housing, traffic congestion, atmospheric pollution, inadequate water supply/sanitation, over-use of agricultural land/overgrazing, deforestation/loss of natural vegetation etc.). Level 2 (3–5 marks) More developed statements describing problems caused by overpopulation. (e.g. lack of work which leads to poverty, inadequate food supplies which cause death by starvation/malnutrition, poor access to education so people remain unqualified, poor access to health care leads to high death rates, overcrowded housing with inadequate basic amenities etc.). Level 3 (6–7 marks) Uses named example (e.g. Bangladesh). Comprehensive and accurate statements including some place specific reference. (e.g. traffic congestion as there are far too many vehicles on the roads especially in cities such as Dhaka, overuse of agricultural land on floods plains of Brahmaputra/Ganges leads to loss of soil fertility/lower yields, widespread deforestation for firewood on slopes of Himalayas etc) [7] [Total: 25]
Mark scheme, page 6
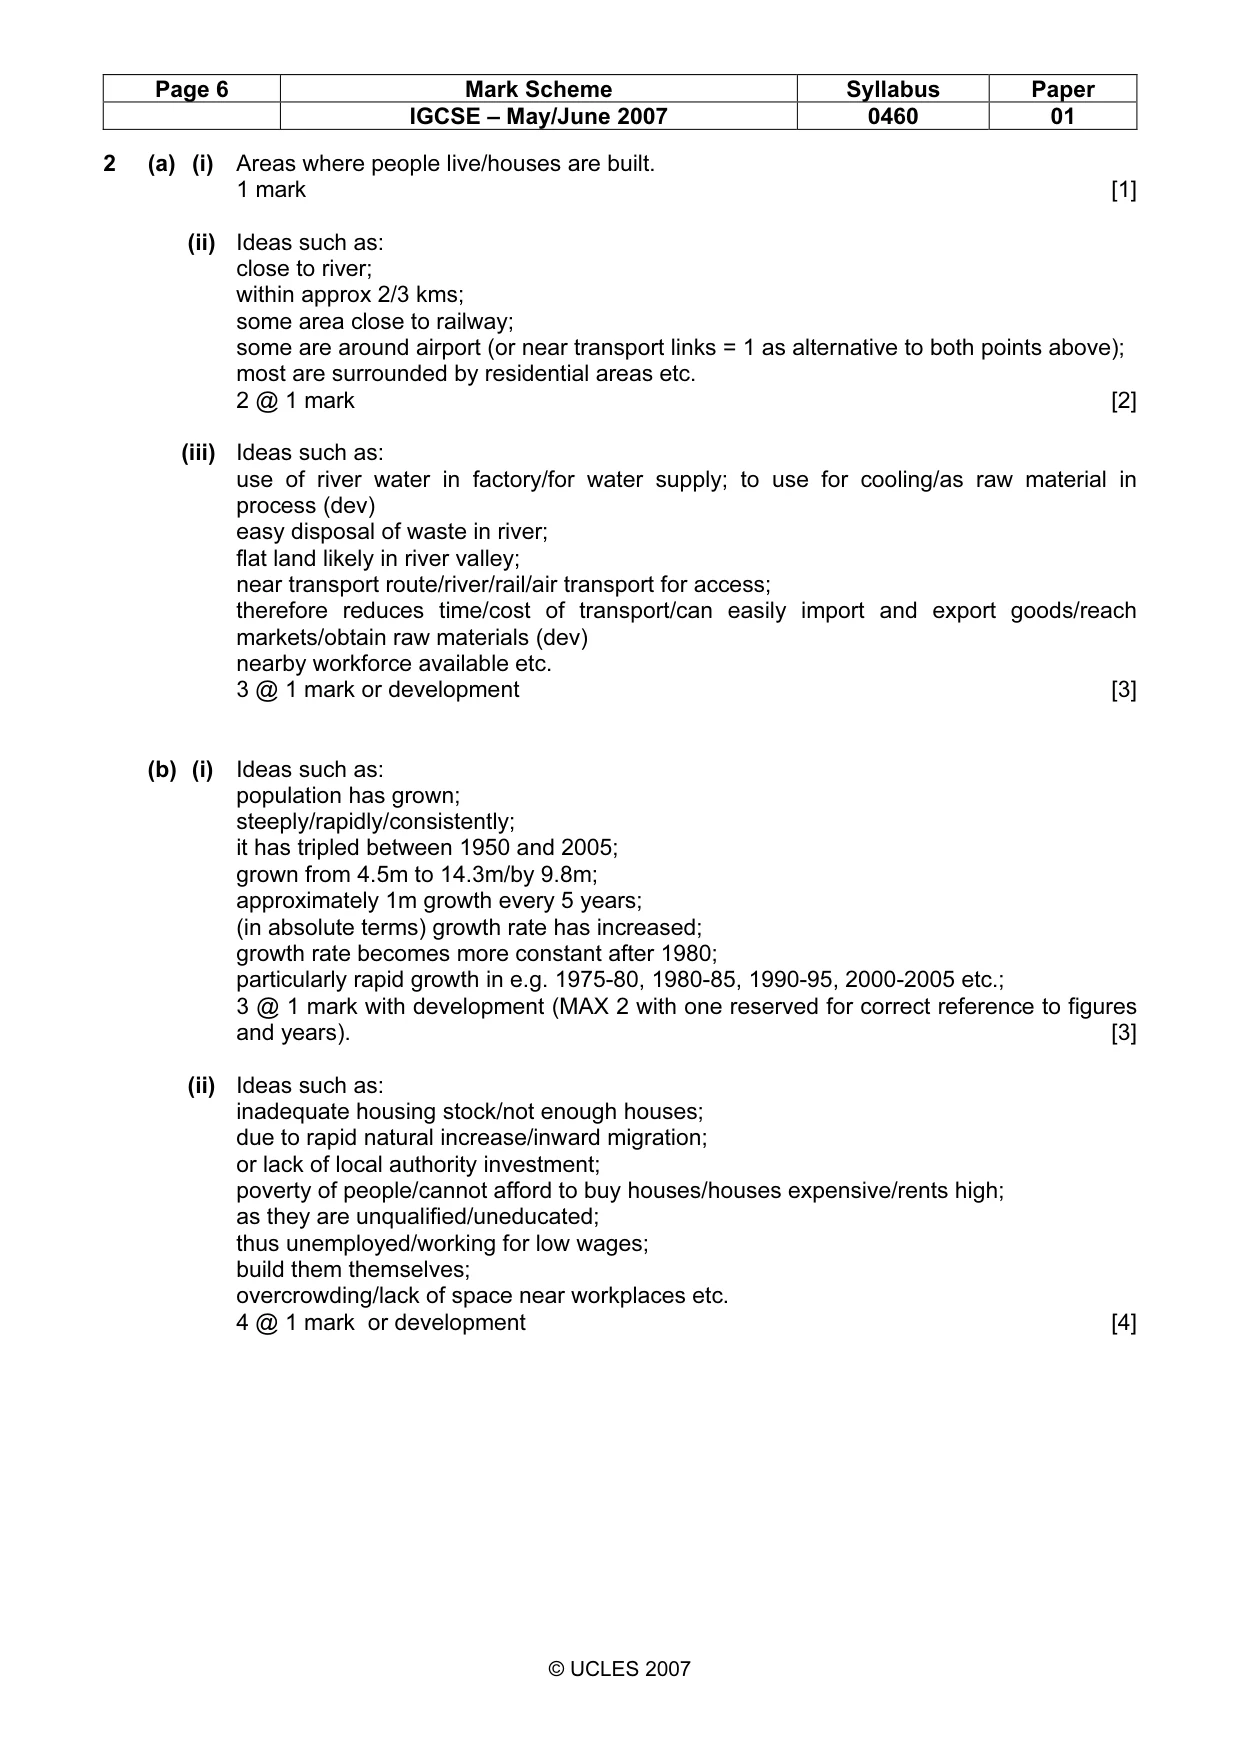
Page 6 Mark Scheme Syllabus Paper IGCSE – May/June 2007 0460 01 © UCLES 2007 2 (a) (i) Areas where people live/houses are built. 1 mark [1] (ii) Ideas such as: close to river; within approx 2/3 kms; some area close to railway; some are around airport (or near transport links = 1 as alternative to both points above); most are surrounded by residential areas etc. 2 @ 1 mark [2] (iii) Ideas such as: use of river water in factory/for water supply; to use for cooling/as raw material in process (dev) easy disposal of waste in river; flat land likely in river valley; near transport route/river/rail/air transport for access; therefore reduces time/cost of transport/can easily import and export goods/reach markets/obtain raw materials (dev) nearby workforce available etc. 3 @ 1 mark or development [3] (b) (i) Ideas such as: population has grown; steeply/rapidly/consistently; it has tripled between 1950 and 2005; grown from 4.5m to 14.3m/by 9.8m; approximately 1m growth every 5 years; (in absolute terms) growth rate has increased; growth rate becomes more constant after 1980; particularly rapid growth in e.g. 1975-80, 1980-85, 1990-95, 2000-2005 etc.; 3 @ 1 mark with development (MAX 2 with one reserved for correct reference to figures and years). [3] (ii) Ideas such as: inadequate housing stock/not enough houses; due to rapid natural increase/inward migration; or lack of local authority investment; poverty of people/cannot afford to buy houses/houses expensive/rents high; as they are unqualified/uneducated; thus unemployed/working for low wages; build them themselves; overcrowding/lack of space near workplaces etc. 4 @ 1 mark or development [4]
Mark scheme, page 7
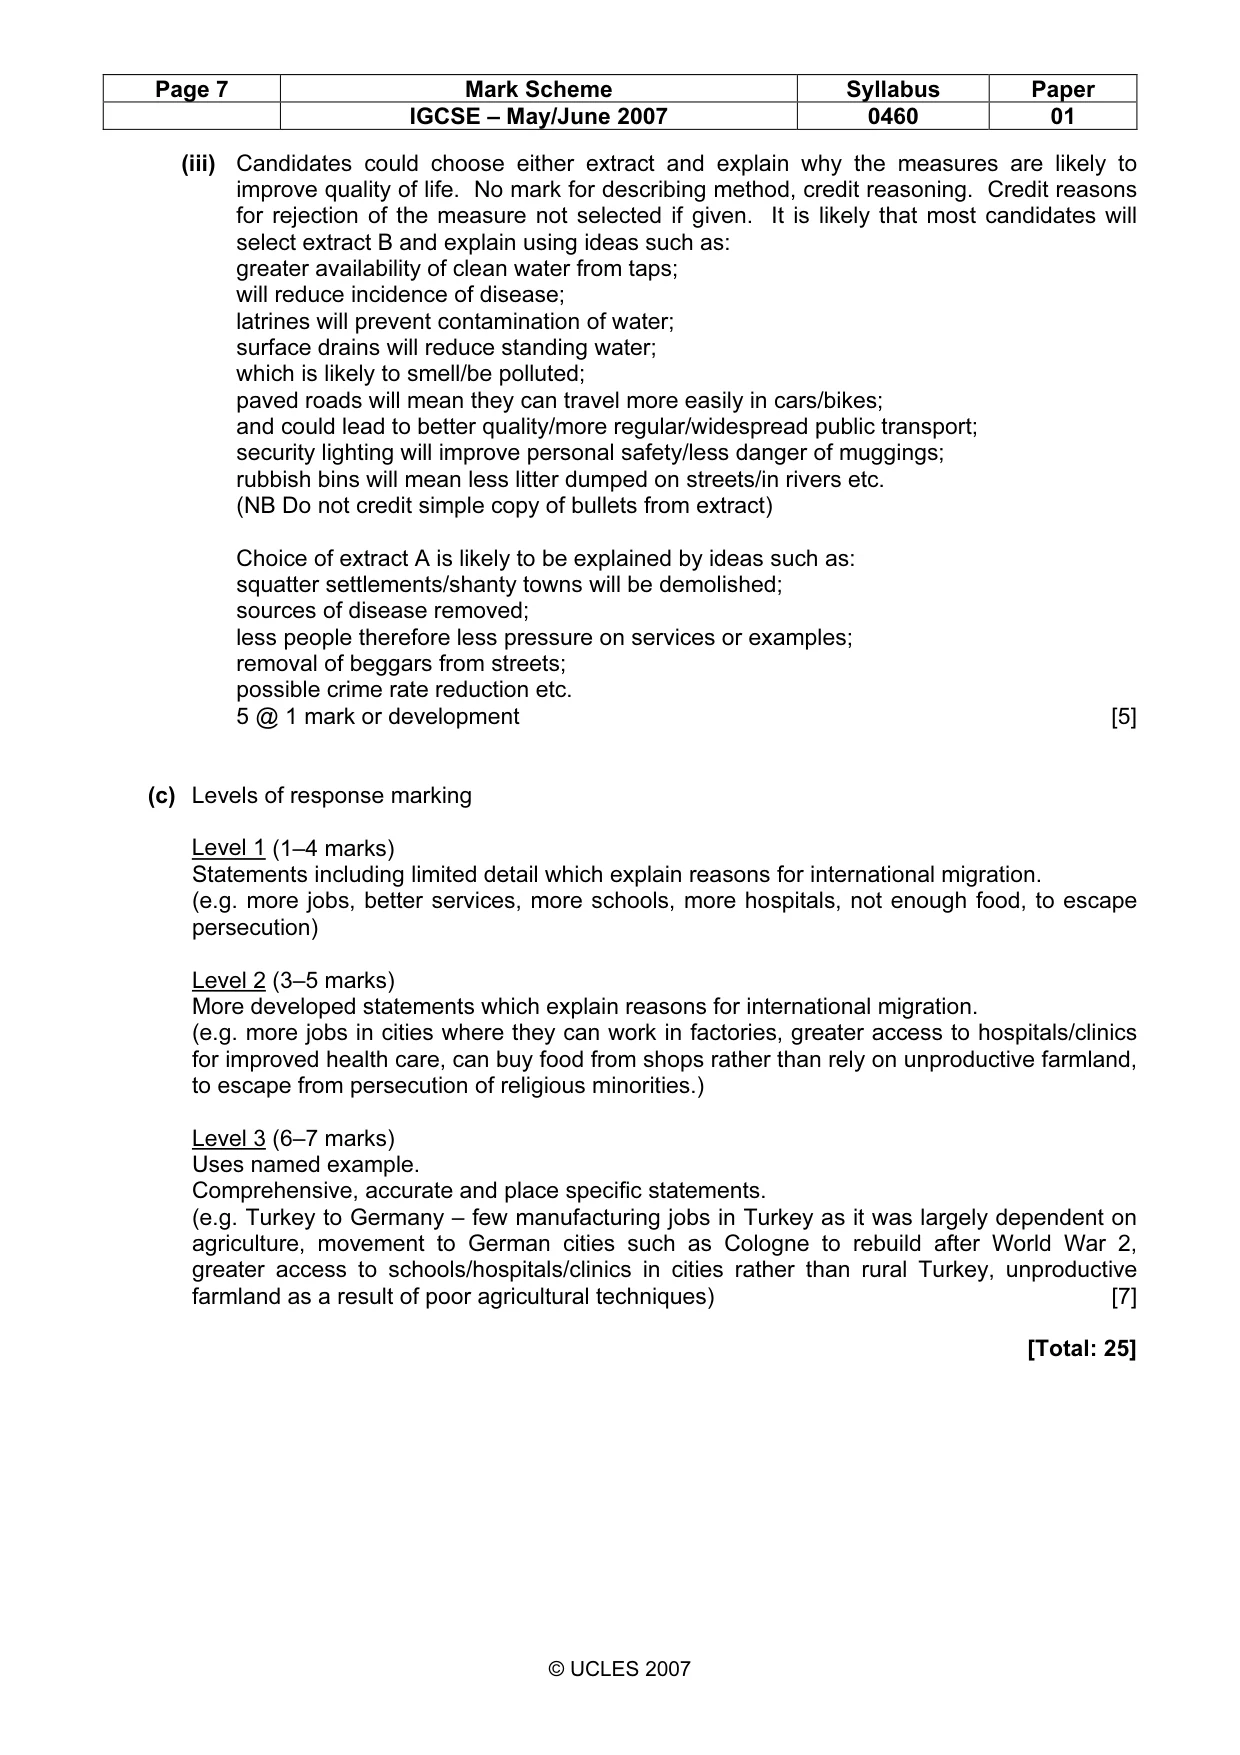
Page 7 Mark Scheme Syllabus Paper IGCSE – May/June 2007 0460 01 © UCLES 2007 (iii) Candidates could choose either extract and explain why the measures are likely to improve quality of life. No mark for describing method, credit reasoning. Credit reasons for rejection of the measure not selected if given. It is likely that most candidates will select extract B and explain using ideas such as: greater availability of clean water from taps; will reduce incidence of disease; latrines will prevent contamination of water; surface drains will reduce standing water; which is likely to smell/be polluted; paved roads will mean they can travel more easily in cars/bikes; and could lead to better quality/more regular/widespread public transport; security lighting will improve personal safety/less danger of muggings; rubbish bins will mean less litter dumped on streets/in rivers etc. (NB Do not credit simple copy of bullets from extract) Choice of extract A is likely to be explained by ideas such as: squatter settlements/shanty towns will be demolished; sources of disease removed; less people therefore less pressure on services or examples; removal of beggars from streets; possible crime rate reduction etc. 5 @ 1 mark or development [5] (c) Levels of response marking Level 1 (1–4 marks) Statements including limited detail which explain reasons for international migration. (e.g. more jobs, better services, more schools, more hospitals, not enough food, to escape persecution) Level 2 (3–5 marks) More developed statements which explain reasons for international migration. (e.g. more jobs in cities where they can work in factories, greater access to hospitals/clinics for improved health care, can buy food from shops rather than rely on unproductive farmland, to escape from persecution of religious minorities.) Level 3 (6–7 marks) Uses named example. Comprehensive, accurate and place specific statements. (e.g. Turkey to Germany – few manufacturing jobs in Turkey as it was largely dependent on agriculture, movement to German cities such as Cologne to rebuild after World War 2, greater access to schools/hospitals/clinics in cities rather than rural Turkey, unproductive farmland as a result of poor agricultural techniques) [7] [Total: 25]
Mark scheme, page 8
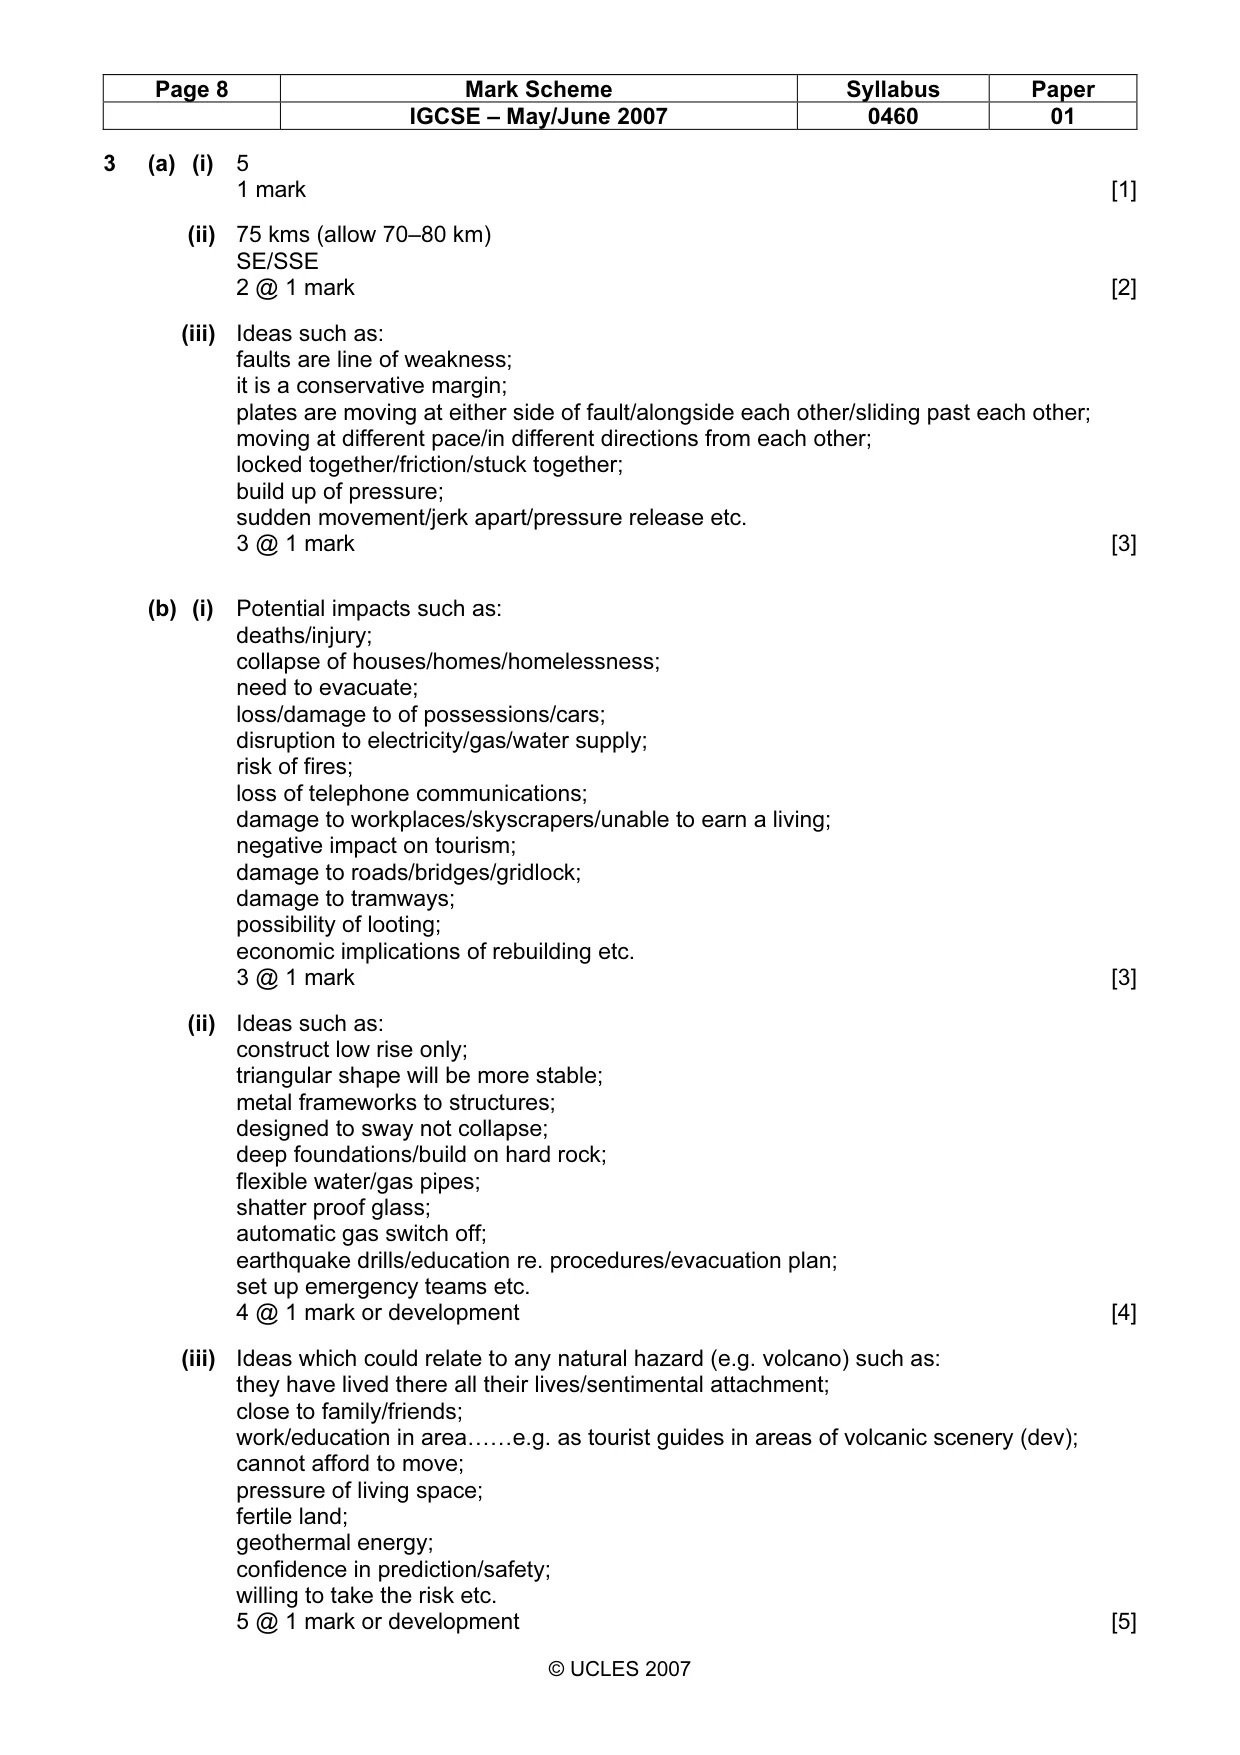
Page 8 Mark Scheme Syllabus Paper IGCSE – May/June 2007 0460 01 © UCLES 2007 3 (a) (i) 5 1 mark [1] (ii) 75 kms (allow 70–80 km) SE/SSE 2 @ 1 mark [2] (iii) Ideas such as: faults are line of weakness; it is a conservative margin; plates are moving at either side of fault/alongside each other/sliding past each other; moving at different pace/in different directions from each other; locked together/friction/stuck together; build up of pressure; sudden movement/jerk apart/pressure release etc. 3 @ 1 mark [3] (b) (i) Potential impacts such as: deaths/injury; collapse of houses/homes/homelessness; need to evacuate; loss/damage to of possessions/cars; disruption to electricity/gas/water supply; risk of fires; loss of telephone communications; damage to workplaces/skyscrapers/unable to earn a living; negative impact on tourism; damage to roads/bridges/gridlock; damage to tramways; possibility of looting; economic implications of rebuilding etc. 3 @ 1 mark [3] (ii) Ideas such as: construct low rise only; triangular shape will be more stable; metal frameworks to structures; designed to sway not collapse; deep foundations/build on hard rock; flexible water/gas pipes; shatter proof glass; automatic gas switch off; earthquake drills/education re. procedures/evacuation plan; set up emergency teams etc. 4 @ 1 mark or development [4] (iii) Ideas which could relate to any natural hazard (e.g. volcano) such as: they have lived there all their lives/sentimental attachment; close to family/friends; work/education in area……e.g. as tourist guides in areas of volcanic scenery (dev); cannot afford to move; pressure of living space; fertile land; geothermal energy; confidence in prediction/safety; willing to take the risk etc. 5 @ 1 mark or development [5]
Mark scheme, page 9
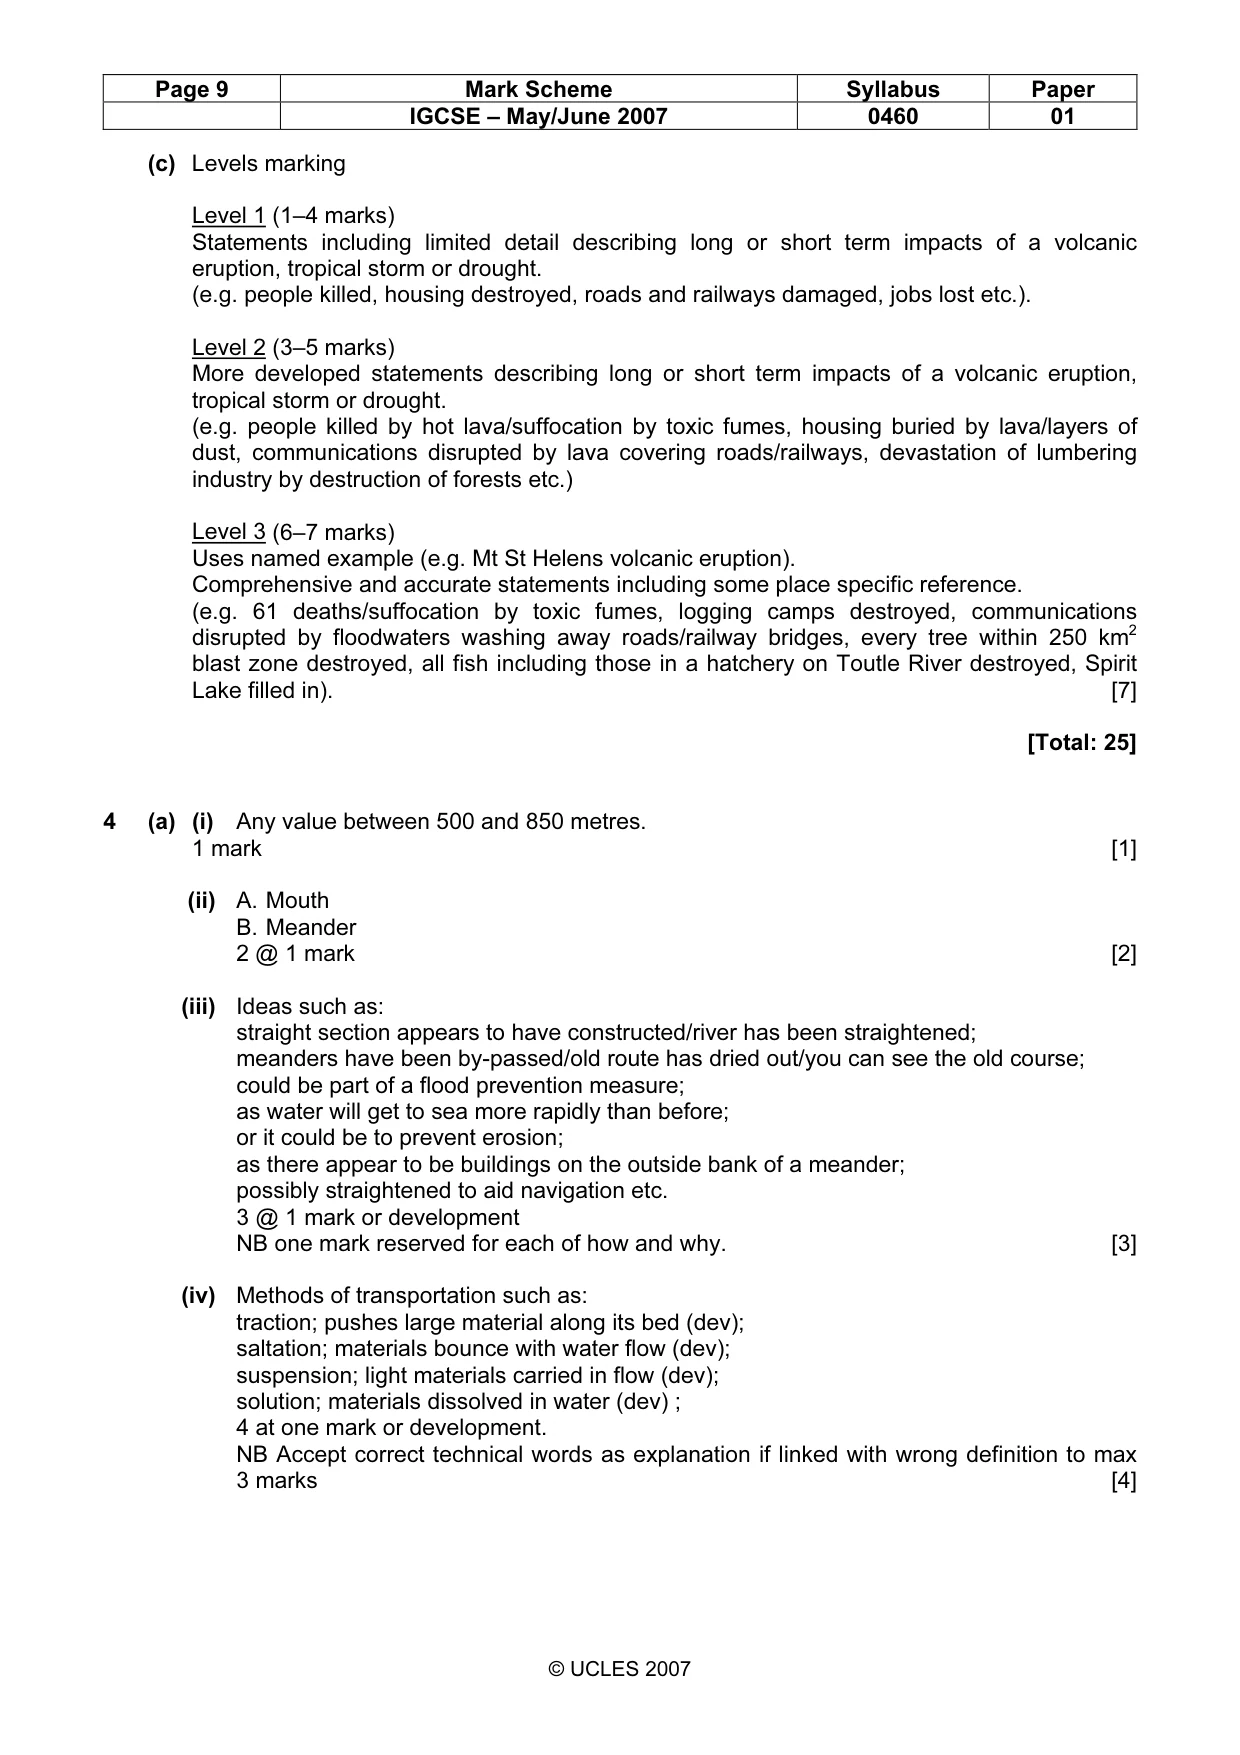
Page 9 Mark Scheme Syllabus Paper IGCSE – May/June 2007 0460 01 © UCLES 2007 (c) Levels marking Level 1 (1–4 marks) Statements including limited detail describing long or short term impacts of a volcanic eruption, tropical storm or drought. (e.g. people killed, housing destroyed, roads and railways damaged, jobs lost etc.). Level 2 (3–5 marks) More developed statements describing long or short term impacts of a volcanic eruption, tropical storm or drought. (e.g. people killed by hot lava/suffocation by toxic fumes, housing buried by lava/layers of dust, communications disrupted by lava covering roads/railways, devastation of lumbering industry by destruction of forests etc.) Level 3 (6–7 marks) Uses named example (e.g. Mt St Helens volcanic eruption). Comprehensive and accurate statements including some place specific reference. (e.g. 61 deaths/suffocation by toxic fumes, logging camps destroyed, communications disrupted by floodwaters washing away roads/railway bridges, every tree within 250 km2 blast zone destroyed, all fish including those in a hatchery on Toutle River destroyed, Spirit Lake filled in). [7] [Total: 25] 4 (a) (i) Any value between 500 and 850 metres. 1 mark [1] (ii) A. Mouth B. Meander 2 @ 1 mark [2] (iii) Ideas such as: straight section appears to have constructed/river has been straightened; meanders have been by-passed/old route has dried out/you can see the old course; could be part of a flood prevention measure; as water will get to sea more rapidly than before; or it could be to prevent erosion; as there appear to be buildings on the outside bank of a meander; possibly straightened to aid navigation etc. 3 @ 1 mark or development NB one mark reserved for each of how and why. [3] (iv) Methods of transportation such as: traction; pushes large material along its bed (dev); saltation; materials bounce with water flow (dev); suspension; light materials carried in flow (dev); solution; materials dissolved in water (dev) ; 4 at one mark or development. NB Accept correct technical words as explanation if linked with wrong definition to max 3 marks [4]
Mark scheme, page 10
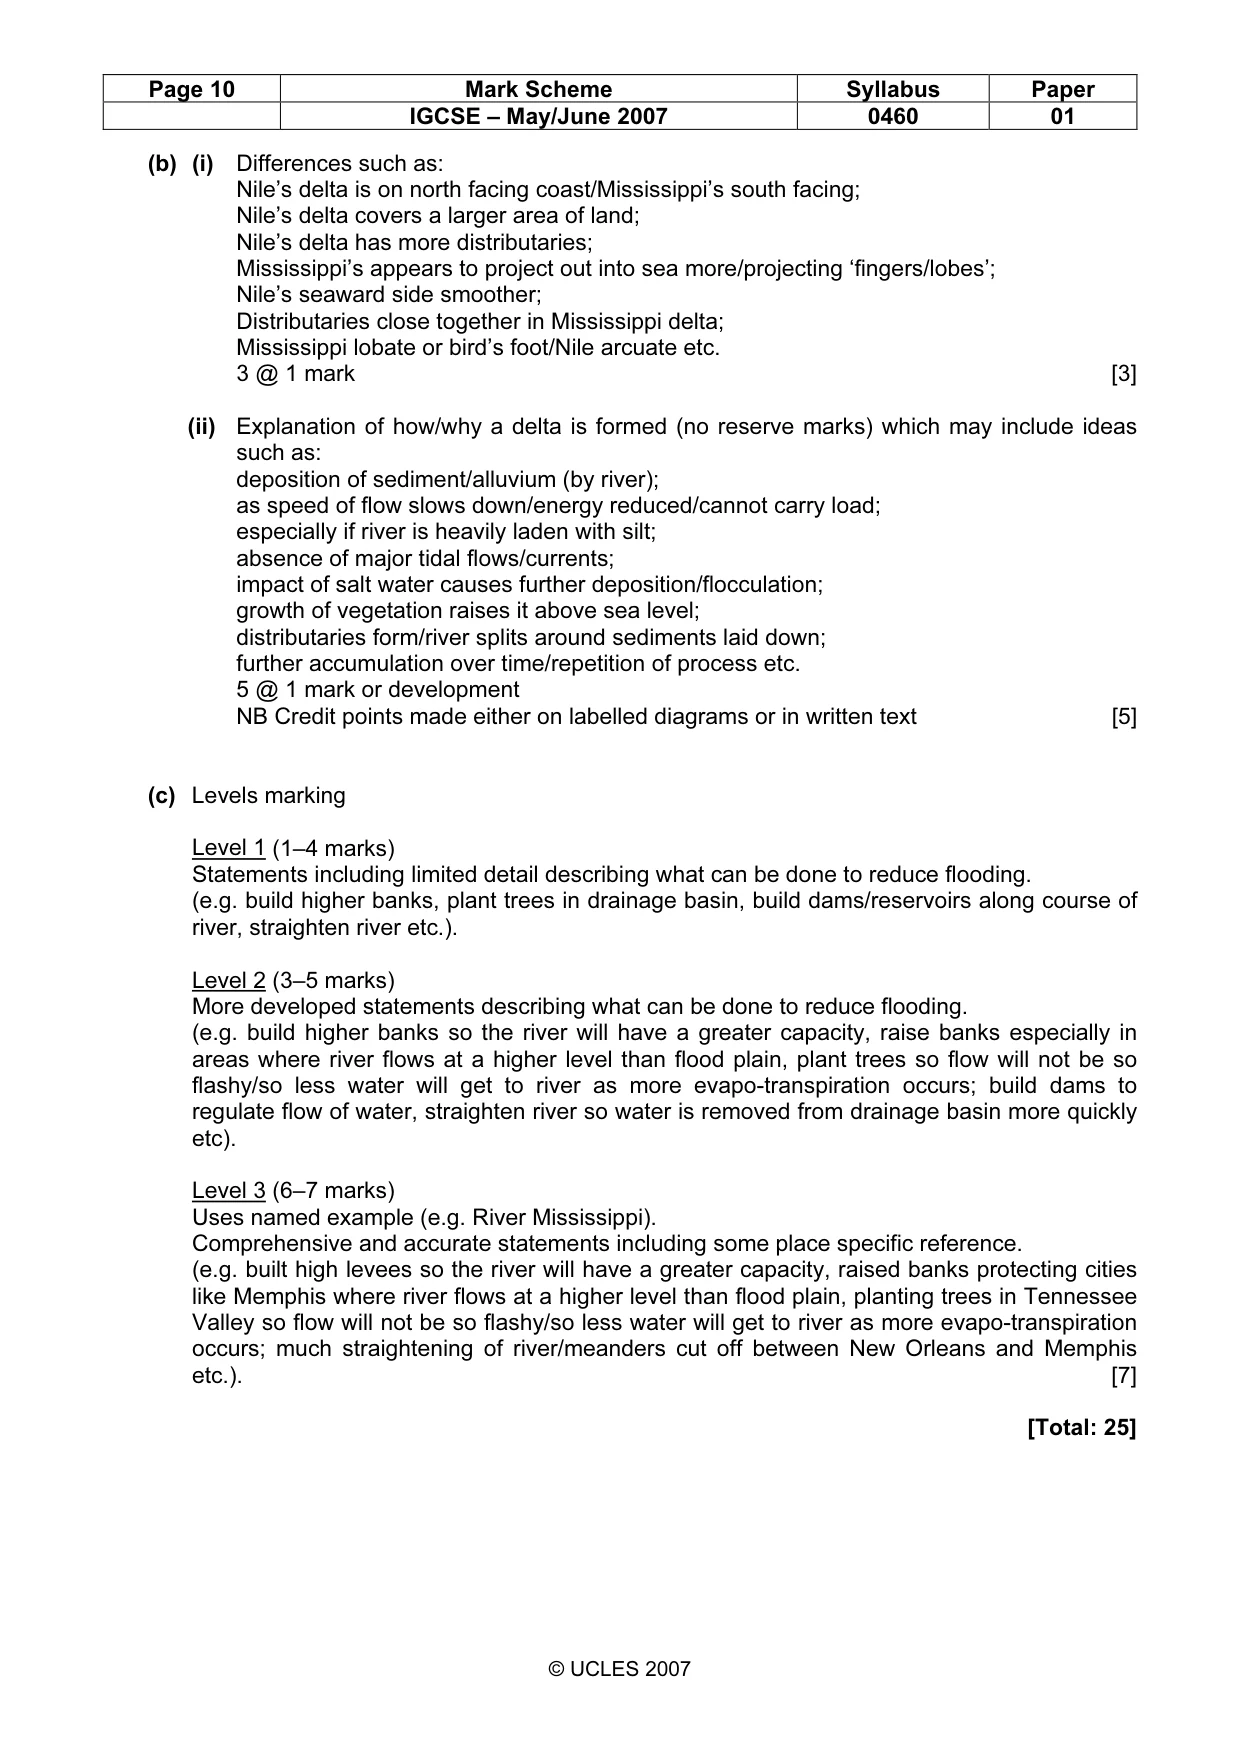
Page 10 Mark Scheme Syllabus Paper IGCSE – May/June 2007 0460 01 © UCLES 2007 (b) (i) Differences such as: Nile’s delta is on north facing coast/Mississippi’s south facing; Nile’s delta covers a larger area of land; Nile’s delta has more distributaries; Mississippi’s appears to project out into sea more/projecting ‘fingers/lobes’; Nile’s seaward side smoother; Distributaries close together in Mississippi delta; Mississippi lobate or bird’s foot/Nile arcuate etc. 3 @ 1 mark [3] (ii) Explanation of how/why a delta is formed (no reserve marks) which may include ideas such as: deposition of sediment/alluvium (by river); as speed of flow slows down/energy reduced/cannot carry load; especially if river is heavily laden with silt; absence of major tidal flows/currents; impact of salt water causes further deposition/flocculation; growth of vegetation raises it above sea level; distributaries form/river splits around sediments laid down; further accumulation over time/repetition of process etc. 5 @ 1 mark or development NB Credit points made either on labelled diagrams or in written text [5] (c) Levels marking Level 1 (1–4 marks) Statements including limited detail describing what can be done to reduce flooding. (e.g. build higher banks, plant trees in drainage basin, build dams/reservoirs along course of river, straighten river etc.). Level 2 (3–5 marks) More developed statements describing what can be done to reduce flooding. (e.g. build higher banks so the river will have a greater capacity, raise banks especially in areas where river flows at a higher level than flood plain, plant trees so flow will not be so flashy/so less water will get to river as more evapo-transpiration occurs; build dams to regulate flow of water, straighten river so water is removed from drainage basin more quickly etc). Level 3 (6–7 marks) Uses named example (e.g. River Mississippi). Comprehensive and accurate statements including some place specific reference. (e.g. built high levees so the river will have a greater capacity, raised banks protecting cities like Memphis where river flows at a higher level than flood plain, planting trees in Tennessee Valley so flow will not be so flashy/so less water will get to river as more evapo-transpiration occurs; much straightening of river/meanders cut off between New Orleans and Memphis etc.). [7] [Total: 25]
Mark scheme, page 11
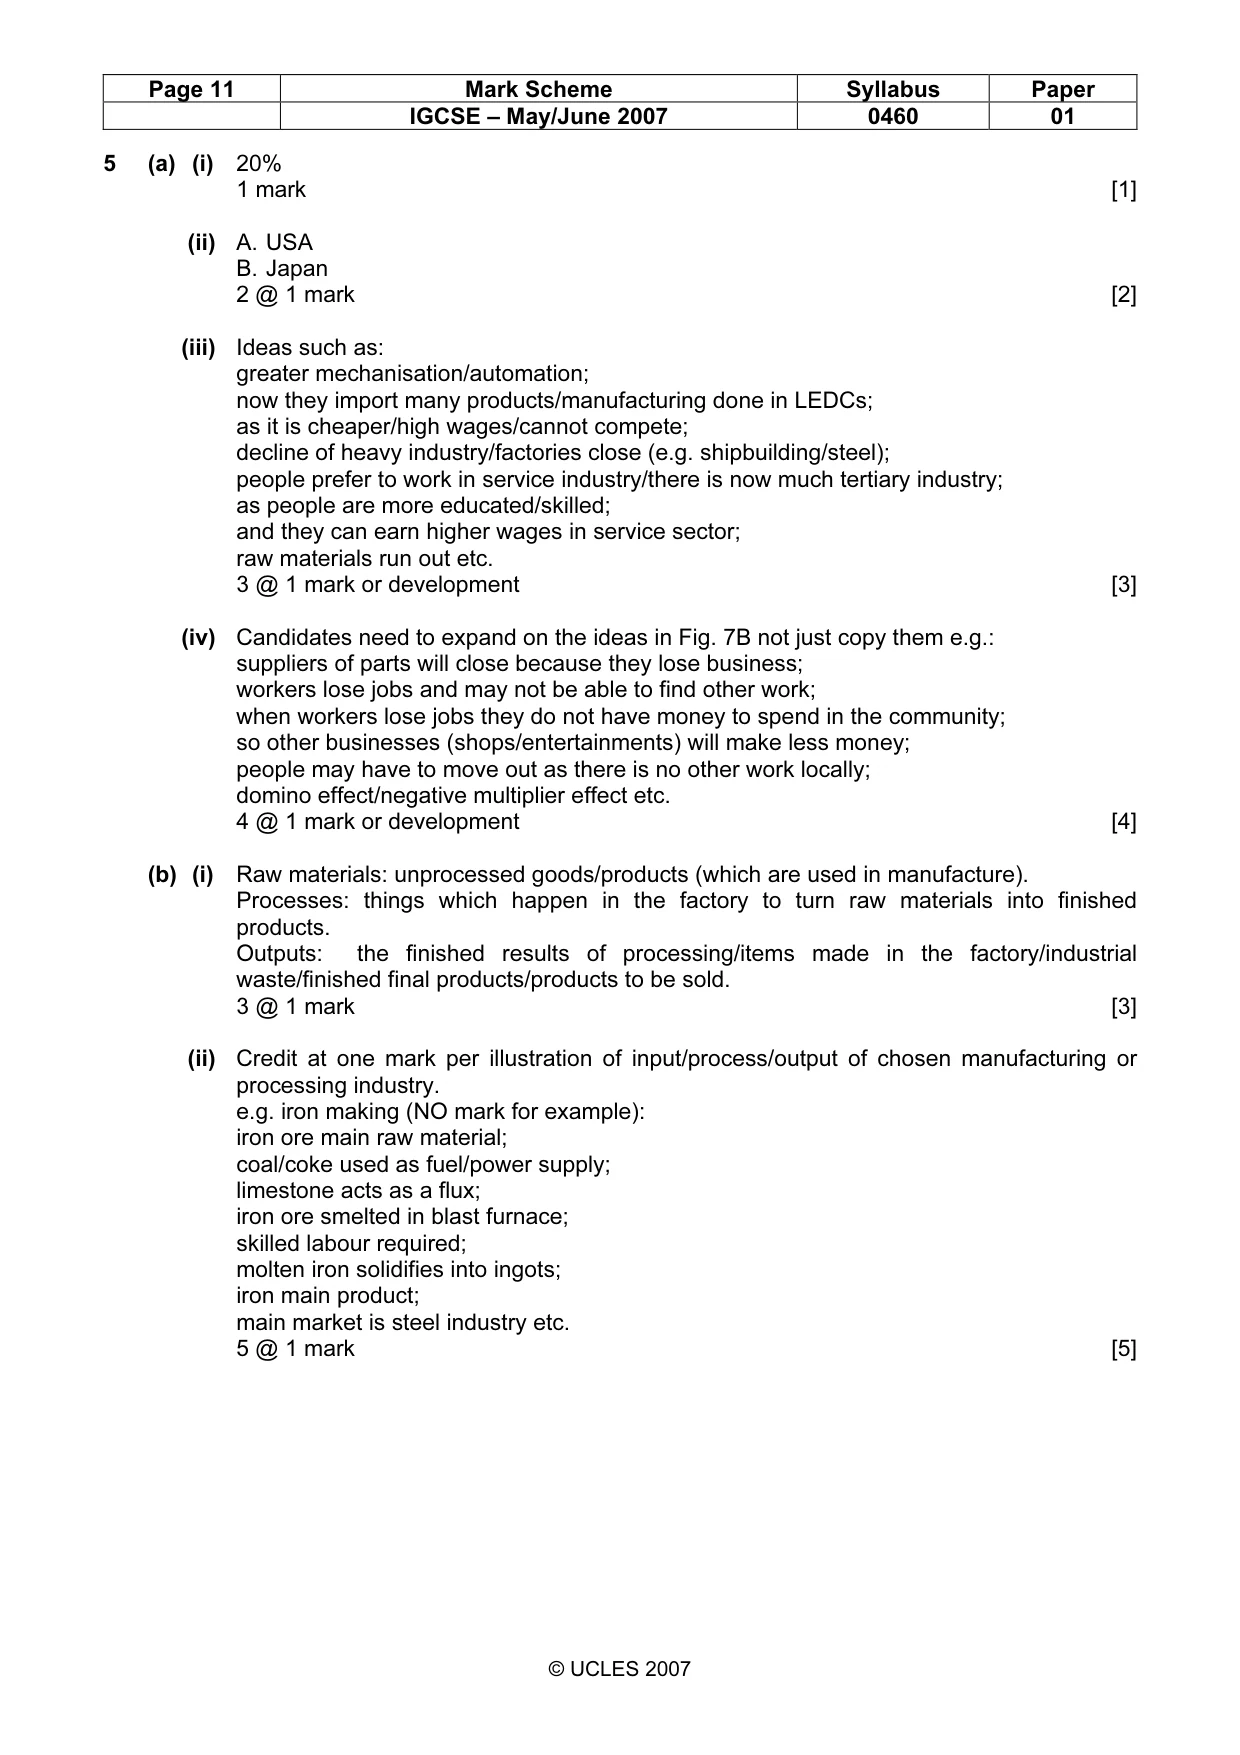
Page 11 Mark Scheme Syllabus Paper IGCSE – May/June 2007 0460 01 © UCLES 2007 5 (a) (i) 20% 1 mark [1] (ii) A. USA B. Japan 2 @ 1 mark [2] (iii) Ideas such as: greater mechanisation/automation; now they import many products/manufacturing done in LEDCs; as it is cheaper/high wages/cannot compete; decline of heavy industry/factories close (e.g. shipbuilding/steel); people prefer to work in service industry/there is now much tertiary industry; as people are more educated/skilled; and they can earn higher wages in service sector; raw materials run out etc. 3 @ 1 mark or development [3] (iv) Candidates need to expand on the ideas in Fig. 7B not just copy them e.g.: suppliers of parts will close because they lose business; workers lose jobs and may not be able to find other work; when workers lose jobs they do not have money to spend in the community; so other businesses (shops/entertainments) will make less money; people may have to move out as there is no other work locally; domino effect/negative multiplier effect etc. 4 @ 1 mark or development [4] (b) (i) Raw materials: unprocessed goods/products (which are used in manufacture). Processes: things which happen in the factory to turn raw materials into finished products. Outputs: the finished results of processing/items made in the factory/industrial waste/finished final products/products to be sold. 3 @ 1 mark [3] (ii) Credit at one mark per illustration of input/process/output of chosen manufacturing or processing industry. e.g. iron making (NO mark for example): iron ore main raw material; coal/coke used as fuel/power supply; limestone acts as a flux; iron ore smelted in blast furnace; skilled labour required; molten iron solidifies into ingots; iron main product; main market is steel industry etc. 5 @ 1 mark [5]
Mark scheme, page 12
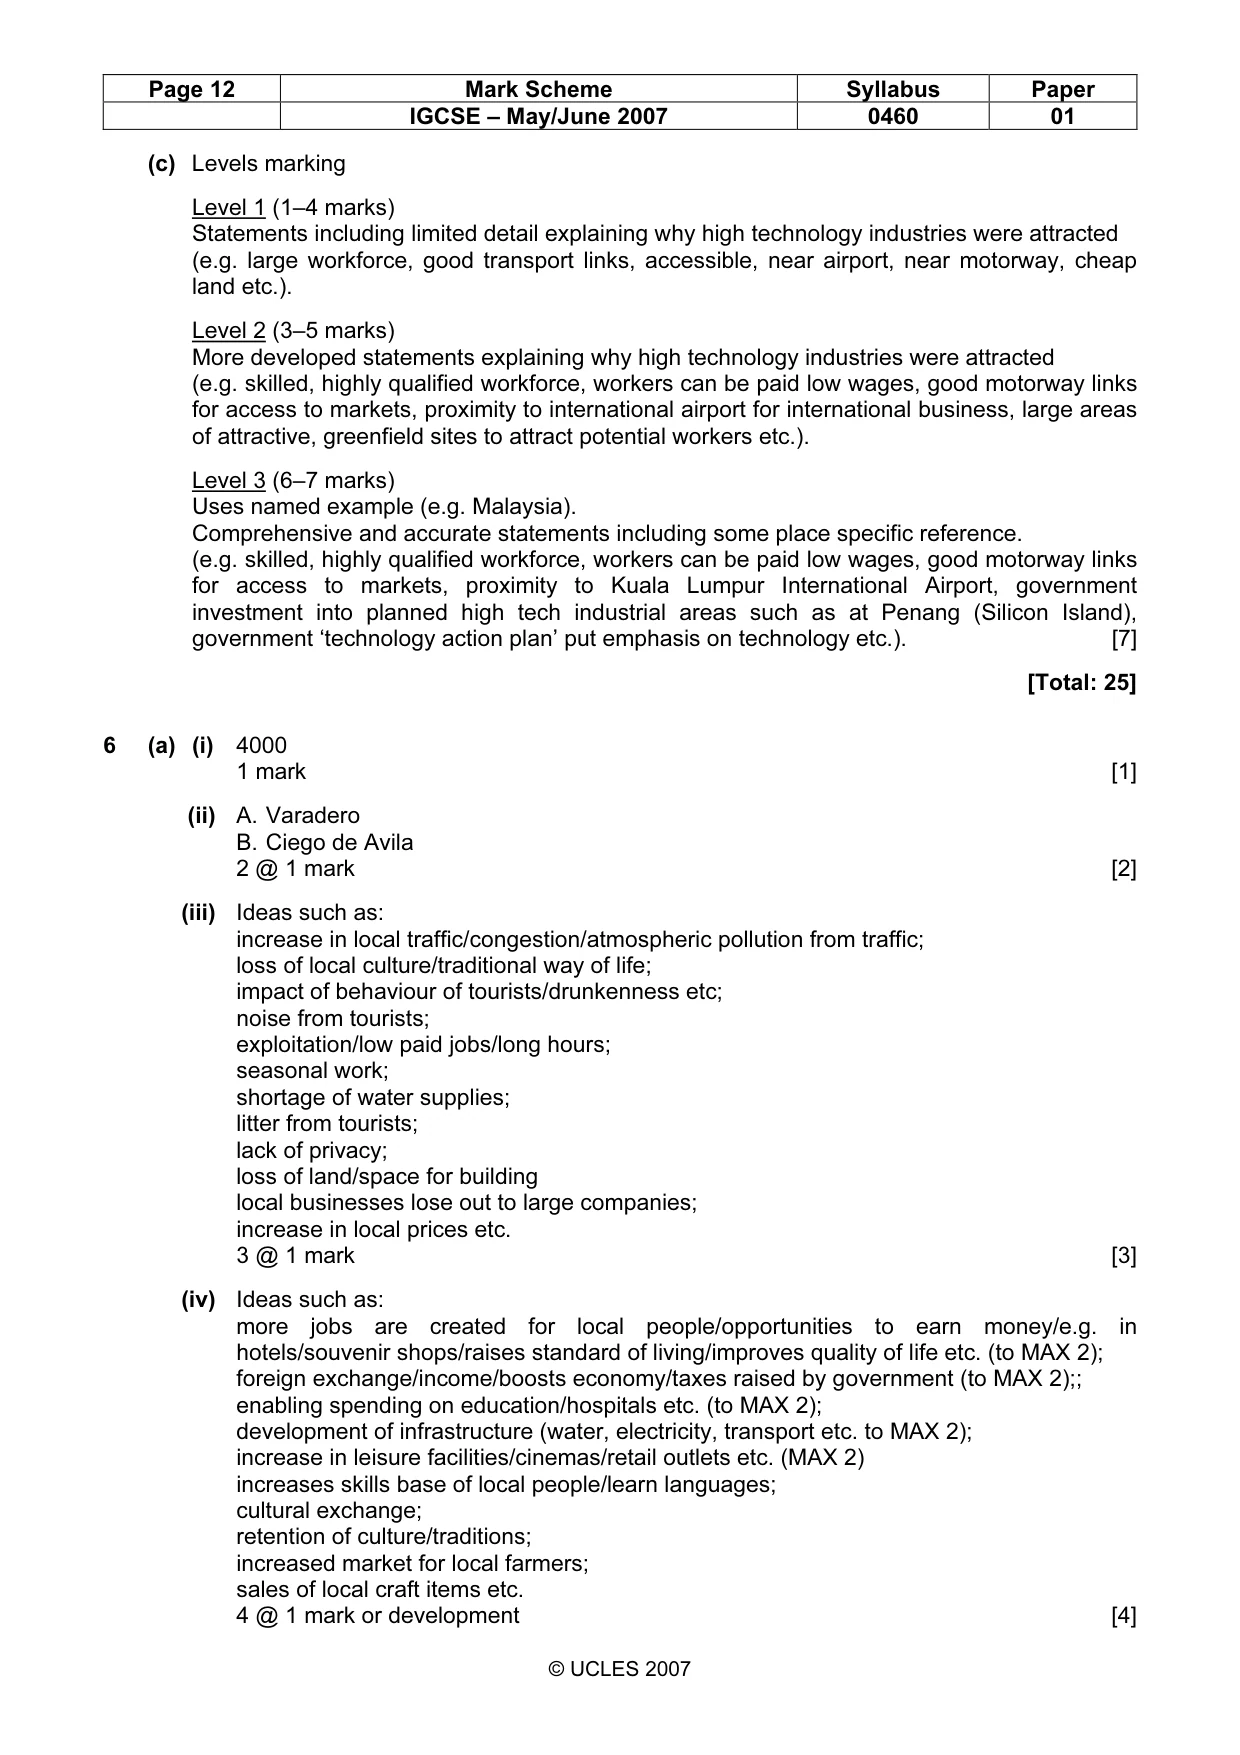
Page 12 Mark Scheme Syllabus Paper IGCSE – May/June 2007 0460 01 © UCLES 2007 (c) Levels marking Level 1 (1–4 marks) Statements including limited detail explaining why high technology industries were attracted (e.g. large workforce, good transport links, accessible, near airport, near motorway, cheap land etc.). Level 2 (3–5 marks) More developed statements explaining why high technology industries were attracted (e.g. skilled, highly qualified workforce, workers can be paid low wages, good motorway links for access to markets, proximity to international airport for international business, large areas of attractive, greenfield sites to attract potential workers etc.). Level 3 (6–7 marks) Uses named example (e.g. Malaysia). Comprehensive and accurate statements including some place specific reference. (e.g. skilled, highly qualified workforce, workers can be paid low wages, good motorway links for access to markets, proximity to Kuala Lumpur International Airport, government investment into planned high tech industrial areas such as at Penang (Silicon Island), government ‘technology action plan’ put emphasis on technology etc.). [7] [Total: 25] 6 (a) (i) 4000 1 mark [1] (ii) A. Varadero B. Ciego de Avila 2 @ 1 mark [2] (iii) Ideas such as: increase in local traffic/congestion/atmospheric pollution from traffic; loss of local culture/traditional way of life; impact of behaviour of tourists/drunkenness etc; noise from tourists; exploitation/low paid jobs/long hours; seasonal work; shortage of water supplies; litter from tourists; lack of privacy; loss of land/space for building local businesses lose out to large companies; increase in local prices etc. 3 @ 1 mark [3] (iv) Ideas such as: more jobs are created for local people/opportunities to earn money/e.g. in hotels/souvenir shops/raises standard of living/improves quality of life etc. (to MAX 2); foreign exchange/income/boosts economy/taxes raised by government (to MAX 2);; enabling spending on education/hospitals etc. (to MAX 2); development of infrastructure (water, electricity, transport etc. to MAX 2); increase in leisure facilities/cinemas/retail outlets etc. (MAX 2) increases skills base of local people/learn languages; cultural exchange; retention of culture/traditions; increased market for local farmers; sales of local craft items etc. 4 @ 1 mark or development [4]
Mark scheme, page 13
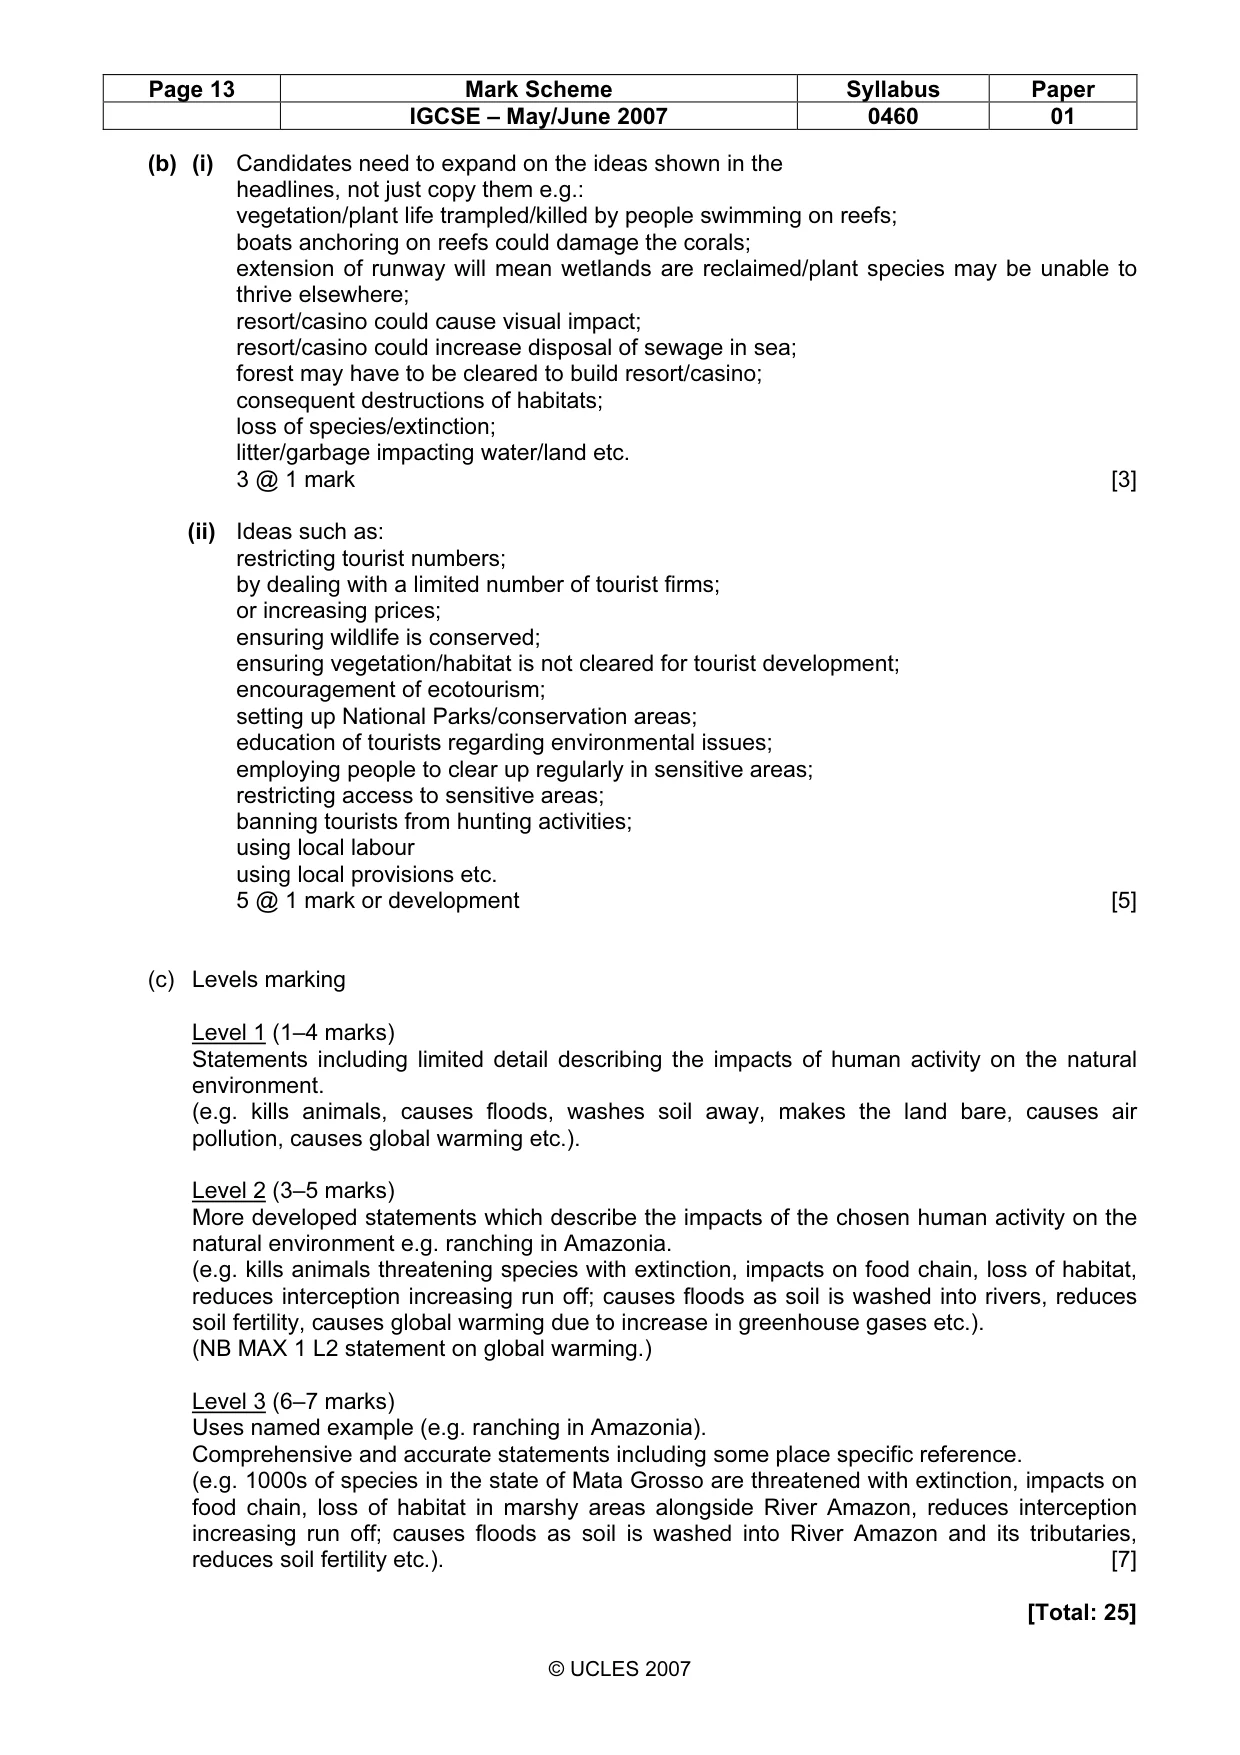
Page 13 Mark Scheme Syllabus Paper IGCSE – May/June 2007 0460 01 © UCLES 2007 (b) (i) Candidates need to expand on the ideas shown in the headlines, not just copy them e.g.: vegetation/plant life trampled/killed by people swimming on reefs; boats anchoring on reefs could damage the corals; extension of runway will mean wetlands are reclaimed/plant species may be unable to thrive elsewhere; resort/casino could cause visual impact; resort/casino could increase disposal of sewage in sea; forest may have to be cleared to build resort/casino; consequent destructions of habitats; loss of species/extinction; litter/garbage impacting water/land etc. 3 @ 1 mark [3] (ii) Ideas such as: restricting tourist numbers; by dealing with a limited number of tourist firms; or increasing prices; ensuring wildlife is conserved; ensuring vegetation/habitat is not cleared for tourist development; encouragement of ecotourism; setting up National Parks/conservation areas; education of tourists regarding environmental issues; employing people to clear up regularly in sensitive areas; restricting access to sensitive areas; banning tourists from hunting activities; using local labour using local provisions etc. 5 @ 1 mark or development [5] (c) Levels marking Level 1 (1–4 marks) Statements including limited detail describing the impacts of human activity on the natural environment. (e.g. kills animals, causes floods, washes soil away, makes the land bare, causes air pollution, causes global warming etc.). Level 2 (3–5 marks) More developed statements which describe the impacts of the chosen human activity on the natural environment e.g. ranching in Amazonia. (e.g. kills animals threatening species with extinction, impacts on food chain, loss of habitat, reduces interception increasing run off; causes floods as soil is washed into rivers, reduces soil fertility, causes global warming due to increase in greenhouse gases etc.). (NB MAX 1 L2 statement on global warming.) Level 3 (6–7 marks) Uses named example (e.g. ranching in Amazonia). Comprehensive and accurate statements including some place specific reference. (e.g. 1000s of species in the state of Mata Grosso are threatened with extinction, impacts on food chain, loss of habitat in marshy areas alongside River Amazon, reduces interception increasing run off; causes floods as soil is washed into River Amazon and its tributaries, reduces soil fertility etc.). [7] [Total: 25]
What you needed in this session
Cambridge’s own grade thresholds for 2007 May/June, Paper 1 · Variant 1. A higher threshold means an easier paper — the bar moves with how the cohort did.