Cambridge IGCSE Geography 0460 — 2006 Oct/Nov Paper 1 · Variant 1
0460/11/O/N/06 · 75 marks · ≈84 min
The question paper and its mark scheme, free to read here and free to download. This is Cambridge’s own paper, exactly as it was sat.
Question paper16 pages
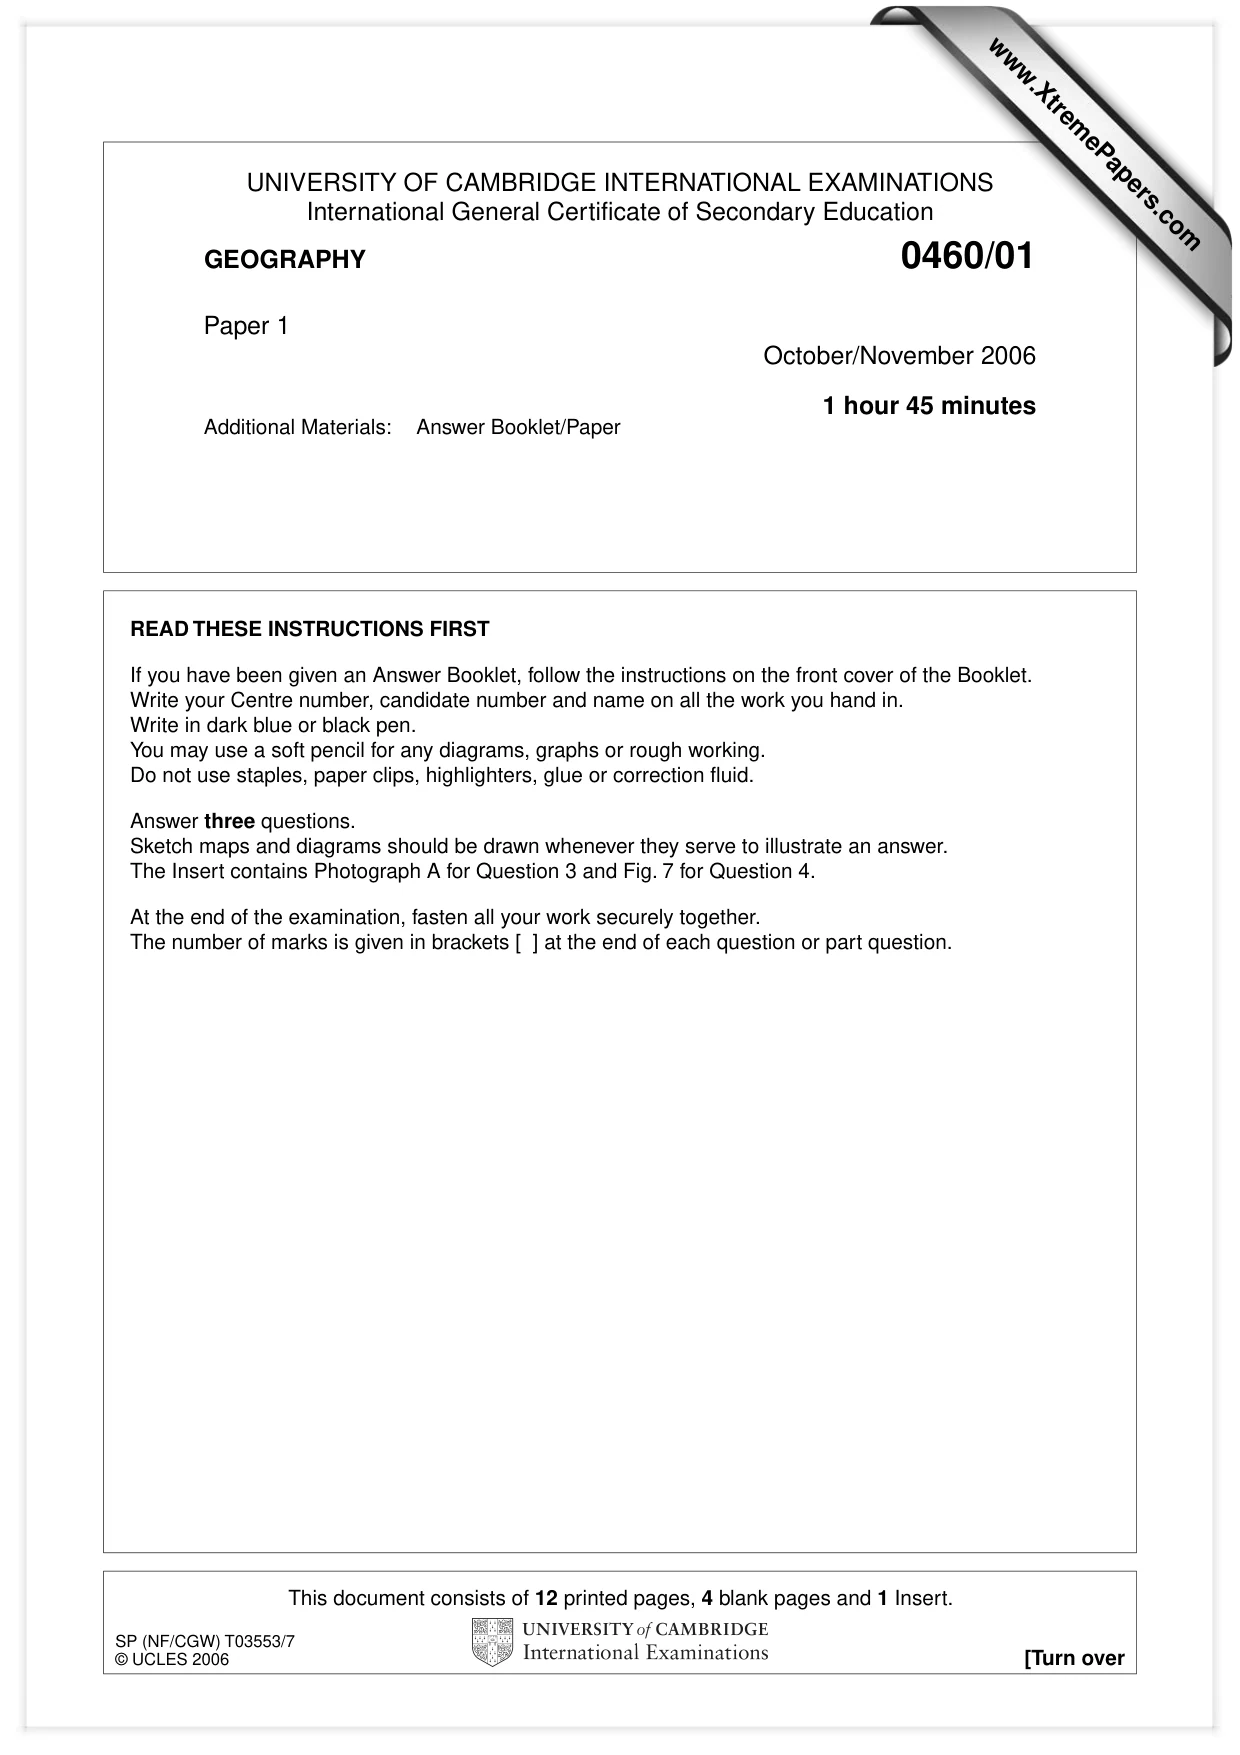



Mark scheme14 pages
Answers below. Sit the paper first if you are practising.
Paper as text
Question paper, page 1
This document consists of 12 printed pages, 4 blank pages and 1 Insert. SP (NF/CGW) T03553/7 © UCLES 2006 [Turn over UNIVERSITY OF CAMBRIDGE INTERNATIONAL EXAMINATIONS International General Certificate of Secondary Education GEOGRAPHY 0460/01 Paper 1 October/November 2006 1 hour 45 minutes Additional Materials: Answer Booklet/Paper READ THESE INSTRUCTIONS FIRST If you have been given an Answer Booklet, follow the instructions on the front cover of the Booklet. Write your Centre number, candidate number and name on all the work you hand in. Write in dark blue or black pen. You may use a soft pencil for any diagrams, graphs or rough working. Do not use staples, paper clips, highlighters, glue or correction fluid. Answer three questions. Sketch maps and diagrams should be drawn whenever they serve to illustrate an answer. The Insert contains Photograph A for Question 3 and Fig. 7 for Question 4. At the end of the examination, fasten all your work securely together. The number of marks is given in brackets [ ] at the end of each question or part question. www.XtremePapers.com
Question paper, page 2
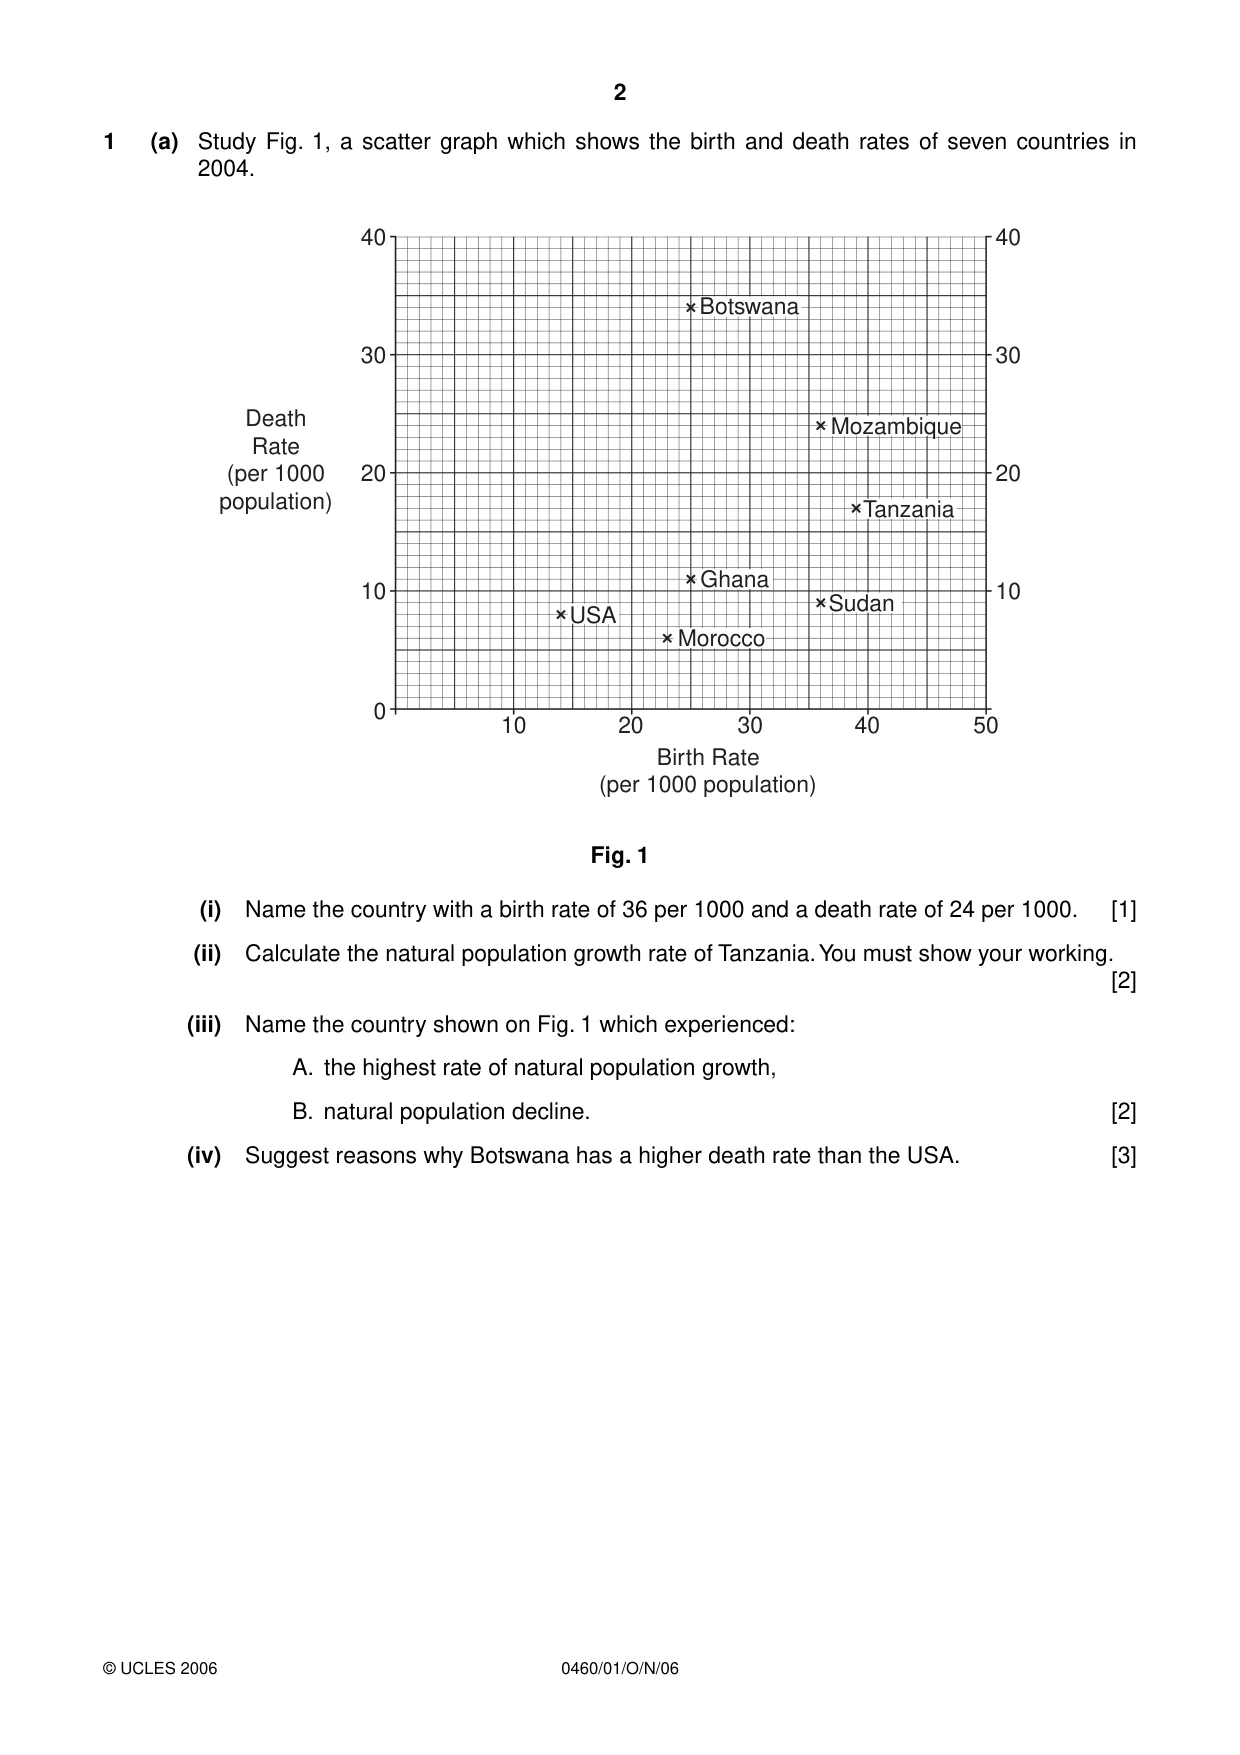
2 0460/01/O/N/06 © UCLES 2006 1 (a) Study Fig. 1, a scatter graph which shows the birth and death rates of seven countries in 2004. 0 10 20 30 Birth Rate (per 1000 population) Death Rate (per 1000 population) 40 50 10 20 30 40 10 20 30 40 Botswana Mozambique Ghana Tanzania Sudan Morocco USA Fig. 1 (i) Name the country with a birth rate of 36 per 1000 and a death rate of 24 per 1000. [1] (ii) Calculate the natural population growth rate of Tanzania. You must show your working. [2] (iii) Name the country shown on Fig. 1 which experienced: A. the highest rate of natural population growth, B. natural population decline. [2] (iv) Suggest reasons why Botswana has a higher death rate than the USA. [3]
Question paper, page 3
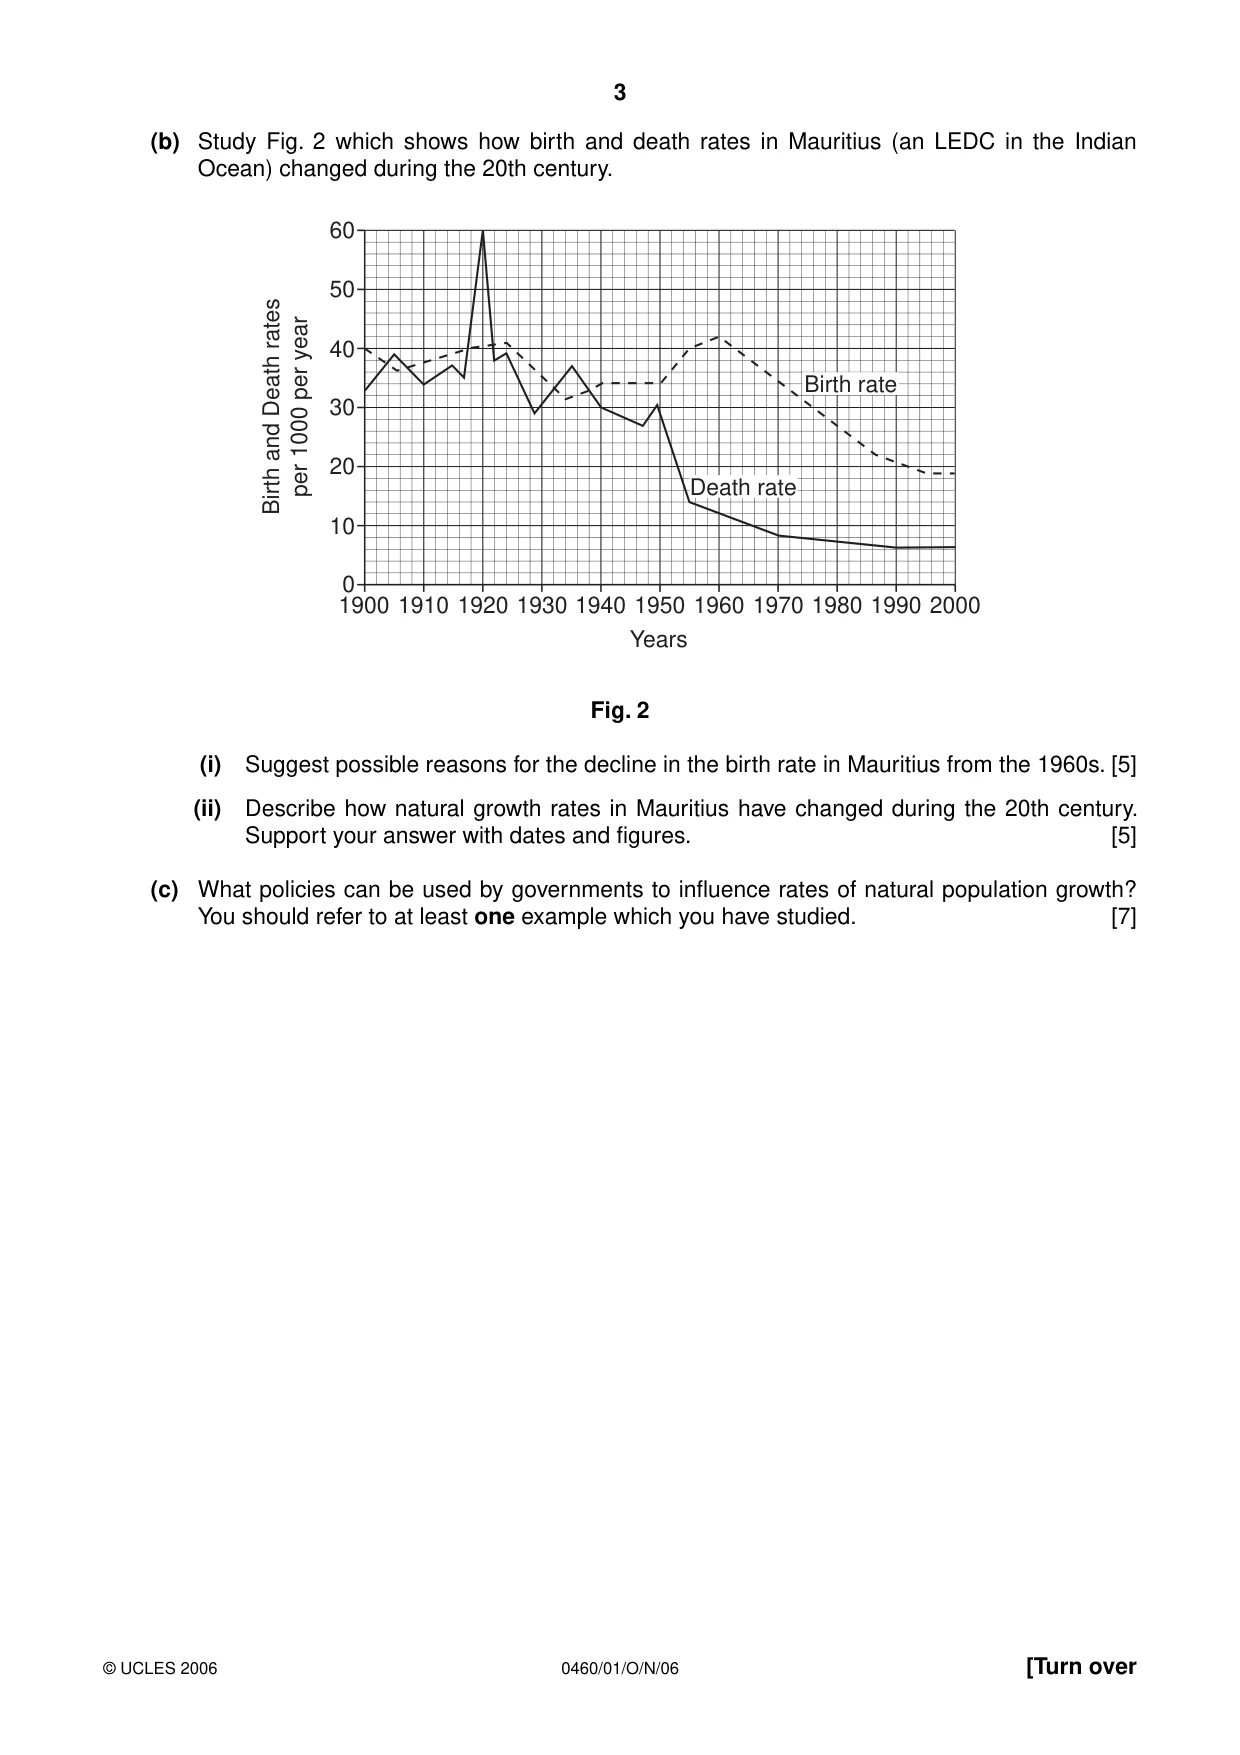
3 0460/01/O/N/06 © UCLES 2006 [Turn over (b) Study Fig. 2 which shows how birth and death rates in Mauritius (an LEDC in the Indian Ocean) changed during the 20th century. 1900 0 10 20 30 40 50 60 1910 1920 1930 1940 1950 Years Birth and Death rates per 1000 per year 1960 1970 1980 1990 2000 Birth rate Death rate Fig. 2 (i) Suggest possible reasons for the decline in the birth rate in Mauritius from the 1960s. [5] (ii) Describe how natural growth rates in Mauritius have changed during the 20th century. Support your answer with dates and figures. [5] (c) What policies can be used by governments to influence rates of natural population growth? You should refer to at least one example which you have studied. [7]
Question paper, page 4
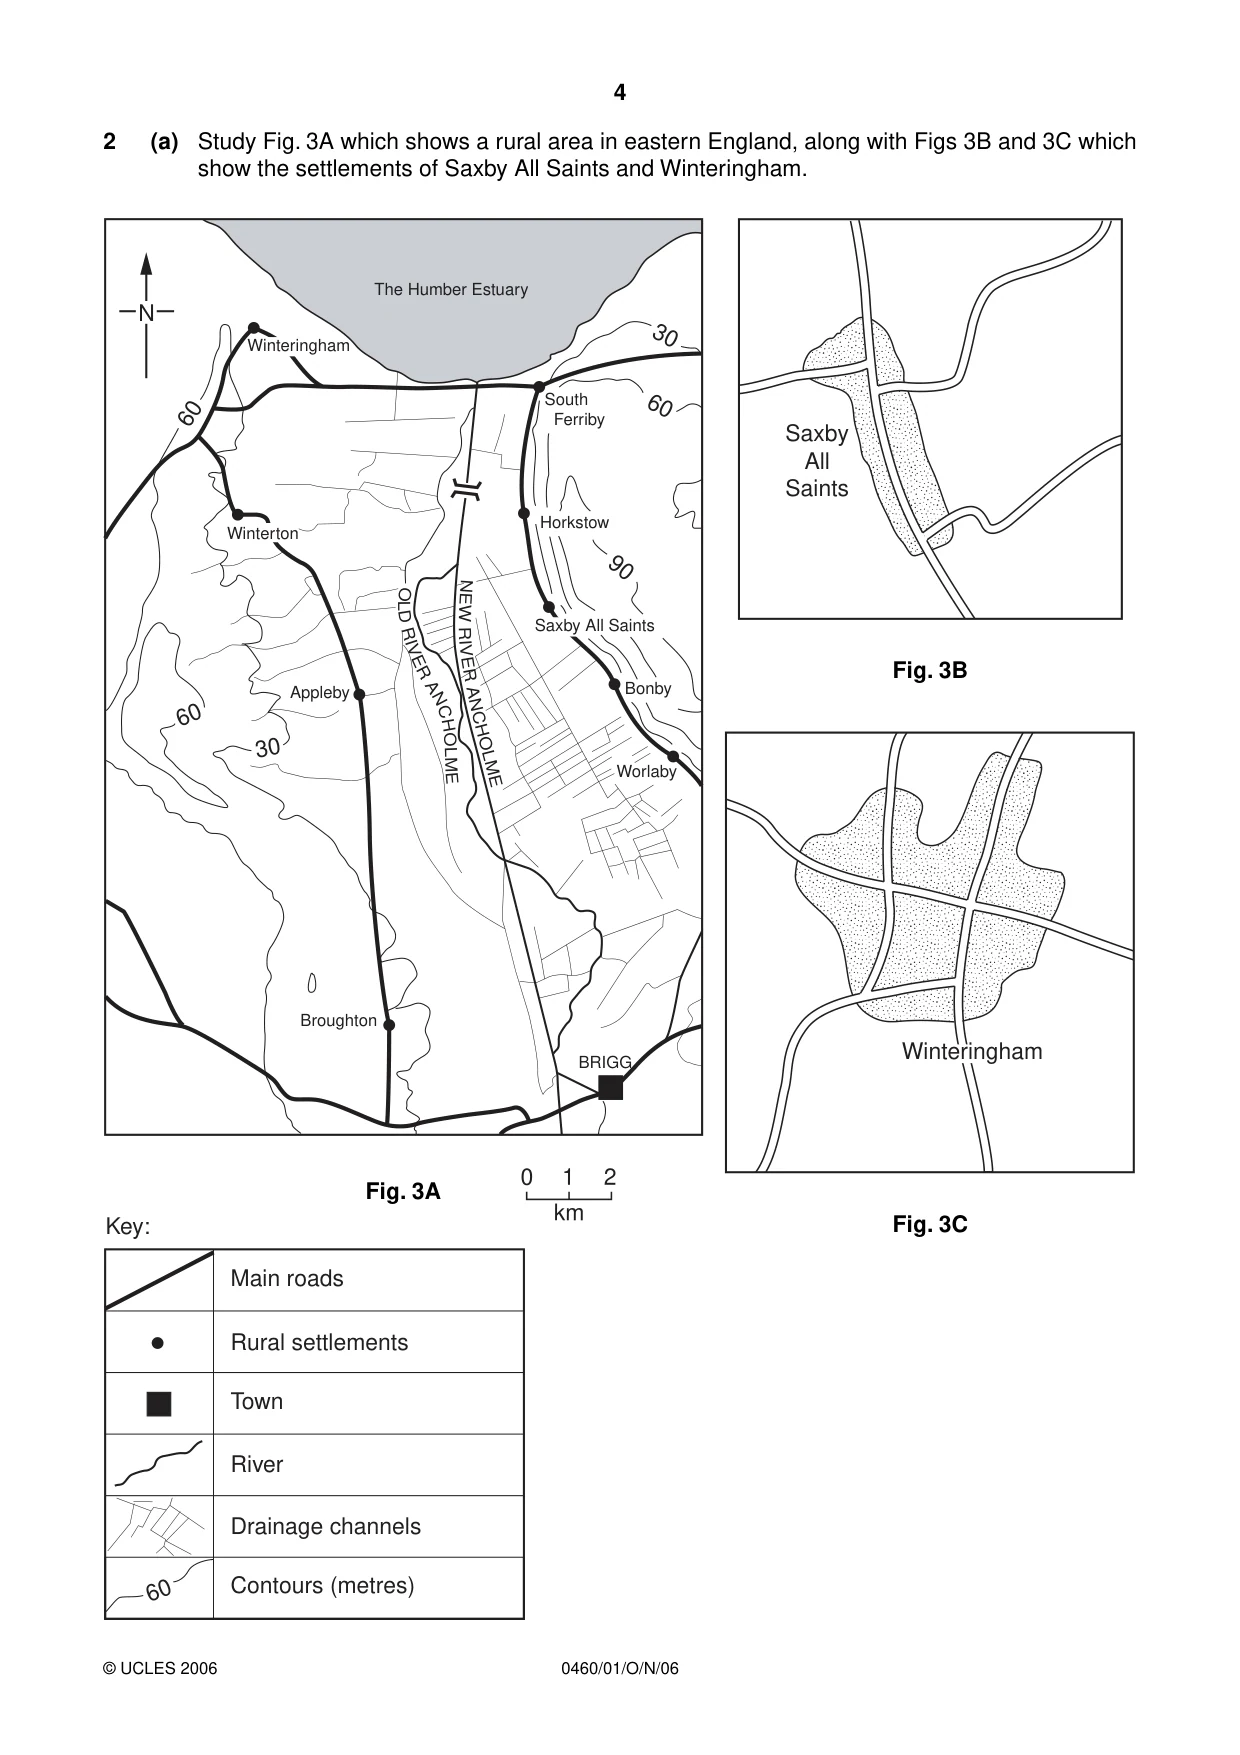
4 0460/01/O/N/06 © UCLES 2006 2 (a) Study Fig. 3A which shows a rural area in eastern England, along with Figs 3B and 3C which show the settlements of Saxby All Saints and Winteringham. NEW R I VE R AN CHOLME Winteringham Winterton Appleby Broughton Worlaby Bonby Saxby All Saints Horkstow 30 60 90 0 1 2 km 60 30 60 South Ferriby BRIGG The Humber Estuary N O L D R IV E R A N C H OLME Main roads Rural settlements Town River Drainage channels Contours (metres) Key: 60 Saxby All Saints Winteringham Fig. 3B Fig. 3C Fig. 3A
Question paper, page 5
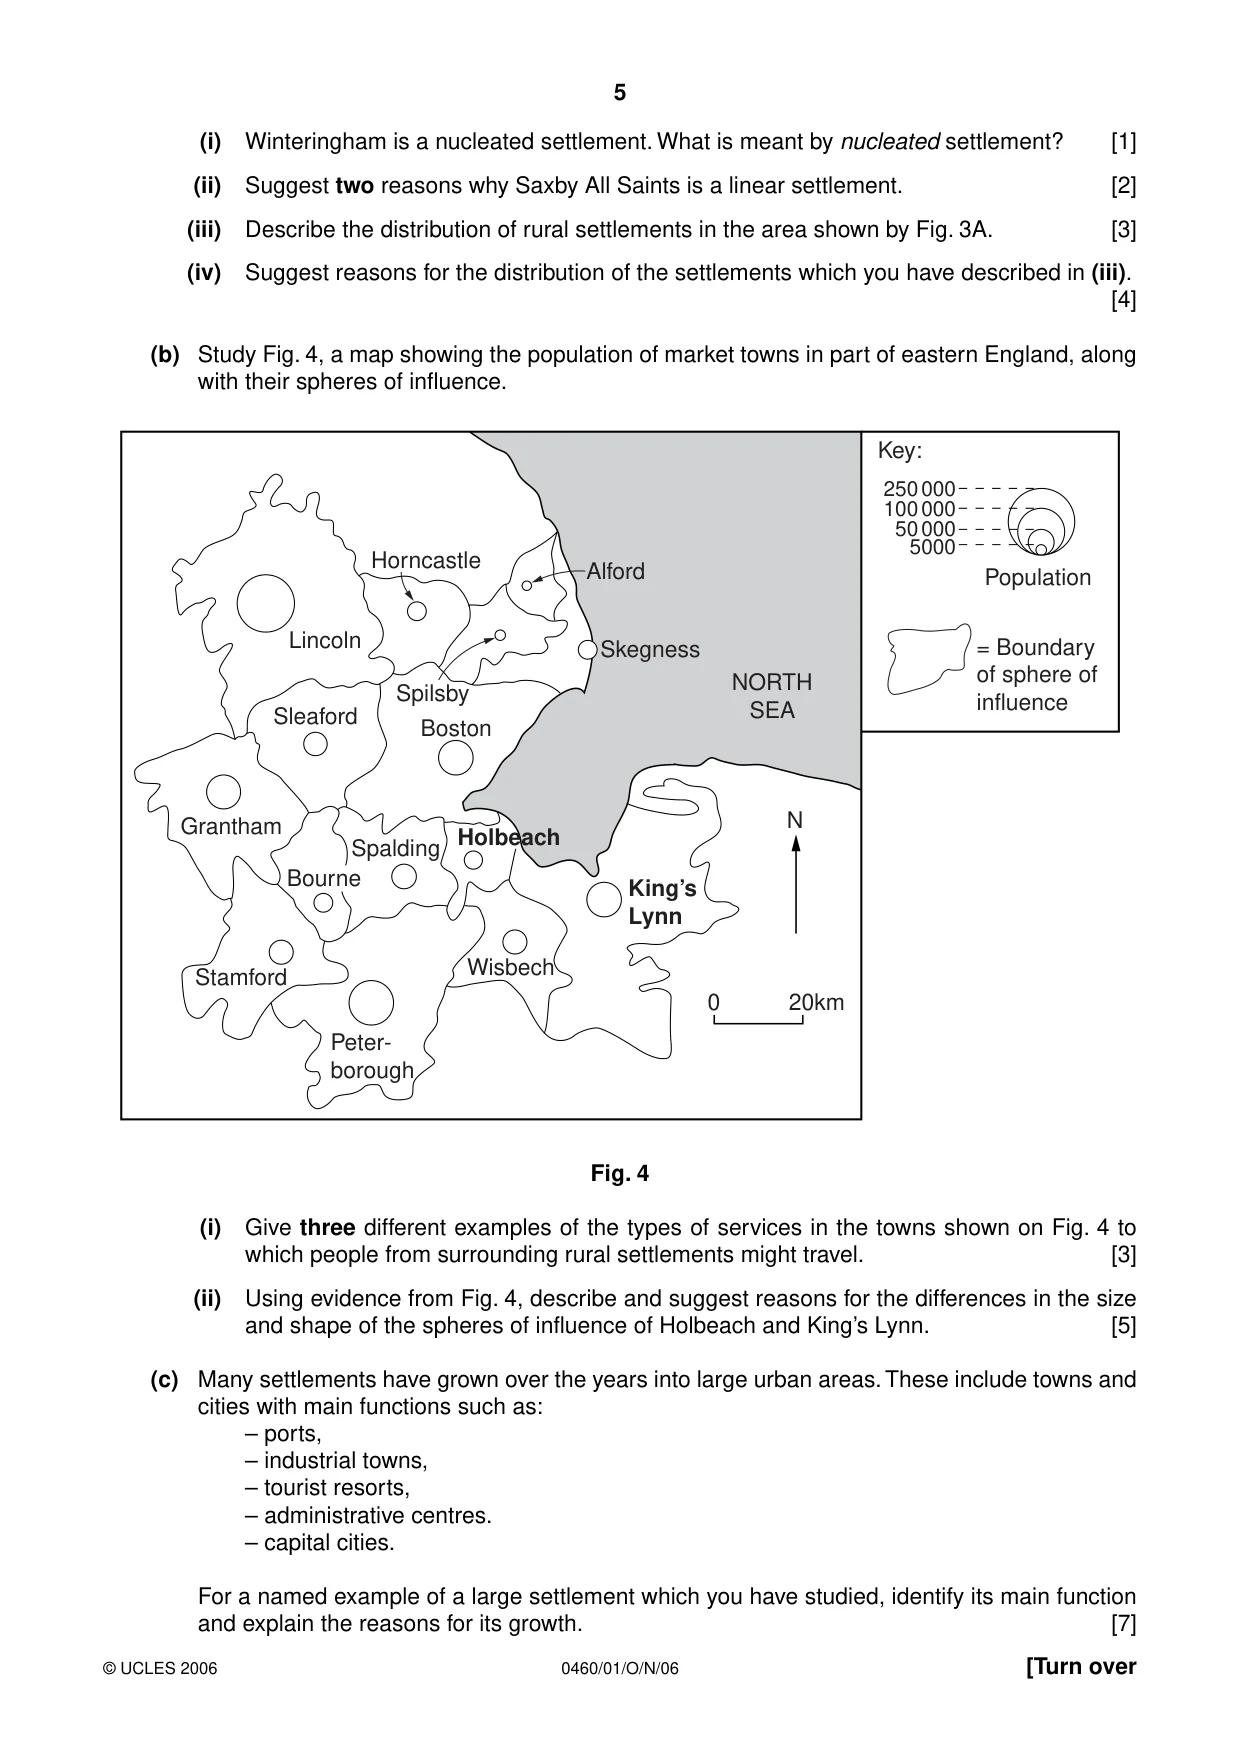
5 0460/01/O/N/06 © UCLES 2006 [Turn over (i) Winteringham is a nucleated settlement. What is meant by nucleated settlement? [1] (ii) Suggest two reasons why Saxby All Saints is a linear settlement. [2] (iii) Describe the distribution of rural settlements in the area shown by Fig. 3A. [3] (iv) Suggest reasons for the distribution of the settlements which you have described in (iii). [4] (b) Study Fig. 4, a map showing the population of market towns in part of eastern England, along with their spheres of influence. Peter- borough Stamford Grantham Sleaford Lincoln Horncastle Alford 250 000 100 000 50 000 5000 Key: Population = Boundary of sphere of influence NORTH SEA Skegness Spilsby Boston Spalding Bourne Wisbech Holbeach King’s Lynn N 0 20km Fig. 4 (i) Give three different examples of the types of services in the towns shown on Fig. 4 to which people from surrounding rural settlements might travel. [3] (ii) Using evidence from Fig. 4, describe and suggest reasons for the differences in the size and shape of the spheres of influence of Holbeach and King’s Lynn. [5] (c) Many settlements have grown over the years into large urban areas. These include towns and cities with main functions such as: – ports, – industrial towns, – tourist resorts, – administrative centres. – capital cities. For a named example of a large settlement which you have studied, identify its main function and explain the reasons for its growth. [7]
Question paper, page 7
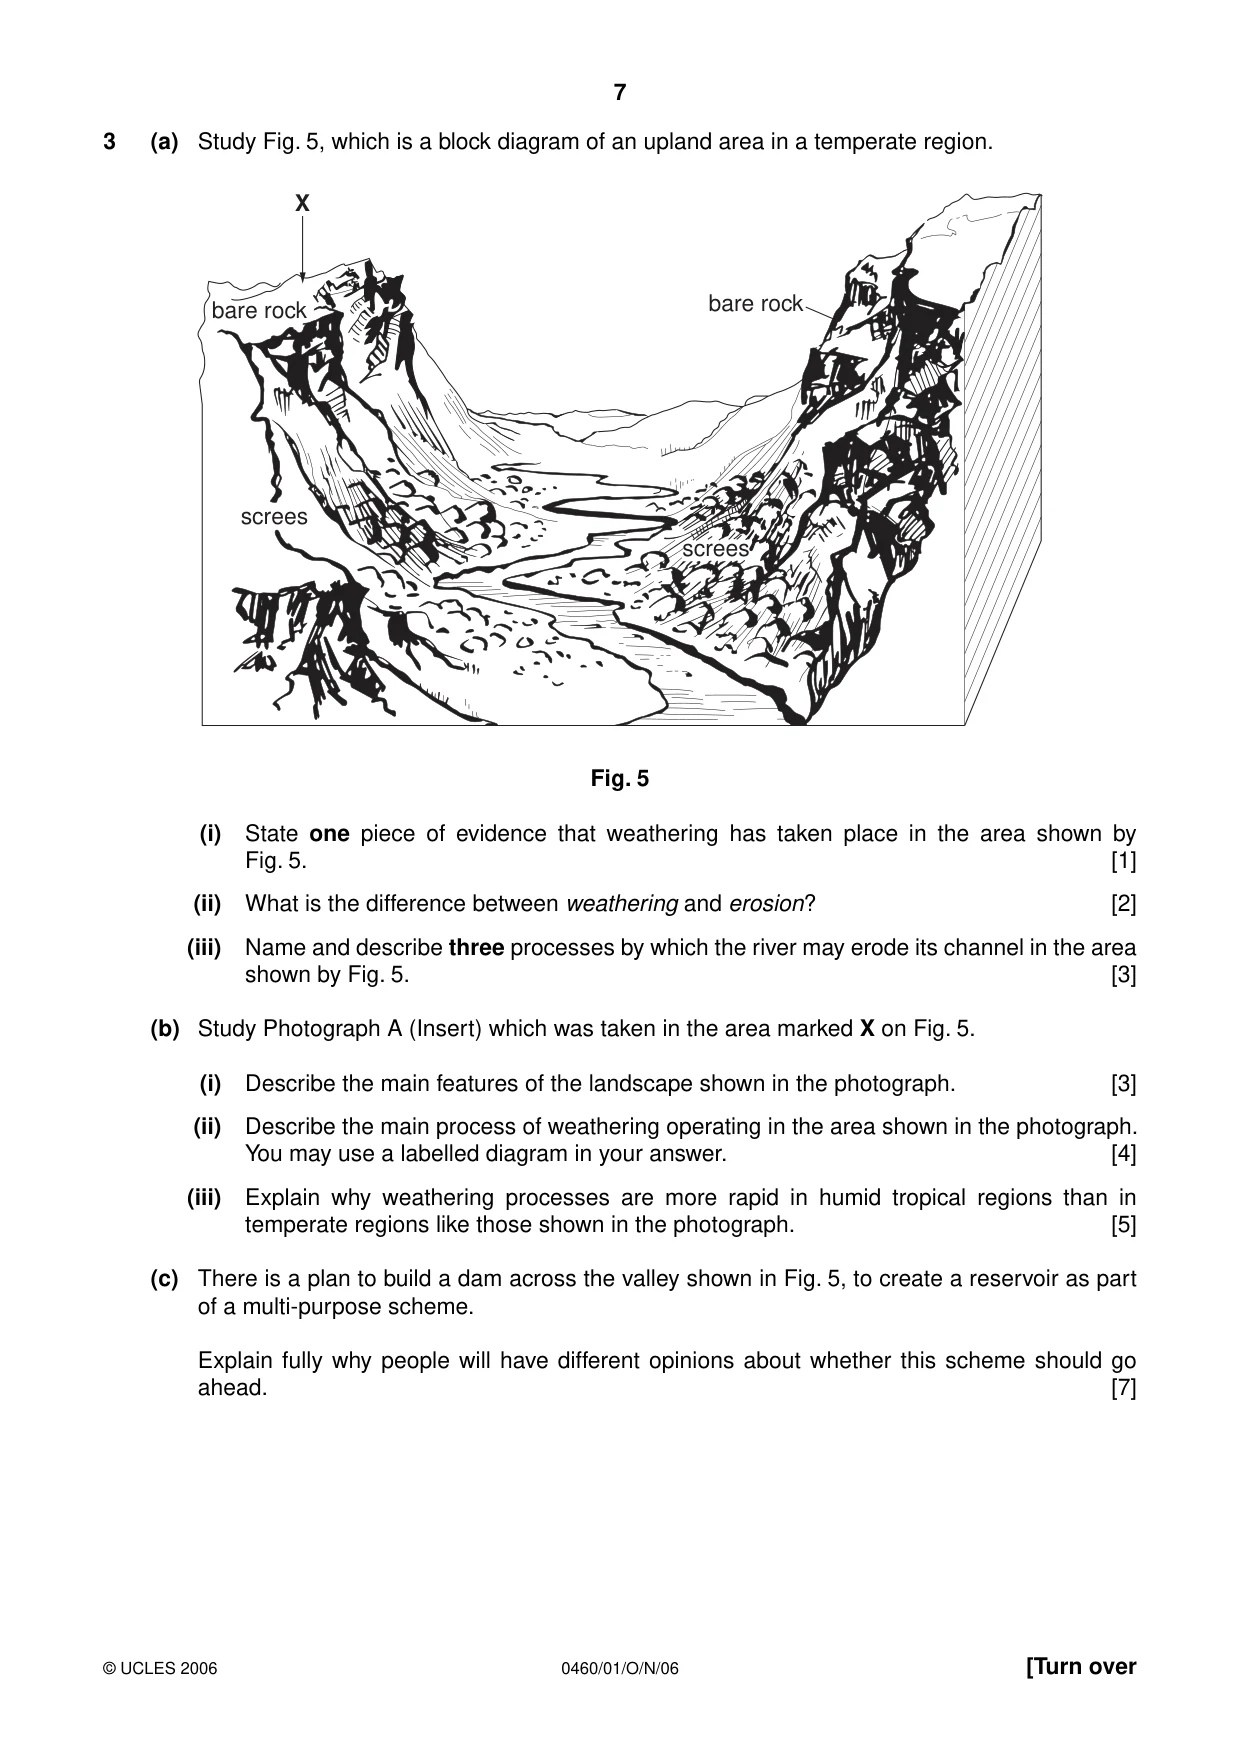
7 0460/01/O/N/06 © UCLES 2006 [Turn over 3 (a) Study Fig. 5, which is a block diagram of an upland area in a temperate region. X bare rock bare rock screes screes Fig. 5 (i) State one piece of evidence that weathering has taken place in the area shown by Fig. 5. [1] (ii) What is the difference between weathering and erosion? [2] (iii) Name and describe three processes by which the river may erode its channel in the area shown by Fig. 5. [3] (b) Study Photograph A (Insert) which was taken in the area marked X on Fig. 5. (i) Describe the main features of the landscape shown in the photograph. [3] (ii) Describe the main process of weathering operating in the area shown in the photograph. You may use a labelled diagram in your answer. [4] (iii) Explain why weathering processes are more rapid in humid tropical regions than in temperate regions like those shown in the photograph. [5] (c) There is a plan to build a dam across the valley shown in Fig. 5, to create a reservoir as part of a multi-purpose scheme. Explain fully why people will have different opinions about whether this scheme should go ahead. [7]
Question paper, page 8
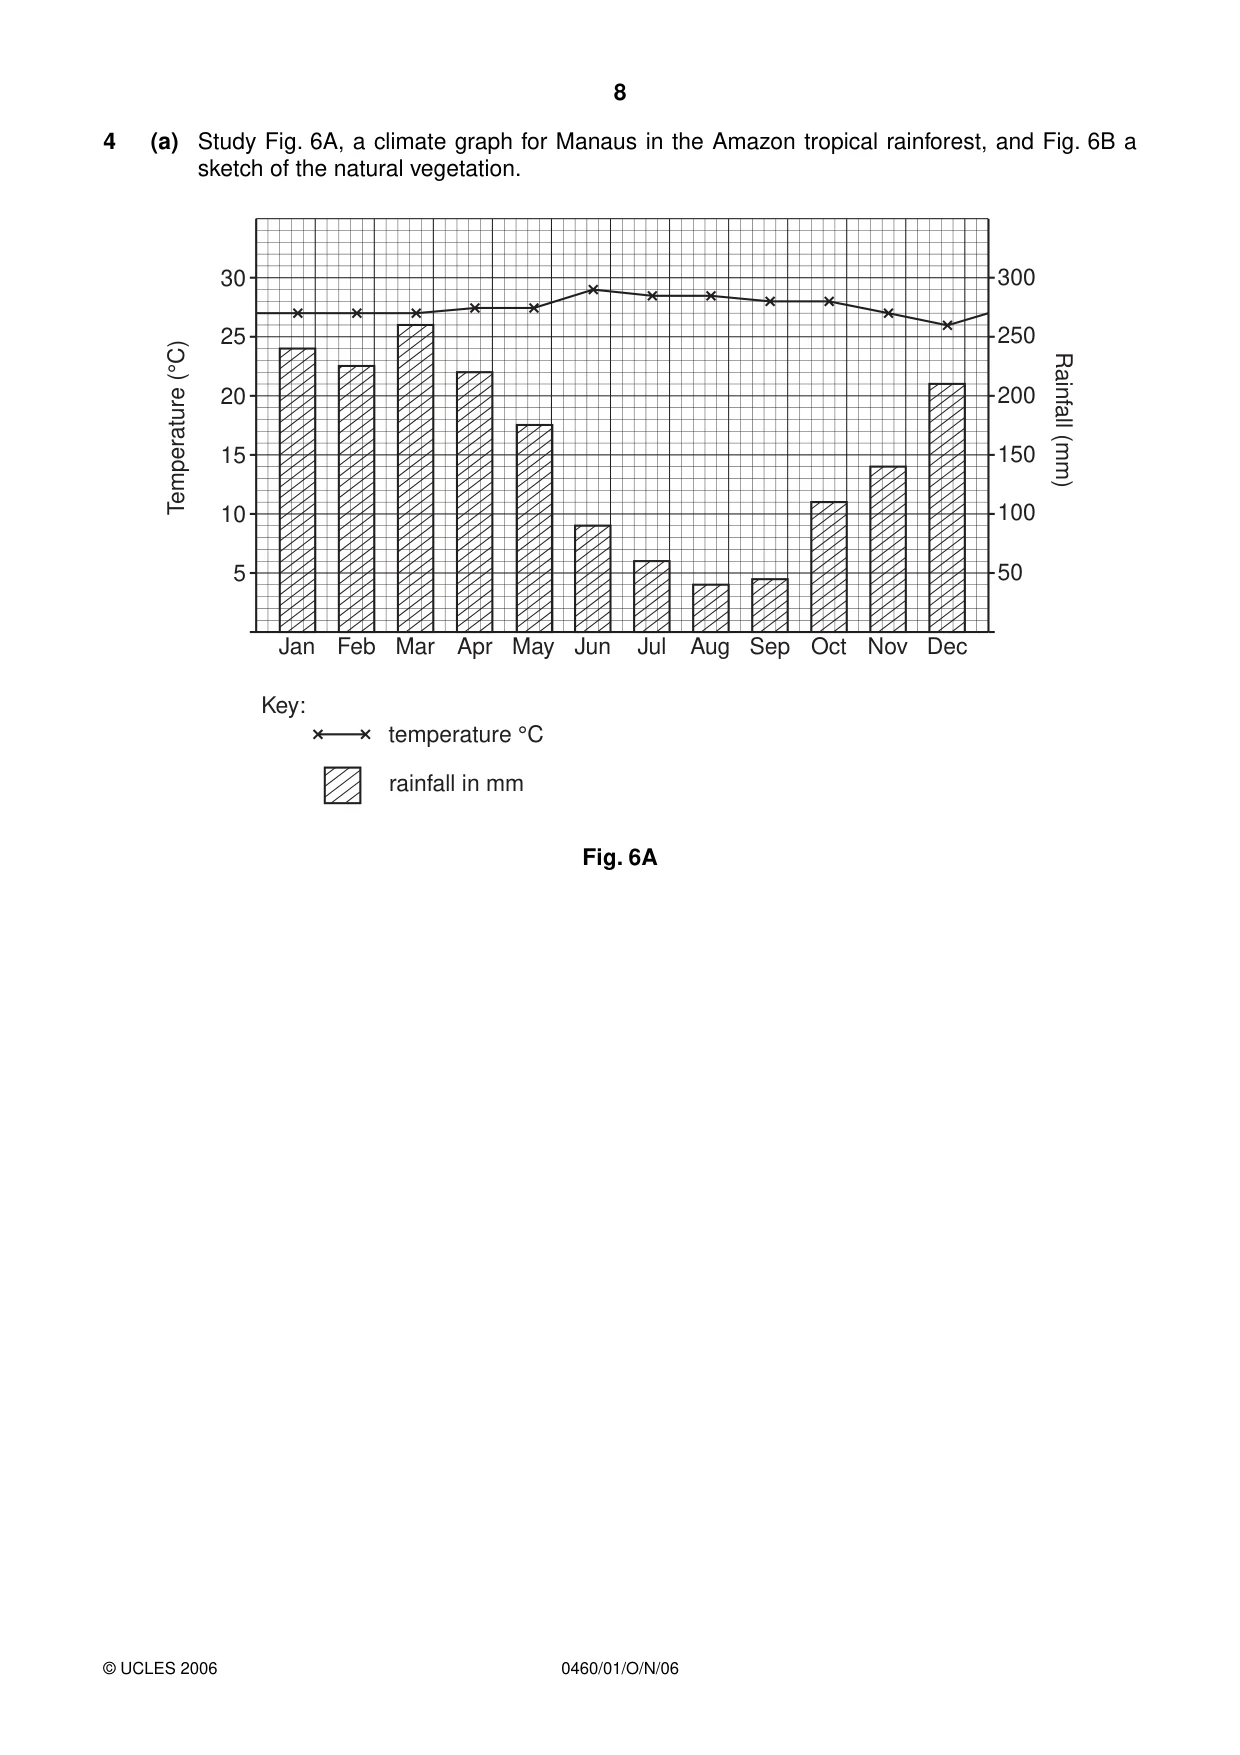
8 0460/01/O/N/06 © UCLES 2006 4 (a) Study Fig. 6A, a climate graph for Manaus in the Amazon tropical rainforest, and Fig. 6B a sketch of the natural vegetation. 30 25 20 Jan Key: temperature °C rainfall in mm Feb Mar Apr May Jun Jul Aug Sep Oct Nov Dec 15 Temperature (°C) 10 5 300 250 200 150 Rainfall (mm) 100 50 Fig. 6A
Question paper, page 9
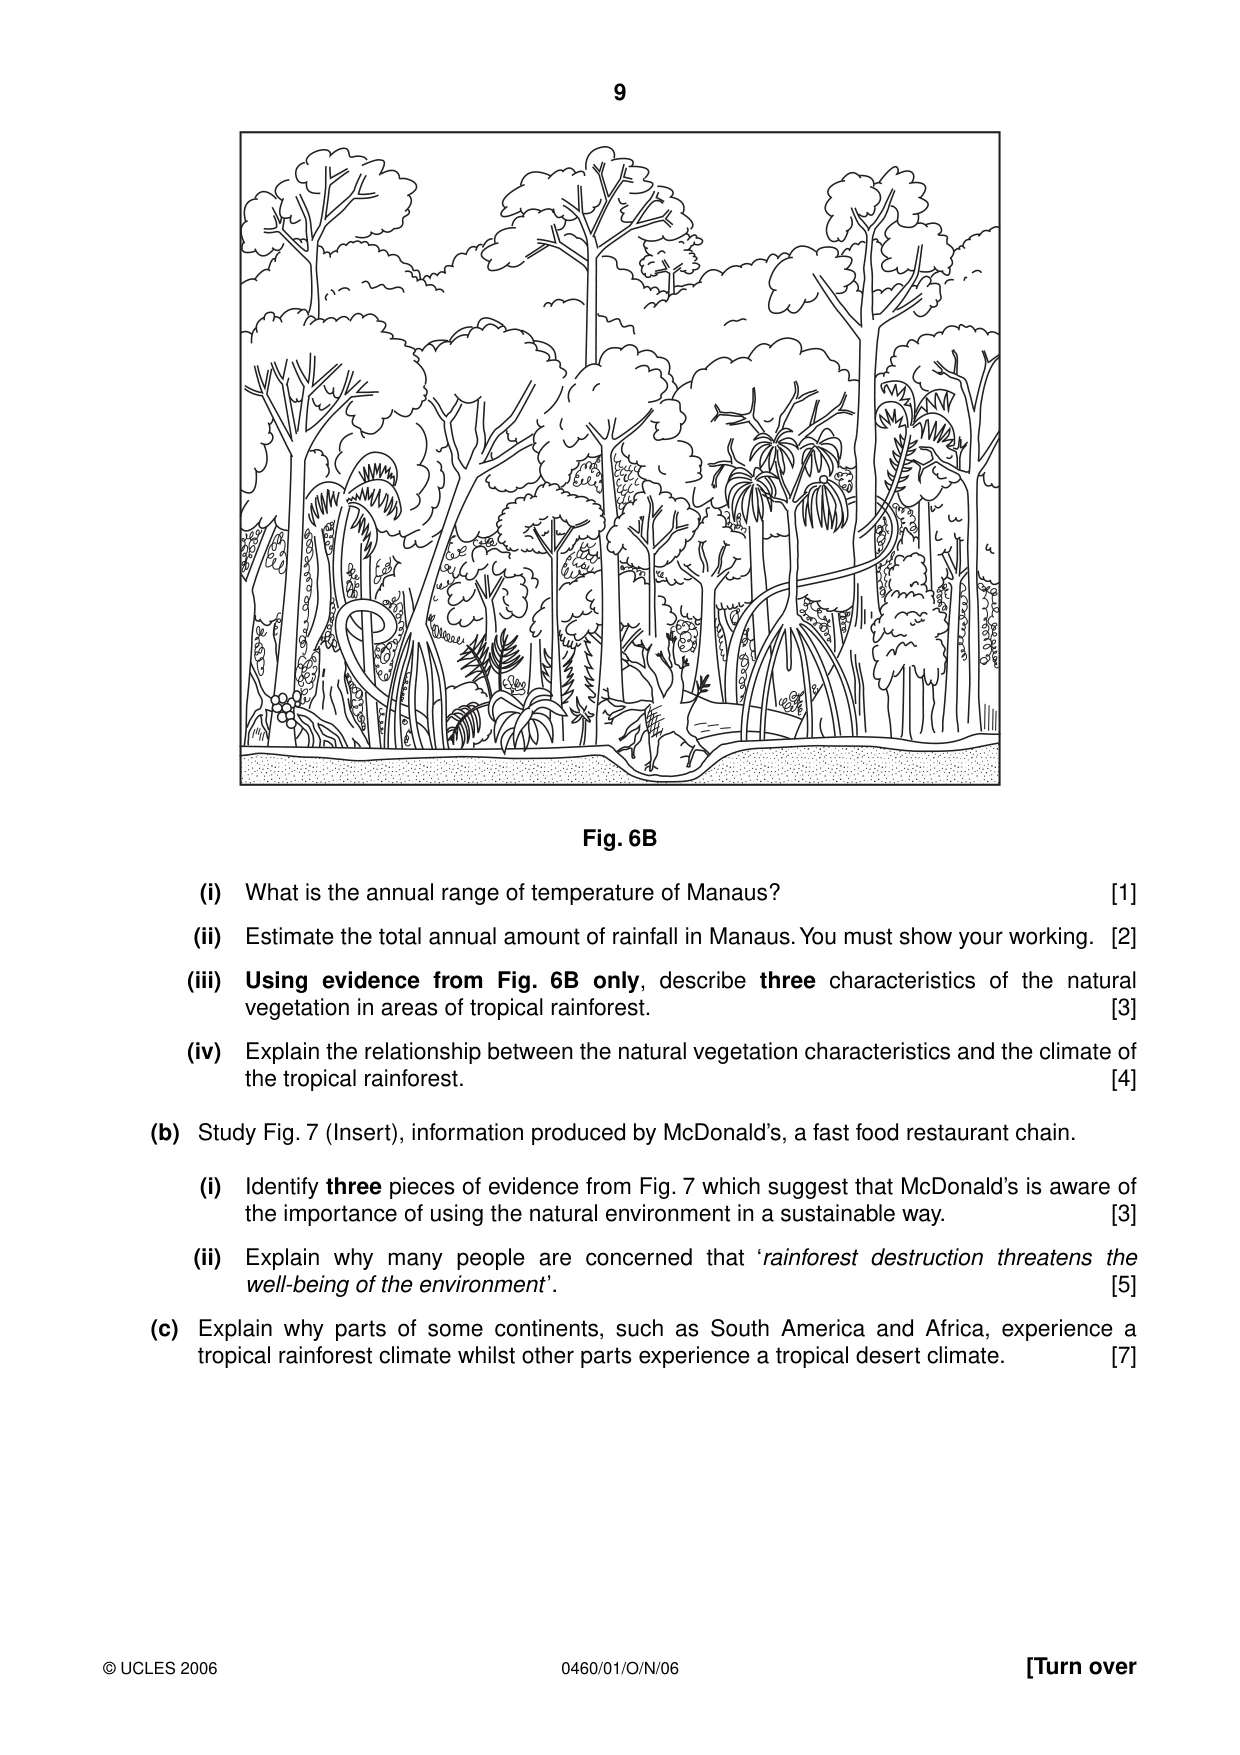
9 0460/01/O/N/06 © UCLES 2006 [Turn over Fig. 6B (i) What is the annual range of temperature of Manaus? [1] (ii) Estimate the total annual amount of rainfall in Manaus. You must show your working. [2] (iii) Using evidence from Fig. 6B only, describe three characteristics of the natural vegetation in areas of tropical rainforest. [3] (iv) Explain the relationship between the natural vegetation characteristics and the climate of the tropical rainforest. [4] (b) Study Fig. 7 (Insert), information produced by McDonald’s, a fast food restaurant chain. (i) Identify three pieces of evidence from Fig. 7 which suggest that McDonald’s is aware of the importance of using the natural environment in a sustainable way. [3] (ii) Explain why many people are concerned that ‘rainforest destruction threatens the well-being of the environment’. [5] (c) Explain why parts of some continents, such as South America and Africa, experience a tropical rainforest climate whilst other parts experience a tropical desert climate. [7]
Question paper, page 10
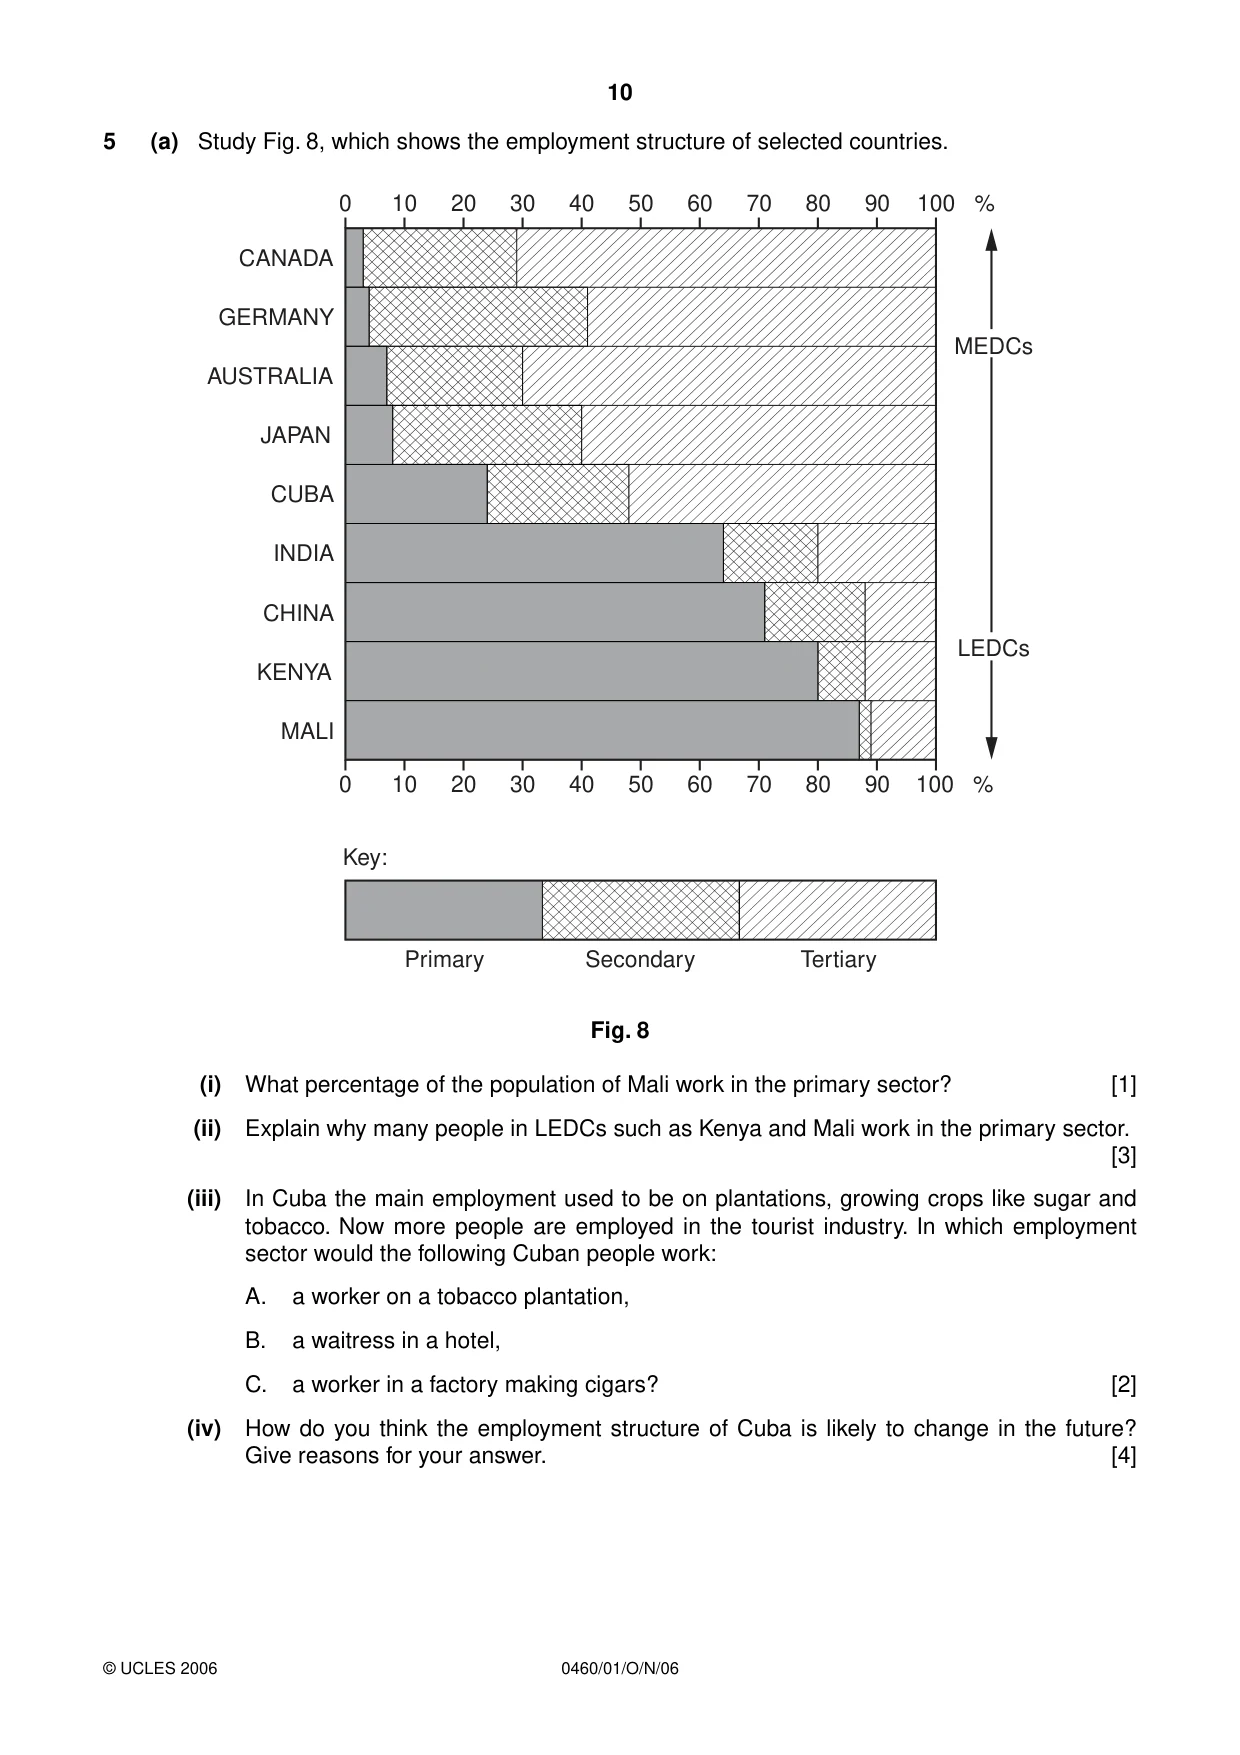
10 0460/01/O/N/06 © UCLES 2006 5 (a) Study Fig. 8, which shows the employment structure of selected countries. 0 CANADA GERMANY AUSTRALIA JAPAN CUBA INDIA CHINA KENYA MALI 10 20 30 40 50 60 70 80 90 100 % 0 10 Key: Primary Secondary Tertiary 20 30 40 50 60 70 80 90 100 % MEDCs LEDCs Fig. 8 (i) What percentage of the population of Mali work in the primary sector? [1] (ii) Explain why many people in LEDCs such as Kenya and Mali work in the primary sector. [3] (iii) In Cuba the main employment used to be on plantations, growing crops like sugar and tobacco. Now more people are employed in the tourist industry. In which employment sector would the following Cuban people work: A. a worker on a tobacco plantation, B. a waitress in a hotel, C. a worker in a factory making cigars? [2] (iv) How do you think the employment structure of Cuba is likely to change in the future? Give reasons for your answer. [4]
Question paper, page 11
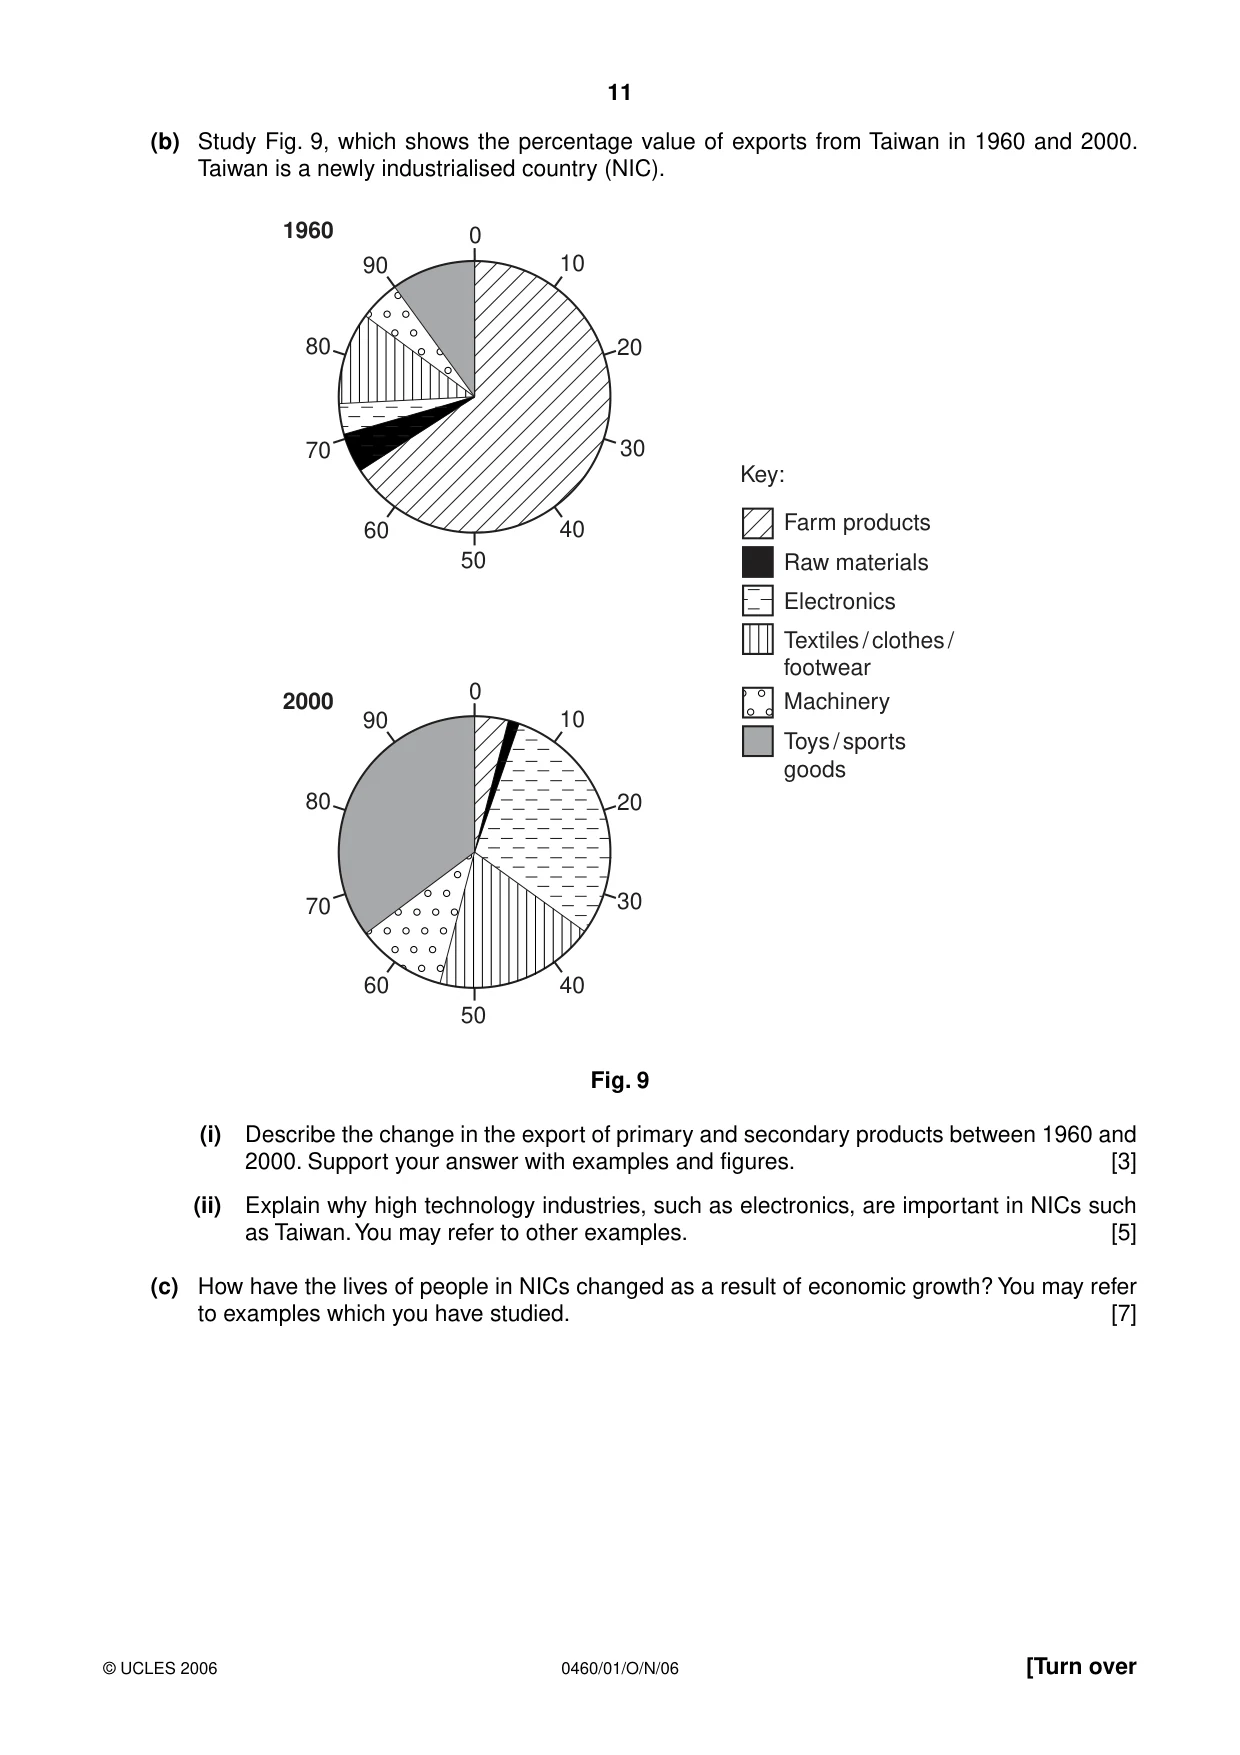
11 0460/01/O/N/06 © UCLES 2006 [Turn over (b) Study Fig. 9, which shows the percentage value of exports from Taiwan in 1960 and 2000. Taiwan is a newly industrialised country (NIC). 0 10 20 30 40 50 60 70 80 90 0 10 20 30 40 50 60 70 80 1960 Farm products Raw materials Electronics Textiles / clothes / footwear 2000 90 Machinery Toys / sports goods Key: Fig. 9 (i) Describe the change in the export of primary and secondary products between 1960 and 2000. Support your answer with examples and figures. [3] (ii) Explain why high technology industries, such as electronics, are important in NICs such as Taiwan. You may refer to other examples. [5] (c) How have the lives of people in NICs changed as a result of economic growth? You may refer to examples which you have studied. [7]
Question paper, page 12
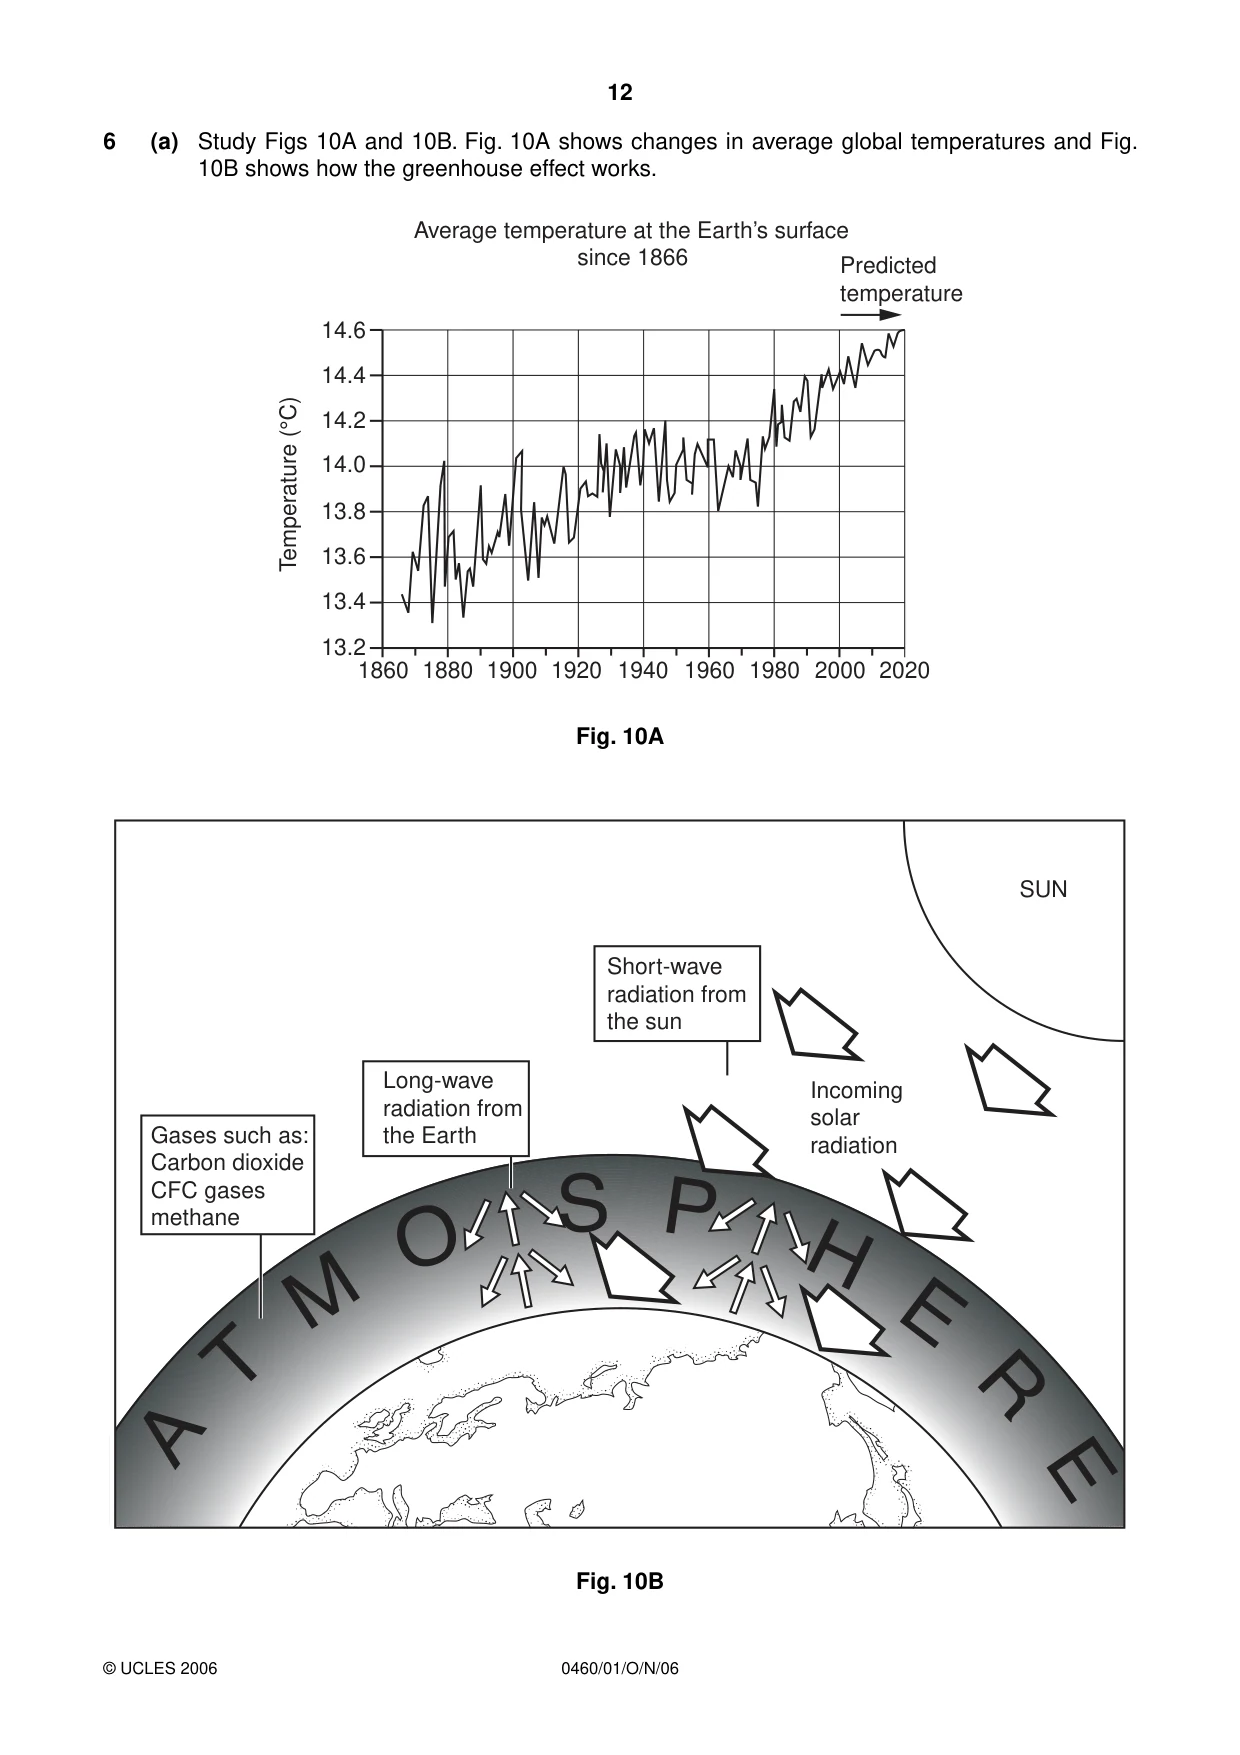
12 0460/01/O/N/06 © UCLES 2006 6 (a) Study Figs 10A and 10B. Fig. 10A shows changes in average global temperatures and Fig. 10B shows how the greenhouse effect works. 14.6 14.4 14.2 14.0 13.8 13.6 13.4 13.2 1860 Temperature (°C) 1880 1900 1920 Average temperature at the Earth’s surface since 1866 Predicted temperature 1940 1960 1980 2000 2020 Fig. 10A SUN Short-wave radiation from the sun Long-wave radiation from the Earth Gases such as: Carbon dioxide CFC gases methane Incoming solar radiation Fig. 10B
Question paper, page 13
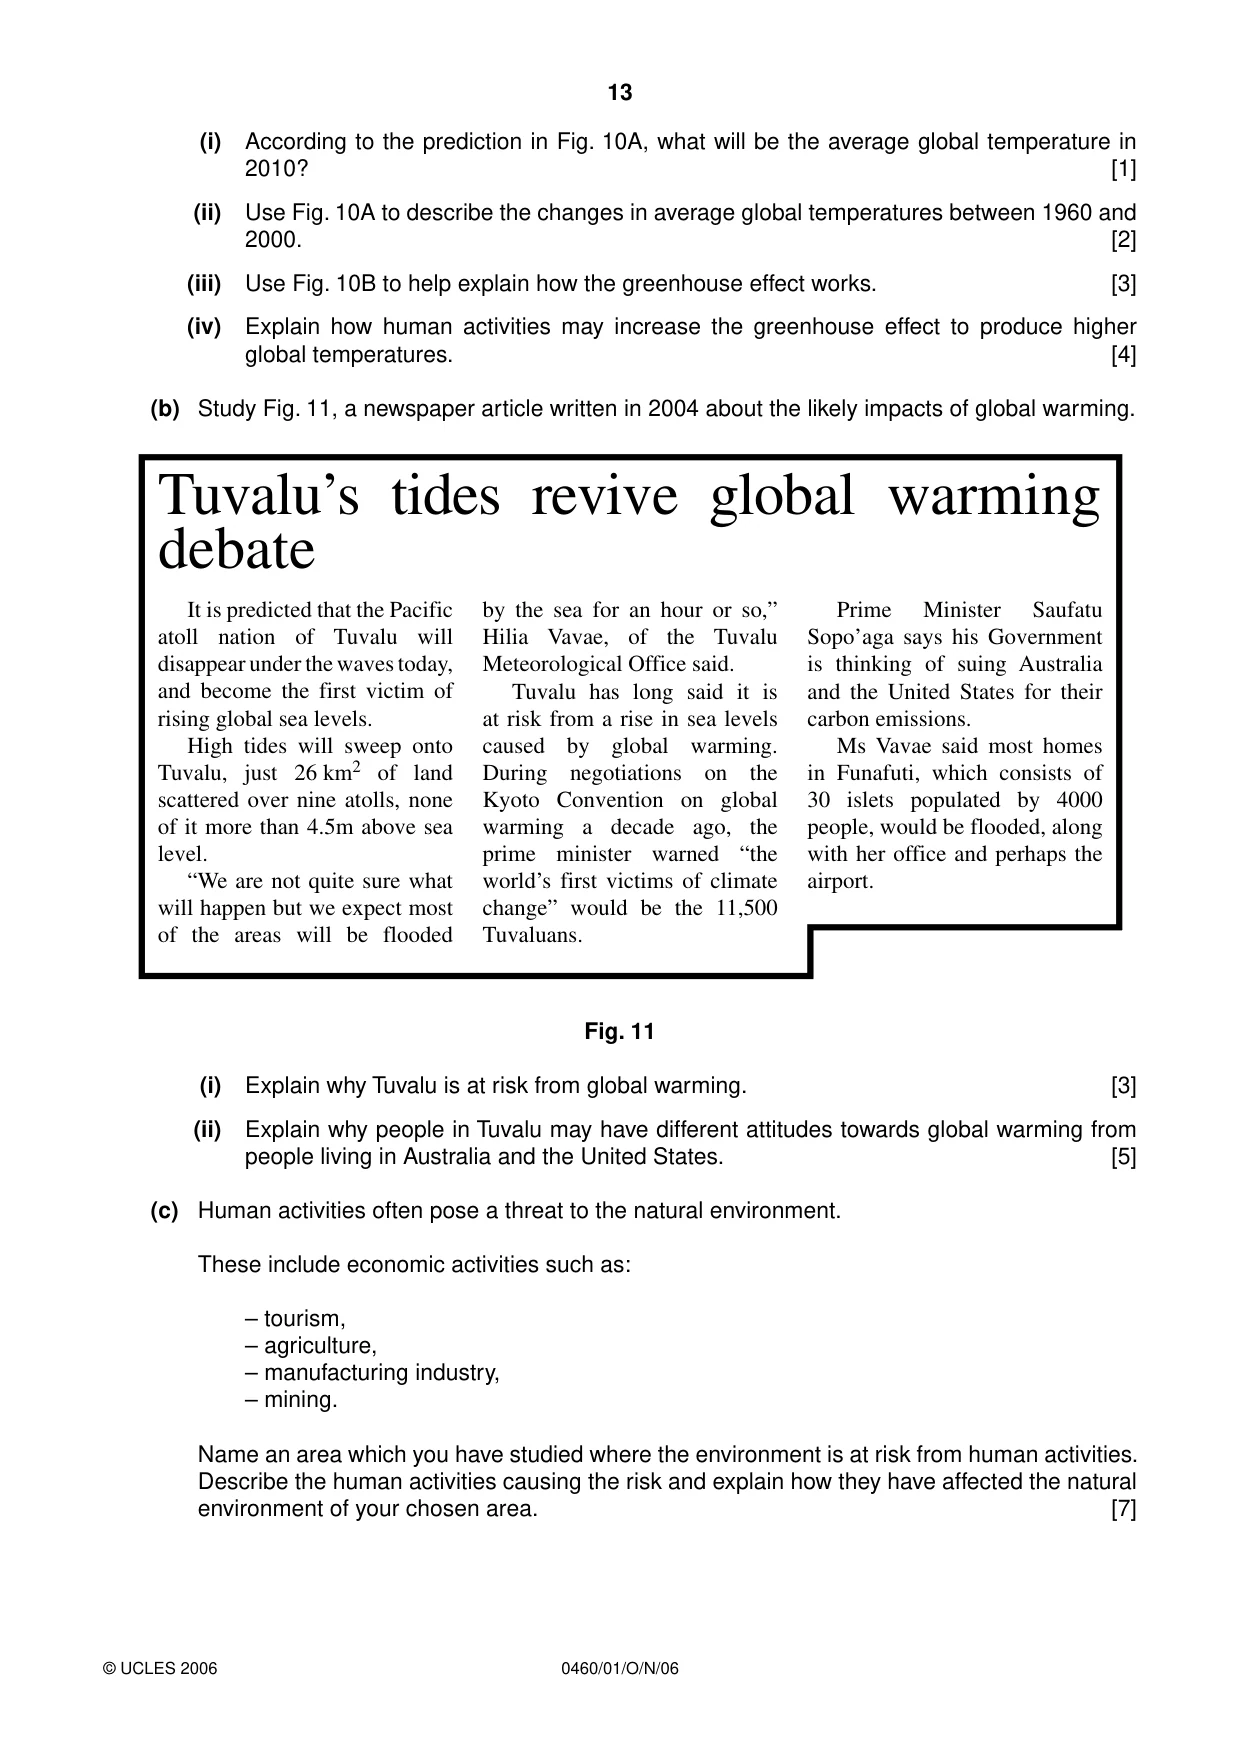
13 0460/01/O/N/06 © UCLES 2006 (i) According to the prediction in Fig. 10A, what will be the average global temperature in 2010? [1] (ii) Use Fig. 10A to describe the changes in average global temperatures between 1960 and 2000. [2] (iii) Use Fig. 10B to help explain how the greenhouse effect works. [3] (iv) Explain how human activities may increase the greenhouse effect to produce higher global temperatures. [4] (b) Study Fig. 11, a newspaper article written in 2004 about the likely impacts of global warming. Tuvalu’s tides revive global warming debate It is predicted that the Pacific atoll nation of Tuvalu will disappear under the waves today, and become the first victim of rising global sea levels. High tides will sweep onto Tuvalu, just 26 km2 of land scattered over nine atolls, none of it more than 4.5m above sea level. “We are not quite sure what will happen but we expect most of the areas will be flooded by the sea for an hour or so,” Hilia Vavae, of the Tuvalu Meteorological Office said. Tuvalu has long said it is at risk from a rise in sea levels caused by global warming. During negotiations on the Kyoto Convention on global warming a decade ago, the prime minister warned “the world’s first victims of climate change” would be the 11,500 Tuvaluans. Prime Minister Saufatu Sopo’aga says his Government is thinking of suing Australia and the United States for their carbon emissions. Ms Vavae said most homes in Funafuti, which consists of 30 islets populated by 4000 people, would be flooded, along with her office and perhaps the airport. Fig. 11 (i) Explain why Tuvalu is at risk from global warming. [3] (ii) Explain why people in Tuvalu may have different attitudes towards global warming from people living in Australia and the United States. [5] (c) Human activities often pose a threat to the natural environment. These include economic activities such as: – tourism, – agriculture, – manufacturing industry, – mining. Name an area which you have studied where the environment is at risk from human activities. Describe the human activities causing the risk and explain how they have affected the natural environment of your chosen area. [7]
Question paper, page 16
16 0460/01/O/N/06 BLANK PAGE Copyright Acknowledgements: Photograph A S. Sibley © UCLES Question 6 Fig. 11 © New Zealand Herald Permission to reproduce items where third-party owned material protected by copyright is included has been sought and cleared where possible. Every reasonable effort has been made by the publisher (UCLES) to trace copyright holders, but if any items requiring clearance have unwittingly been included, the publisher will be pleased to make amends at the earliest possible opportunity. University of Cambridge International Examinations is part of the University of Cambridge Local Examinations Syndicate (UCLES), which is itself a department of the University of Cambridge.
Mark scheme, page 1
UNIVERSITY OF CAMBRIDGE INTERNATIONAL EXAMINATIONS International General Certificate of Secondary Education MARK SCHEME for the October/November 2006 question paper 0460 GEOGRAPHY 0460/01 Paper 1, maximum raw mark 75 This mark scheme is published as an aid to teachers and students, to indicate the requirements of the examination. It shows the basis on which Examiners were instructed to award marks. It does not indicate the details of the discussions that took place at an Examiners’ meeting before marking began. All Examiners are instructed that alternative correct answers and unexpected approaches in candidates’ scripts must be given marks that fairly reflect the relevant knowledge and skills demonstrated. Mark schemes must be read in conjunction with the question papers and the report on the examination. The grade thresholds for various grades are published in the report on the examination for most IGCSE, GCE Advanced Level and Advanced Subsidiary Level syllabuses. • CIE will not enter into discussions or correspondence in connection with these mark schemes. CIE is publishing the mark schemes for the October/November 2006 question papers for most IGCSE, GCE Advanced Level and Advanced Subsidiary Level syllabuses and some Ordinary Level syllabuses. www.XtremePapers.com
Mark scheme, page 2
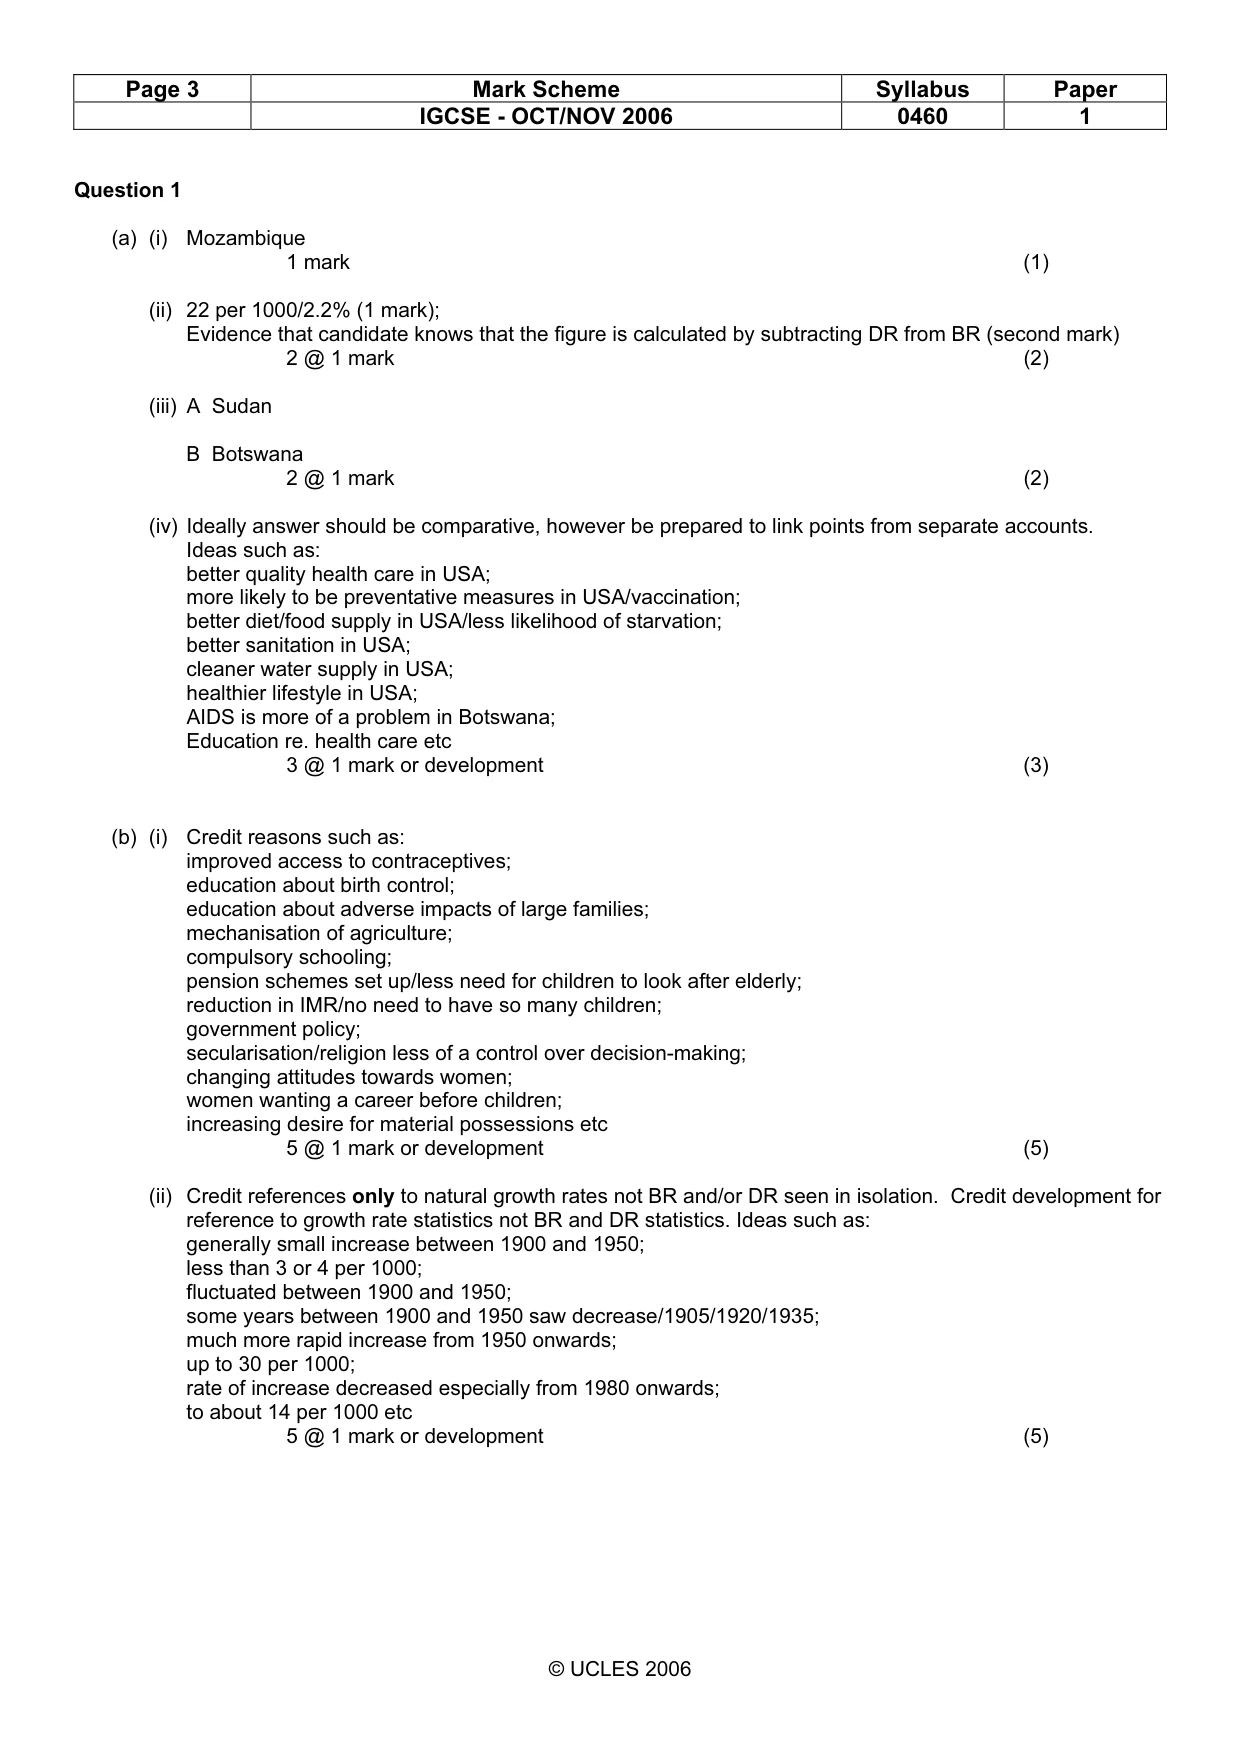
Page 2 Mark Scheme Syllabus Paper IGCSE - OCT/NOV 2006 0460 1 © UCLES 2006 Final MARK SCHEME Geography IGCSE Paper 1 Nov 2006 The features of the marking scheme Each question carries 25 marks. Candidates cannot earn above the maximum marks available within each sub section. The marking scheme attempts to give guidance about the requirements of each answer and lists a number of responses which will earn marks along with the general principles to be applied when marking each question. It should be noted that candidates can earn marks if their answers are phrased differently, provided they convey the same meaning as those in the mark scheme. THE CANDIDATES DO NOT NEED TO USE THE SAME WORDING TO EARN MARKS. The notation ‘etc’ at the end of an answer in the mark scheme signifies that there may well be other correct responses or examples that can be given credit. Providing the statement is true, relevant to the question asked and not repetition of a previous point made credit should be given. A point made within one sub-section which is an answer to the question set in a different sub-section should not be given credit as each sub-section asks different questions which require independent answers. The mark scheme uses semi colons (;) to separate marks and diagonals to separate alternative answers.
Mark scheme, page 3
Page 3 Mark Scheme Syllabus Paper IGCSE - OCT/NOV 2006 0460 1 © UCLES 2006 Question 1 (a) (i) Mozambique 1 mark (1) (ii) 22 per 1000/2.2% (1 mark); Evidence that candidate knows that the figure is calculated by subtracting DR from BR (second mark) 2 @ 1 mark (2) (iii) A Sudan B Botswana 2 @ 1 mark (2) (iv) Ideally answer should be comparative, however be prepared to link points from separate accounts. Ideas such as: better quality health care in USA; more likely to be preventative measures in USA/vaccination; better diet/food supply in USA/less likelihood of starvation; better sanitation in USA; cleaner water supply in USA; healthier lifestyle in USA; AIDS is more of a problem in Botswana; Education re. health care etc 3 @ 1 mark or development (3) (b) (i) Credit reasons such as: improved access to contraceptives; education about birth control; education about adverse impacts of large families; mechanisation of agriculture; compulsory schooling; pension schemes set up/less need for children to look after elderly; reduction in IMR/no need to have so many children; government policy; secularisation/religion less of a control over decision-making; changing attitudes towards women; women wanting a career before children; increasing desire for material possessions etc 5 @ 1 mark or development (5) (ii) Credit references only to natural growth rates not BR and/or DR seen in isolation. Credit development for reference to growth rate statistics not BR and DR statistics. Ideas such as: generally small increase between 1900 and 1950; less than 3 or 4 per 1000; fluctuated between 1900 and 1950; some years between 1900 and 1950 saw decrease/1905/1920/1935; much more rapid increase from 1950 onwards; up to 30 per 1000; rate of increase decreased especially from 1980 onwards; to about 14 per 1000 etc 5 @ 1 mark or development (5)
Mark scheme, page 4
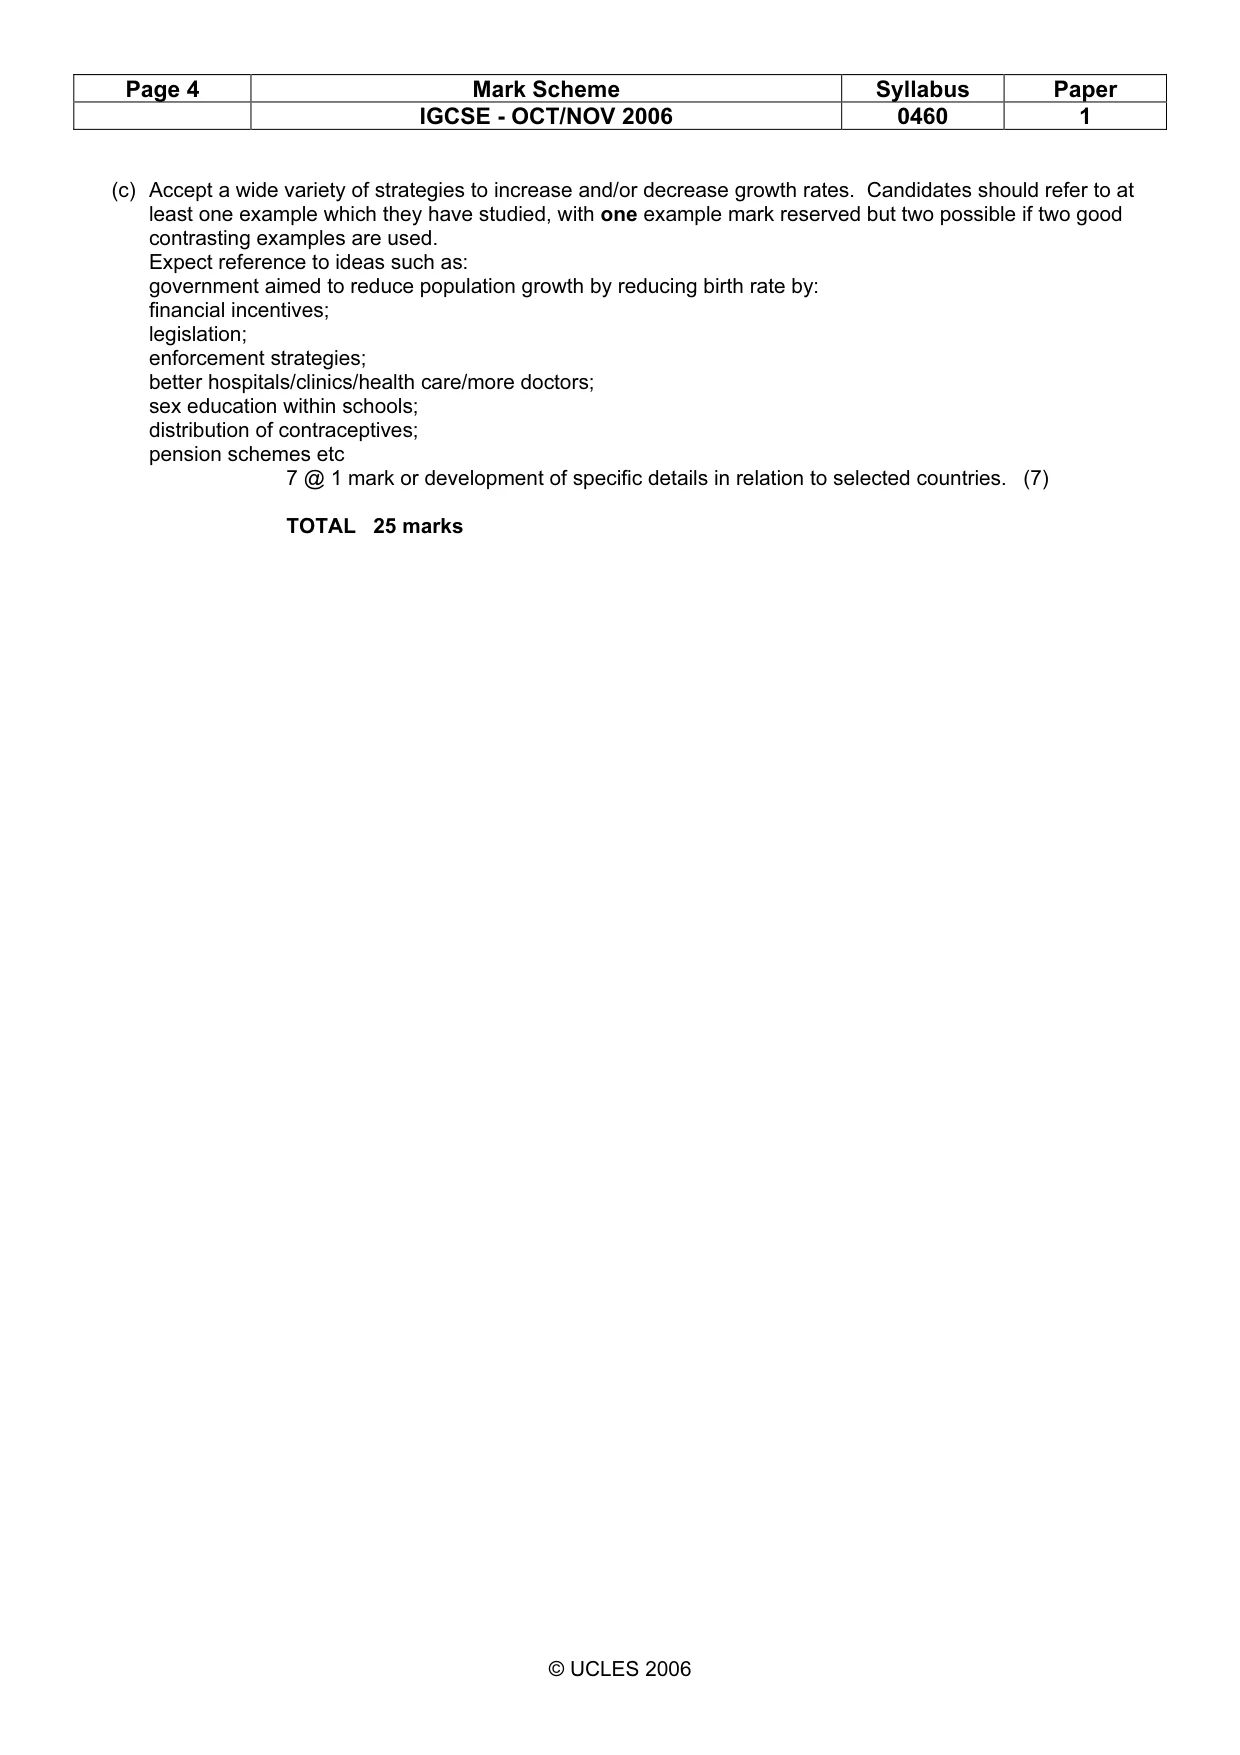
Page 4 Mark Scheme Syllabus Paper IGCSE - OCT/NOV 2006 0460 1 © UCLES 2006 (c) Accept a wide variety of strategies to increase and/or decrease growth rates. Candidates should refer to at least one example which they have studied, with one example mark reserved but two possible if two good contrasting examples are used. Expect reference to ideas such as: government aimed to reduce population growth by reducing birth rate by: financial incentives; legislation; enforcement strategies; better hospitals/clinics/health care/more doctors; sex education within schools; distribution of contraceptives; pension schemes etc 7 @ 1 mark or development of specific details in relation to selected countries. (7) TOTAL 25 marks
Mark scheme, page 5
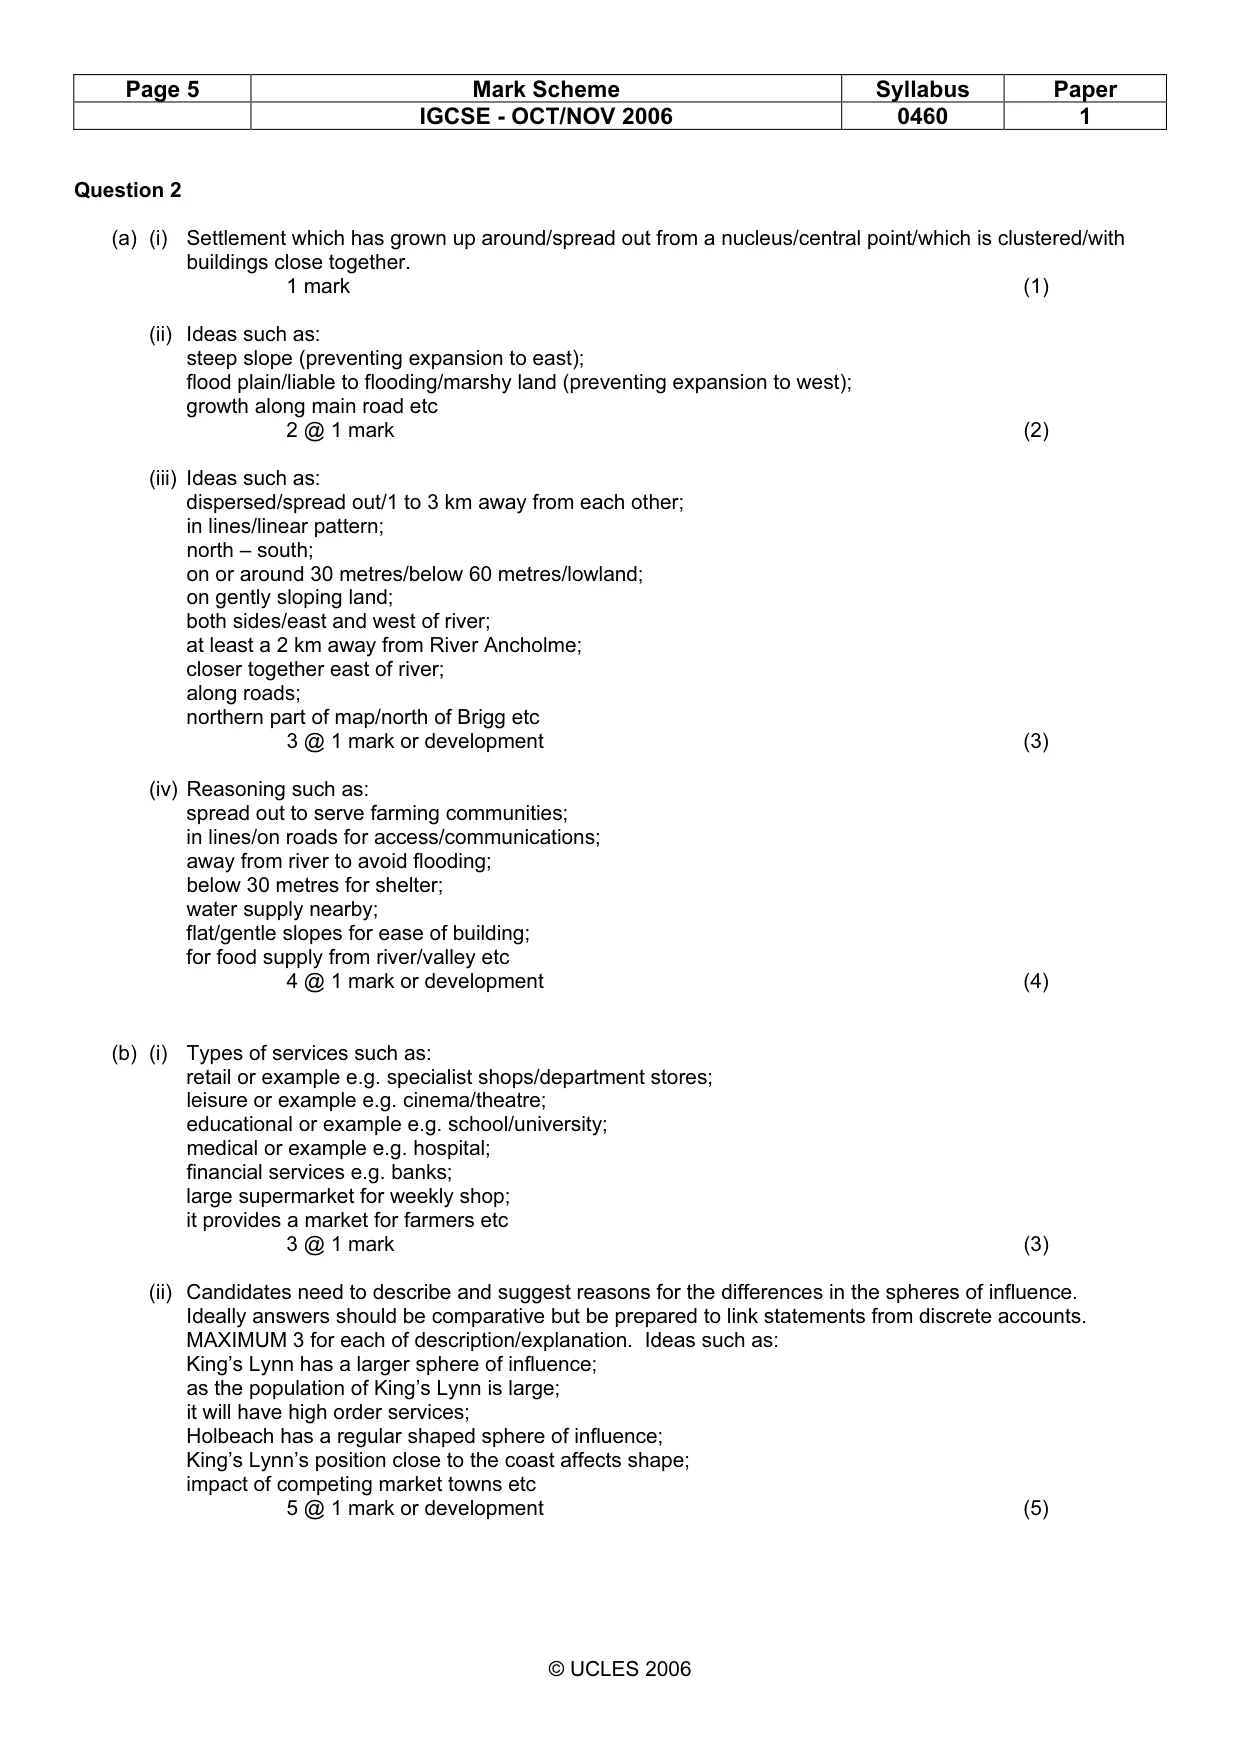
Page 5 Mark Scheme Syllabus Paper IGCSE - OCT/NOV 2006 0460 1 © UCLES 2006 Question 2 (a) (i) Settlement which has grown up around/spread out from a nucleus/central point/which is clustered/with buildings close together. 1 mark (1) (ii) Ideas such as: steep slope (preventing expansion to east); flood plain/liable to flooding/marshy land (preventing expansion to west); growth along main road etc 2 @ 1 mark (2) (iii) Ideas such as: dispersed/spread out/1 to 3 km away from each other; in lines/linear pattern; north – south; on or around 30 metres/below 60 metres/lowland; on gently sloping land; both sides/east and west of river; at least a 2 km away from River Ancholme; closer together east of river; along roads; northern part of map/north of Brigg etc 3 @ 1 mark or development (3) (iv) Reasoning such as: spread out to serve farming communities; in lines/on roads for access/communications; away from river to avoid flooding; below 30 metres for shelter; water supply nearby; flat/gentle slopes for ease of building; for food supply from river/valley etc 4 @ 1 mark or development (4) (b) (i) Types of services such as: retail or example e.g. specialist shops/department stores; leisure or example e.g. cinema/theatre; educational or example e.g. school/university; medical or example e.g. hospital; financial services e.g. banks; large supermarket for weekly shop; it provides a market for farmers etc 3 @ 1 mark (3) (ii) Candidates need to describe and suggest reasons for the differences in the spheres of influence. Ideally answers should be comparative but be prepared to link statements from discrete accounts. MAXIMUM 3 for each of description/explanation. Ideas such as: King’s Lynn has a larger sphere of influence; as the population of King’s Lynn is large; it will have high order services; Holbeach has a regular shaped sphere of influence; King’s Lynn’s position close to the coast affects shape; impact of competing market towns etc 5 @ 1 mark or development (5)
Mark scheme, page 6
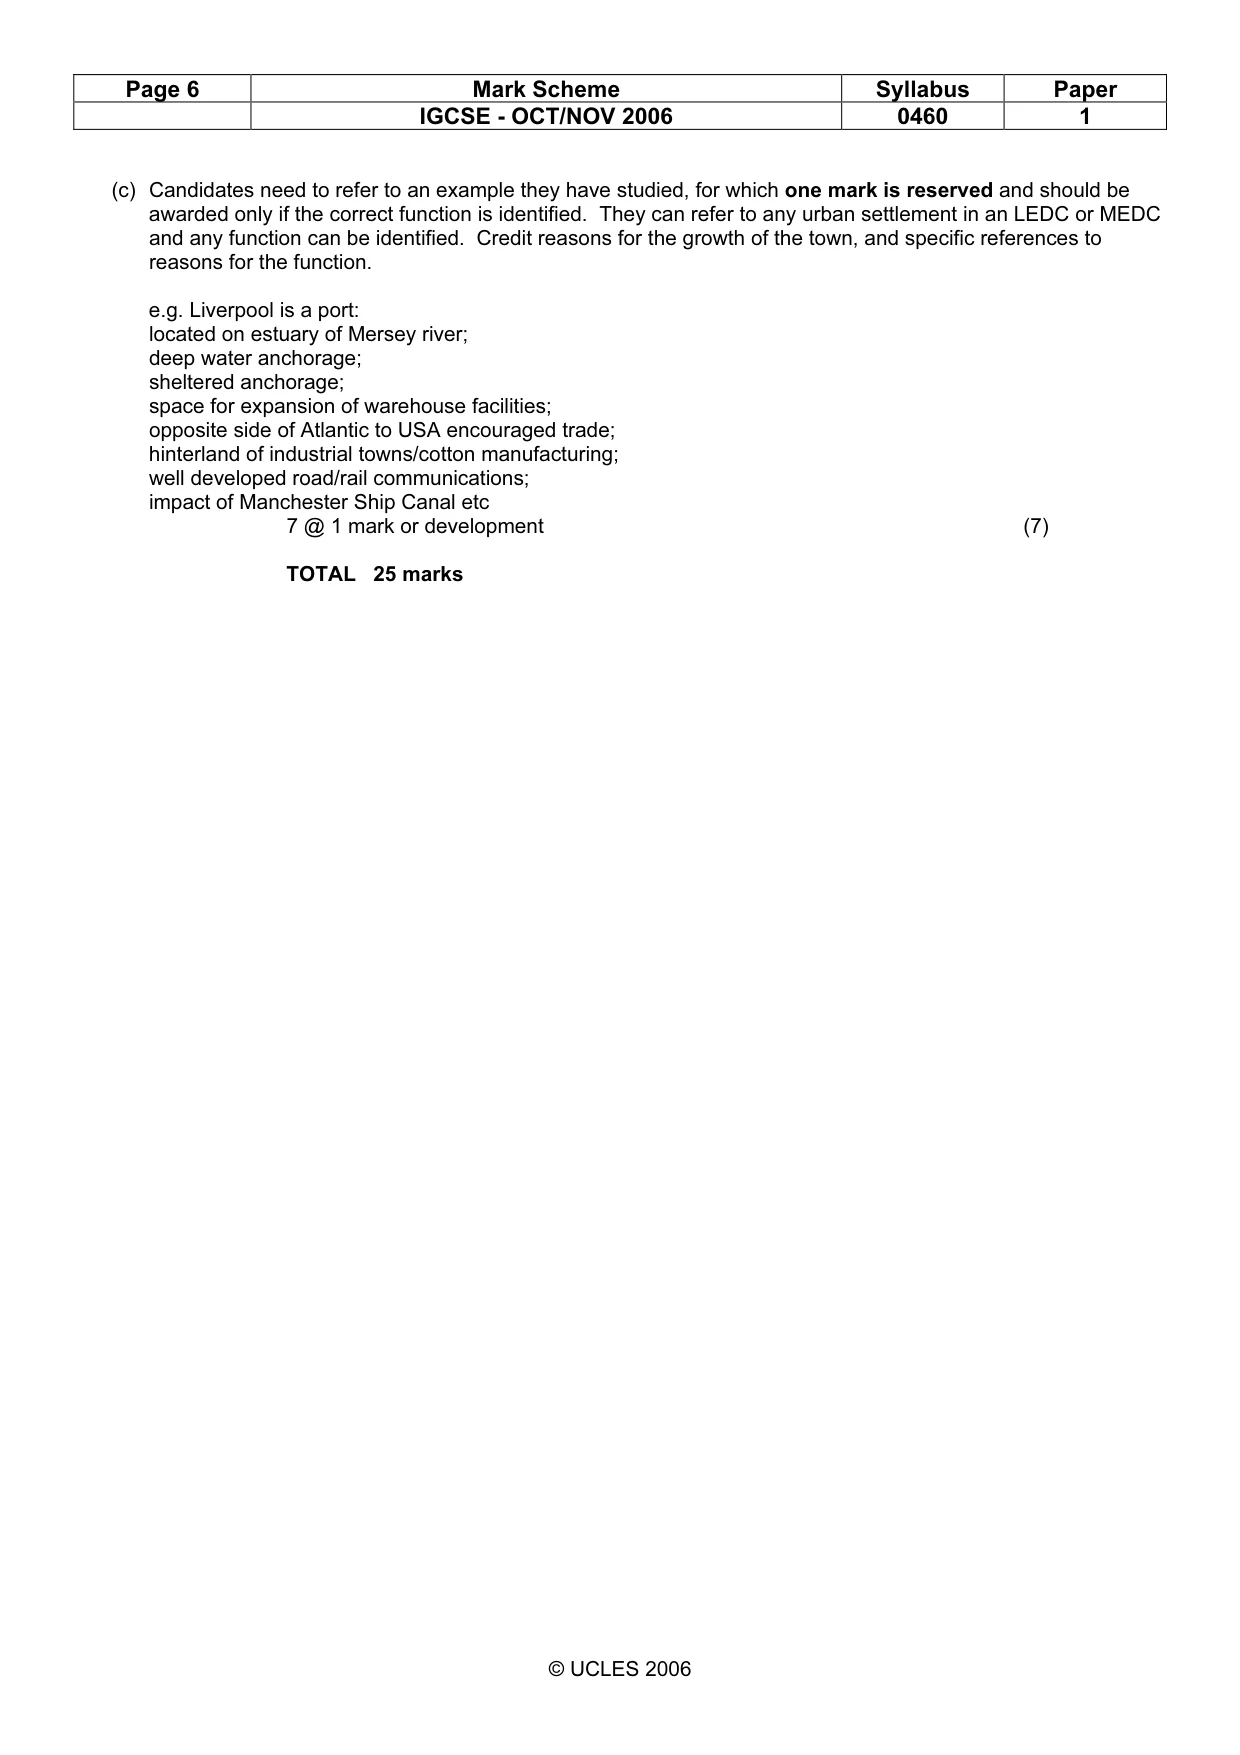
Page 6 Mark Scheme Syllabus Paper IGCSE - OCT/NOV 2006 0460 1 © UCLES 2006 (c) Candidates need to refer to an example they have studied, for which one mark is reserved and should be awarded only if the correct function is identified. They can refer to any urban settlement in an LEDC or MEDC and any function can be identified. Credit reasons for the growth of the town, and specific references to reasons for the function. e.g. Liverpool is a port: located on estuary of Mersey river; deep water anchorage; sheltered anchorage; space for expansion of warehouse facilities; opposite side of Atlantic to USA encouraged trade; hinterland of industrial towns/cotton manufacturing; well developed road/rail communications; impact of Manchester Ship Canal etc 7 @ 1 mark or development (7) TOTAL 25 marks
Mark scheme, page 7
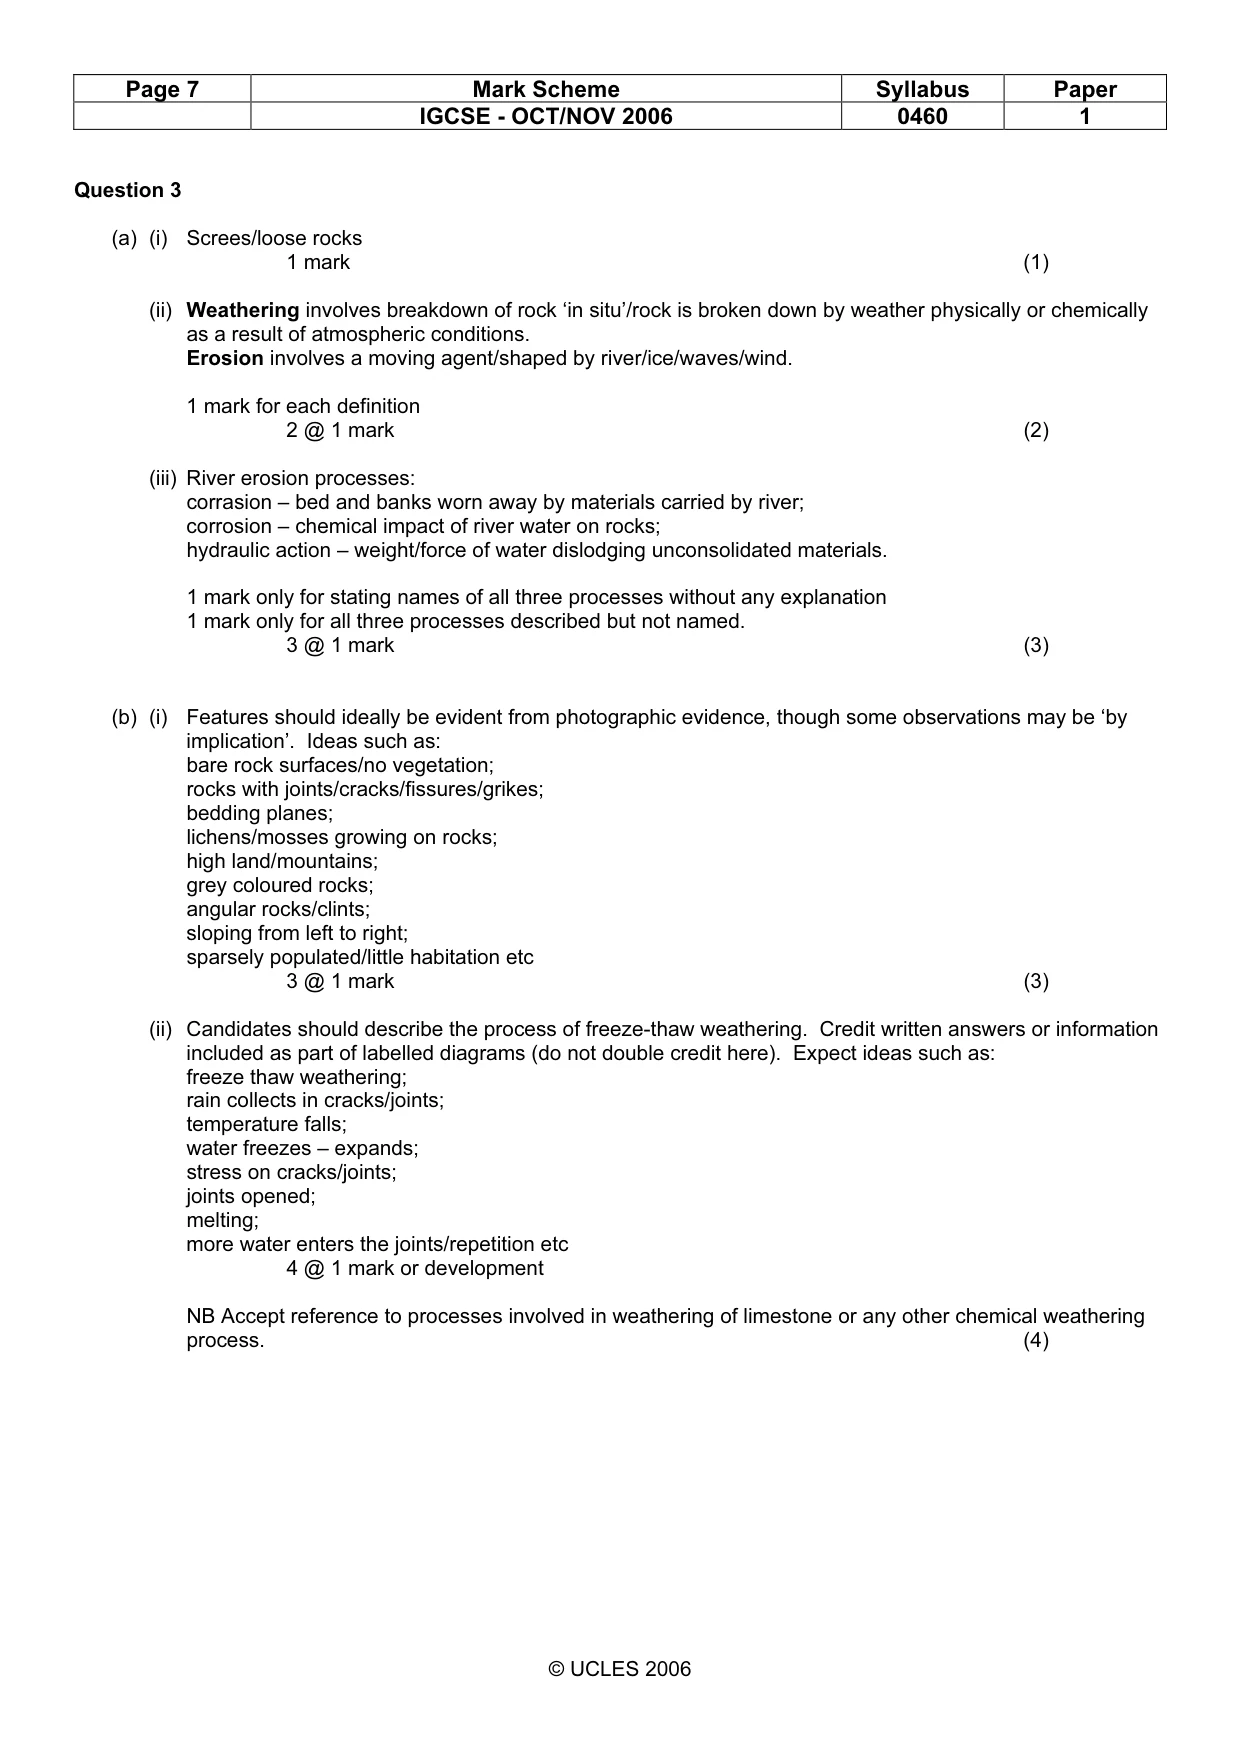
Page 7 Mark Scheme Syllabus Paper IGCSE - OCT/NOV 2006 0460 1 © UCLES 2006 Question 3 (a) (i) Screes/loose rocks 1 mark (1) (ii) Weathering involves breakdown of rock ‘in situ’/rock is broken down by weather physically or chemically as a result of atmospheric conditions. Erosion involves a moving agent/shaped by river/ice/waves/wind. 1 mark for each definition 2 @ 1 mark (2) (iii) River erosion processes: corrasion – bed and banks worn away by materials carried by river; corrosion – chemical impact of river water on rocks; hydraulic action – weight/force of water dislodging unconsolidated materials. 1 mark only for stating names of all three processes without any explanation 1 mark only for all three processes described but not named. 3 @ 1 mark (3) (b) (i) Features should ideally be evident from photographic evidence, though some observations may be ‘by implication’. Ideas such as: bare rock surfaces/no vegetation; rocks with joints/cracks/fissures/grikes; bedding planes; lichens/mosses growing on rocks; high land/mountains; grey coloured rocks; angular rocks/clints; sloping from left to right; sparsely populated/little habitation etc 3 @ 1 mark (3) (ii) Candidates should describe the process of freeze-thaw weathering. Credit written answers or information included as part of labelled diagrams (do not double credit here). Expect ideas such as: freeze thaw weathering; rain collects in cracks/joints; temperature falls; water freezes – expands; stress on cracks/joints; joints opened; melting; more water enters the joints/repetition etc 4 @ 1 mark or development NB Accept reference to processes involved in weathering of limestone or any other chemical weathering process. (4)
Mark scheme, page 8
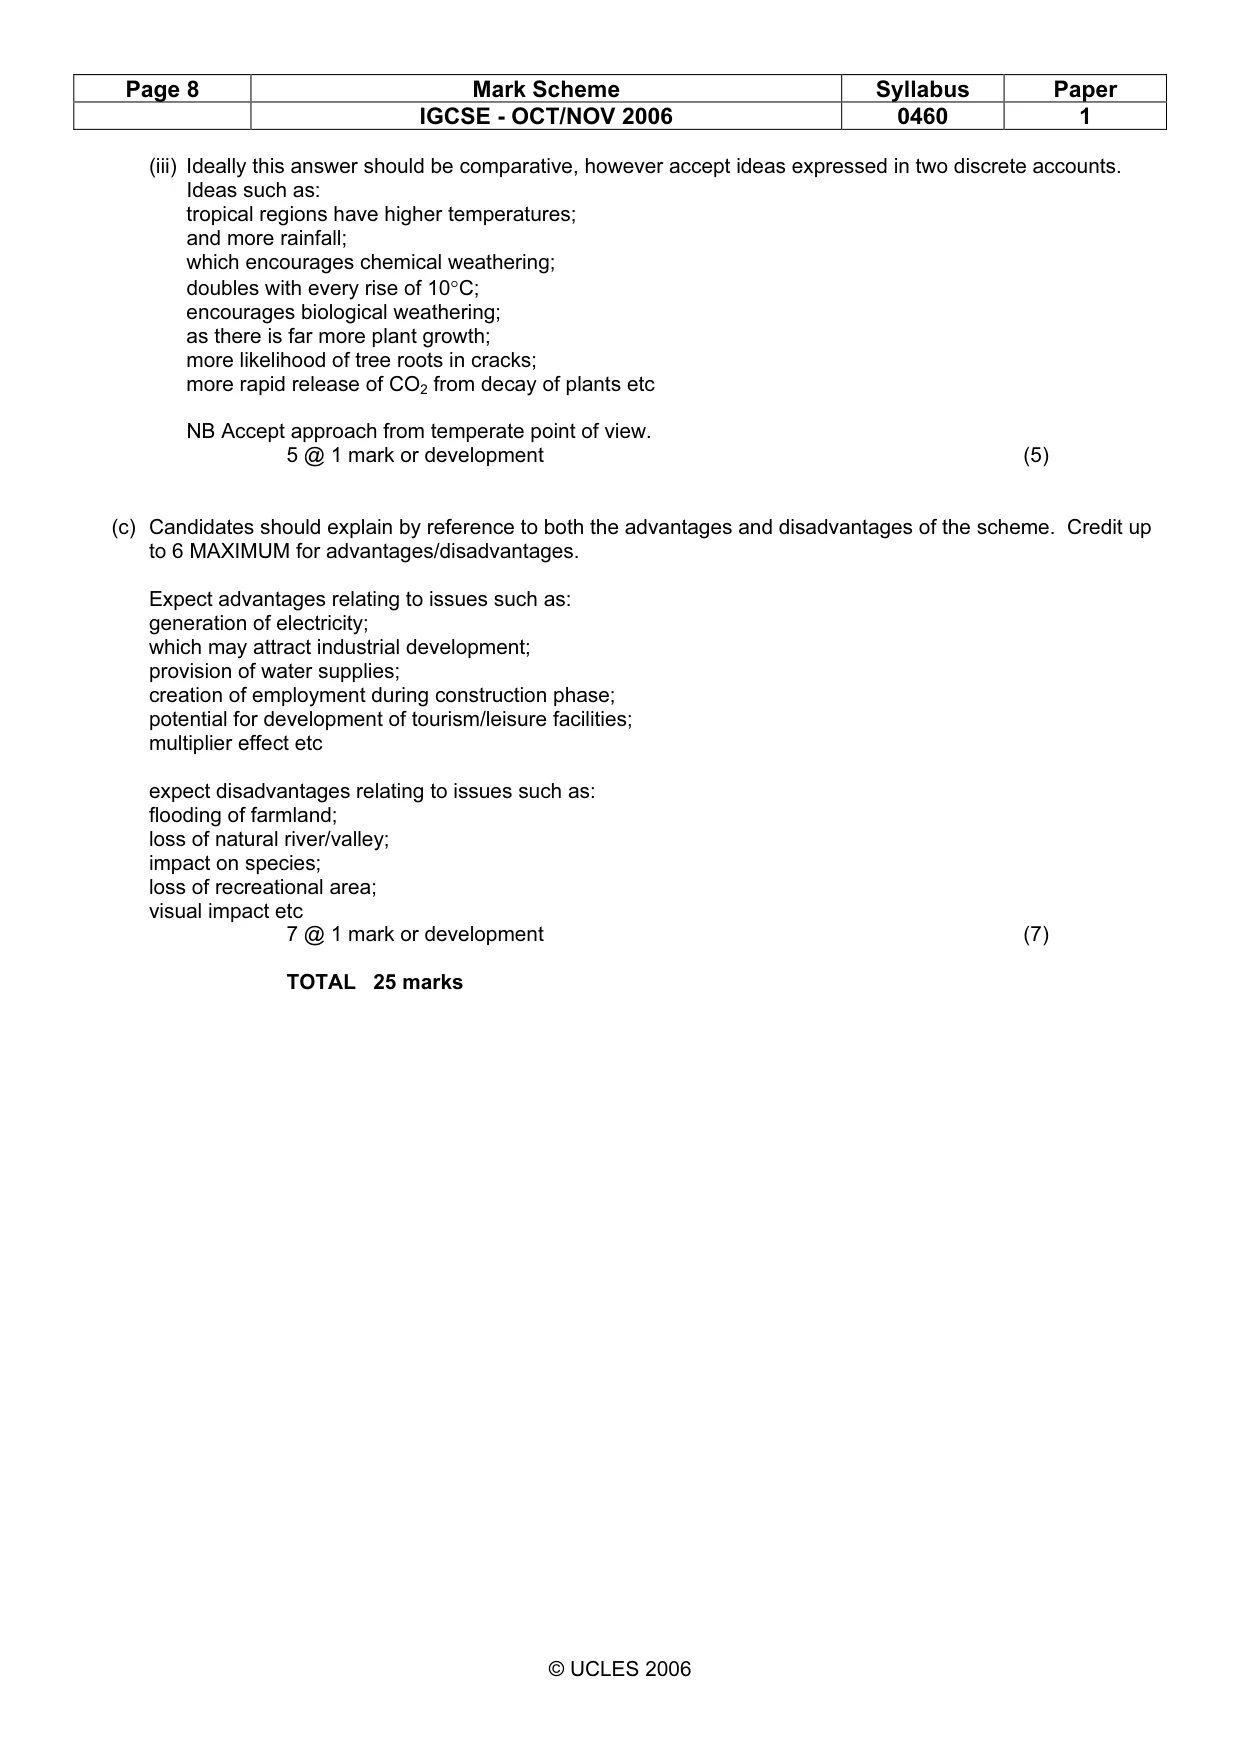
Page 8 Mark Scheme Syllabus Paper IGCSE - OCT/NOV 2006 0460 1 © UCLES 2006 (iii) Ideally this answer should be comparative, however accept ideas expressed in two discrete accounts. Ideas such as: tropical regions have higher temperatures; and more rainfall; which encourages chemical weathering; doubles with every rise of 10°C; encourages biological weathering; as there is far more plant growth; more likelihood of tree roots in cracks; more rapid release of CO2 from decay of plants etc NB Accept approach from temperate point of view. 5 @ 1 mark or development (5) (c) Candidates should explain by reference to both the advantages and disadvantages of the scheme. Credit up to 6 MAXIMUM for advantages/disadvantages. Expect advantages relating to issues such as: generation of electricity; which may attract industrial development; provision of water supplies; creation of employment during construction phase; potential for development of tourism/leisure facilities; multiplier effect etc expect disadvantages relating to issues such as: flooding of farmland; loss of natural river/valley; impact on species; loss of recreational area; visual impact etc 7 @ 1 mark or development (7) TOTAL 25 marks
Mark scheme, page 9
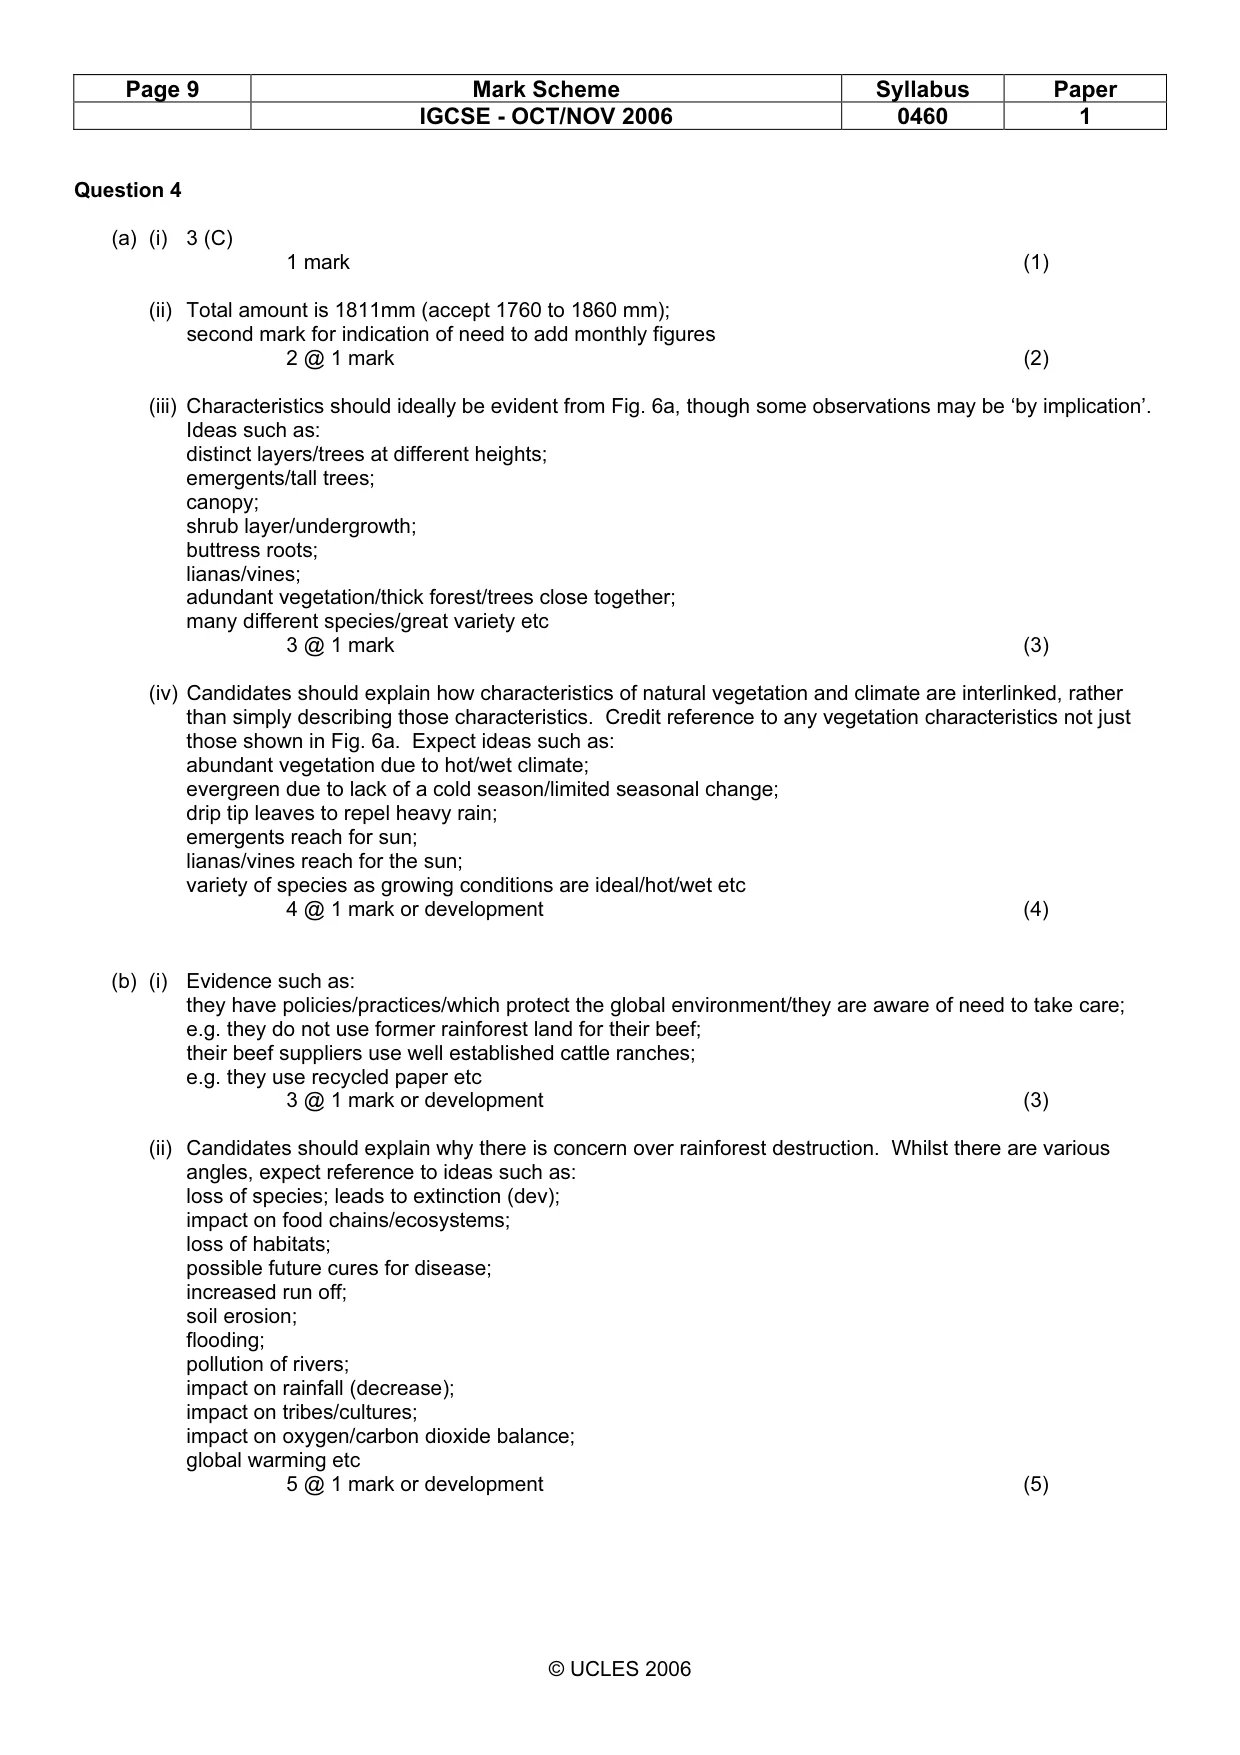
Page 9 Mark Scheme Syllabus Paper IGCSE - OCT/NOV 2006 0460 1 © UCLES 2006 Question 4 (a) (i) 3 (C) 1 mark (1) (ii) Total amount is 1811mm (accept 1760 to 1860 mm); second mark for indication of need to add monthly figures 2 @ 1 mark (2) (iii) Characteristics should ideally be evident from Fig. 6a, though some observations may be ‘by implication’. Ideas such as: distinct layers/trees at different heights; emergents/tall trees; canopy; shrub layer/undergrowth; buttress roots; lianas/vines; adundant vegetation/thick forest/trees close together; many different species/great variety etc 3 @ 1 mark (3) (iv) Candidates should explain how characteristics of natural vegetation and climate are interlinked, rather than simply describing those characteristics. Credit reference to any vegetation characteristics not just those shown in Fig. 6a. Expect ideas such as: abundant vegetation due to hot/wet climate; evergreen due to lack of a cold season/limited seasonal change; drip tip leaves to repel heavy rain; emergents reach for sun; lianas/vines reach for the sun; variety of species as growing conditions are ideal/hot/wet etc 4 @ 1 mark or development (4) (b) (i) Evidence such as: they have policies/practices/which protect the global environment/they are aware of need to take care; e.g. they do not use former rainforest land for their beef; their beef suppliers use well established cattle ranches; e.g. they use recycled paper etc 3 @ 1 mark or development (3) (ii) Candidates should explain why there is concern over rainforest destruction. Whilst there are various angles, expect reference to ideas such as: loss of species; leads to extinction (dev); impact on food chains/ecosystems; loss of habitats; possible future cures for disease; increased run off; soil erosion; flooding; pollution of rivers; impact on rainfall (decrease); impact on tribes/cultures; impact on oxygen/carbon dioxide balance; global warming etc 5 @ 1 mark or development (5)
Mark scheme, page 10
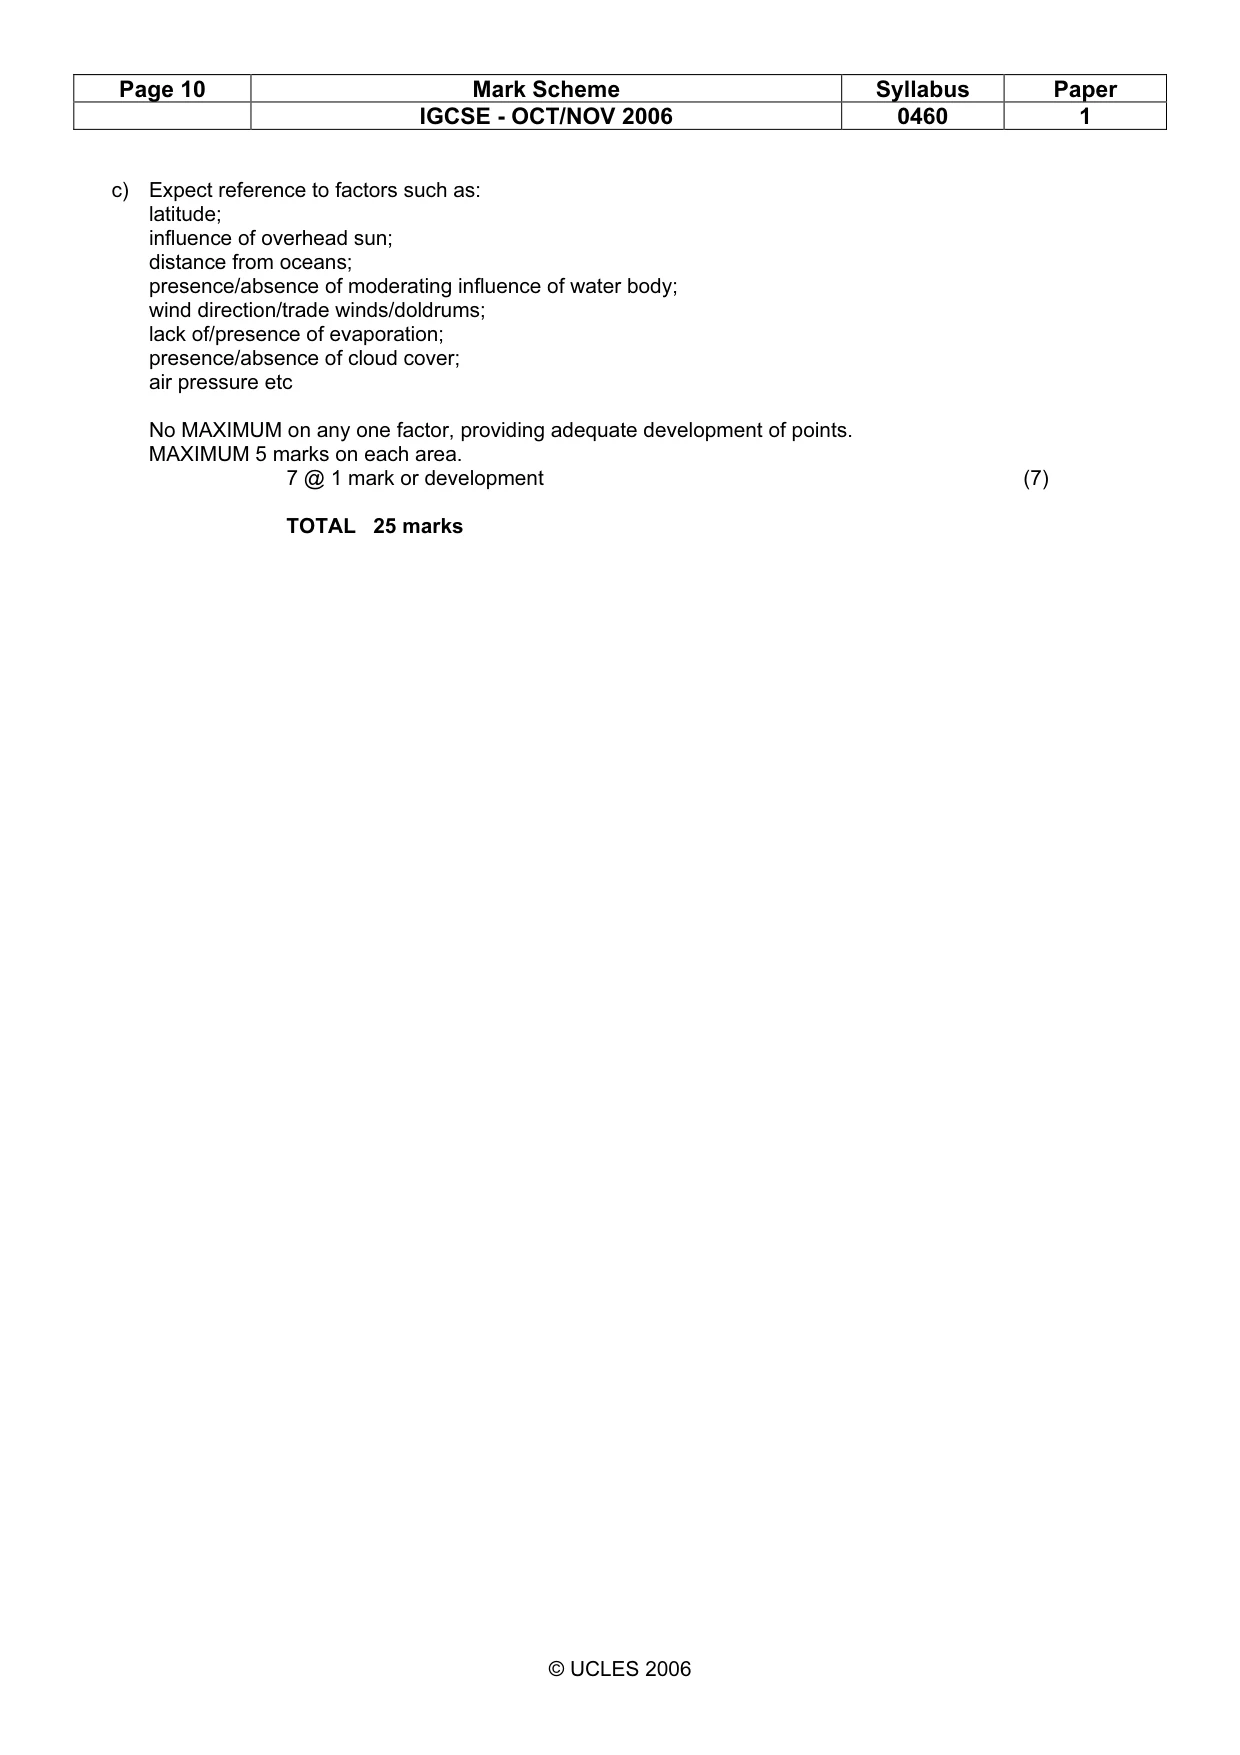
Page 10 Mark Scheme Syllabus Paper IGCSE - OCT/NOV 2006 0460 1 © UCLES 2006 c) Expect reference to factors such as: latitude; influence of overhead sun; distance from oceans; presence/absence of moderating influence of water body; wind direction/trade winds/doldrums; lack of/presence of evaporation; presence/absence of cloud cover; air pressure etc No MAXIMUM on any one factor, providing adequate development of points. MAXIMUM 5 marks on each area. 7 @ 1 mark or development (7) TOTAL 25 marks
Mark scheme, page 11
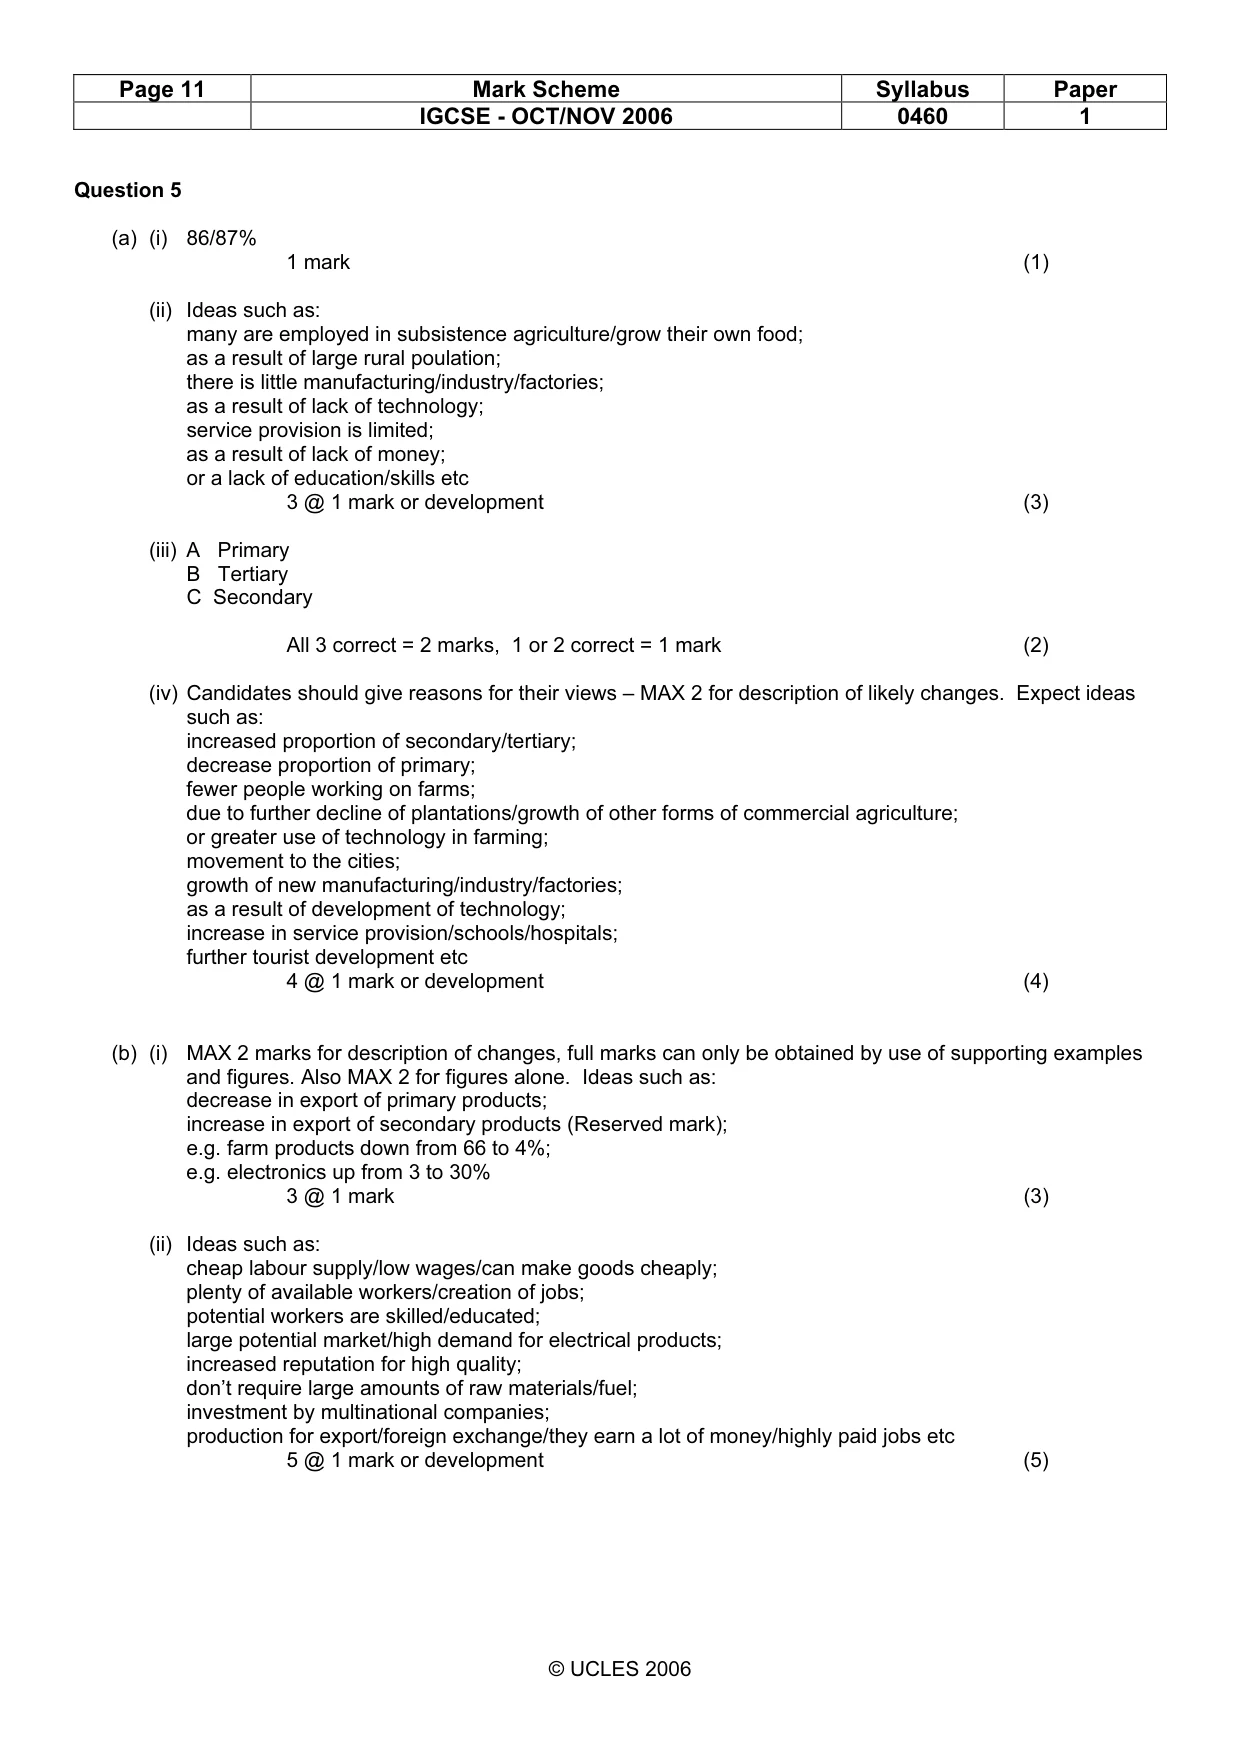
Page 11 Mark Scheme Syllabus Paper IGCSE - OCT/NOV 2006 0460 1 © UCLES 2006 Question 5 (a) (i) 86/87% 1 mark (1) (ii) Ideas such as: many are employed in subsistence agriculture/grow their own food; as a result of large rural poulation; there is little manufacturing/industry/factories; as a result of lack of technology; service provision is limited; as a result of lack of money; or a lack of education/skills etc 3 @ 1 mark or development (3) (iii) A Primary B Tertiary C Secondary All 3 correct = 2 marks, 1 or 2 correct = 1 mark (2) (iv) Candidates should give reasons for their views – MAX 2 for description of likely changes. Expect ideas such as: increased proportion of secondary/tertiary; decrease proportion of primary; fewer people working on farms; due to further decline of plantations/growth of other forms of commercial agriculture; or greater use of technology in farming; movement to the cities; growth of new manufacturing/industry/factories; as a result of development of technology; increase in service provision/schools/hospitals; further tourist development etc 4 @ 1 mark or development (4) (b) (i) MAX 2 marks for description of changes, full marks can only be obtained by use of supporting examples and figures. Also MAX 2 for figures alone. Ideas such as: decrease in export of primary products; increase in export of secondary products (Reserved mark); e.g. farm products down from 66 to 4%; e.g. electronics up from 3 to 30% 3 @ 1 mark (3) (ii) Ideas such as: cheap labour supply/low wages/can make goods cheaply; plenty of available workers/creation of jobs; potential workers are skilled/educated; large potential market/high demand for electrical products; increased reputation for high quality; don’t require large amounts of raw materials/fuel; investment by multinational companies; production for export/foreign exchange/they earn a lot of money/highly paid jobs etc 5 @ 1 mark or development (5)
Mark scheme, page 12
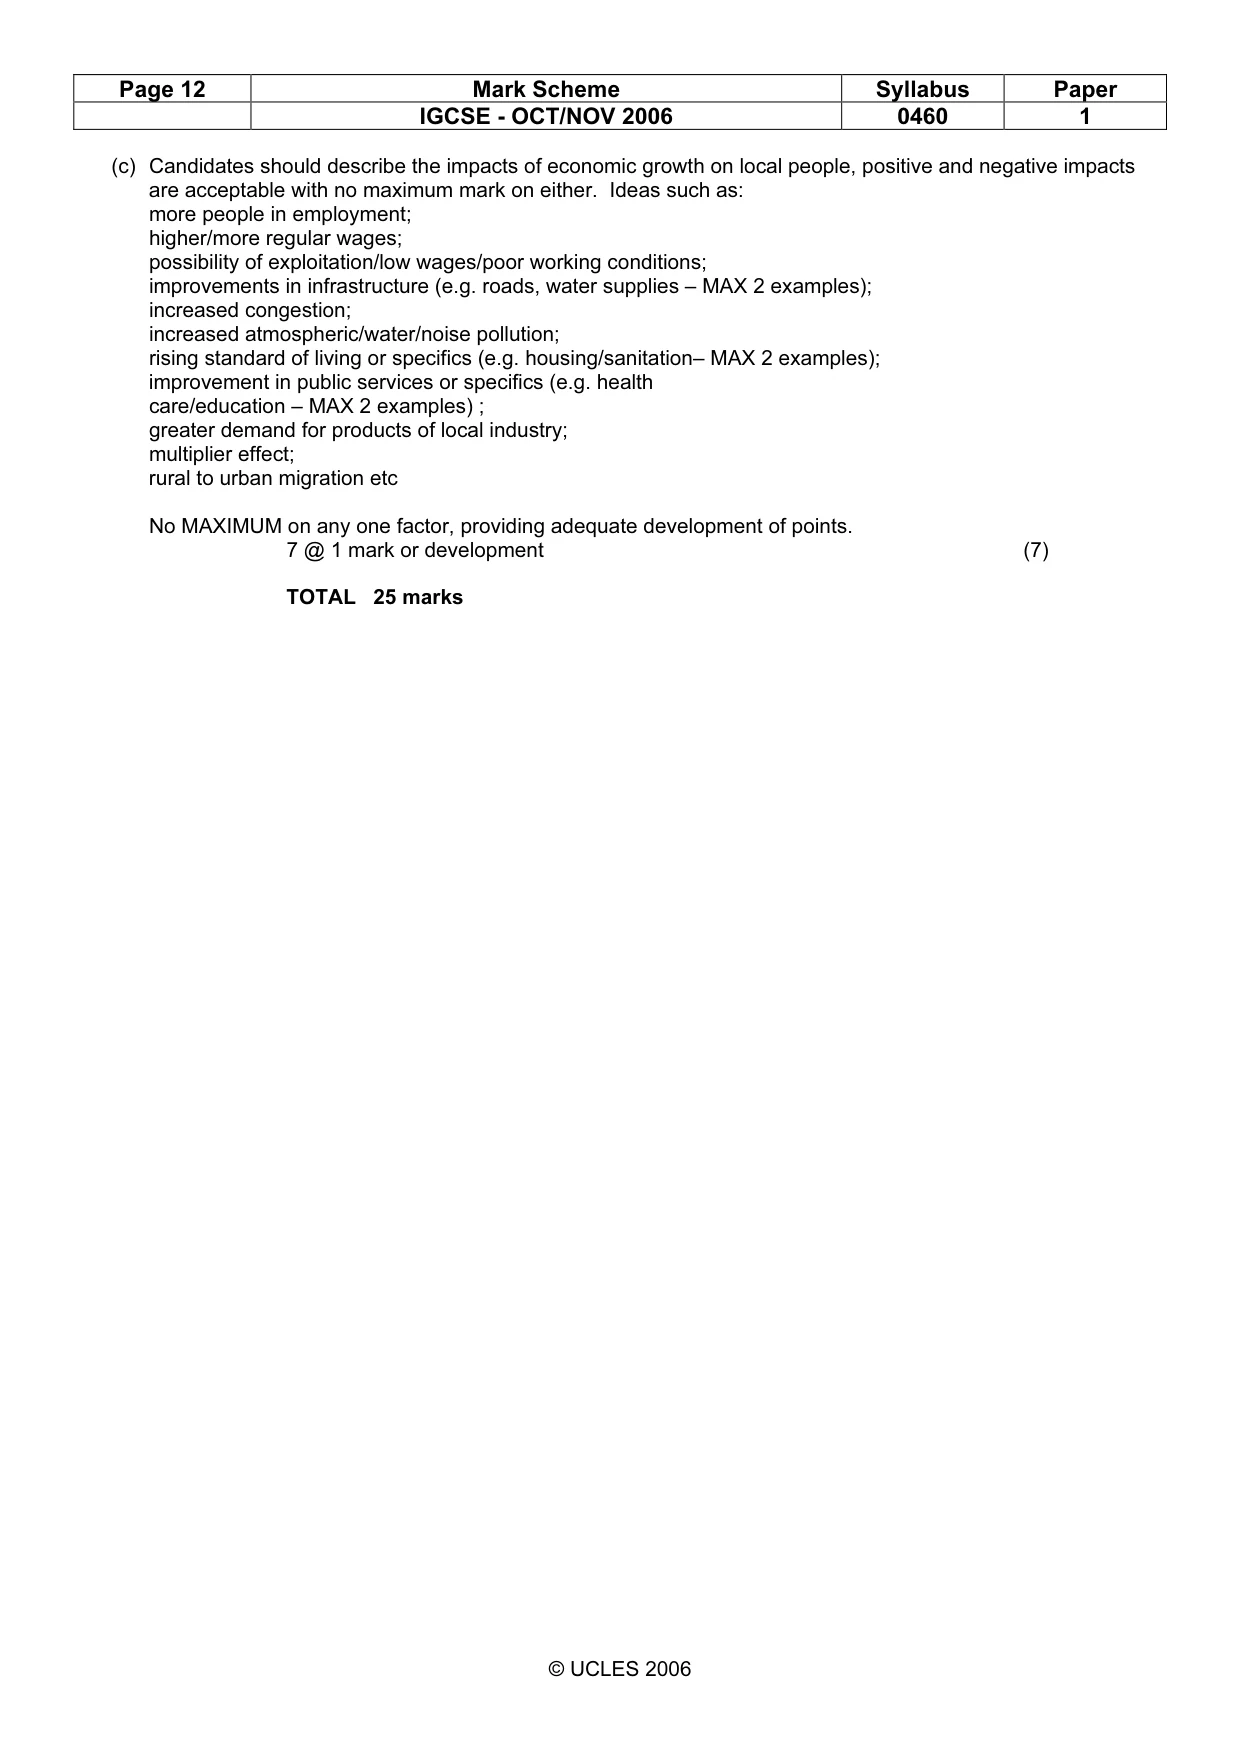
Page 12 Mark Scheme Syllabus Paper IGCSE - OCT/NOV 2006 0460 1 © UCLES 2006 (c) Candidates should describe the impacts of economic growth on local people, positive and negative impacts are acceptable with no maximum mark on either. Ideas such as: more people in employment; higher/more regular wages; possibility of exploitation/low wages/poor working conditions; improvements in infrastructure (e.g. roads, water supplies – MAX 2 examples); increased congestion; increased atmospheric/water/noise pollution; rising standard of living or specifics (e.g. housing/sanitation– MAX 2 examples); improvement in public services or specifics (e.g. health care/education – MAX 2 examples) ; greater demand for products of local industry; multiplier effect; rural to urban migration etc No MAXIMUM on any one factor, providing adequate development of points. 7 @ 1 mark or development (7) TOTAL 25 marks
Mark scheme, page 13
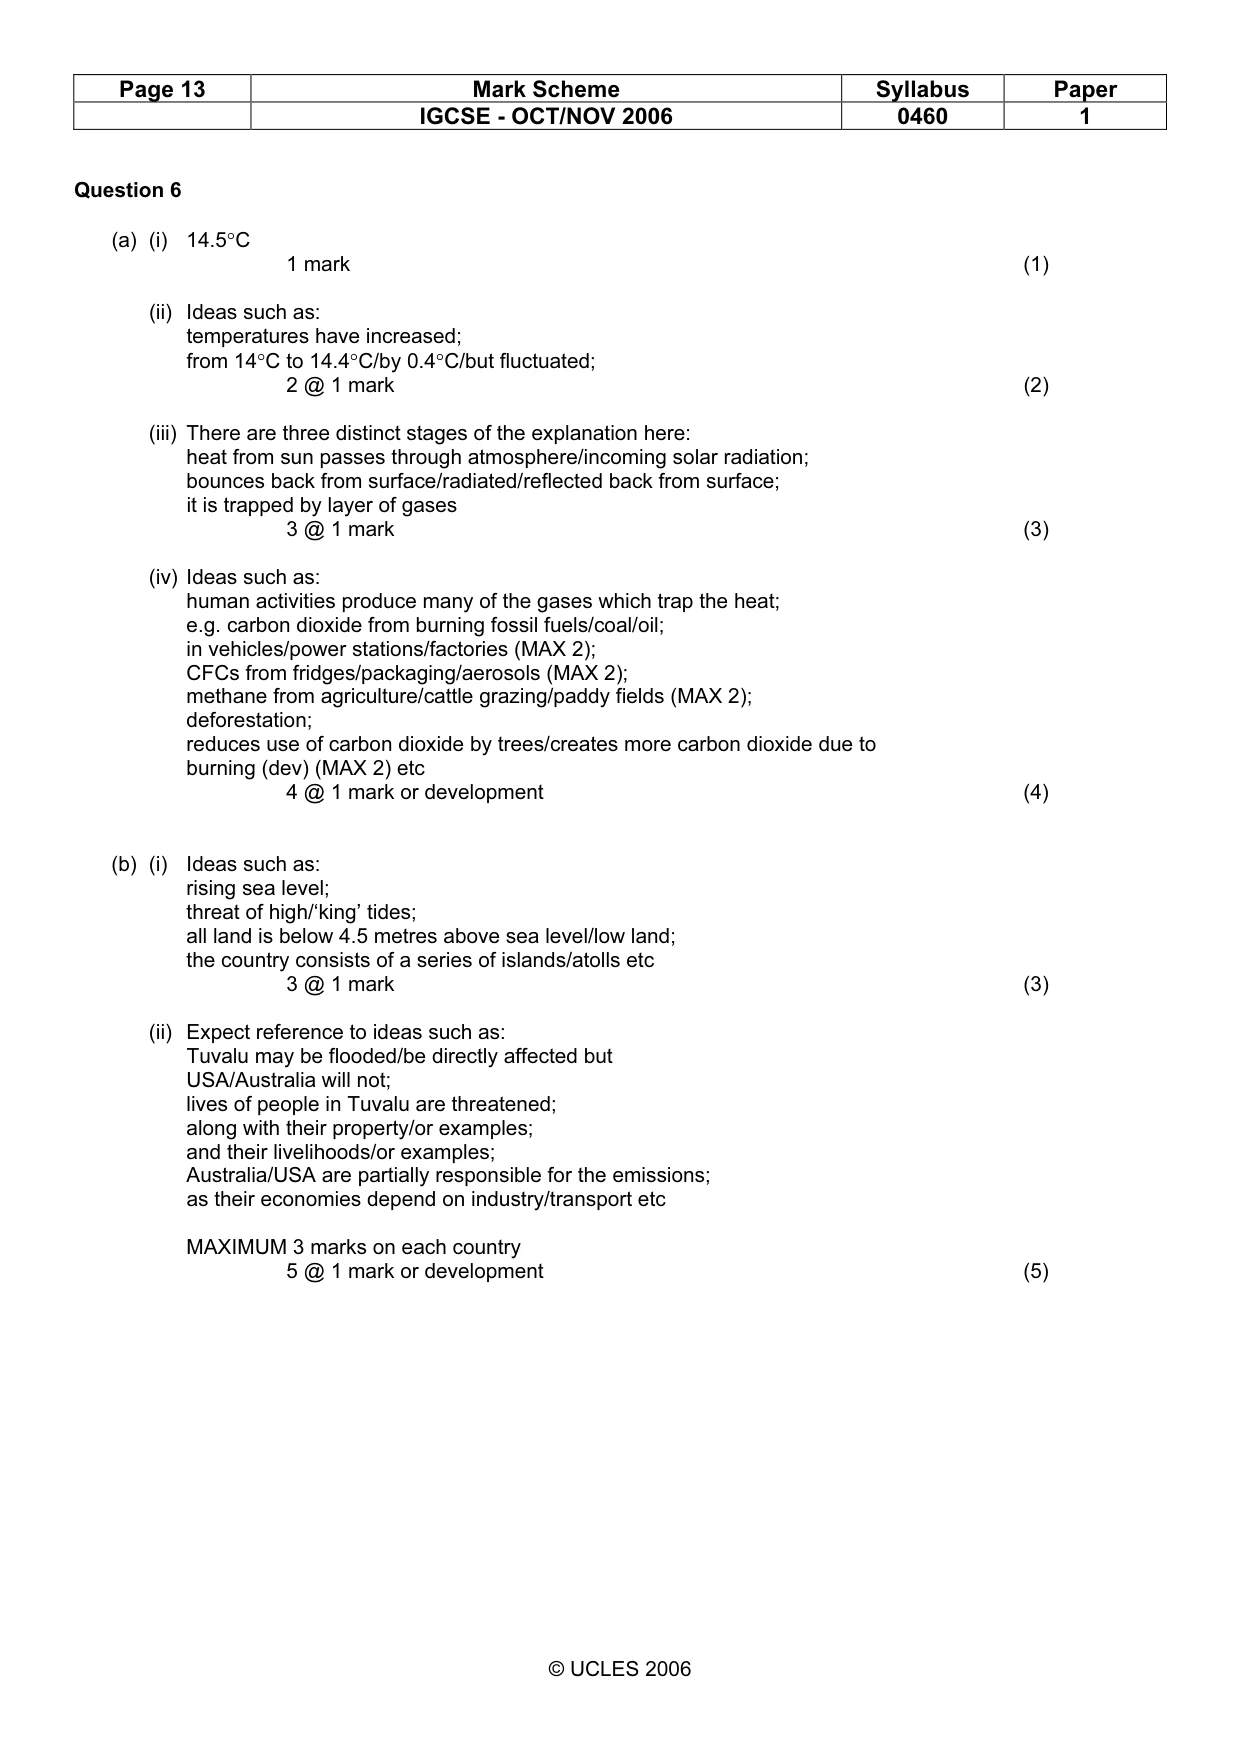
Page 13 Mark Scheme Syllabus Paper IGCSE - OCT/NOV 2006 0460 1 © UCLES 2006 Question 6 (a) (i) 14.5°C 1 mark (1) (ii) Ideas such as: temperatures have increased; from 14°C to 14.4°C/by 0.4°C/but fluctuated; 2 @ 1 mark (2) (iii) There are three distinct stages of the explanation here: heat from sun passes through atmosphere/incoming solar radiation; bounces back from surface/radiated/reflected back from surface; it is trapped by layer of gases 3 @ 1 mark (3) (iv) Ideas such as: human activities produce many of the gases which trap the heat; e.g. carbon dioxide from burning fossil fuels/coal/oil; in vehicles/power stations/factories (MAX 2); CFCs from fridges/packaging/aerosols (MAX 2); methane from agriculture/cattle grazing/paddy fields (MAX 2); deforestation; reduces use of carbon dioxide by trees/creates more carbon dioxide due to burning (dev) (MAX 2) etc 4 @ 1 mark or development (4) (b) (i) Ideas such as: rising sea level; threat of high/‘king’ tides; all land is below 4.5 metres above sea level/low land; the country consists of a series of islands/atolls etc 3 @ 1 mark (3) (ii) Expect reference to ideas such as: Tuvalu may be flooded/be directly affected but USA/Australia will not; lives of people in Tuvalu are threatened; along with their property/or examples; and their livelihoods/or examples; Australia/USA are partially responsible for the emissions; as their economies depend on industry/transport etc MAXIMUM 3 marks on each country 5 @ 1 mark or development (5)
Mark scheme, page 14
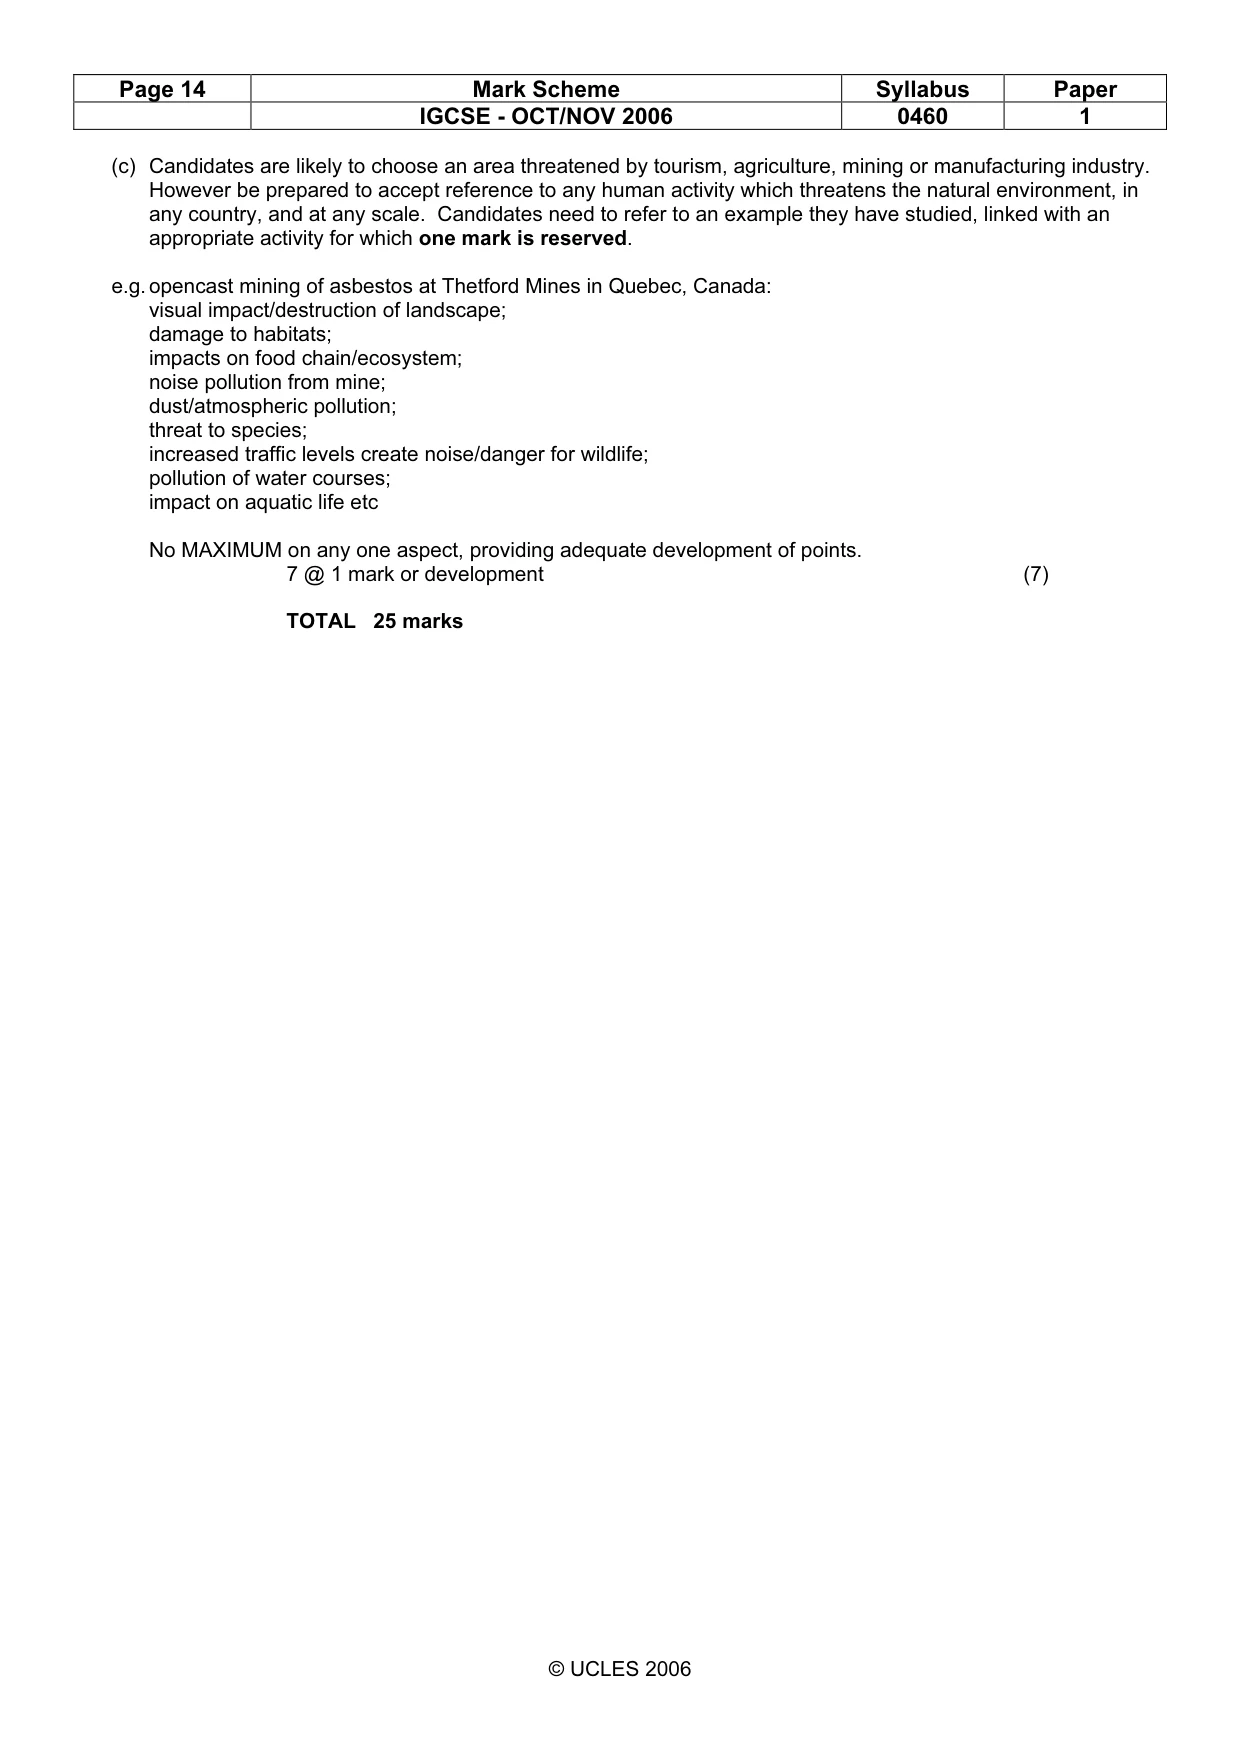
Page 14 Mark Scheme Syllabus Paper IGCSE - OCT/NOV 2006 0460 1 © UCLES 2006 (c) Candidates are likely to choose an area threatened by tourism, agriculture, mining or manufacturing industry. However be prepared to accept reference to any human activity which threatens the natural environment, in any country, and at any scale. Candidates need to refer to an example they have studied, linked with an appropriate activity for which one mark is reserved. e.g. opencast mining of asbestos at Thetford Mines in Quebec, Canada: visual impact/destruction of landscape; damage to habitats; impacts on food chain/ecosystem; noise pollution from mine; dust/atmospheric pollution; threat to species; increased traffic levels create noise/danger for wildlife; pollution of water courses; impact on aquatic life etc No MAXIMUM on any one aspect, providing adequate development of points. 7 @ 1 mark or development (7) TOTAL 25 marks
What you needed in this session
Cambridge’s own grade thresholds for 2006 Oct/Nov, Paper 1 · Variant 1. A higher threshold means an easier paper — the bar moves with how the cohort did.