Cambridge IGCSE Geography 0460 — 2004 Oct/Nov Paper 1 · Variant 1
0460/11/O/N/04
The question paper and its mark scheme, free to read here and free to download. This is Cambridge’s own paper, exactly as it was sat.
Question paper16 pages



Mark scheme16 pages
Answers below. Sit the paper first if you are practising.
Paper as text
Question paper, page 1
This document consists of 12 printed pages, 4 blank pages and an insert. SP (DR) S57833/3 © UCLES 2004 [Turn over UNIVERSITY OF CAMBRIDGE INTERNATIONAL EXAMINATIONS International General Certificate of Secondary Education GEOGRAPHY 0460/01 Paper 1 October/November 2004 1 hour 45 minutes Additional Materials: Answer Booklet/Paper READ THESE INSTRUCTIONS FIRST If you have been given an Answer Booklet, follow the instructions on the front cover of the Booklet. Write your Centre number, candidate number and name on all the work you hand in. Write in dark blue or black pen on both sides of the paper. You may use a soft pencil for any diagrams, graphs or rough working. Do not use staples, paper clips, highlighters, glue or correction fluid. Answer three questions. At the end of the examination, fasten all your work securely together. The number of marks is given in brackets [ ] at the end of each question or part question. Sketch maps and diagrams should be drawn whenever they serve to illustrate an answer. The insert contains Photograph A for Question 3 and Fig. 6 for Question 4. 2396 www.XtremePapers.com
Question paper, page 2
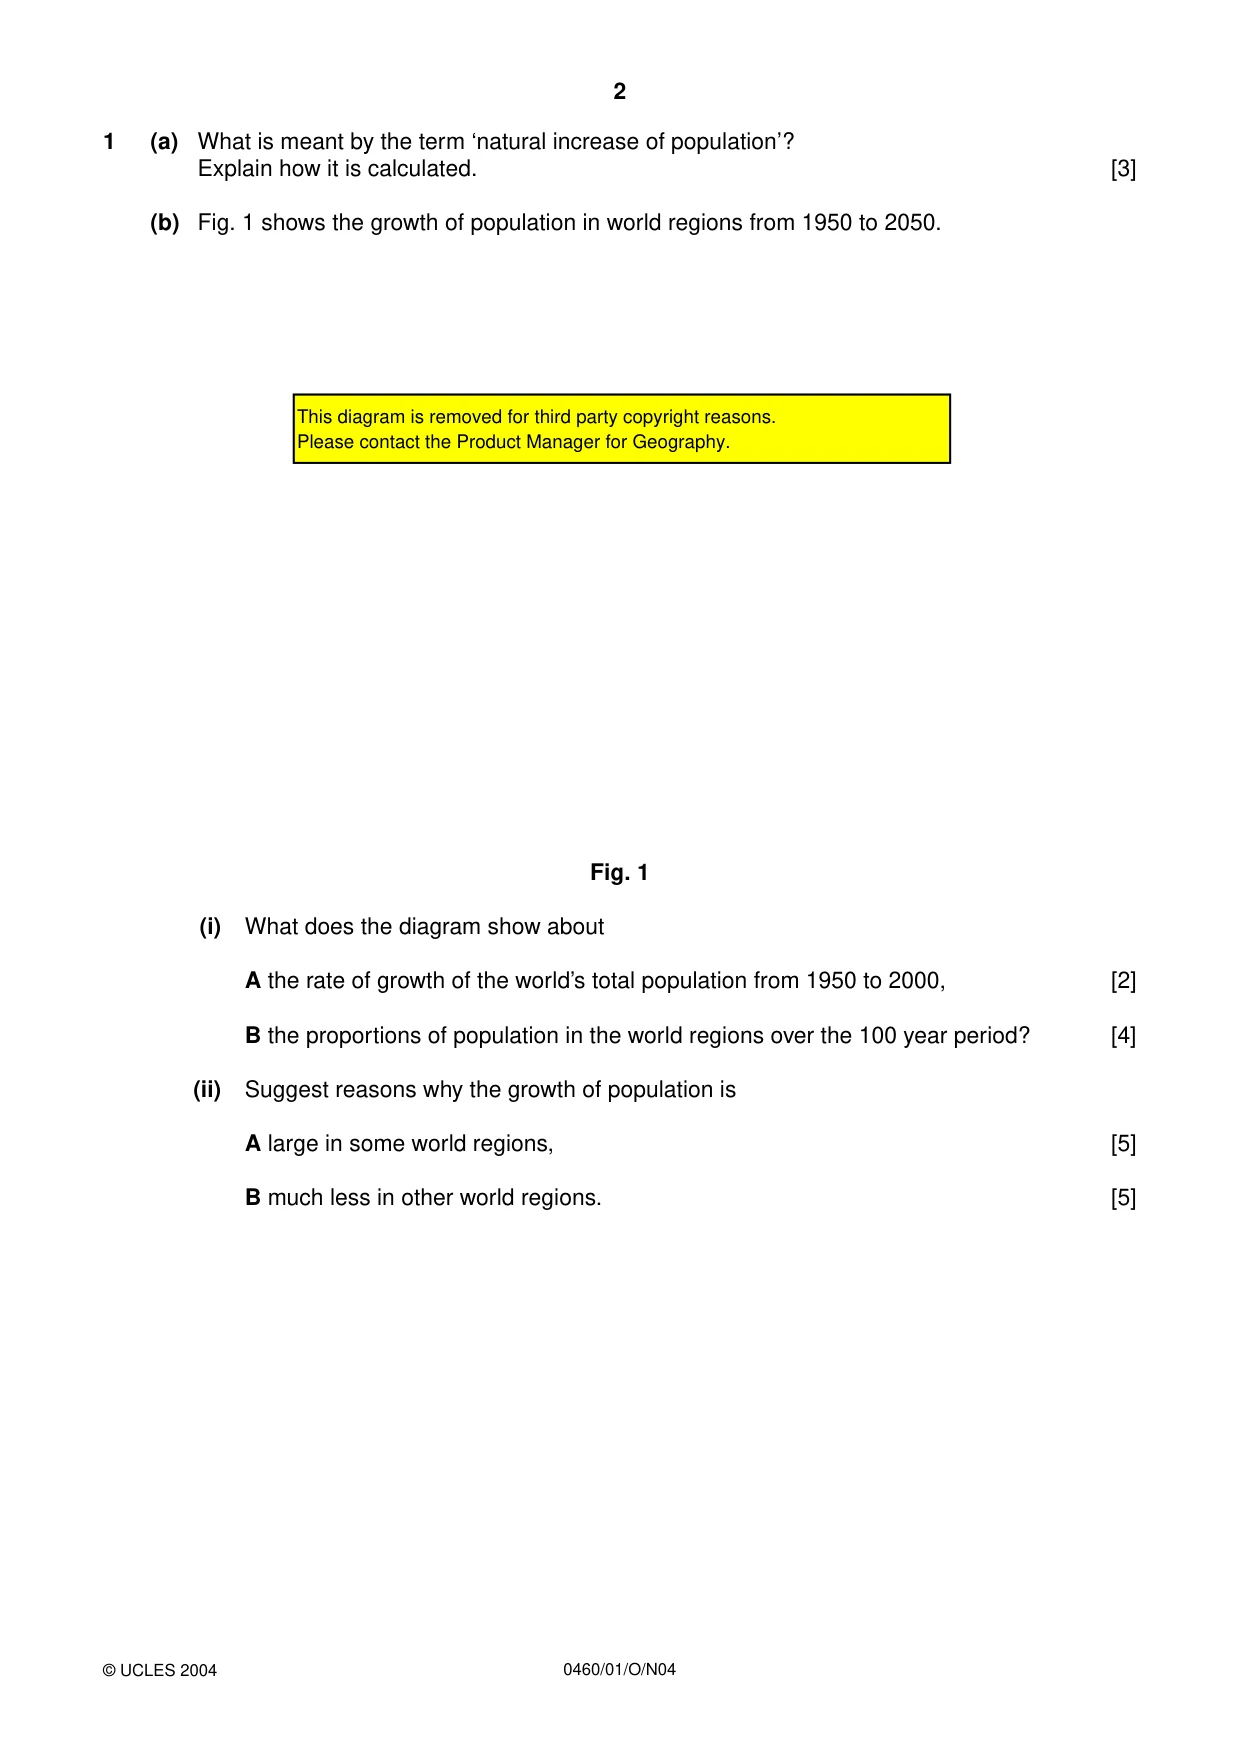
2 0460/01/O/N04 1 (a) What is meant by the term ‘natural increase of population’? Explain how it is calculated. [3] (b) Fig. 1 shows the growth of population in world regions from 1950 to 2050. Fig. 1 (i) What does the diagram show about A the rate of growth of the world’s total population from 1950 to 2000, [2] B the proportions of population in the world regions over the 100 year period? [4] (ii) Suggest reasons why the growth of population is A large in some world regions, [5] B much less in other world regions. [5] © UCLES 2004 This diagram is removed for third party copyright reasons. Please contact the Product Manager for Geography.
Question paper, page 3
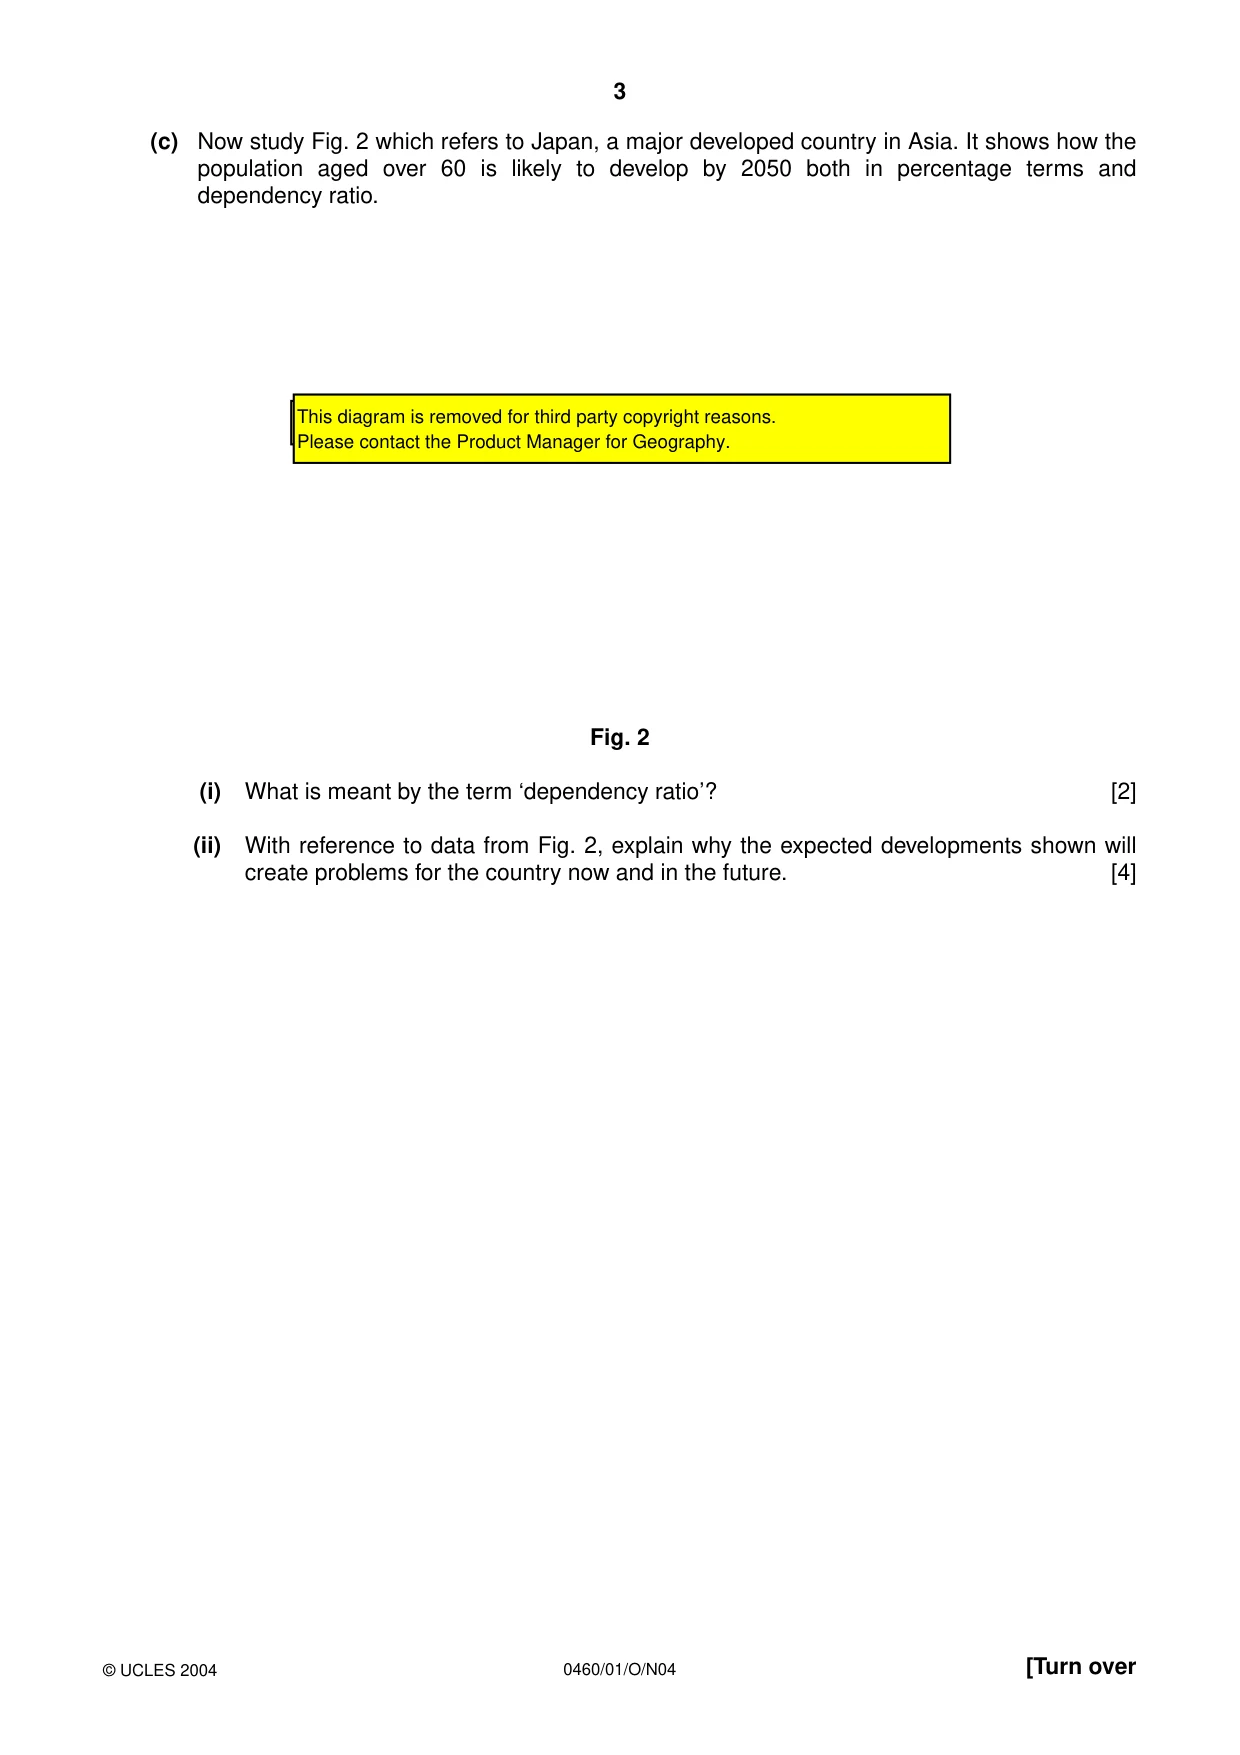
3 0460/01/O/N04 [Turn over (c) Now study Fig. 2 which refers to Japan, a major developed country in Asia. It shows how the population aged over 60 is likely to develop by 2050 both in percentage terms and dependency ratio. Fig. 2 (i) What is meant by the term ‘dependency ratio’? [2] (ii) With reference to data from Fig. 2, explain why the expected developments shown will create problems for the country now and in the future. [4] © UCLES 2004 This diagram is removed for third party copyright reasons This diagram is removed for third party copyright reasons. Please contact the Product Manager for Geography.
Question paper, page 4
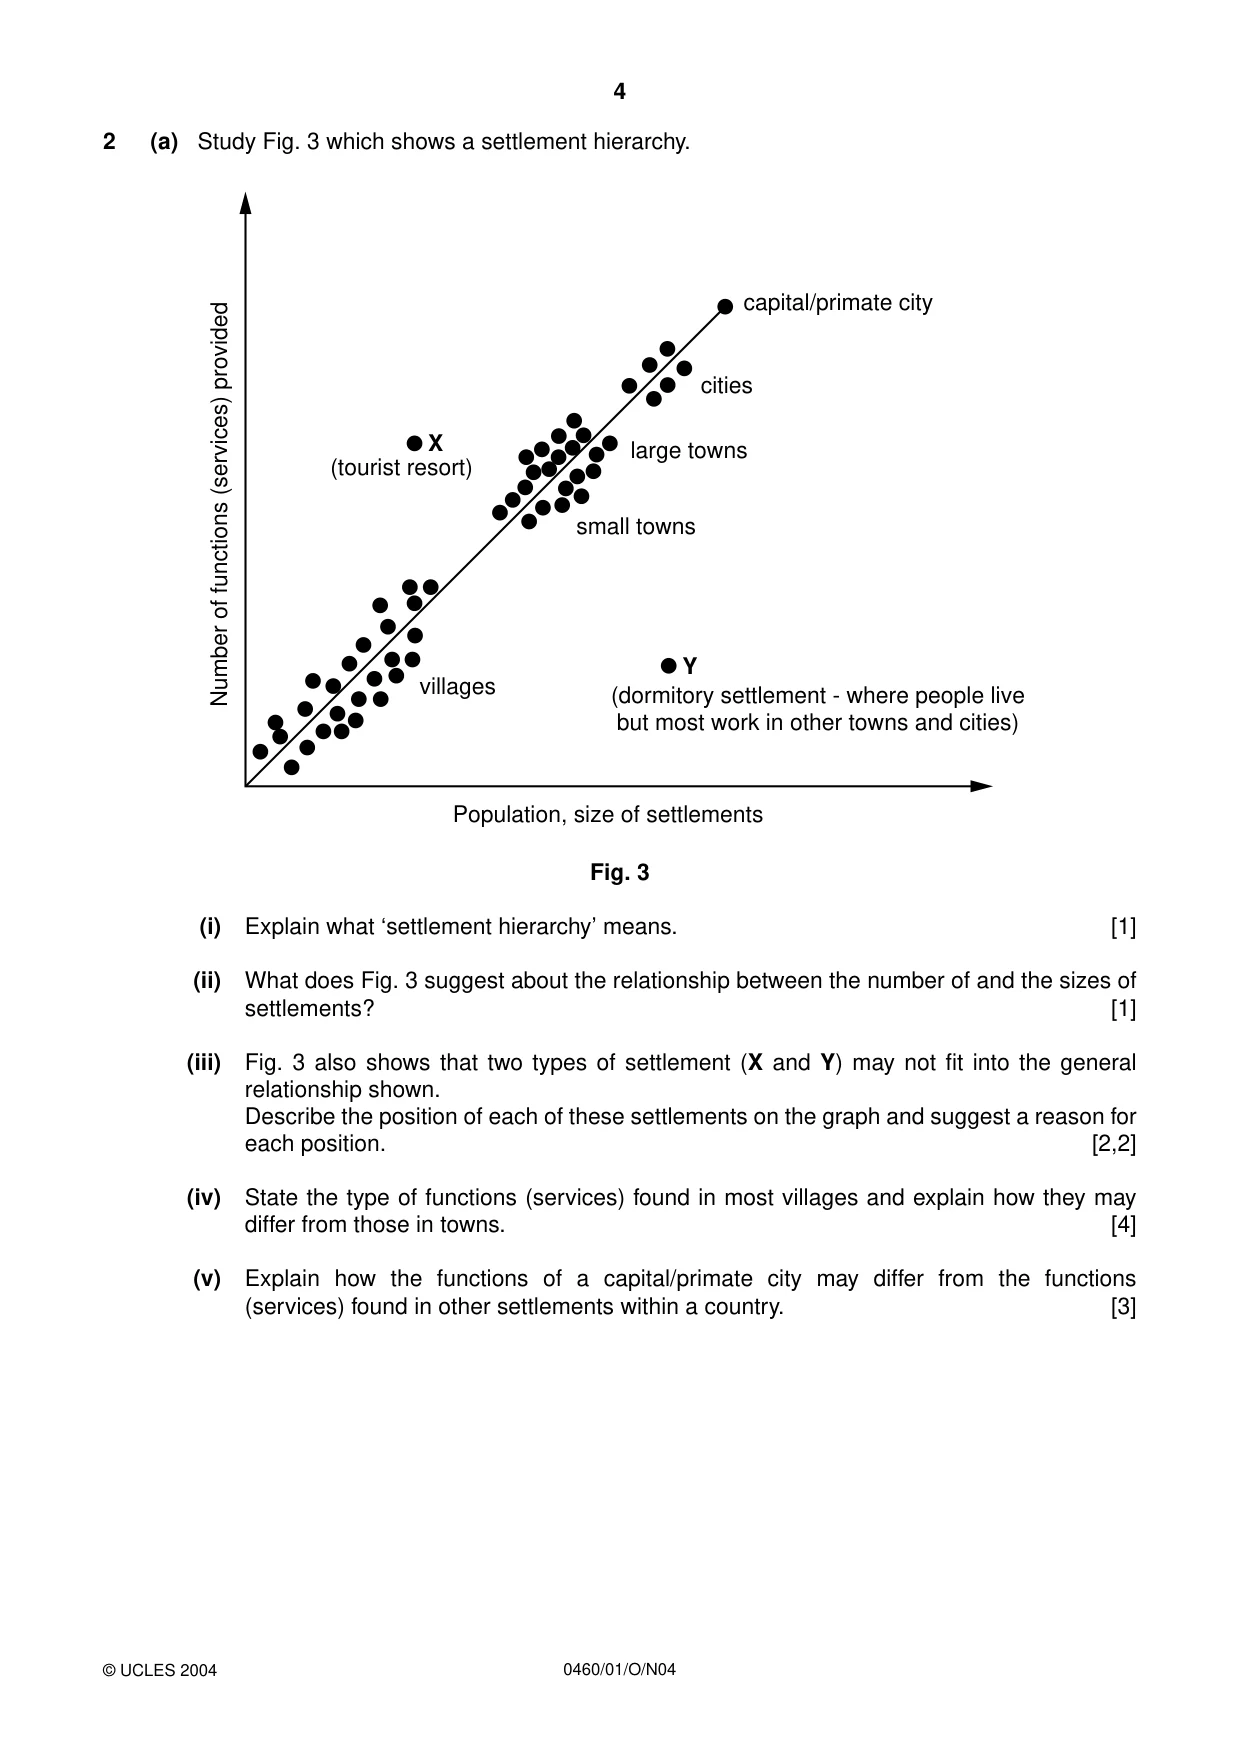
4 0460/01/O/N04 2 (a) Study Fig. 3 which shows a settlement hierarchy. Fig. 3 (i) Explain what ‘settlement hierarchy’ means. [1] (ii) What does Fig. 3 suggest about the relationship between the number of and the sizes of settlements? [1] (iii) Fig. 3 also shows that two types of settlement (X and Y) may not fit into the general relationship shown. Describe the position of each of these settlements on the graph and suggest a reason for each position. [2,2] (iv) State the type of functions (services) found in most villages and explain how they may differ from those in towns. [4] (v) Explain how the functions of a capital/primate city may differ from the functions (services) found in other settlements within a country. [3] X Y capital/primate city cities large towns small towns (tourist resort) villages (dormitory settlement - where people live but most work in other towns and cities) Population, size of settlements Number of functions (services) provided © UCLES 2004
Question paper, page 5
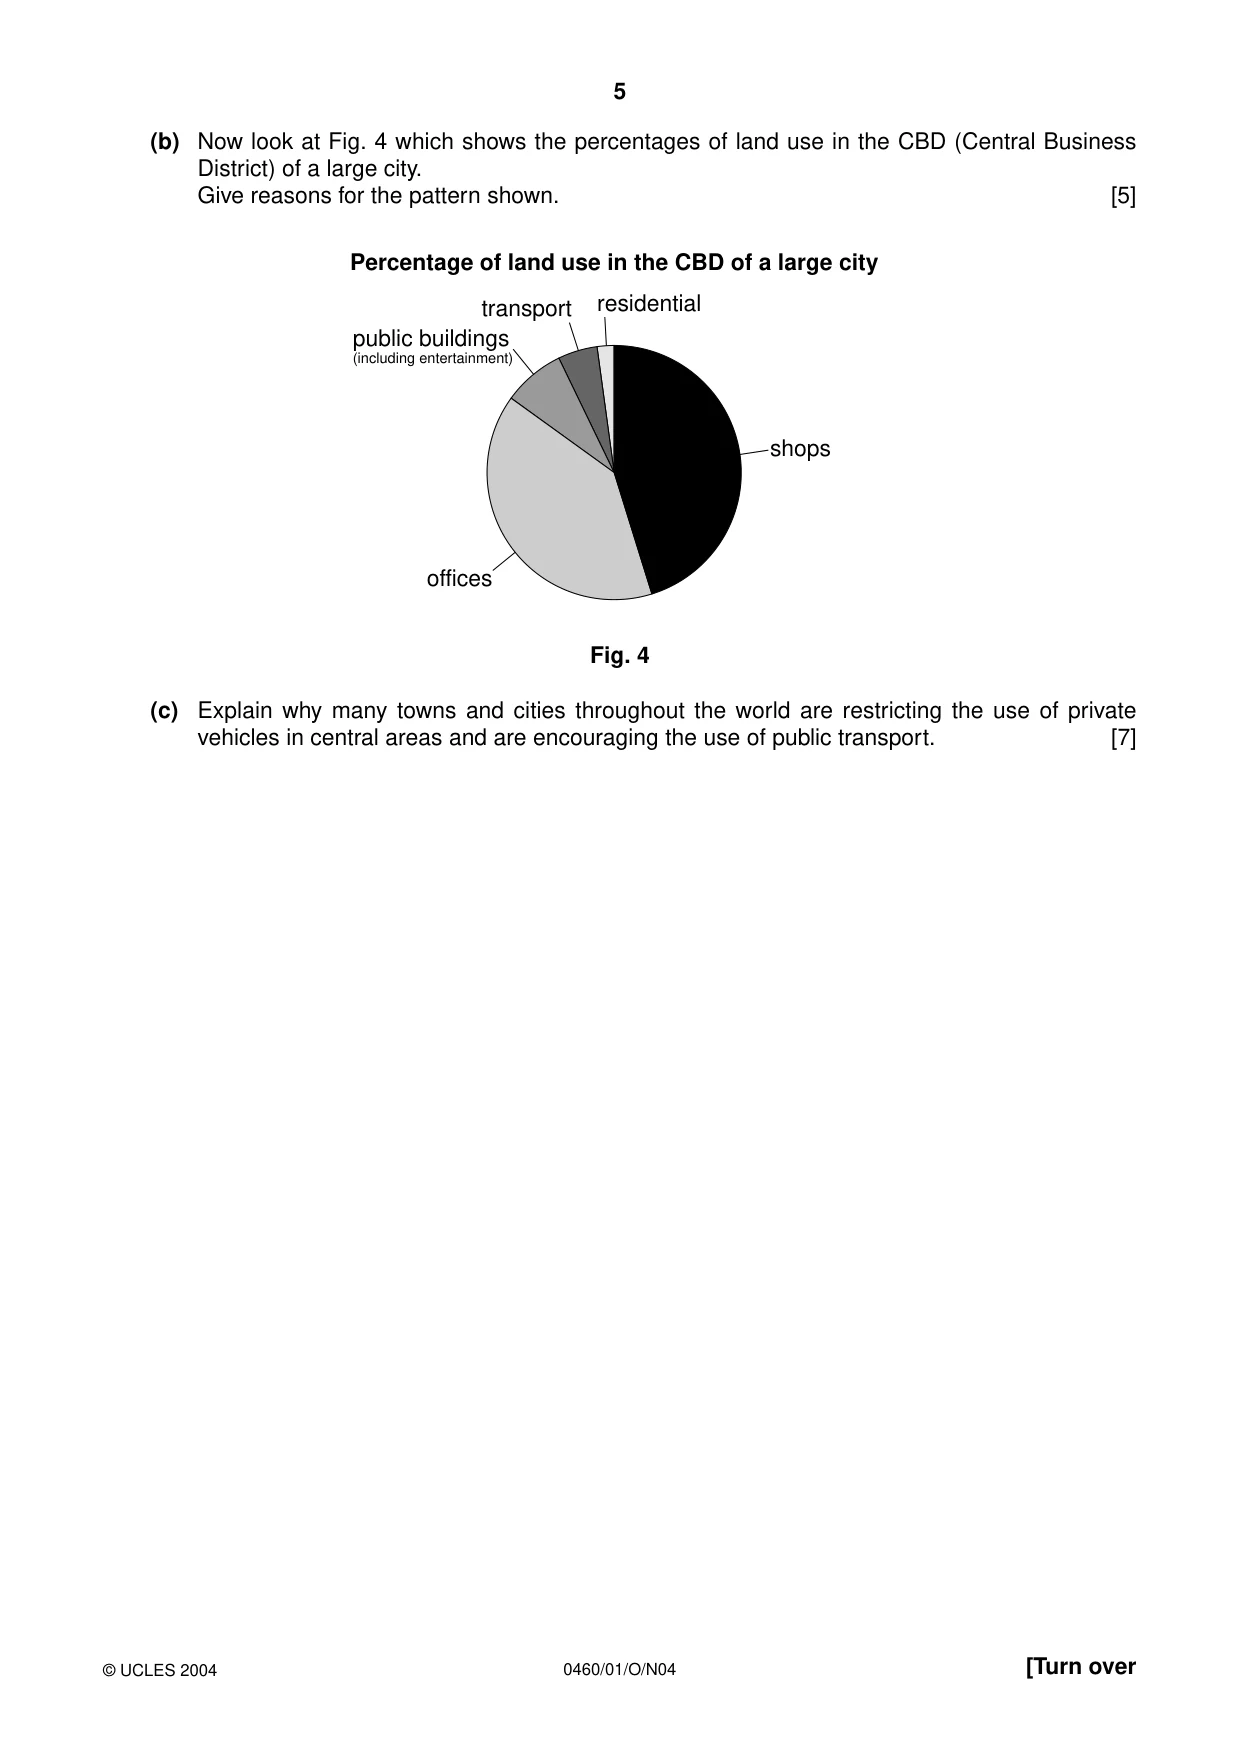
5 0460/01/O/N04 [Turn over (b) Now look at Fig. 4 which shows the percentages of land use in the CBD (Central Business District) of a large city. Give reasons for the pattern shown. [5] Fig. 4 (c) Explain why many towns and cities throughout the world are restricting the use of private vehicles in central areas and are encouraging the use of public transport. [7] residential transport public buildings (including entertainment) offices shops Percentage of land use in the CBD of a large city © UCLES 2004
Question paper, page 6
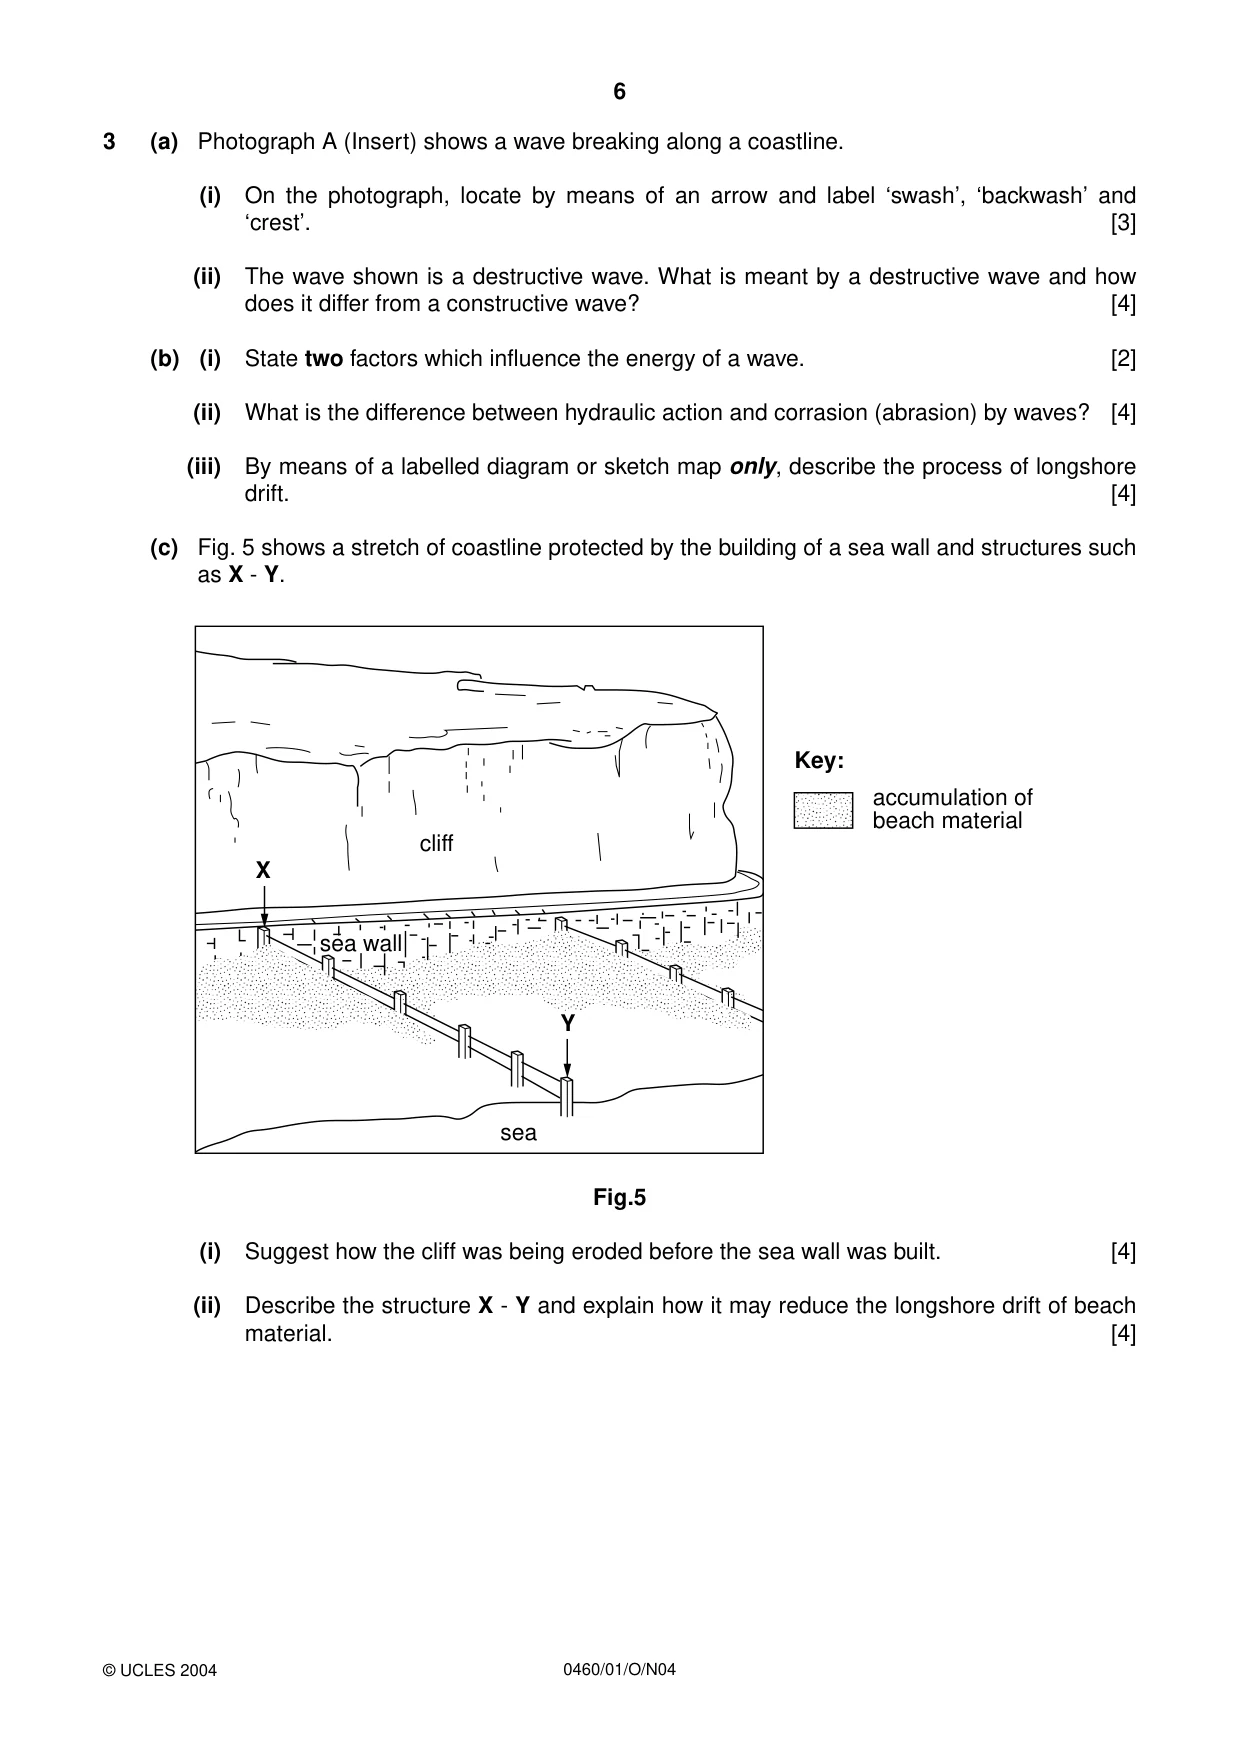
6 0460/01/O/N04 3 (a) Photograph A (Insert) shows a wave breaking along a coastline. (i) On the photograph, locate by means of an arrow and label ‘swash’, ‘backwash’ and ‘crest’. [3] (ii) The wave shown is a destructive wave. What is meant by a destructive wave and how does it differ from a constructive wave? [4] (b) (i) State two factors which influence the energy of a wave. [2] (ii) What is the difference between hydraulic action and corrasion (abrasion) by waves? [4] (iii) By means of a labelled diagram or sketch map only, describe the process of longshore drift. [4] (c) Fig. 5 shows a stretch of coastline protected by the building of a sea wall and structures such as X - Y. Fig.5 (i) Suggest how the cliff was being eroded before the sea wall was built. [4] (ii) Describe the structure X - Y and explain how it may reduce the longshore drift of beach material. [4] cliff X sea wall sea Y Key: accumulation of beach material © UCLES 2004
Question paper, page 8
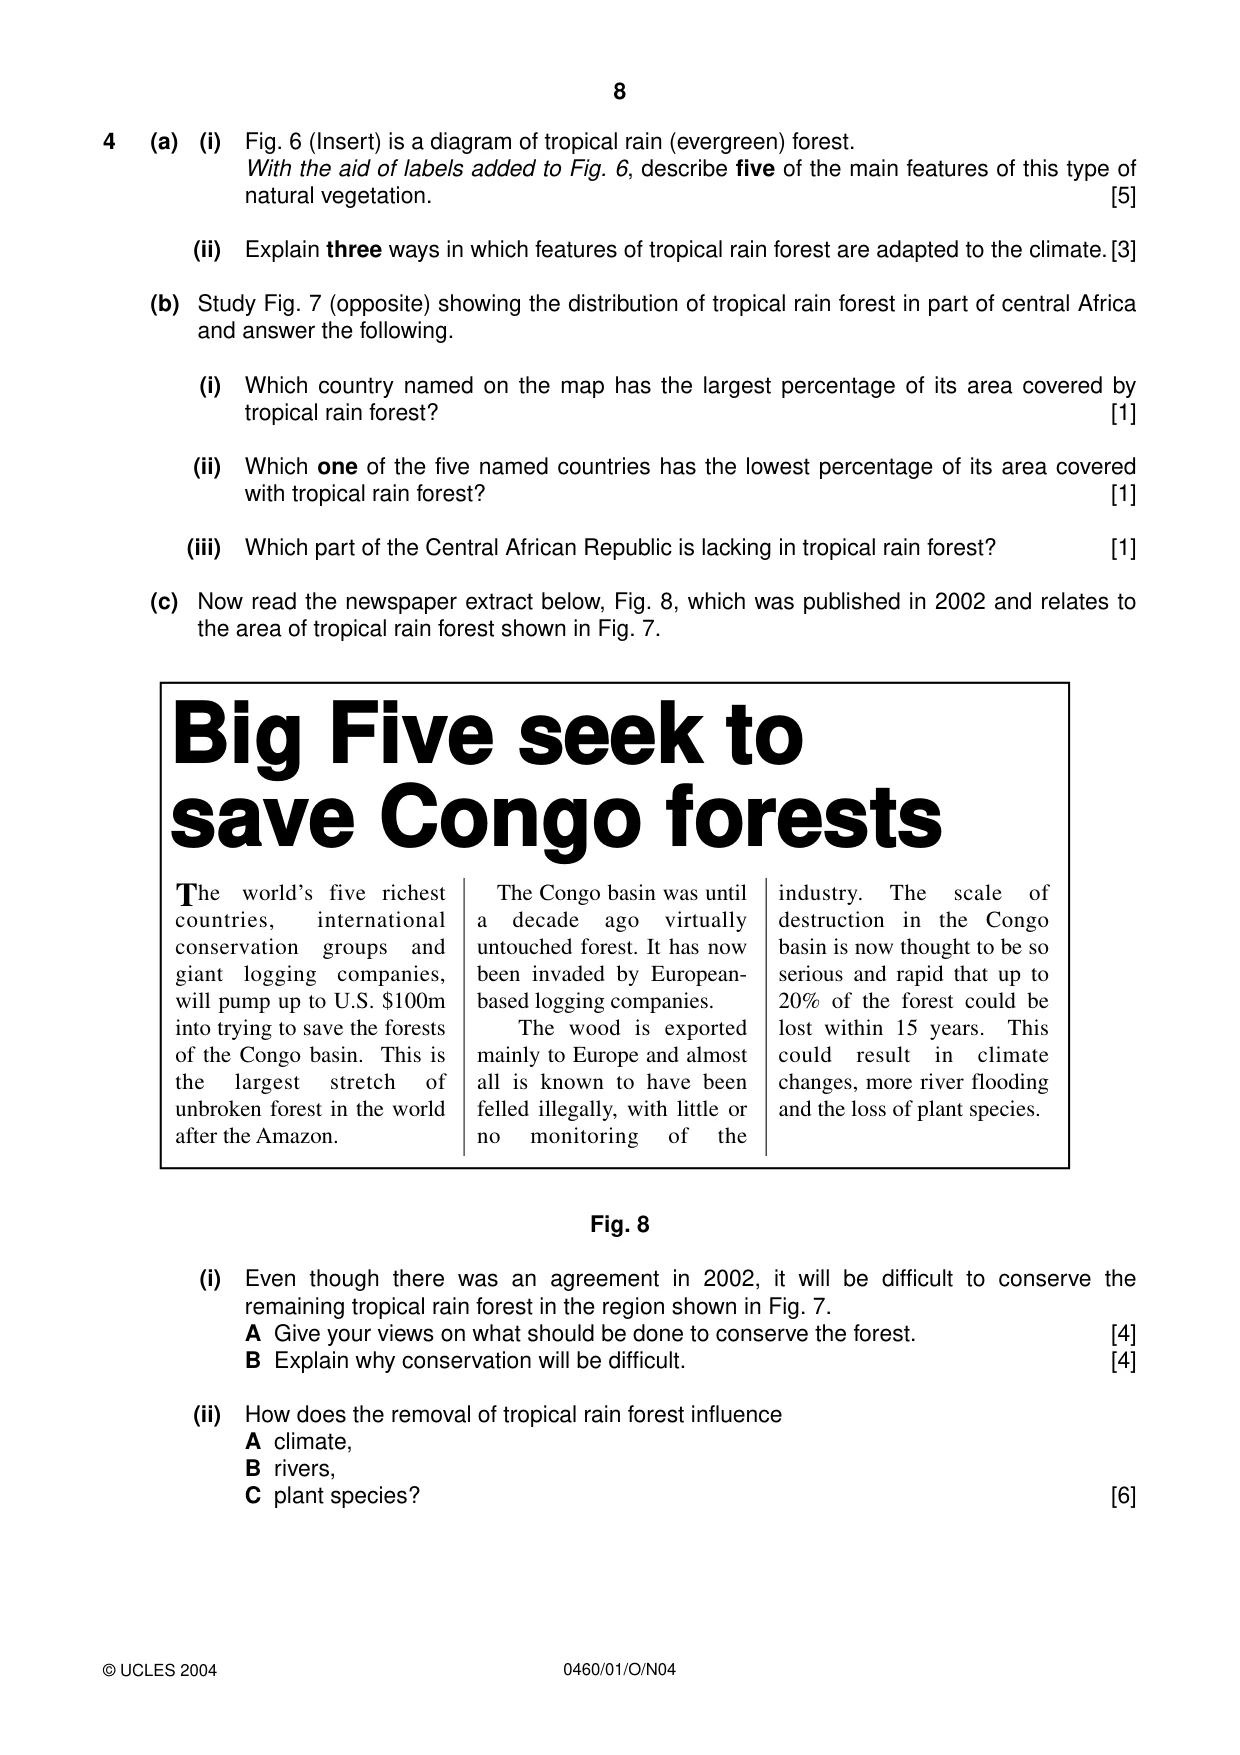
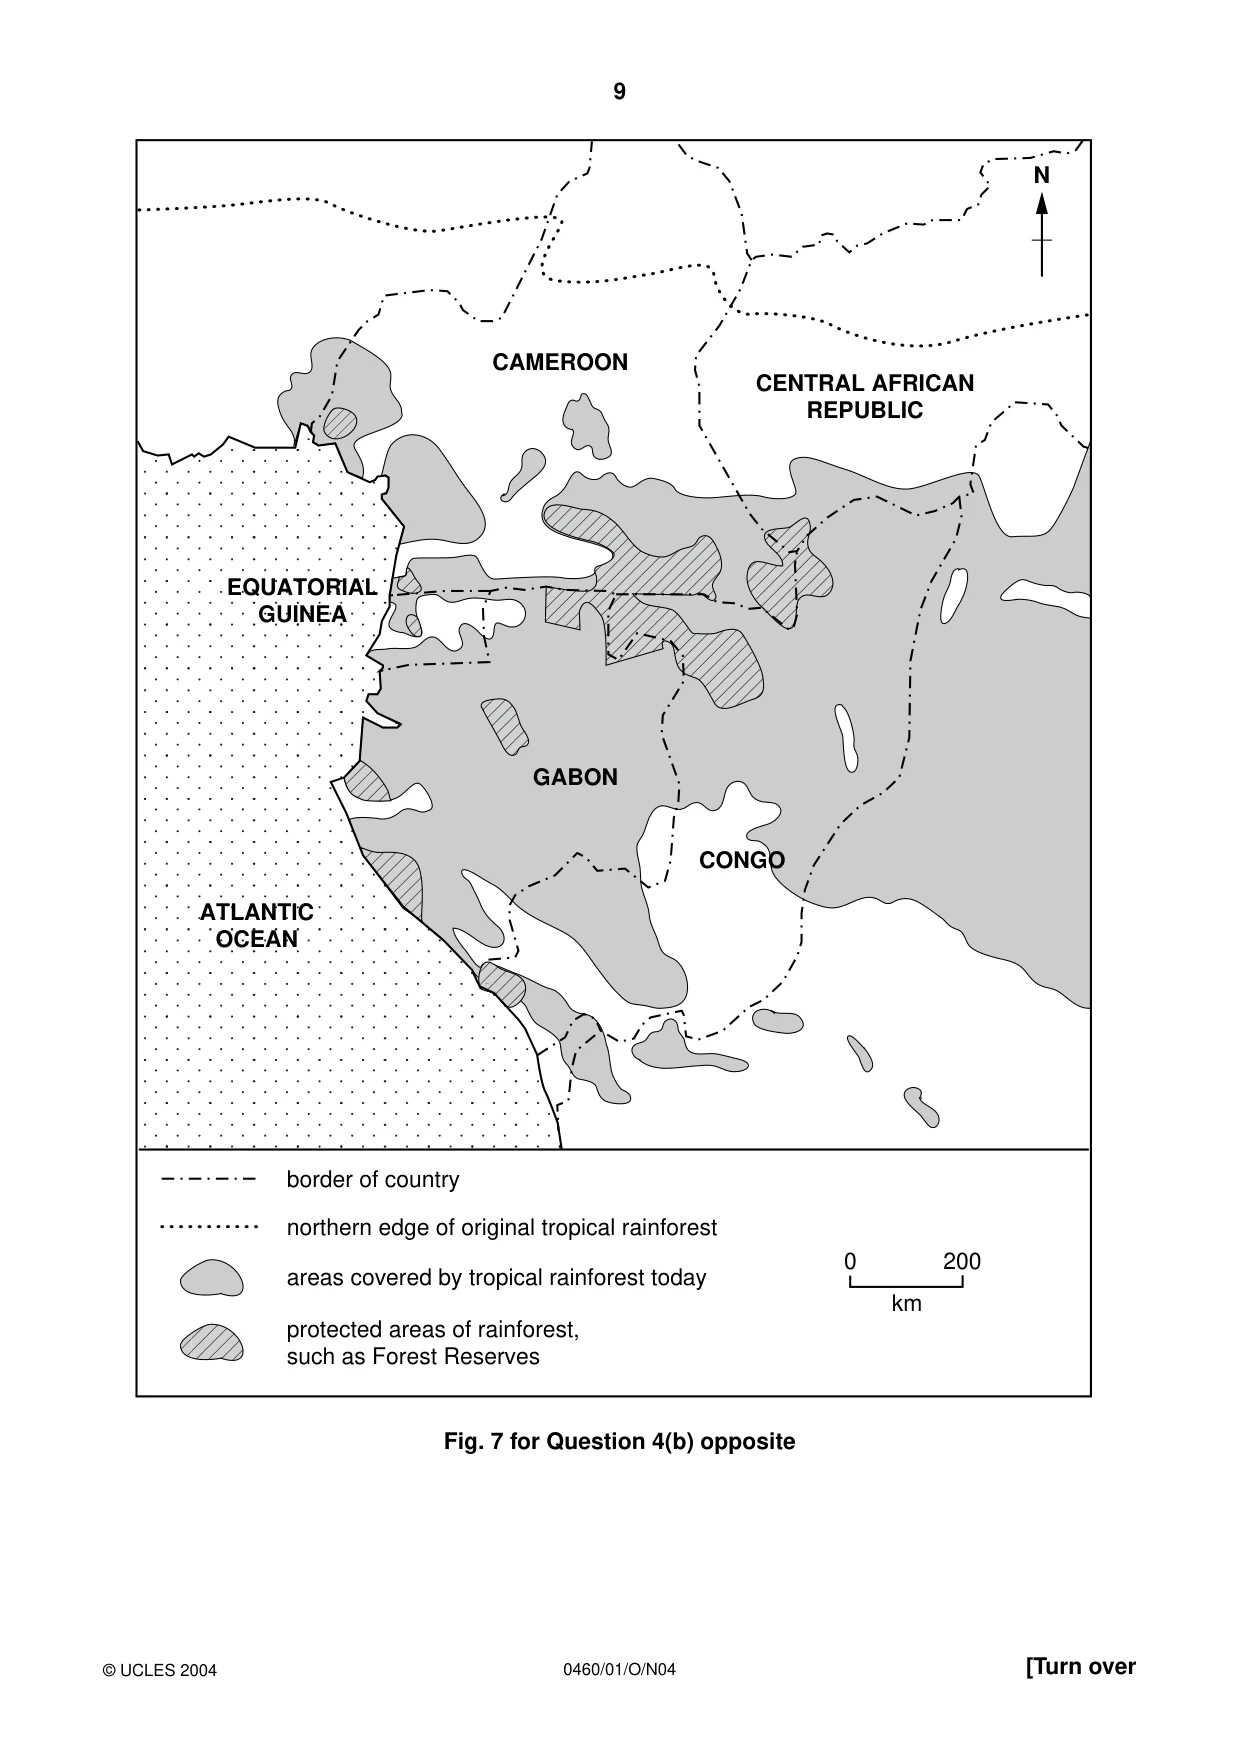
8 0460/01/O/N04 4 (a) (i) Fig. 6 (Insert) is a diagram of tropical rain (evergreen) forest. With the aid of labels added to Fig. 6, describe five of the main features of this type of natural vegetation. [5] (ii) Explain three ways in which features of tropical rain forest are adapted to the climate.[3] (b) Study Fig. 7 (opposite) showing the distribution of tropical rain forest in part of central Africa and answer the following. (i) Which country named on the map has the largest percentage of its area covered by tropical rain forest? [1] (ii) Which one of the five named countries has the lowest percentage of its area covered with tropical rain forest? [1] (iii) Which part of the Central African Republic is lacking in tropical rain forest? [1] (c) Now read the newspaper extract below, Fig. 8, which was published in 2002 and relates to the area of tropical rain forest shown in Fig. 7. Fig. 8 (i) Even though there was an agreement in 2002, it will be difficult to conserve the remaining tropical rain forest in the region shown in Fig. 7. A Give your views on what should be done to conserve the forest. [4] B Explain why conservation will be difficult. [4] (ii) How does the removal of tropical rain forest influence A climate, B rivers, C plant species? [6] Big Five seek to Big Five seek to save Congo forests save Congo forests The world’s five richest countries, international conservation groups and giant logging companies, will pump up to U.S. $100m into trying to save the forests of the Congo basin. This is the largest stretch of unbroken forest in the world after the Amazon. The Congo basin was until a decade ago virtually untouched forest. It has now been invaded by European- based logging companies. The wood is exported mainly to Europe and almost all is known to have been felled illegally, with little or no monitoring of the industry. The scale of destruction in the Congo basin is now thought to be so serious and rapid that up to 20% of the forest could be lost within 15 years. This could result in climate changes, more river flooding and the loss of plant species. © UCLES 2004
Question paper, page 9
9 0460/01/O/N04 [Turn over Fig. 7 for Question 4(b) opposite CAMEROON ATLANTIC OCEAN EQUATORIAL GUINEA CENTRAL AFRICAN REPUBLIC GABON CONGO border of country northern edge of original tropical rainforest areas covered by tropical rainforest today protected areas of rainforest, such as Forest Reserves 0 km 200 N © UCLES 2004
Question paper, page 10
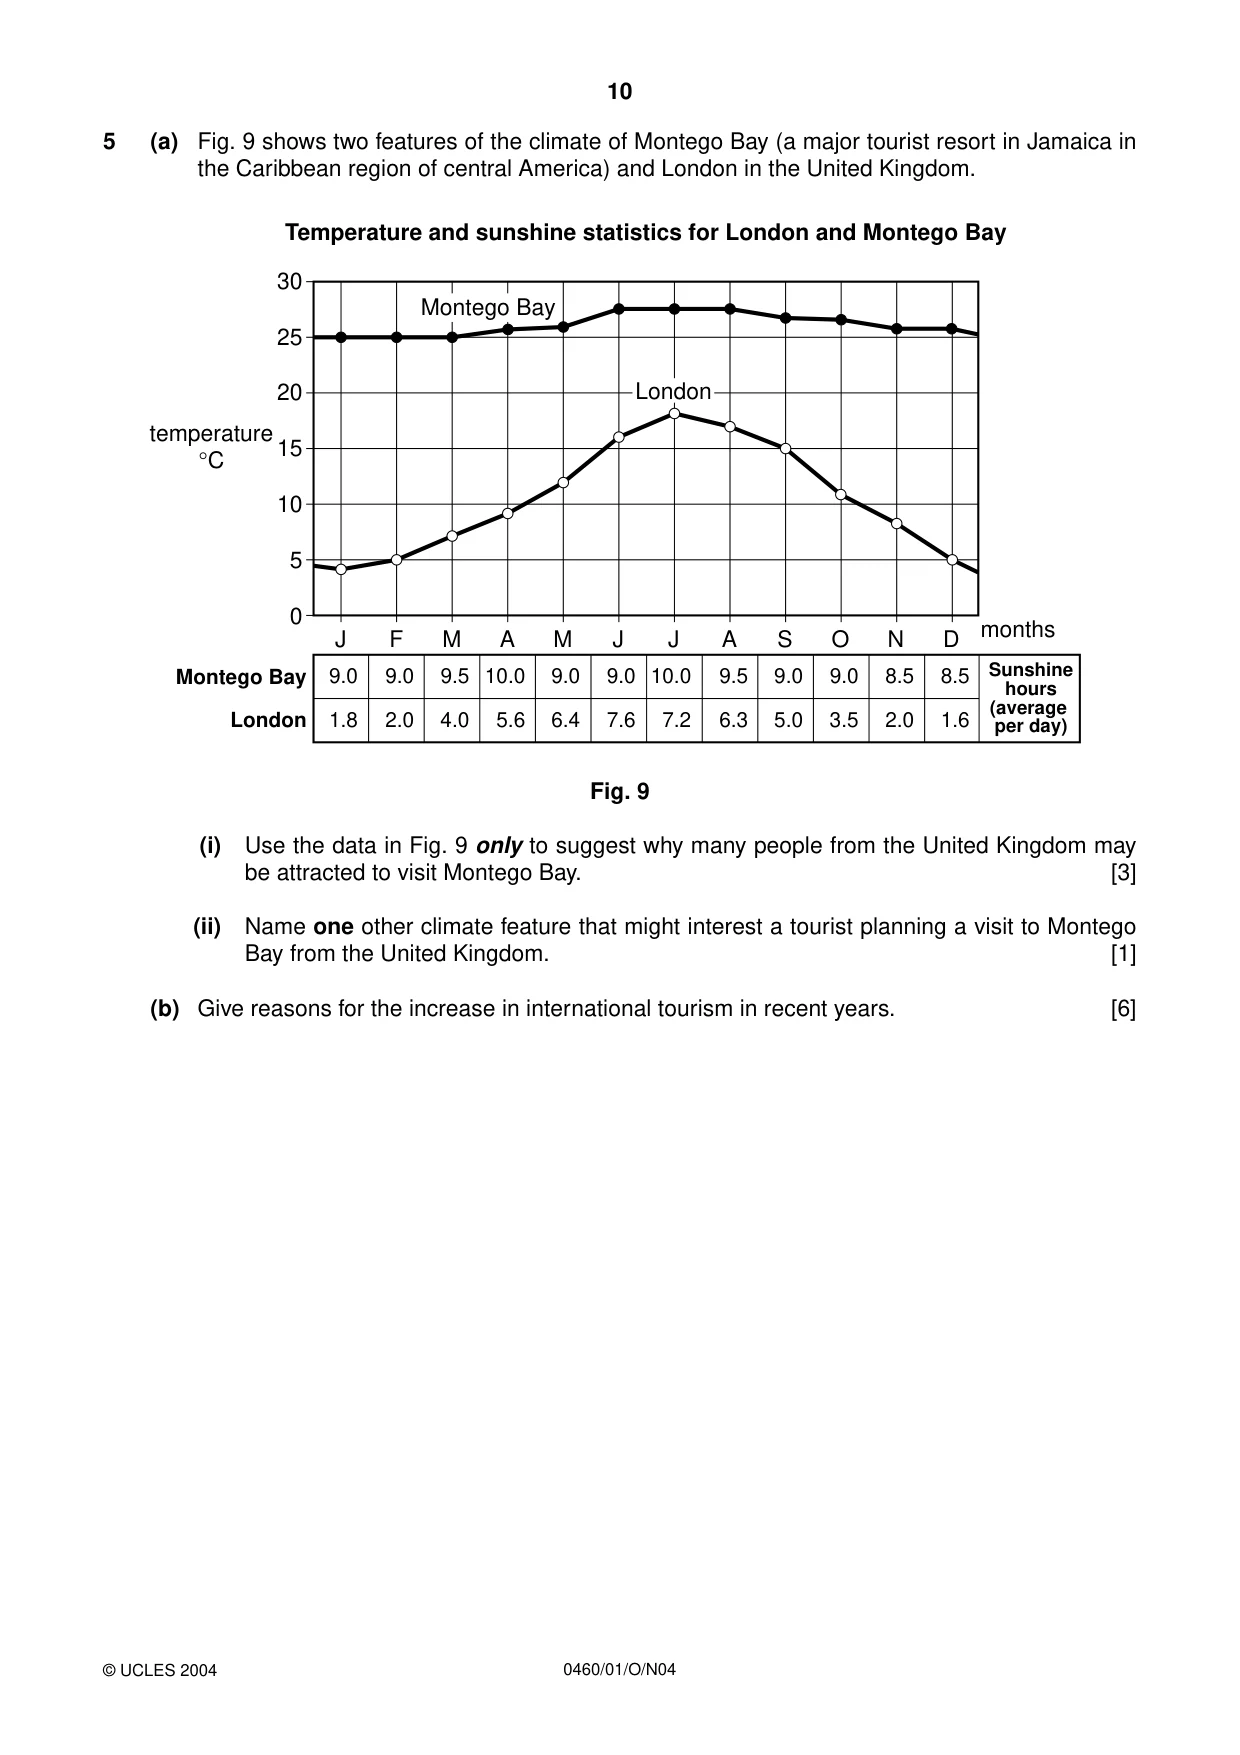
10 0460/01/O/N04 5 (a) Fig. 9 shows two features of the climate of Montego Bay (a major tourist resort in Jamaica in the Caribbean region of central America) and London in the United Kingdom. Fig. 9 (i) Use the data in Fig. 9 only to suggest why many people from the United Kingdom may be attracted to visit Montego Bay. [3] (ii) Name one other climate feature that might interest a tourist planning a visit to Montego Bay from the United Kingdom. [1] (b) Give reasons for the increase in international tourism in recent years. [6] 0 5 10 15 20 25 30 temperature °C Montego Bay London J F M A M J J A S O N D months Temperature and sunshine statistics for London and Montego Bay 9.0 9.0 9.5 10.0 9.0 9.0 10.0 9.5 9.0 9.0 8.5 8.5 1.8 2.0 4.0 5.6 6.4 7.6 7.2 6.3 5.0 3.5 2.0 1.6 Sunshine hours (average per day) Montego Bay London © UCLES 2004
Question paper, page 11
11 0460/01/O/N04 [Turn over (c) Fig. 10 shows some of the effects of tourists developments on the environment and on people living in various parts of the world. Fig. 10 (i) With reference to information in Fig.10 and from studies you have made, explain how the growth of tourism has A changed the natural environment, [4] B caused problems for local people. [4] (ii) For a named tourist area, describe the benefits for local people from the growth of the tourist industry. [7] © UCLES 2004 This diagram is removed for third party copyright reasons This diagram is removed for third party copyright reasons. Please contact the Product Manager for Geography.
Question paper, page 12
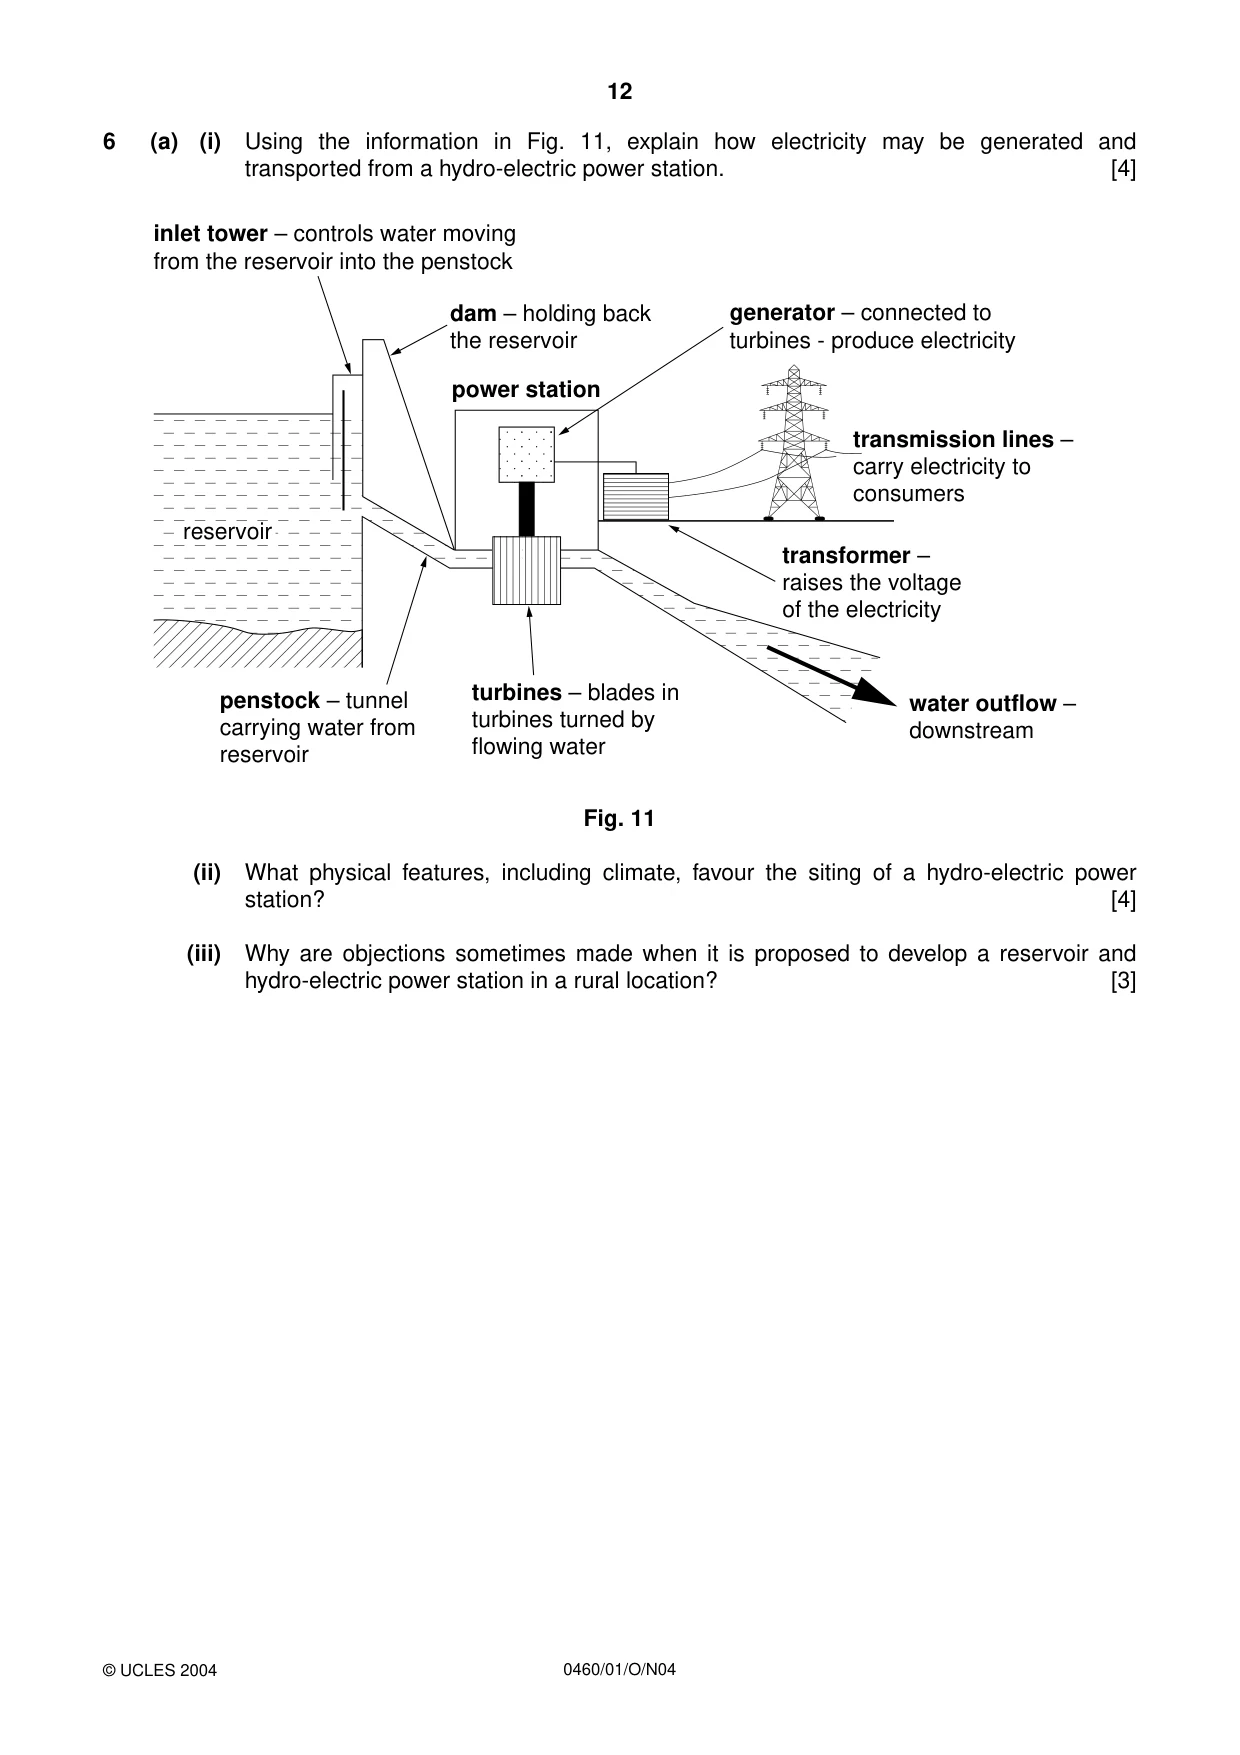
12 0460/01/O/N04 6 (a) (i) Using the information in Fig. 11, explain how electricity may be generated and transported from a hydro-electric power station. [4] Fig. 11 (ii) What physical features, including climate, favour the siting of a hydro-electric power station? [4] (iii) Why are objections sometimes made when it is proposed to develop a reservoir and hydro-electric power station in a rural location? [3] inlet tower – controls water moving from the reservoir into the penstock dam – holding back the reservoir turbines – blades in turbines turned by flowing water penstock – tunnel carrying water from reservoir power station generator – connected to turbines - produce electricity transmission lines – carry electricity to consumers transformer – raises the voltage of the electricity water outflow – downstream reservoir © UCLES 2004
Question paper, page 13
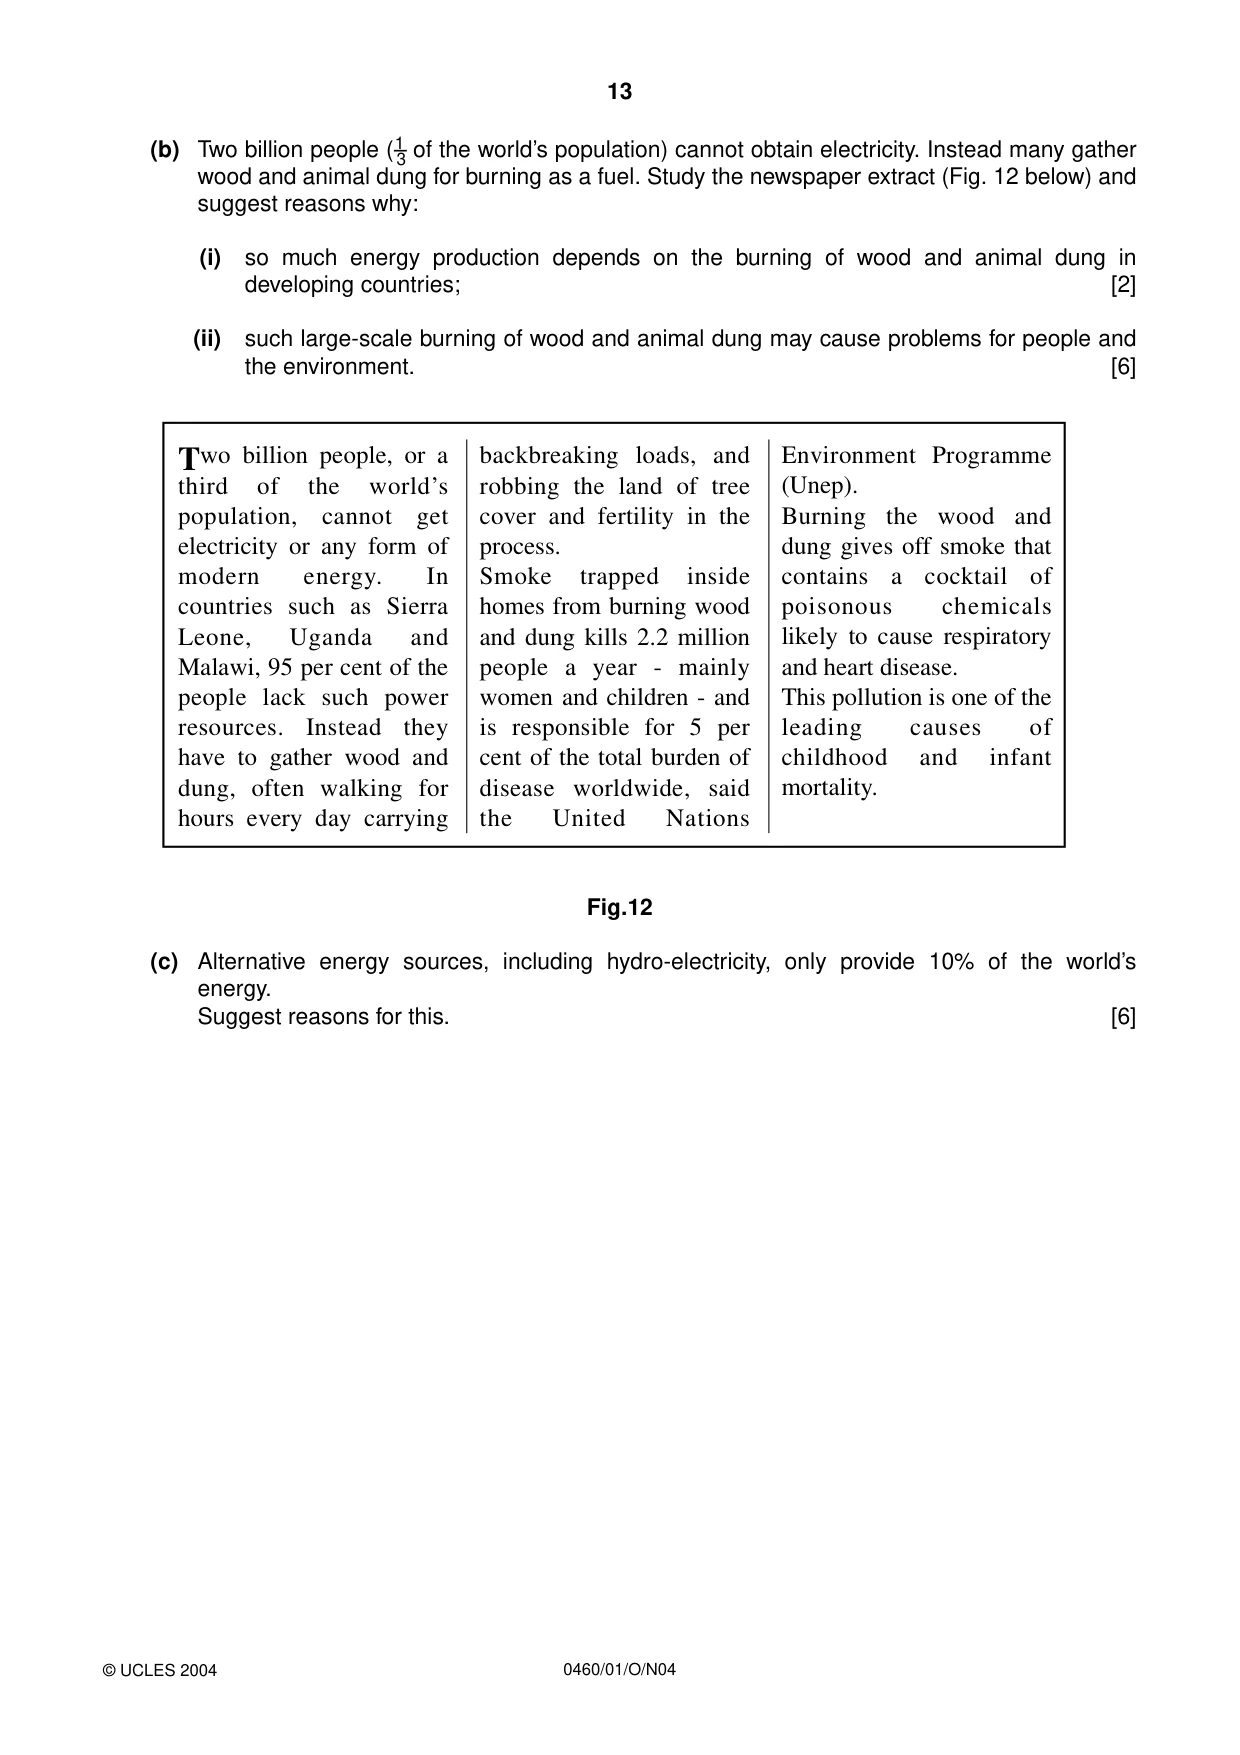
13 0460/01/O/N04 (b) Two billion people (1–3 of the world’s population) cannot obtain electricity. Instead many gather wood and animal dung for burning as a fuel. Study the newspaper extract (Fig. 12 below) and suggest reasons why: (i) so much energy production depends on the burning of wood and animal dung in developing countries; [2] (ii) such large-scale burning of wood and animal dung may cause problems for people and the environment. [6] Fig.12 (c) Alternative energy sources, including hydro-electricity, only provide 10% of the world’s energy. Suggest reasons for this. [6] Two billion people, or a third of the world’s population, cannot get electricity or any form of modern energy. In countries such as Sierra Leone, Uganda and Malawi, 95 per cent of the people lack such power resources. Instead they have to gather wood and dung, often walking for hours every day carrying backbreaking loads, and robbing the land of tree cover and fertility in the process. Smoke trapped inside homes from burning wood and dung kills 2.2 million people a year - mainly women and children - and is responsible for 5 per cent of the total burden of disease worldwide, said the United Nations Environment Programme (Unep). Burning the wood and dung gives off smoke that contains a cocktail of poisonous chemicals likely to cause respiratory and heart disease. This pollution is one of the leading causes of childhood and infant mortality. © UCLES 2004
Question paper, page 16
16 0460/01/O/N04 BLANK PAGE Copyright Acknowledgements: Figure 1. © The Economist Figure 2. © The Economist Figure 10. © The Guardian. www.guardian.co.uk Figure 11. EUSTON, BROWN AND WOODWARD. Geography. © Reproduced by permission of Cambridge University Press. Figure 12. © The Independent Every reasonable effort has been made to trace all copyright holders where the publishers (i.e. UCLES) are aware that third-party material has been reproduced. The publishers would be pleased to hear from anyone whose rights they have unwittingly infringed. University of Cambridge International Examinations is part of the University of Cambridge Local Examinations Syndicate (UCLES), which is itself a department of the University of Cambridge.
Mark scheme, page 1
UNIVERSITY OF CAMBRIDGE INTERNATIONAL EXAMINATIONS International General Certificate of Secondary Education MARK SCHEME for the November 2004 question paper 0460 GEOGRAPHY 0460/01 Paper 1, maximum mark 75 This mark scheme is published as an aid to teachers and students, to indicate the requirements of the examination. It shows the basis on which Examiners were initially instructed to award marks. It does not indicate the details of the discussions that took place at an Examiners’ meeting before marking began. Any substantial changes to the mark scheme that arose from these discussions will be recorded in the published Report on the Examination. All Examiners are instructed that alternative correct answers and unexpected approaches in candidates’ scripts must be given marks that fairly reflect the relevant knowledge and skills demonstrated. Mark schemes must be read in conjunction with the question papers and the Report on the Examination. CIE will not enter into discussion or correspondence in connection with these mark schemes. CIE is publishing the mark schemes for the November 2004 question papers for most IGCSE and GCE Advanced Level syllabuses. www.XtremePapers.com
Mark scheme, page 2
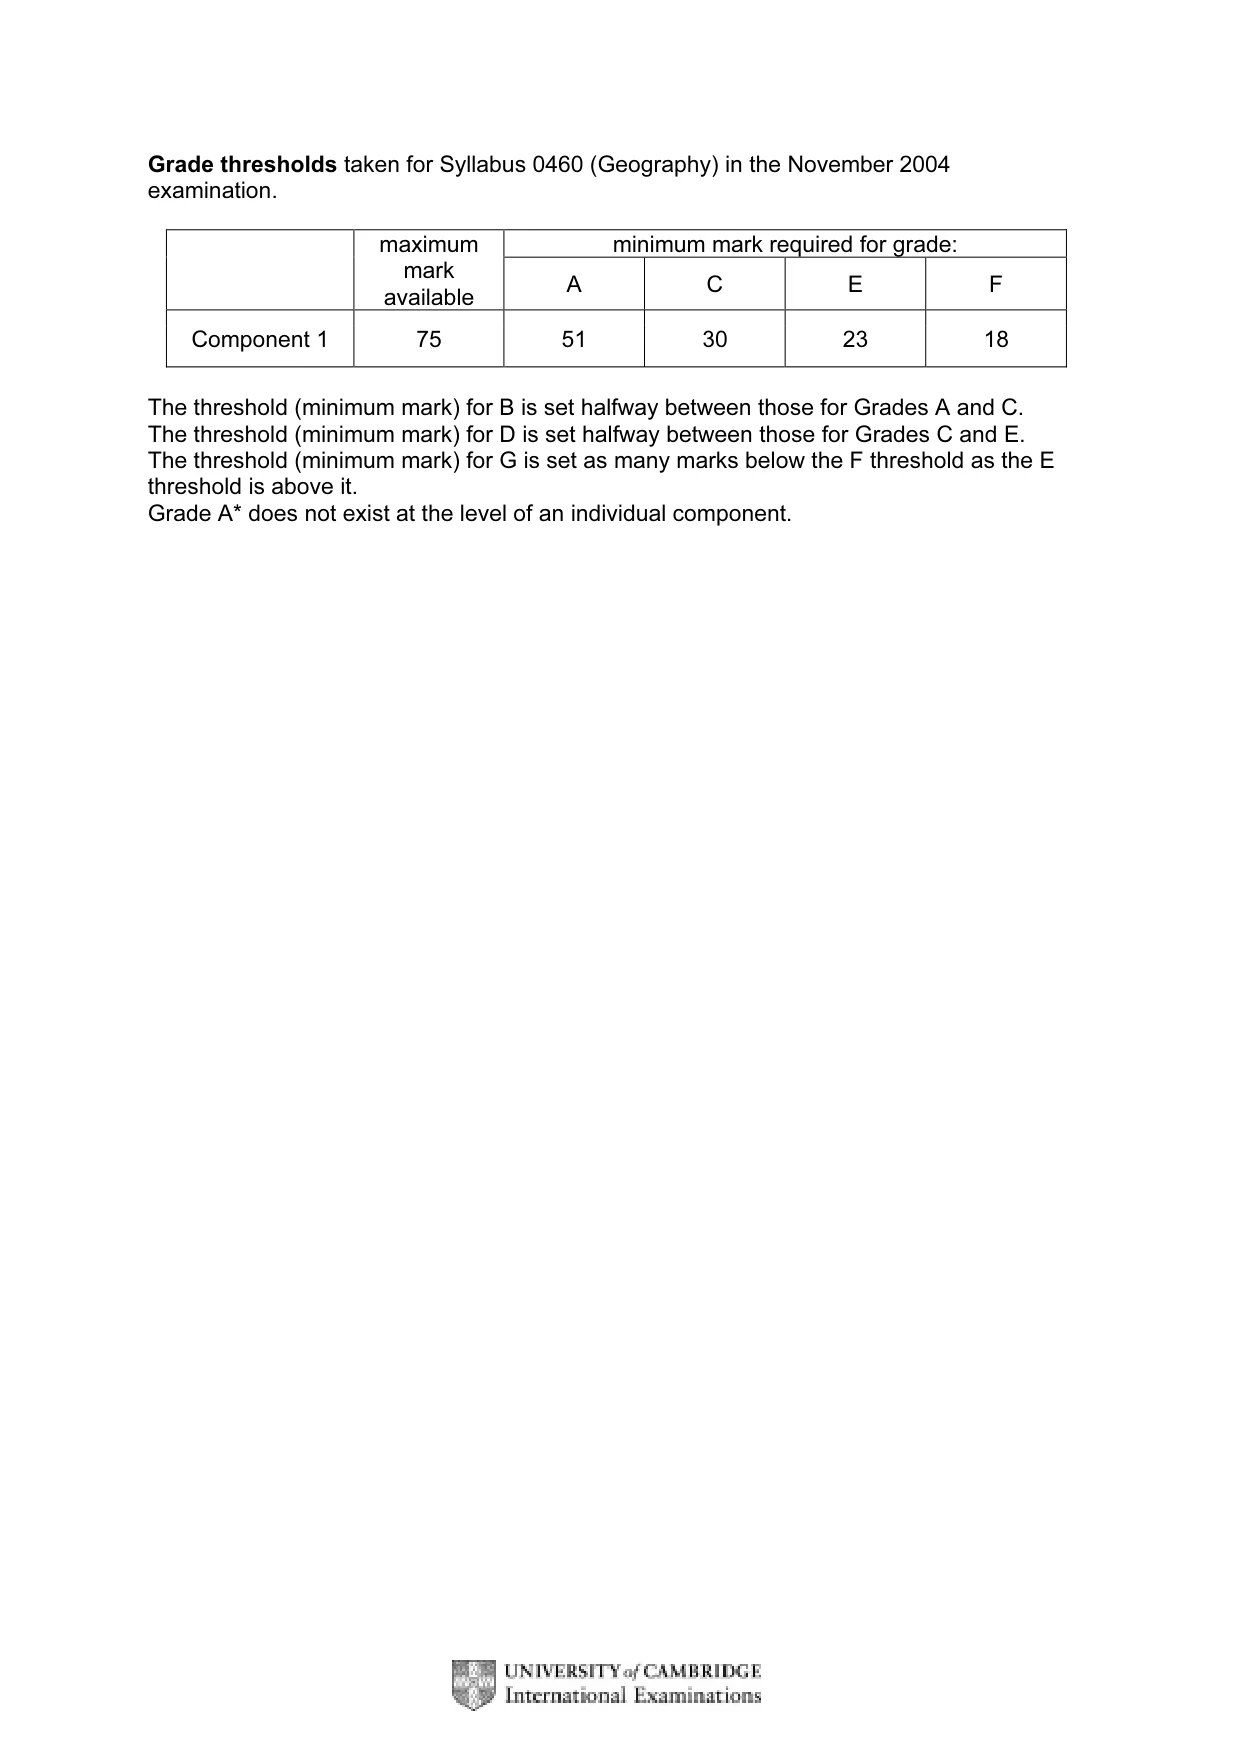
Grade thresholds taken for Syllabus 0460 (Geography) in the November 2004 examination. minimum mark required for grade: maximum mark available A C E F Component 1 75 51 30 23 18 The threshold (minimum mark) for B is set halfway between those for Grades A and C. The threshold (minimum mark) for D is set halfway between those for Grades C and E. The threshold (minimum mark) for G is set as many marks below the F threshold as the E threshold is above it. Grade A* does not exist at the level of an individual component.
Mark scheme, page 3
November 2004 INTERNATIONAL GCSE MARK SCHEME MAXIMUM MARK: 75 SYLLABUS/COMPONENT: 0460/01 GEOGRAPHY Paper 1
Mark scheme, page 4
Page 1 Mark Scheme Syllabus Paper IGCSE – NOVEMBER 2004 0460 1 © University of Cambridge International Examinations 2005 Mark scheme 0460/1 November 2004 The features of the marking scheme Each question carries 25 marks. Candidates cannot earn above the maximum marks available within each sub section. The marking scheme attempts to give guidance about the requirements of each answer and lists a number of responses which will earn marks along with the general principles to be applied when marking each question. It should be noted that candidates can earn marks if their answers are phrased differently provided they convey the same meaning as those in the mark scheme. THE CANDIDATES DO NOT NEED TO USE THE SAME WORDING TO EARN MARKS. The notation ‘etc.’ at the end of an answer in the mark scheme signifies that there may well be other correct responses or examples that can be given credit. Providing the statement is true, relevant to the question asked and not repetition of a previous point made credit should be given. A point made within one sub-section which is an answer to the question set in a different sub- section should not be given credit as each sub-section asks different questions which require independent answers. The mark scheme uses semi colons (;) to separate marks and diagonals (/) to separate alternative answers.
Mark scheme, page 5
Page 2 Mark Scheme Syllabus Paper IGCSE – NOVEMBER 2004 0460 1 © University of Cambridge International Examinations 2005 Question 1 (a) One mark reserved for definition of ‘natural increase of population’ : growth of population excluding migration/as a result of births and deaths, Two further marks for explanation of calculation: birth rate minus death rate = 2 marks; number of births minus number of deaths (1 mark); per 1000 population/percentage (1 mark); per annum/in a year (1 mark) [3] (b) (i) A Credit ideas which describe the rate of growth of the world’s total population between 1950 and 2000 such as: growth was rapid; growth was continuous; rate of growth increased later in C20; population doubled 1950 to 2000; 2 billion + in 1950 - approximately. 6 billion in 2000 (1 mark MAX for use of figures) 2 at 1 mark [2] B Credit ideas which refer to the proportions of population in the world regions between 1950 and 2050 such as: Asia/Oceania always had largest share; increase in proportion in regions of developing world; increase in proportion in sub Saharan Africa/Latin America/North Africa (MAX 2) Europe declining proportion throughout the 100 years; N. America similar proportion etc. 4 at 1 mark [4]
Mark scheme, page 6
Page 3 Mark Scheme Syllabus Paper IGCSE – NOVEMBER 2004 0460 1 © University of Cambridge International Examinations 2005 (ii) A High birth rates/low or falling death rates = 1. Reasons for high birth rates such as: lack of/no contraception/family planning; lack of awareness/knowledge/education of family planning; large families for economic reasons/children sent out to work/work on farms; need for children to look after people in old age; high infant mortality/want enough children to ensure survival; traditional values/respect for people with many children; religious values/religious disapproval of family planning etc. and/or falling death rates such as: improvements in medical care; improvements in sanitation/water supply; facilities/support for elderly etc. 5 at 1 mark with no maximum on high birth rates/falling death rates [5] B Low birth rates/equal birth and death rates = 1 Reasons for low birth rates such as: availability/access to/use of contraception; acceptance of family planning; knowledge/education of family planning; small families for economic reasons/children have to be sent to school; no need for children to look after people in old age/state support of elderly; low infant mortality/children will usually survive to adulthood; many women are career orientated; female emancipation; women now spend longer period of time in education; many women have children relatively late in life; secular values/positive approval of family planning/abortion; impact of Government policies regarding family size; death rates remain high in some areas; impacts of AIDS on death rates/life expectancy etc. 5 at 1 mark [5] (c) (i) The dependency ratio is: the relative proportion of the population dependent economically on active/working population (2 marks); people who are not working/the population dependent economically on active/working (1 mark); population under 15s and over 60s/children and OAPs (1 mark). 2 at 1 mark [2]
Mark scheme, page 7
Page 4 Mark Scheme Syllabus Paper IGCSE – NOVEMBER 2004 0460 1 © University of Cambridge International Examinations 2005 (ii) Candidates should explain why the developments shown in Fig. 2 will create problems for Japan now and in the future including ideas such as: increase in dependency ratio/ageing population/greater percentage of old people; increased spending on older dependants/rise in taxes to support old people need to provide housing/more pressure on housing stock; need to provide medical care/more pressure on medical services; need to provide pensions; need to provide social services; stagnant/declining population growth; labour shortages; possible need to import labour; problems for defence etc. 4 at 1 mark or development [4] TOTAL 25 MARKS Question 2 (a) (i) A settlement hierarchy is: (a description of/diagram showing) settlements according to size/importance 1 mark [1] (ii) The relationship shown by Fig. 3 is: the greater the size the fewer the settlements or reverse 1 mark [1] (iii) X (tourist resort): more functions/services than expected for a settlement of that size; population increases greatly with visitors/who require large number of services/functions etc. 2 at 1 mark, with one mark reserved for describing the position on the graph and the other for reasoning. Y (dormitory settlement): Services/functions fewer than expected for a settlement of that size; people live but work elsewhere/obtain services elsewhere. 2 at 1 mark, with one mark reserved for describing the position on the graph and the other for reasoning. [2, 2]
Mark scheme, page 8
Page 5 Mark Scheme Syllabus Paper IGCSE – NOVEMBER 2004 0460 1 © University of Cambridge International Examinations 2005 (iv) Candidates need to identify the type of functions found in most villages and explain how they may differ from those in towns. Expect ideas such as: villages - low order services, services in towns will be higher order (dev); mainly/entirely convenience goods, whilst towns will offer specialist/comparison goods; examples of village services (e.g. post office, church/mosque/temple etc.) MAX 1 mark services which require small threshold population; services which have small sphere of influence/range, in towns have a greater range/people travel larger distances. examples of urban services (e.g. market, clothes shops etc.) MAX 1 mark etc. 4 at 1 mark or development N.B. Points made about services in towns are likely to be credited as development. maximum 3 marks without an attempt to compare with towns. [4] (v) Functions of a capital/primate city are likely to: have a greater number of services; have the largest sphere of influence; be higher order functions/services than other towns or cities; have more administration/government functions; be the main business centre; in LEDCs there will be better educational opportunities; usually the main centre of communications/or examples; larger threshold population etc. 3 at 1 mark [3] (b) Reasoning is likely to focus on large proportion of land used for businesses/public buildings and/or the relatively small amount of land used for residential purposes. Be prepared to accept any valid reasoning to explain the proportion of any type of land use but do not double credit the same idea related to different land uses e.g. cost of land). Ideas such as: high cost of land; can only be afforded by shops/offices; need for central position for shops; large sphere of influence; transport focus; links with all parts of the town/city; transport links for shoppers visiting city centre; offices - transport of workers/commuters; few residences - high cost/rent etc. 5 at 1 mark or development [5]
Mark scheme, page 9
Page 6 Mark Scheme Syllabus Paper IGCSE – NOVEMBER 2004 0460 1 © University of Cambridge International Examinations 2005 (c) Views/reasons are likely to be in support of attempts being made to encourage the use of public transport. Reasoning is likely to focus on value of: reducing congestion; saving time; saving transport costs; reduction of accidents; reduction of stress levels; creating more pleasant urban environment; reduction of atmospheric pollution/exhaust fumes; reduction of noise pollution; space saving - less car parks; reward examples used to illustrate up to MAX 2 7 at 1 mark or development [7] TOTAL 25 MARKS Question 3 (a) (i) 3 labels on photograph. 3 at 1 mark [3] (ii) Award 2 marks for description of destructive waves and 2 for constructive waves. The differences do not need to be explicitly stated as they will be implied: Destructive wave high energy/powerful waves erode break with great force over short distance steeply sloping coasts backwash more powerful than swash/strong backwash short wave length break with vertical ellipse Constructive wave low energy/gentle waves deposition friction with sea bed - break some distance from coast gently sloping coasts swash more powerful than backwash/strong swash long wave length break with horizontal ellipse 4 at 1 mark [4] (b) (i) Factors likely to influence wave energy include: wind strength; wind duration; offshore profile/presence of wave cut platform; fetch; type of wave; presence of bays/headlands etc. 2 at 1 mark [2]
Mark scheme, page 10
Page 7 Mark Scheme Syllabus Paper IGCSE – NOVEMBER 2004 0460 1 © University of Cambridge International Examinations 2005 (ii) Award 2 marks for description of hydraulic action and 2 for corrasion. The differences do not need to be explicitly stated as they will be implied: hydraulic action: force/power of breaking waves/hammer effect; compressing of air in crevices; wave retreat air expands; corrasion: waves + boulders/pebbles/sand; attacks base of cliff; abrasive effect etc. 4 at 1 mark [4] (iii) Marks to be awarded on the basis of labelling the following on a diagram/map: wind direction; waves approach beach obliquely; backwash at right angles; zig-zag movement along beach; direction of longshore drift indicated; piling up of beach material where there is an obstruction (N.B. Do not credit written text alone though the use of a key linking with a diagram is acceptable) 4 at 1 mark [4] (c) (i) Accept either the names of processes or description: waves hit cliff; hydraulic action/corrasion/corrosion (MAX 1); undercutting/notch formed; cliff collapse; retreat of cliff line etc. 4 at 1 mark [4] (ii) Description of structure X-Y could include ideas such as: groynes; barriers at right angles to coast, Explanation of how they may reduce longshore drift such as: barrier/obstruction to longshore drift; beach material retained/piles up against groynes; as shown on Fig. 5 - movement left to right, etc. 4 at 1 mark with one mark reserved for description and explanation [4] TOTAL 25 MARKS
Mark scheme, page 11
Page 8 Mark Scheme Syllabus Paper IGCSE – NOVEMBER 2004 0460 1 © University of Cambridge International Examinations 2005 Question 4 (a) (i) Marks to be awarded on the basis of labelling the following on Fig. 6: emergents; canopy/upper storey - 20 to 25 m/continuous canopy; second storey/under storey 10 to 15 m; crowns interlock ; branches found near tops of trees; trunks tall and straight; lianas; epiphytes - anchor on branches and trunks; a variety of tree species; very little undergrowth; buttress roots; ferns, herbs, low growing plants; deciduous trees; examples - meranti, rosewood, mahogany, etc. (N.B. Credit written text alone to MAX 3 though the use of a key linking with a Fig. 6 is acceptable for full marks) 5 at 1 mark [5] (ii) Reasoning such as: seasonal rhythm - lose/replace leaves gradually; high temperatures/rainfall - many species; high temperatures/rainfall - rapid growth; large trees compete for sunlight; buttress roots for support as trees grow upwards for sunlight; canopy - leaves angled to catch as much light as possible; drip tips to shed water; smaller trees below -less sunlight; forest floor - little light/undergrowth, lianas use trees in search for sunlight. 3 at 1 mark [3] (b) (i) Gabon 1 mark [1] (ii) Central African Republic 1 mark [1] (iii) Northern/central/eastern areas 1 mark [1]
Mark scheme, page 12
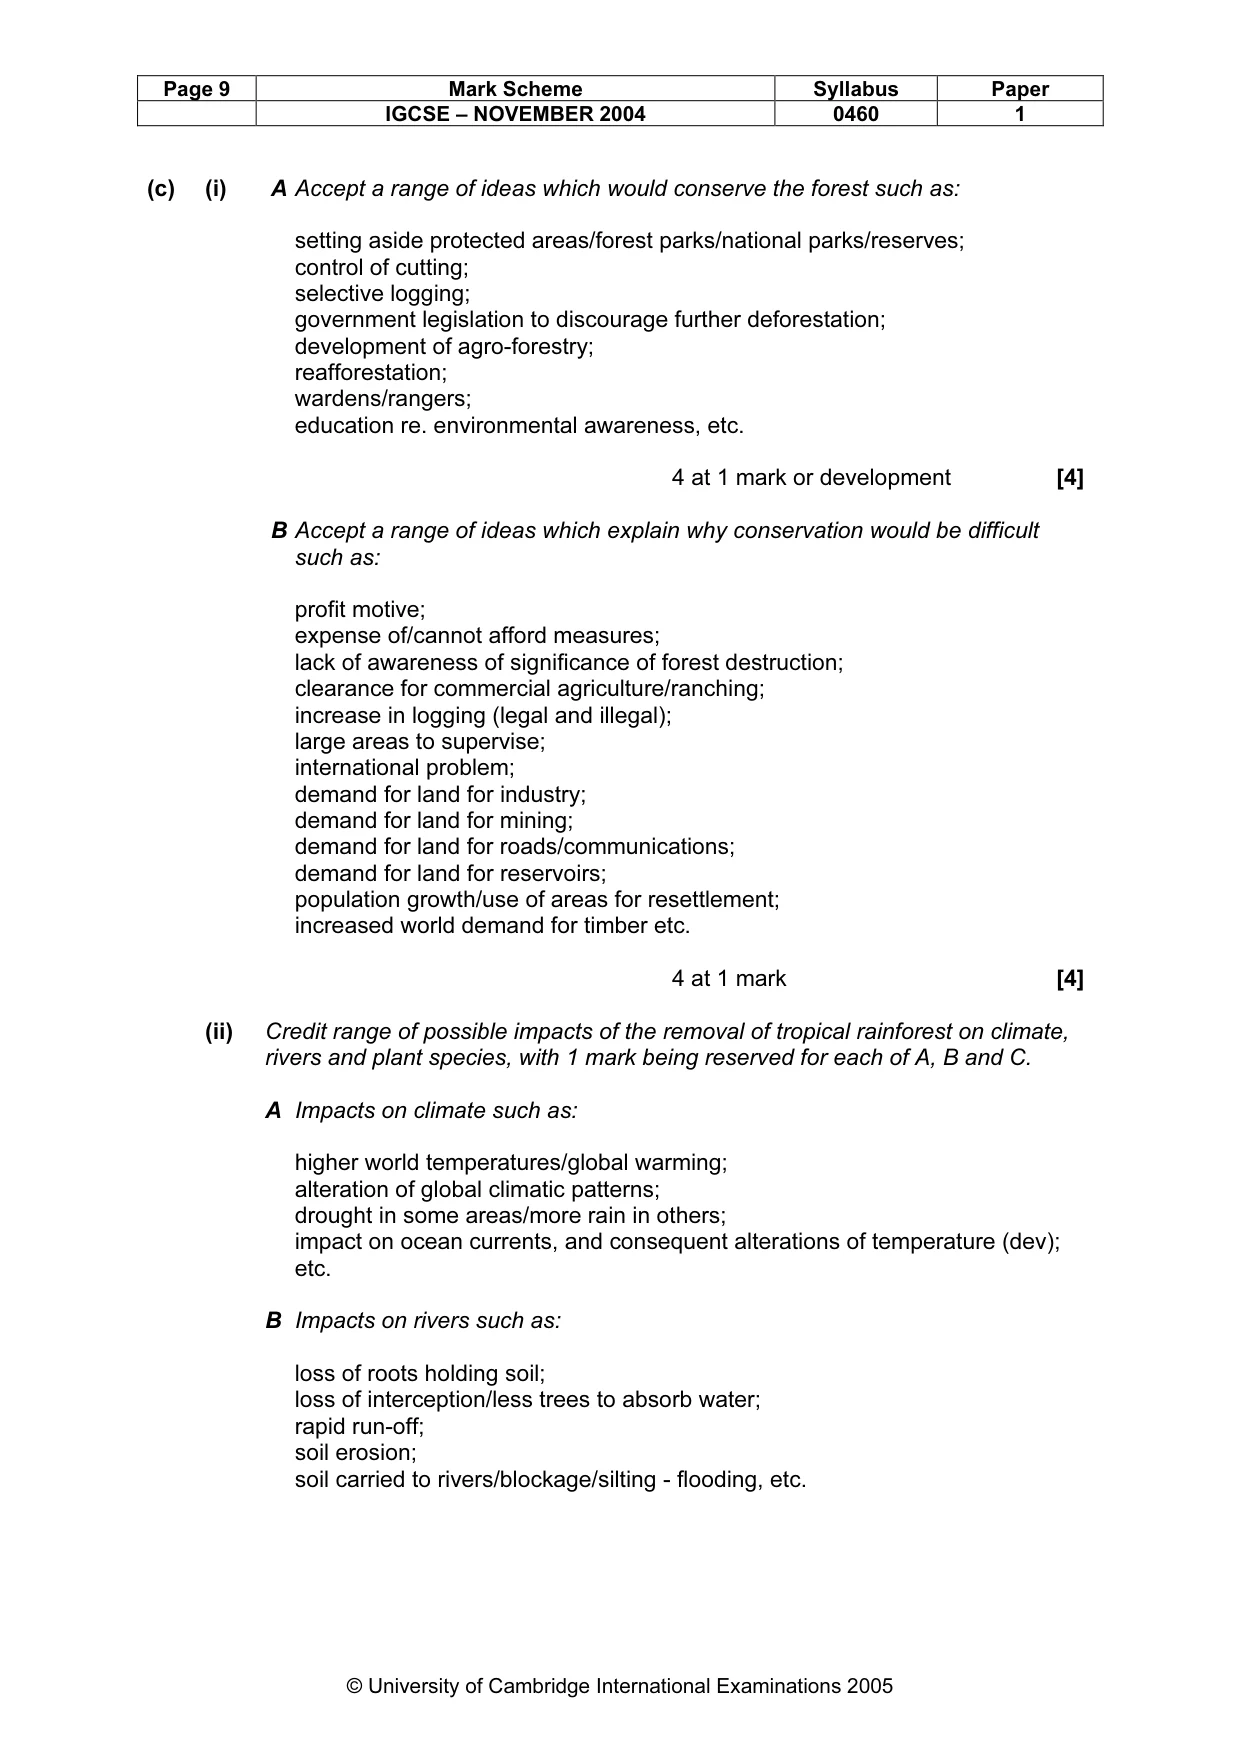
Page 9 Mark Scheme Syllabus Paper IGCSE – NOVEMBER 2004 0460 1 © University of Cambridge International Examinations 2005 (c) (i) A Accept a range of ideas which would conserve the forest such as: setting aside protected areas/forest parks/national parks/reserves; control of cutting; selective logging; government legislation to discourage further deforestation; development of agro-forestry; reafforestation; wardens/rangers; education re. environmental awareness, etc. 4 at 1 mark or development [4] B Accept a range of ideas which explain why conservation would be difficult such as: profit motive; expense of/cannot afford measures; lack of awareness of significance of forest destruction; clearance for commercial agriculture/ranching; increase in logging (legal and illegal); large areas to supervise; international problem; demand for land for industry; demand for land for mining; demand for land for roads/communications; demand for land for reservoirs; population growth/use of areas for resettlement; increased world demand for timber etc. 4 at 1 mark [4] (ii) Credit range of possible impacts of the removal of tropical rainforest on climate, rivers and plant species, with 1 mark being reserved for each of A, B and C. A Impacts on climate such as: higher world temperatures/global warming; alteration of global climatic patterns; drought in some areas/more rain in others; impact on ocean currents, and consequent alterations of temperature (dev); etc. B Impacts on rivers such as: loss of roots holding soil; loss of interception/less trees to absorb water; rapid run-off; soil erosion; soil carried to rivers/blockage/silting - flooding, etc.
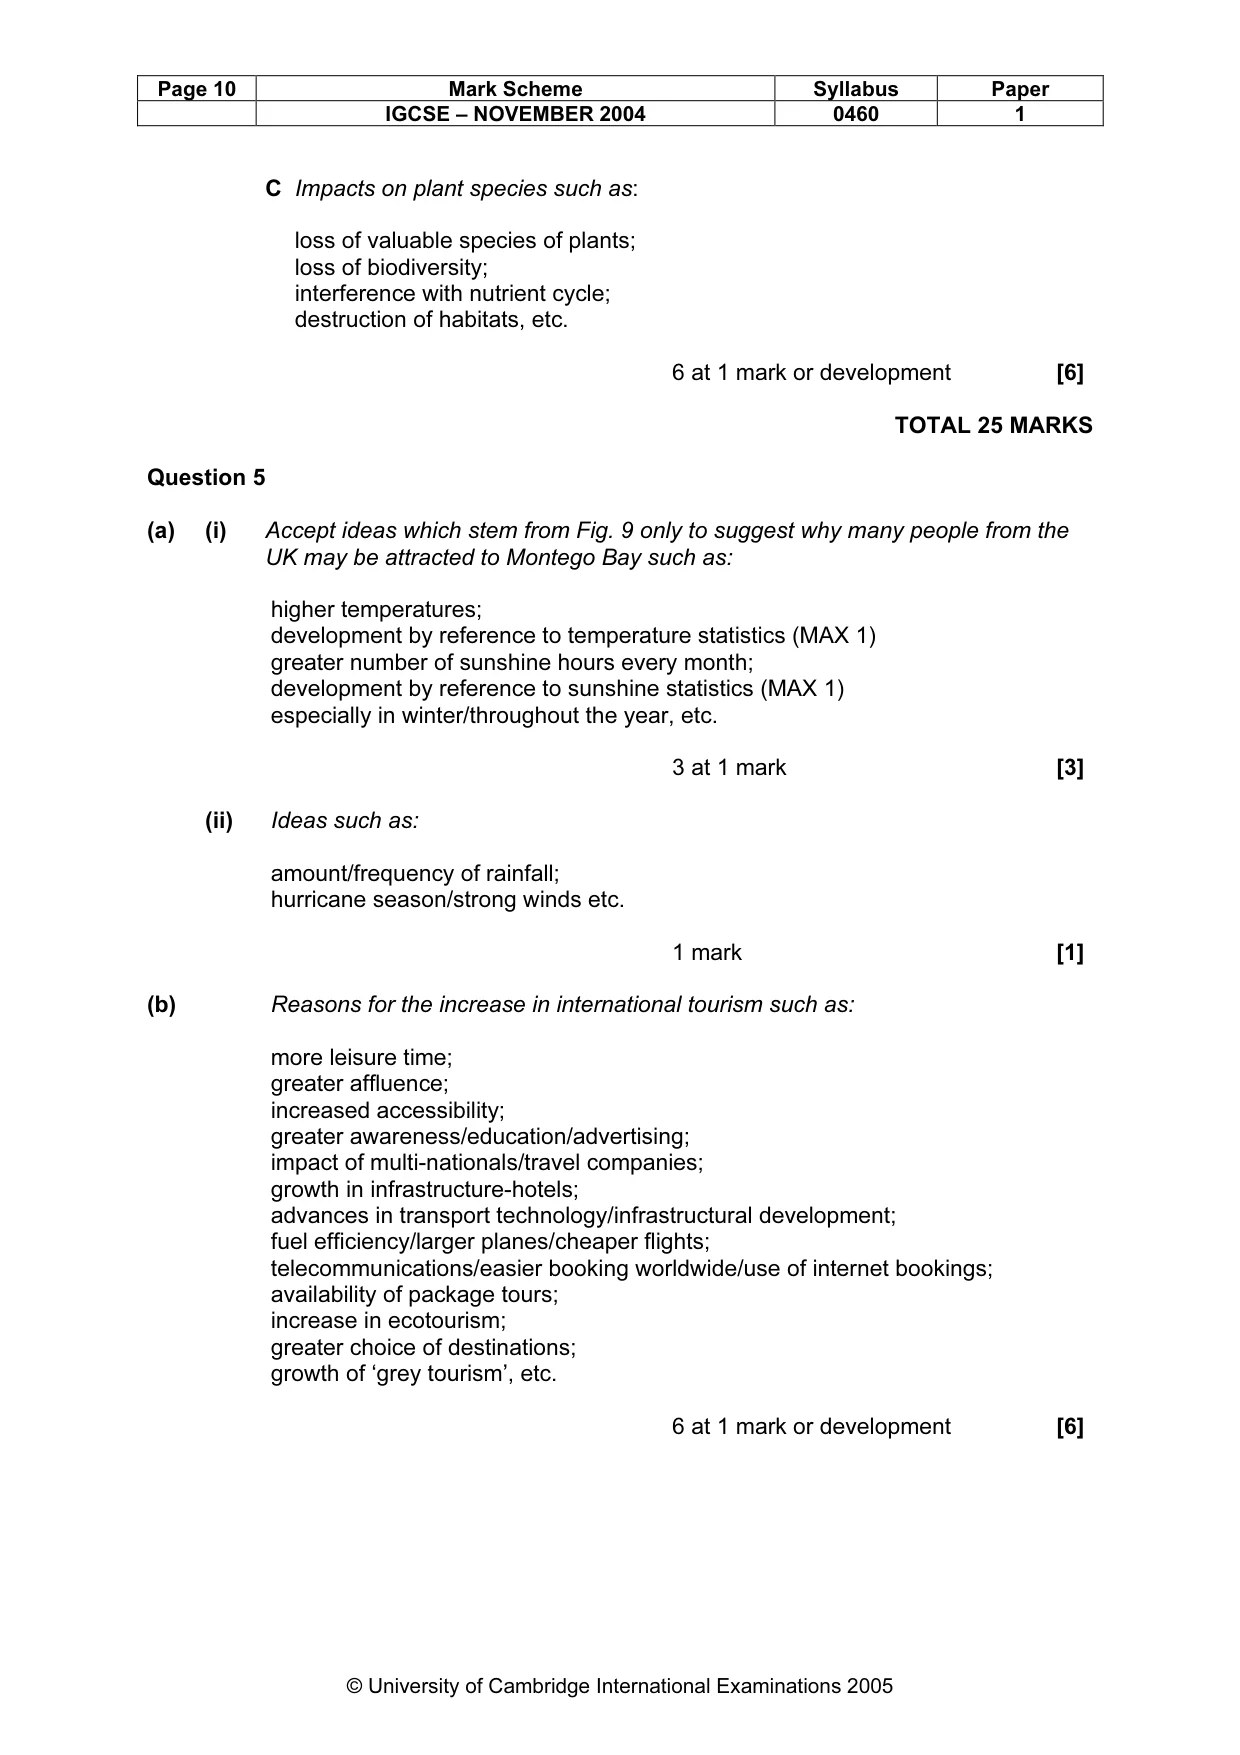
Mark scheme, page 13
Page 10 Mark Scheme Syllabus Paper IGCSE – NOVEMBER 2004 0460 1 © University of Cambridge International Examinations 2005 C Impacts on plant species such as: loss of valuable species of plants; loss of biodiversity; interference with nutrient cycle; destruction of habitats, etc. 6 at 1 mark or development [6] TOTAL 25 MARKS Question 5 (a) (i) Accept ideas which stem from Fig. 9 only to suggest why many people from the UK may be attracted to Montego Bay such as: higher temperatures; development by reference to temperature statistics (MAX 1) greater number of sunshine hours every month; development by reference to sunshine statistics (MAX 1) especially in winter/throughout the year, etc. 3 at 1 mark [3] (ii) Ideas such as: amount/frequency of rainfall; hurricane season/strong winds etc. 1 mark [1] (b) Reasons for the increase in international tourism such as: more leisure time; greater affluence; increased accessibility; greater awareness/education/advertising; impact of multi-nationals/travel companies; growth in infrastructure-hotels; advances in transport technology/infrastructural development; fuel efficiency/larger planes/cheaper flights; telecommunications/easier booking worldwide/use of internet bookings; availability of package tours; increase in ecotourism; greater choice of destinations; growth of ‘grey tourism’, etc. 6 at 1 mark or development [6]
Mark scheme, page 14
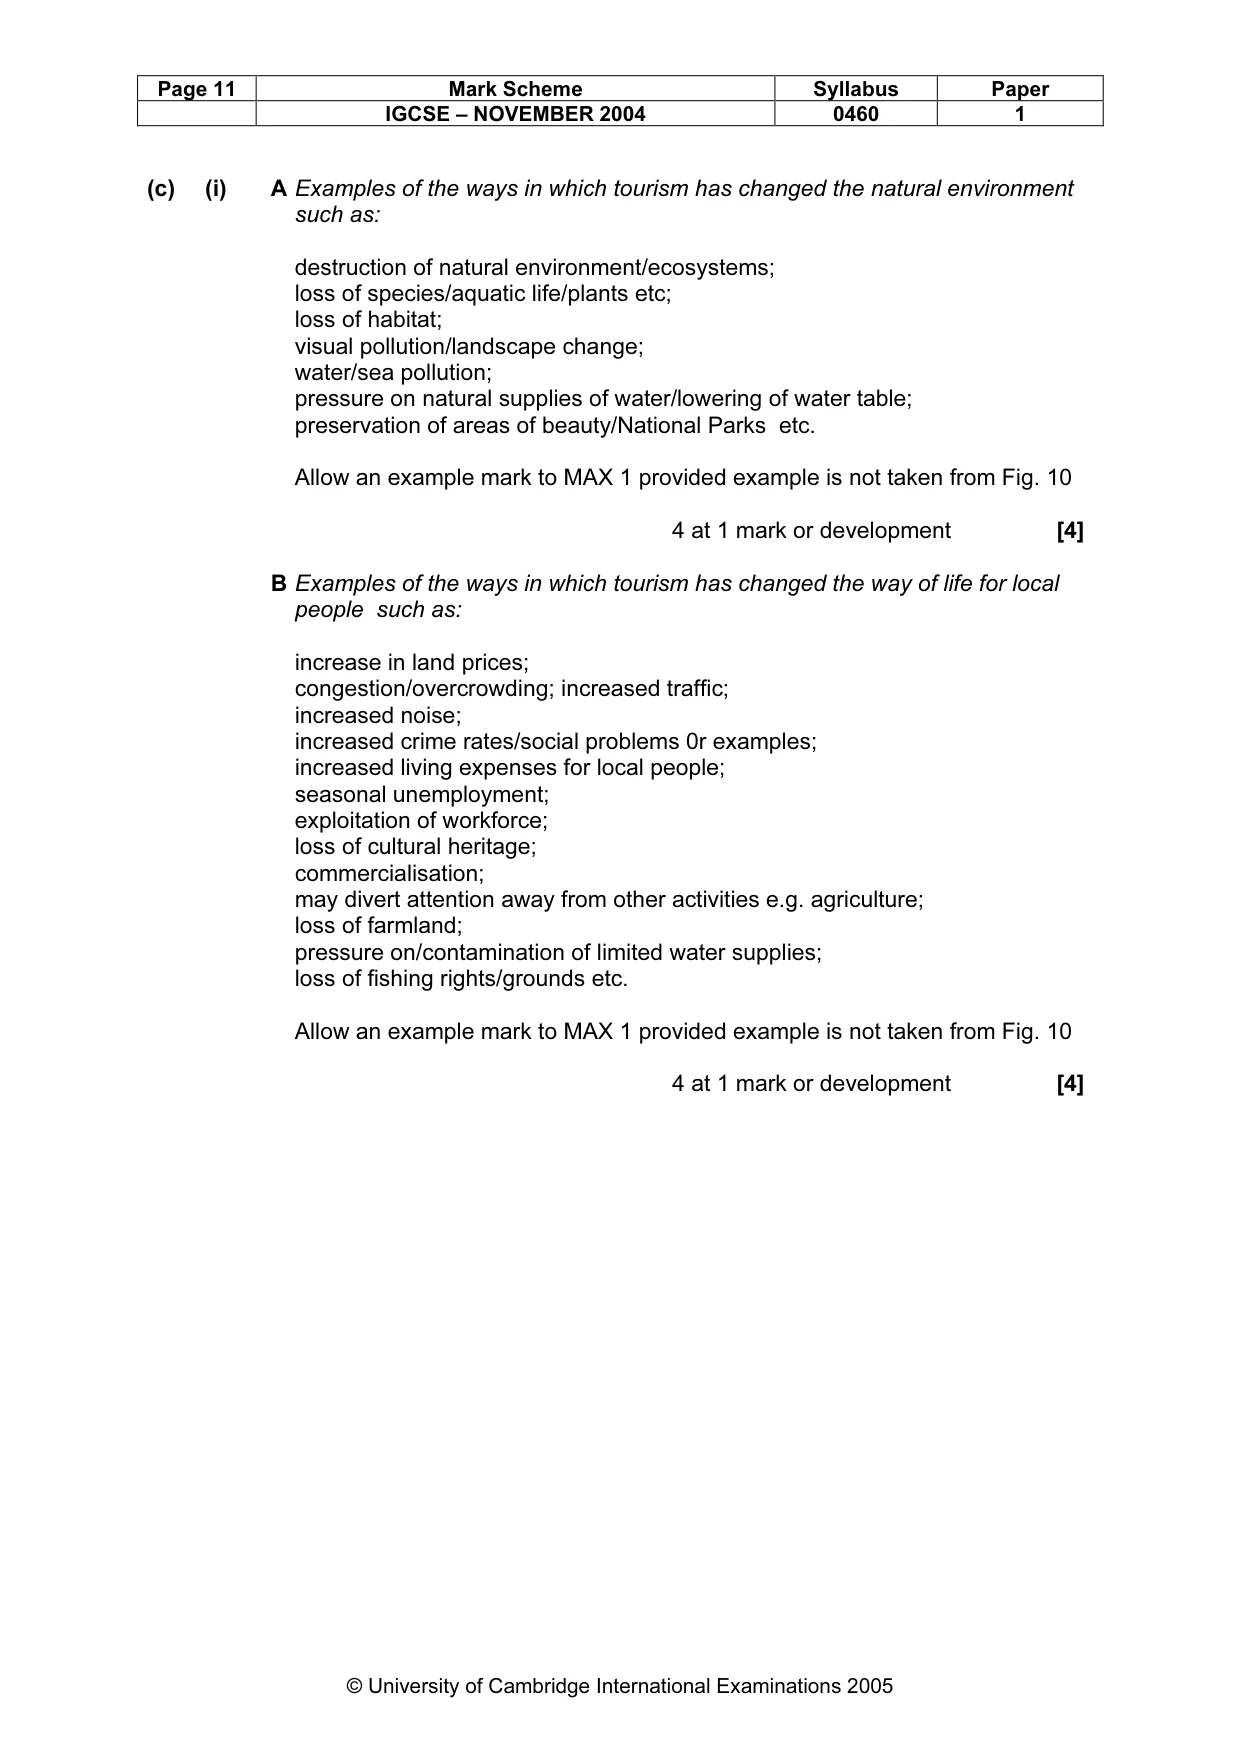
Page 11 Mark Scheme Syllabus Paper IGCSE – NOVEMBER 2004 0460 1 © University of Cambridge International Examinations 2005 (c) (i) A Examples of the ways in which tourism has changed the natural environment such as: destruction of natural environment/ecosystems; loss of species/aquatic life/plants etc; loss of habitat; visual pollution/landscape change; water/sea pollution; pressure on natural supplies of water/lowering of water table; preservation of areas of beauty/National Parks etc. Allow an example mark to MAX 1 provided example is not taken from Fig. 10 4 at 1 mark or development [4] B Examples of the ways in which tourism has changed the way of life for local people such as: increase in land prices; congestion/overcrowding; increased traffic; increased noise; increased crime rates/social problems 0r examples; increased living expenses for local people; seasonal unemployment; exploitation of workforce; loss of cultural heritage; commercialisation; may divert attention away from other activities e.g. agriculture; loss of farmland; pressure on/contamination of limited water supplies; loss of fishing rights/grounds etc. Allow an example mark to MAX 1 provided example is not taken from Fig. 10 4 at 1 mark or development [4]
Mark scheme, page 15
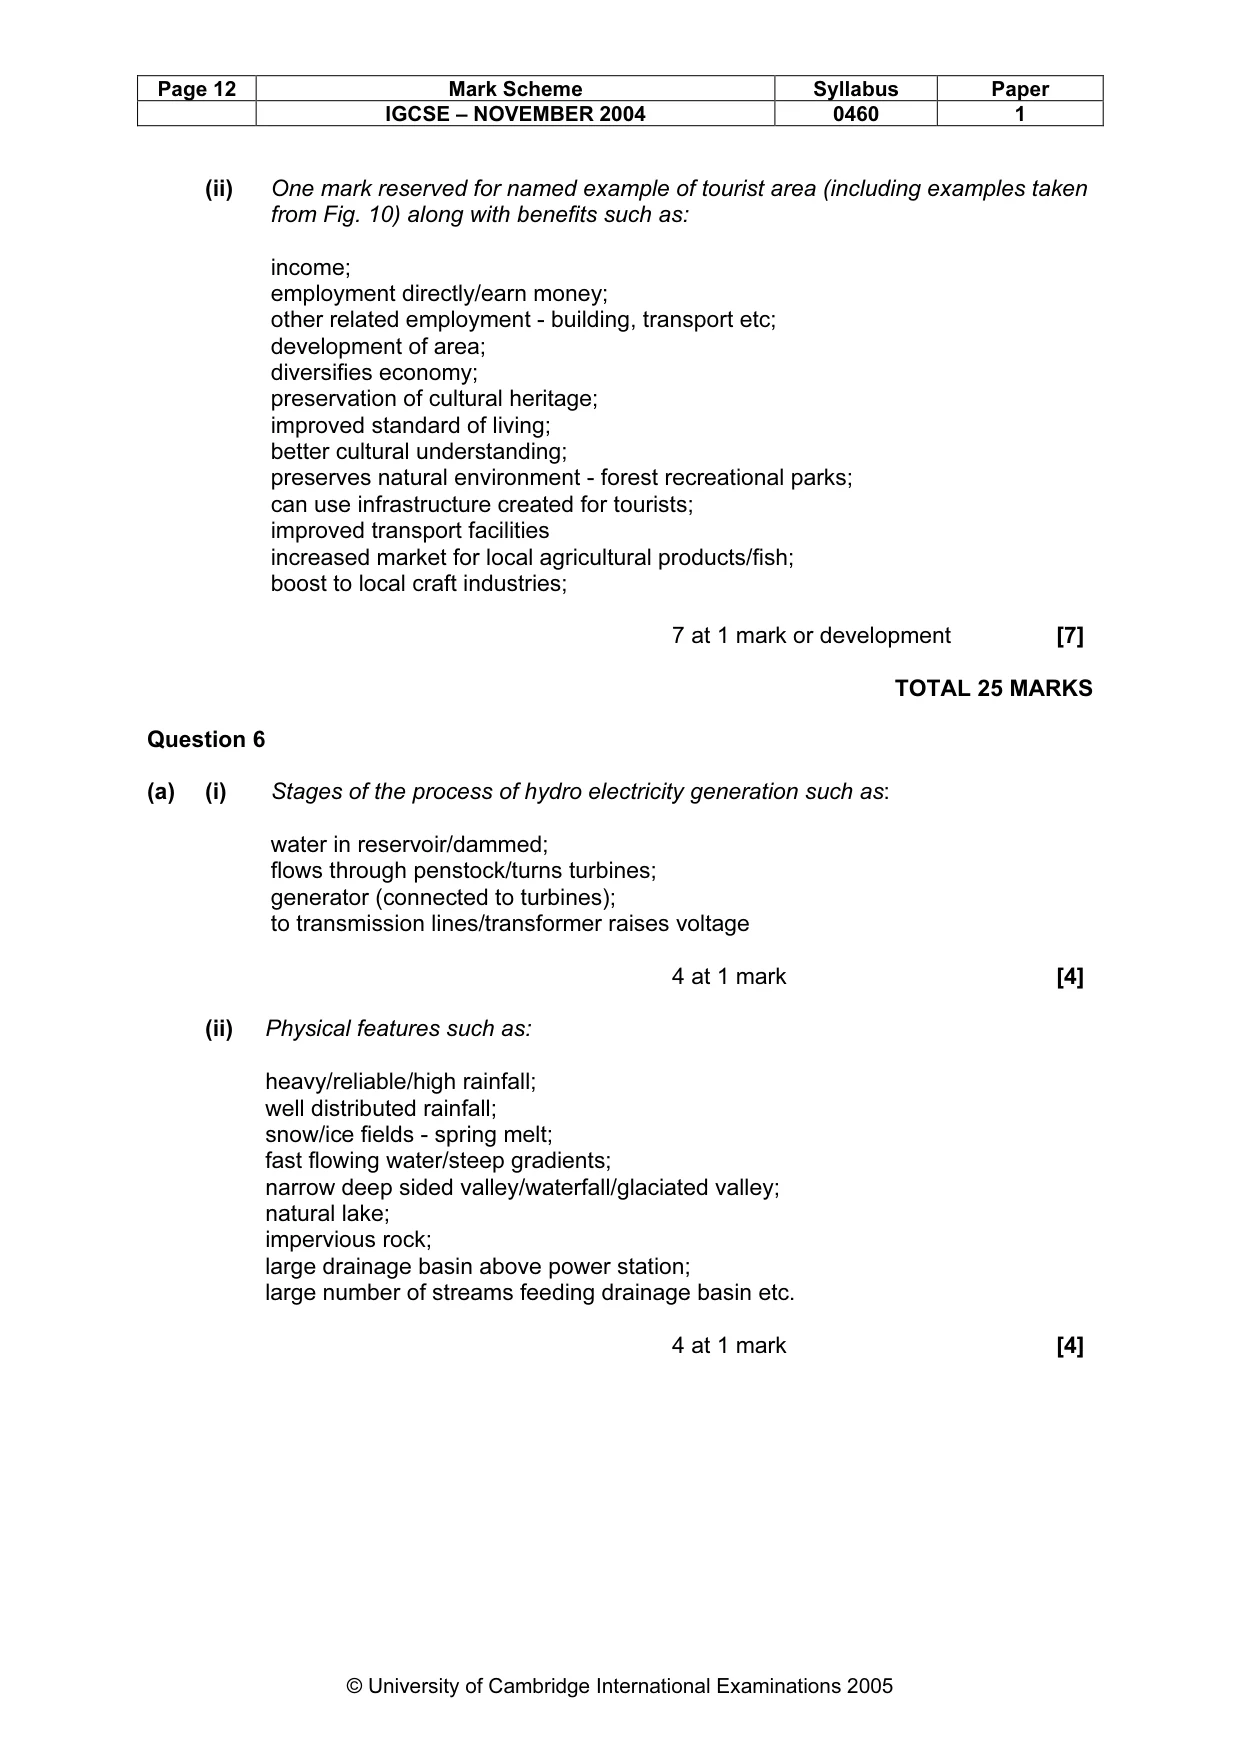
Page 12 Mark Scheme Syllabus Paper IGCSE – NOVEMBER 2004 0460 1 © University of Cambridge International Examinations 2005 (ii) One mark reserved for named example of tourist area (including examples taken from Fig. 10) along with benefits such as: income; employment directly/earn money; other related employment - building, transport etc; development of area; diversifies economy; preservation of cultural heritage; improved standard of living; better cultural understanding; preserves natural environment - forest recreational parks; can use infrastructure created for tourists; improved transport facilities increased market for local agricultural products/fish; boost to local craft industries; 7 at 1 mark or development [7] TOTAL 25 MARKS Question 6 (a) (i) Stages of the process of hydro electricity generation such as: water in reservoir/dammed; flows through penstock/turns turbines; generator (connected to turbines); to transmission lines/transformer raises voltage 4 at 1 mark [4] (ii) Physical features such as: heavy/reliable/high rainfall; well distributed rainfall; snow/ice fields - spring melt; fast flowing water/steep gradients; narrow deep sided valley/waterfall/glaciated valley; natural lake; impervious rock; large drainage basin above power station; large number of streams feeding drainage basin etc. 4 at 1 mark [4]
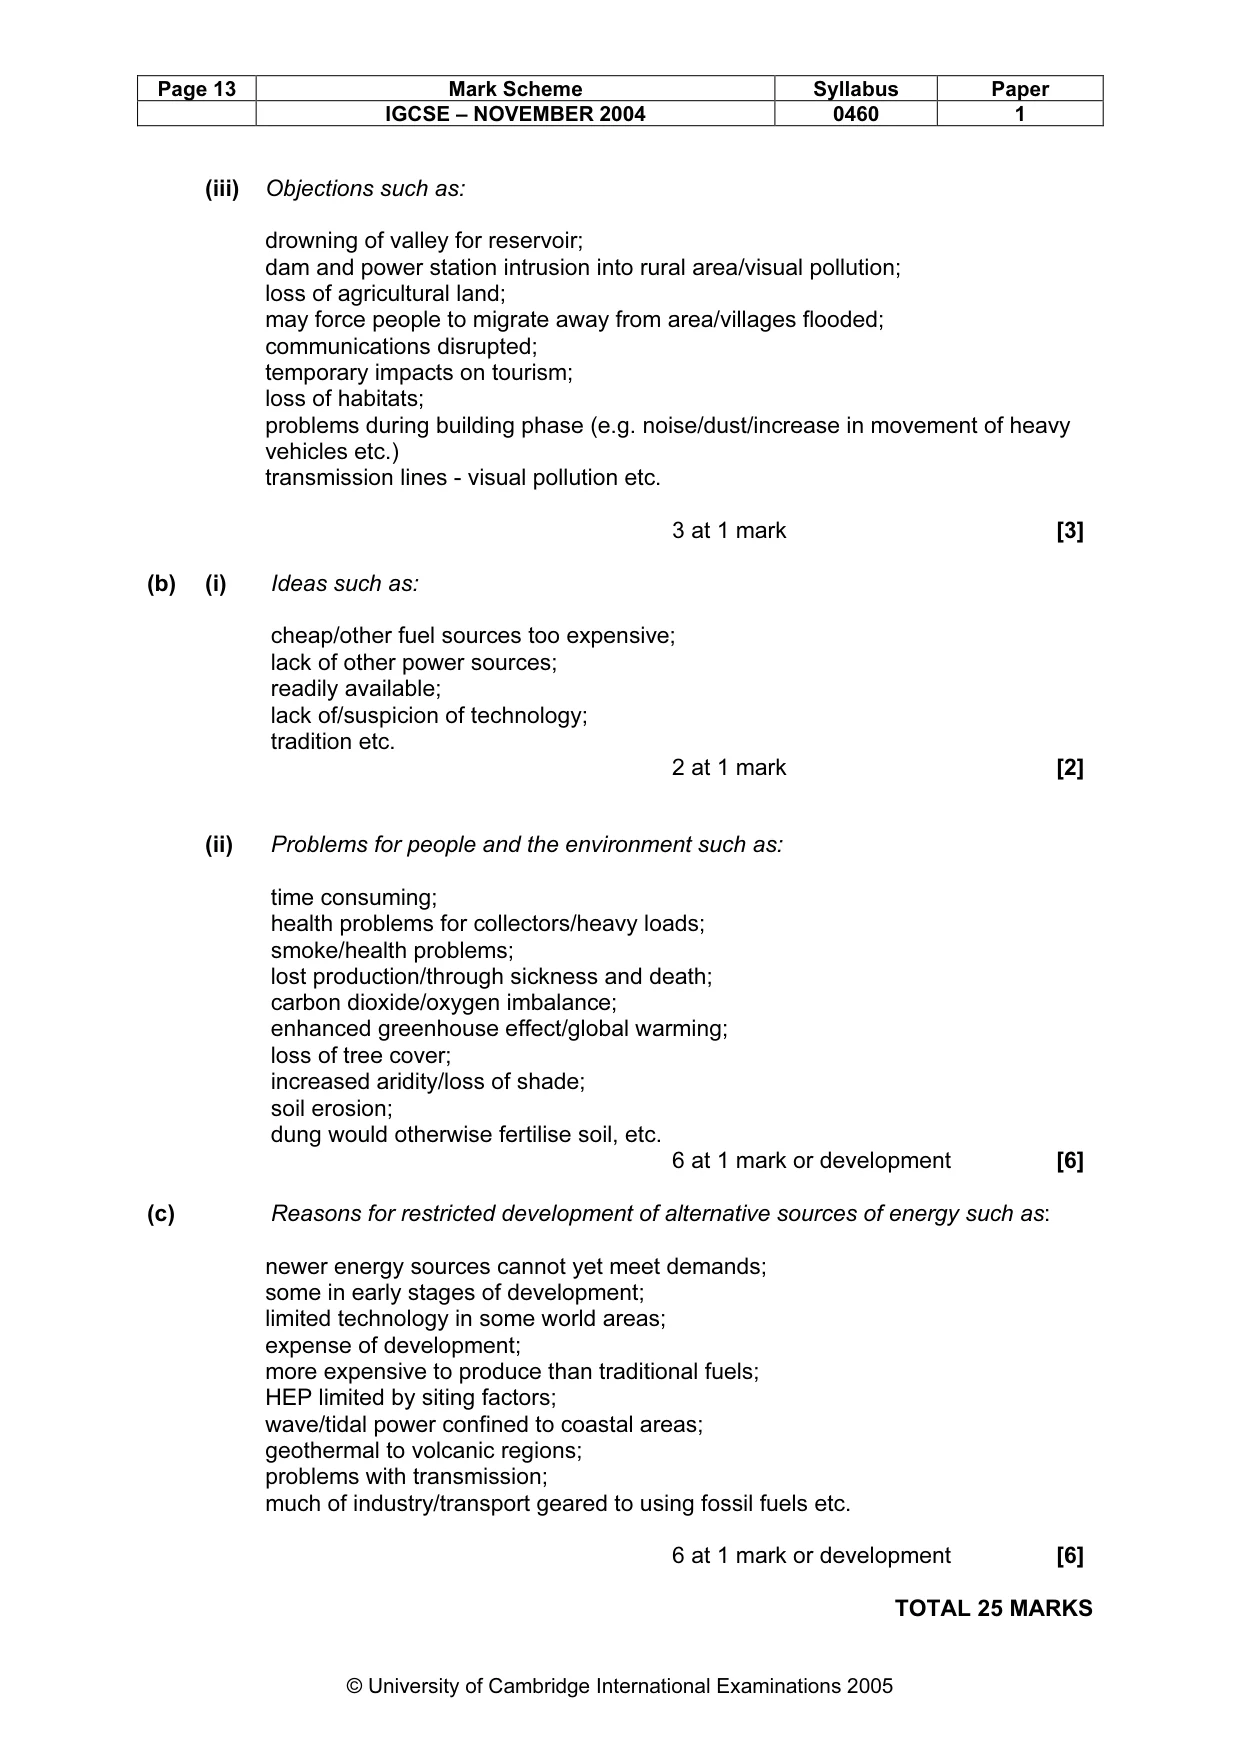
Mark scheme, page 16
Page 13 Mark Scheme Syllabus Paper IGCSE – NOVEMBER 2004 0460 1 © University of Cambridge International Examinations 2005 (iii) Objections such as: drowning of valley for reservoir; dam and power station intrusion into rural area/visual pollution; loss of agricultural land; may force people to migrate away from area/villages flooded; communications disrupted; temporary impacts on tourism; loss of habitats; problems during building phase (e.g. noise/dust/increase in movement of heavy vehicles etc.) transmission lines - visual pollution etc. 3 at 1 mark [3] (b) (i) Ideas such as: cheap/other fuel sources too expensive; lack of other power sources; readily available; lack of/suspicion of technology; tradition etc. 2 at 1 mark [2] (ii) Problems for people and the environment such as: time consuming; health problems for collectors/heavy loads; smoke/health problems; lost production/through sickness and death; carbon dioxide/oxygen imbalance; enhanced greenhouse effect/global warming; loss of tree cover; increased aridity/loss of shade; soil erosion; dung would otherwise fertilise soil, etc. 6 at 1 mark or development [6] (c) Reasons for restricted development of alternative sources of energy such as: newer energy sources cannot yet meet demands; some in early stages of development; limited technology in some world areas; expense of development; more expensive to produce than traditional fuels; HEP limited by siting factors; wave/tidal power confined to coastal areas; geothermal to volcanic regions; problems with transmission; much of industry/transport geared to using fossil fuels etc. 6 at 1 mark or development [6] TOTAL 25 MARKS