Cambridge IGCSE Environmental Management 0680 — 2016 Oct/Nov Paper 1 · Variant 1
0680/11/O/N/16 · 60 marks · ≈68 min
The question paper and its mark scheme, free to read here and free to download. This is Cambridge’s own paper, exactly as it was sat.
Question paper16 pages
Mark scheme7 pages
Answers below. Sit the paper first if you are practising.
Paper as text
Question paper, page 1
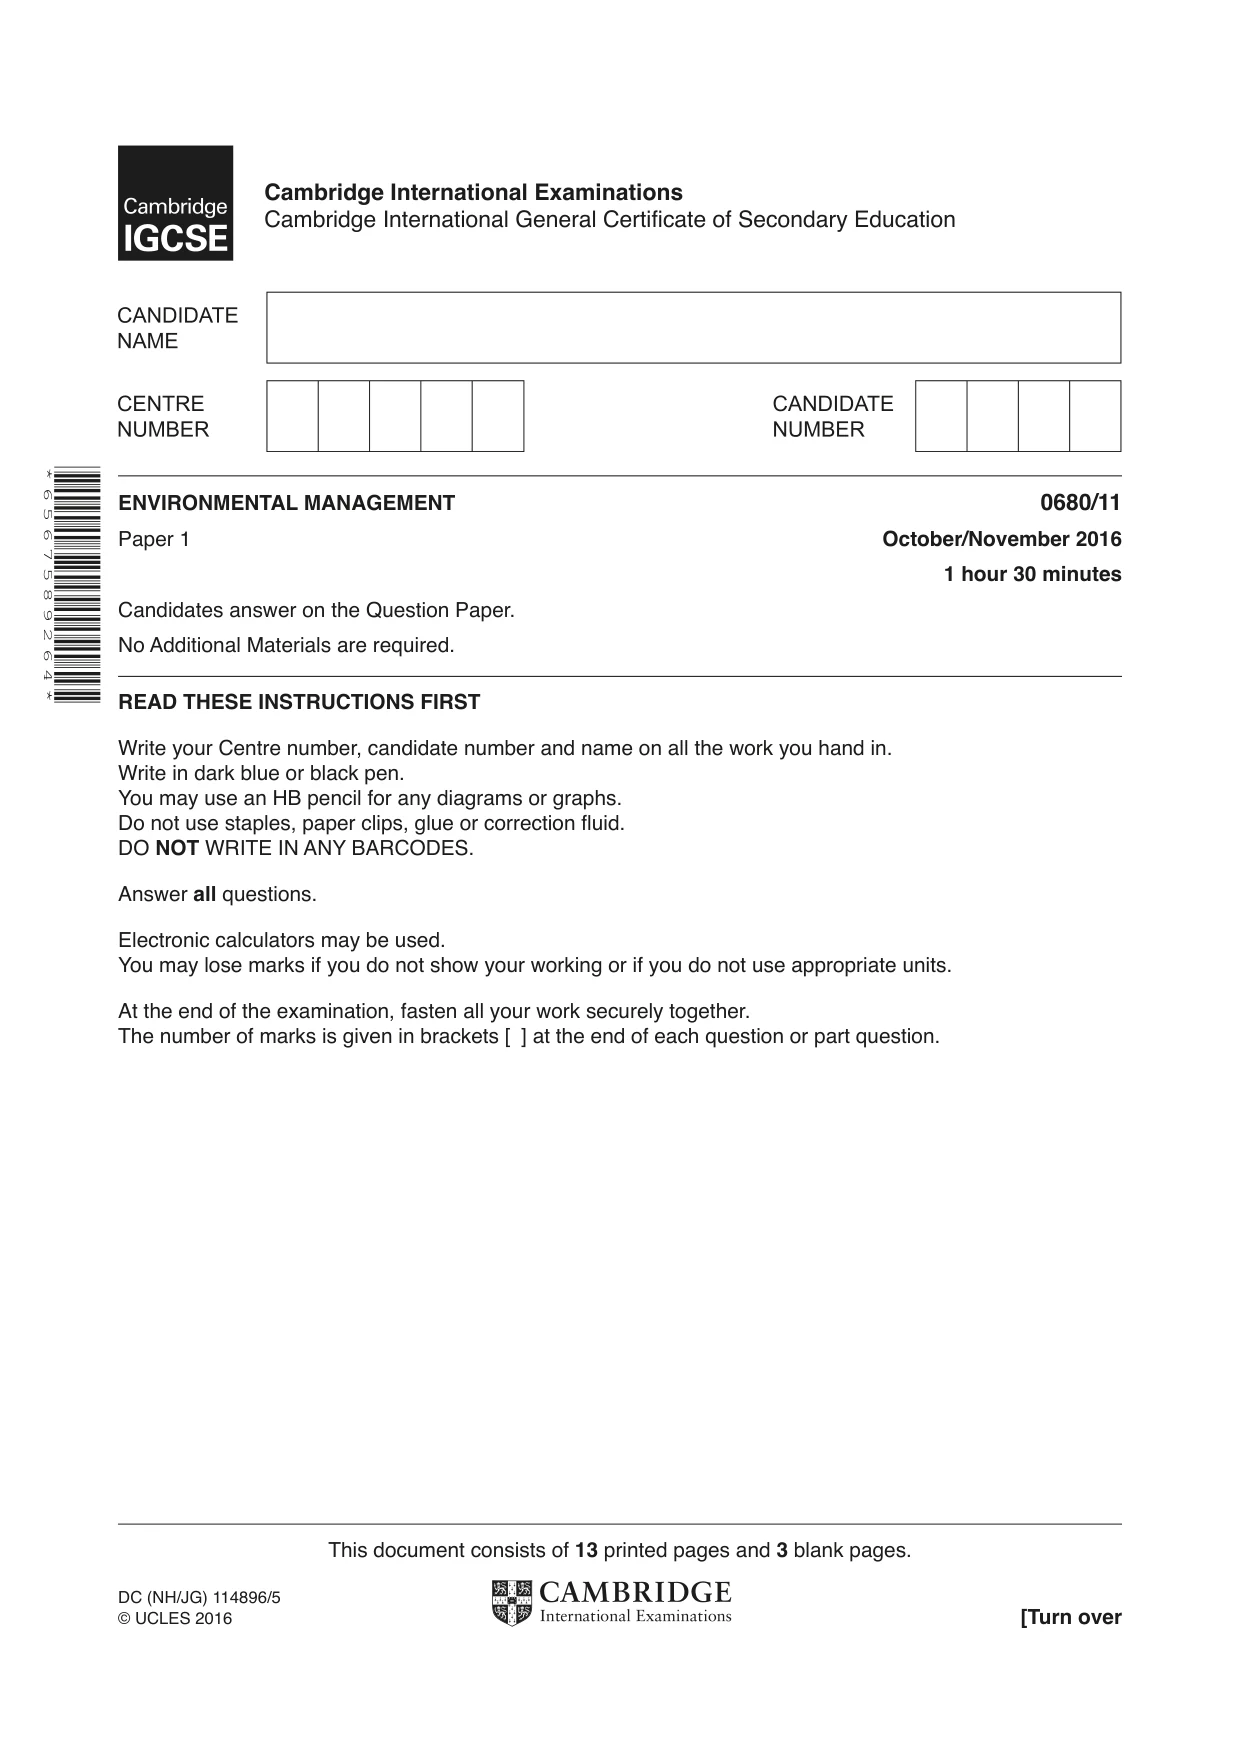
This document consists of 13 printed pages and 3 blank pages. DC (NH/JG) 114896/5 © UCLES 2016 [Turn over * 6 5 6 7 5 8 9 2 6 4 * ENVIRONMENTAL MANAGEMENT 0680/11 Paper 1 October/November 2016 1 hour 30 minutes Candidates answer on the Question Paper. No Additional Materials are required. READ THESE INSTRUCTIONS FIRST Write your Centre number, candidate number and name on all the work you hand in. Write in dark blue or black pen. You may use an HB pencil for any diagrams or graphs. Do not use staples, paper clips, glue or correction fluid. DO NOT WRITE IN ANY BARCODES. Answer all questions. Electronic calculators may be used. You may lose marks if you do not show your working or if you do not use appropriate units. At the end of the examination, fasten all your work securely together. The number of marks is given in brackets [ ] at the end of each question or part question. Cambridge International Examinations Cambridge International General Certificate of Secondary Education
Question paper, page 2
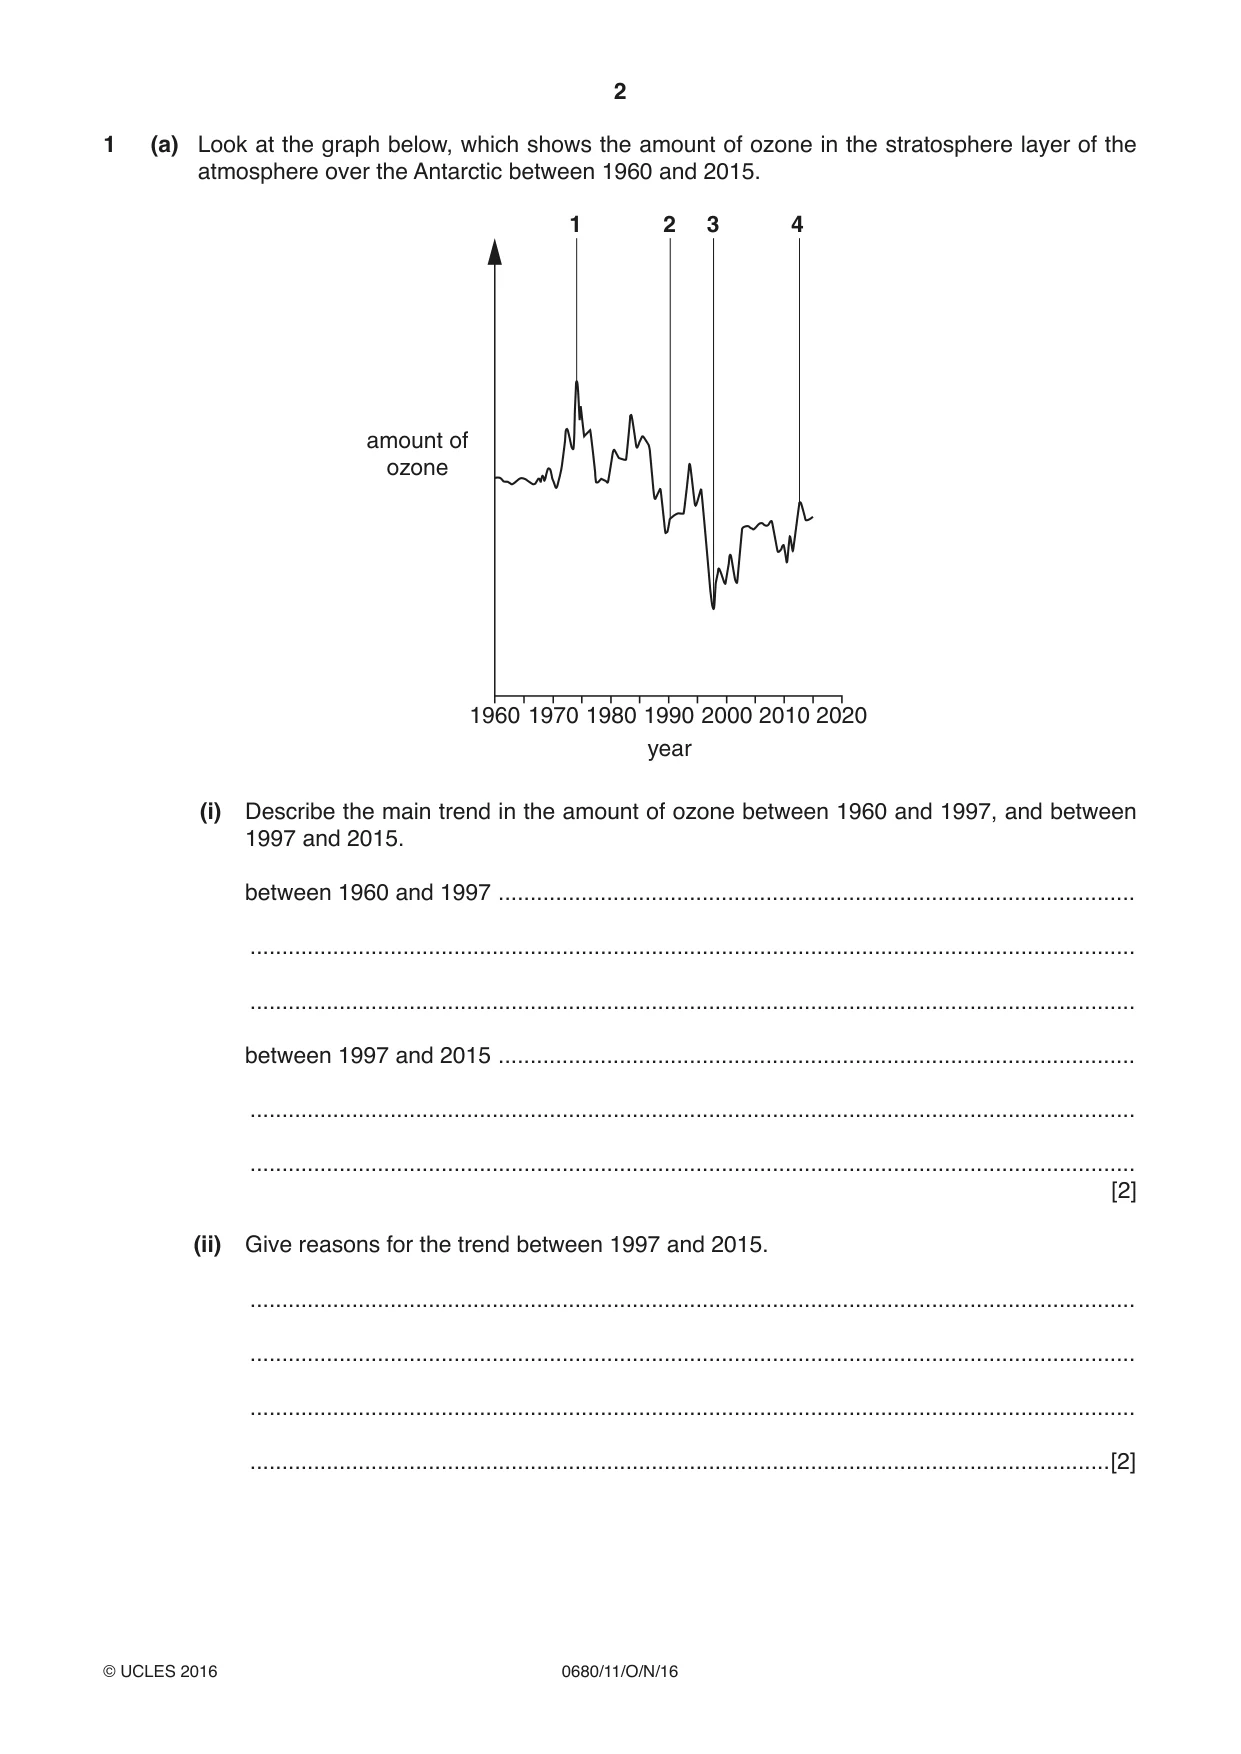
2 0680/11/O/N/16 © UCLES 2016 1 (a) Look at the graph below, which shows the amount of ozone in the stratosphere layer of the atmosphere over the Antarctic between 1960 and 2015. 1960 1970 1980 year 1990 2000 2010 2020 amount of ozone 1 2 3 4 (i) Describe the main trend in the amount of ozone between 1960 and 1997, and between 1997 and 2015. between 1960 and 1997 … … … between 1997 and 2015 … … … [2] (ii) Give reasons for the trend between 1997 and 2015. … … … …[2]
Question paper, page 3
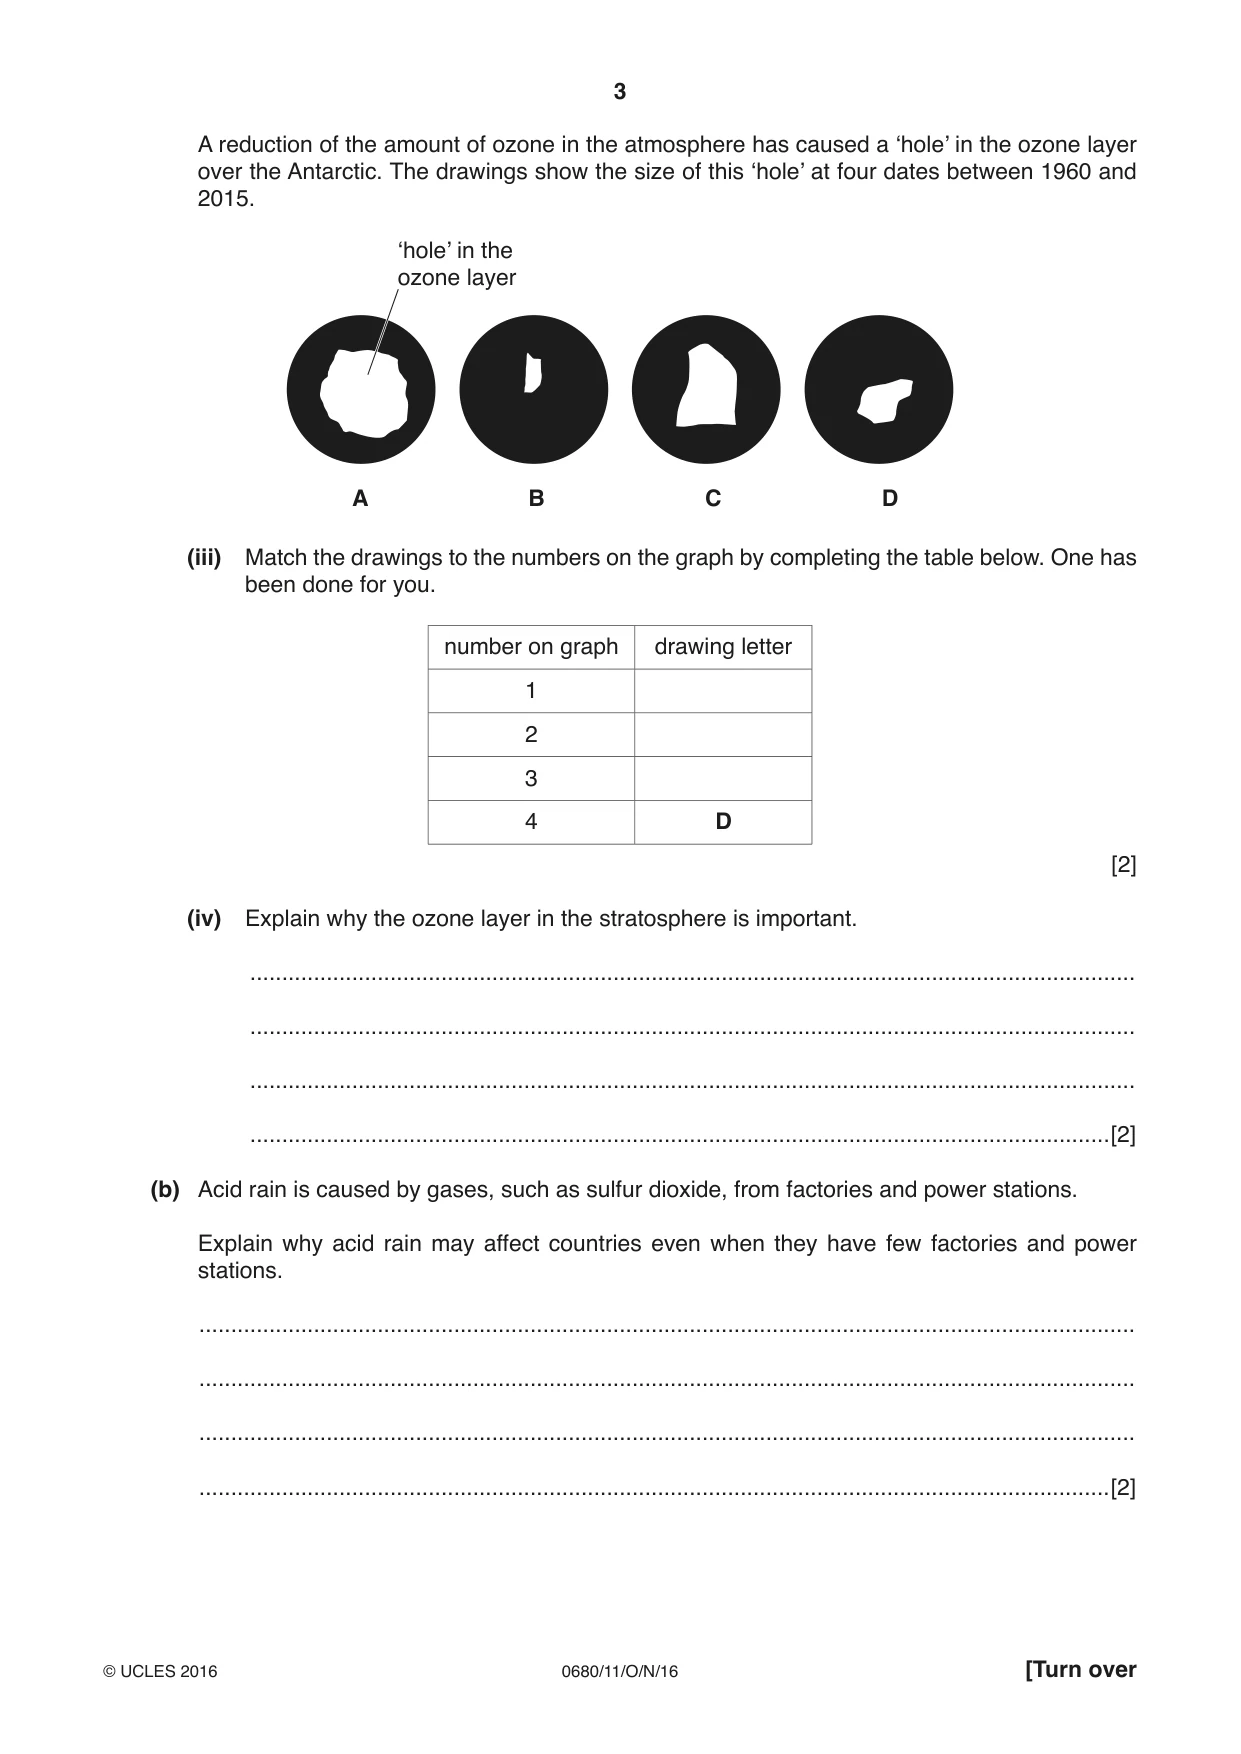
3 0680/11/O/N/16 © UCLES 2016 [Turn over A reduction of the amount of ozone in the atmosphere has caused a ‘hole’ in the ozone layer over the Antarctic. The drawings show the size of this ‘hole’ at four dates between 1960 and 2015. ‘hole’ in the ozone layer A B C D (iii) Match the drawings to the numbers on the graph by completing the table below. One has been done for you. number on graph drawing letter 1 2 3 4 D [2] (iv) Explain why the ozone layer in the stratosphere is important. … … … …[2] (b) Acid rain is caused by gases, such as sulfur dioxide, from factories and power stations. Explain why acid rain may affect countries even when they have few factories and power stations. … … … …[2]
Question paper, page 4
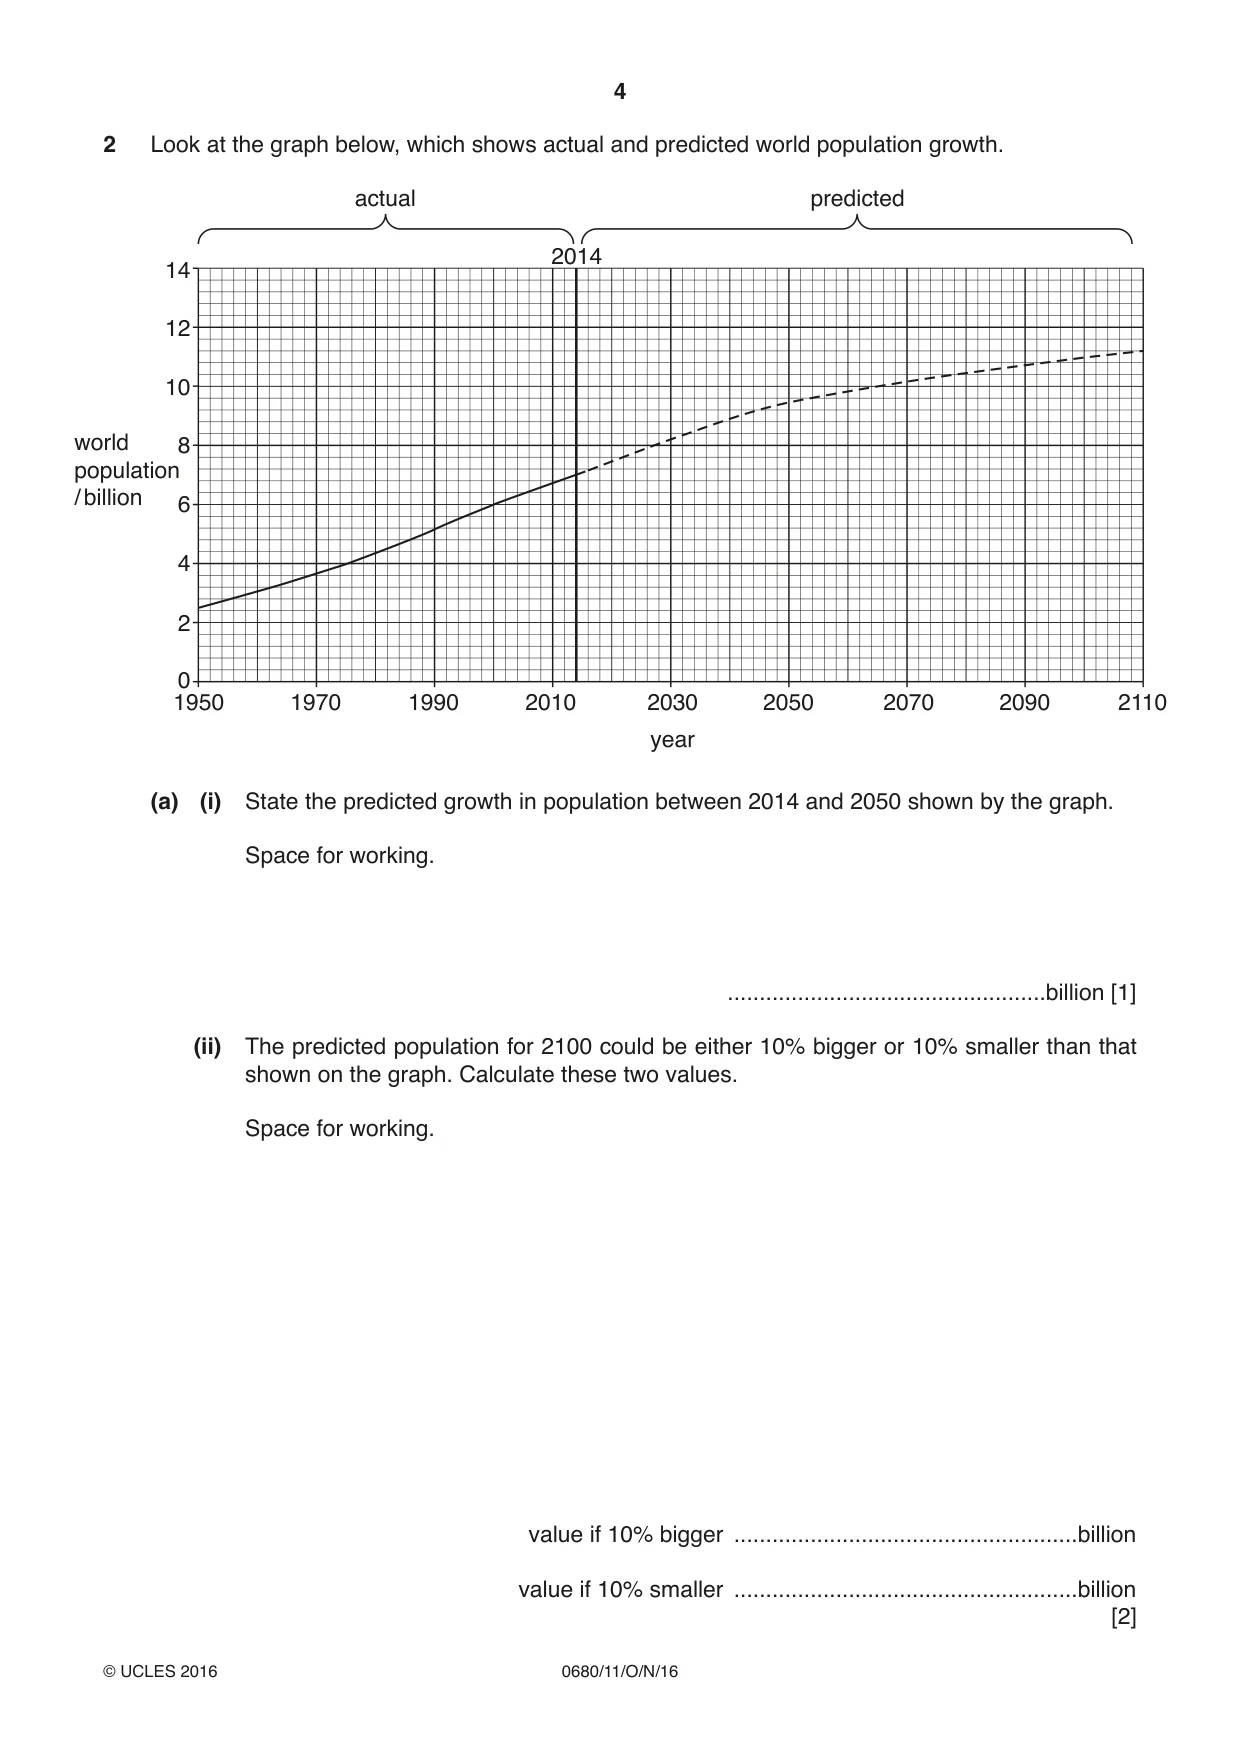
4 0680/11/O/N/16 © UCLES 2016 2 Look at the graph below, which shows actual and predicted world population growth. actual predicted 1950 1990 2010 2014 2030 year 2050 2090 2070 2110 1970 0 2 4 6 8 10 12 14 world population / billion (a) (i) State the predicted growth in population between 2014 and 2050 shown by the graph. Space for working. …billion [1] (ii) The predicted population for 2100 could be either 10% bigger or 10% smaller than that shown on the graph. Calculate these two values. Space for working. value if 10% bigger …billion value if 10% smaller …billion [2]
Question paper, page 5
5 0680/11/O/N/16 © UCLES 2016 [Turn over (iii) Describe two impacts of population growth on the natural environment. … … … … … … … …[4] (b) Describe two strategies for managing population growth. … … … … … …[3]
Question paper, page 6
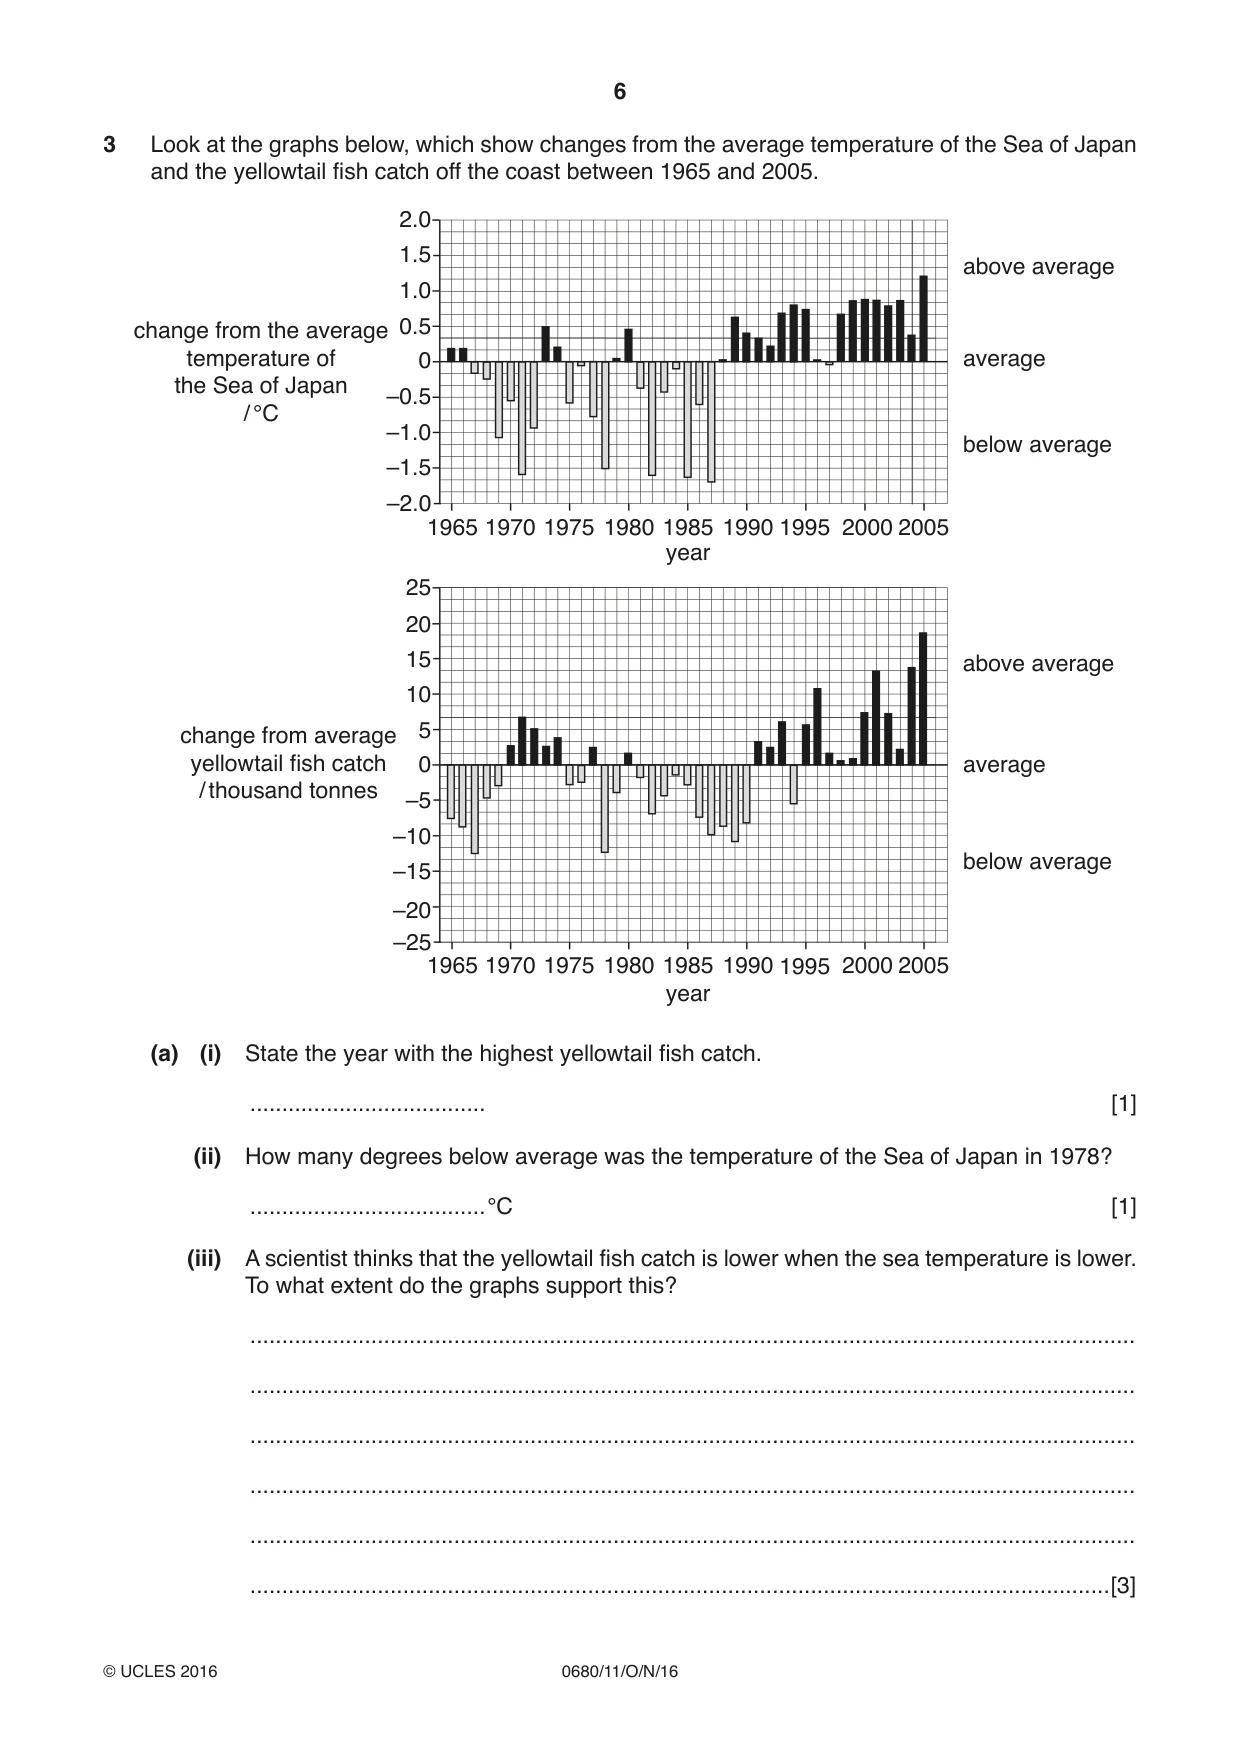
6 0680/11/O/N/16 © UCLES 2016 3 Look at the graphs below, which show changes from the average temperature of the Sea of Japan and the yellowtail fish catch off the coast between 1965 and 2005. –25 –20 –15 –10 –5 0 5 15 10 20 25 1965 1970 1975 1980 1985 year 1990 1995 2000 2005 change from average yellowtail fish catch / thousand tonnes 1965 1970 1975 1980 1985 year 1990 1995 2000 2005 above average below average average above average below average average change from the average temperature of the Sea of Japan / °C –2.0 –1.5 –1.0 –0.5 0 0.5 1.0 1.5 2.0 (a) (i) State the year with the highest yellowtail fish catch. … [1] (ii) How many degrees below average was the temperature of the Sea of Japan in 1978? …°C [1] (iii) A scientist thinks that the yellowtail fish catch is lower when the sea temperature is lower. To what extent do the graphs support this? … … … … … …[3]
Question paper, page 7
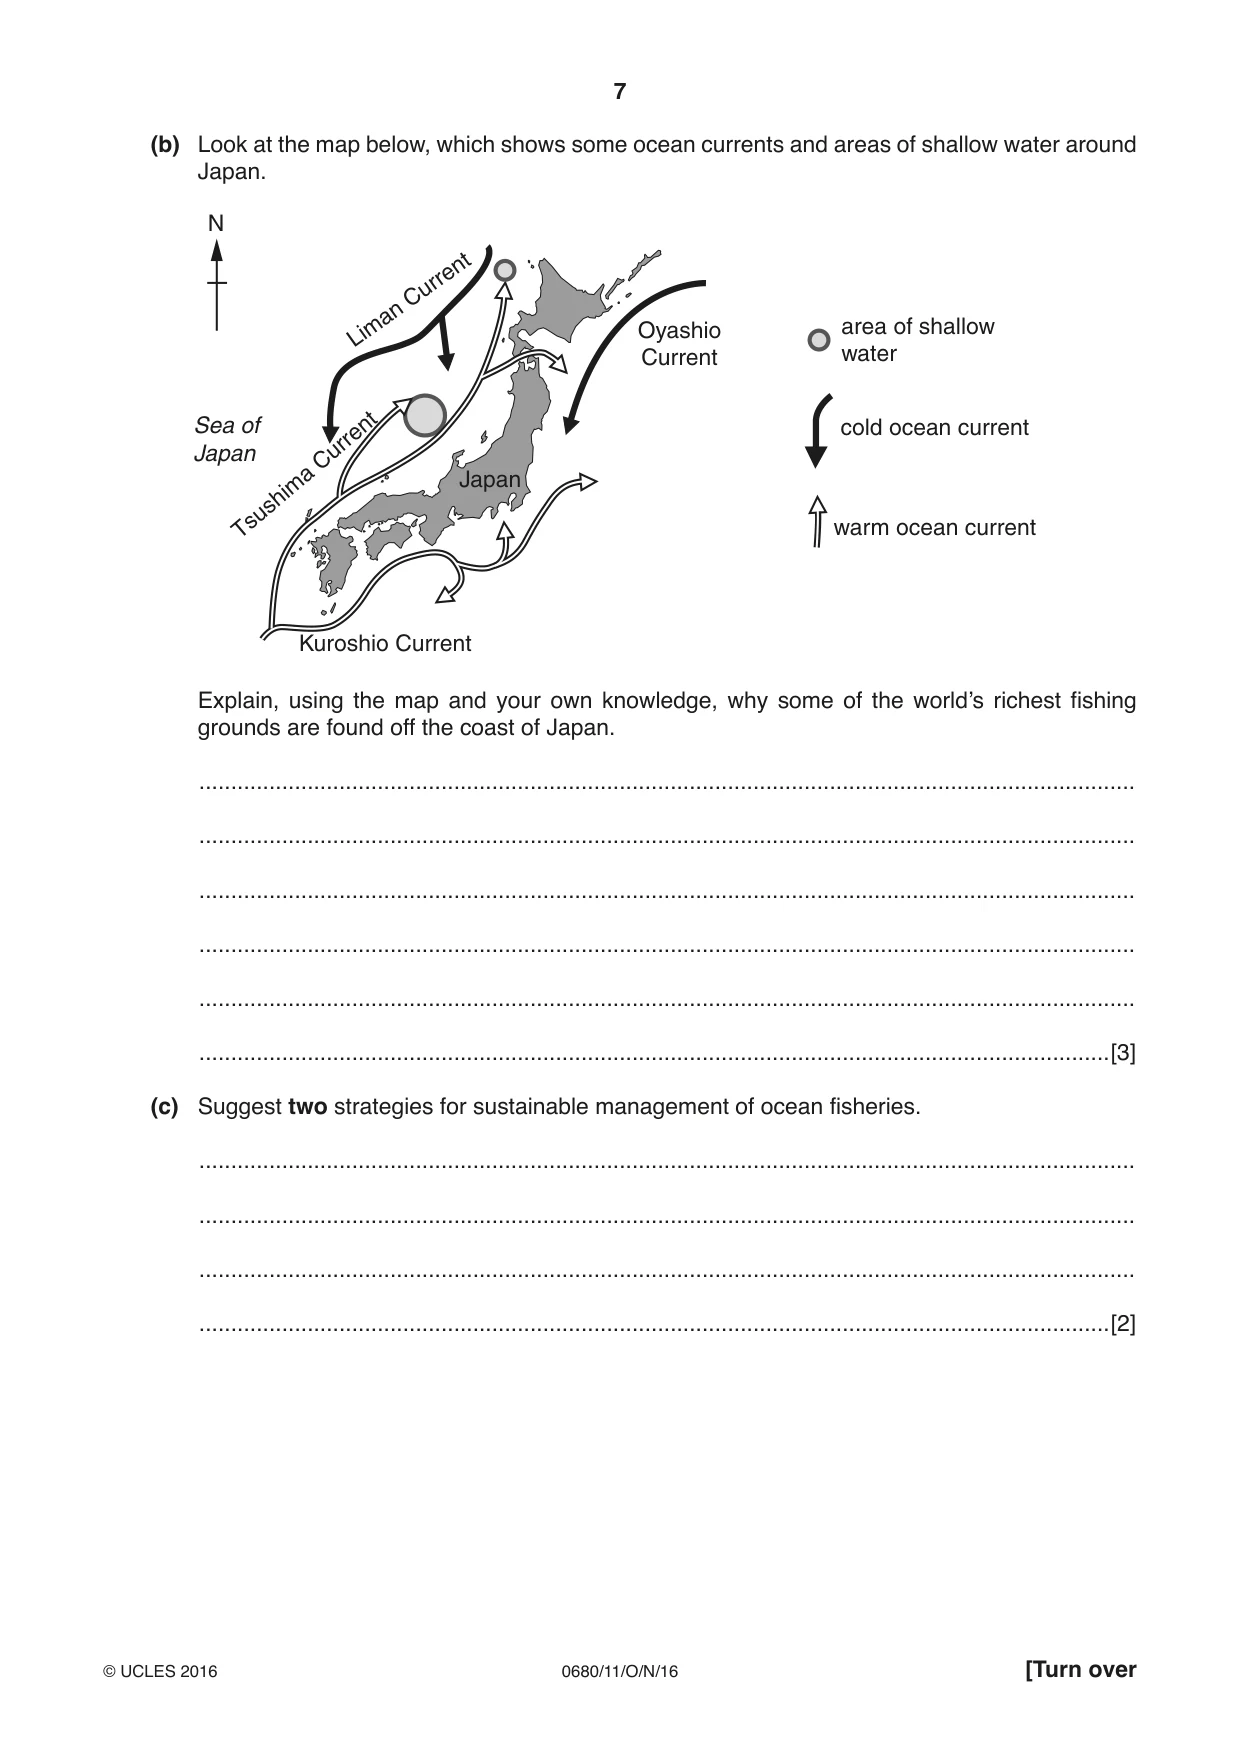
7 0680/11/O/N/16 © UCLES 2016 [Turn over (b) Look at the map below, which shows some ocean currents and areas of shallow water around Japan. N Japan Sea of Japan Liman Current Oyashio Current cold ocean current warm ocean current Kuroshio Current Tsushima Current area of shallow water Explain, using the map and your own knowledge, why some of the world’s richest fishing grounds are found off the coast of Japan. … … … … … …[3] (c) Suggest two strategies for sustainable management of ocean fisheries. … … … …[2]
Question paper, page 8
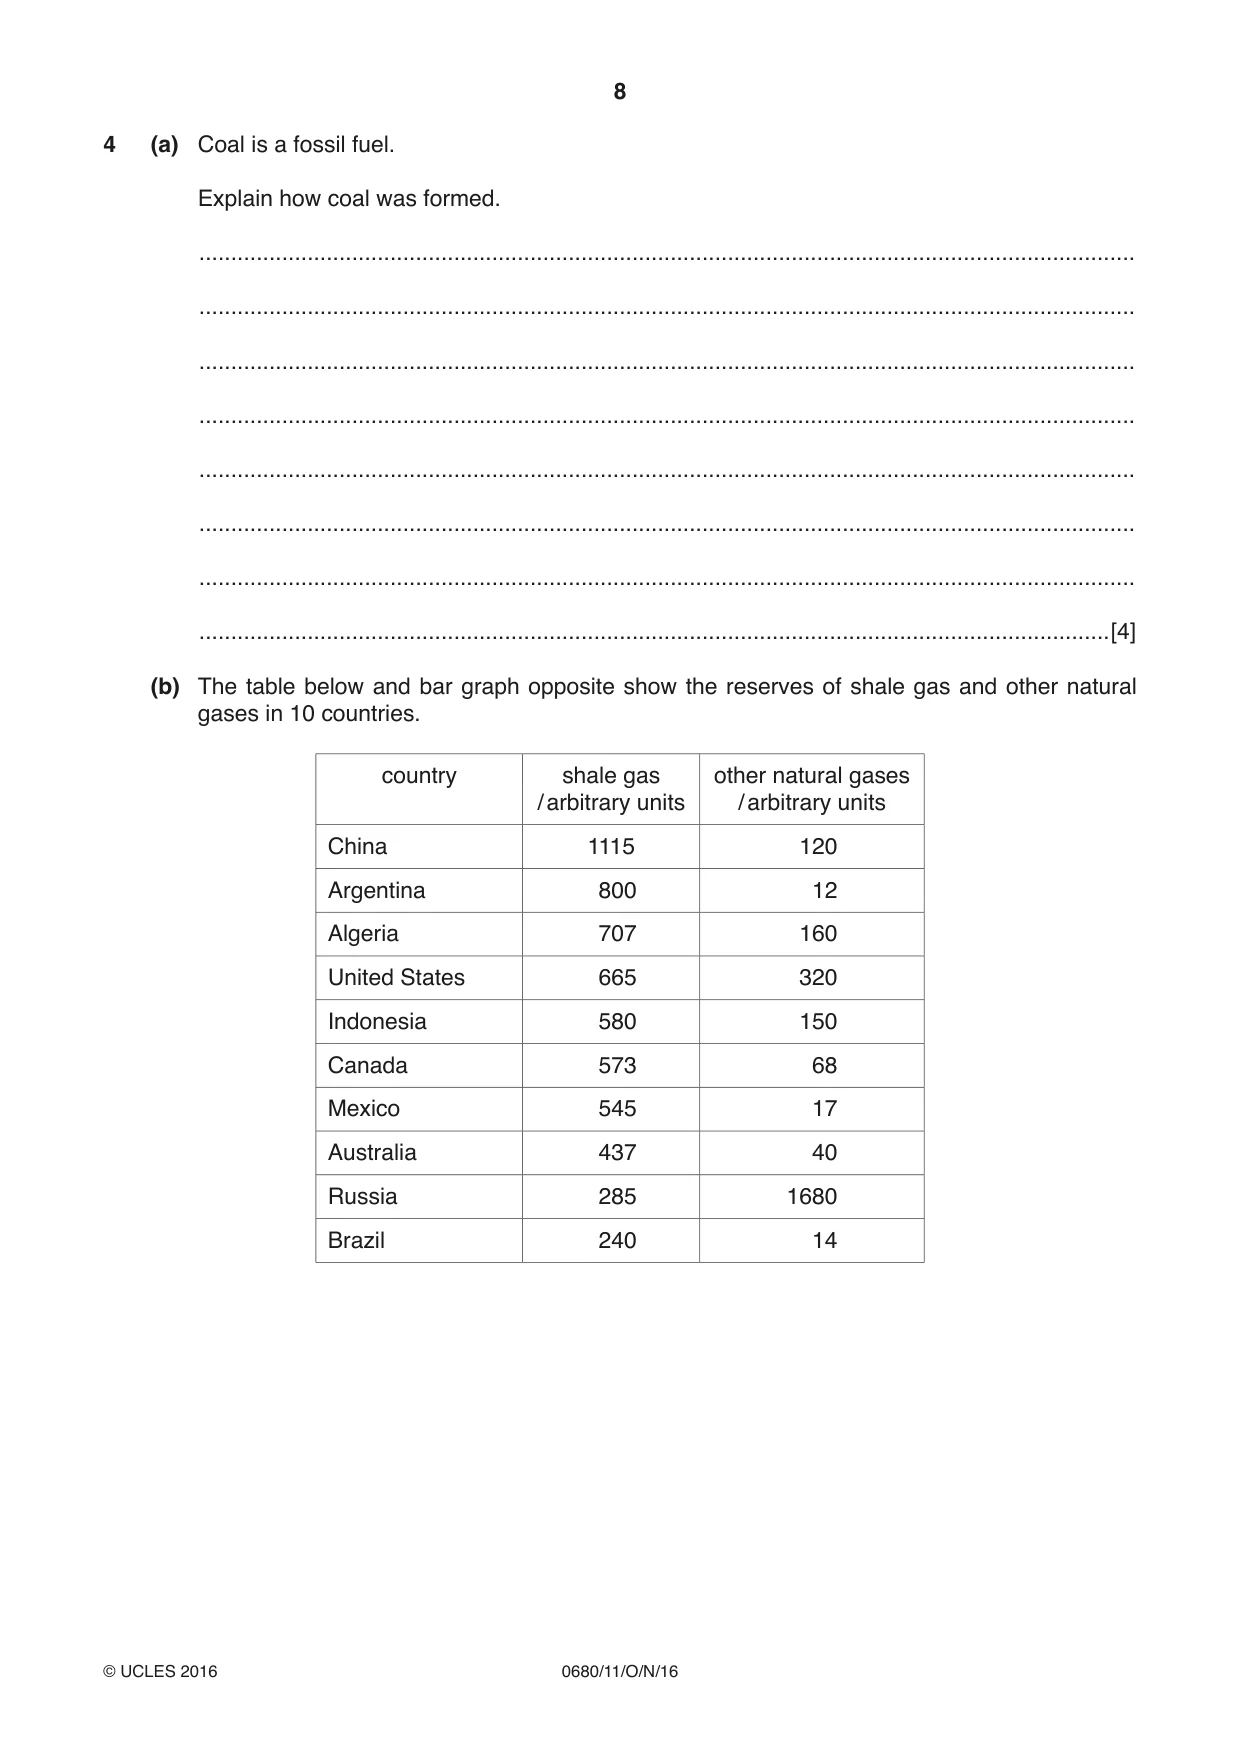
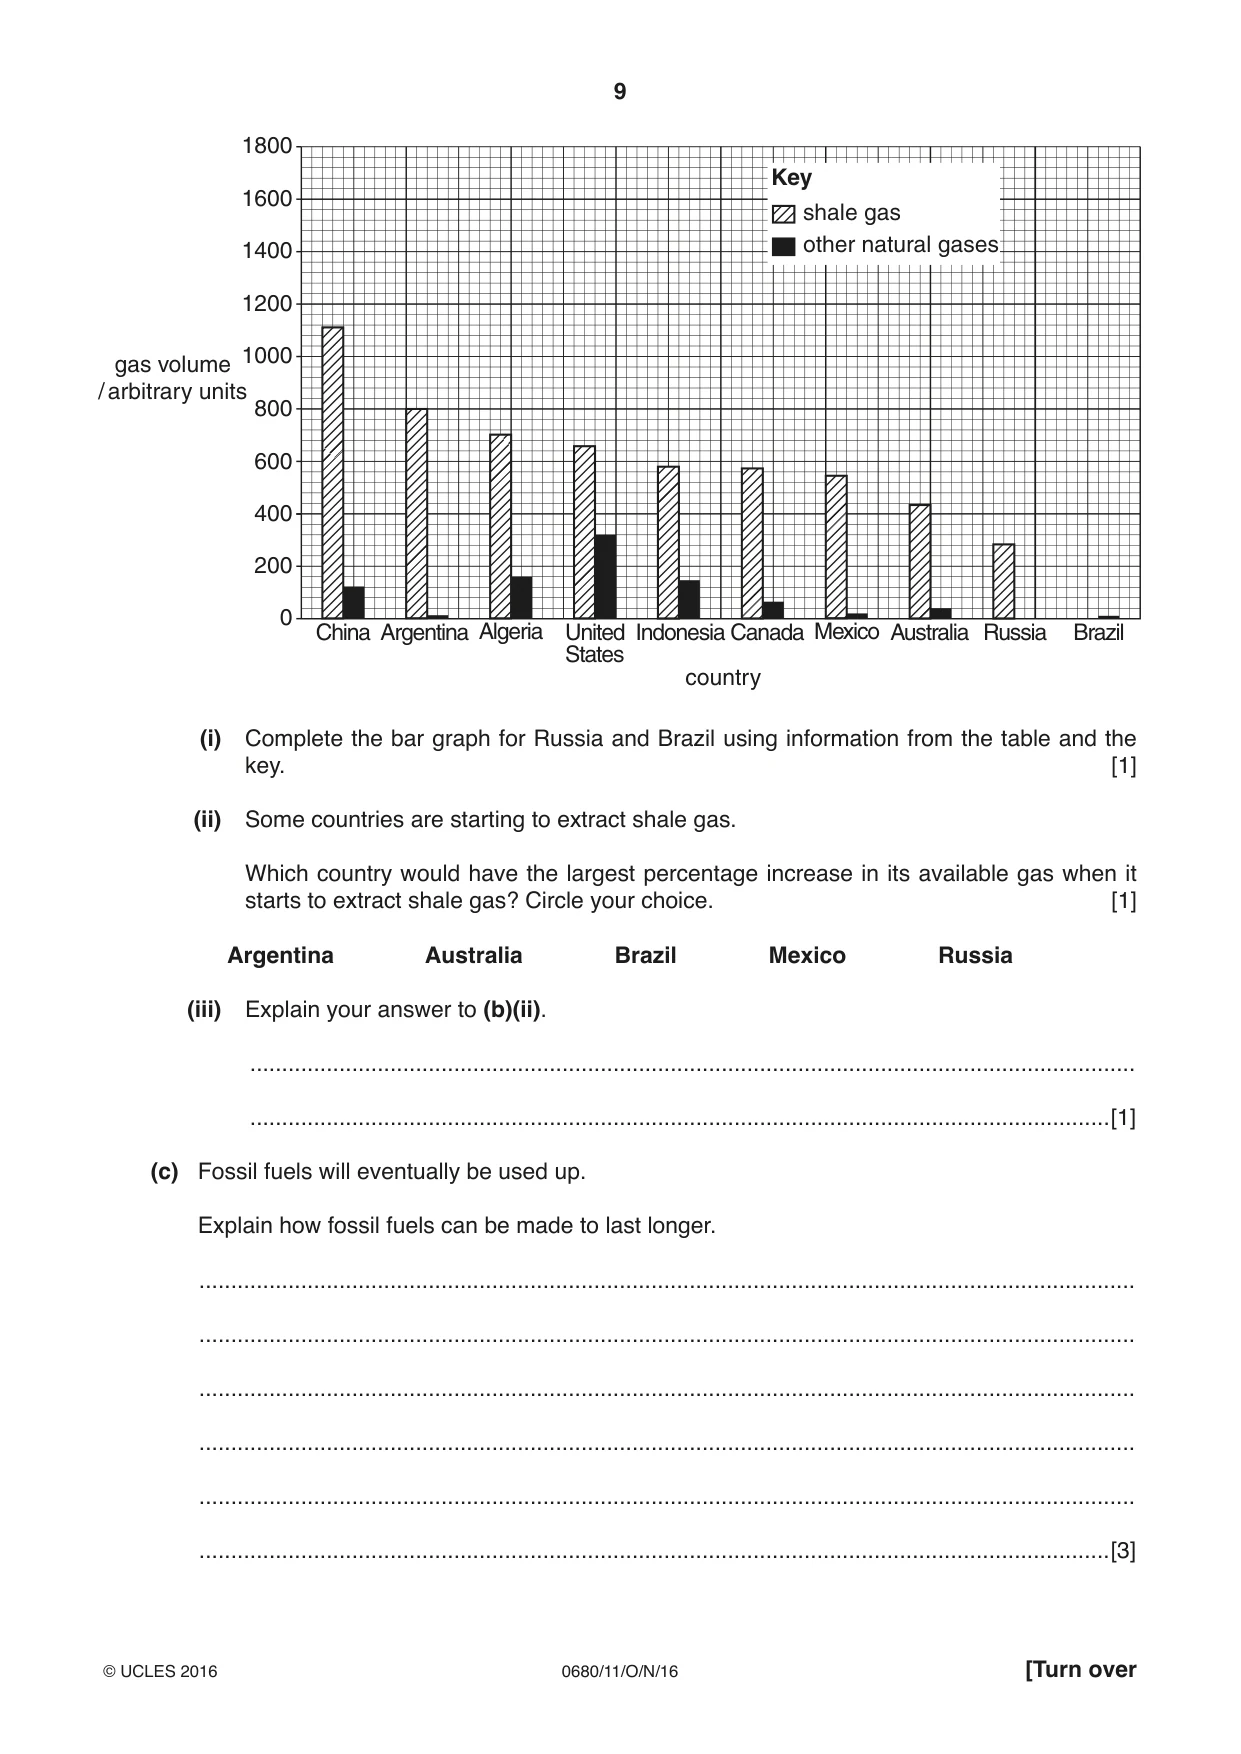
8 0680/11/O/N/16 © UCLES 2016 4 (a) Coal is a fossil fuel. Explain how coal was formed. … … … … … … … …[4] (b) The table below and bar graph opposite show the reserves of shale gas and other natural gases in 10 countries. country shale gas / arbitrary units other natural gases / arbitrary units China 1115 120 Argentina 800 12 Algeria 707 160 United States 665 320 Indonesia 580 150 Canada 573 68 Mexico 545 17 Australia 437 40 Russia 285 1680 Brazil 240 14
Question paper, page 9
9 0680/11/O/N/16 © UCLES 2016 [Turn over 1800 1600 1400 1200 1000 800 600 400 200 0 Key country gas volume / arbitrary units China Argentina Algeria shale gas other natural gases Indonesia Canada Mexico Australia Russia Brazil United States (i) Complete the bar graph for Russia and Brazil using information from the table and the key. [1] (ii) Some countries are starting to extract shale gas. Which country would have the largest percentage increase in its available gas when it starts to extract shale gas? Circle your choice. [1] Argentina Australia Brazil Mexico Russia (iii) Explain your answer to (b)(ii). … …[1] (c) Fossil fuels will eventually be used up. Explain how fossil fuels can be made to last longer. … … … … … …[3]
Question paper, page 10
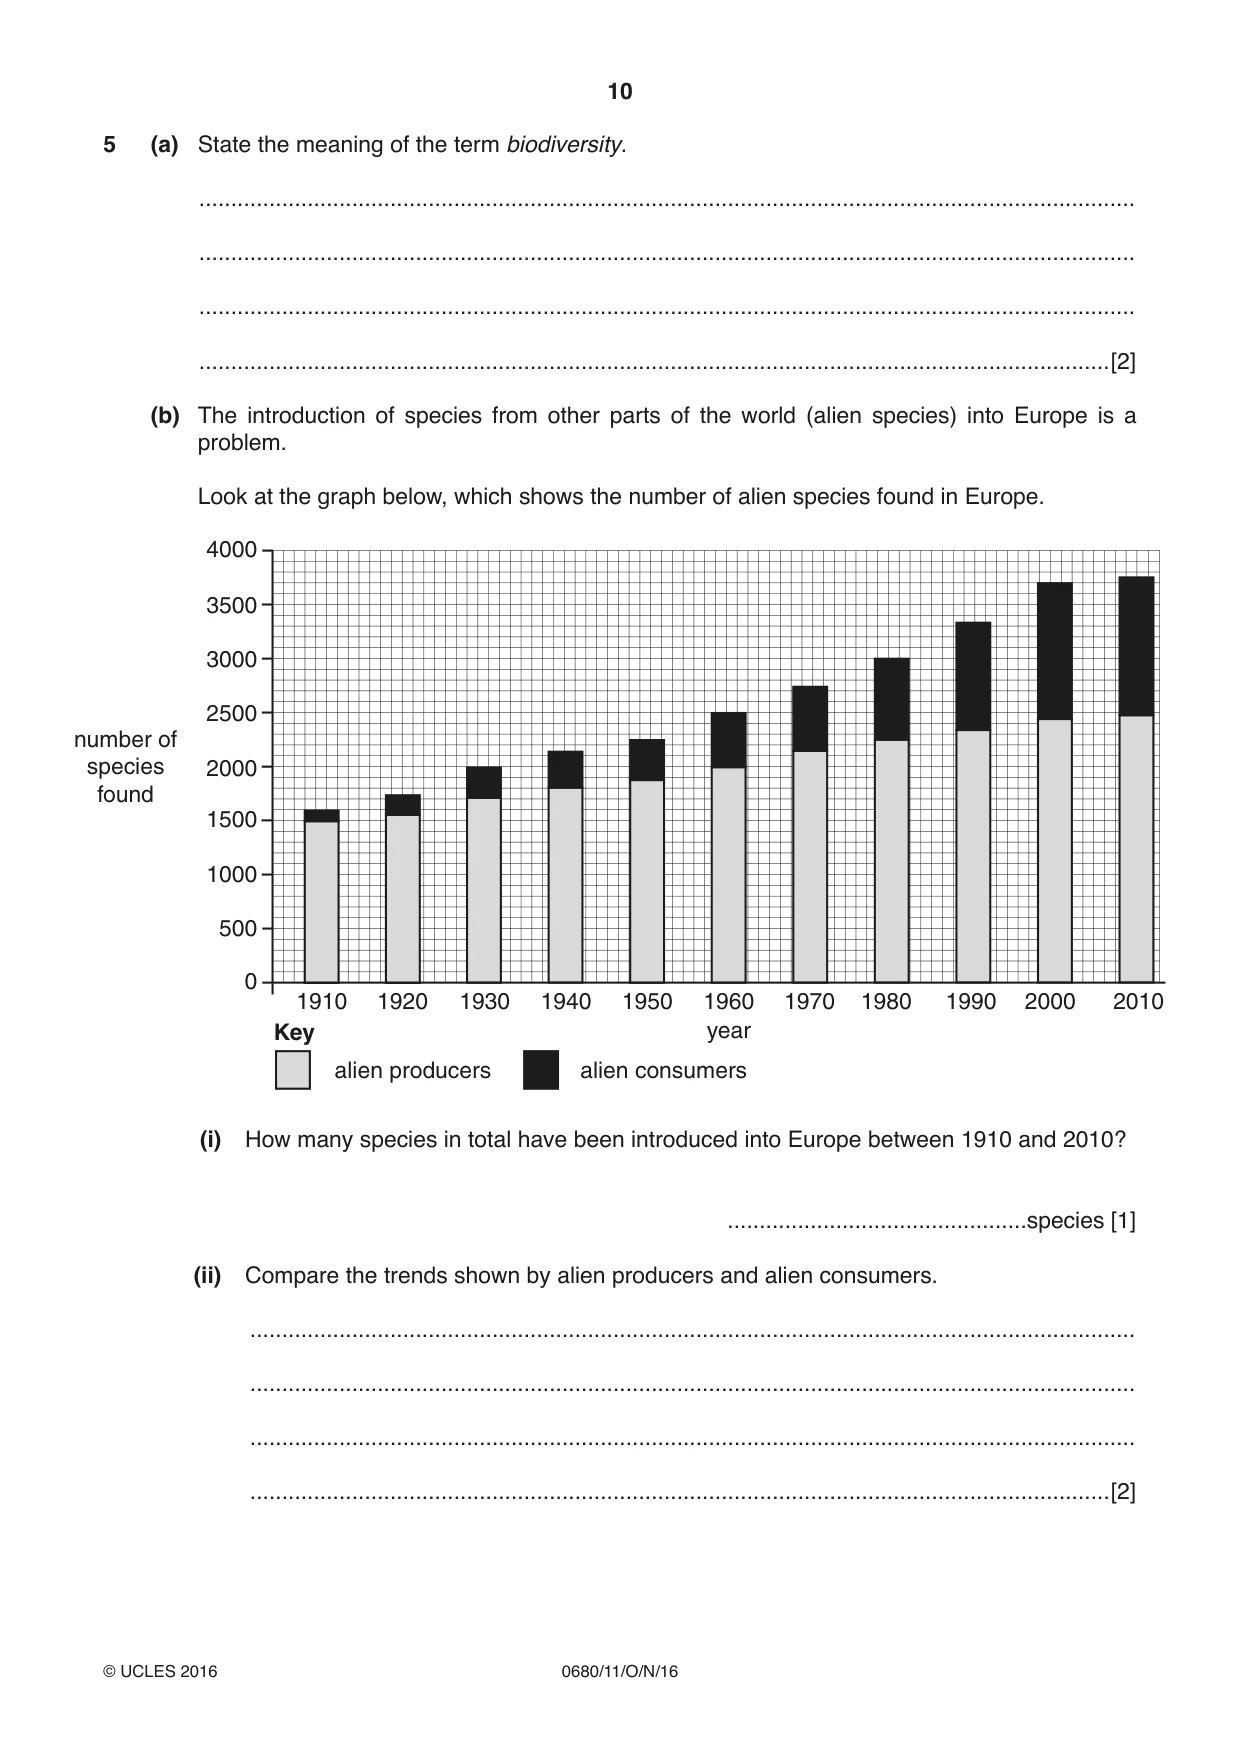
10 0680/11/O/N/16 © UCLES 2016 5 (a) State the meaning of the term biodiversity. … … … …[2] (b) The introduction of species from other parts of the world (alien species) into Europe is a problem. Look at the graph below, which shows the number of alien species found in Europe. Key 1910 alien producers 1920 1930 1940 1950 1960 year 1970 1980 1990 2000 2010 alien consumers 4000 3500 3000 2500 2000 1500 1000 500 0 number of species found (i) How many species in total have been introduced into Europe between 1910 and 2010? …species [1] (ii) Compare the trends shown by alien producers and alien consumers. … … … …[2]
Question paper, page 11
11 0680/11/O/N/16 © UCLES 2016 [Turn over (iii) Suggest the effect that introducing alien producers might have on food webs in an ecosystem. … … … … … …[3] (iv) Suggest how the introduction of alien species could be reduced. … … … …[2]
Question paper, page 12
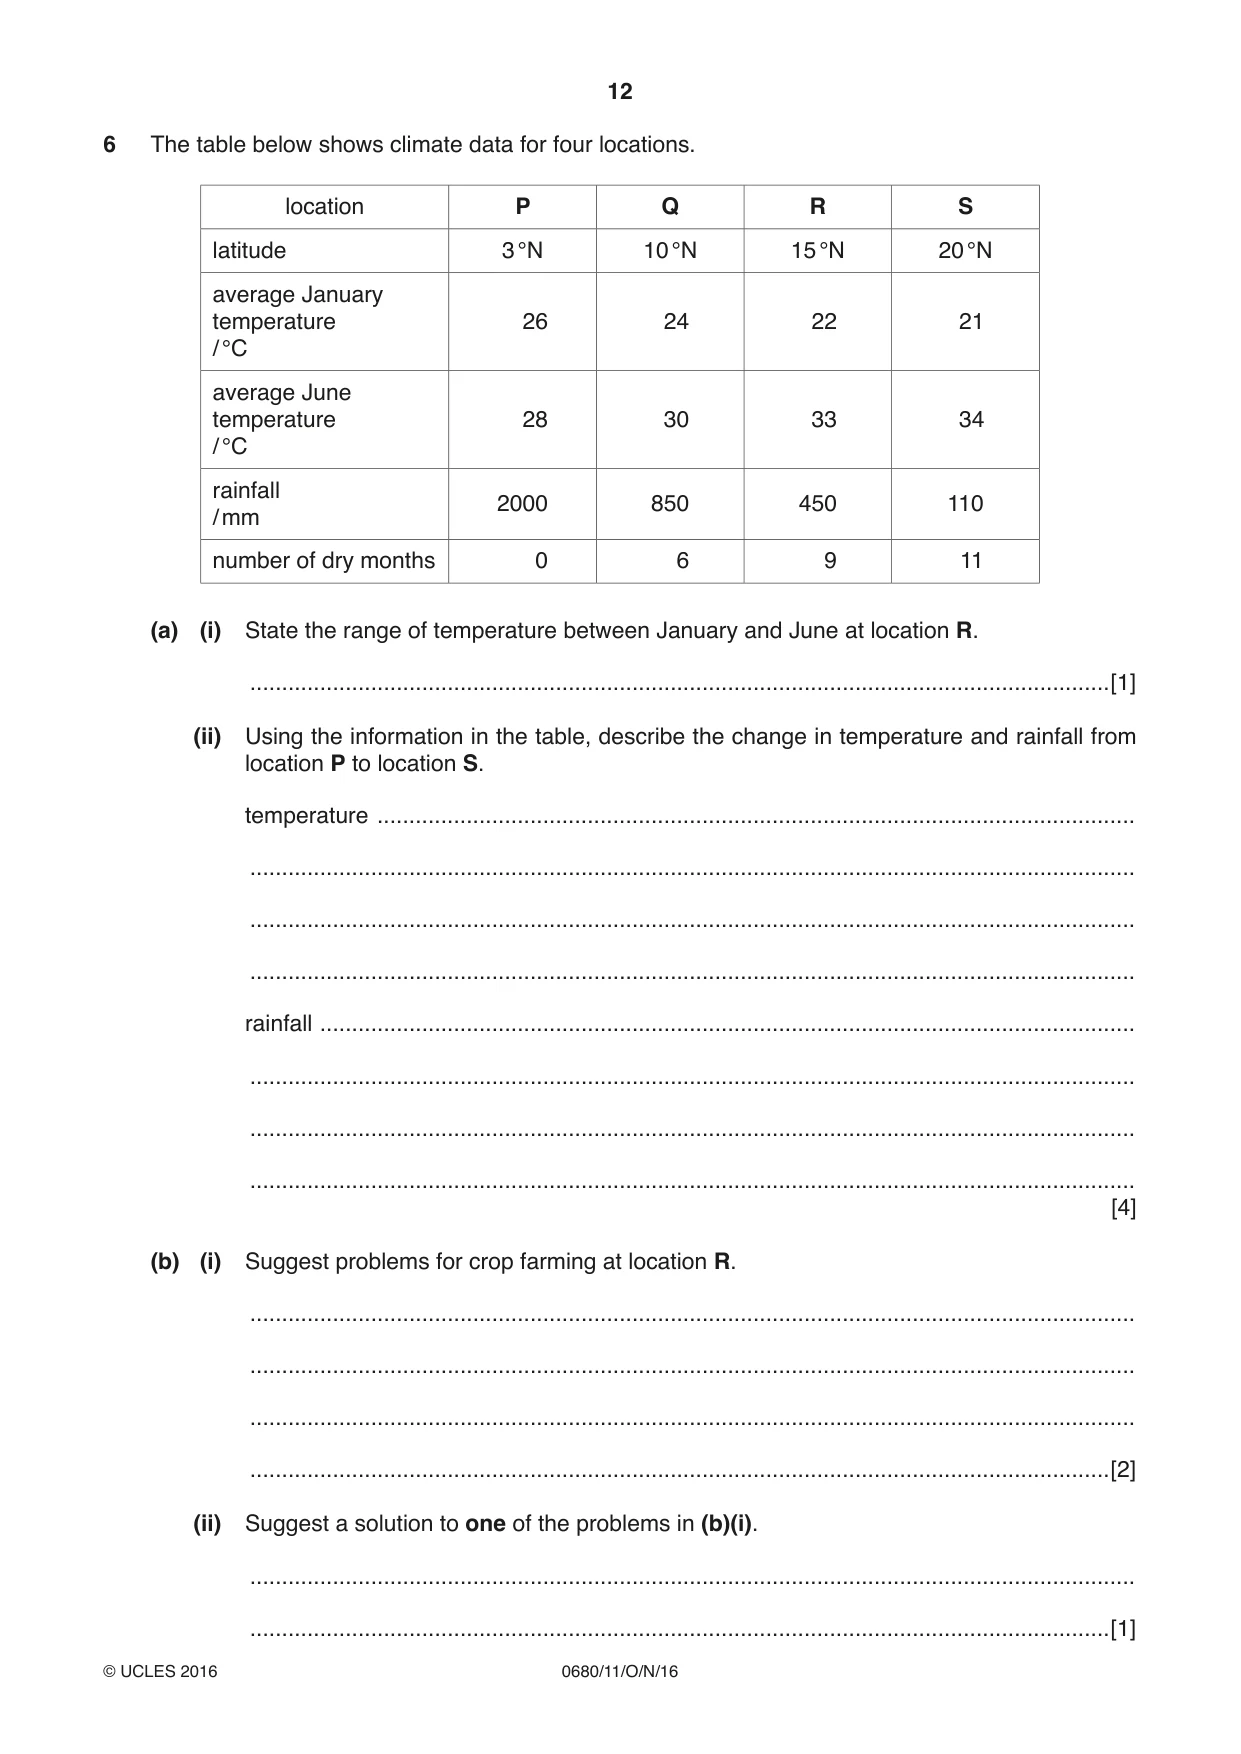
12 0680/11/O/N/16 © UCLES 2016 6 The table below shows climate data for four locations. location P Q R S latitude 3 °N 10 °N 15 °N 20 °N average January temperature / °C 26 24 22 21 average June temperature / °C 28 30 33 34 rainfall / mm 2000 850 450 110 number of dry months 0 6 9 11 (a) (i) State the range of temperature between January and June at location R. …[1] (ii) Using the information in the table, describe the change in temperature and rainfall from location P to location S. temperature … … … … rainfall … … … … [4] (b) (i) Suggest problems for crop farming at location R. … … … …[2] (ii) Suggest a solution to one of the problems in (b)(i). … …[1]
Question paper, page 13
13 0680/11/O/N/16 © UCLES 2016 (c) For a developing country, explain one advantage and one disadvantage of using land to grow biomass for fuel. … … … …[2]
Question paper, page 14
14 0680/11/O/N/16 © UCLES 2016 BLANK PAGE
Question paper, page 15
15 0680/11/O/N/16 © UCLES 2016 BLANK PAGE
Question paper, page 16
16 0680/11/O/N/16 © UCLES 2016 Permission to reproduce items where third-party owned material protected by copyright is included has been sought and cleared where possible. Every reasonable effort has been made by the publisher (UCLES) to trace copyright holders, but if any items requiring clearance have unwittingly been included, the publisher will be pleased to make amends at the earliest possible opportunity. To avoid the issue of disclosure of answer-related information to candidates, all copyright acknowledgements are reproduced online in the Cambridge International Examinations Copyright Acknowledgements Booklet. This is produced for each series of examinations and is freely available to download at www.cie.org.uk after the live examination series. Cambridge International Examinations is part of the Cambridge Assessment Group. Cambridge Assessment is the brand name of University of Cambridge Local Examinations Syndicate (UCLES), which is itself a department of the University of Cambridge. BLANK PAGE
Mark scheme, page 1
® IGCSE is the registered trademark of Cambridge International Examinations. This document consists of 7 printed pages. © UCLES 2016 [Turn over Cambridge International Examinations Cambridge International General Certificate of Secondary Education ENVIRONMENTAL MANAGEMENT 0680/11 Paper 1 October/November 2016 MARK SCHEME Maximum Mark: 60 Published This mark scheme is published as an aid to teachers and candidates, to indicate the requirements of the examination. It shows the basis on which Examiners were instructed to award marks. It does not indicate the details of the discussions that took place at an Examiners’ meeting before marking began, which would have considered the acceptability of alternative answers. Mark schemes should be read in conjunction with the question paper and the Principal Examiner Report for Teachers. Cambridge will not enter into discussions about these mark schemes. Cambridge is publishing the mark schemes for the October/November 2016 series for most Cambridge IGCSE®, Cambridge International A and AS Level components and some Cambridge O Level components.
Mark scheme, page 2
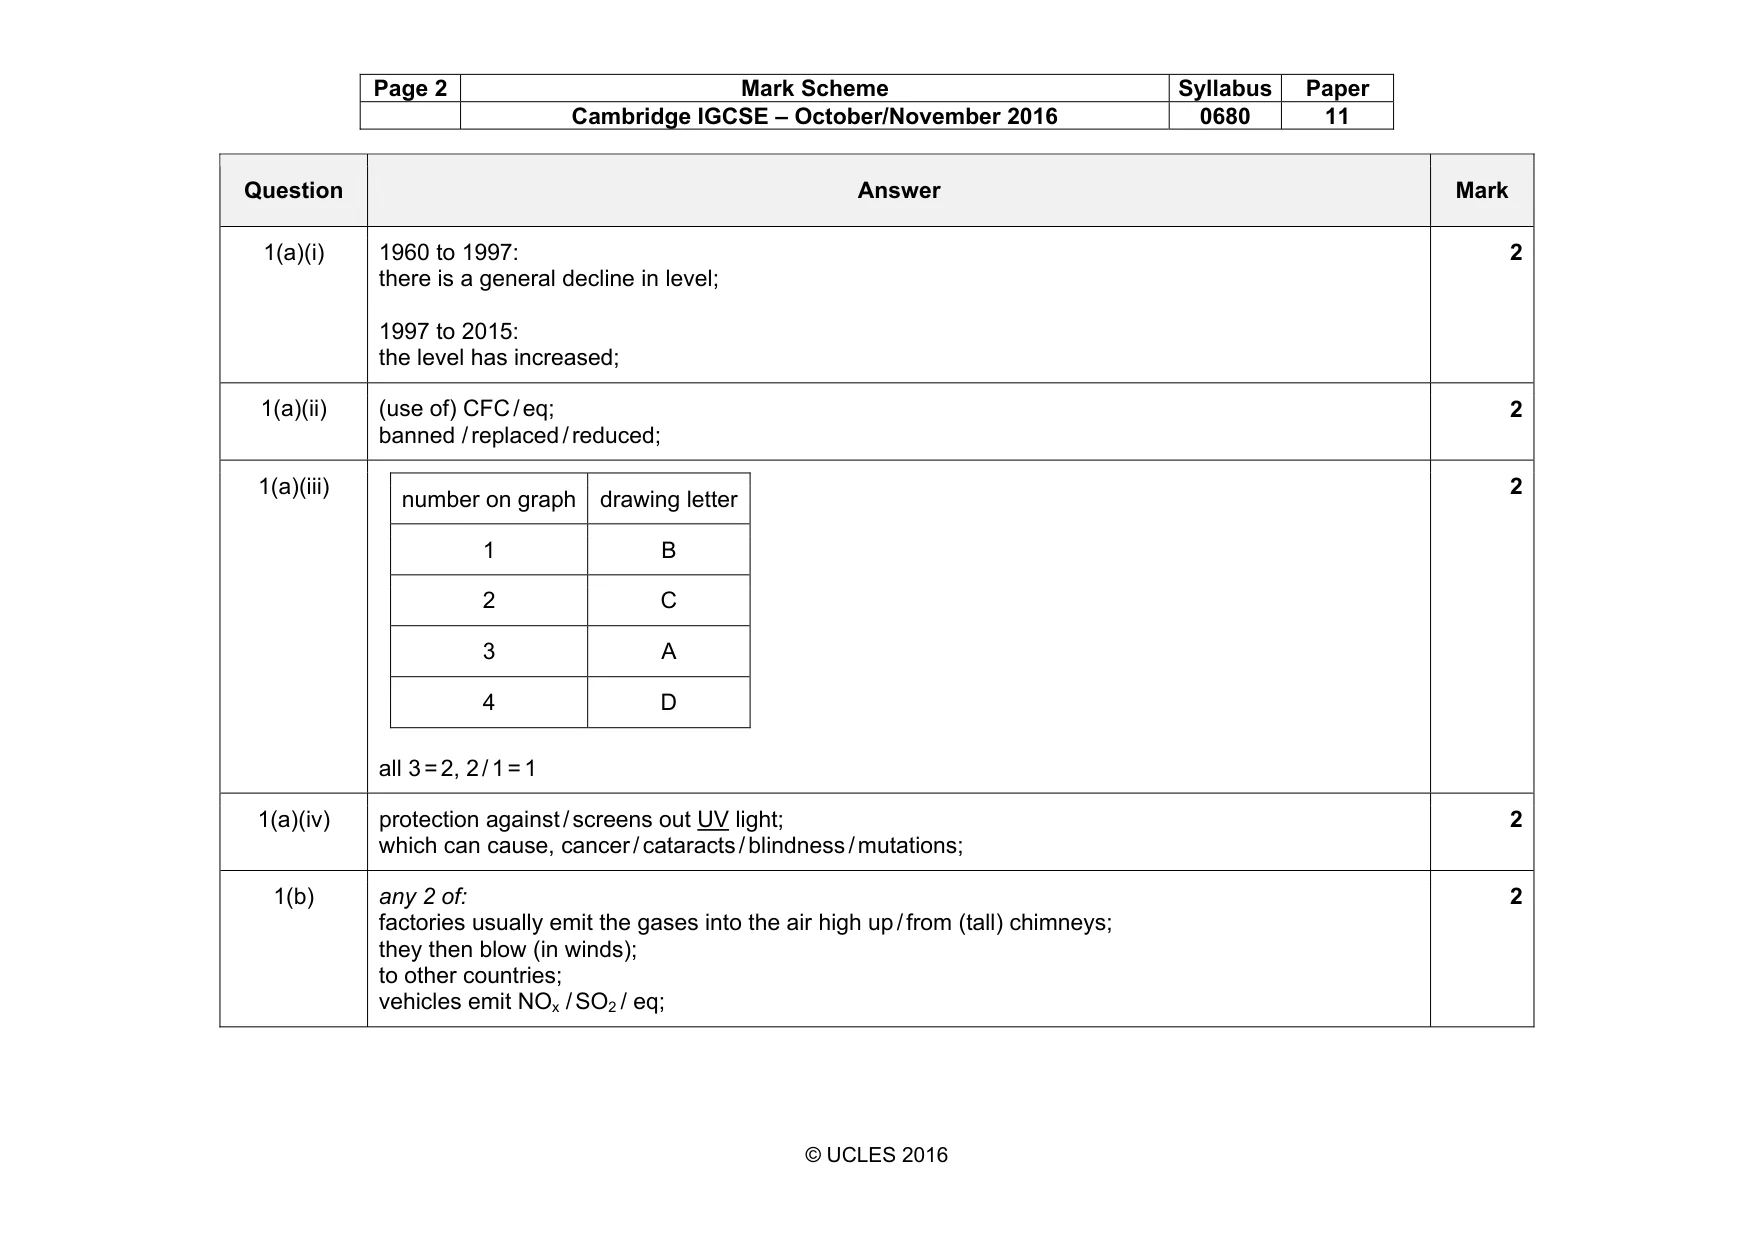
Page 2 Mark Scheme Syllabus Paper Cambridge IGCSE – October/November 2016 0680 11 © UCLES 2016 Question Answer Mark 1(a)(i) 1960 to 1997: there is a general decline in level; 1997 to 2015: the level has increased; 2 1(a)(ii) (use of) CFC / eq; banned / replaced / reduced; 2 1(a)(iii) number on graph drawing letter 1 B 2 C 3 A 4 D all 3 = 2, 2 / 1 = 1 2 1(a)(iv) protection against / screens out UV light; which can cause, cancer / cataracts / blindness / mutations; 2 1(b) any 2 of: factories usually emit the gases into the air high up / from (tall) chimneys; they then blow (in winds); to other countries; vehicles emit NOx / SO2 / eq; 2
Mark scheme, page 3
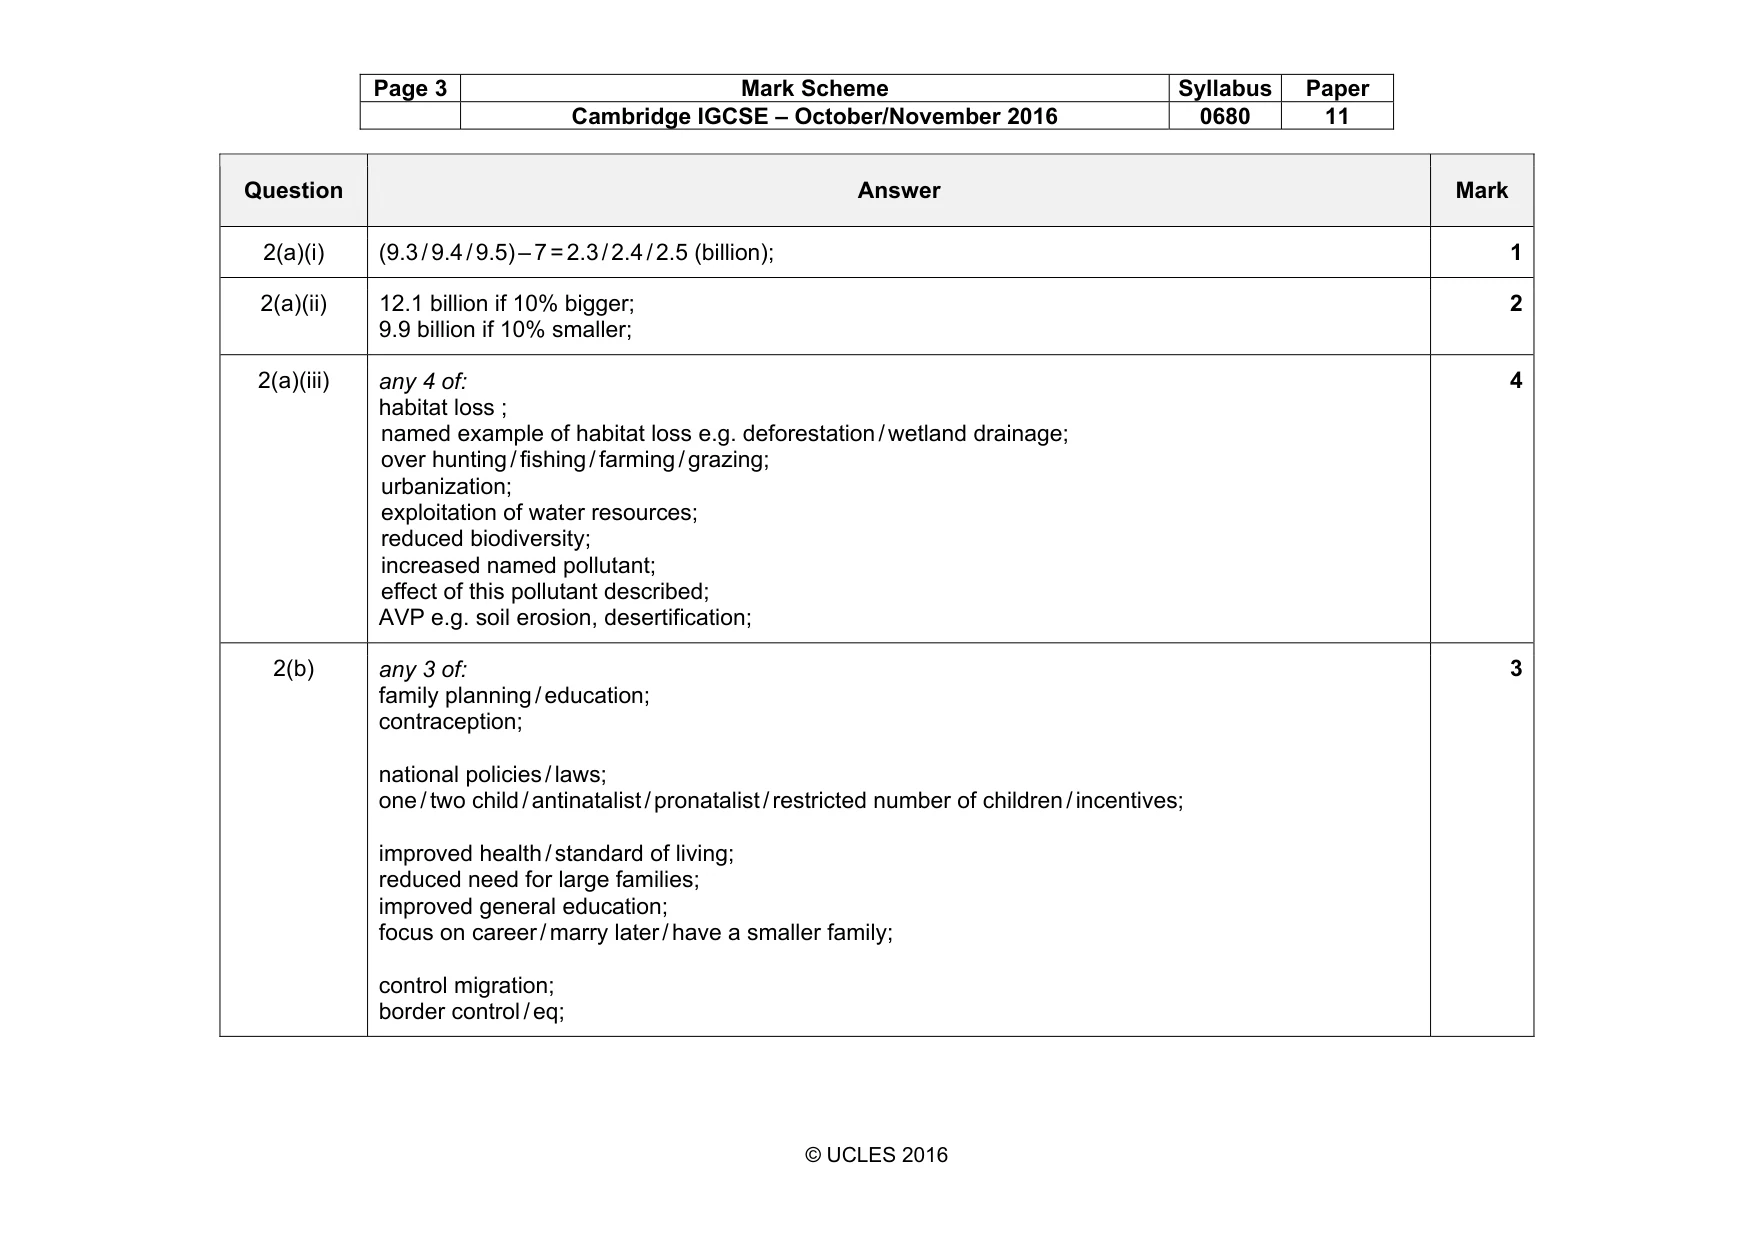
Page 3 Mark Scheme Syllabus Paper Cambridge IGCSE – October/November 2016 0680 11 © UCLES 2016 Question Answer Mark 2(a)(i) (9.3 / 9.4 / 9.5) – 7 = 2.3 / 2.4 / 2.5 (billion); 1 2(a)(ii) 12.1 billion if 10% bigger; 9.9 billion if 10% smaller; 2 2(a)(iii) any 4 of: habitat loss ; named example of habitat loss e.g. deforestation / wetland drainage; over hunting / fishing / farming / grazing; urbanization; exploitation of water resources; reduced biodiversity; increased named pollutant; effect of this pollutant described; AVP e.g. soil erosion, desertification; 4 2(b) any 3 of: family planning / education; contraception; national policies / laws; one / two child / antinatalist / pronatalist / restricted number of children / incentives; improved health / standard of living; reduced need for large families; improved general education; focus on career / marry later / have a smaller family; control migration; border control / eq; 3
Mark scheme, page 4
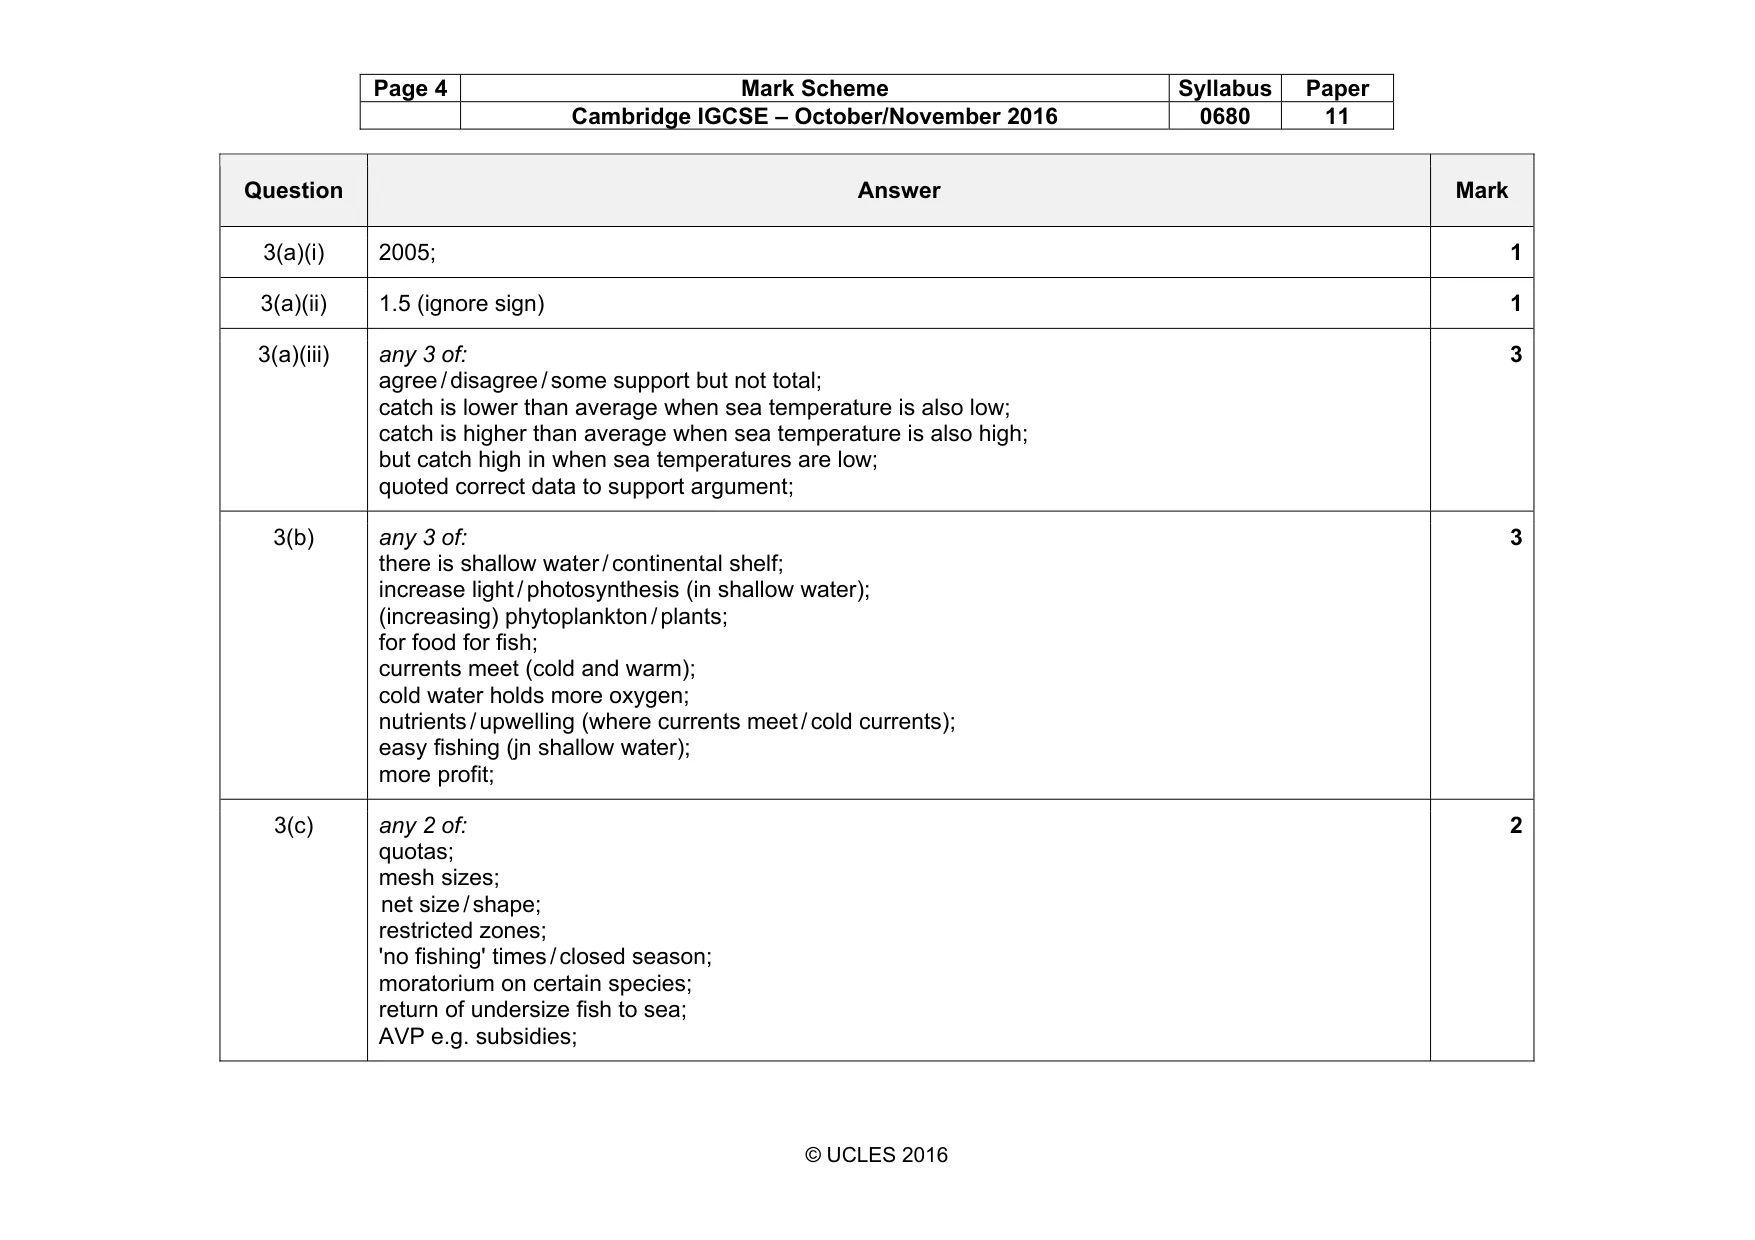
Page 4 Mark Scheme Syllabus Paper Cambridge IGCSE – October/November 2016 0680 11 © UCLES 2016 Question Answer Mark 3(a)(i) 2005; 1 3(a)(ii) 1.5 (ignore sign) 1 3(a)(iii) any 3 of: agree / disagree / some support but not total; catch is lower than average when sea temperature is also low; catch is higher than average when sea temperature is also high; but catch high in when sea temperatures are low; quoted correct data to support argument; 3 3(b) any 3 of: there is shallow water / continental shelf; increase light / photosynthesis (in shallow water); (increasing) phytoplankton / plants; for food for fish; currents meet (cold and warm); cold water holds more oxygen; nutrients / upwelling (where currents meet / cold currents); easy fishing (jn shallow water); more profit; 3 3(c) any 2 of: quotas; mesh sizes; net size / shape; restricted zones; 'no fishing' times / closed season; moratorium on certain species; return of undersize fish to sea; AVP e.g. subsidies; 2
Mark scheme, page 5
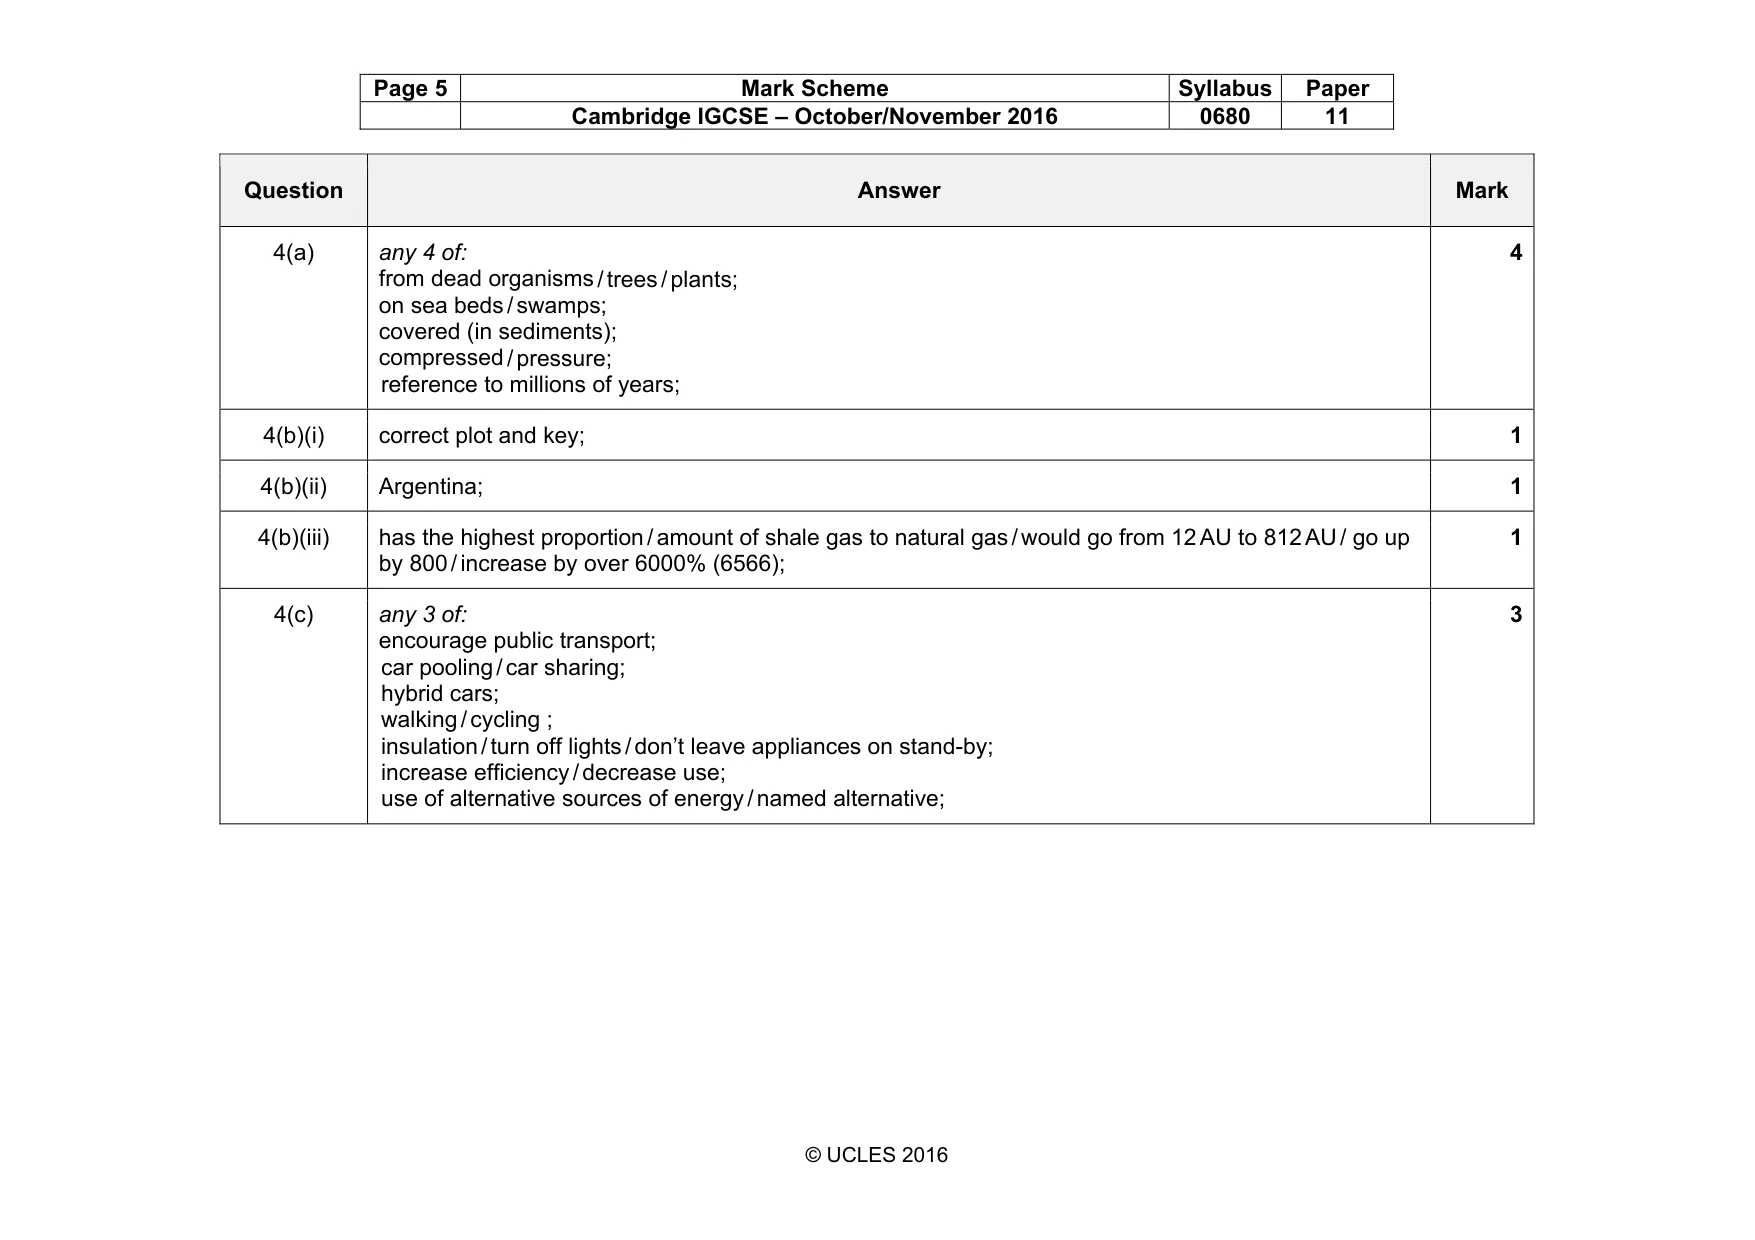
Page 5 Mark Scheme Syllabus Paper Cambridge IGCSE – October/November 2016 0680 11 © UCLES 2016 Question Answer Mark 4(a) any 4 of: from dead organisms / trees / plants; on sea beds / swamps; covered (in sediments); compressed / pressure; reference to millions of years; 4 4(b)(i) correct plot and key; 1 4(b)(ii) Argentina; 1 4(b)(iii) has the highest proportion / amount of shale gas to natural gas / would go from 12 AU to 812 AU / go up by 800 / increase by over 6000% (6566); 1 4(c) any 3 of: encourage public transport; car pooling / car sharing; hybrid cars; walking / cycling ; insulation / turn off lights / don’t leave appliances on stand-by; increase efficiency / decrease use; use of alternative sources of energy / named alternative; 3
Mark scheme, page 6
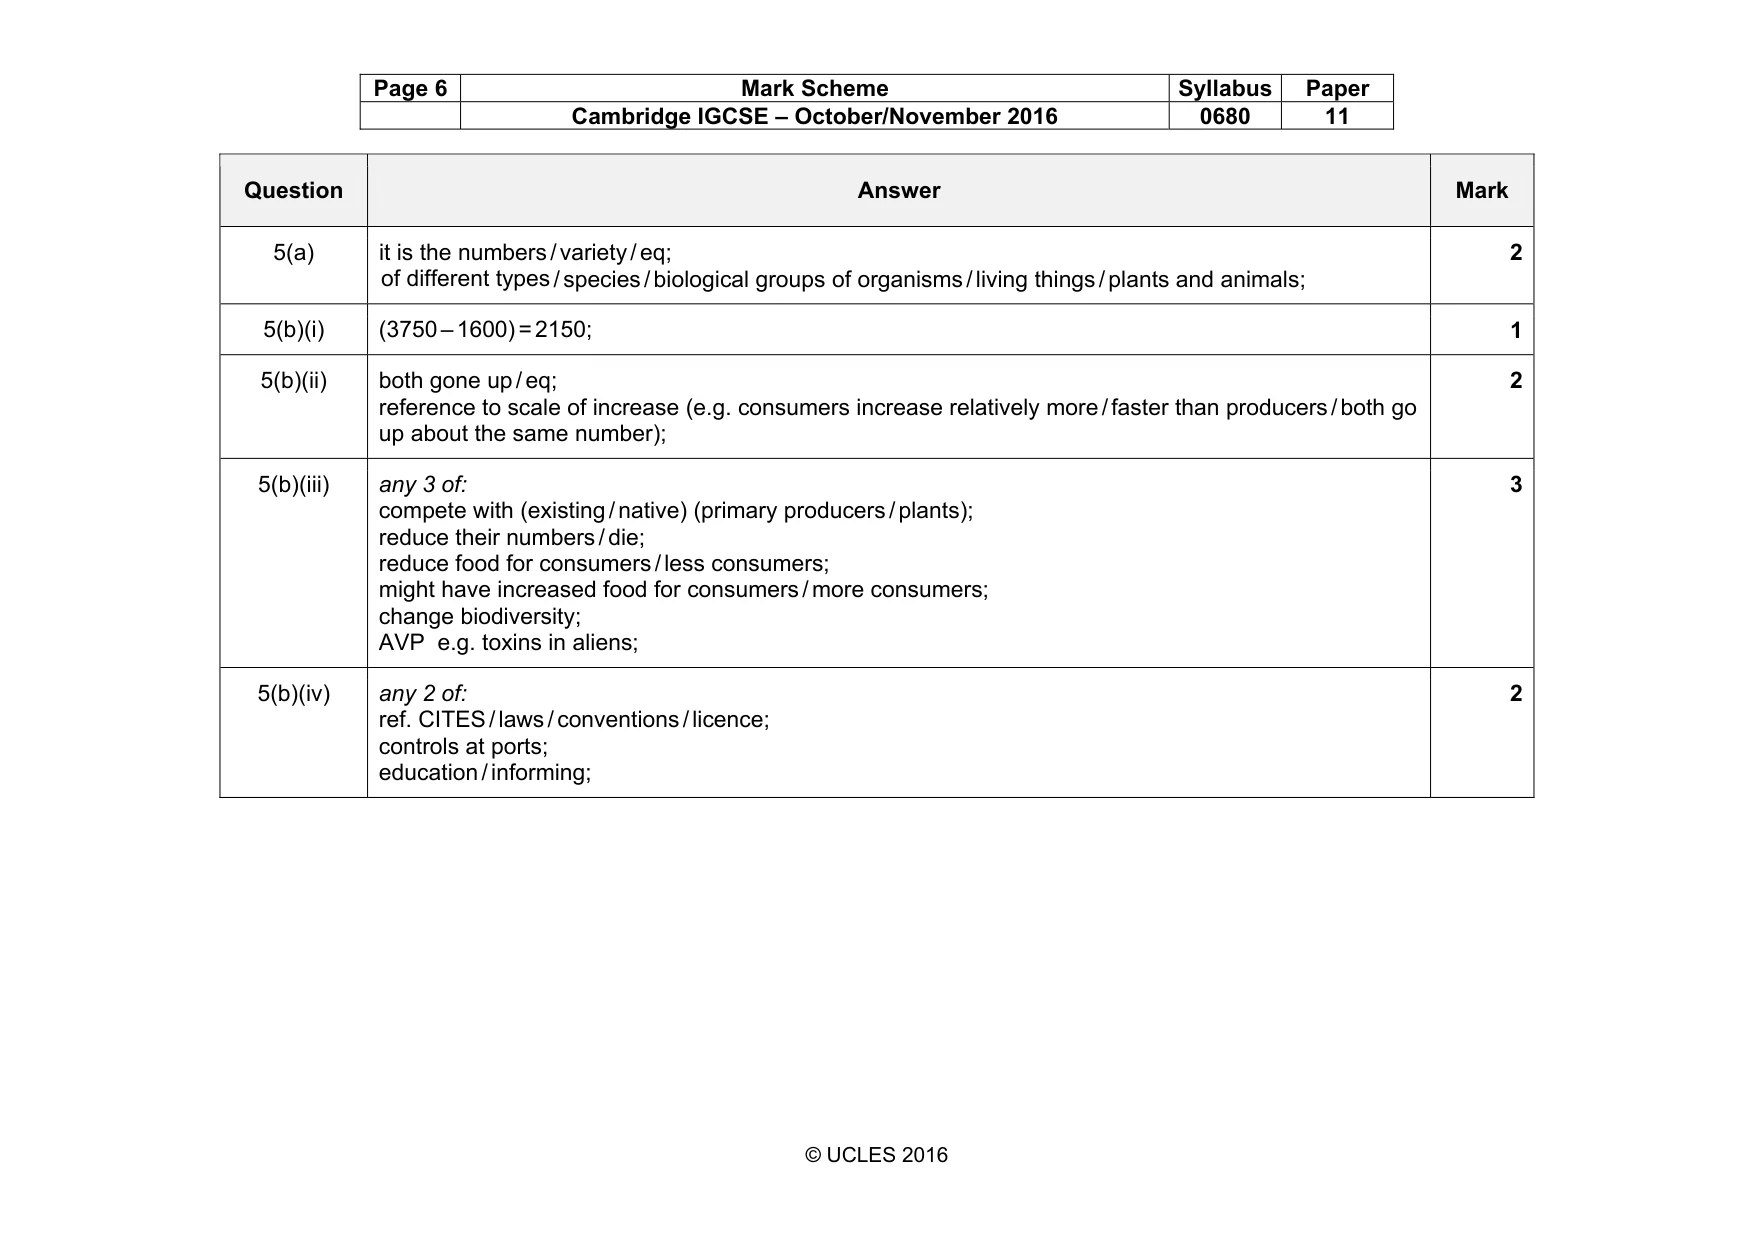
Page 6 Mark Scheme Syllabus Paper Cambridge IGCSE – October/November 2016 0680 11 © UCLES 2016 Question Answer Mark 5(a) it is the numbers / variety / eq; of different types / species / biological groups of organisms / living things / plants and animals; 2 5(b)(i) (3750 – 1600) = 2150; 1 5(b)(ii) both gone up / eq; reference to scale of increase (e.g. consumers increase relatively more / faster than producers / both go up about the same number); 2 5(b)(iii) any 3 of: compete with (existing / native) (primary producers / plants); reduce their numbers / die; reduce food for consumers / less consumers; might have increased food for consumers / more consumers; change biodiversity; AVP e.g. toxins in aliens; 3 5(b)(iv) any 2 of: ref. CITES / laws / conventions / licence; controls at ports; education / informing; 2
Mark scheme, page 7
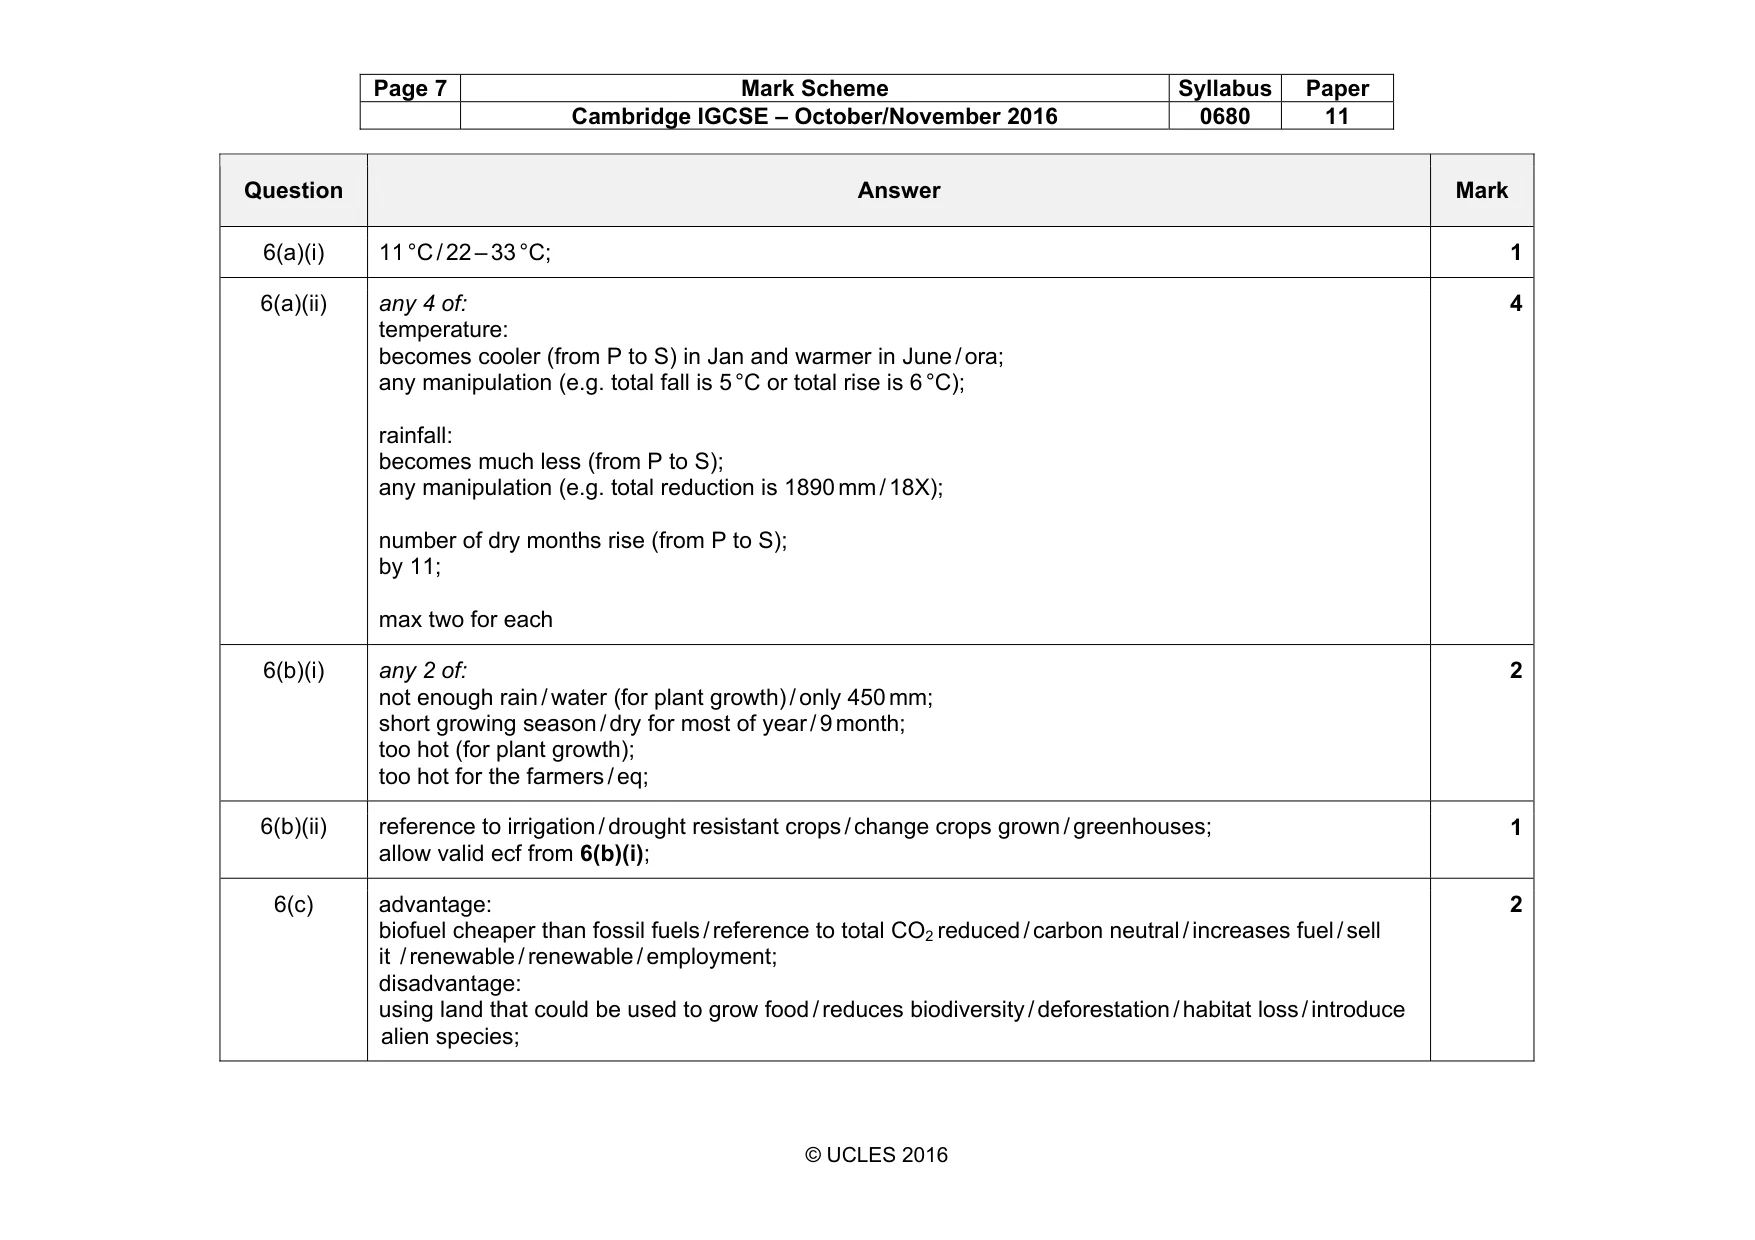
Page 7 Mark Scheme Syllabus Paper Cambridge IGCSE – October/November 2016 0680 11 © UCLES 2016 Question Answer Mark 6(a)(i) 11 °C / 22 – 33 °C; 1 6(a)(ii) any 4 of: temperature: becomes cooler (from P to S) in Jan and warmer in June / ora; any manipulation (e.g. total fall is 5 °C or total rise is 6 °C); rainfall: becomes much less (from P to S); any manipulation (e.g. total reduction is 1890 mm / 18X); number of dry months rise (from P to S); by 11; max two for each 4 6(b)(i) any 2 of: not enough rain / water (for plant growth) / only 450 mm; short growing season / dry for most of year / 9 month; too hot (for plant growth); too hot for the farmers / eq; 2 6(b)(ii) reference to irrigation / drought resistant crops / change crops grown / greenhouses; allow valid ecf from 6(b)(i); 1 6(c) advantage: biofuel cheaper than fossil fuels / reference to total CO2 reduced / carbon neutral / increases fuel / sell it / renewable / renewable / employment; disadvantage: using land that could be used to grow food / reduces biodiversity / deforestation / habitat loss / introduce alien species; 2
What you needed in this session
Cambridge’s own grade thresholds for 2016 Oct/Nov, Paper 1 · Variant 1. A higher threshold means an easier paper — the bar moves with how the cohort did.