Cambridge IGCSE Environmental Management 0680 — 2012 May/June Paper 1 · Variant 2
0680/12/M/J/12 · 60 marks · ≈68 min
The question paper and its mark scheme, free to read here and free to download. This is Cambridge’s own paper, exactly as it was sat.
Question paper16 pages



Mark scheme6 pages
Answers below. Sit the paper first if you are practising.
Paper as text
Question paper, page 1
This document consists of 13 printed pages and 3 blank pages. DC (SJF/SW) 46970/2 © UCLES 2012 [Turn over UNIVERSITY OF CAMBRIDGE INTERNATIONAL EXAMINATIONS International General Certificate of Secondary Education READ THESE INSTRUCTIONS FIRST Write your Centre number, candidate number and name on all the work you hand in. Write in dark blue or black pen. You may use a soft pencil for any diagrams, graphs or rough working. Do not use staples, paper clips, highlighters, glue or correction fluid. DO NOT WRITE IN ANY BARCODES. Answer all questions. At the end of the examination, fasten all your work securely together. The number of marks is given in brackets [ ] at the end of each question or part question. * 6 8 7 7 0 3 5 6 9 2 * ENVIRONMENTAL MANAGEMENT 0680/12 Paper 1 May/June 2012 1 hour 30 minutes Candidates answer on the Question Paper. Additional Materials: Ruler www.XtremePapers.com
Question paper, page 2
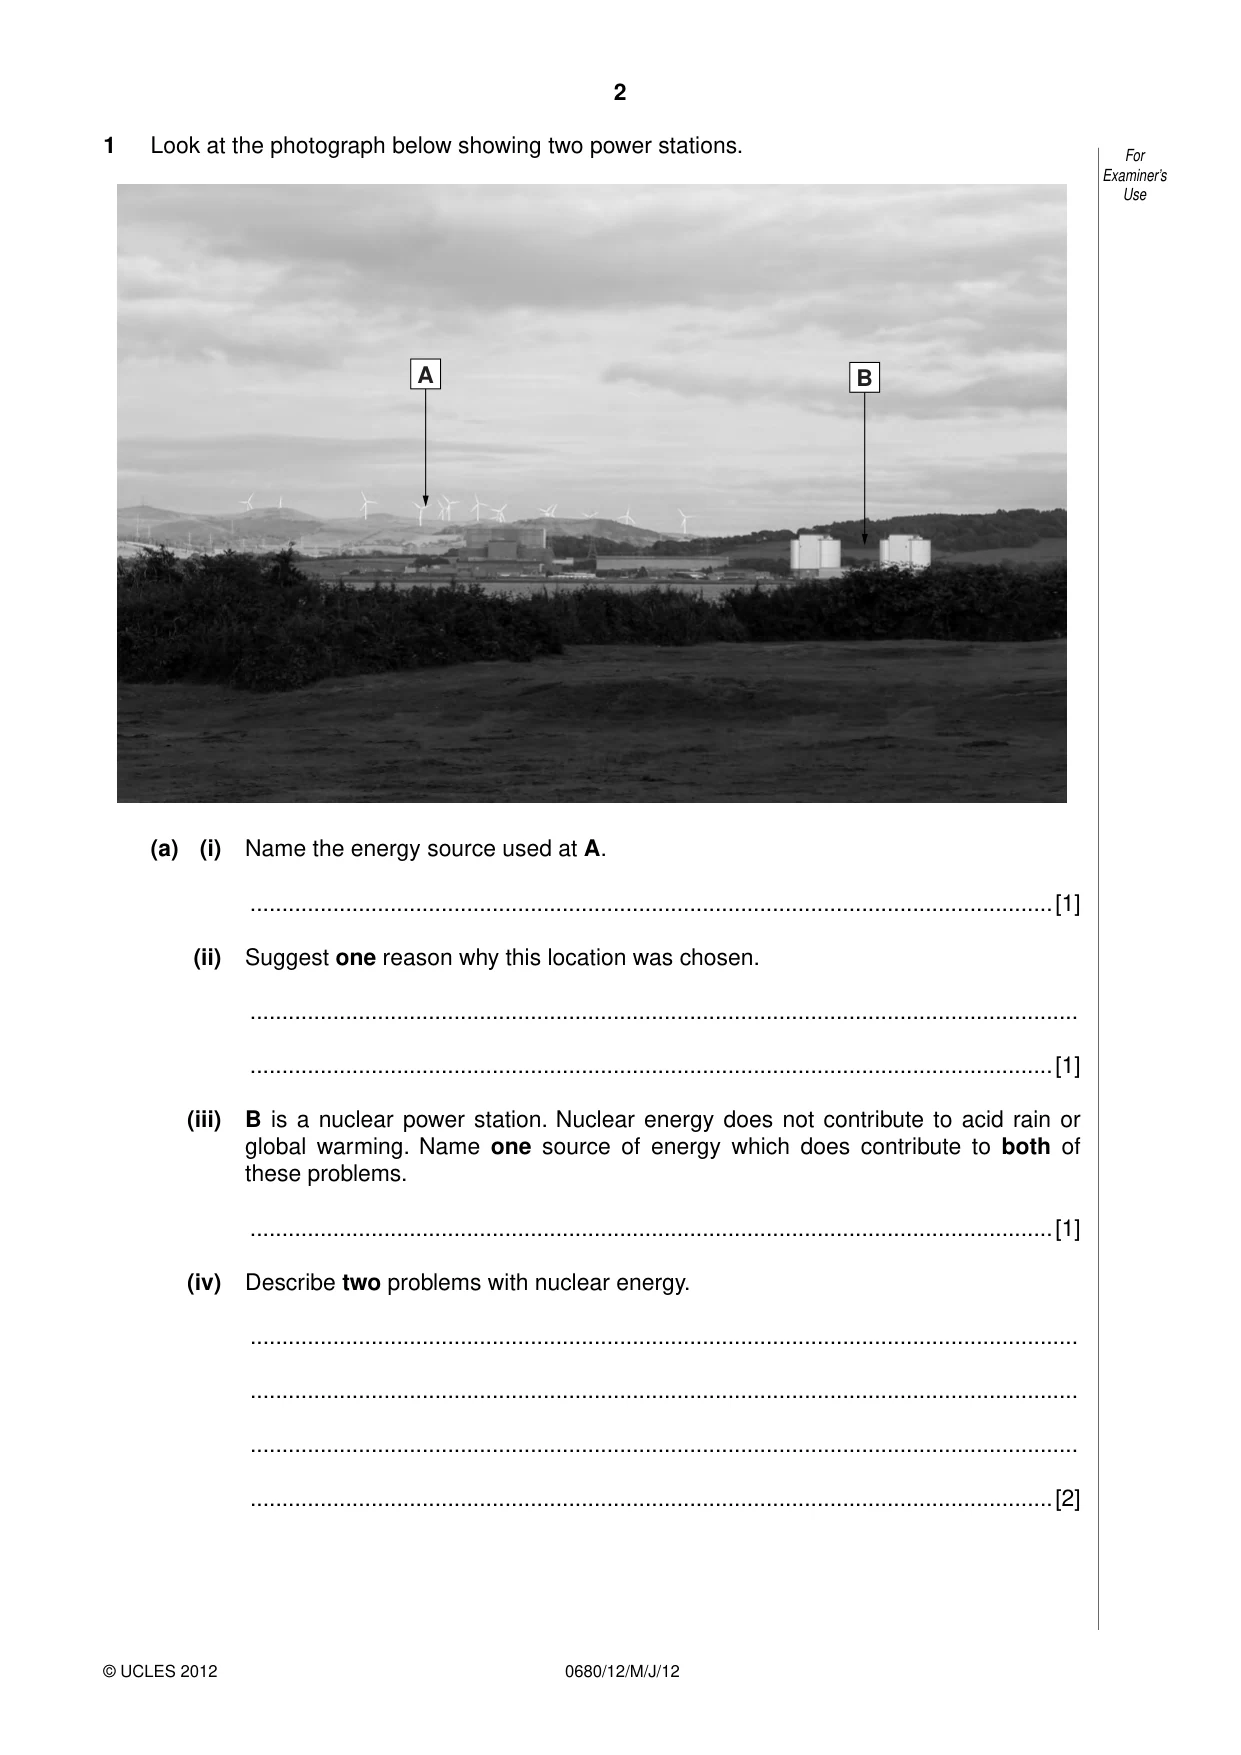
2 © UCLES 2012 For Examiner’s Use 0680/12/M/J/12 1 Look at the photograph below showing two power stations. A B (a) (i) Name the energy source used at A. …[1] (ii) Suggest one reason why this location was chosen. … …[1] (iii) B is a nuclear power station. Nuclear energy does not contribute to acid rain or global warming. Name one source of energy which does contribute to both of these problems. …[1] (iv) Describe two problems with nuclear energy. … … … …[2]
Question paper, page 3
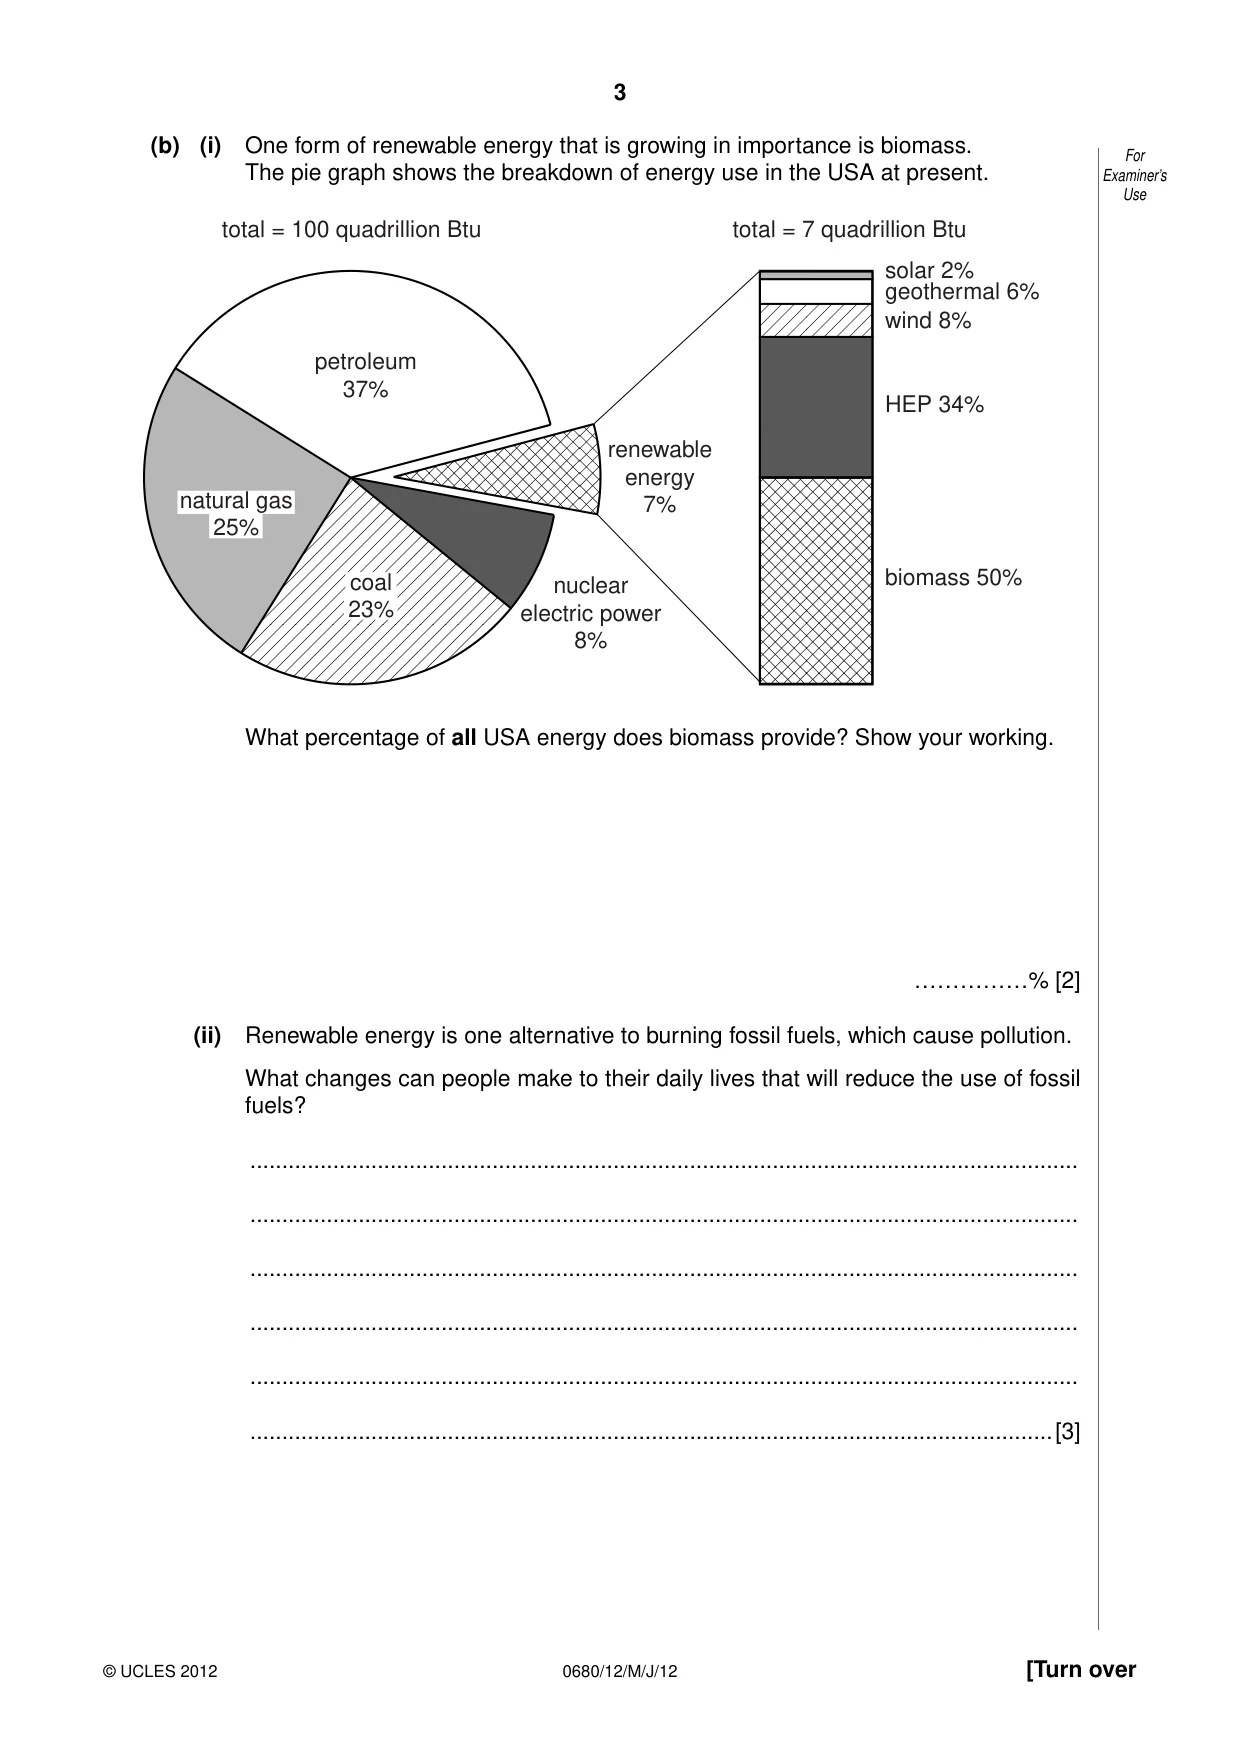
3 © UCLES 2012 [Turn over For Examiner’s Use 0680/12/M/J/12 (b) (i) One form of renewable energy that is growing in importance is biomass. The pie graph shows the breakdown of energy use in the USA at present. petroleum 37% renewable energy 7% total = 100 quadrillion Btu total = 7 quadrillion Btu solar 2% geothermal 6% wind 8% HEP 34% biomass 50% nuclear electric power 8% natural gas 25% coal 23% What percentage of all USA energy does biomass provide? Show your working. ……………% [2] (ii) Renewable energy is one alternative to burning fossil fuels, which cause pollution. What changes can people make to their daily lives that will reduce the use of fossil fuels? … … … … … …[3]
Question paper, page 4
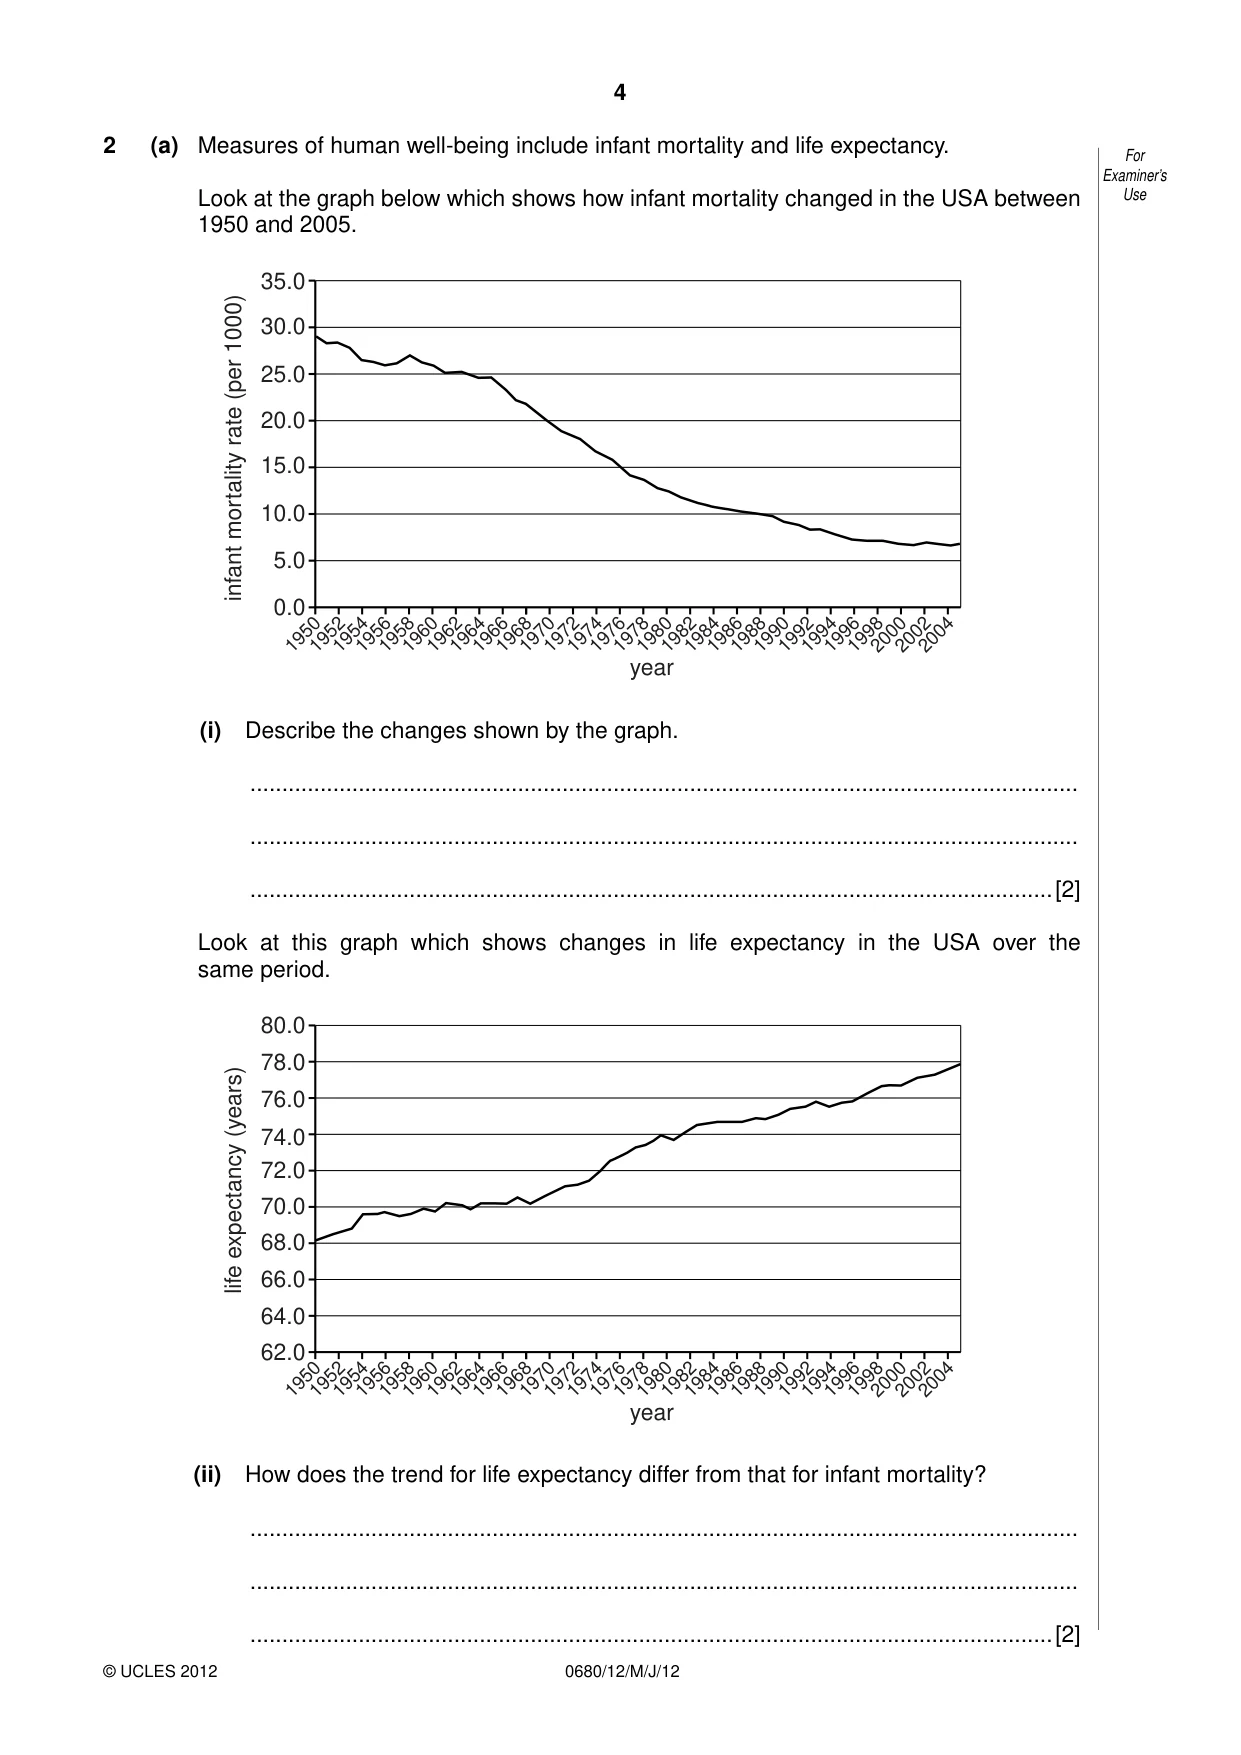
4 © UCLES 2012 For Examiner’s Use 0680/12/M/J/12 2 (a) Measures of human well-being include infant mortality and life expectancy. Look at the graph below which shows how infant mortality changed in the USA between 1950 and 2005. 0.0 5.0 10.0 15.0 20.0 25.0 year infant mortality rate (per 1000) 30.0 35.0 1950 1952 1954 1956 1958 1960 1962 1964 1966 1968 1970 1972 1974 1976 1978 1980 1982 1984 1986 1988 1990 1992 1994 1996 1998 2000 2002 2004 (i) Describe the changes shown by the graph. … … …[2] Look at this graph which shows changes in life expectancy in the USA over the same period. life expectancy (years) 62.0 64.0 66.0 68.0 72.0 70.0 74.0 76.0 78.0 80.0 year 1950 1952 1954 1956 1958 1960 1962 1964 1966 1968 1970 1972 1974 1976 1978 1980 1982 1984 1986 1988 1990 1992 1994 1996 1998 2000 2002 2004 (ii) How does the trend for life expectancy differ from that for infant mortality? … … …[2]
Question paper, page 5
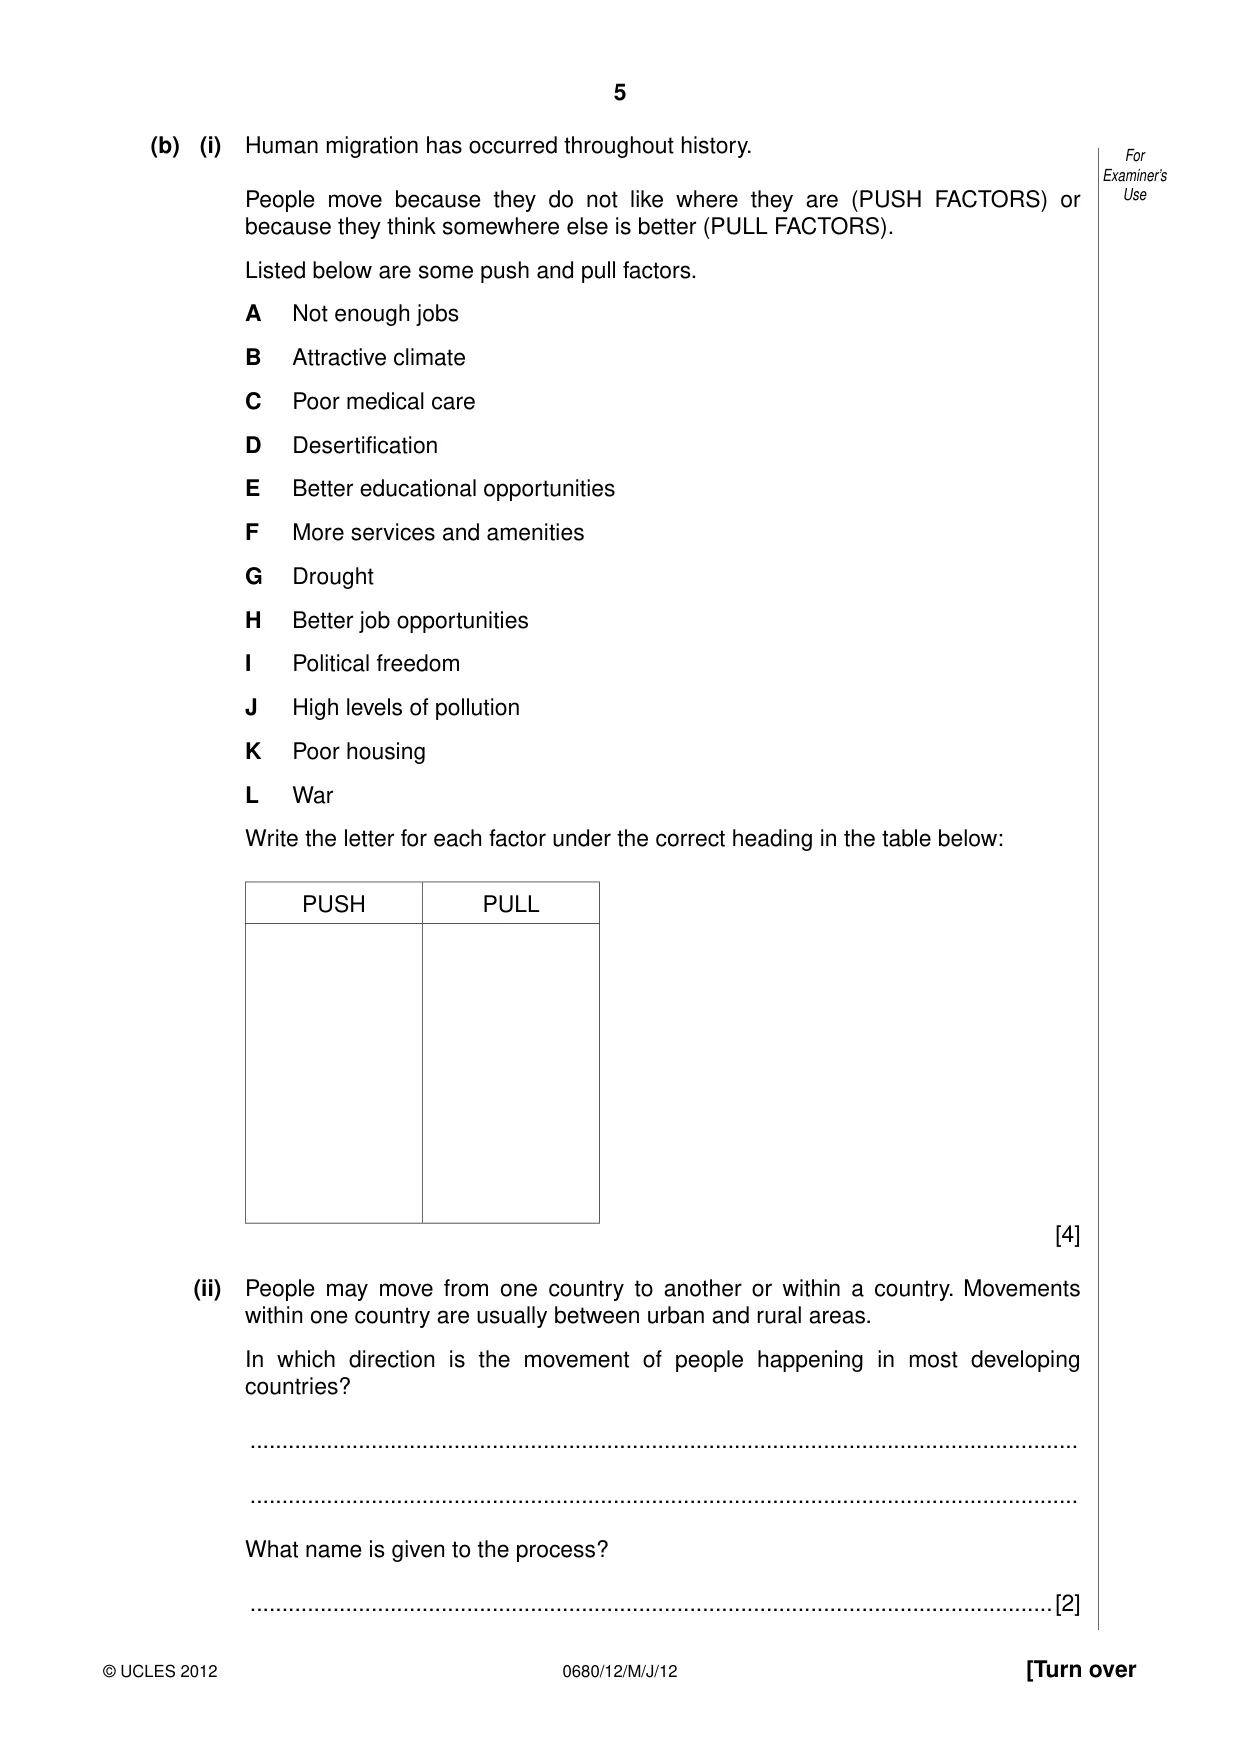
5 © UCLES 2012 [Turn over For Examiner’s Use 0680/12/M/J/12 (b) (i) Human migration has occurred throughout history. People move because they do not like where they are (PUSH FACTORS) or because they think somewhere else is better (PULL FACTORS). Listed below are some push and pull factors. A Not enough jobs B Attractive climate C Poor medical care D Desertification E Better educational opportunities F More services and amenities G Drought H Better job opportunities I Political freedom J High levels of pollution K Poor housing L War Write the letter for each factor under the correct heading in the table below: PUSH PULL [4] (ii) People may move from one country to another or within a country. Movements within one country are usually between urban and rural areas. In which direction is the movement of people happening in most developing countries? … … What name is given to the process? …[2]
Question paper, page 6
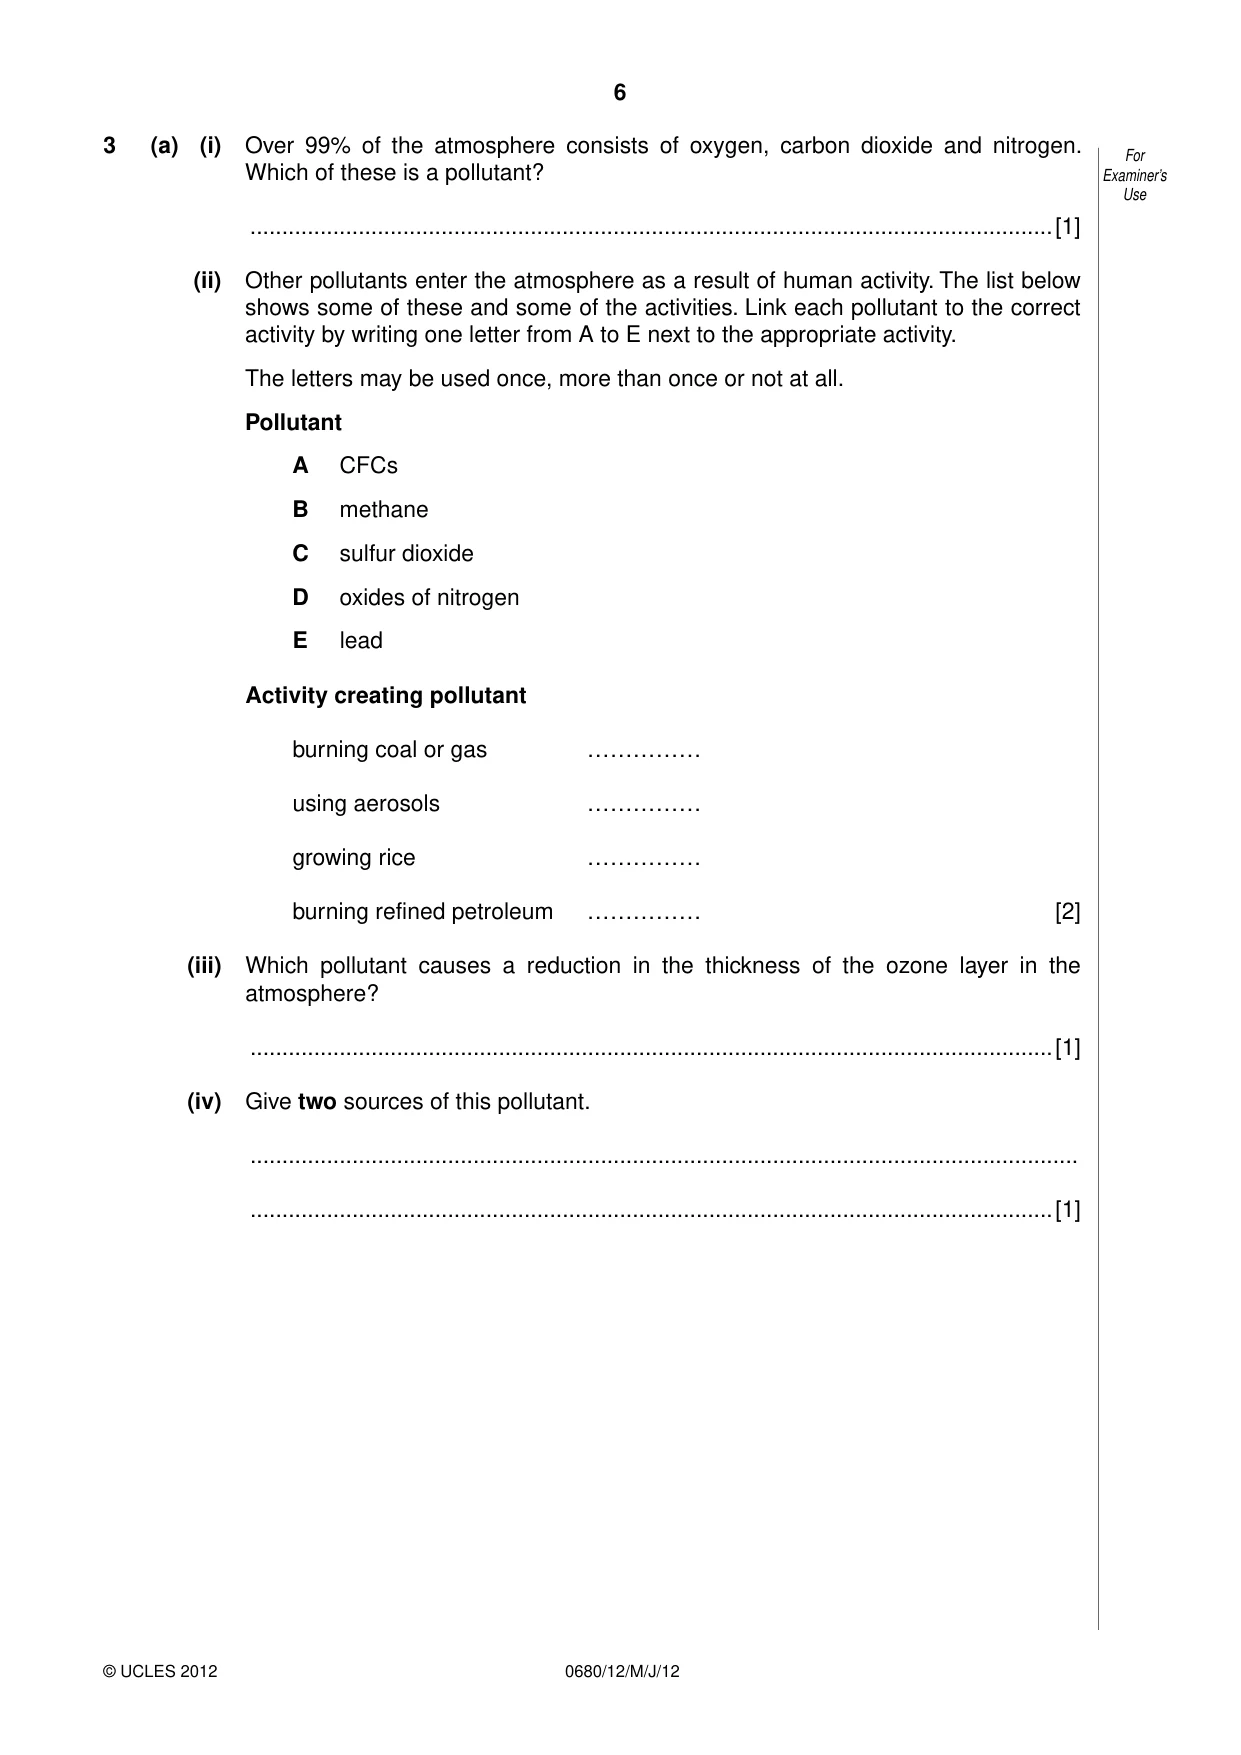
6 © UCLES 2012 For Examiner’s Use 0680/12/M/J/12 3 (a) (i) Over 99% of the atmosphere consists of oxygen, carbon dioxide and nitrogen. Which of these is a pollutant? …[1] (ii) Other pollutants enter the atmosphere as a result of human activity. The list below shows some of these and some of the activities. Link each pollutant to the correct activity by writing one letter from A to E next to the appropriate activity. The letters may be used once, more than once or not at all. Pollutant A CFCs B methane C sulfur dioxide D oxides of nitrogen E lead Activity creating pollutant burning coal or gas …………… using aerosols …………… growing rice …………… burning refined petroleum …………… [2] (iii) Which pollutant causes a reduction in the thickness of the ozone layer in the atmosphere? …[1] (iv) Give two sources of this pollutant. … …[1]
Question paper, page 7
7 © UCLES 2012 [Turn over For Examiner’s Use 0680/12/M/J/12 (b) (i) How might the ozone hole affect the environment and humans? … … … … …[3] (ii) Describe strategies that have been used to reduce the problem of the ozone hole. … … … …[2]
Question paper, page 8
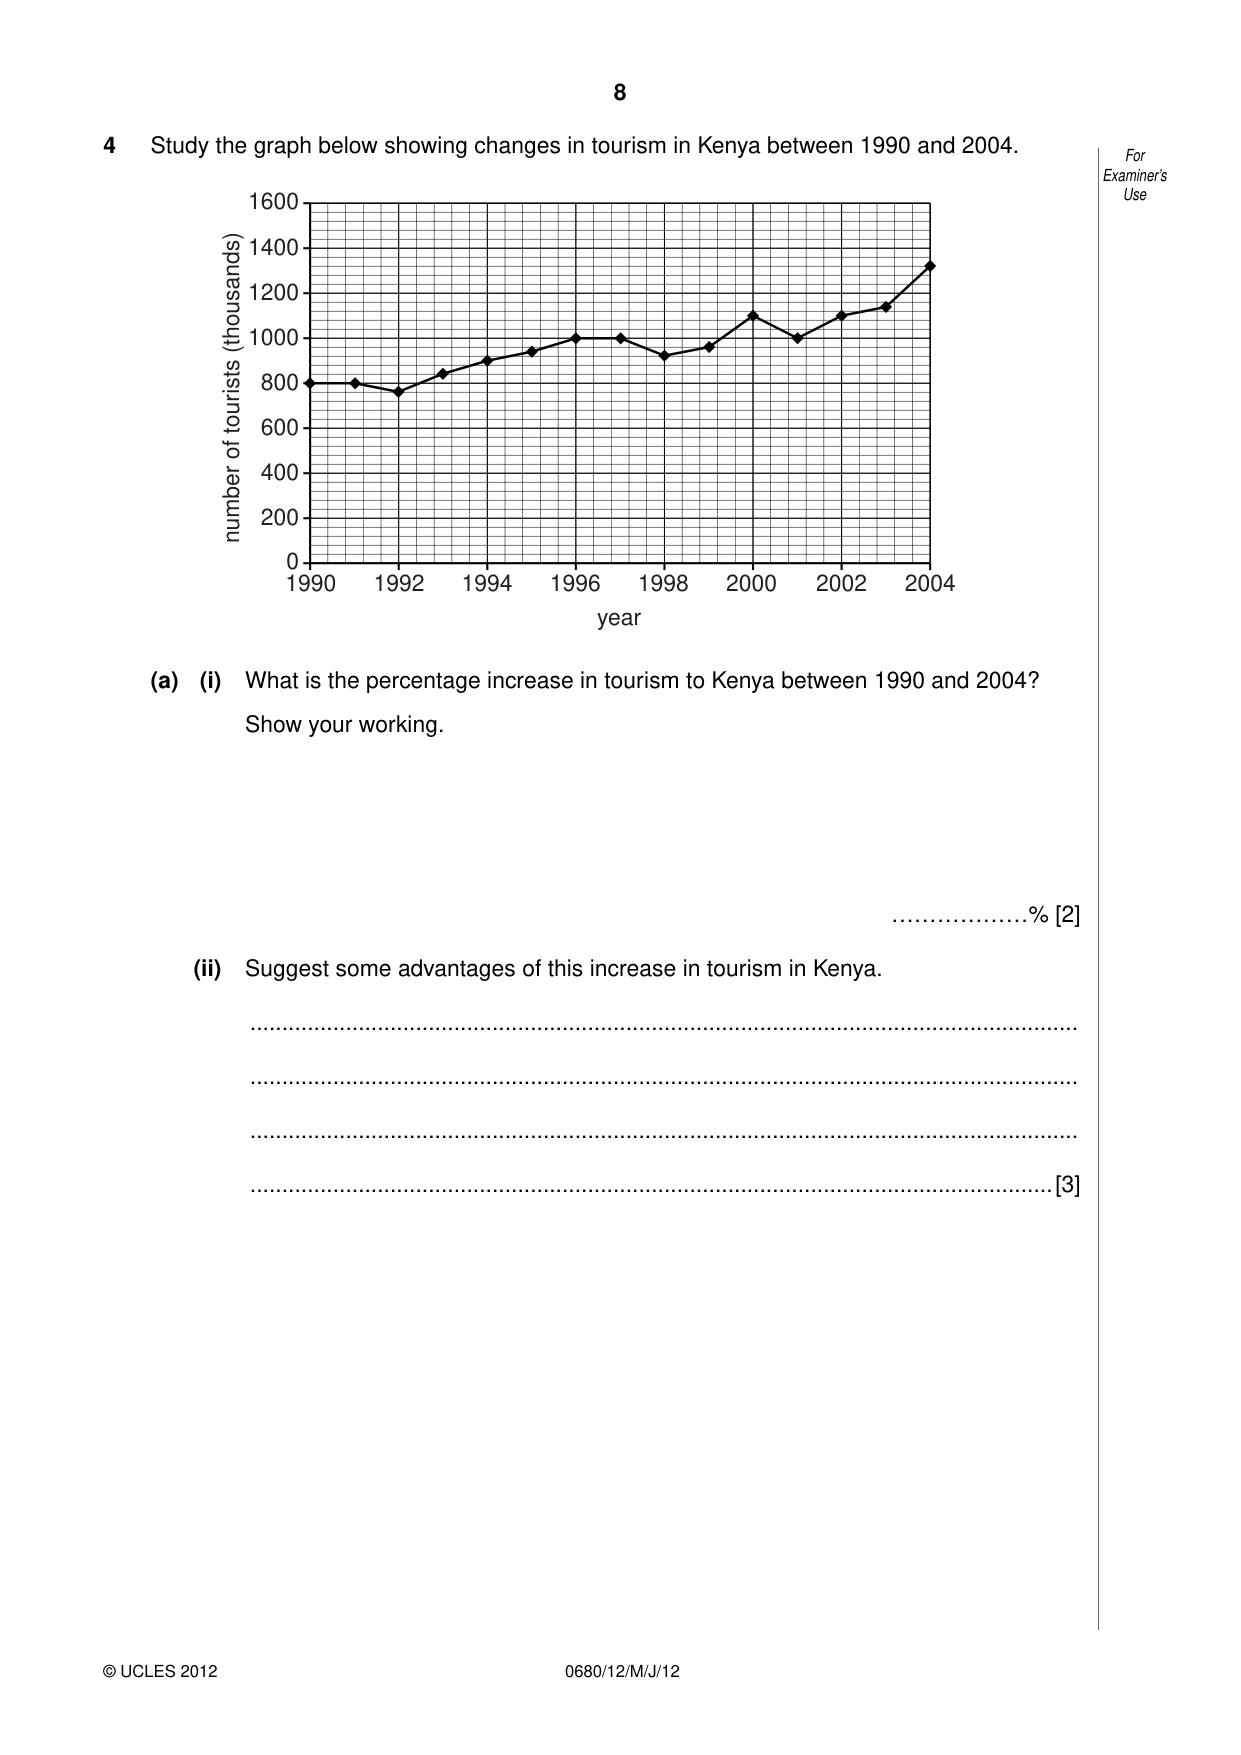
8 © UCLES 2012 For Examiner’s Use 0680/12/M/J/12 4 Study the graph below showing changes in tourism in Kenya between 1990 and 2004. 1600 1400 1200 1990 1992 1994 1996 1998 year number of tourists (thousands) 2000 2002 2004 1000 800 600 400 200 0 (a) (i) What is the percentage increase in tourism to Kenya between 1990 and 2004? Show your working. ………………% [2] (ii) Suggest some advantages of this increase in tourism in Kenya. … … … …[3]
Question paper, page 9
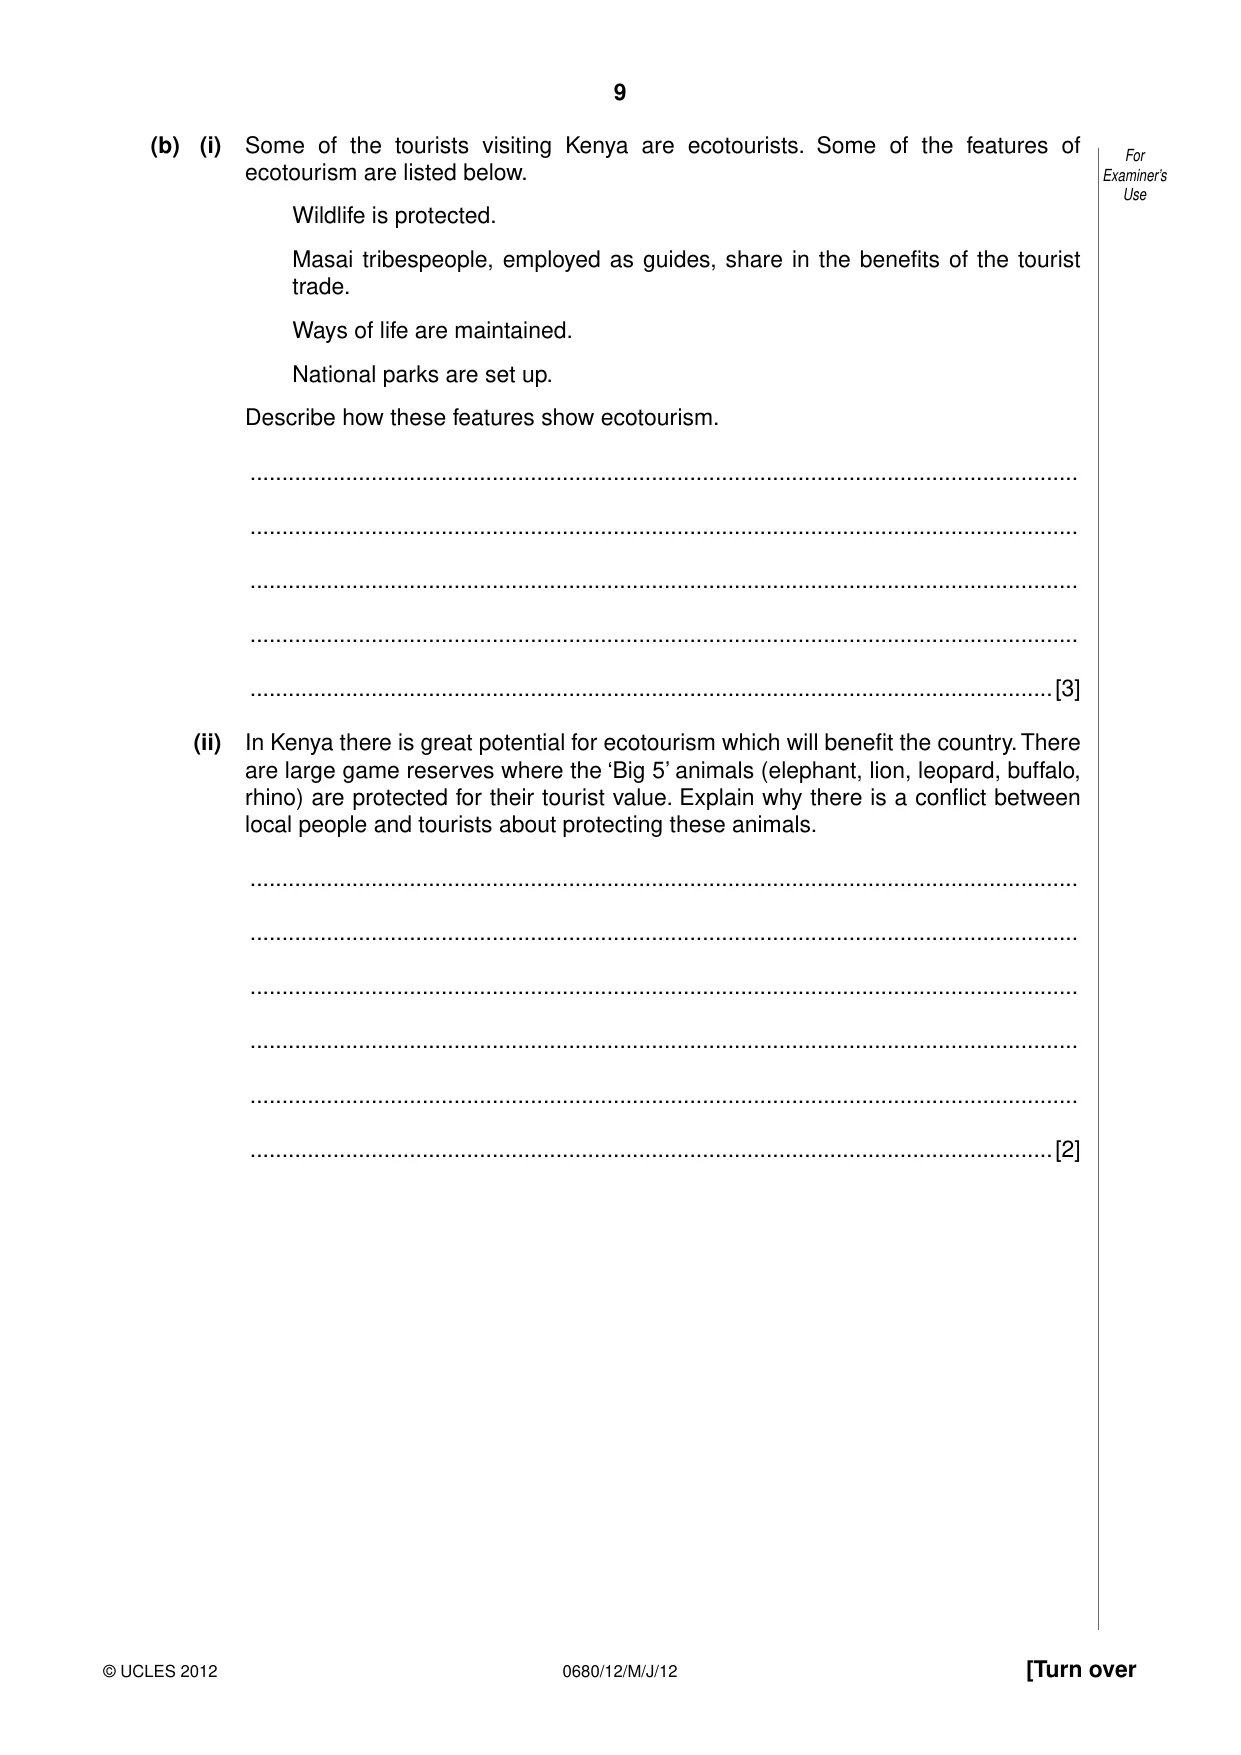
9 © UCLES 2012 [Turn over For Examiner’s Use 0680/12/M/J/12 (b) (i) Some of the tourists visiting Kenya are ecotourists. Some of the features of ecotourism are listed below. Wildlife is protected. Masai tribespeople, employed as guides, share in the benefits of the tourist trade. Ways of life are maintained. National parks are set up. Describe how these features show ecotourism. … … … … …[3] (ii) In Kenya there is great potential for ecotourism which will benefit the country. There are large game reserves where the ‘Big 5’ animals (elephant, lion, leopard, buffalo, rhino) are protected for their tourist value. Explain why there is a conflict between local people and tourists about protecting these animals. … … … … … …[2]
Question paper, page 10
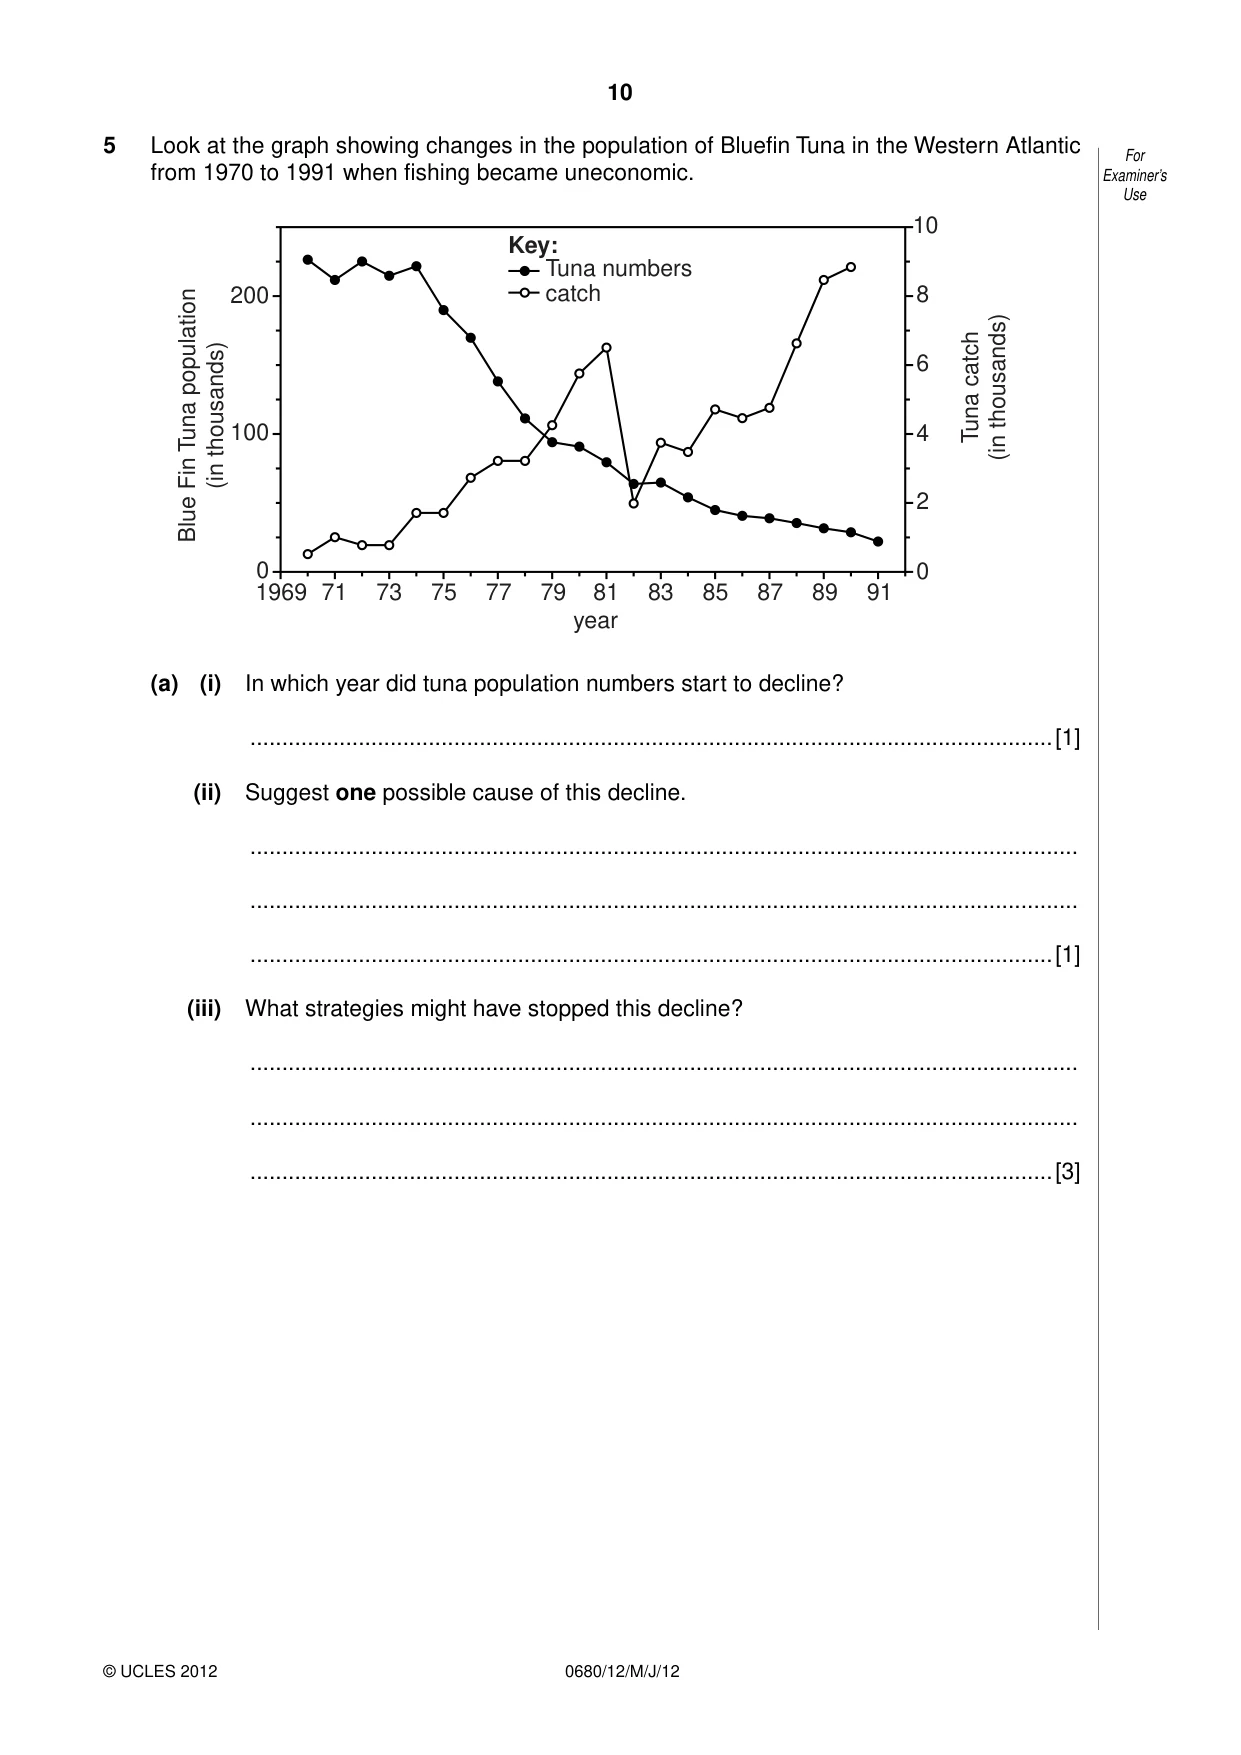
10 © UCLES 2012 For Examiner’s Use 0680/12/M/J/12 5 Look at the graph showing changes in the population of Bluefin Tuna in the Western Atlantic from 1970 to 1991 when fishing became uneconomic. 71 1969 0 100 Blue Fin Tuna population (in thousands) Tuna catch (in thousands) 200 73 75 77 79 81 year 91 0 2 4 6 8 10 catch Tuna numbers Key: 83 85 87 89 (a) (i) In which year did tuna population numbers start to decline? …[1] (ii) Suggest one possible cause of this decline. … … …[1] (iii) What strategies might have stopped this decline? … … …[3]
Question paper, page 11
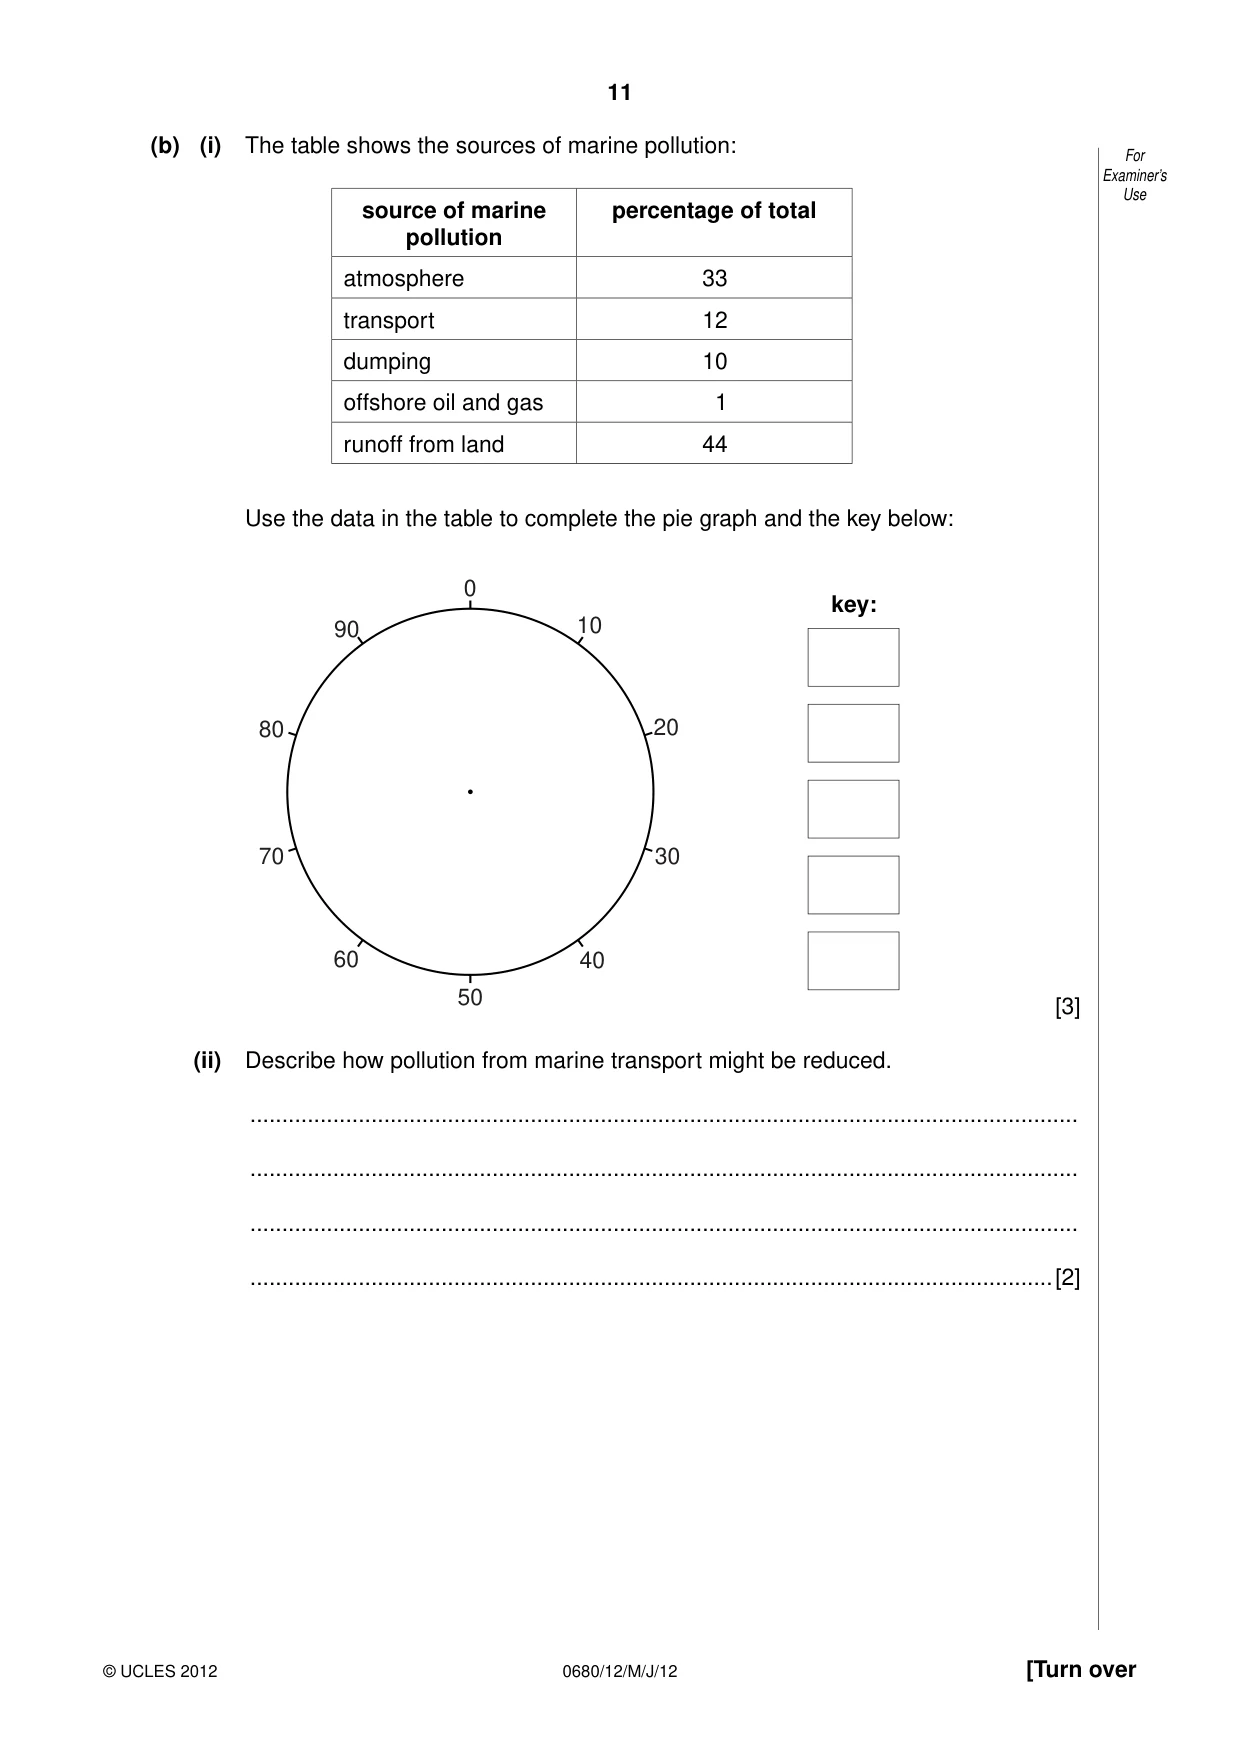
11 © UCLES 2012 [Turn over For Examiner’s Use 0680/12/M/J/12 (b) (i) The table shows the sources of marine pollution: source of marine pollution percentage of total atmosphere 33 transport 12 dumping 10 offshore oil and gas 1 runoff from land 44 Use the data in the table to complete the pie graph and the key below: key: 0 10 20 30 40 50 60 70 80 90 [3] (ii) Describe how pollution from marine transport might be reduced. … … … …[2]
Question paper, page 12
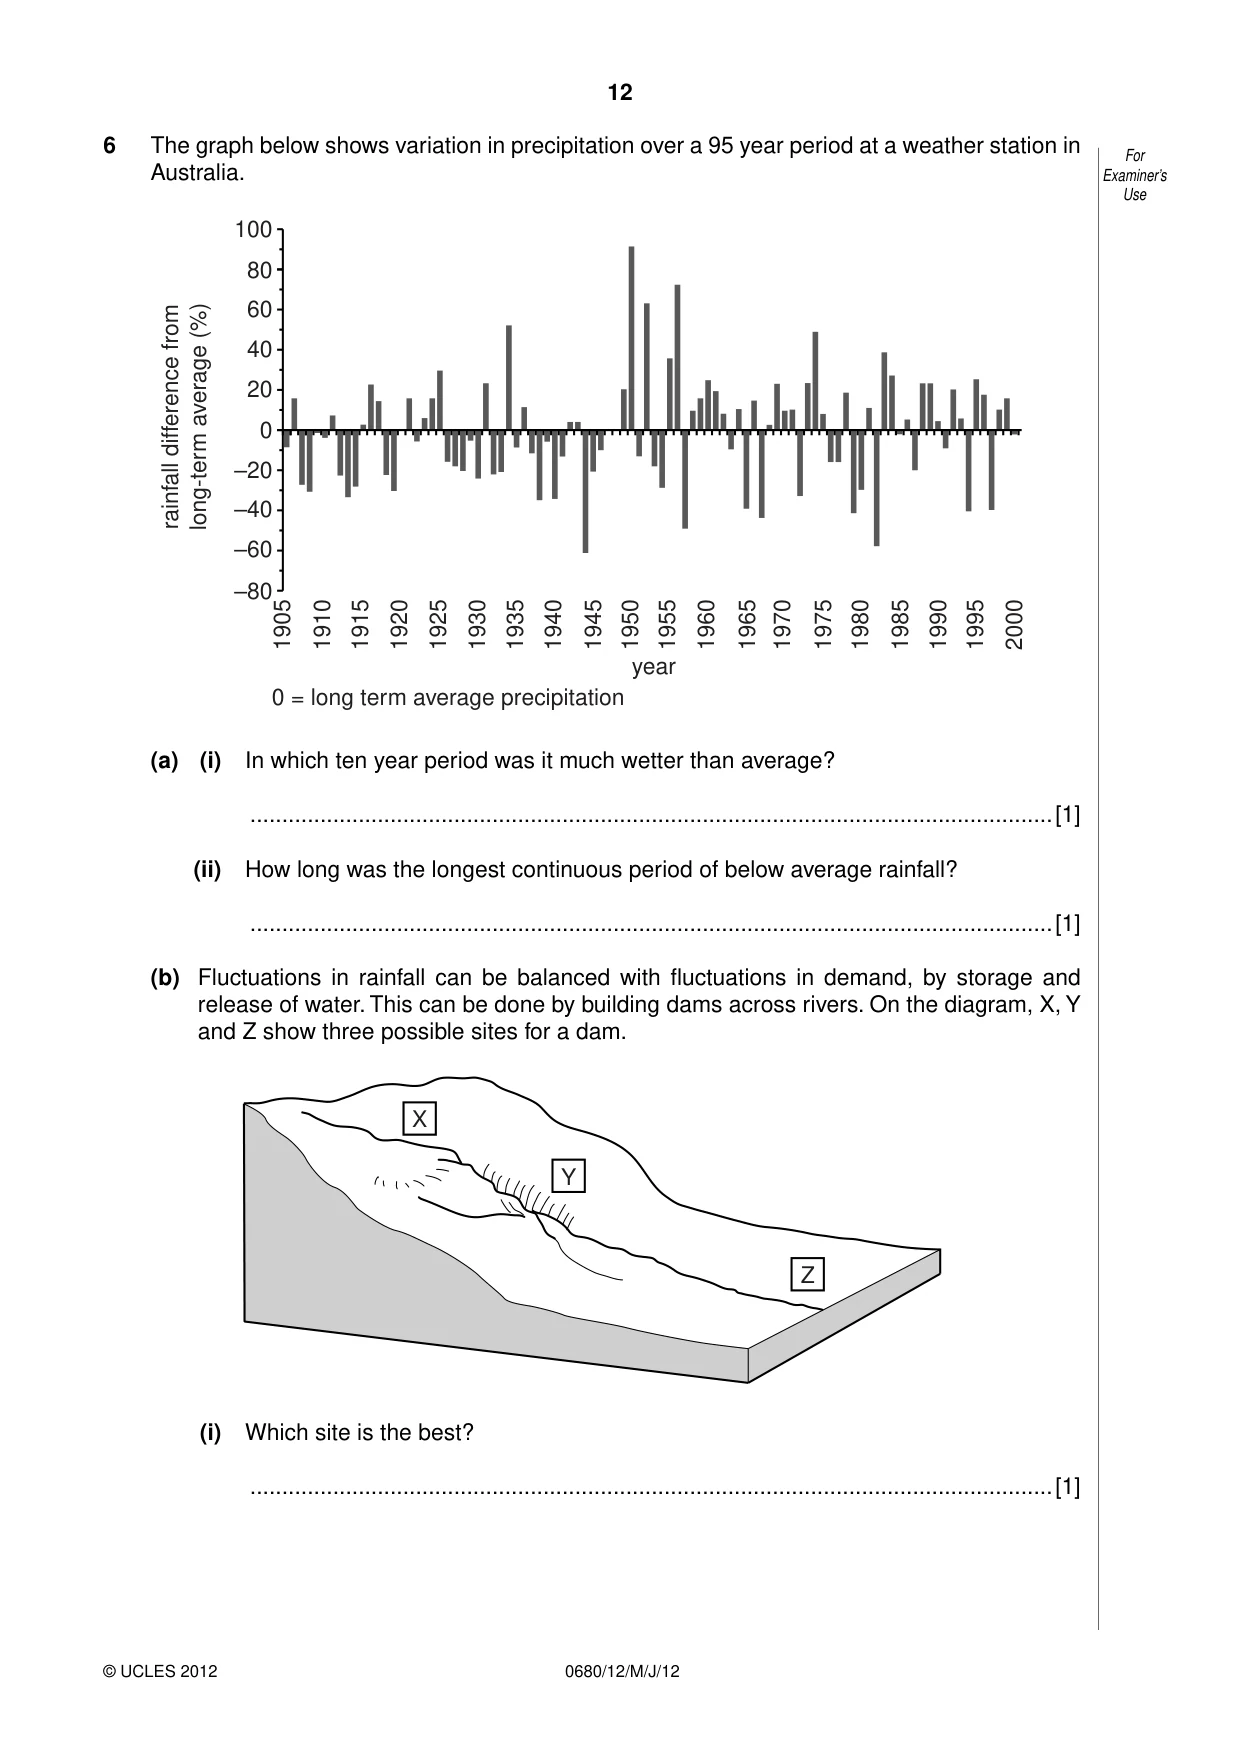
12 © UCLES 2012 For Examiner’s Use 0680/12/M/J/12 6 The graph below shows variation in precipitation over a 95 year period at a weather station in Australia. 100 80 60 40 20 0 0 = long term average precipitation –20 –40 –60 year rainfall difference from long-term average (%) –80 1905 1910 1915 1920 1925 1930 1935 1940 1945 1950 1955 1960 1965 1970 1975 1980 1985 1990 1995 2000 (a) (i) In which ten year period was it much wetter than average? …[1] (ii) How long was the longest continuous period of below average rainfall? …[1] (b) Fluctuations in rainfall can be balanced with fluctuations in demand, by storage and release of water. This can be done by building dams across rivers. On the diagram, X, Y and Z show three possible sites for a dam. X Y Z (i) Which site is the best? …[1]
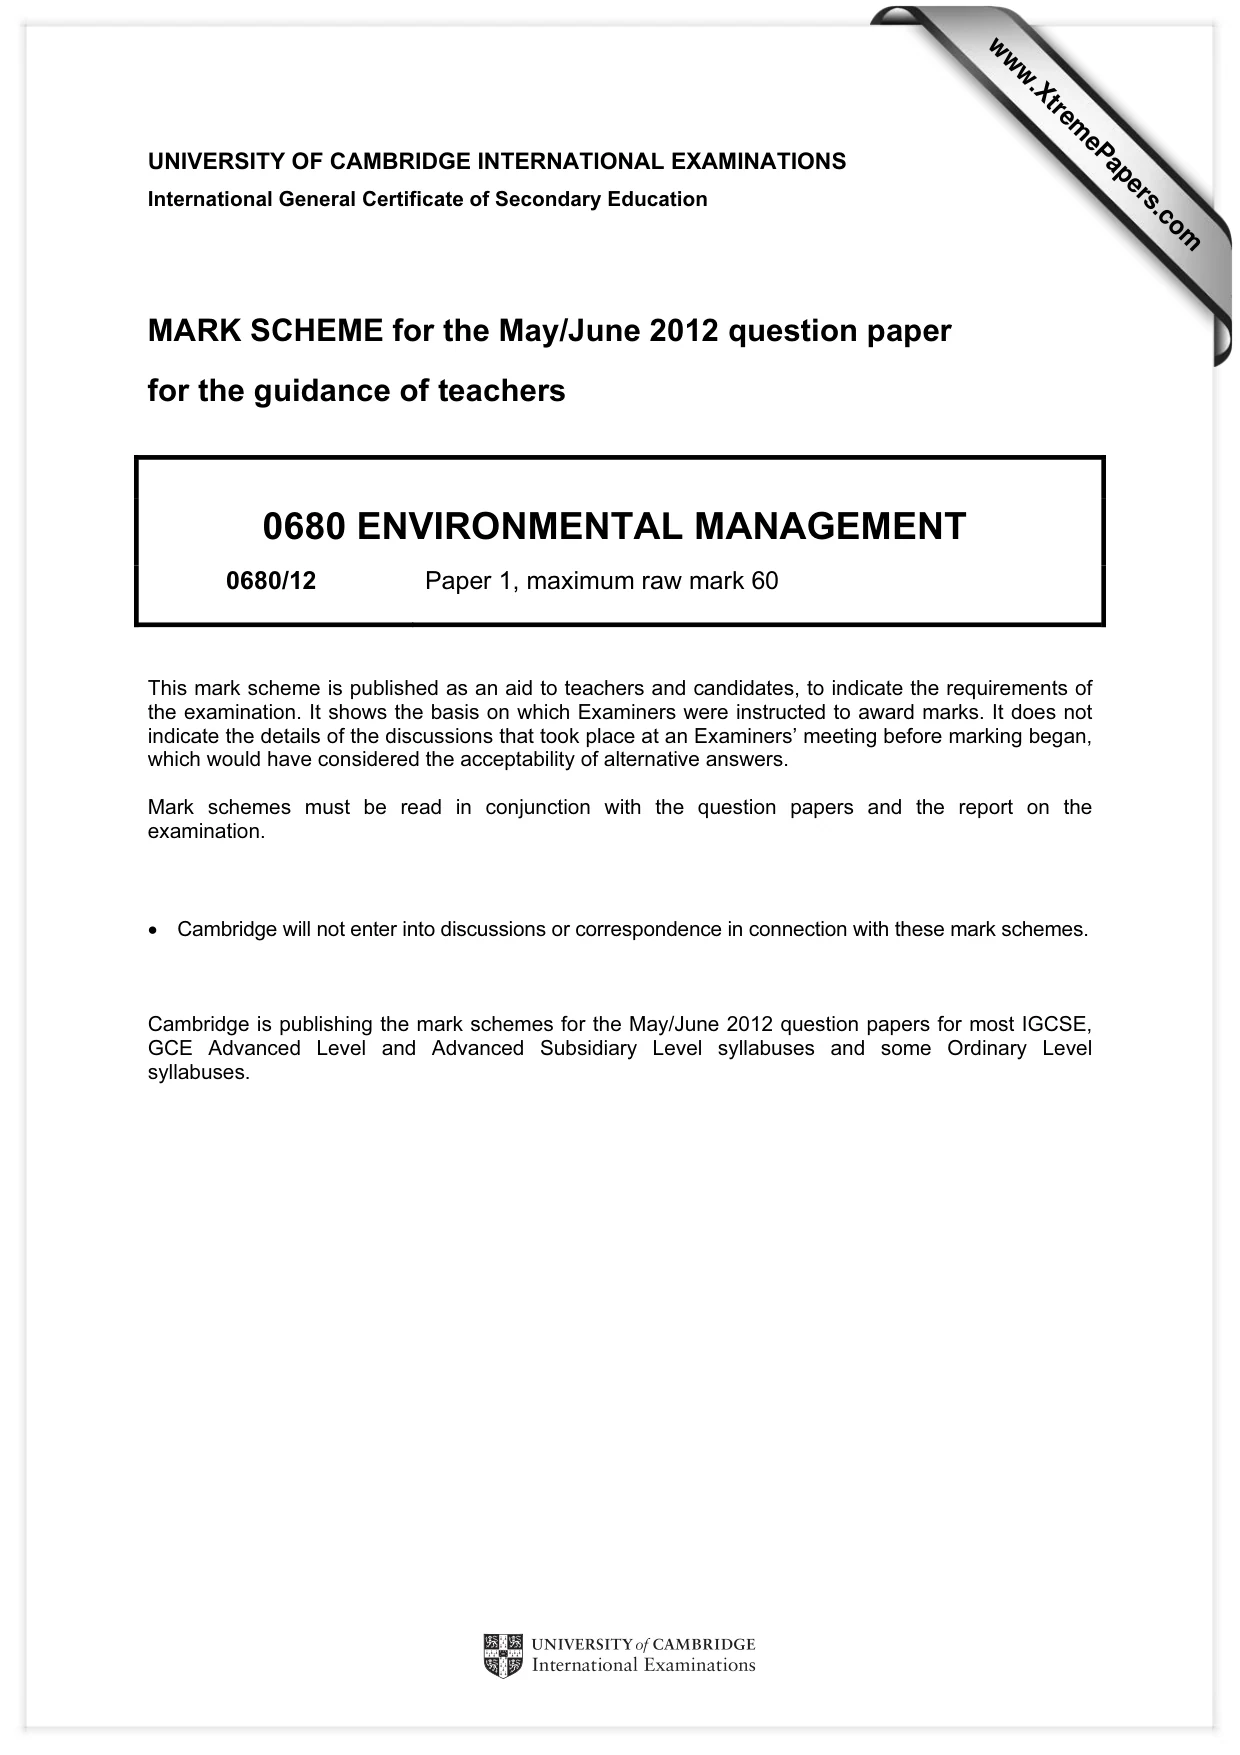
Question paper, page 13
13 © UCLES 2012 For Examiner’s Use 0680/12/M/J/12 (ii) Explain why the site you have chosen is better than the other two. … … … … … …[4] (c) Water is essential for life, but in some parts of the world it can carry diseases. Complete the table below listing water-related diseases. disease type Bilharzia water-borne Malaria [3]
Question paper, page 14
14 0680/12/M/J/12 © UCLES 2012 BLANK PAGE
Question paper, page 15
15 0680/12/M/J/12 © UCLES 2012 BLANK PAGE
Question paper, page 16
16 0680/12/M/J/12 © UCLES 2012 Permission to reproduce items where third-party owned material protected by copyright is included has been sought and cleared where possible. Every reasonable effort has been made by the publisher (UCLES) to trace copyright holders, but if any items requiring clearance have unwittingly been included, the publisher will be pleased to make amends at the earliest possible opportunity. University of Cambridge International Examinations is part of the Cambridge Assessment Group. Cambridge Assessment is the brand name of University of Cambridge Local Examinations Syndicate (UCLES), which is itself a department of the University of Cambridge. BLANK PAGE
Mark scheme, page 1
UNIVERSITY OF CAMBRIDGE INTERNATIONAL EXAMINATIONS International General Certificate of Secondary Education MARK SCHEME for the May/June 2012 question paper for the guidance of teachers 0680 ENVIRONMENTAL MANAGEMENT 0680/12 Paper 1, maximum raw mark 60 This mark scheme is published as an aid to teachers and candidates, to indicate the requirements of the examination. It shows the basis on which Examiners were instructed to award marks. It does not indicate the details of the discussions that took place at an Examiners’ meeting before marking began, which would have considered the acceptability of alternative answers. Mark schemes must be read in conjunction with the question papers and the report on the examination. • Cambridge will not enter into discussions or correspondence in connection with these mark schemes. Cambridge is publishing the mark schemes for the May/June 2012 question papers for most IGCSE, GCE Advanced Level and Advanced Subsidiary Level syllabuses and some Ordinary Level syllabuses. www.XtremePapers.com
Mark scheme, page 2
Page 2 Mark Scheme: Teachers’ version Syllabus Paper IGCSE – May/June 2012 0680 12 © University of Cambridge International Examinations 2012 General notes Symbols used in Environmental Management mark schemes. / separates alternatives for a marking point – other valid ways of expressing the same idea are also credited ; separates points for the award of a mark [3] indicates the number of marks available [max 3] the number shows the maximum number of marks available for the question where there are more marking points than total marks available [max 3] when part of the marks of a question must come from part of the mark scheme, this is indicated by non-bold marks showing the internal maxima for different parts of the question these non-bold marks are also used to show marks for bands where banded mark schemes are used italic indicates that this is information about the marking points and is not required to gain credit italic text is also used for comments about alternatives that should be accepted, ignored or rejected ora or reverse argument – shows that an argument from an alternative viewpoint will be credited AW alternative wording, sometimes called ‘or words to that effect’ – AW is used when there are many different ways of expressing the same idea ( ) the word / phrase in brackets is not required to gain marks but sets the context of the response for credit e.g. (nuclear) waste – nuclear is not needed but if it was described as a domestic waste then no mark is awarded volcanic underlined words – the answer must contain exactly this word ecf error carried forward – if an incorrect answer is given to part of a question, and this answer is subsequently used by a candidate in later parts of the question, this indicates that the candidate’s incorrect answer will be used as a starting point for marking the later parts of the question
Mark scheme, page 3
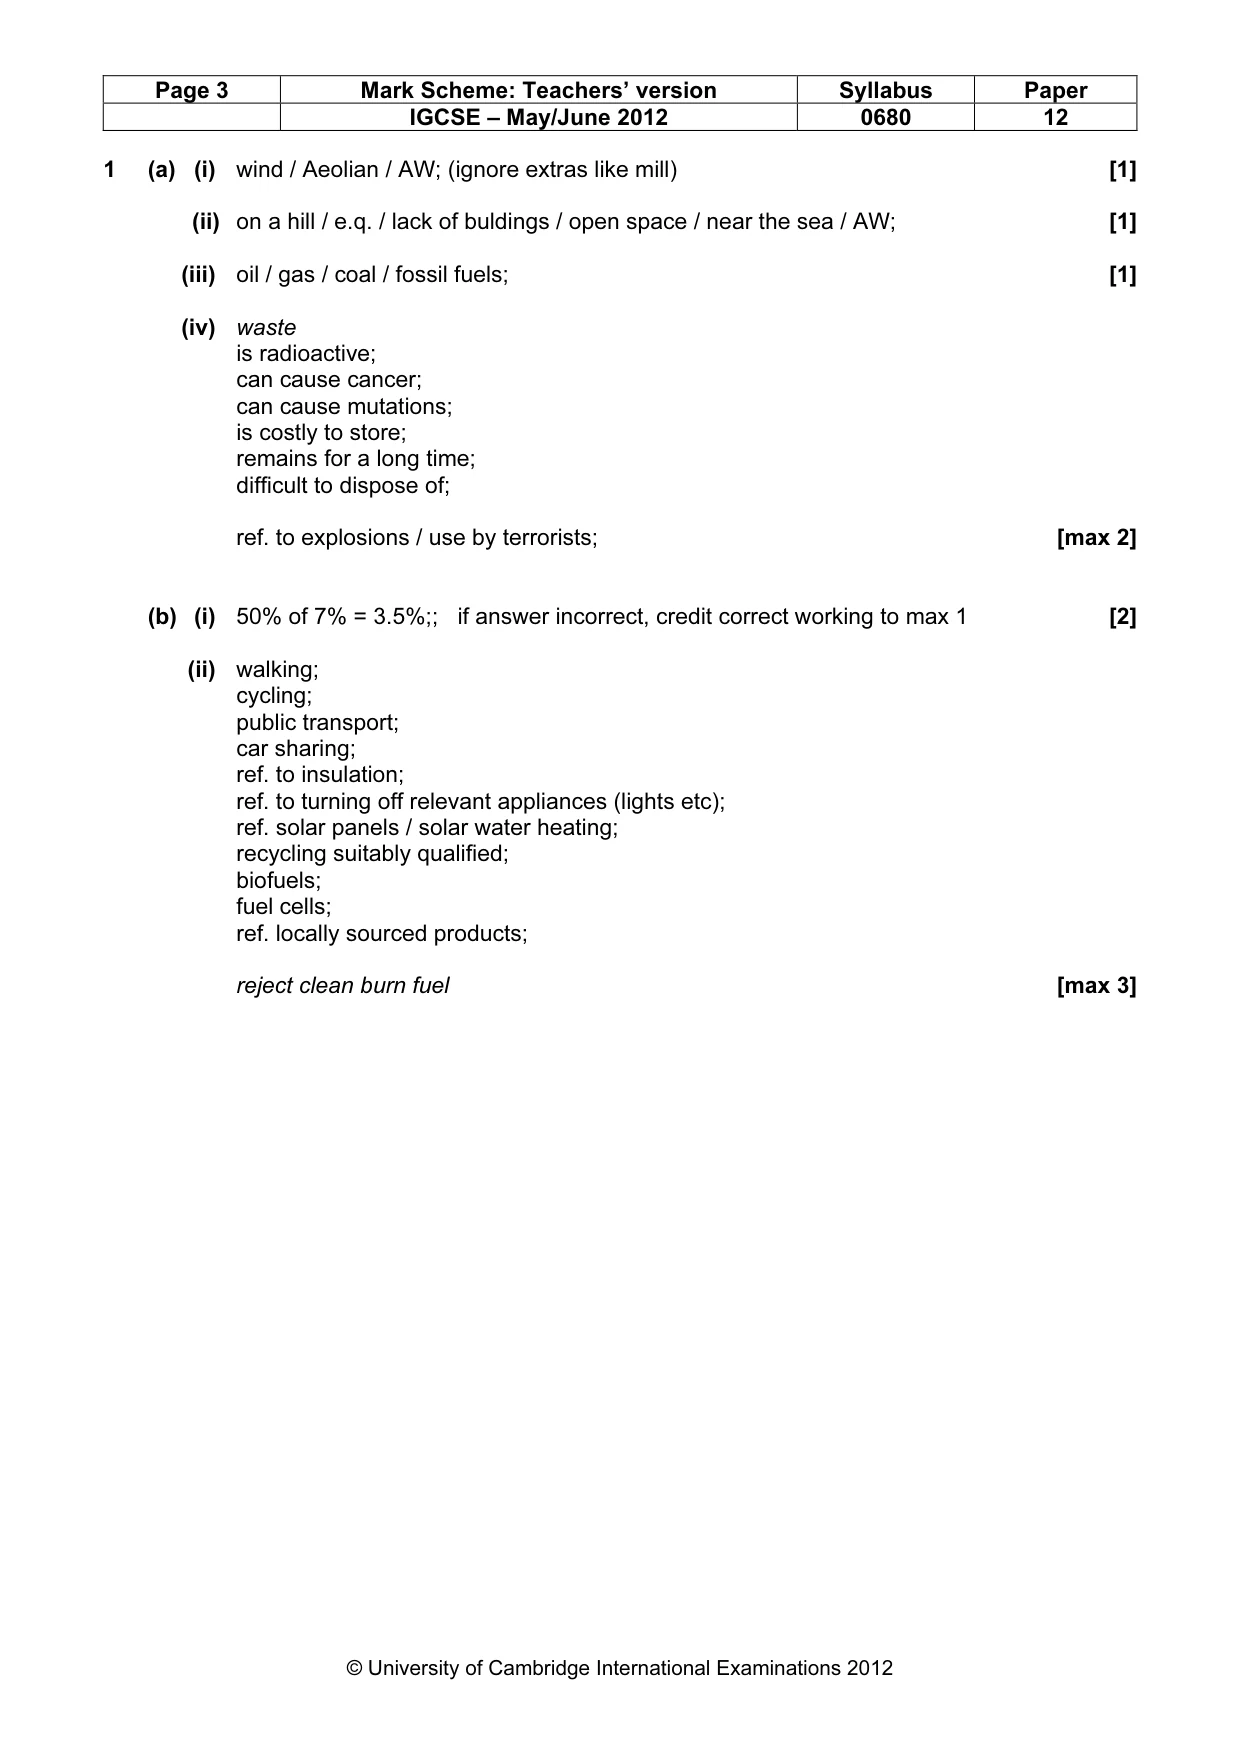
Page 3 Mark Scheme: Teachers’ version Syllabus Paper IGCSE – May/June 2012 0680 12 © University of Cambridge International Examinations 2012 1 (a) (i) wind / Aeolian / AW; (ignore extras like mill) [1] (ii) on a hill / e.q. / lack of buldings / open space / near the sea / AW; [1] (iii) oil / gas / coal / fossil fuels; [1] (iv) waste is radioactive; can cause cancer; can cause mutations; is costly to store; remains for a long time; difficult to dispose of; ref. to explosions / use by terrorists; [max 2] (b) (i) 50% of 7% = 3.5%;; if answer incorrect, credit correct working to max 1 [2] (ii) walking; cycling; public transport; car sharing; ref. to insulation; ref. to turning off relevant appliances (lights etc); ref. solar panels / solar water heating; recycling suitably qualified; biofuels; fuel cells; ref. locally sourced products; reject clean burn fuel [max 3]
Mark scheme, page 4
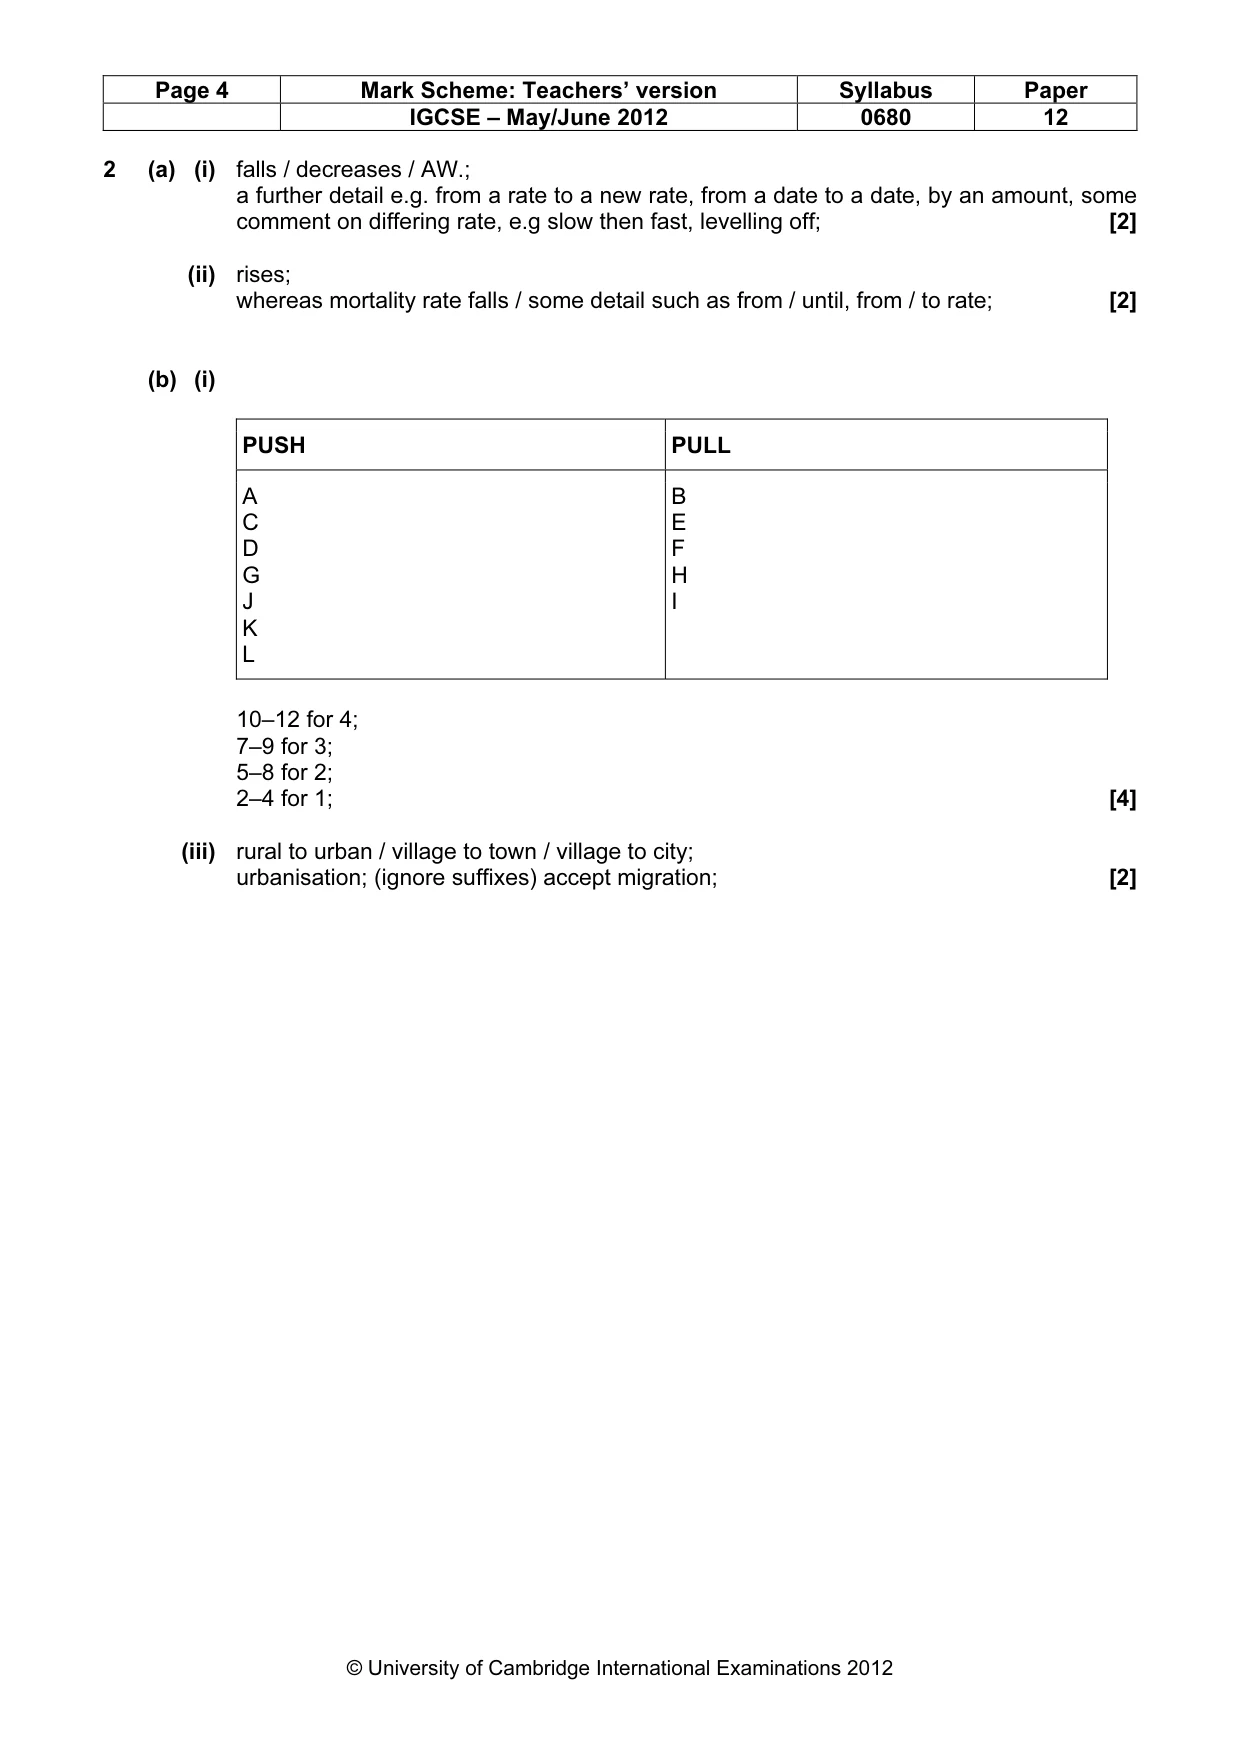
Page 4 Mark Scheme: Teachers’ version Syllabus Paper IGCSE – May/June 2012 0680 12 © University of Cambridge International Examinations 2012 2 (a) (i) falls / decreases / AW.; a further detail e.g. from a rate to a new rate, from a date to a date, by an amount, some comment on differing rate, e.g slow then fast, levelling off; [2] (ii) rises; whereas mortality rate falls / some detail such as from / until, from / to rate; [2] (b) (i) PUSH PULL A C D G J K L B E F H I 10–12 for 4; 7–9 for 3; 5–8 for 2; 2–4 for 1; [4] (iii) rural to urban / village to town / village to city; urbanisation; (ignore suffixes) accept migration; [2]
Mark scheme, page 5
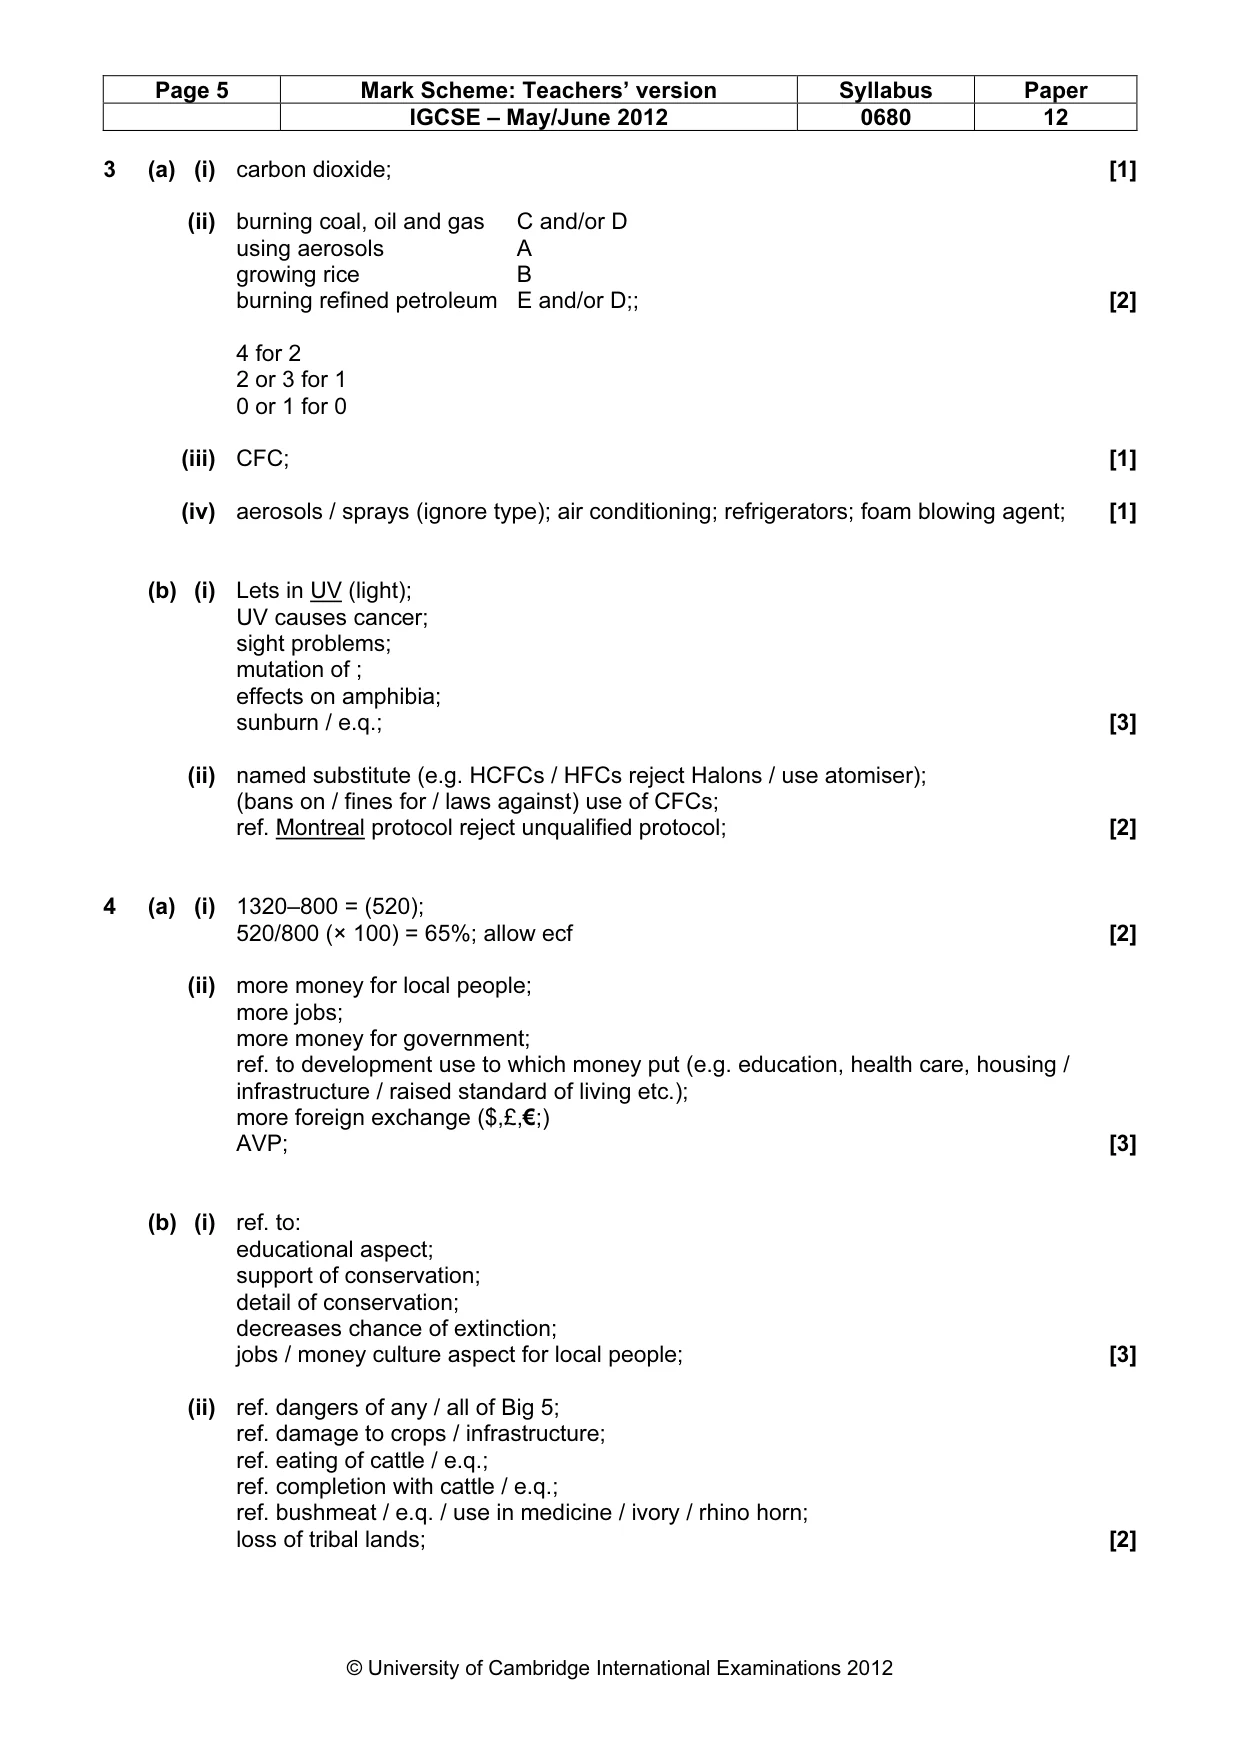
Page 5 Mark Scheme: Teachers’ version Syllabus Paper IGCSE – May/June 2012 0680 12 © University of Cambridge International Examinations 2012 3 (a) (i) carbon dioxide; [1] (ii) burning coal, oil and gas C and/or D using aerosols A growing rice B burning refined petroleum E and/or D;; [2] 4 for 2 2 or 3 for 1 0 or 1 for 0 (iii) CFC; [1] (iv) aerosols / sprays (ignore type); air conditioning; refrigerators; foam blowing agent; [1] (b) (i) Lets in UV (light); UV causes cancer; sight problems; mutation of ; effects on amphibia; sunburn / e.q.; [3] (ii) named substitute (e.g. HCFCs / HFCs reject Halons / use atomiser); (bans on / fines for / laws against) use of CFCs; ref. Montreal protocol reject unqualified protocol; [2] 4 (a) (i) 1320–800 = (520); 520/800 (× 100) = 65%; allow ecf [2] (ii) more money for local people; more jobs; more money for government; ref. to development use to which money put (e.g. education, health care, housing / infrastructure / raised standard of living etc.); more foreign exchange ($,£,€;) AVP; [3] (b) (i) ref. to: educational aspect; support of conservation; detail of conservation; decreases chance of extinction; jobs / money culture aspect for local people; [3] (ii) ref. dangers of any / all of Big 5; ref. damage to crops / infrastructure; ref. eating of cattle / e.q.; ref. completion with cattle / e.q.; ref. bushmeat / e.q. / use in medicine / ivory / rhino horn; loss of tribal lands; [2]
Mark scheme, page 6
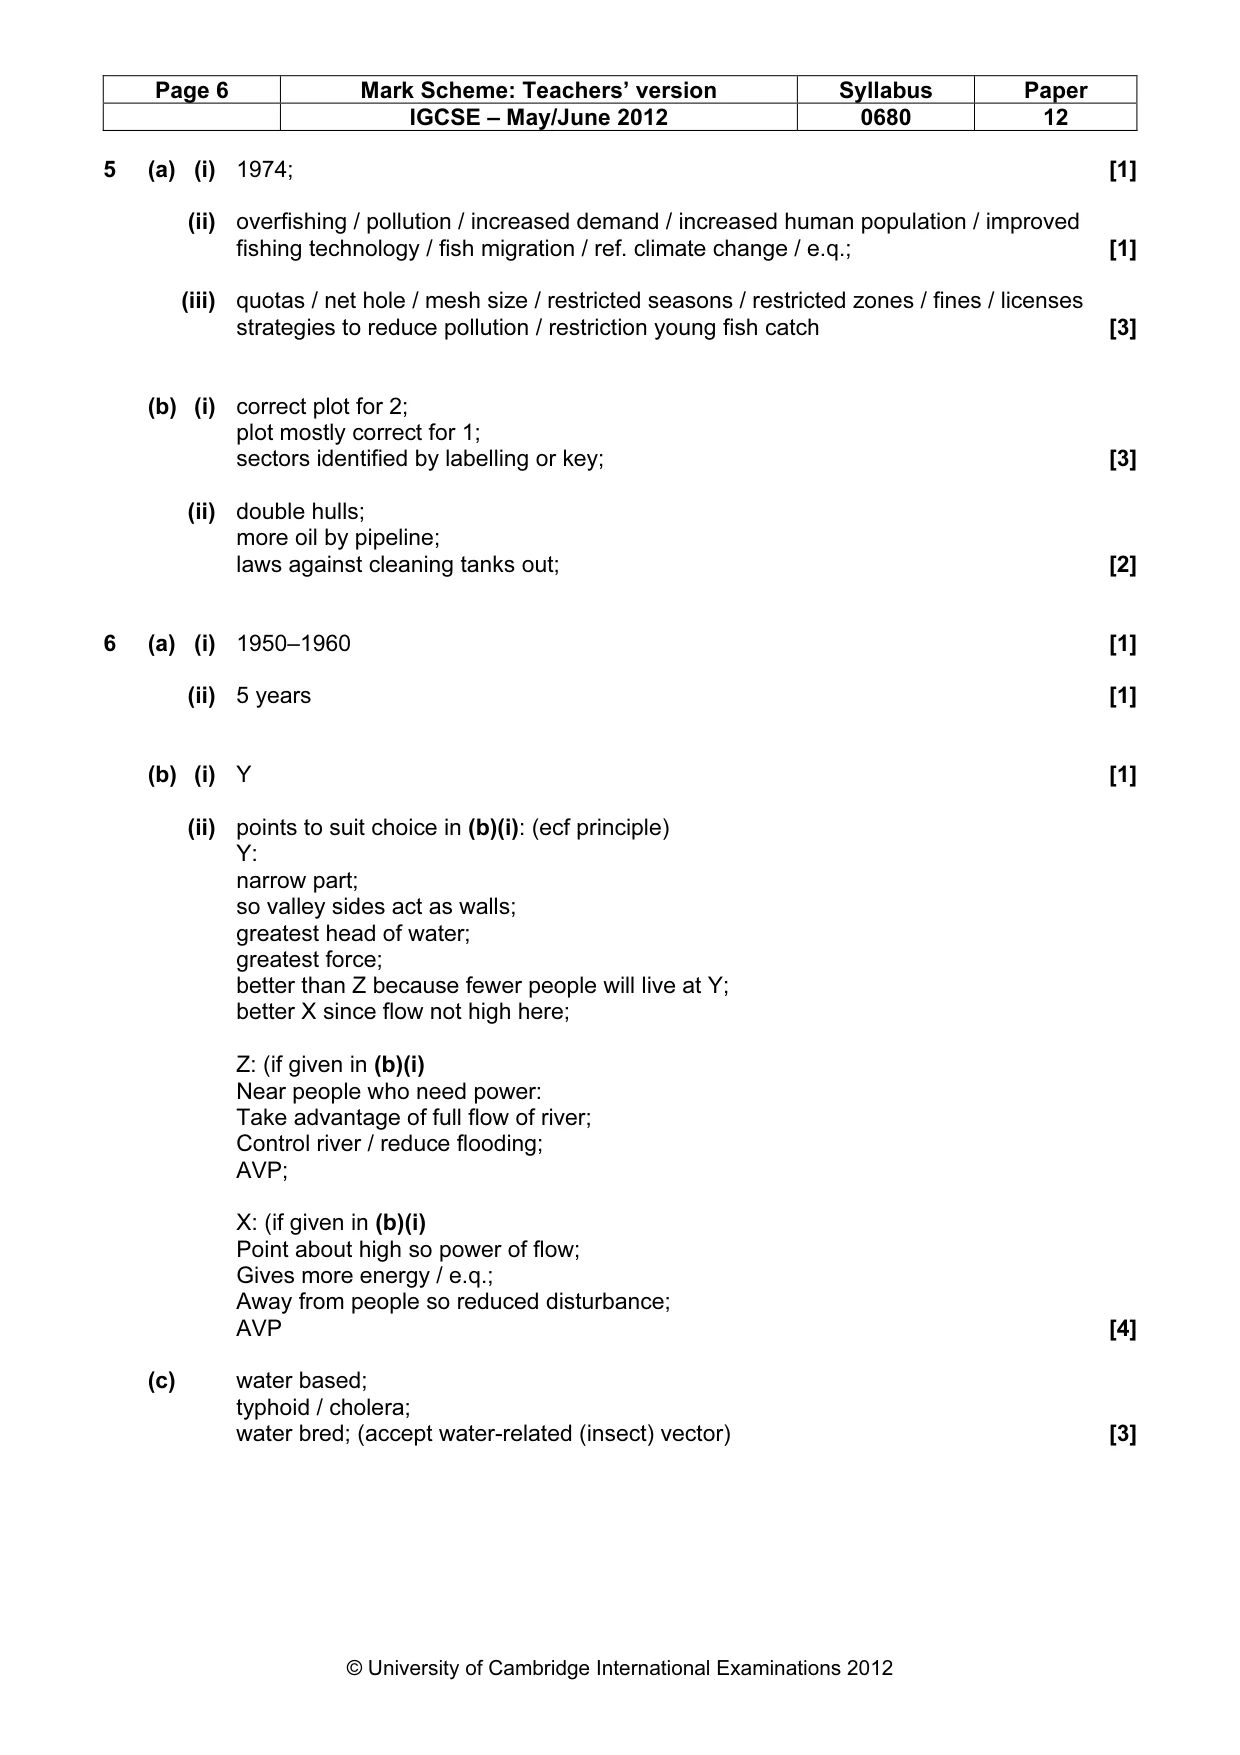
Page 6 Mark Scheme: Teachers’ version Syllabus Paper IGCSE – May/June 2012 0680 12 © University of Cambridge International Examinations 2012 5 (a) (i) 1974; [1] (ii) overfishing / pollution / increased demand / increased human population / improved fishing technology / fish migration / ref. climate change / e.q.; [1] (iii) quotas / net hole / mesh size / restricted seasons / restricted zones / fines / licenses strategies to reduce pollution / restriction young fish catch [3] (b) (i) correct plot for 2; plot mostly correct for 1; sectors identified by labelling or key; [3] (ii) double hulls; more oil by pipeline; laws against cleaning tanks out; [2] 6 (a) (i) 1950–1960 [1] (ii) 5 years [1] (b) (i) Y [1] (ii) points to suit choice in (b)(i): (ecf principle) Y: narrow part; so valley sides act as walls; greatest head of water; greatest force; better than Z because fewer people will live at Y; better X since flow not high here; Z: (if given in (b)(i) Near people who need power: Take advantage of full flow of river; Control river / reduce flooding; AVP; X: (if given in (b)(i) Point about high so power of flow; Gives more energy / e.q.; Away from people so reduced disturbance; AVP [4] (c) water based; typhoid / cholera; water bred; (accept water-related (insect) vector) [3]
What you needed in this session
Cambridge’s own grade thresholds for 2012 May/June, Paper 1 · Variant 2. A higher threshold means an easier paper — the bar moves with how the cohort did.