Cambridge IGCSE Environmental Management 0680 — 2011 May/June Paper 1 · Variant 1
0680/11/M/J/11 · 60 marks · ≈68 min
The question paper and its mark scheme, free to read here and free to download. This is Cambridge’s own paper, exactly as it was sat.
Question paper16 pages




Mark scheme4 pages
Answers below. Sit the paper first if you are practising.
Paper as text
Question paper, page 1
This document consists of 12 printed pages and 4 blank pages. DC (NF/DJ) 33733/5 © UCLES 2011 [Turn over UNIVERSITY OF CAMBRIDGE INTERNATIONAL EXAMINATIONS International General Certificate of Secondary Education * 9 3 3 5 1 5 2 4 7 2 * ENVIRONMENTAL MANAGEMENT 0680/11 Paper 1 May/June 2011 1 hour 30 minutes Candidates answer on the Question Paper. Additional Materials: Ruler READ THESE INSTRUCTIONS FIRST Write your Centre number, candidate number and name on all the work you hand in. Write in dark blue or black pen. You may use a soft pencil for any diagrams, graphs or rough working. Do not use staples, paper clips, highlighters, glue or correction fluid. DO NOT WRITE IN ANY BARCODES. Answer all questions. At the end of the examination, fasten all your work securely together. The number of marks is given in brackets [ ] at the end of each question or part question. For Examiner’s Use 1 2 3 4 5 6 Total www.XtremePapers.com
Question paper, page 2
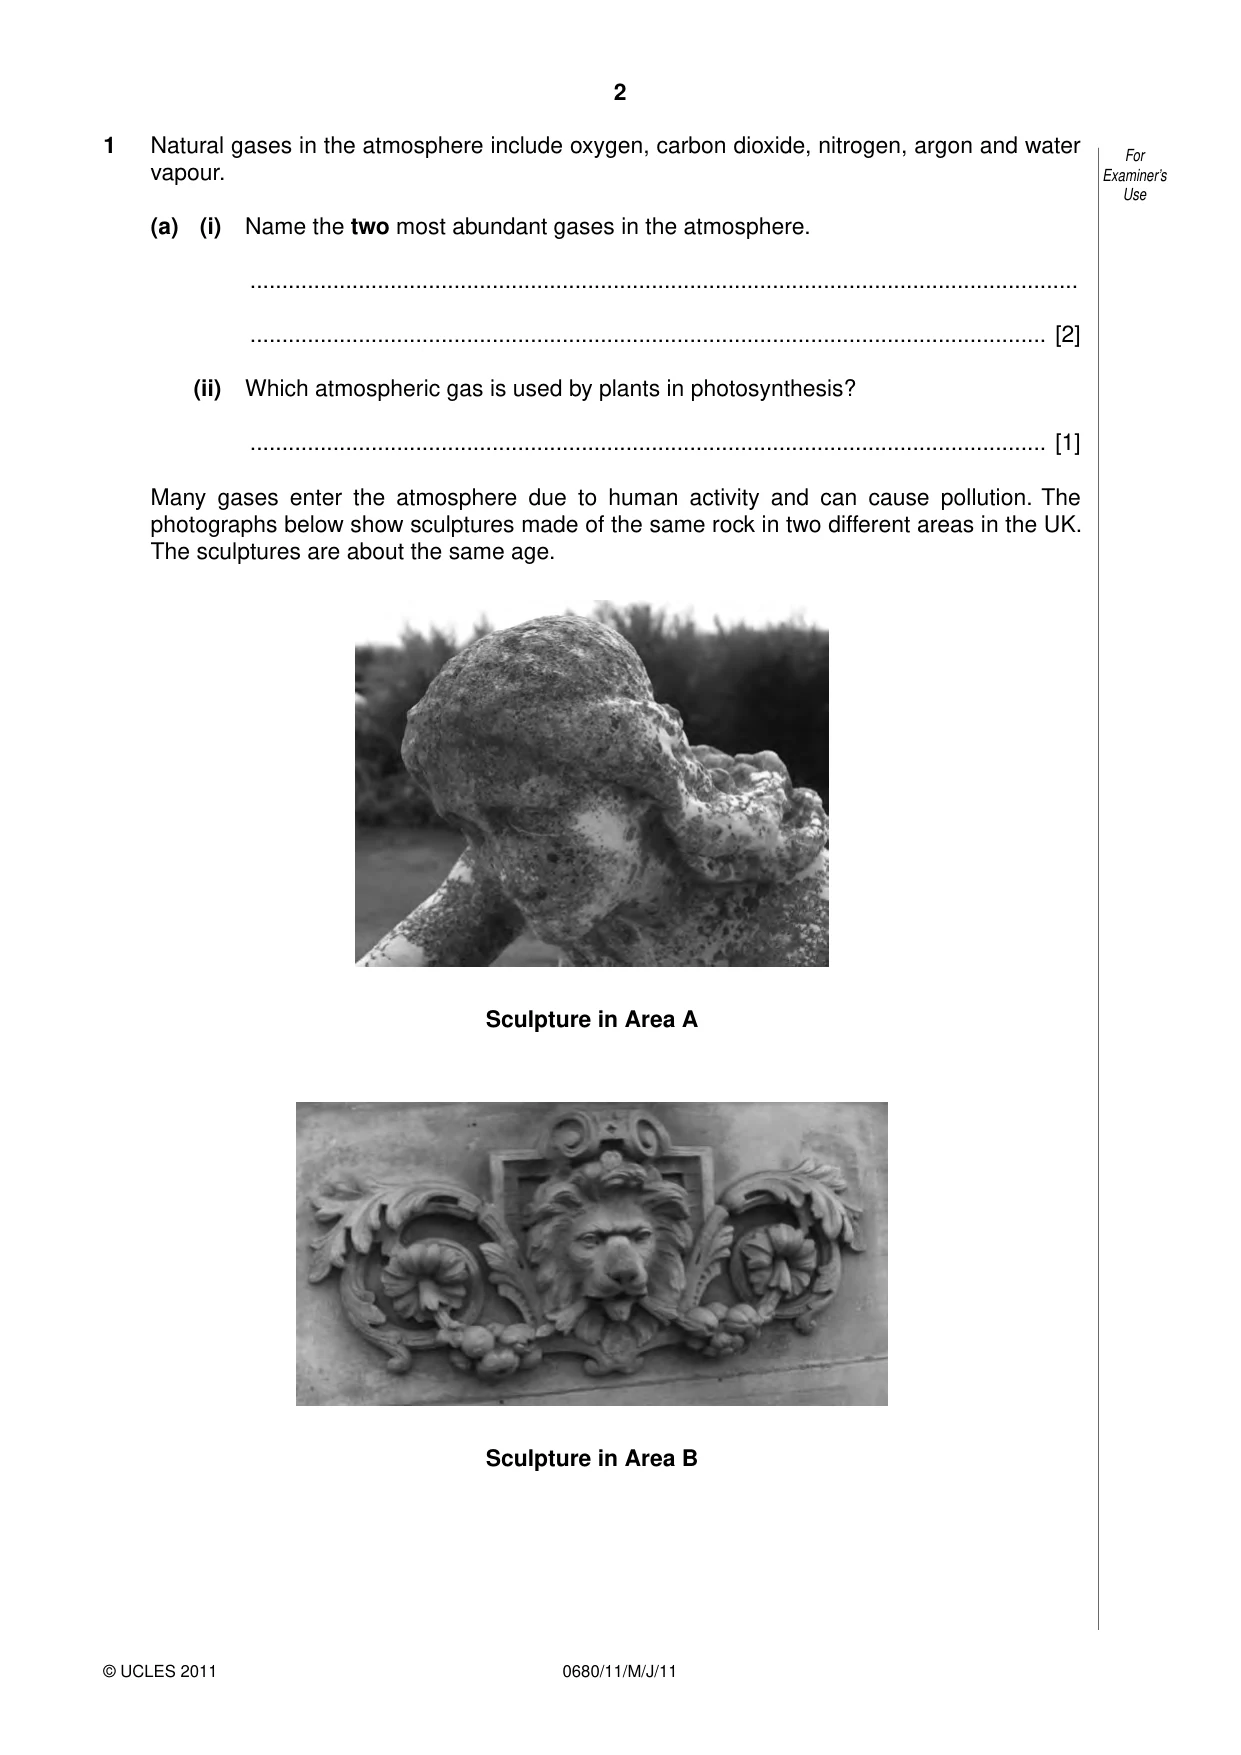
2 0680/11/M/J/11 © UCLES 2011 For Examiner’s Use 1 Natural gases in the atmosphere include oxygen, carbon dioxide, nitrogen, argon and water vapour. (a) (i) Name the two most abundant gases in the atmosphere. … … [2] (ii) Which atmospheric gas is used by plants in photosynthesis? … [1] Many gases enter the atmosphere due to human activity and can cause pollution. The photographs below show sculptures made of the same rock in two different areas in the UK. The sculptures are about the same age. Sculpture in Area A Sculpture in Area B
Question paper, page 3
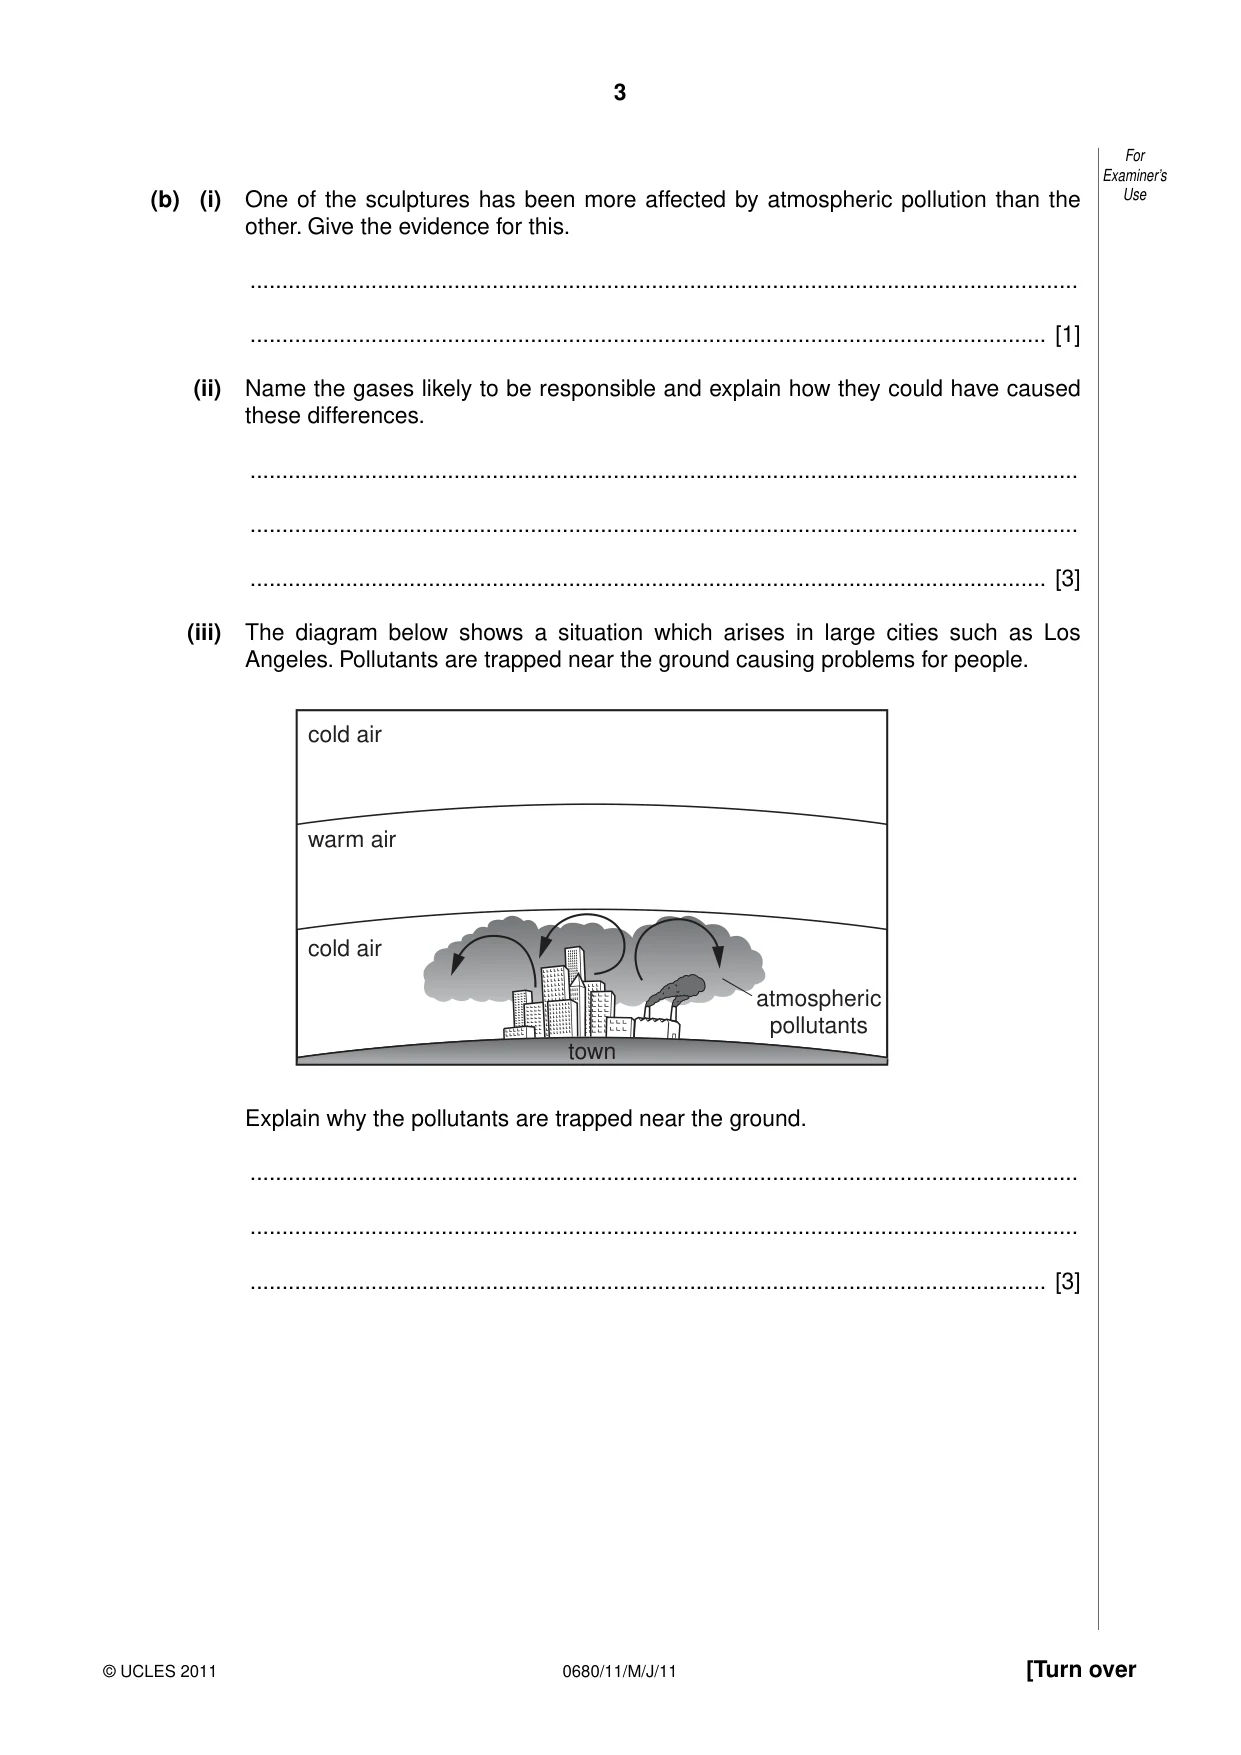
3 0680/11/M/J/11 © UCLES 2011 [Turn over For Examiner’s Use (b) (i) One of the sculptures has been more affected by atmospheric pollution than the other. Give the evidence for this. … … [1] (ii) Name the gases likely to be responsible and explain how they could have caused these differences. … … … [3] (iii) The diagram below shows a situation which arises in large cities such as Los Angeles. Pollutants are trapped near the ground causing problems for people. cold air warm air cold air town atmospheric pollutants Explain why the pollutants are trapped near the ground. … … … [3]
Question paper, page 4
4 0680/11/M/J/11 © UCLES 2011 For Examiner’s Use 2 At the Kola Institute in Russia scientists drilled for more than 15 years through the Earth’s crust to a depth of over 12 km. This was an attempt to reach the layer of the Earth below the crust. It failed, as did a similar attempt by the Americans, called the MoHo Project. (a) (i) What is the name of the layer below the Earth’s crust? … [1] (ii) State two ways in which rocks in the layer below the Earth’s crust are different from those in the crust. … … … … [2] (iii) The Russian project was land based, whereas the American project began drilling at the bottom of the sea. Why was it thought more likely that the American project would be successful? … … [1] (b) (i) The crust contains fossil fuels used by humans. Describe the ways in which oil is discovered and extracted from the crust. … … … … … …[4] (ii) During transport of the oil in ships, there may be an oil spill. State one way in which a spill might be avoided and one way in which its effects might be reduced. avoided … … effects reduced … … [2]
Question paper, page 5
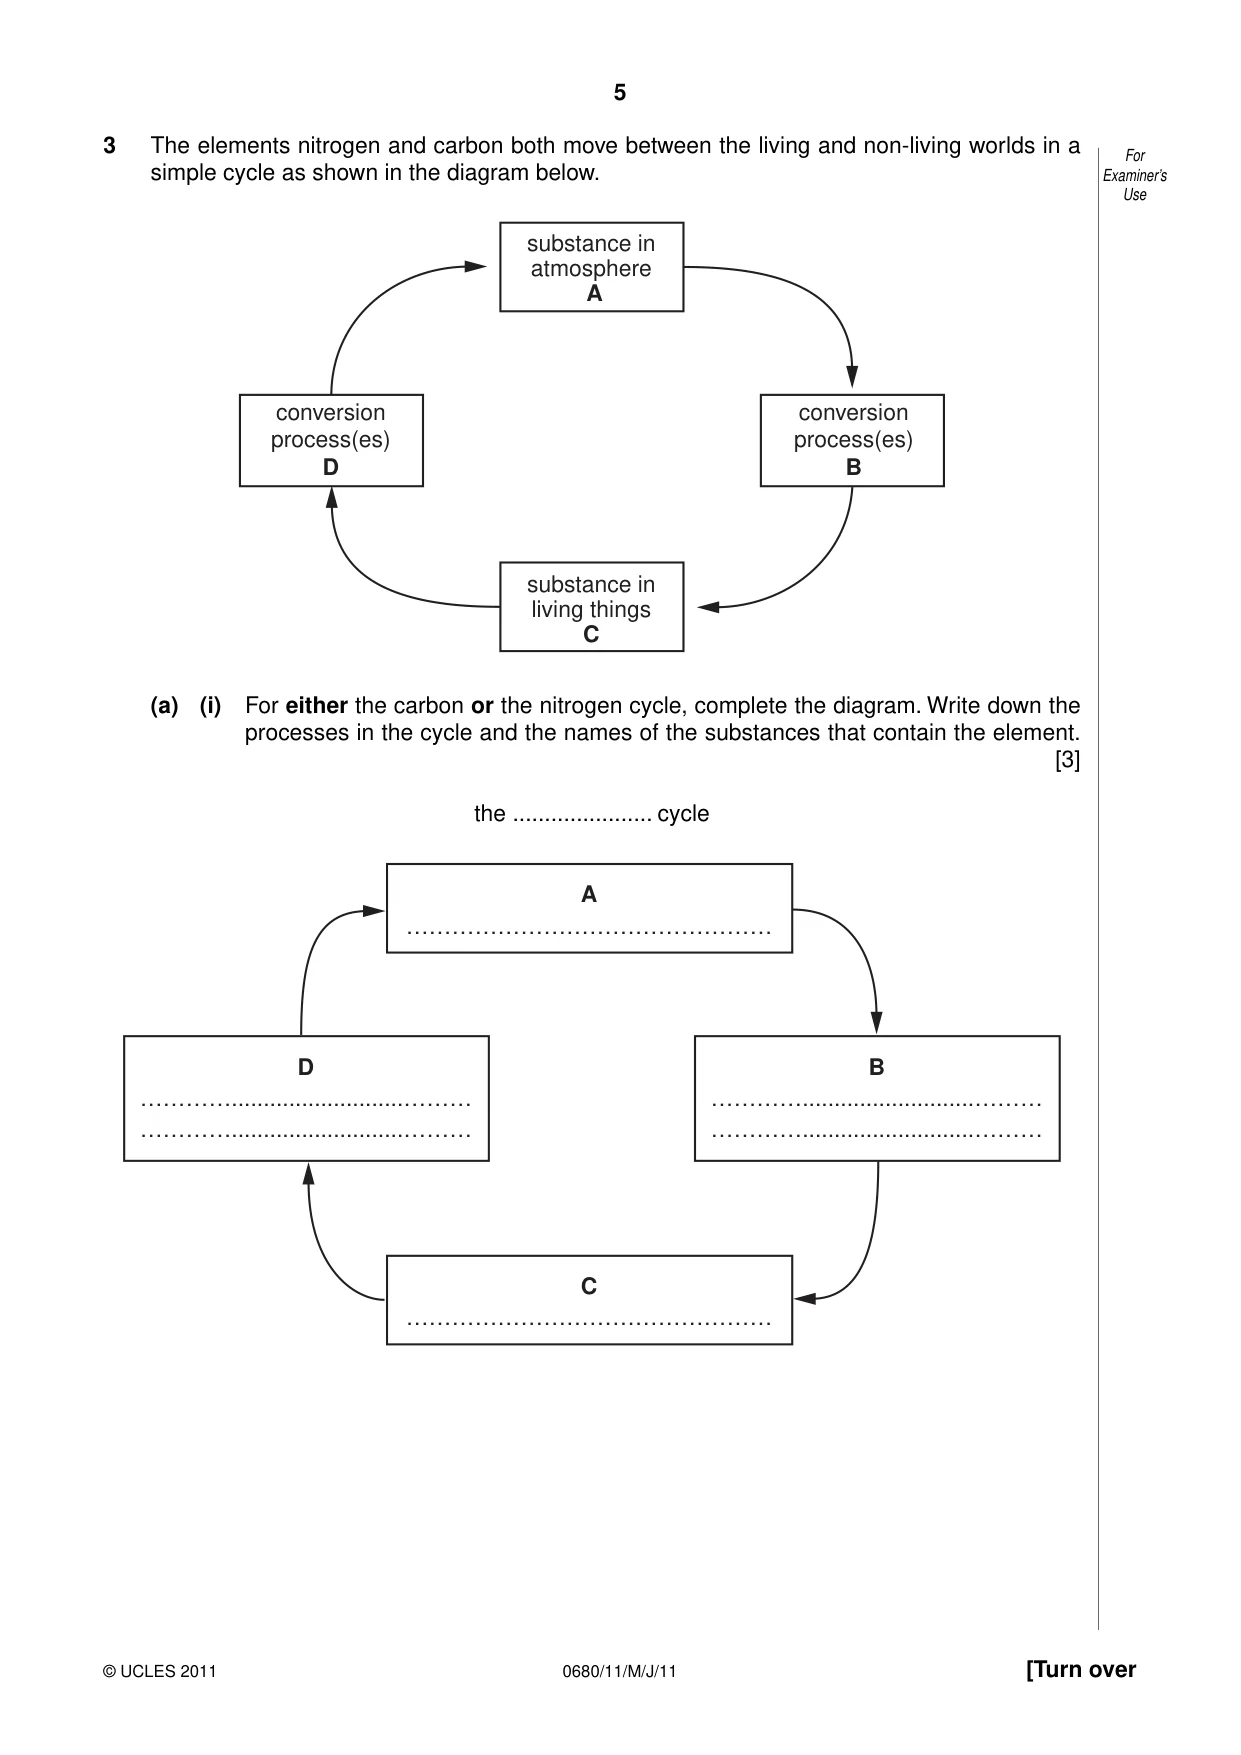
5 0680/11/M/J/11 © UCLES 2011 [Turn over For Examiner’s Use 3 The elements nitrogen and carbon both move between the living and non-living worlds in a simple cycle as shown in the diagram below. substance in atmosphere A substance in living things C conversion process(es) D conversion process(es) B (a) (i) For either the carbon or the nitrogen cycle, complete the diagram. Write down the processes in the cycle and the names of the substances that contain the element. [3] the … cycle A ………………………………………… C ………………………………………… D …………………… …………………… B …………………… ……………………
Question paper, page 6
6 0680/11/M/J/11 © UCLES 2011 For Examiner’s Use (ii) Crops need a good supply of both nitrogen and carbon. Which of these can crops obtain from a fertiliser? … [1] (iii) Describe one environmental problem caused by the overuse of fertilisers. … … … … [2] (b) Overuse of another group of agricultural chemicals, pesticides, can also cause problems. (i) Explain how the overuse of pesticides can harm wildlife. … … … … [2] (ii) Describe another way of controlling pests which would cause less damage to the environment than using pesticides. … … … … [2]
Question paper, page 7
7 0680/11/M/J/11 © UCLES 2011 [Turn over BLANK PAGE
Question paper, page 8
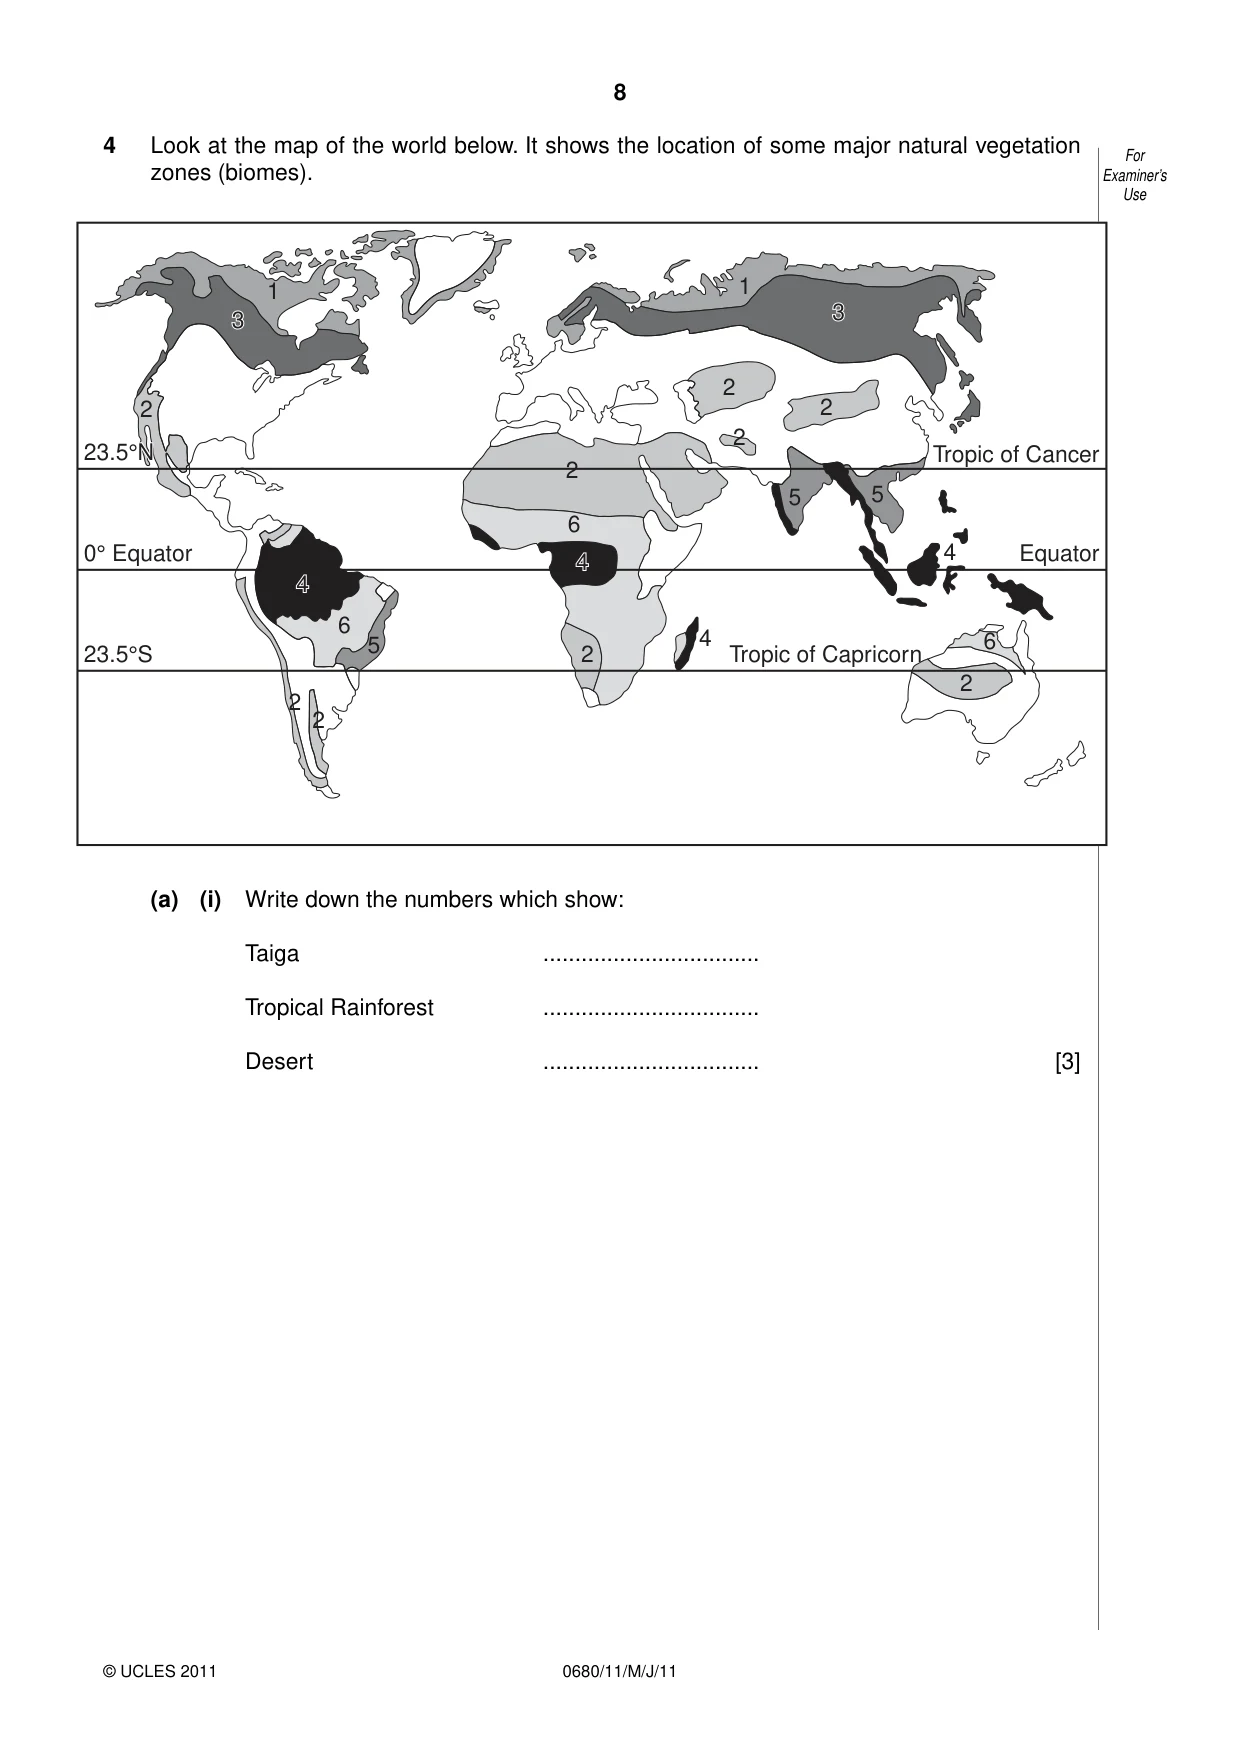
8 0680/11/M/J/11 © UCLES 2011 For Examiner’s Use 4 Look at the map of the world below. It shows the location of some major natural vegetation zones (biomes). 1 2 4 4 4 6 5 2 2 2 4 4 4 6 2 2 2 2 3 3 1 5 5 2 6 Tropic of Cancer Equator Tropic of Capricorn 23.5°S 23.5°N 23.5°N 0° Equator 23.5°N (a) (i) Write down the numbers which show: Taiga … Tropical Rainforest … Desert … [3]
Question paper, page 9
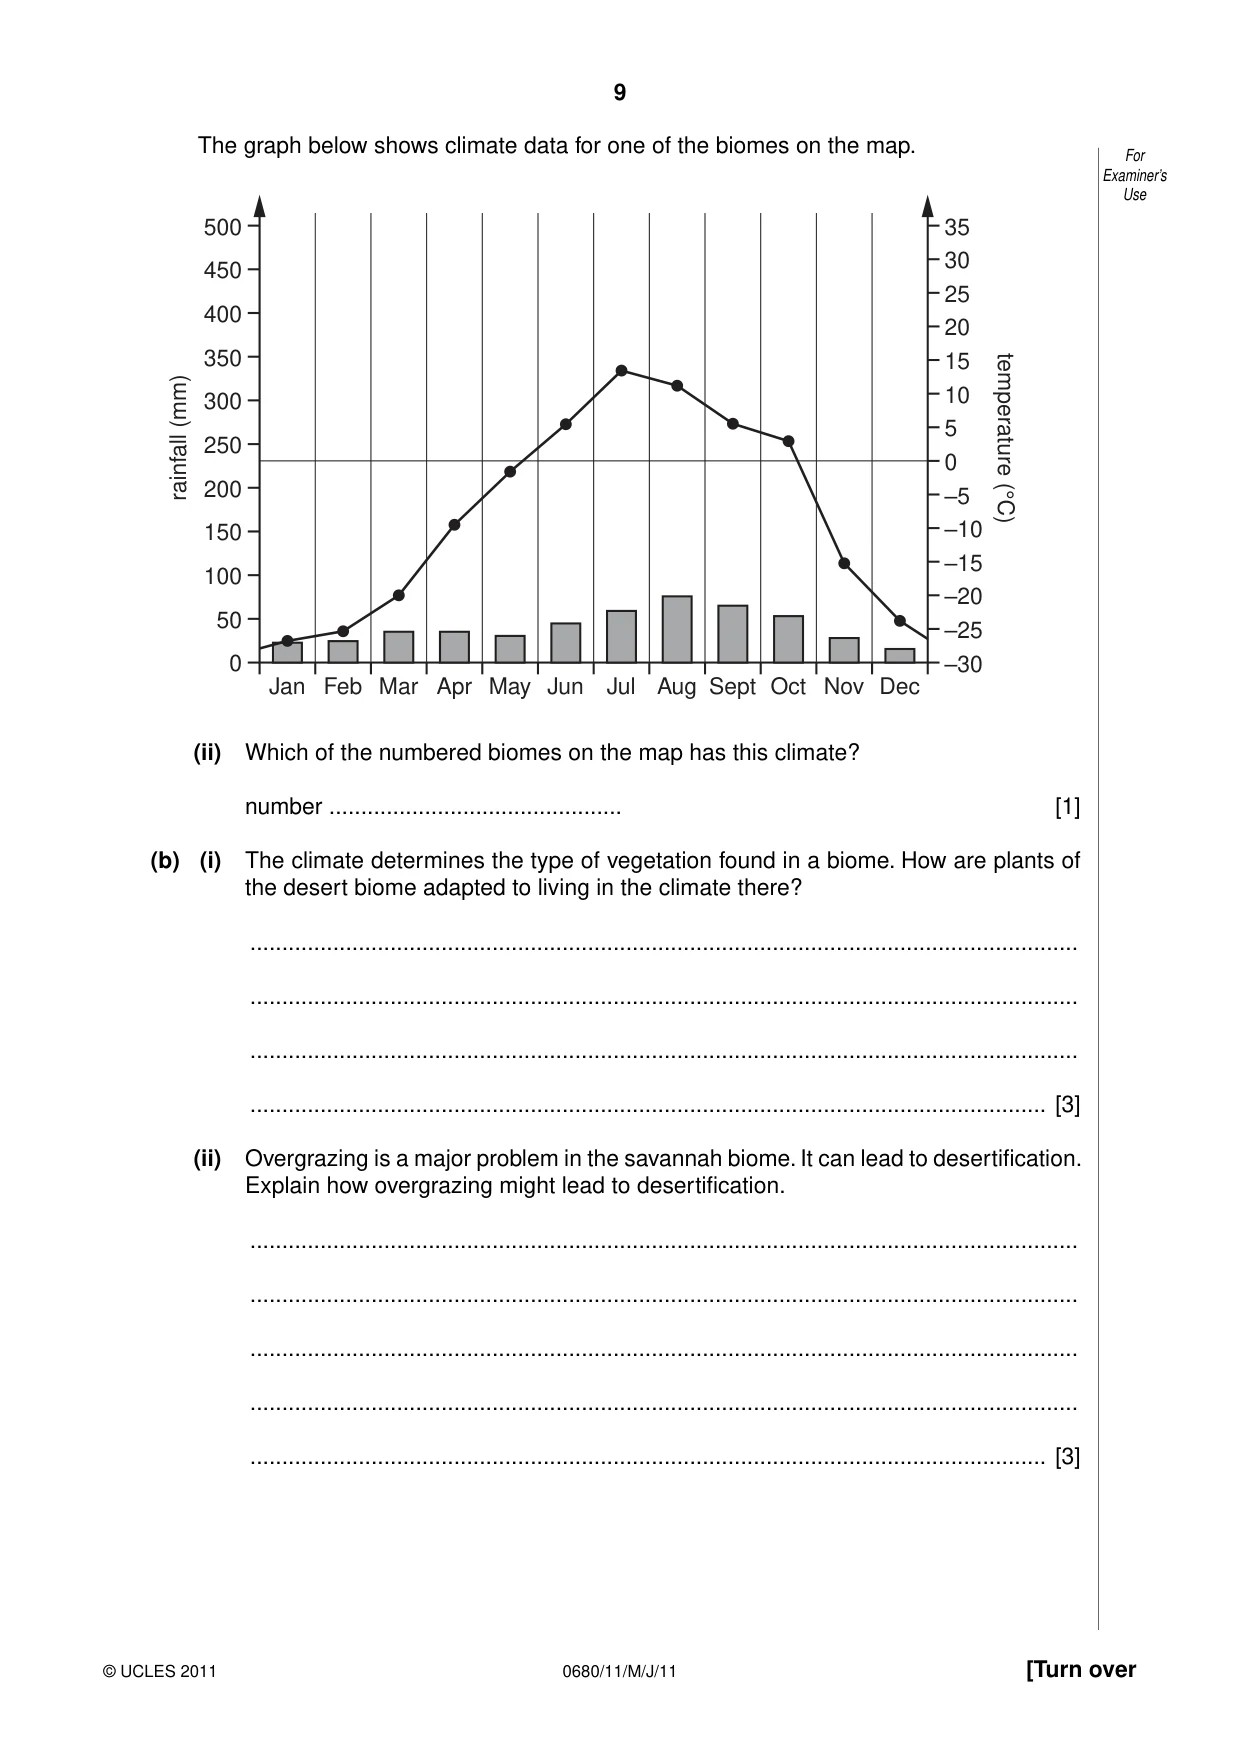
9 0680/11/M/J/11 © UCLES 2011 [Turn over For Examiner’s Use The graph below shows climate data for one of the biomes on the map. 500 35 30 25 20 15 10 5 0 –5 –10 –15 –20 –25 –30 450 400 350 300 rainfall (mm) temperature (°C) 250 200 150 100 50 0 Jan Feb Mar Apr May Jun Jul Aug Sept Oct Nov Dec (ii) Which of the numbered biomes on the map has this climate? number … [1] (b) (i) The climate determines the type of vegetation found in a biome. How are plants of the desert biome adapted to living in the climate there? … … … … [3] (ii) Overgrazing is a major problem in the savannah biome. It can lead to desertification. Explain how overgrazing might lead to desertification. … … … … … [3]
Question paper, page 10
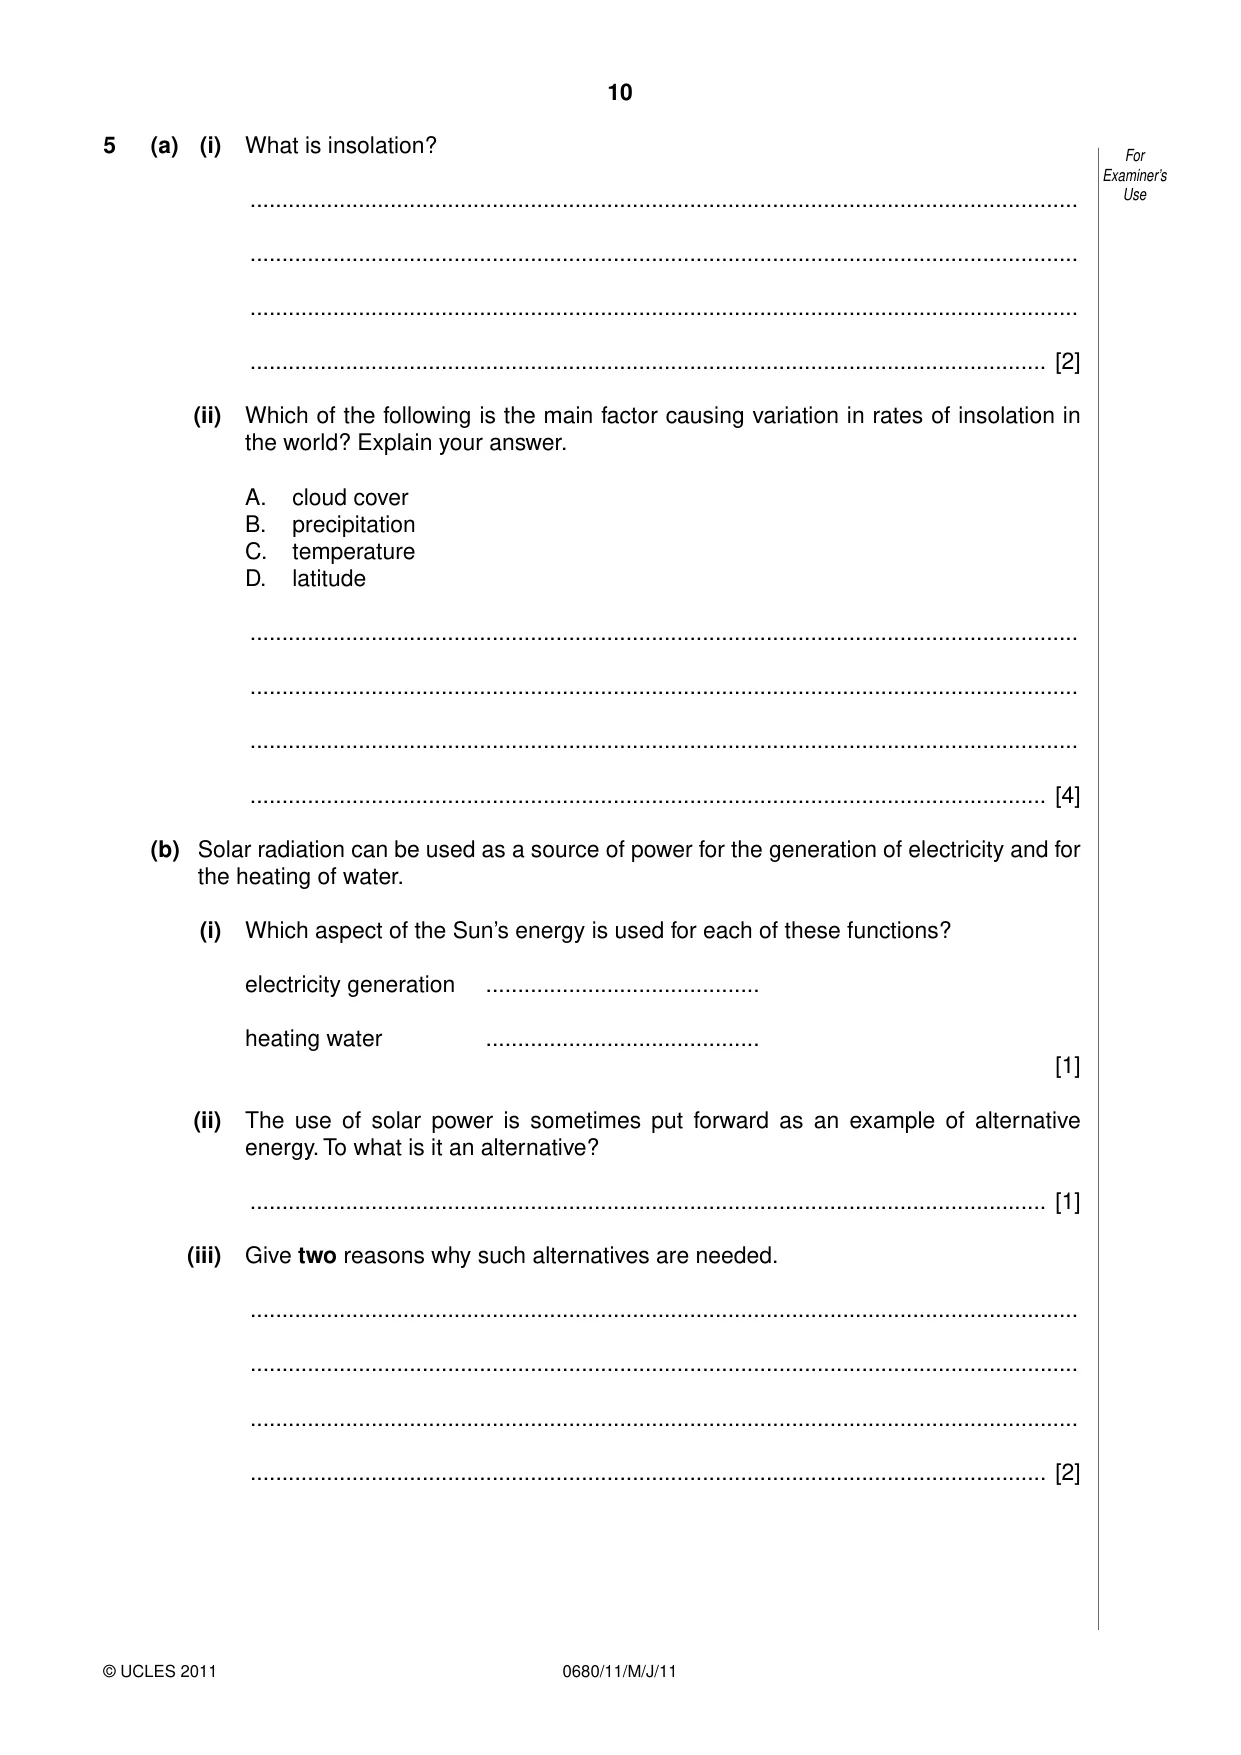
10 0680/11/M/J/11 © UCLES 2011 For Examiner’s Use 5 (a) (i) What is insolation? … … … … [2] (ii) Which of the following is the main factor causing variation in rates of insolation in the world? Explain your answer. A. cloud cover B. precipitation C. temperature D. latitude … … … … [4] (b) Solar radiation can be used as a source of power for the generation of electricity and for the heating of water. (i) Which aspect of the Sun’s energy is used for each of these functions? electricity generation … heating water … [1] (ii) The use of solar power is sometimes put forward as an example of alternative energy. To what is it an alternative? … [1] (iii) Give two reasons why such alternatives are needed. … … … … [2]
Question paper, page 11
11 0680/11/M/J/11 © UCLES 2011 [Turn over BLANK PAGE
Question paper, page 12
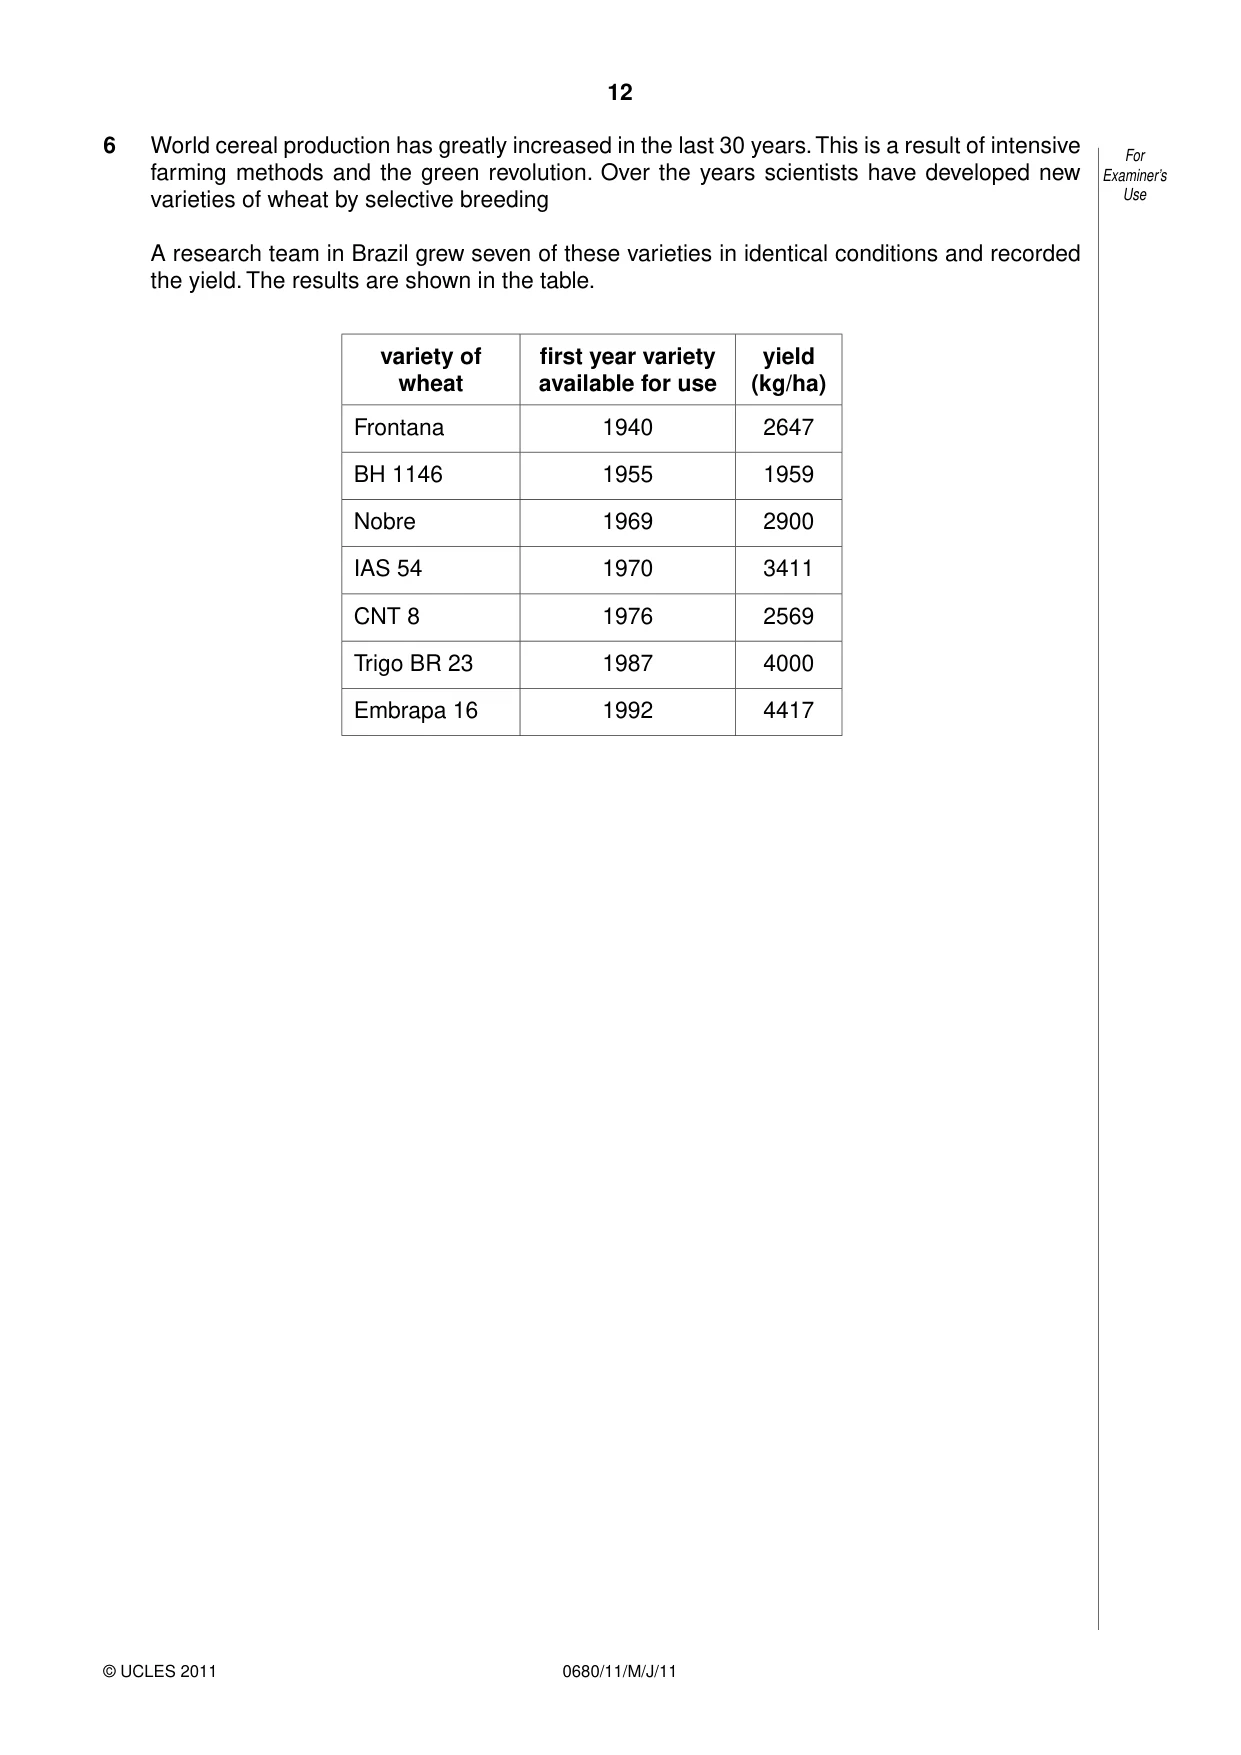
12 0680/11/M/J/11 © UCLES 2011 For Examiner’s Use 6 World cereal production has greatly increased in the last 30 years. This is a result of intensive farming methods and the green revolution. Over the years scientists have developed new varieties of wheat by selective breeding A research team in Brazil grew seven of these varieties in identical conditions and recorded the yield. The results are shown in the table. variety of wheat first year variety available for use yield (kg/ha) Frontana 1940 2647 BH 1146 1955 1959 Nobre 1969 2900 IAS 54 1970 3411 CNT 8 1976 2569 Trigo BR 23 1987 4000 Embrapa 16 1992 4417
Question paper, page 13
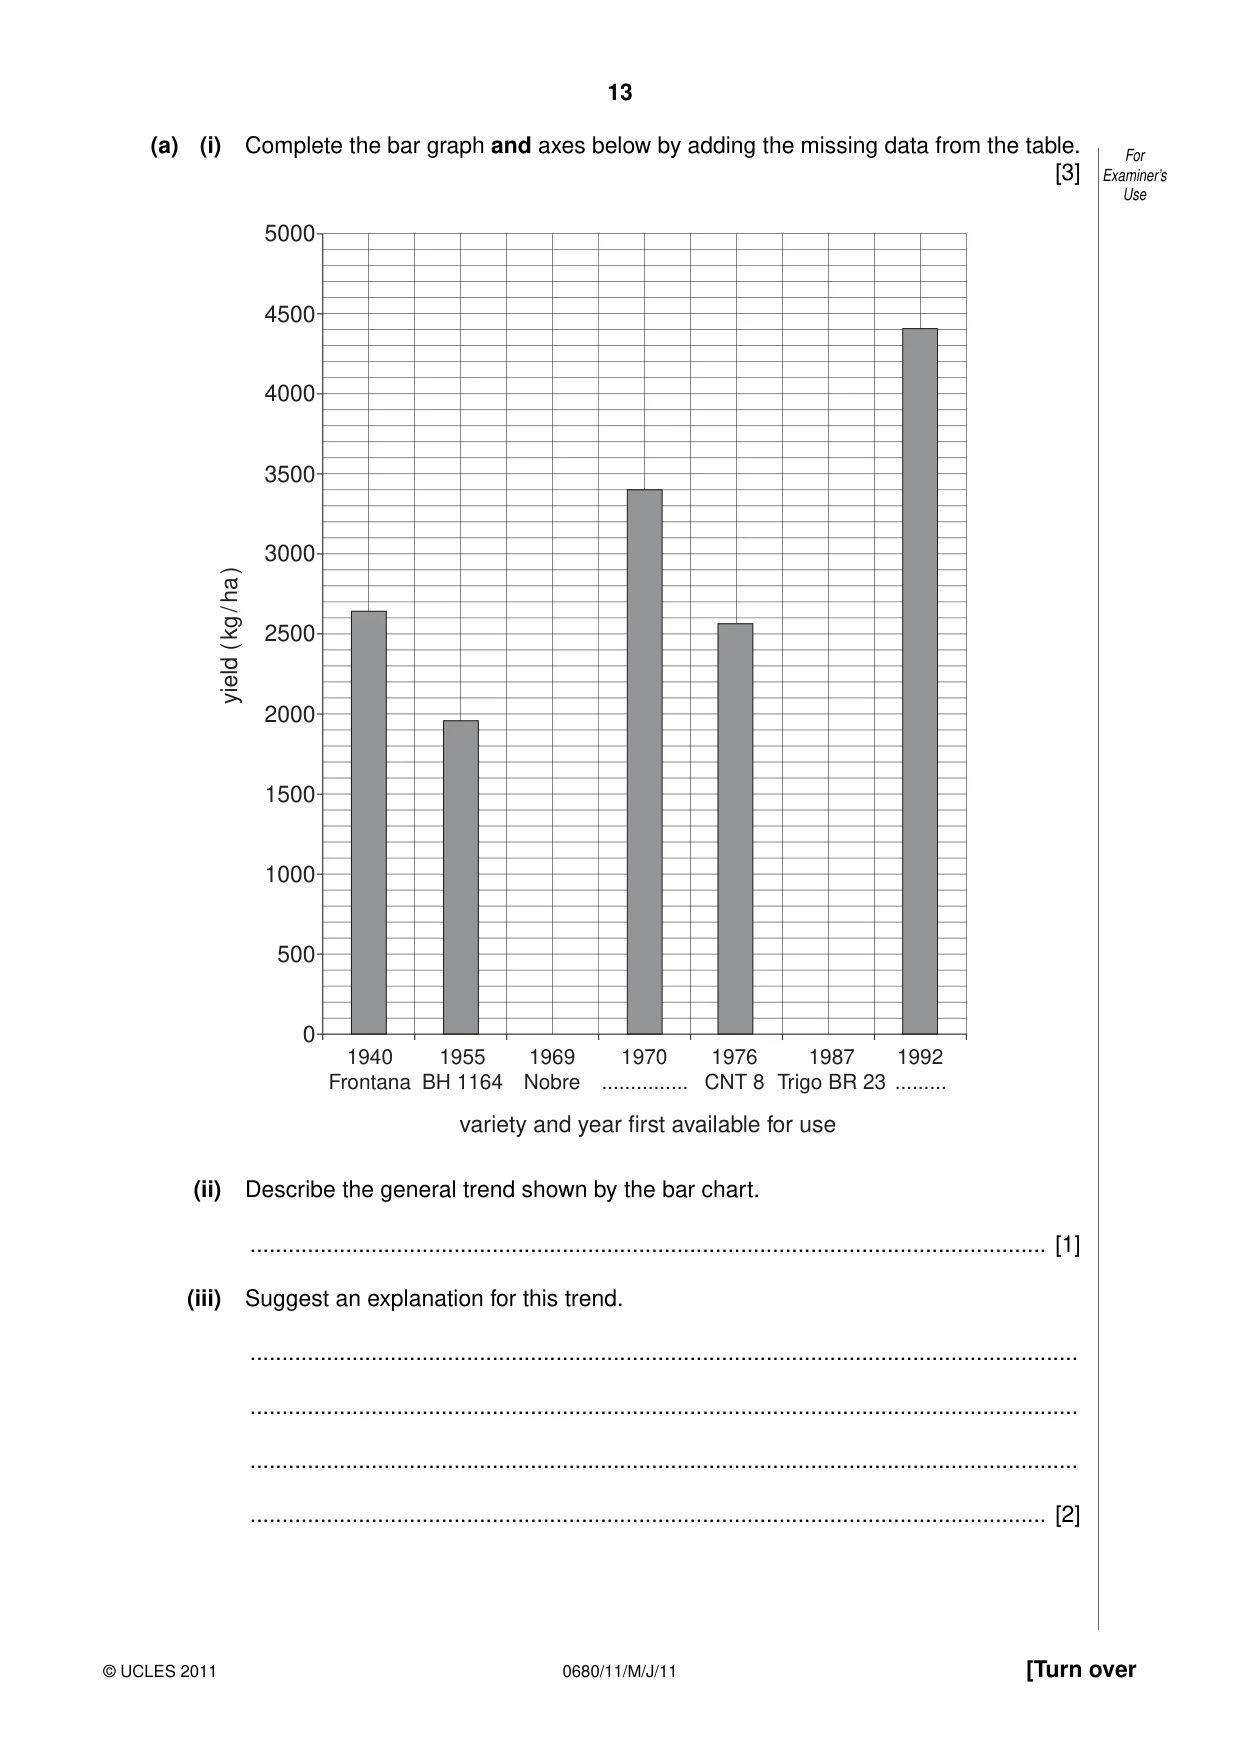
13 0680/11/M/J/11 © UCLES 2011 [Turn over For Examiner’s Use (a) (i) Complete the bar graph and axes below by adding the missing data from the table. [3] 0 500 variety and year first available for use 1000 1500 2000 2500 3000 3500 4000 4500 5000 1940 Frontana 1955 BH 1164 1969 Nobre 1970 … 1992 … 1976 CNT 8 1987 Trigo BR 23 yield ( kg / ha ) (ii) Describe the general trend shown by the bar chart. … [1] (iii) Suggest an explanation for this trend. … … … … [2]
Question paper, page 14
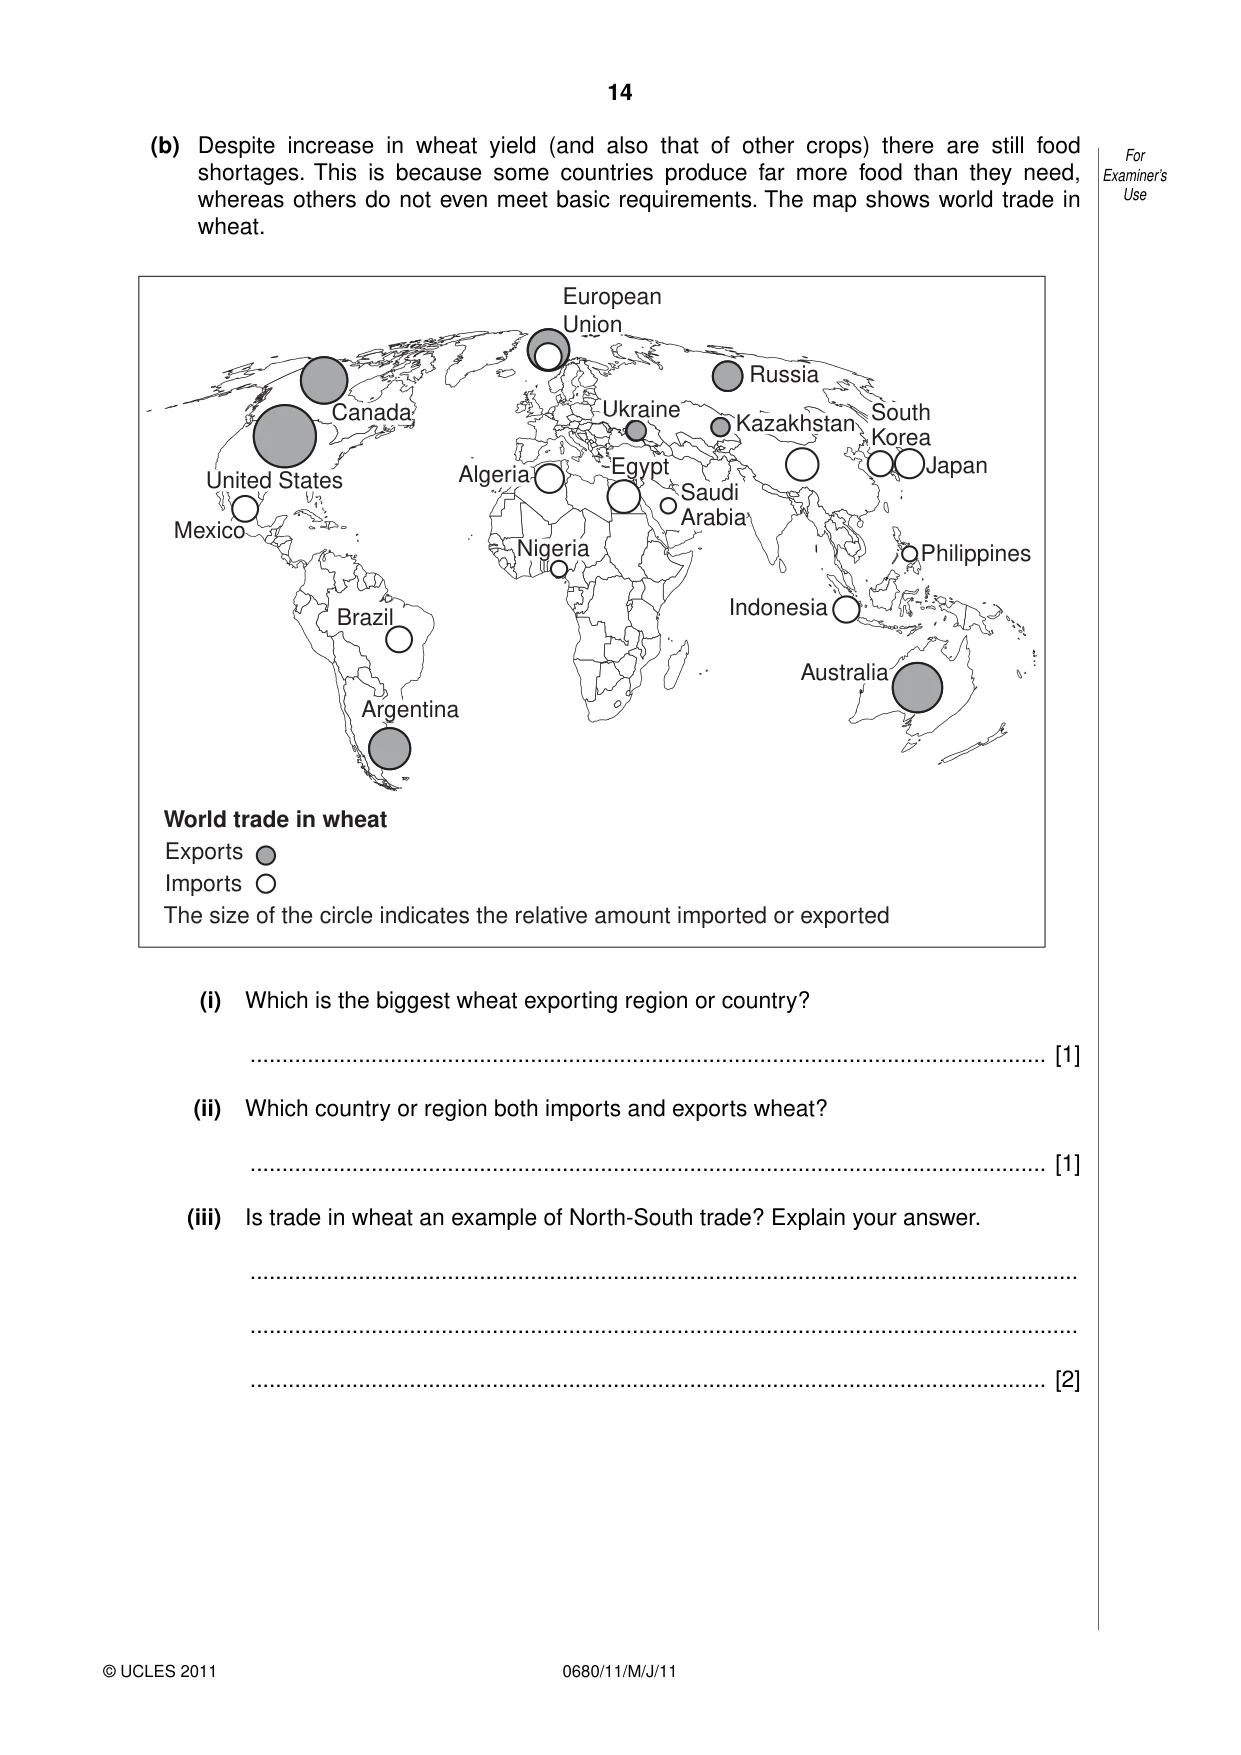
14 0680/11/M/J/11 © UCLES 2011 For Examiner’s Use (b) Despite increase in wheat yield (and also that of other crops) there are still food shortages. This is because some countries produce far more food than they need, whereas others do not even meet basic requirements. The map shows world trade in wheat. Argentina Brazil Mexico United States Canada European Union Russia Kazakhstan Japan South Korea Nigeria Algeria Egypt Saudi Arabia Ukraine Philippines Australia Indonesia Exports Imports World trade in wheat The size of the circle indicates the relative amount imported or exported (i) Which is the biggest wheat exporting region or country? … [1] (ii) Which country or region both imports and exports wheat? … [1] (iii) Is trade in wheat an example of North-South trade? Explain your answer. … … … [2]
Question paper, page 15
15 0680/11/M/J/11 © UCLES 2011 BLANK PAGE
Question paper, page 16
16 0680/11/M/J/11 © UCLES 2011 BLANK PAGE Permission to reproduce items where third-party owned material protected by copyright is included has been sought and cleared where possible. Every reasonable effort has been made by the publisher (UCLES) to trace copyright holders, but if any items requiring clearance have unwittingly been included, the publisher will be pleased to make amends at the earliest possible opportunity. University of Cambridge International Examinations is part of the Cambridge Assessment Group. Cambridge Assessment is the brand name of University of Cambridge Local Examinations Syndicate (UCLES), which is itself a department of the University of Cambridge.
Mark scheme, page 1
UNIVERSITY OF CAMBRIDGE INTERNATIONAL EXAMINATIONS International General Certificate of Secondary Education MARK SCHEME for the May/June 2011 question paper for the guidance of teachers 0680 ENVIRONMENTAL MANAGEMENT 0680/11 Paper 1, maximum raw mark 60 This mark scheme is published as an aid to teachers and candidates, to indicate the requirements of the examination. It shows the basis on which Examiners were instructed to award marks. It does not indicate the details of the discussions that took place at an Examiners’ meeting before marking began, which would have considered the acceptability of alternative answers. Mark schemes must be read in conjunction with the question papers and the report on the examination. • Cambridge will not enter into discussions or correspondence in connection with these mark schemes. Cambridge is publishing the mark schemes for the May/June 2011 question papers for most IGCSE, GCE Advanced Level and Advanced Subsidiary Level syllabuses and some Ordinary Level syllabuses. www.XtremePapers.com
Mark scheme, page 2
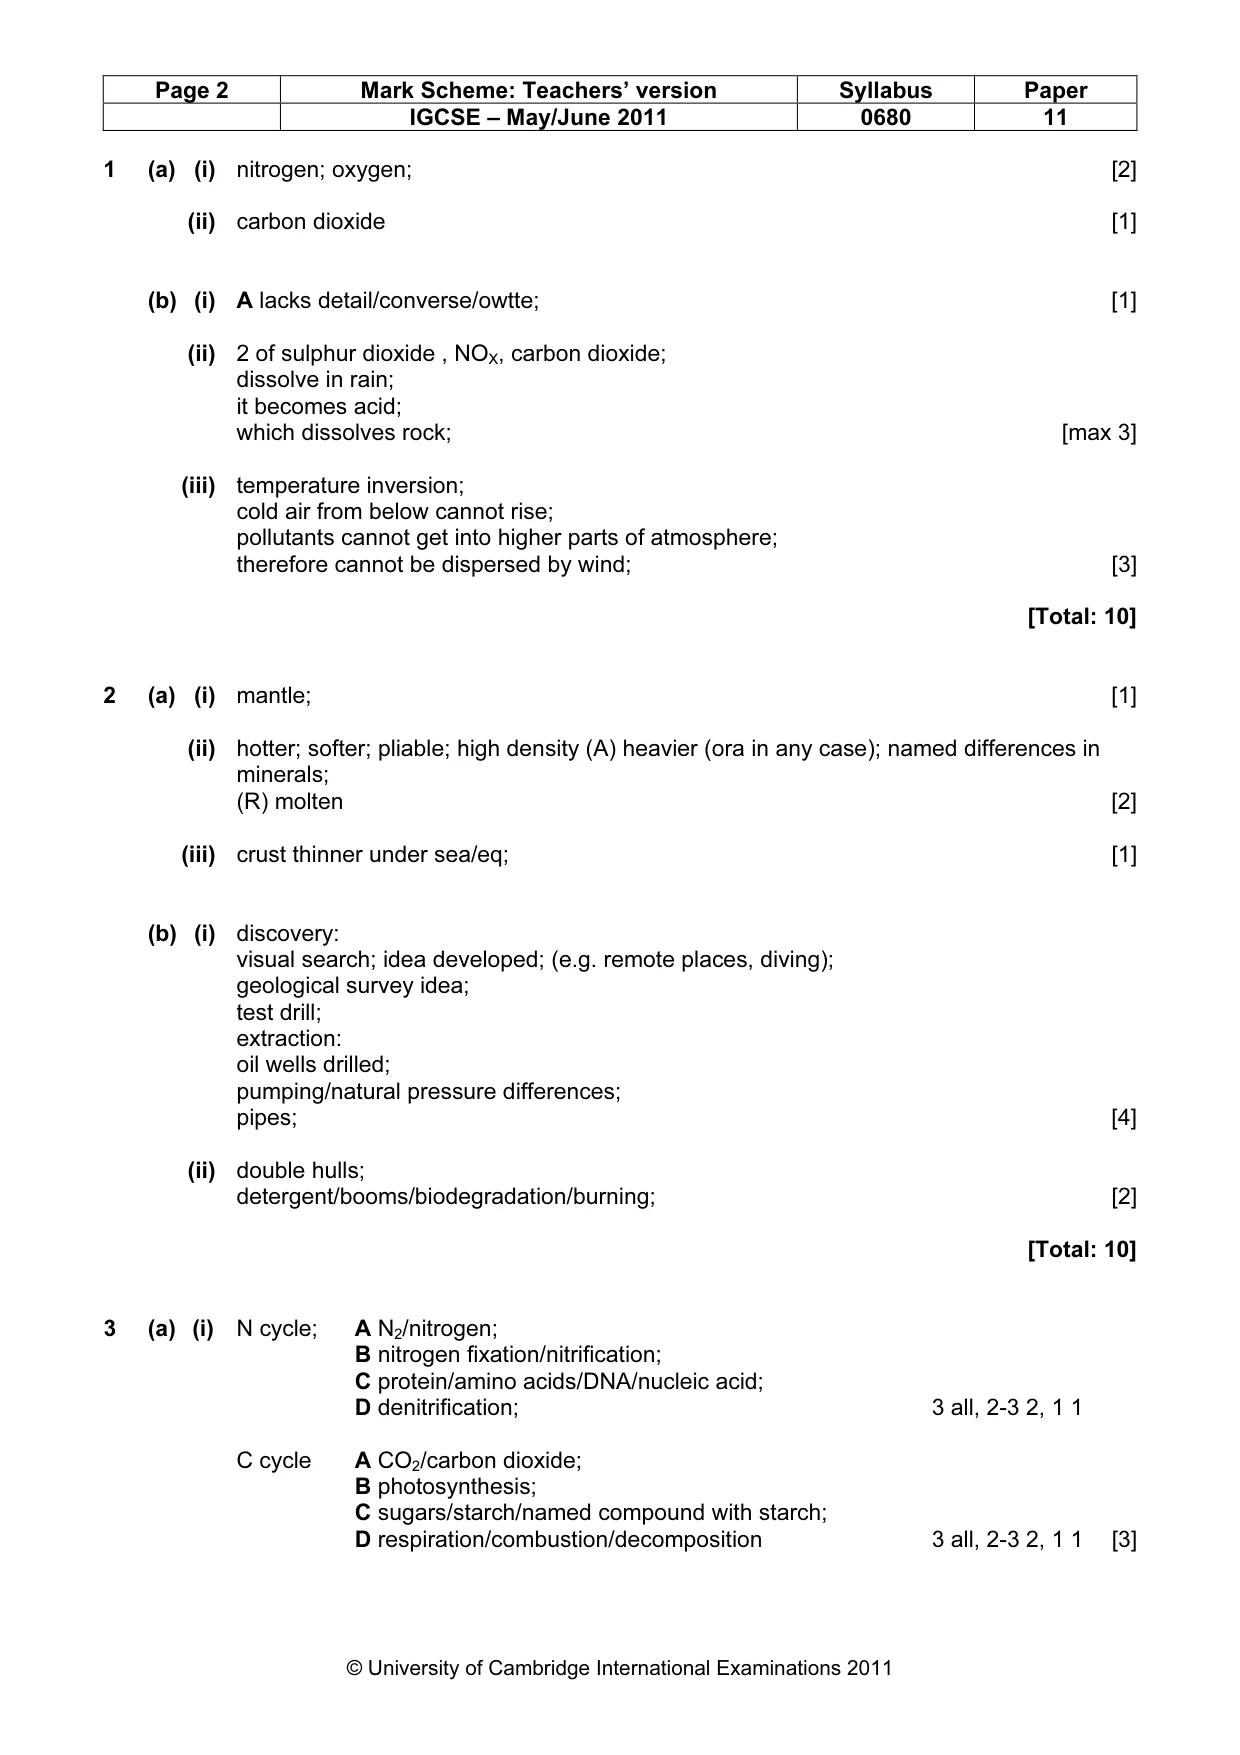
Page 2 Mark Scheme: Teachers’ version Syllabus Paper IGCSE – May/June 2011 0680 11 © University of Cambridge International Examinations 2011 1 (a) (i) nitrogen; oxygen; [2] (ii) carbon dioxide [1] (b) (i) A lacks detail/converse/owtte; [1] (ii) 2 of sulphur dioxide , NOX, carbon dioxide; dissolve in rain; it becomes acid; which dissolves rock; [max 3] (iii) temperature inversion; cold air from below cannot rise; pollutants cannot get into higher parts of atmosphere; therefore cannot be dispersed by wind; [3] [Total: 10] 2 (a) (i) mantle; [1] (ii) hotter; softer; pliable; high density (A) heavier (ora in any case); named differences in minerals; (R) molten [2] (iii) crust thinner under sea/eq; [1] (b) (i) discovery: visual search; idea developed; (e.g. remote places, diving); geological survey idea; test drill; extraction: oil wells drilled; pumping/natural pressure differences; pipes; [4] (ii) double hulls; detergent/booms/biodegradation/burning; [2] [Total: 10] 3 (a) (i) N cycle; A N2/nitrogen; B nitrogen fixation/nitrification; C protein/amino acids/DNA/nucleic acid; D denitrification; 3 all, 2-3 2, 1 1 C cycle A CO2/carbon dioxide; B photosynthesis; C sugars/starch/named compound with starch; D respiration/combustion/decomposition 3 all, 2-3 2, 1 1 [3]
Mark scheme, page 3
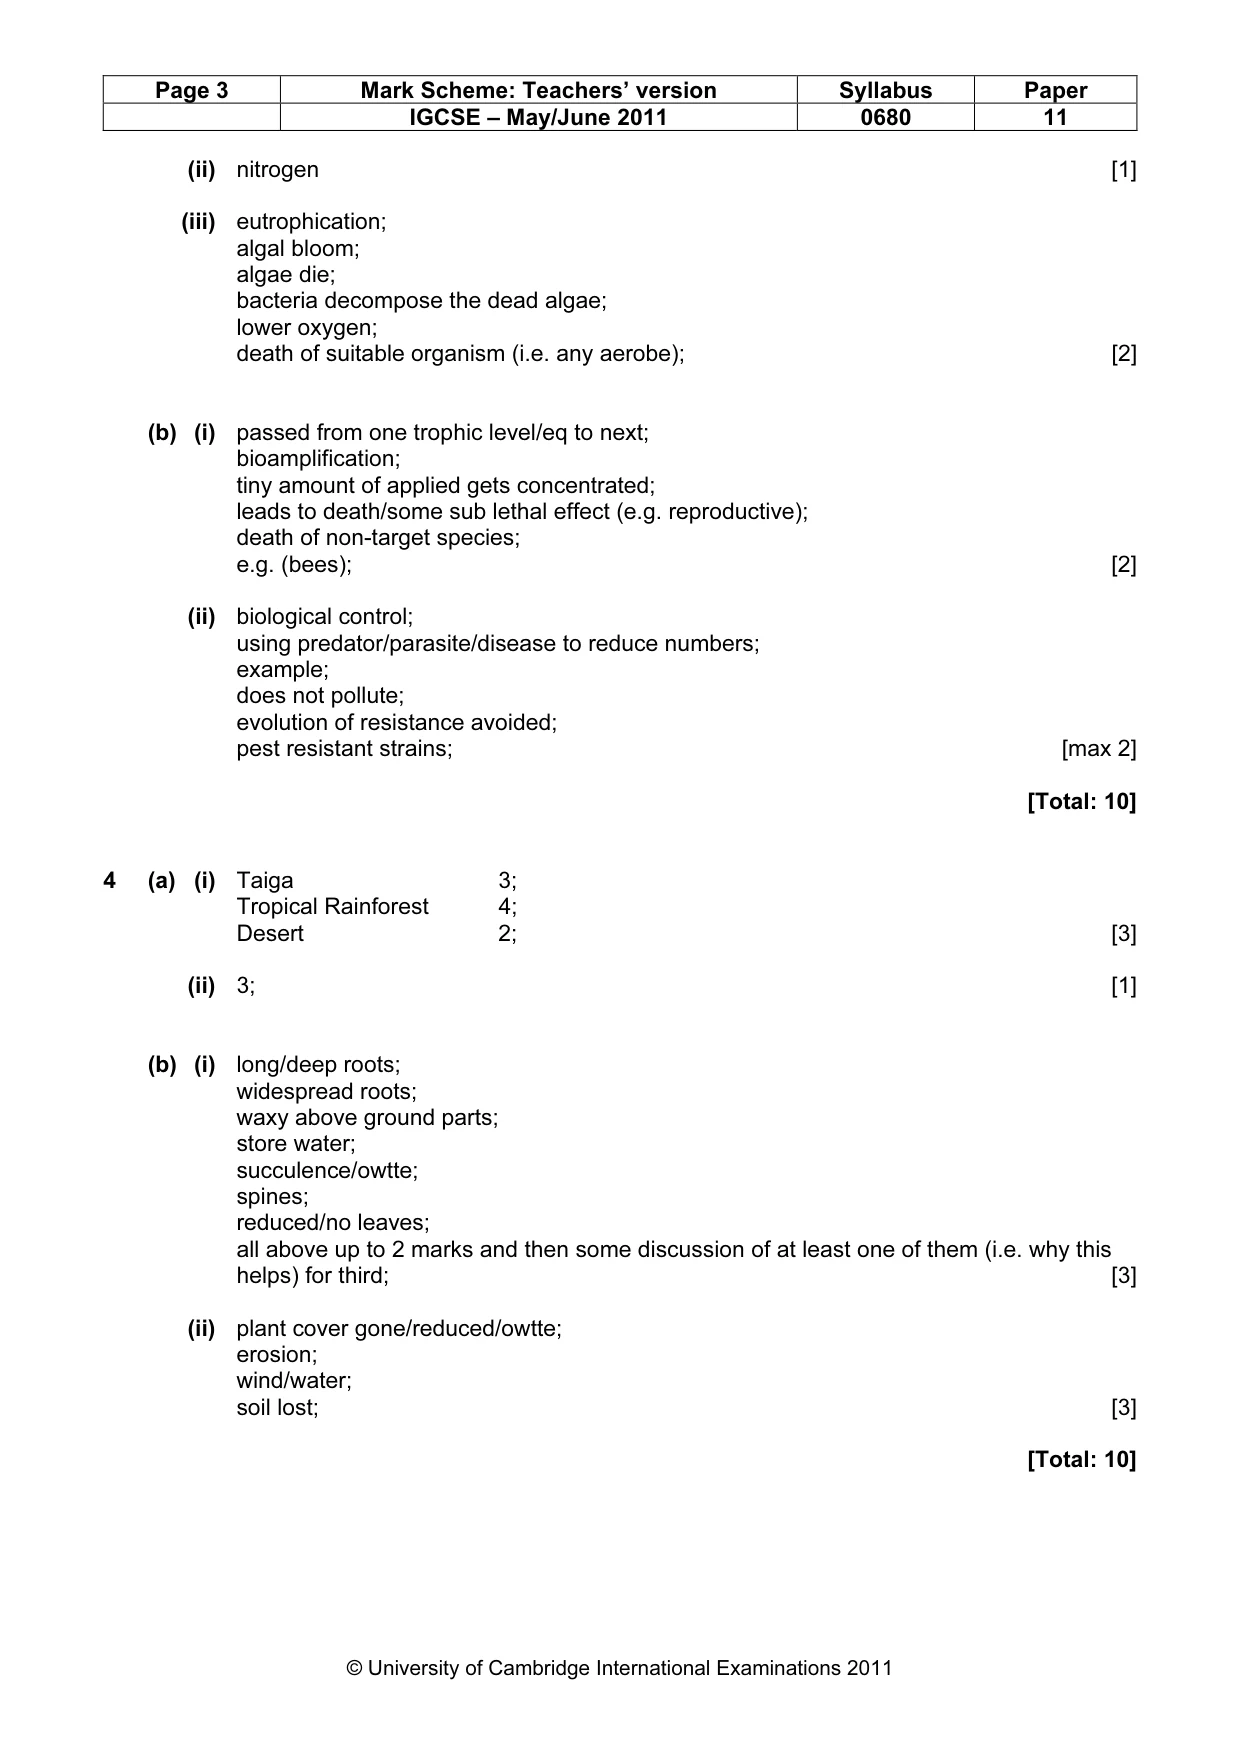
Page 3 Mark Scheme: Teachers’ version Syllabus Paper IGCSE – May/June 2011 0680 11 © University of Cambridge International Examinations 2011 (ii) nitrogen [1] (iii) eutrophication; algal bloom; algae die; bacteria decompose the dead algae; lower oxygen; death of suitable organism (i.e. any aerobe); [2] (b) (i) passed from one trophic level/eq to next; bioamplification; tiny amount of applied gets concentrated; leads to death/some sub lethal effect (e.g. reproductive); death of non-target species; e.g. (bees); [2] (ii) biological control; using predator/parasite/disease to reduce numbers; example; does not pollute; evolution of resistance avoided; pest resistant strains; [max 2] [Total: 10] 4 (a) (i) Taiga 3; Tropical Rainforest 4; Desert 2; [3] (ii) 3; [1] (b) (i) long/deep roots; widespread roots; waxy above ground parts; store water; succulence/owtte; spines; reduced/no leaves; all above up to 2 marks and then some discussion of at least one of them (i.e. why this helps) for third; [3] (ii) plant cover gone/reduced/owtte; erosion; wind/water; soil lost; [3] [Total: 10]
Mark scheme, page 4
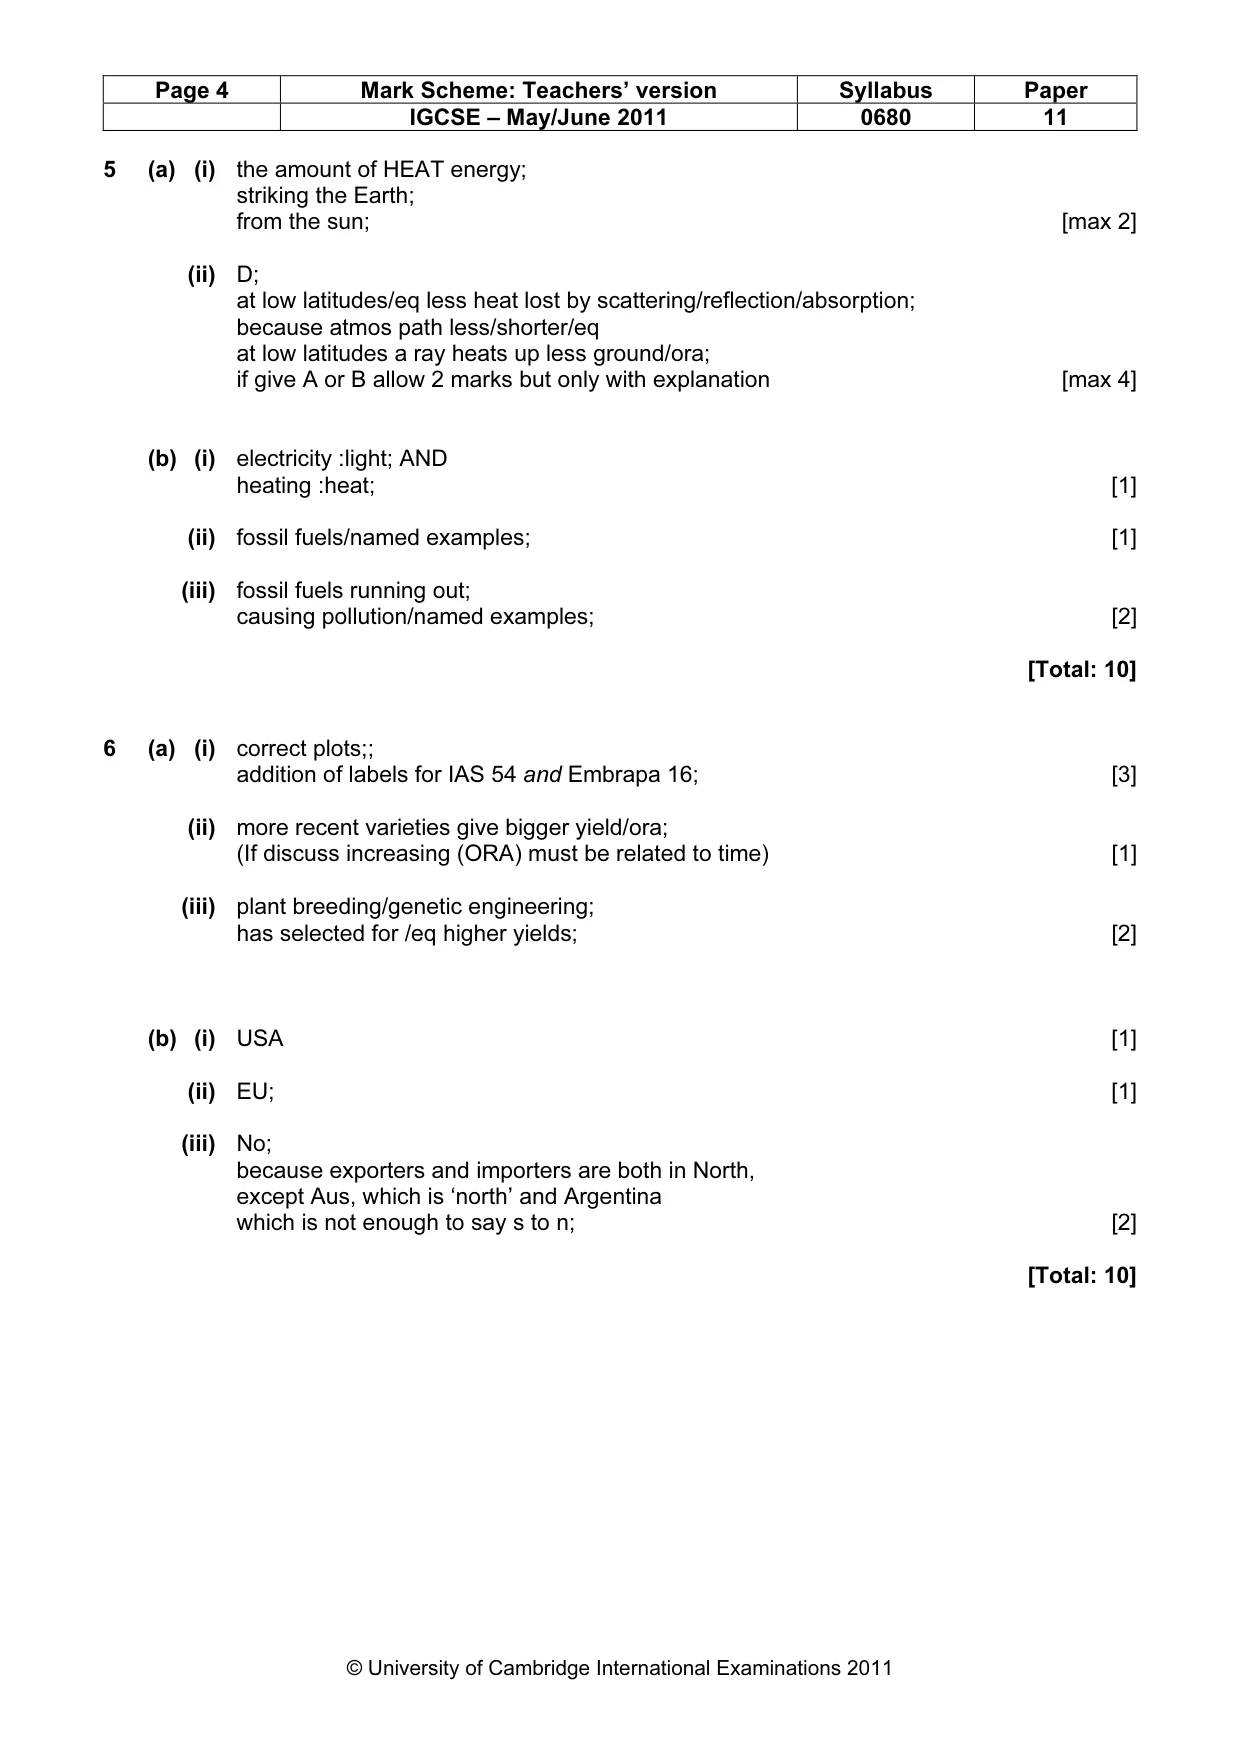
Page 4 Mark Scheme: Teachers’ version Syllabus Paper IGCSE – May/June 2011 0680 11 © University of Cambridge International Examinations 2011 5 (a) (i) the amount of HEAT energy; striking the Earth; from the sun; [max 2] (ii) D; at low latitudes/eq less heat lost by scattering/reflection/absorption; because atmos path less/shorter/eq at low latitudes a ray heats up less ground/ora; if give A or B allow 2 marks but only with explanation [max 4] (b) (i) electricity :light; AND heating :heat; [1] (ii) fossil fuels/named examples; [1] (iii) fossil fuels running out; causing pollution/named examples; [2] [Total: 10] 6 (a) (i) correct plots;; addition of labels for IAS 54 and Embrapa 16; [3] (ii) more recent varieties give bigger yield/ora; (If discuss increasing (ORA) must be related to time) [1] (iii) plant breeding/genetic engineering; has selected for /eq higher yields; [2] (b) (i) USA [1] (ii) EU; [1] (iii) No; because exporters and importers are both in North, except Aus, which is ‘north’ and Argentina which is not enough to say s to n; [2] [Total: 10]
What you needed in this session
Cambridge’s own grade thresholds for 2011 May/June, Paper 1 · Variant 1. A higher threshold means an easier paper — the bar moves with how the cohort did.