Cambridge IGCSE Environmental Management 0680 — 2010 Oct/Nov Paper 1 · Variant 2
0680/12/O/N/10 · 60 marks · ≈68 min
The question paper and its mark scheme, free to read here and free to download. This is Cambridge’s own paper, exactly as it was sat.
Question paper16 pages



Mark scheme4 pages
Answers below. Sit the paper first if you are practising.
Paper as text
Question paper, page 1
This document consists of 13 printed pages and 3 blank pages. DC (LEO/SW) 19497/3 © UCLES 2010 [Turn over UNIVERSITY OF CAMBRIDGE INTERNATIONAL EXAMINATIONS International General Certificate of Secondary Education READ THESE INSTRUCTIONS FIRST Write your Centre number, candidate number and name on all the work you hand in. Write in dark blue or black pen. You may use a soft pencil for any diagrams, graphs or rough working. Do not use staples, paper clips, highlighters, glue or correction fluid. DO NOT WRITE IN ANY BARCODES. Answer all questions. At the end of the examination, fasten all your work securely together. The number of marks is given in brackets [ ] at the end of each question or part question. * 6 4 1 0 6 7 7 1 1 4 * ENVIRONMENTAL MANAGEMENT 0680/12 Paper 1 October/November 2010 1 hour 30 minutes Candidates answer on the Question Paper. Additional Materials: Ruler For Examiner’s Use 1 2 3 4 5 6 Total www.XtremePapers.com
Question paper, page 2
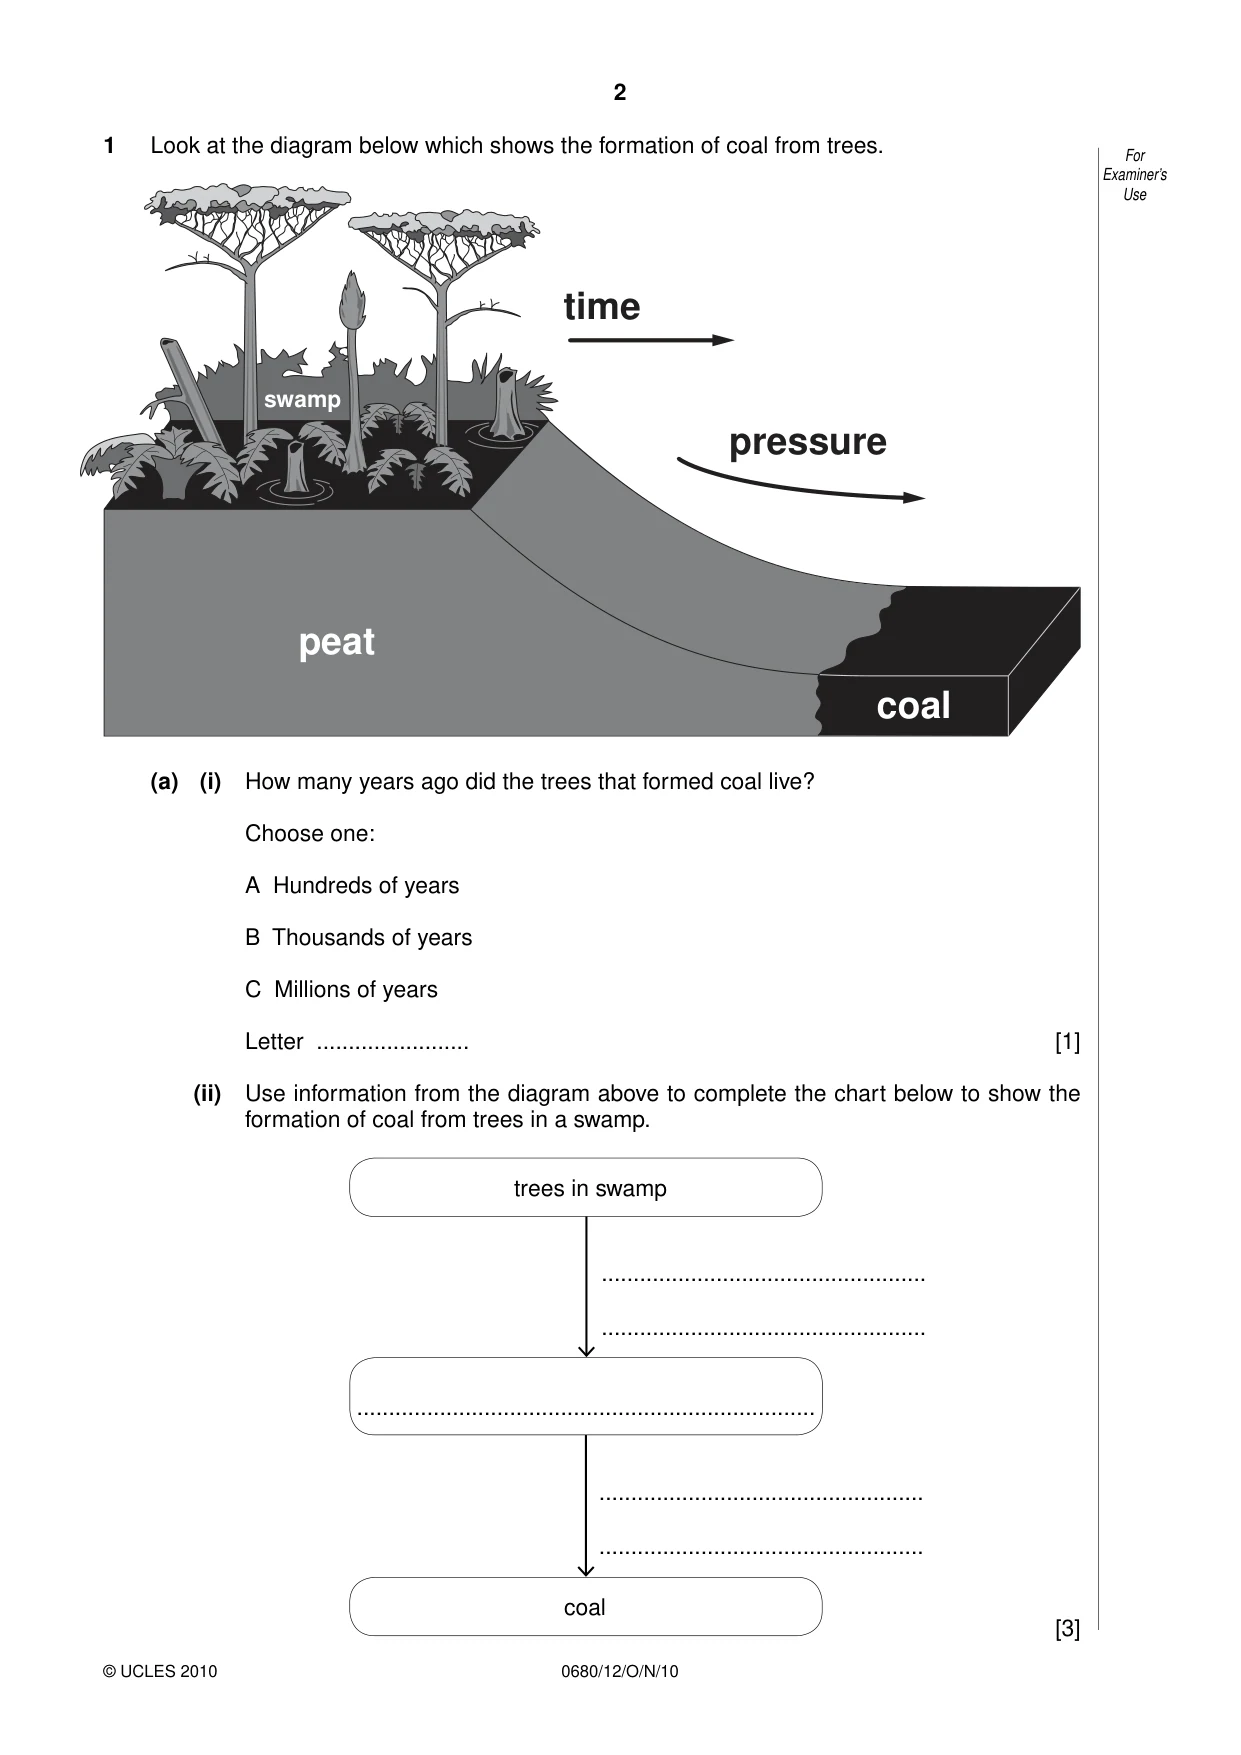
2 0680/12/O/N/10 © UCLES 2010 For Examiner’s Use 1 Look at the diagram below which shows the formation of coal from trees. coal peat swamp time pressure (a) (i) How many years ago did the trees that formed coal live? Choose one: A Hundreds of years B Thousands of years C Millions of years Letter … [1] (ii) Use information from the diagram above to complete the chart below to show the formation of coal from trees in a swamp. coal … … … trees in swamp … … [3]
Question paper, page 3
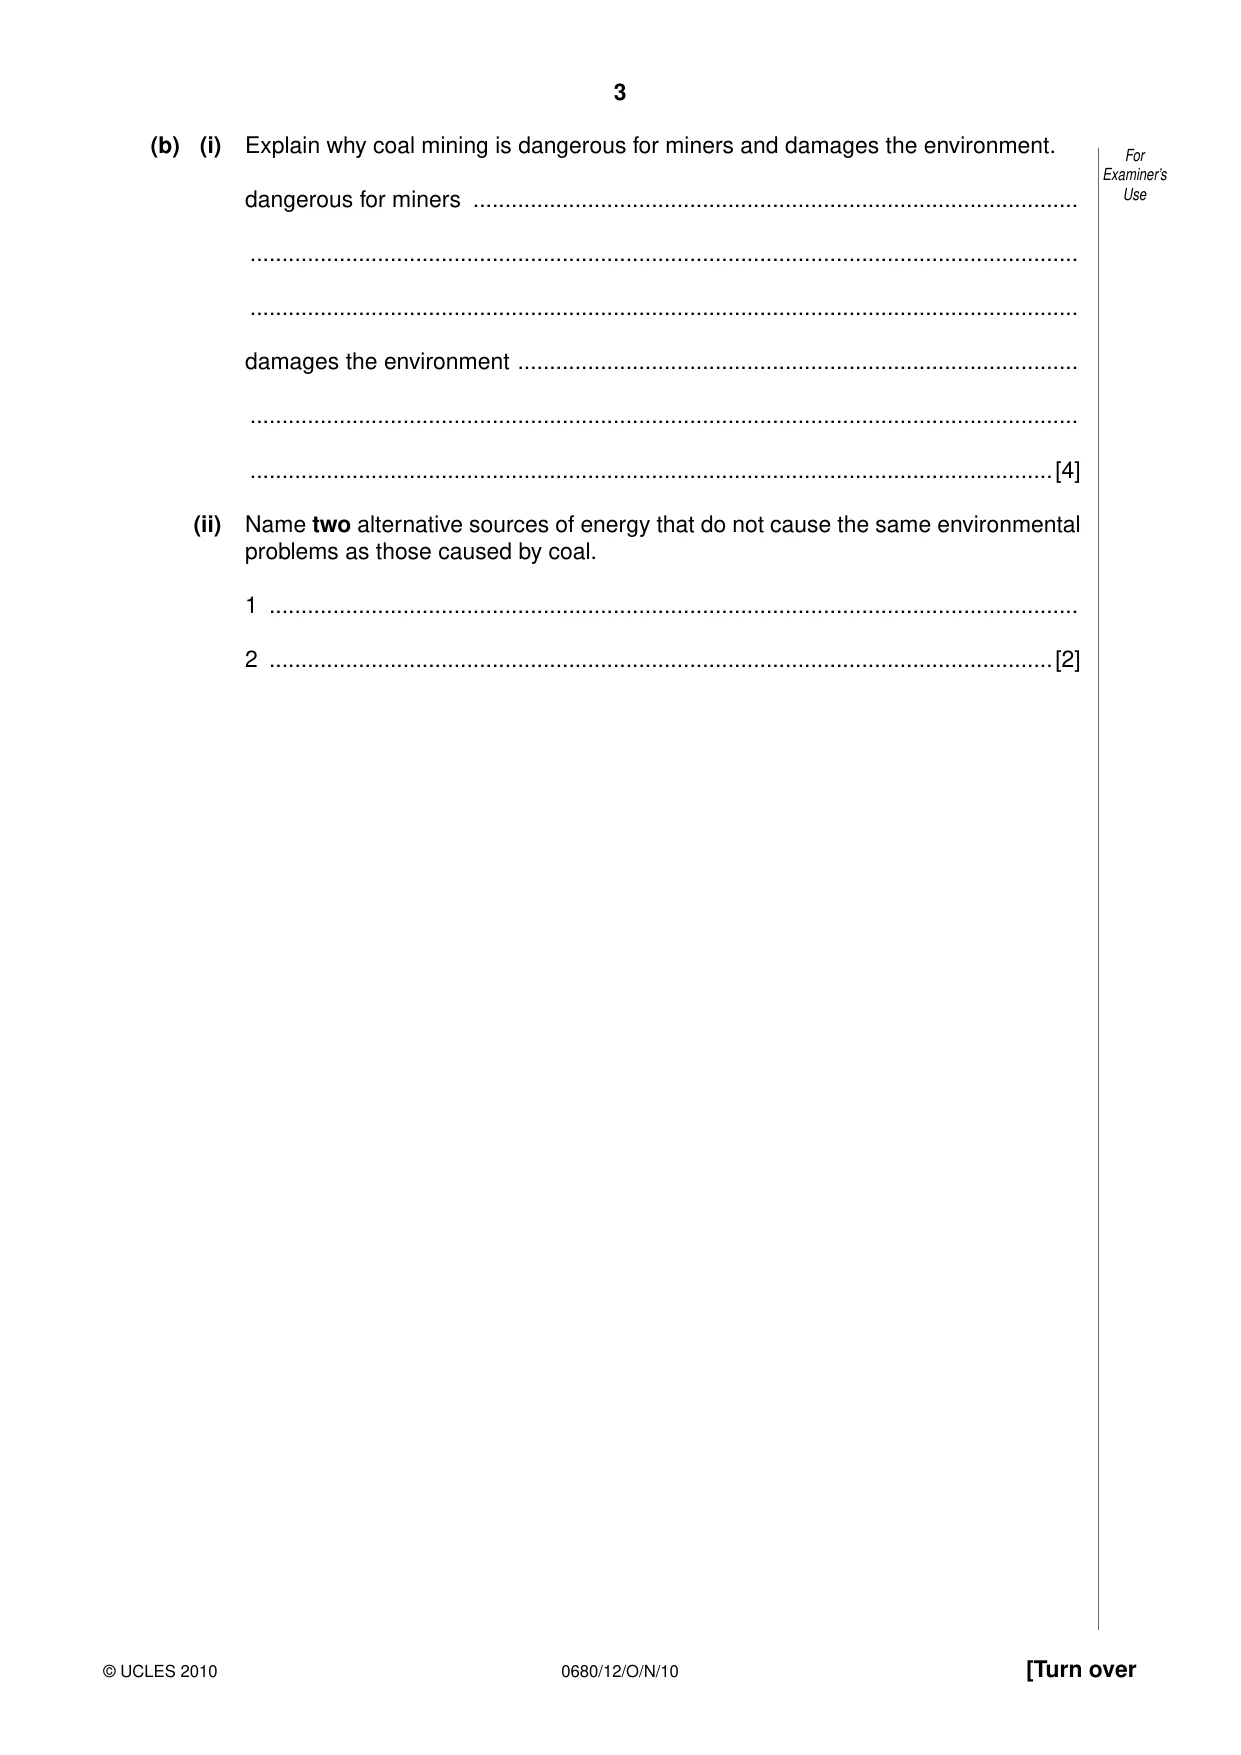
3 0680/12/O/N/10 © UCLES 2010 [Turn over For Examiner’s Use (b) (i) Explain why coal mining is dangerous for miners and damages the environment. dangerous for miners … … … damages the environment … … …[4] (ii) Name two alternative sources of energy that do not cause the same environmental problems as those caused by coal. 1 … 2 …[2]
Question paper, page 4
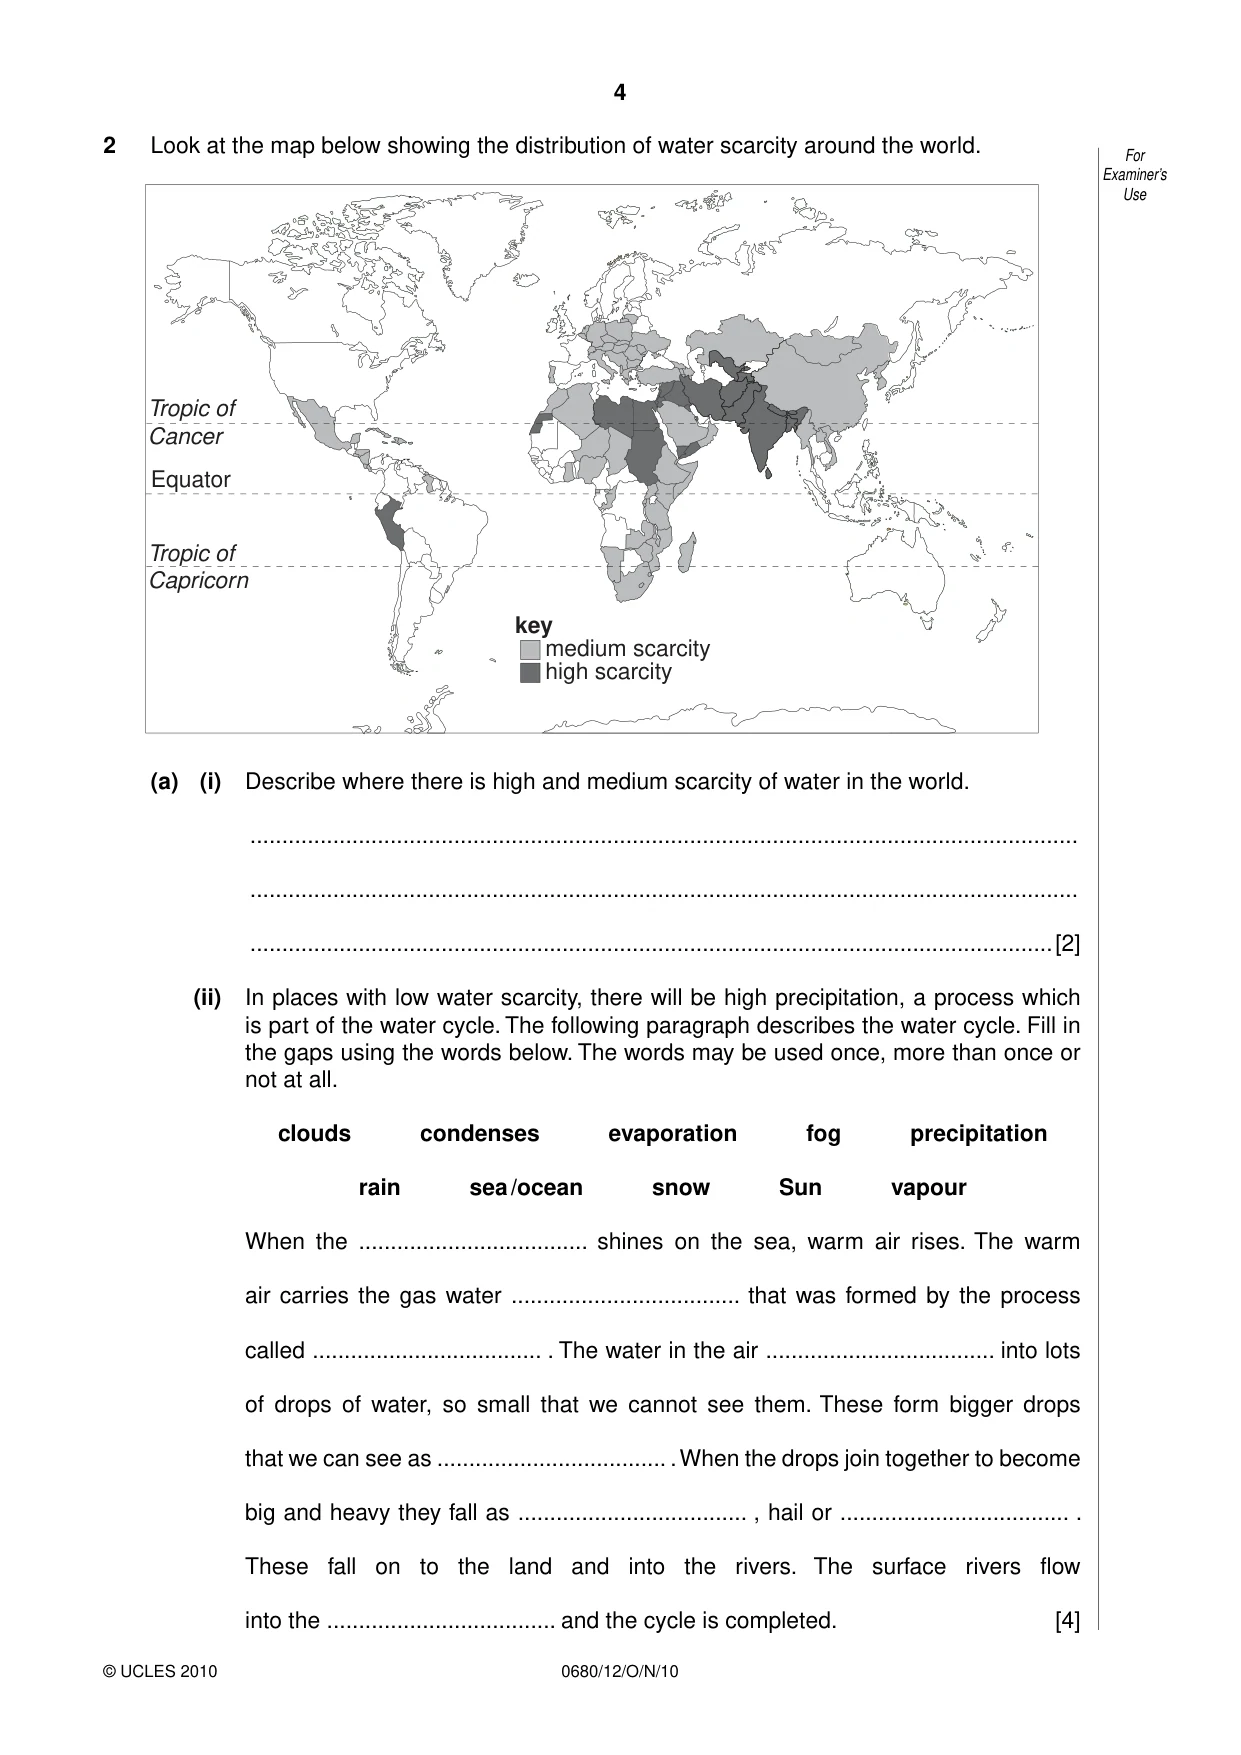
4 0680/12/O/N/10 © UCLES 2010 For Examiner’s Use 2 Look at the map below showing the distribution of water scarcity around the world. Equator medium scarcity key high scarcity Tropic of Cancer Tropic of Capricorn (a) (i) Describe where there is high and medium scarcity of water in the world. … … …[2] (ii) In places with low water scarcity, there will be high precipitation, a process which is part of the water cycle. The following paragraph describes the water cycle. Fill in the gaps using the words below. The words may be used once, more than once or not at all. clouds condenses evaporation fog precipitation rain sea /ocean snow Sun vapour When the … shines on the sea, warm air rises. The warm air carries the gas water … that was formed by the process called … . The water in the air … into lots of drops of water, so small that we cannot see them. These form bigger drops that we can see as … . When the drops join together to become big and heavy they fall as … , hail or … . These fall on to the land and into the rivers. The surface rivers flow into the … and the cycle is completed. [4]
Question paper, page 5
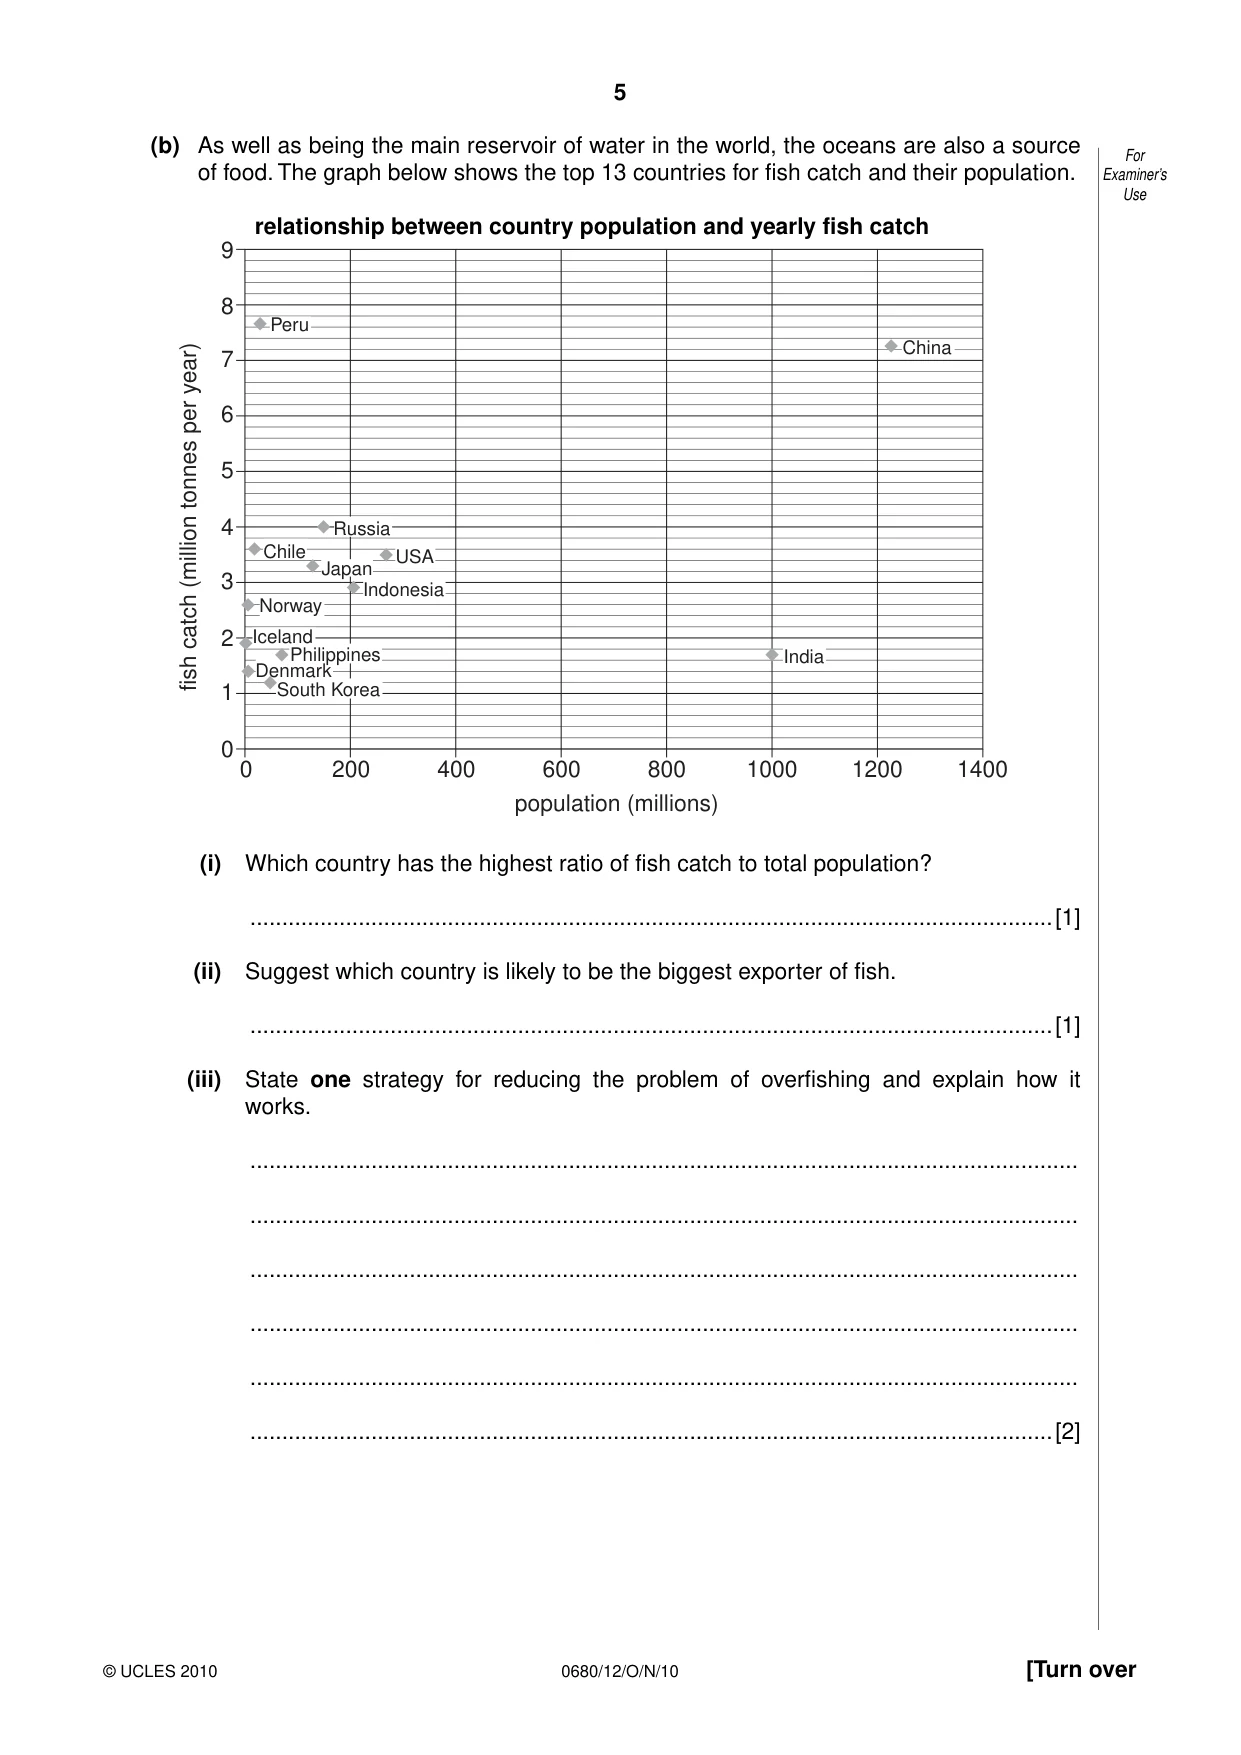
5 0680/12/O/N/10 © UCLES 2010 [Turn over For Examiner’s Use (b) As well as being the main reservoir of water in the world, the oceans are also a source of food. The graph below shows the top 13 countries for fish catch and their population. relationship between country population and yearly fish catch 0 0 1 2 3 4 5 6 7 8 9 200 400 600 800 population (millions) fish catch (million tonnes per year) 1000 1200 1400 China India Peru Chile Russia USA Indonesia Norway Iceland Philippines Denmark South Korea Japan (i) Which country has the highest ratio of fish catch to total population? …[1] (ii) Suggest which country is likely to be the biggest exporter of fish. …[1] (iii) State one strategy for reducing the problem of overfishing and explain how it works. … … … … … …[2]
Question paper, page 6
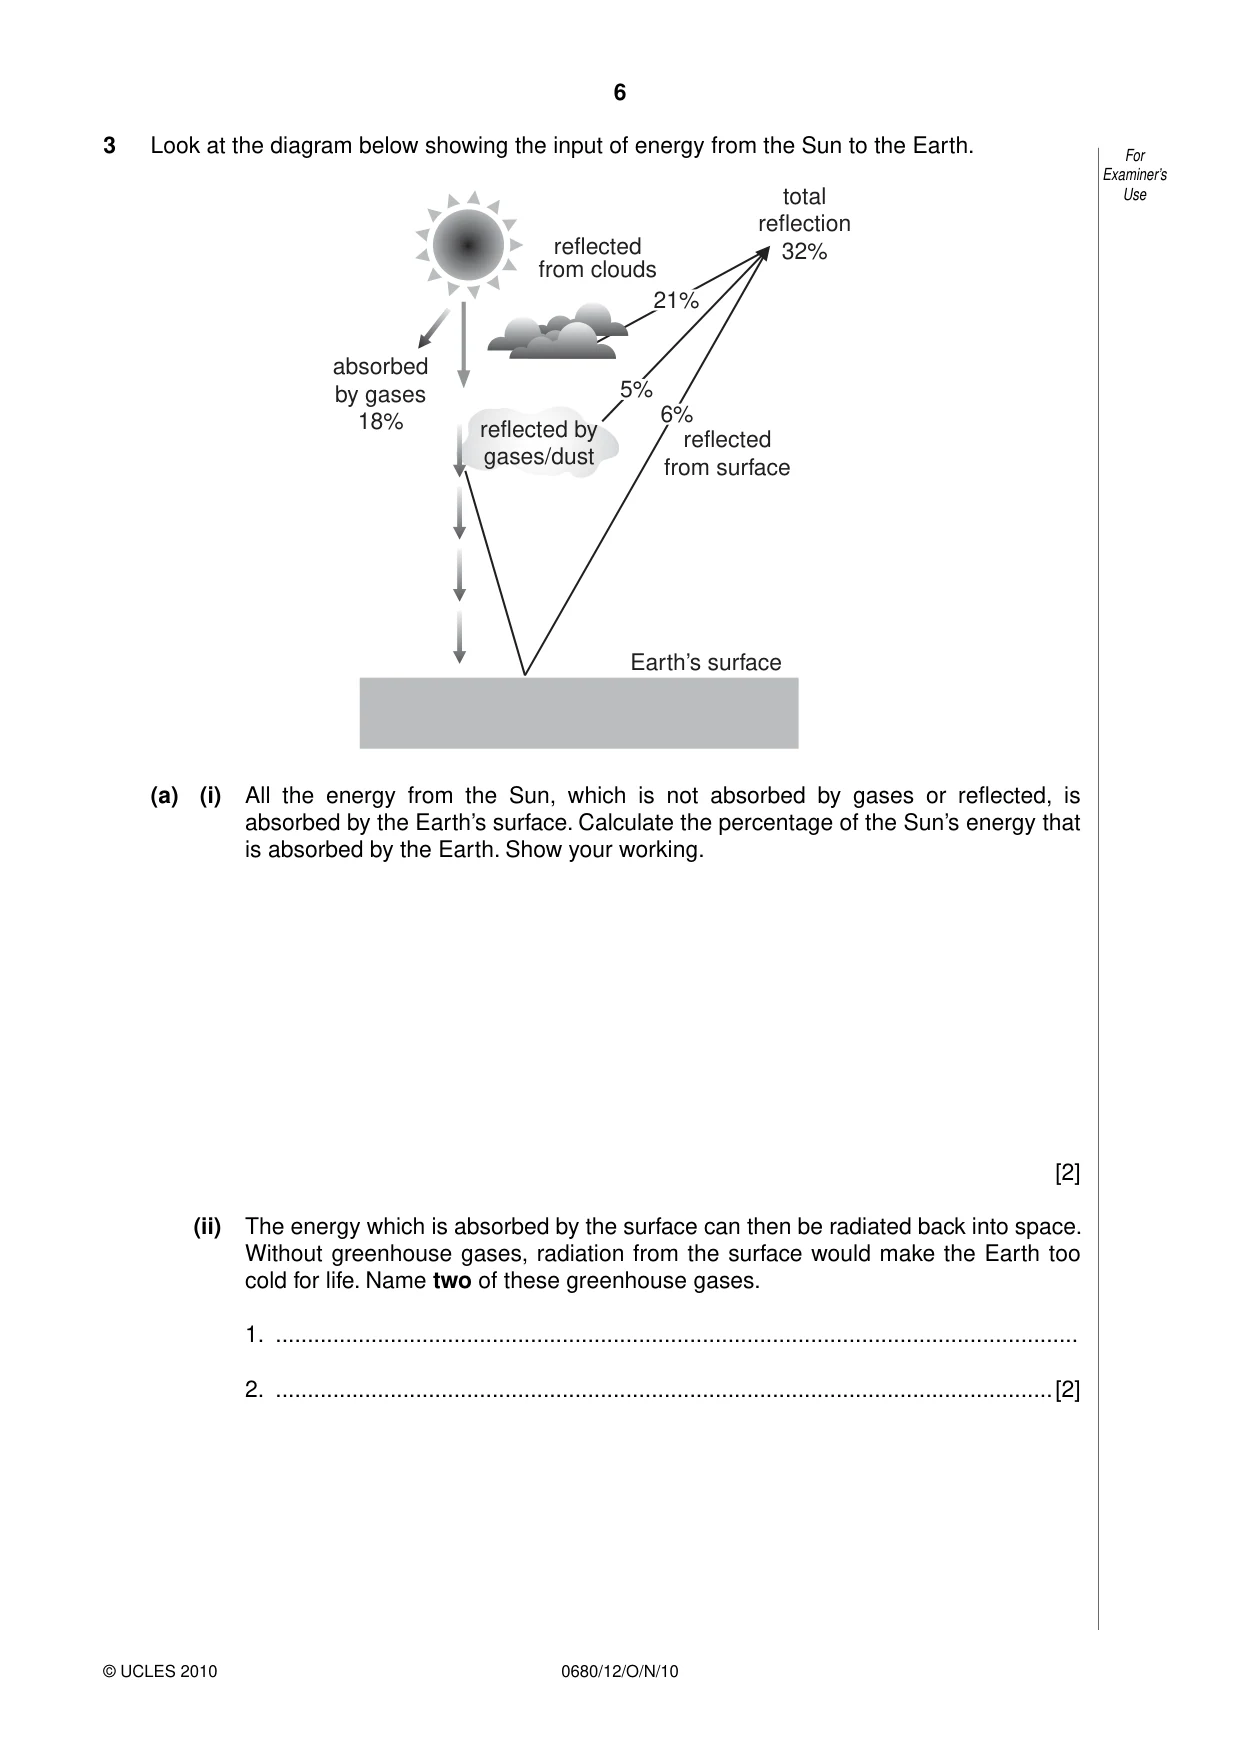
6 0680/12/O/N/10 © UCLES 2010 For Examiner’s Use 3 Look at the diagram below showing the input of energy from the Sun to the Earth. 21% reflected from clouds total reflection 32% 6% reflected from surface Earth’s surface reflected by gases/dust 5% absorbed by gases 18% (a) (i) All the energy from the Sun, which is not absorbed by gases or reflected, is absorbed by the Earth’s surface. Calculate the percentage of the Sun’s energy that is absorbed by the Earth. Show your working. [2] (ii) The energy which is absorbed by the surface can then be radiated back into space. Without greenhouse gases, radiation from the surface would make the Earth too cold for life. Name two of these greenhouse gases. 1. … 2. …[2]
Question paper, page 7
7 0680/12/O/N/10 © UCLES 2010 [Turn over For Examiner’s Use (b) Over the last two hundred years human activities have led to a decrease in the amount of radiated heat from the Earth’s surface being lost to space resulting in the warming of the atmosphere. (i) Draw a labelled diagram to show how this warming of the atmosphere occurs. [2] (ii) One major source of greenhouse gases is the motor car. Suggest two ways of reducing the amount of gases from this source. … … … … … …[4]
Question paper, page 8
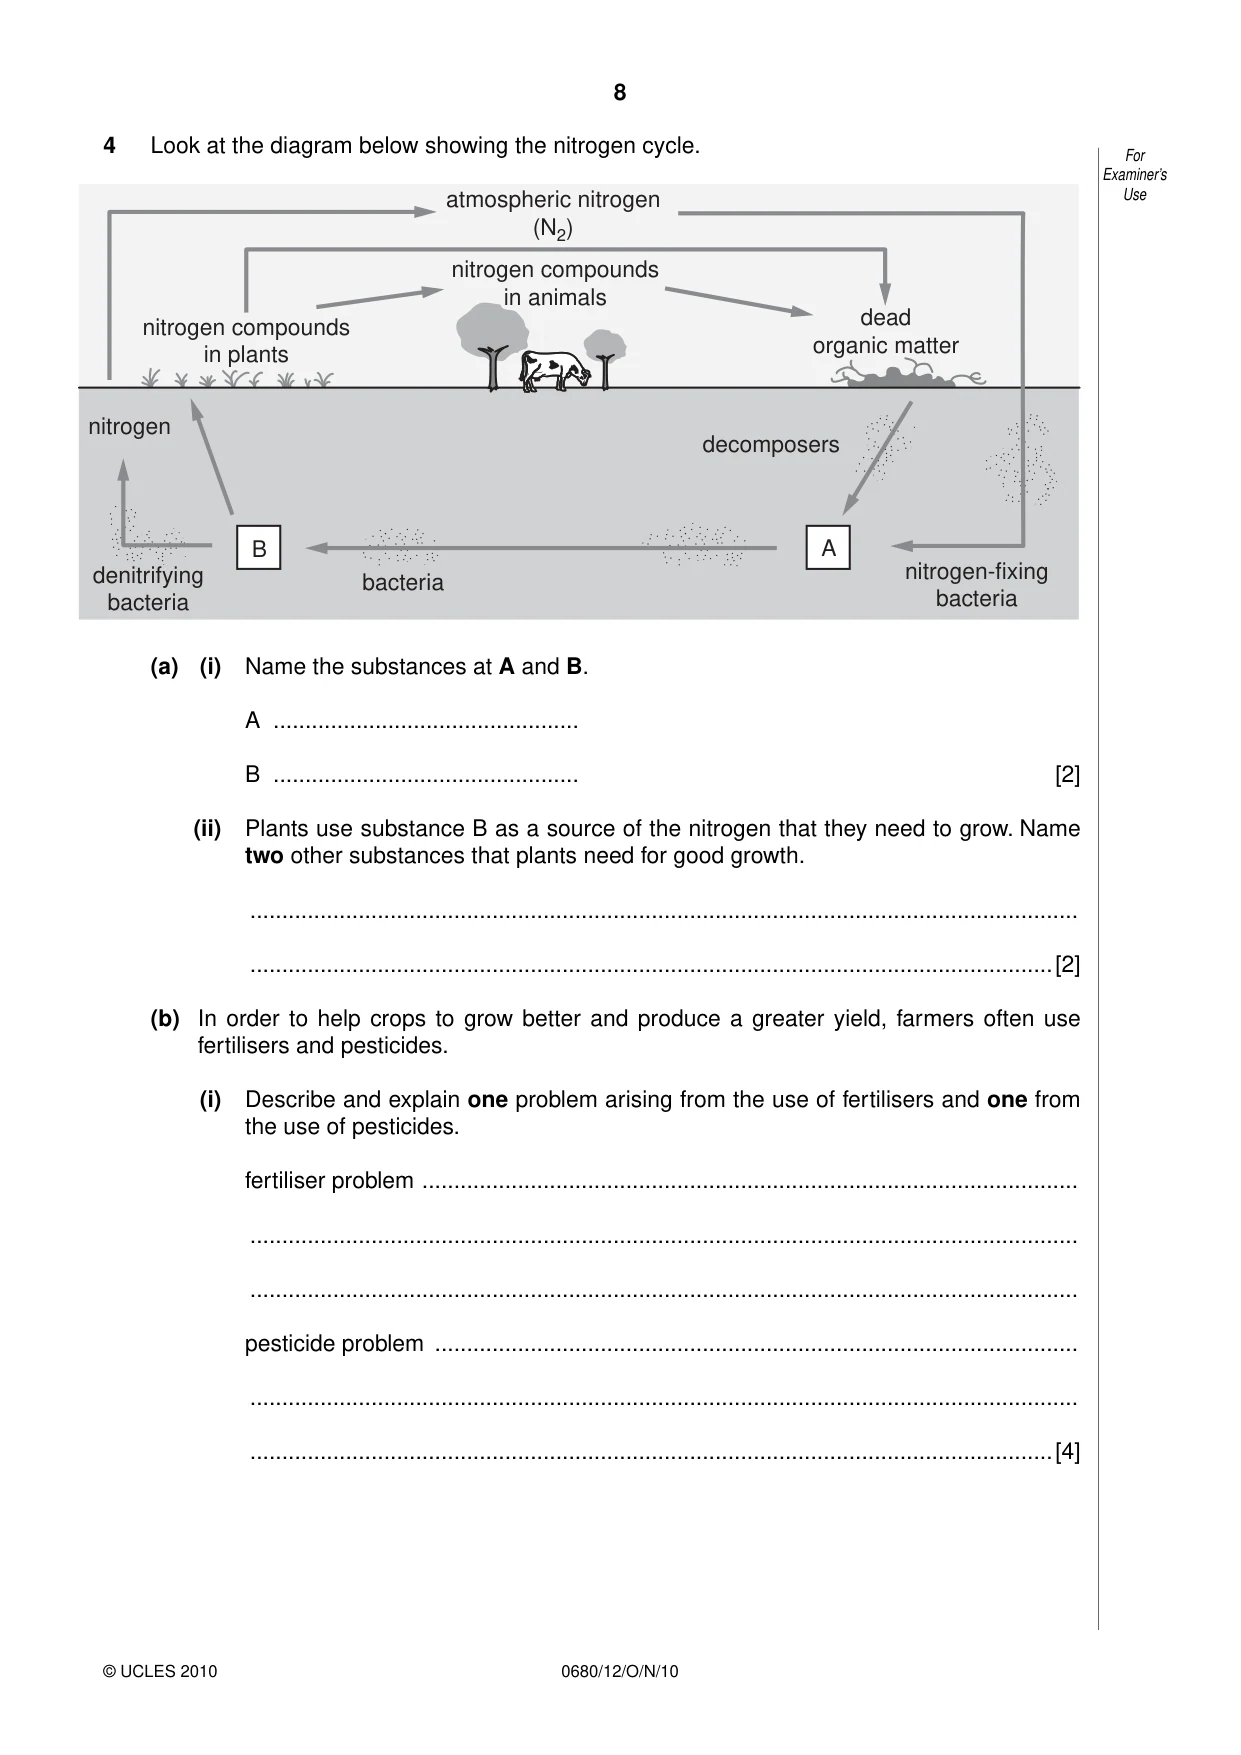
8 0680/12/O/N/10 © UCLES 2010 For Examiner’s Use 4 Look at the diagram below showing the nitrogen cycle. bacteria decomposers denitrifying bacteria nitrogen atmospheric nitrogen (N2) nitrogen compounds in animals nitrogen compounds in plants dead organic matter nitrogen-fixing bacteria B A (a) (i) Name the substances at A and B. A … B … [2] (ii) Plants use substance B as a source of the nitrogen that they need to grow. Name two other substances that plants need for good growth. … …[2] (b) In order to help crops to grow better and produce a greater yield, farmers often use fertilisers and pesticides. (i) Describe and explain one problem arising from the use of fertilisers and one from the use of pesticides. fertiliser problem … … … pesticide problem … … …[4]
Question paper, page 9
9 0680/12/O/N/10 © UCLES 2010 [Turn over For Examiner’s Use (ii) To avoid the problems pesticide use can cause, farmers can use alternatives. Describe some of these alternatives. … … … …[2]
Question paper, page 10
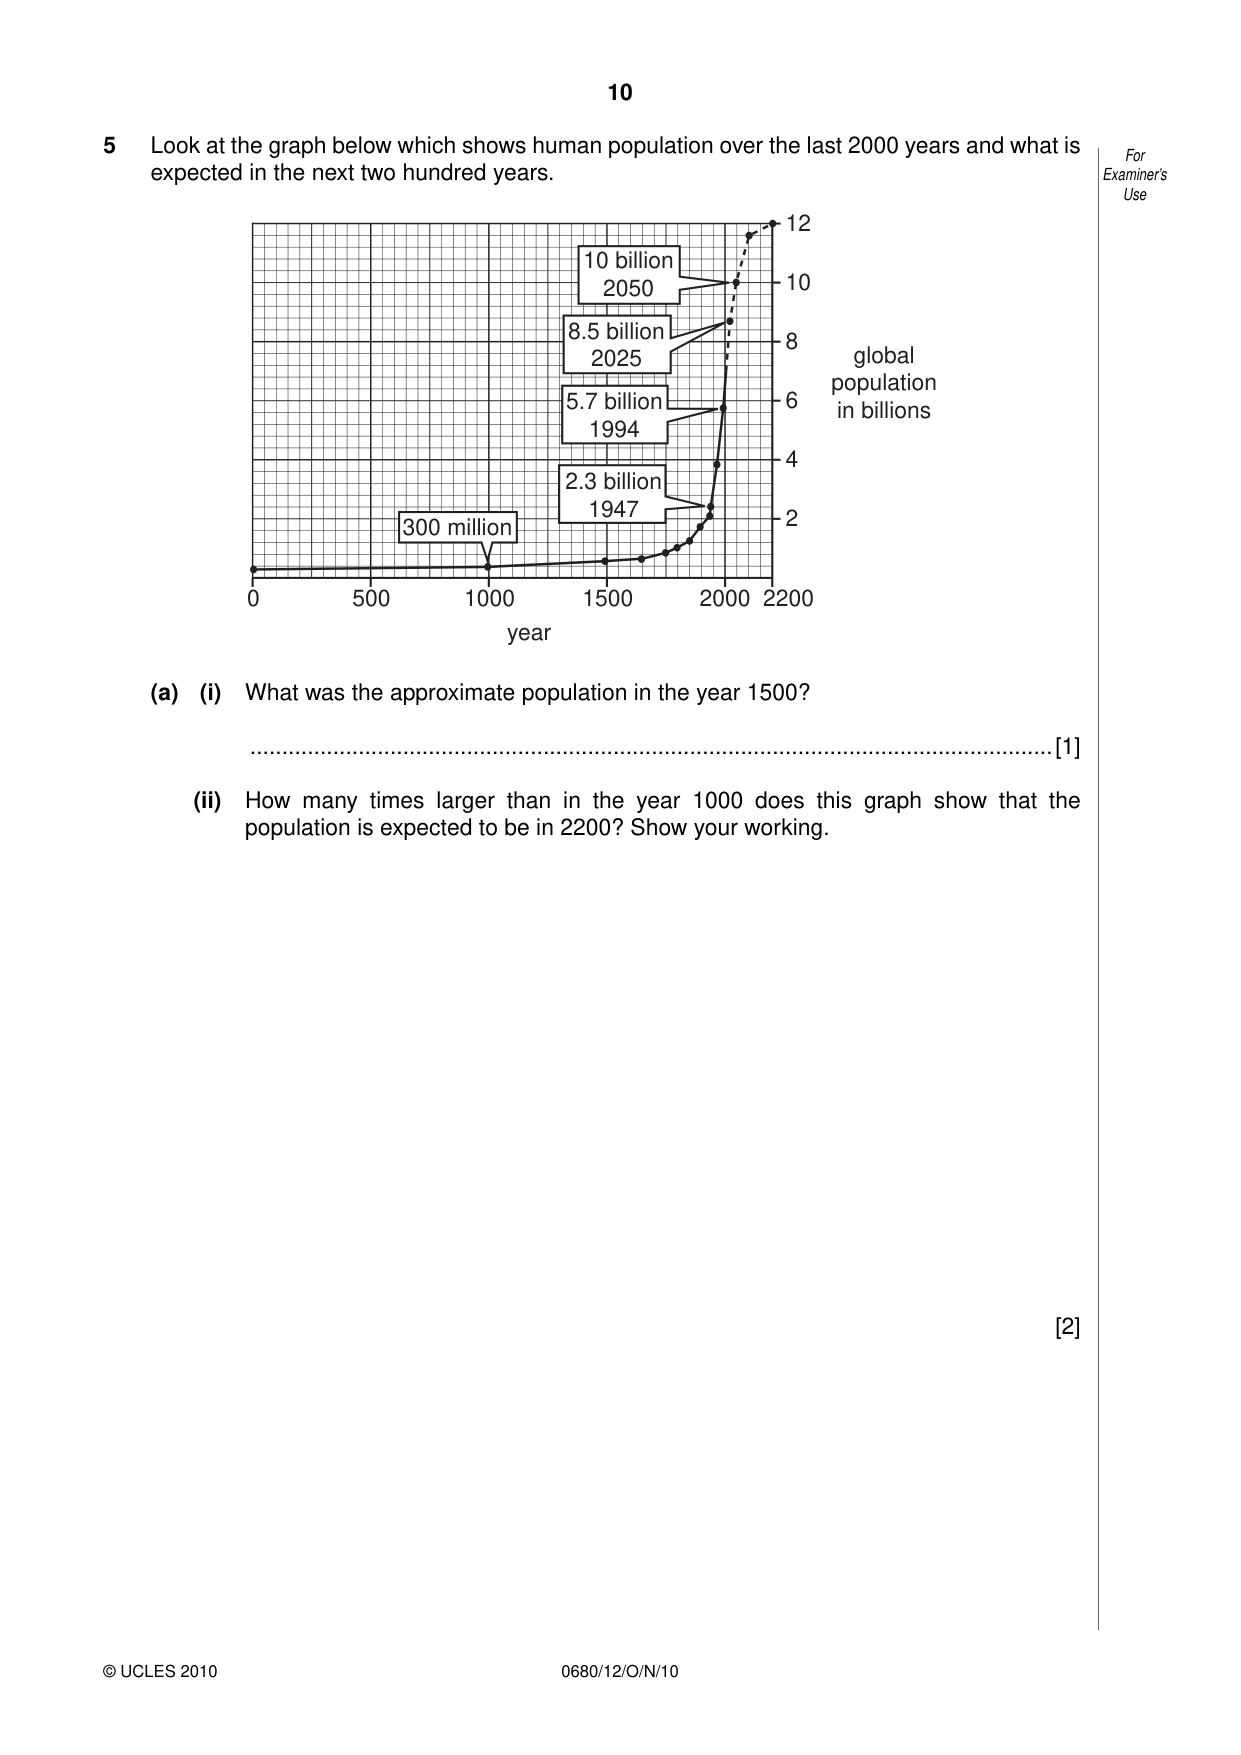
10 0680/12/O/N/10 © UCLES 2010 For Examiner’s Use 5 Look at the graph below which shows human population over the last 2000 years and what is expected in the next two hundred years. 0 500 1000 1500 2000 year 2200 2 4 6 8 10 12 global population in billions 10 billion 2050 8.5 billion 2025 5.7 billion 1994 2.3 billion 1947 300 million (a) (i) What was the approximate population in the year 1500? …[1] (ii) How many times larger than in the year 1000 does this graph show that the population is expected to be in 2200? Show your working. [2]
Question paper, page 11
11 0680/12/O/N/10 © UCLES 2010 [Turn over For Examiner’s Use (b) An increasing population causes many problems, especially for the environment. (i) List three ways, using the headings below, in which the environment might be damaged by population growth on a large scale. soil … … water … … vegetation … …[3] (ii) The most obvious solution to limit environmental damage is to slow, stop and then reverse population growth. This has been achieved in many European and other more developed countries. Apart from family planning, describe and explain two reasons why population growth rates have slowed down in more developed countries. … … … … … …[4]
Question paper, page 12
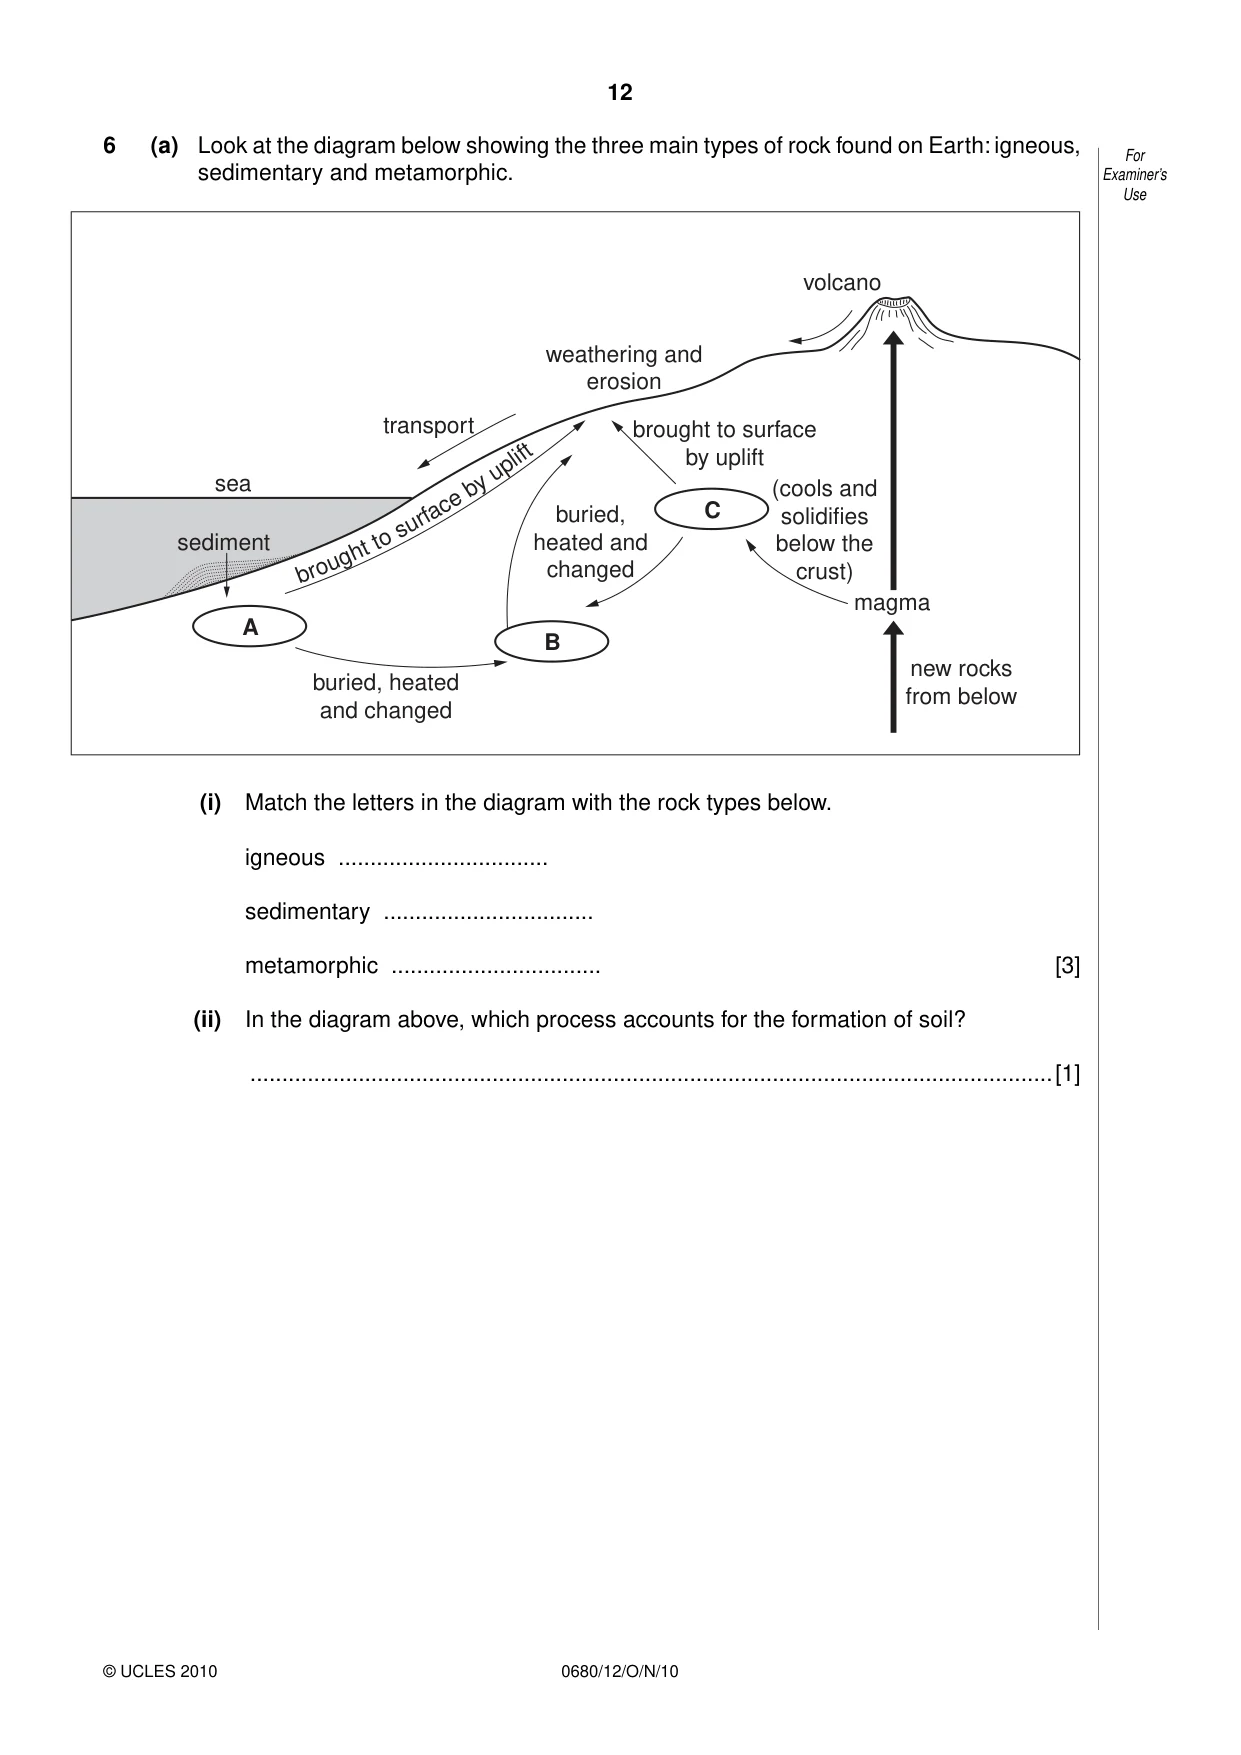
12 0680/12/O/N/10 © UCLES 2010 For Examiner’s Use 6 (a) Look at the diagram below showing the three main types of rock found on Earth: igneous, sedimentary and metamorphic. brou ght t o sur face by up lift A buried, heated and changed buried, heated and changed (cools and solidifies below the crust) magma new rocks from below brought to surface by uplift weathering and erosion volcano B C transport sea sediment (i) Match the letters in the diagram with the rock types below. igneous … sedimentary … metamorphic … [3] (ii) In the diagram above, which process accounts for the formation of soil? …[1]
Question paper, page 13
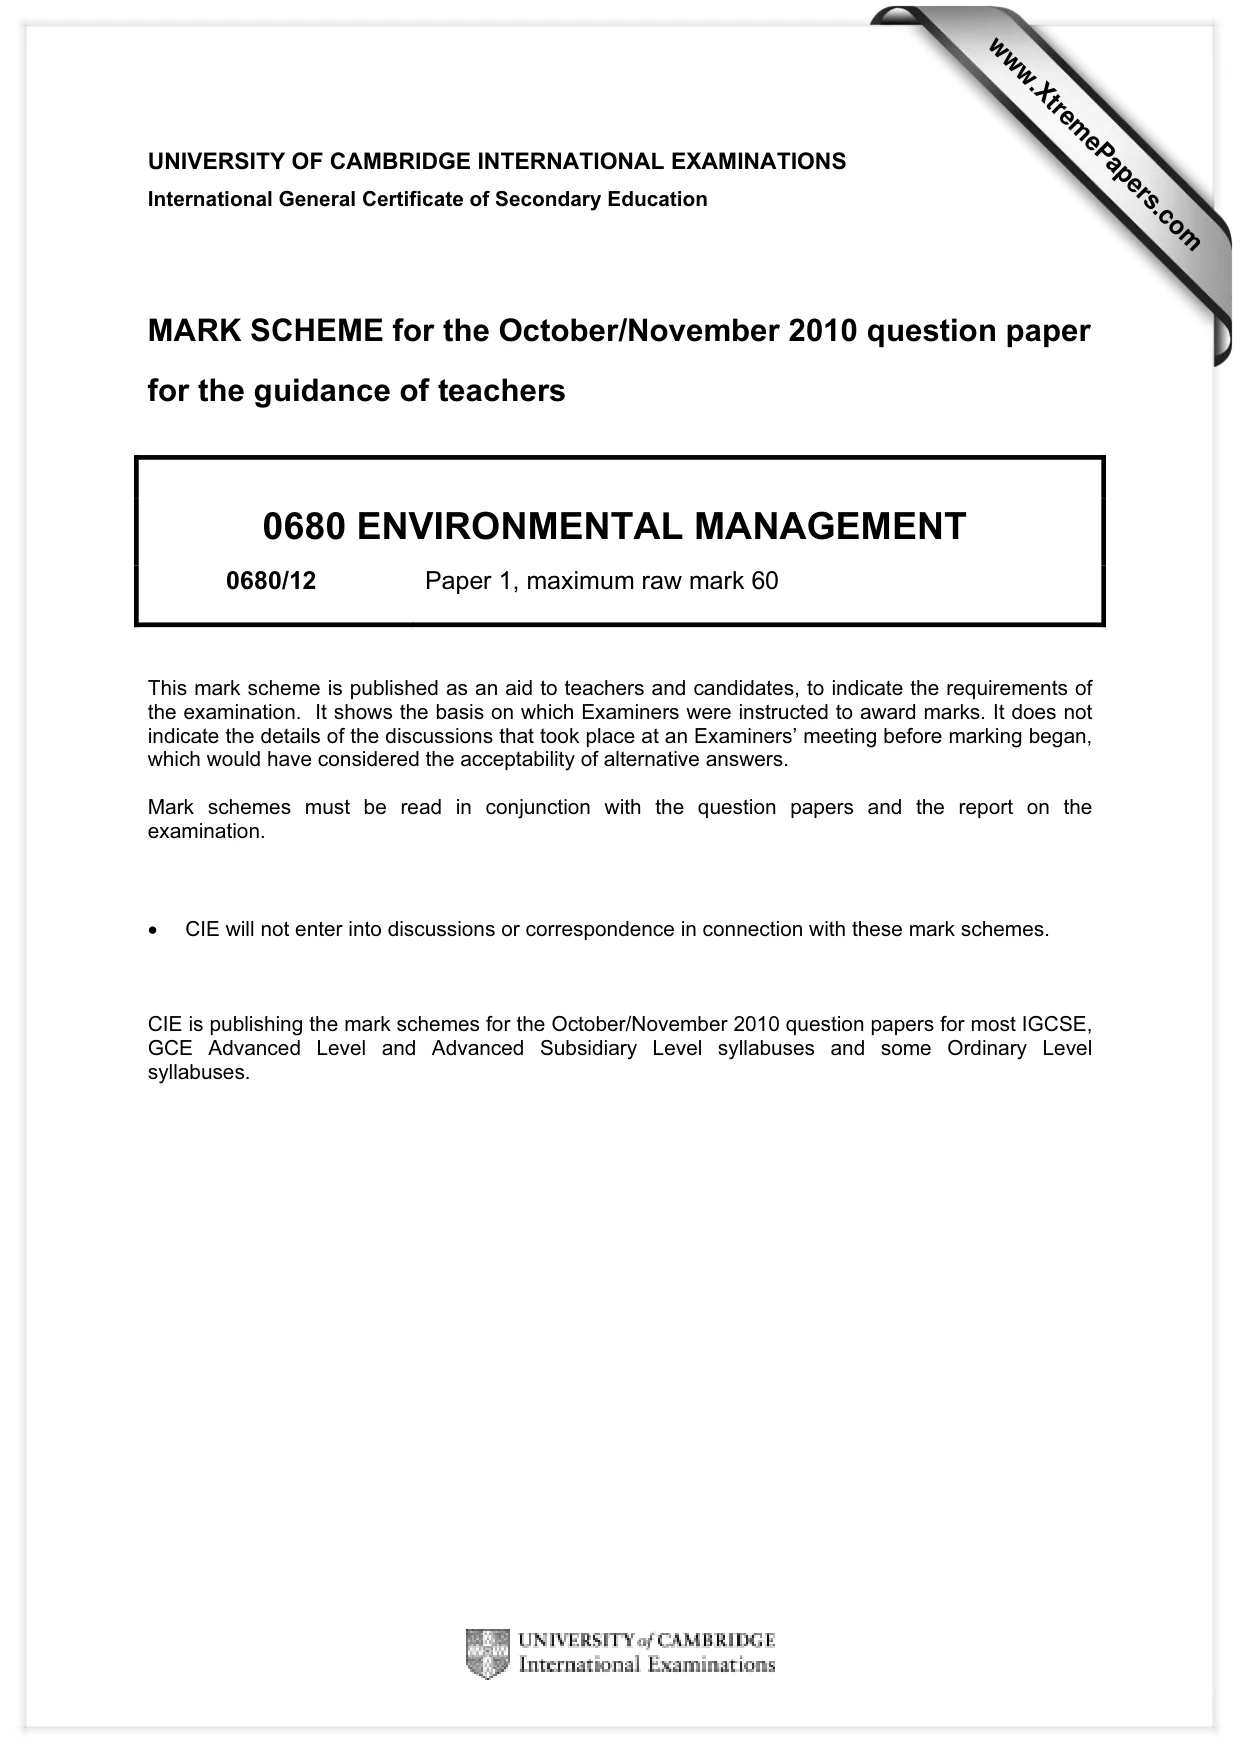
13 0680/12/O/N/10 © UCLES 2010 For Examiner’s Use (b) The diagram below shows some of the ways in which loss of soil can be reduced when growing crops on a hillside. D E C A crop growing in valley bottom B (i) Name the process which causes soil loss. …[1] (ii) On the diagram, A, B, C and D are all methods which protect against soil loss. Name these methods. A … B … C … D …[2] (iii) In the valley bottom at E, forest has been cleared to grow crops. Describe how deforestation and growing crops might lead to increasing levels of carbon dioxide in the atmosphere. … … … … … …[3]
Question paper, page 14
14 0680/12/O/N/10 © UCLES 2010 BLANK PAGE
Question paper, page 15
15 0680/12/O/N/10 © UCLES 2010 BLANK PAGE
Question paper, page 16
16 0680/12/O/N/10 © UCLES 2010 BLANK PAGE Copyright Acknowledgements: Question 2 Map © J Pallister; Environmental Management ; Oxford University Press, India; 2005. Permission to reproduce items where third-party owned material protected by copyright is included has been sought and cleared where possible. Every reasonable effort has been made by the publisher (UCLES) to trace copyright holders, but if any items requiring clearance have unwittingly been included, the publisher will be pleased to make amends at the earliest possible opportunity. University of Cambridge International Examinations is part of the Cambridge Assessment Group. Cambridge Assessment is the brand name of University of Cambridge Local Examinations Syndicate (UCLES), which is itself a department of the University of Cambridge.
Mark scheme, page 1
UNIVERSITY OF CAMBRIDGE INTERNATIONAL EXAMINATIONS International General Certificate of Secondary Education MARK SCHEME for the October/November 2010 question paper for the guidance of teachers 0680 ENVIRONMENTAL MANAGEMENT 0680/12 Paper 1, maximum raw mark 60 This mark scheme is published as an aid to teachers and candidates, to indicate the requirements of the examination. It shows the basis on which Examiners were instructed to award marks. It does not indicate the details of the discussions that took place at an Examiners’ meeting before marking began, which would have considered the acceptability of alternative answers. Mark schemes must be read in conjunction with the question papers and the report on the examination. • CIE will not enter into discussions or correspondence in connection with these mark schemes. CIE is publishing the mark schemes for the October/November 2010 question papers for most IGCSE, GCE Advanced Level and Advanced Subsidiary Level syllabuses and some Ordinary Level syllabuses. www.XtremePapers.com
Mark scheme, page 2
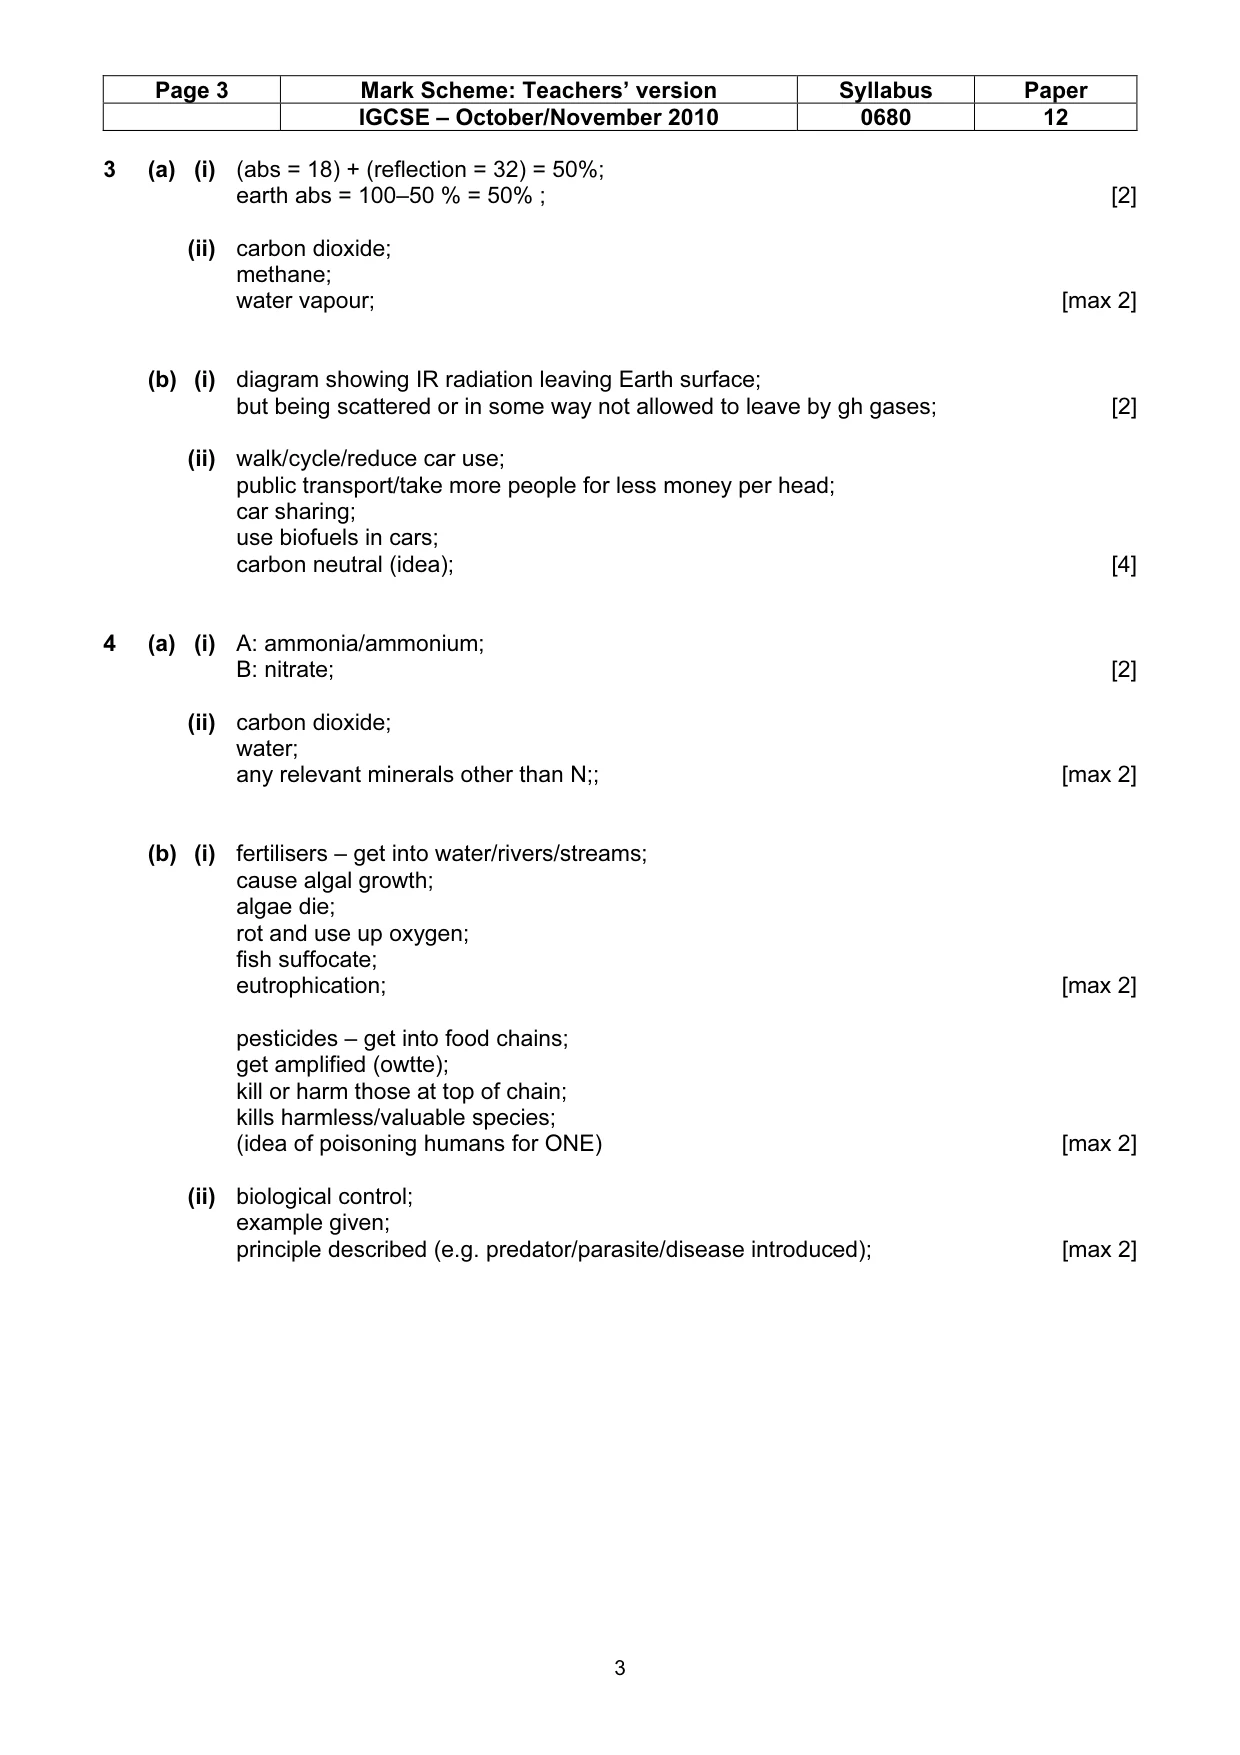
Page 2 Mark Scheme: Teachers’ version Syllabus Paper IGCSE – October/November 2010 0680 12 2 1 (a) (i) C; [1] (ii) A peat; B time and pressure; C time and pressure; [3] (b) (i) miners collapse of tunnel; fire due to gases from coal; poisoning from coal gases/silicosis; breathing problems; flooding; [max 2] environment spoil pollutes ground and water around mine; carbon dioxide/owtte when burnt; landscape destruction/visual pollution (open cast); [max 2] (b) (ii) wind; hep; geothermal; nuclear; tidal; wave; biofuels; [max 2] 2 (a) (i) N and S of tropics/equator; Africa; S Asia; W S America; AVP (relevant countries named); [max 2] (ii) sun; vapour; evaporation; condenses; clouds; rain; snow (owtte); sea/ocean; half each/round down [max 4] (b) (i) Peru [1] (ii) Peru [1] (iii) quotas/seasons/net size; relevant explanation; [2]
Mark scheme, page 3
Page 3 Mark Scheme: Teachers’ version Syllabus Paper IGCSE – October/November 2010 0680 12 3 3 (a) (i) (abs = 18) + (reflection = 32) = 50%; earth abs = 100–50 % = 50% ; [2] (ii) carbon dioxide; methane; water vapour; [max 2] (b) (i) diagram showing IR radiation leaving Earth surface; but being scattered or in some way not allowed to leave by gh gases; [2] (ii) walk/cycle/reduce car use; public transport/take more people for less money per head; car sharing; use biofuels in cars; carbon neutral (idea); [4] 4 (a) (i) A: ammonia/ammonium; B: nitrate; [2] (ii) carbon dioxide; water; any relevant minerals other than N;; [max 2] (b) (i) fertilisers – get into water/rivers/streams; cause algal growth; algae die; rot and use up oxygen; fish suffocate; eutrophication; [max 2] pesticides – get into food chains; get amplified (owtte); kill or harm those at top of chain; kills harmless/valuable species; (idea of poisoning humans for ONE) [max 2] (ii) biological control; example given; principle described (e.g. predator/parasite/disease introduced); [max 2]
Mark scheme, page 4
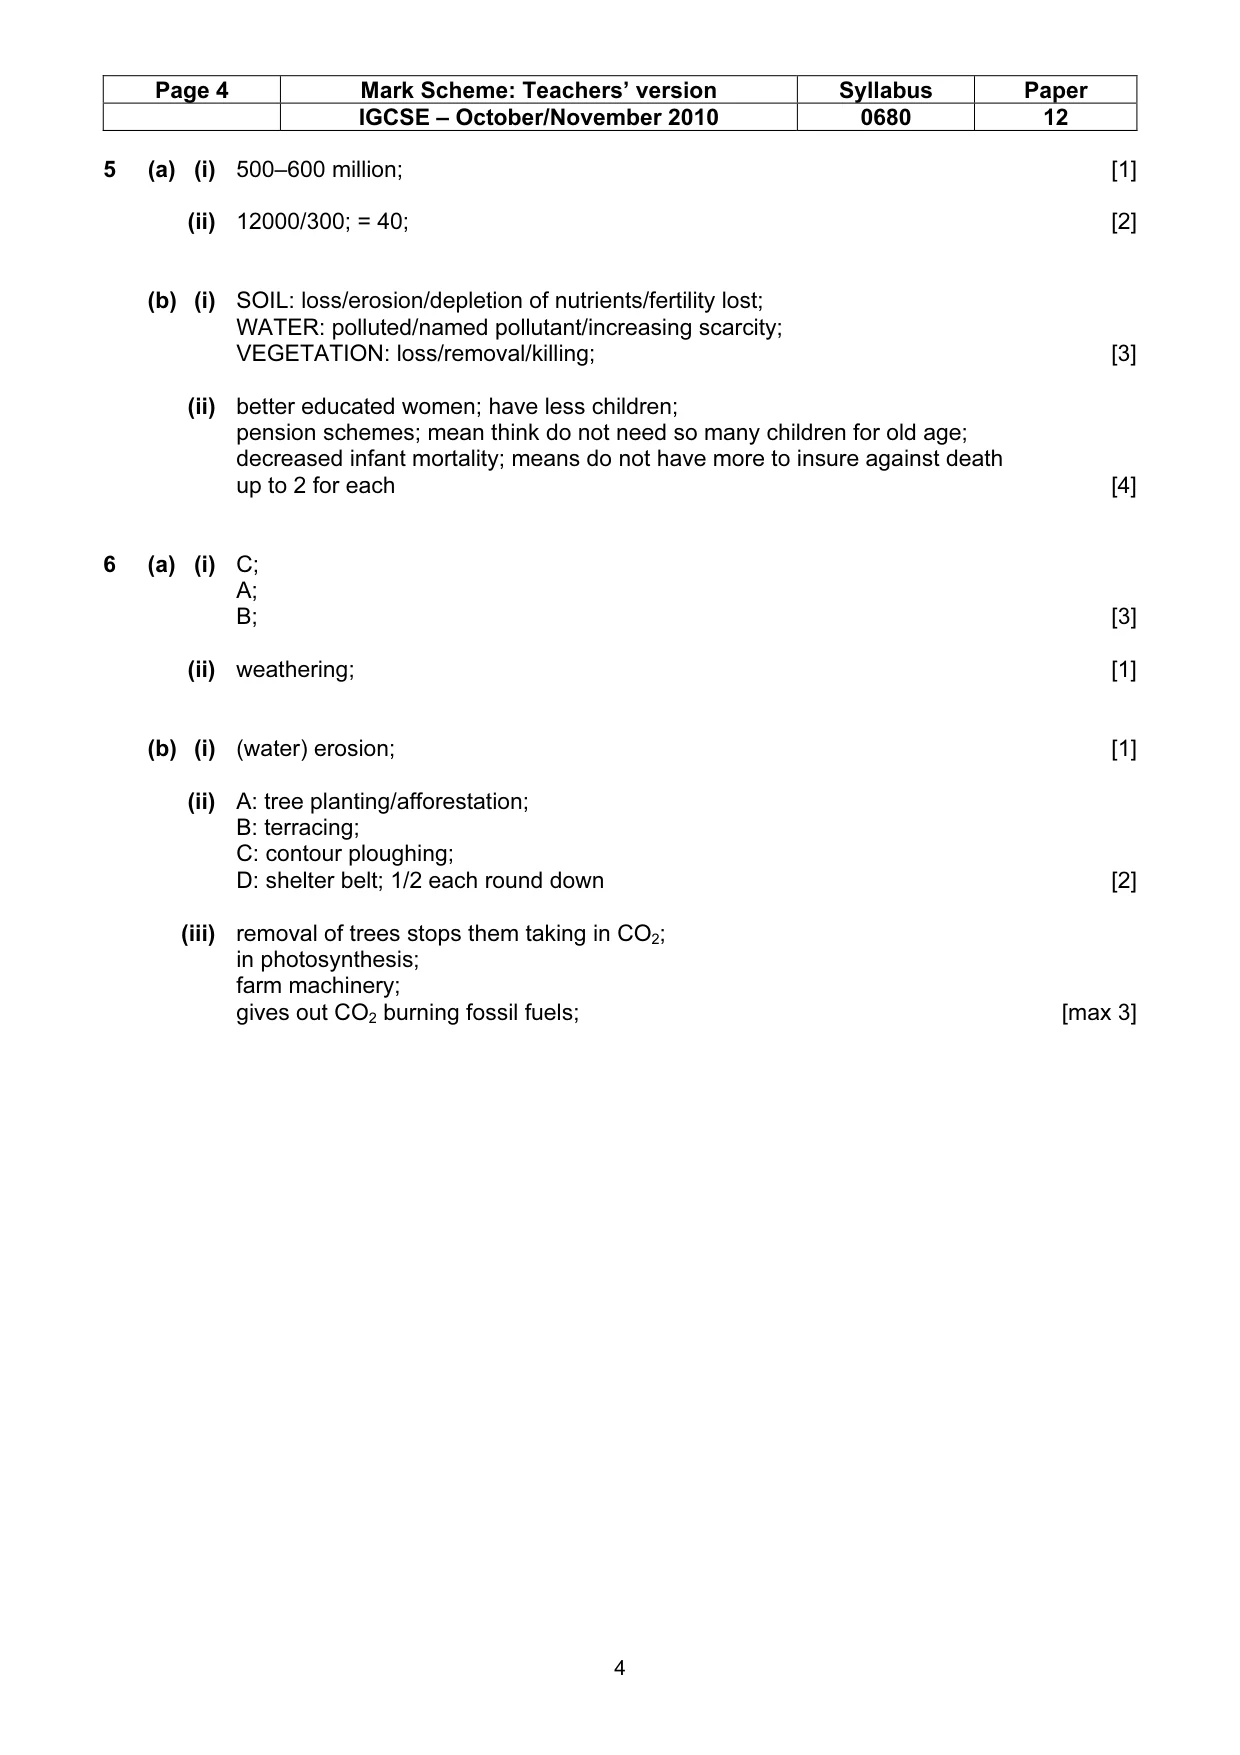
Page 4 Mark Scheme: Teachers’ version Syllabus Paper IGCSE – October/November 2010 0680 12 4 5 (a) (i) 500–600 million; [1] (ii) 12000/300; = 40; [2] (b) (i) SOIL: loss/erosion/depletion of nutrients/fertility lost; WATER: polluted/named pollutant/increasing scarcity; VEGETATION: loss/removal/killing; [3] (ii) better educated women; have less children; pension schemes; mean think do not need so many children for old age; decreased infant mortality; means do not have more to insure against death up to 2 for each [4] 6 (a) (i) C; A; B; [3] (ii) weathering; [1] (b) (i) (water) erosion; [1] (ii) A: tree planting/afforestation; B: terracing; C: contour ploughing; D: shelter belt; 1/2 each round down [2] (iii) removal of trees stops them taking in CO2; in photosynthesis; farm machinery; gives out CO2 burning fossil fuels; [max 3]
What you needed in this session
Cambridge’s own grade thresholds for 2010 Oct/Nov, Paper 1 · Variant 2. A higher threshold means an easier paper — the bar moves with how the cohort did.