Cambridge IGCSE Environmental Management 0680 — 2010 Oct/Nov Paper 1 · Variant 1
0680/11/O/N/10 · 60 marks · ≈68 min
The question paper and its mark scheme, free to read here and free to download. This is Cambridge’s own paper, exactly as it was sat.
Question paper12 pages
Mark scheme3 pages
Answers below. Sit the paper first if you are practising.
Paper as text
Question paper, page 1
This document consists of 12 printed pages. DC (AC/DJ) 16493/4 © UCLES 2010 [Turn over UNIVERSITY OF CAMBRIDGE INTERNATIONAL EXAMINATIONS International General Certificate of Secondary Education * 5 0 8 7 3 7 9 5 3 6 * ENVIRONMENTAL MANAGEMENT 0680/11 Paper 1 October/November 2010 1 hour 30 minutes Candidates answer on the Question Paper. Additional Materials: Ruler READ THESE INSTRUCTIONS FIRST Write your Centre number, candidate number and name on all the work you hand in. Write in dark blue or black pen. You may use a soft pencil for any diagrams, graphs or rough working. Do not use staples, paper clips, highlighters, glue or correction fluid. DO NOT WRITE IN ANY BARCODES. Answer all questions. At the end of the examination, fasten all your work securely together. The number of marks is given in brackets [ ] at the end of each question or part question. For Examiner’s Use 1 2 3 4 5 6 Total www.XtremePapers.com
Question paper, page 2
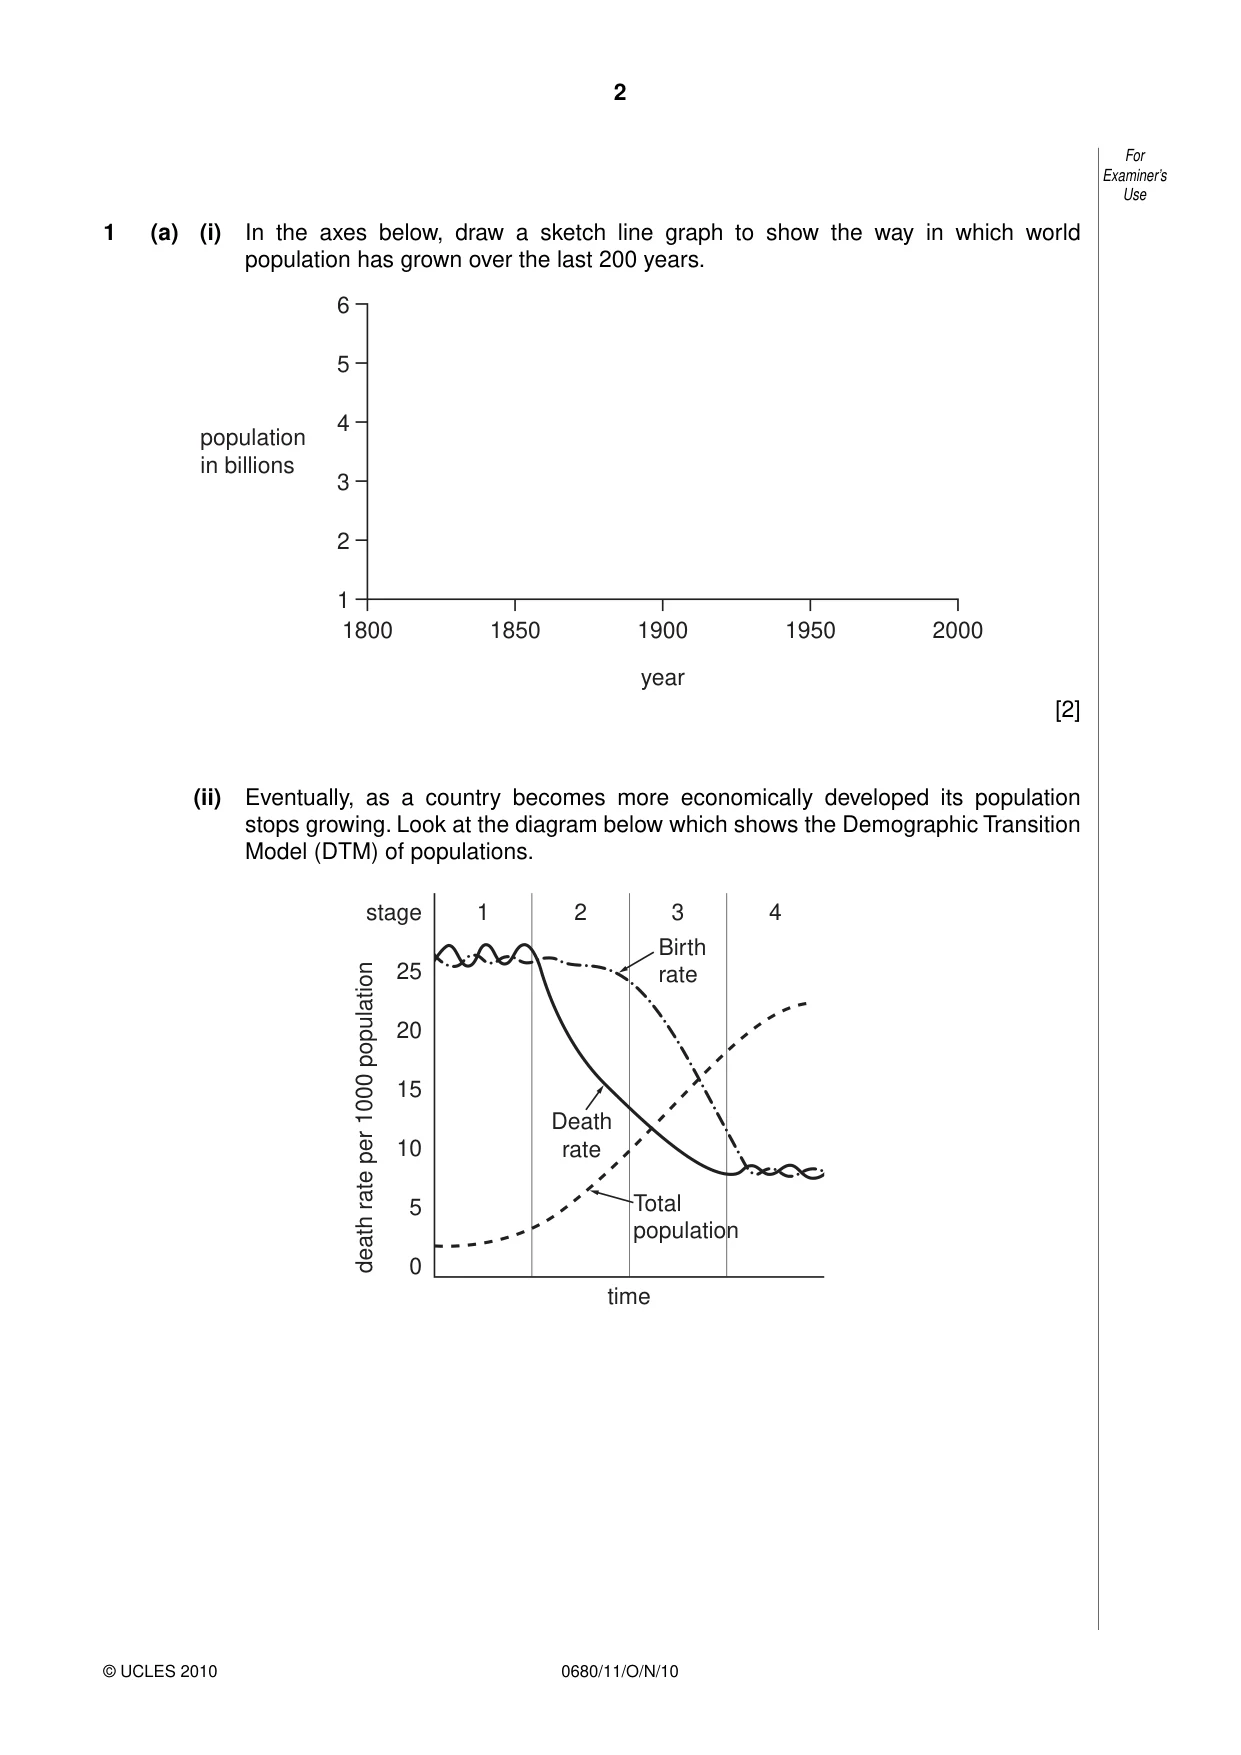
2 0680/11/O/N/10 © UCLES 2010 For Examiner’s Use 1 (a) (i) In the axes below, draw a sketch line graph to show the way in which world population has grown over the last 200 years. 6 5 4 3 2 1 1800 1850 1900 year 1950 2000 population in billions [2] (ii) Eventually, as a country becomes more economically developed its population stops growing. Look at the diagram below which shows the Demographic Transition Model (DTM) of populations. 0 5 10 15 20 Death rate time Birth rate Total population 25 stage 1 2 3 4 death rate per 1000 population
Question paper, page 3
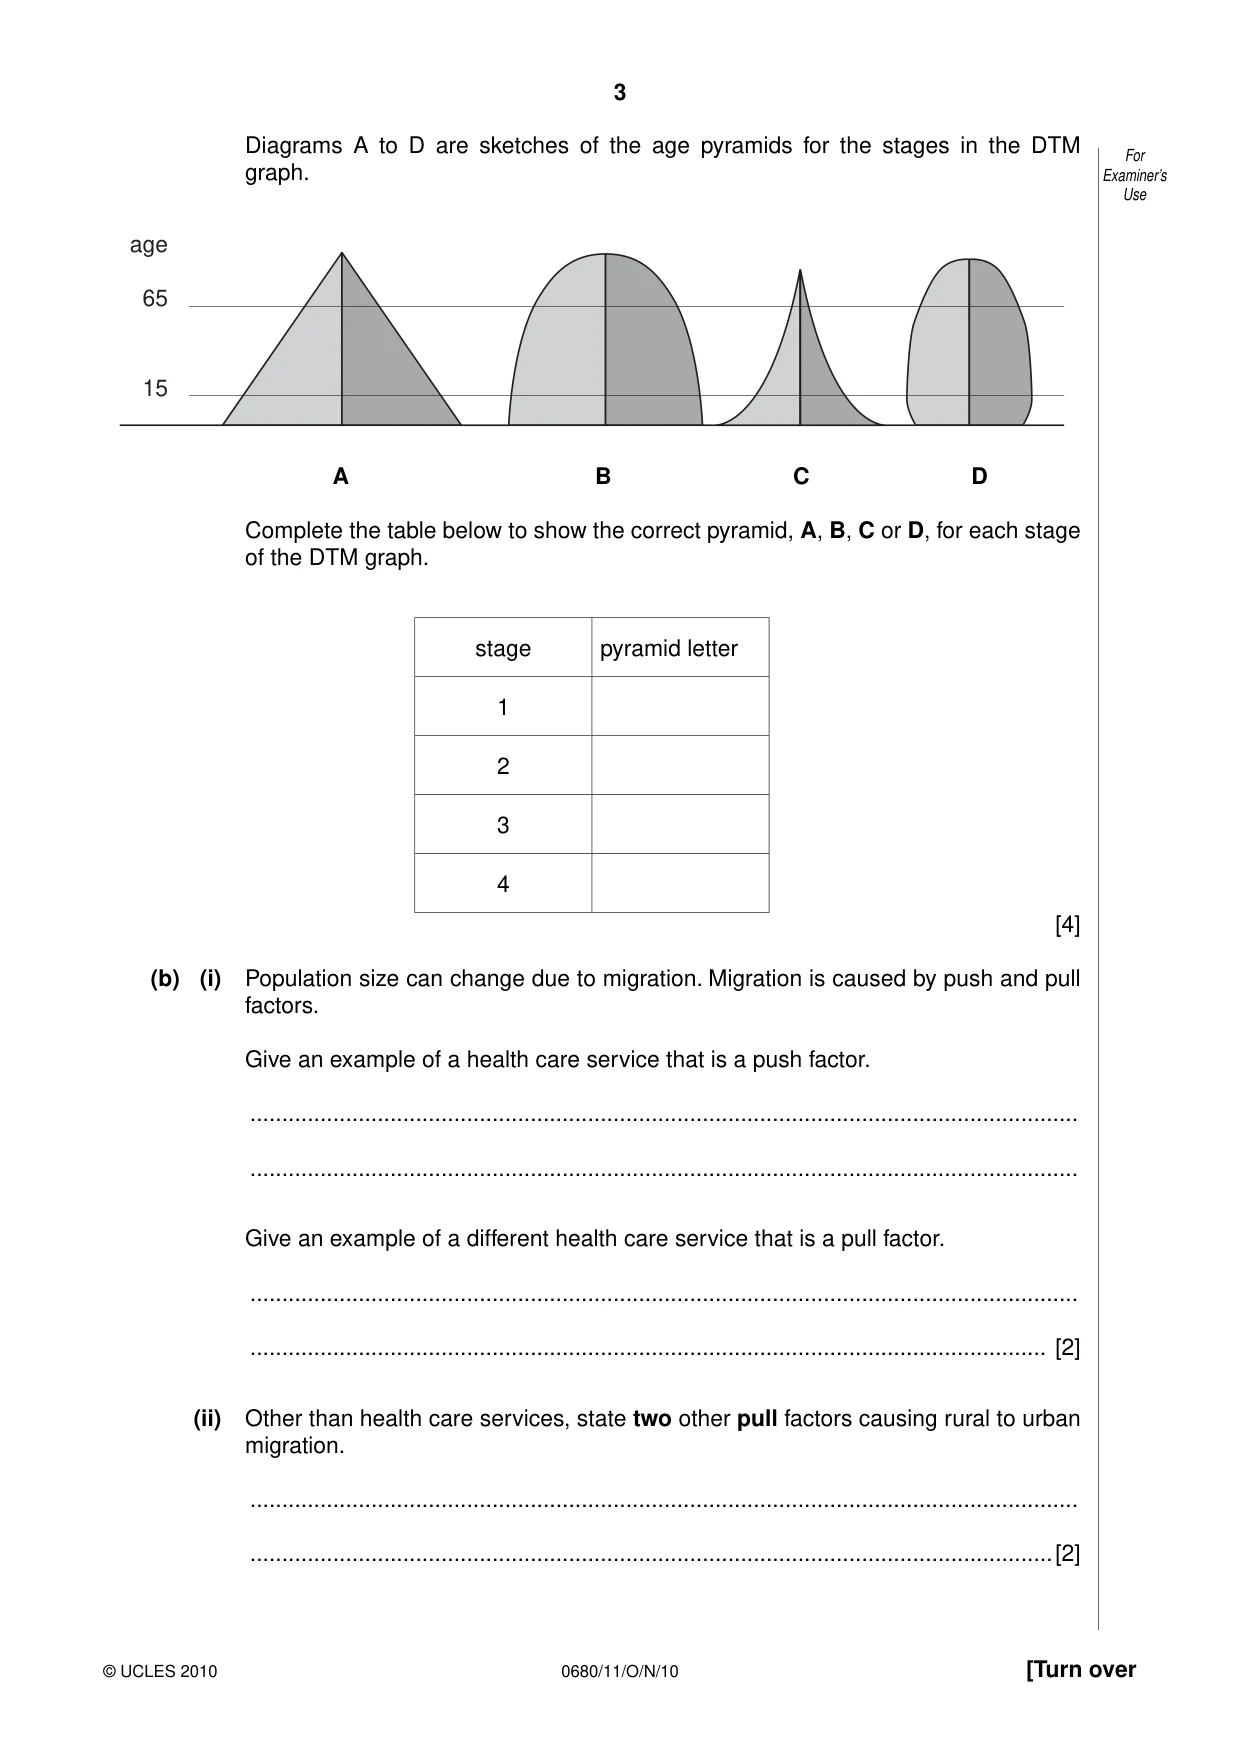
3 0680/11/O/N/10 © UCLES 2010 [Turn over For Examiner’s Use Diagrams A to D are sketches of the age pyramids for the stages in the DTM graph. 65 age 15 A B C D Complete the table below to show the correct pyramid, A, B, C or D, for each stage of the DTM graph. stage pyramid letter 1 2 3 4 [4] (b) (i) Population size can change due to migration. Migration is caused by push and pull factors. Give an example of a health care service that is a push factor. … … Give an example of a different health care service that is a pull factor. … … [2] (ii) Other than health care services, state two other pull factors causing rural to urban migration. … …[2]
Question paper, page 4
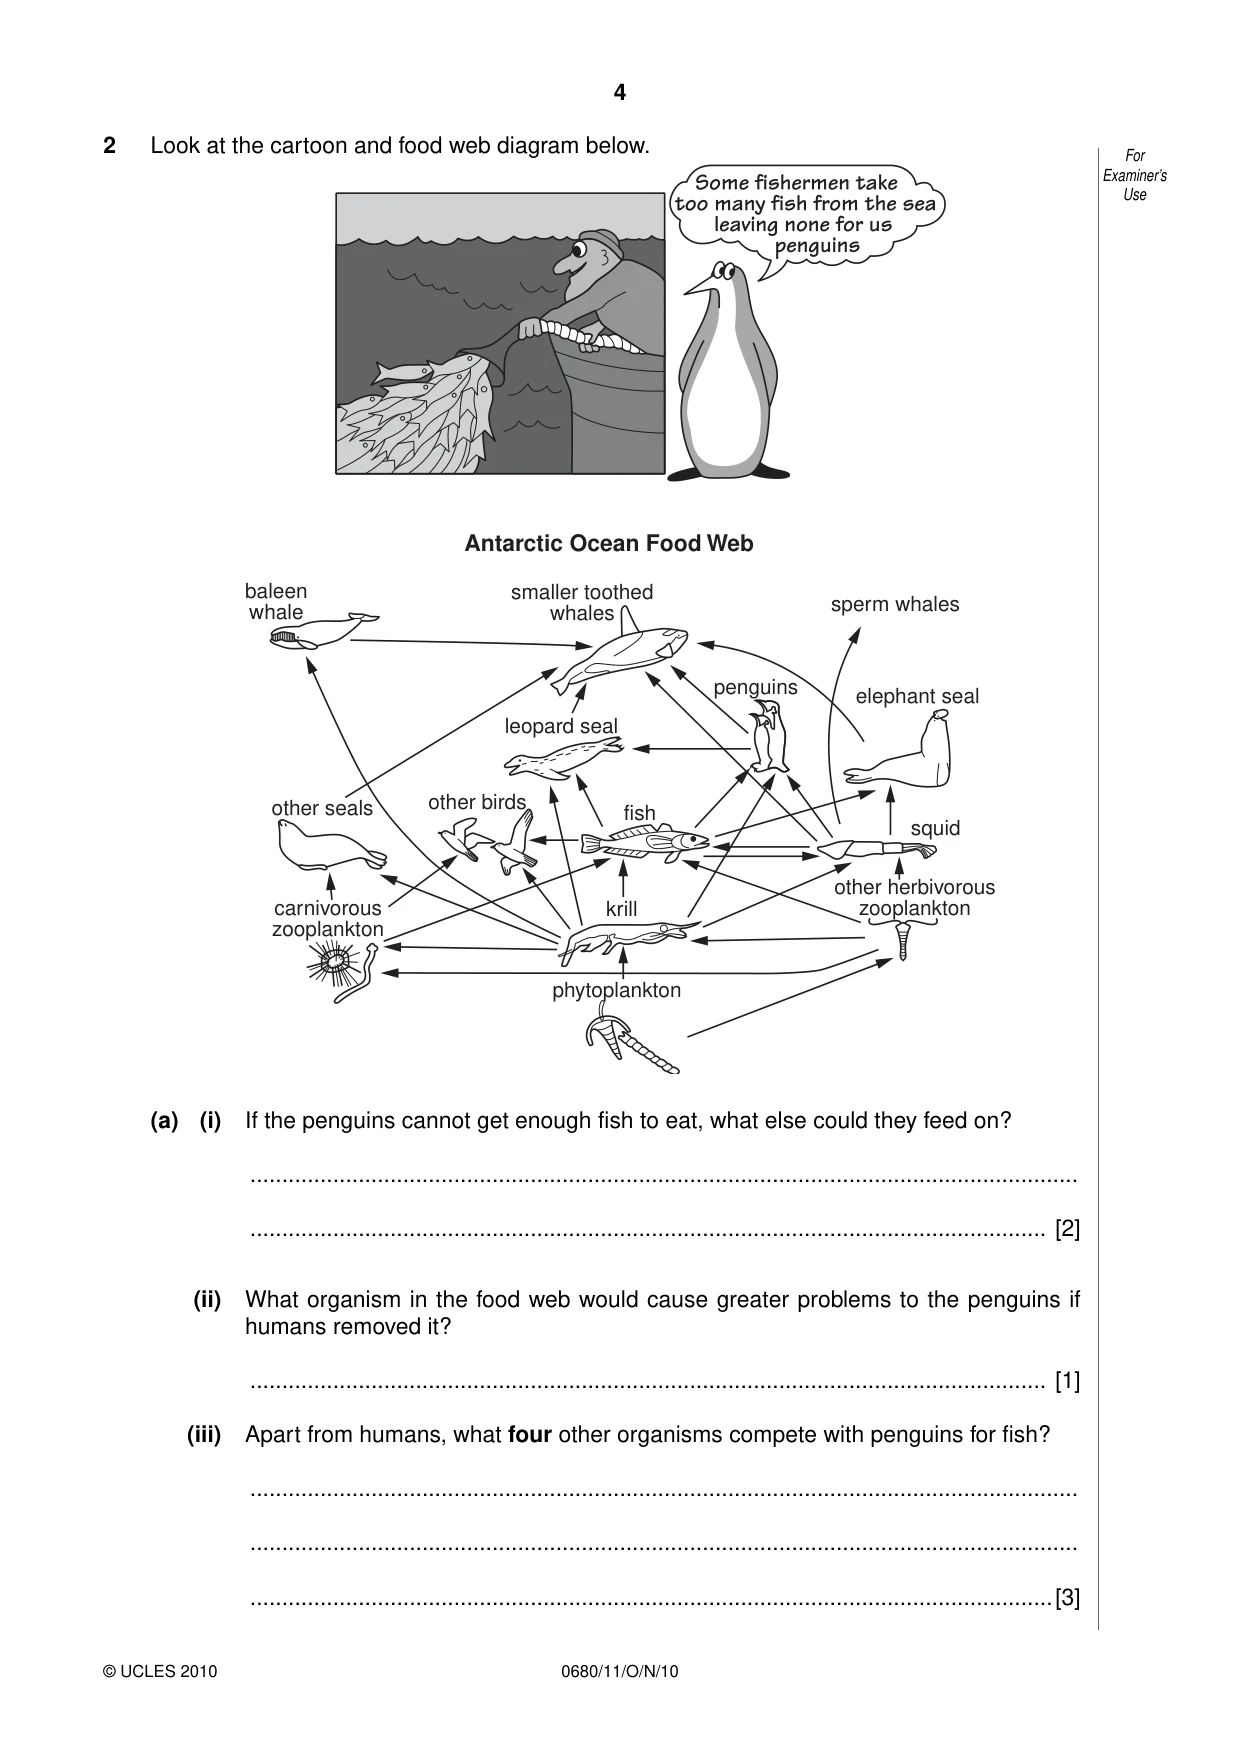
4 0680/11/O/N/10 © UCLES 2010 For Examiner’s Use 2 Look at the cartoon and food web diagram below. Antarctic Ocean Food Web smaller toothed whales baleen whale penguins leopard seal fish other herbivorous zooplankton squid elephant seal sperm whales other birds krill phytoplankton carnivorous zooplankton other seals (a) (i) If the penguins cannot get enough fish to eat, what else could they feed on? … … [2] (ii) What organism in the food web would cause greater problems to the penguins if humans removed it? … [1] (iii) Apart from humans, what four other organisms compete with penguins for fish? … … …[3]
Question paper, page 5
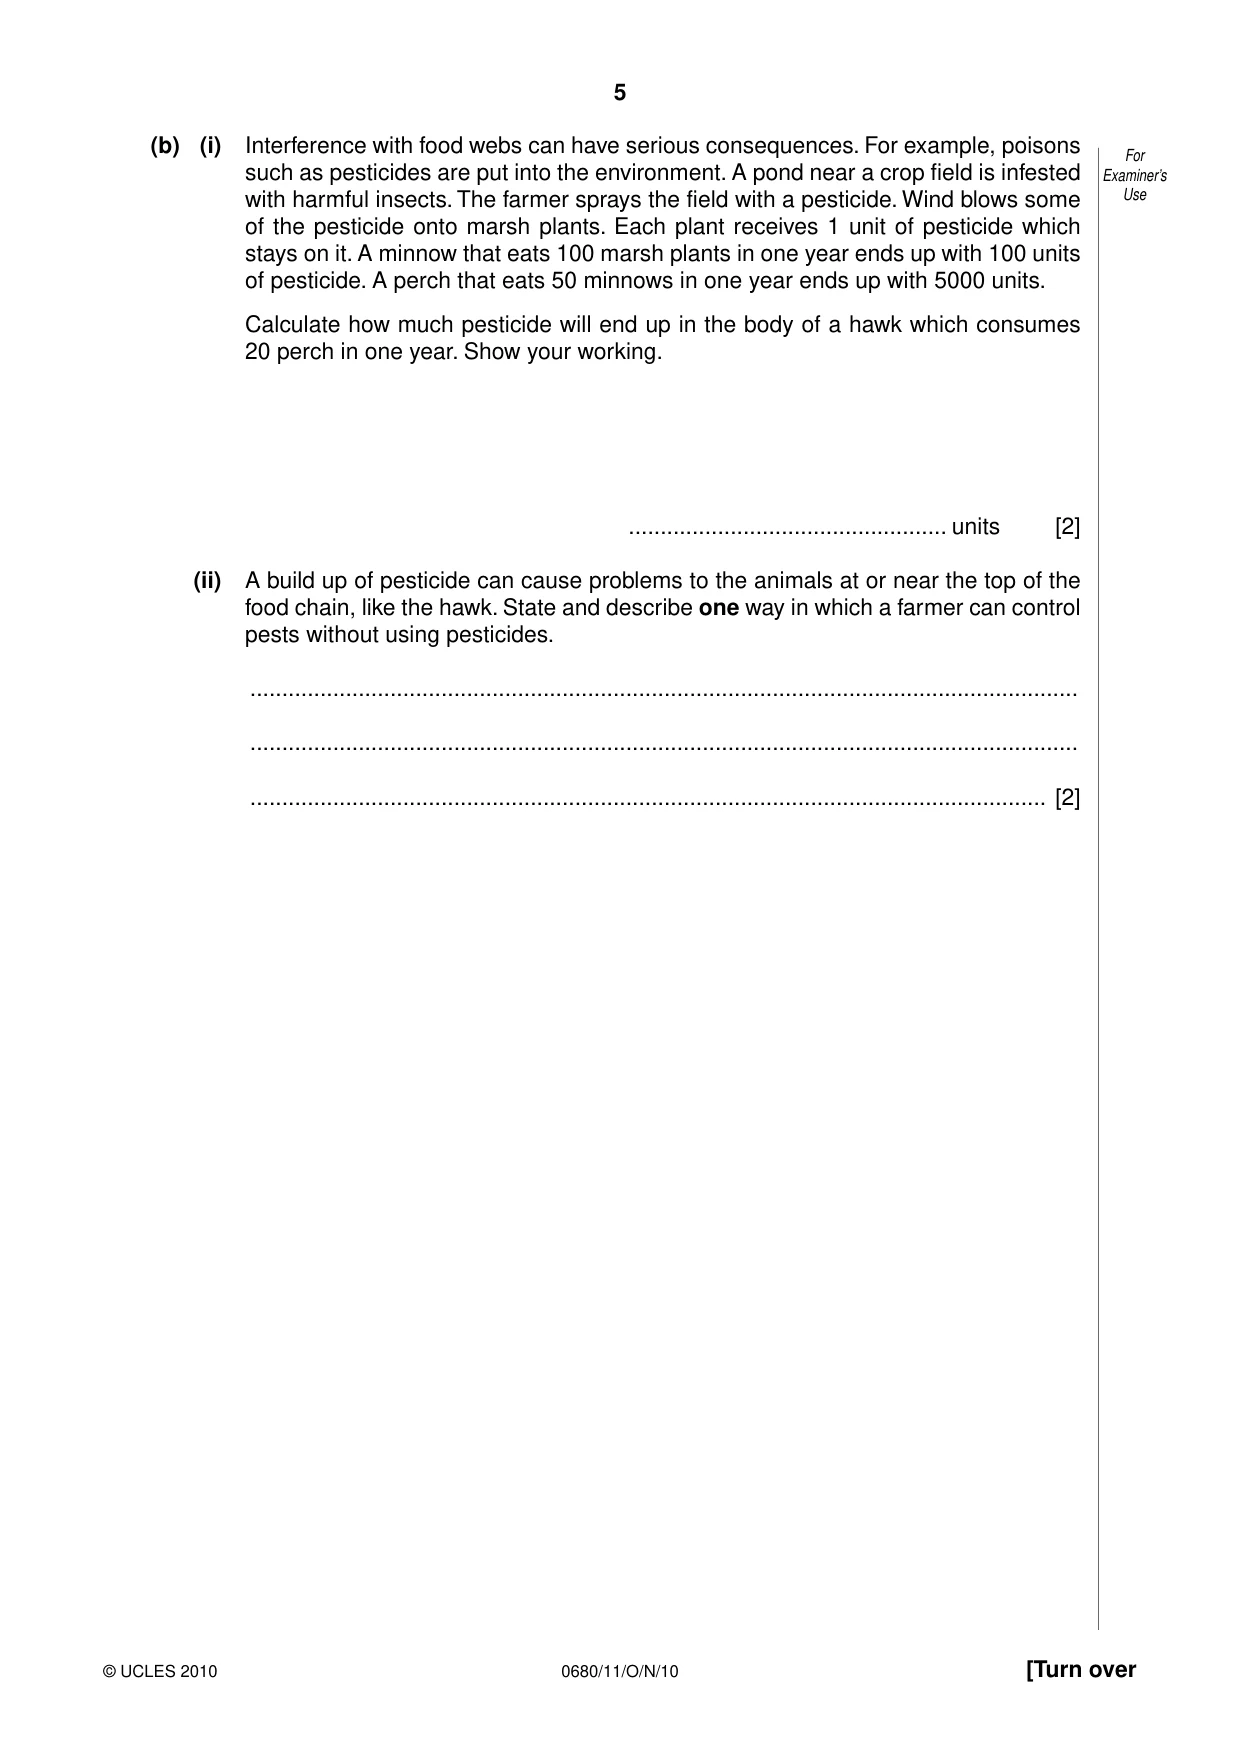
5 0680/11/O/N/10 © UCLES 2010 [Turn over For Examiner’s Use (b) (i) Interference with food webs can have serious consequences. For example, poisons such as pesticides are put into the environment. A pond near a crop field is infested with harmful insects. The farmer sprays the field with a pesticide. Wind blows some of the pesticide onto marsh plants. Each plant receives 1 unit of pesticide which stays on it. A minnow that eats 100 marsh plants in one year ends up with 100 units of pesticide. A perch that eats 50 minnows in one year ends up with 5000 units. Calculate how much pesticide will end up in the body of a hawk which consumes 20 perch in one year. Show your working. … units [2] (ii) A build up of pesticide can cause problems to the animals at or near the top of the food chain, like the hawk. State and describe one way in which a farmer can control pests without using pesticides. … … … [2]
Question paper, page 6
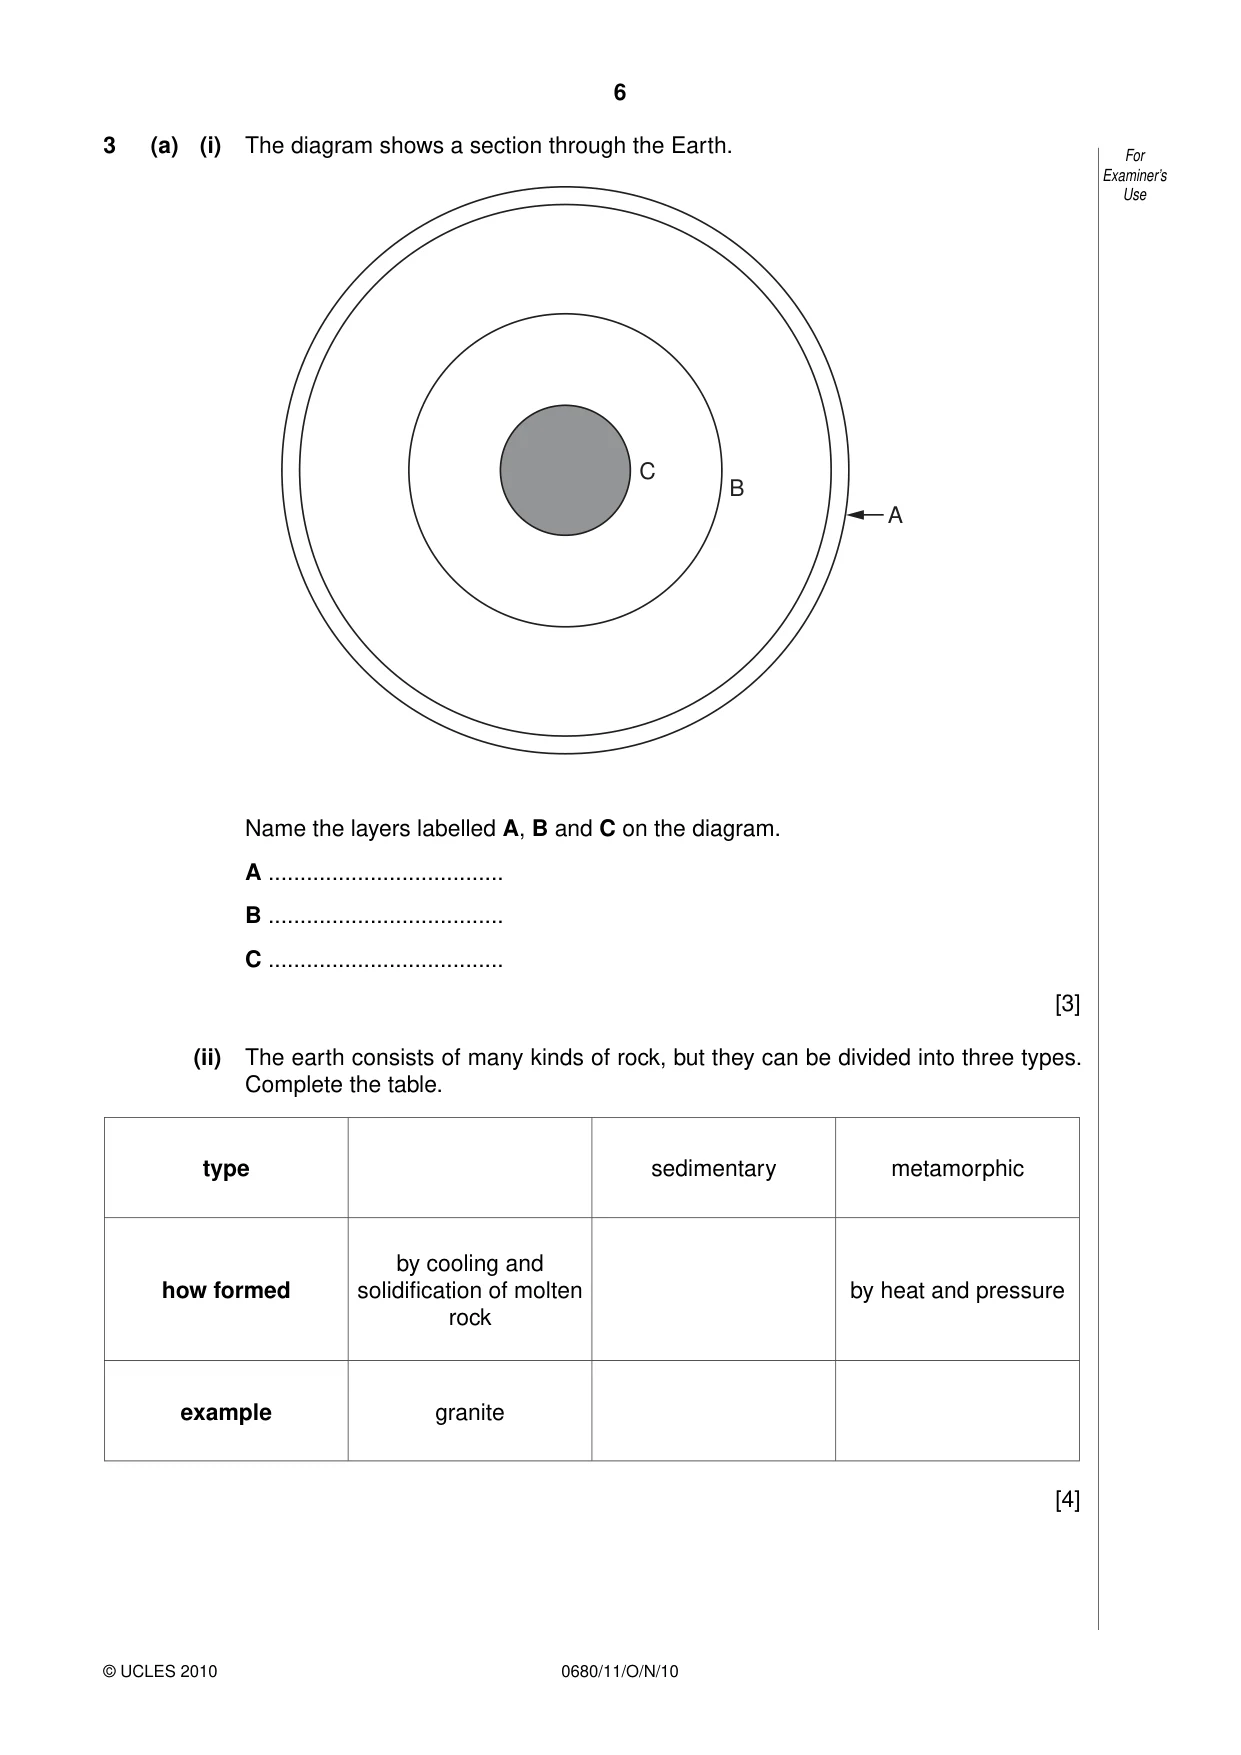
6 0680/11/O/N/10 © UCLES 2010 For Examiner’s Use 3 (a) (i) The diagram shows a section through the Earth. C B A Name the layers labelled A, B and C on the diagram. A … B … C … [3] (ii) The earth consists of many kinds of rock, but they can be divided into three types. Complete the table. type sedimentary metamorphic how formed by cooling and solidification of molten rock by heat and pressure example granite [4]
Question paper, page 7
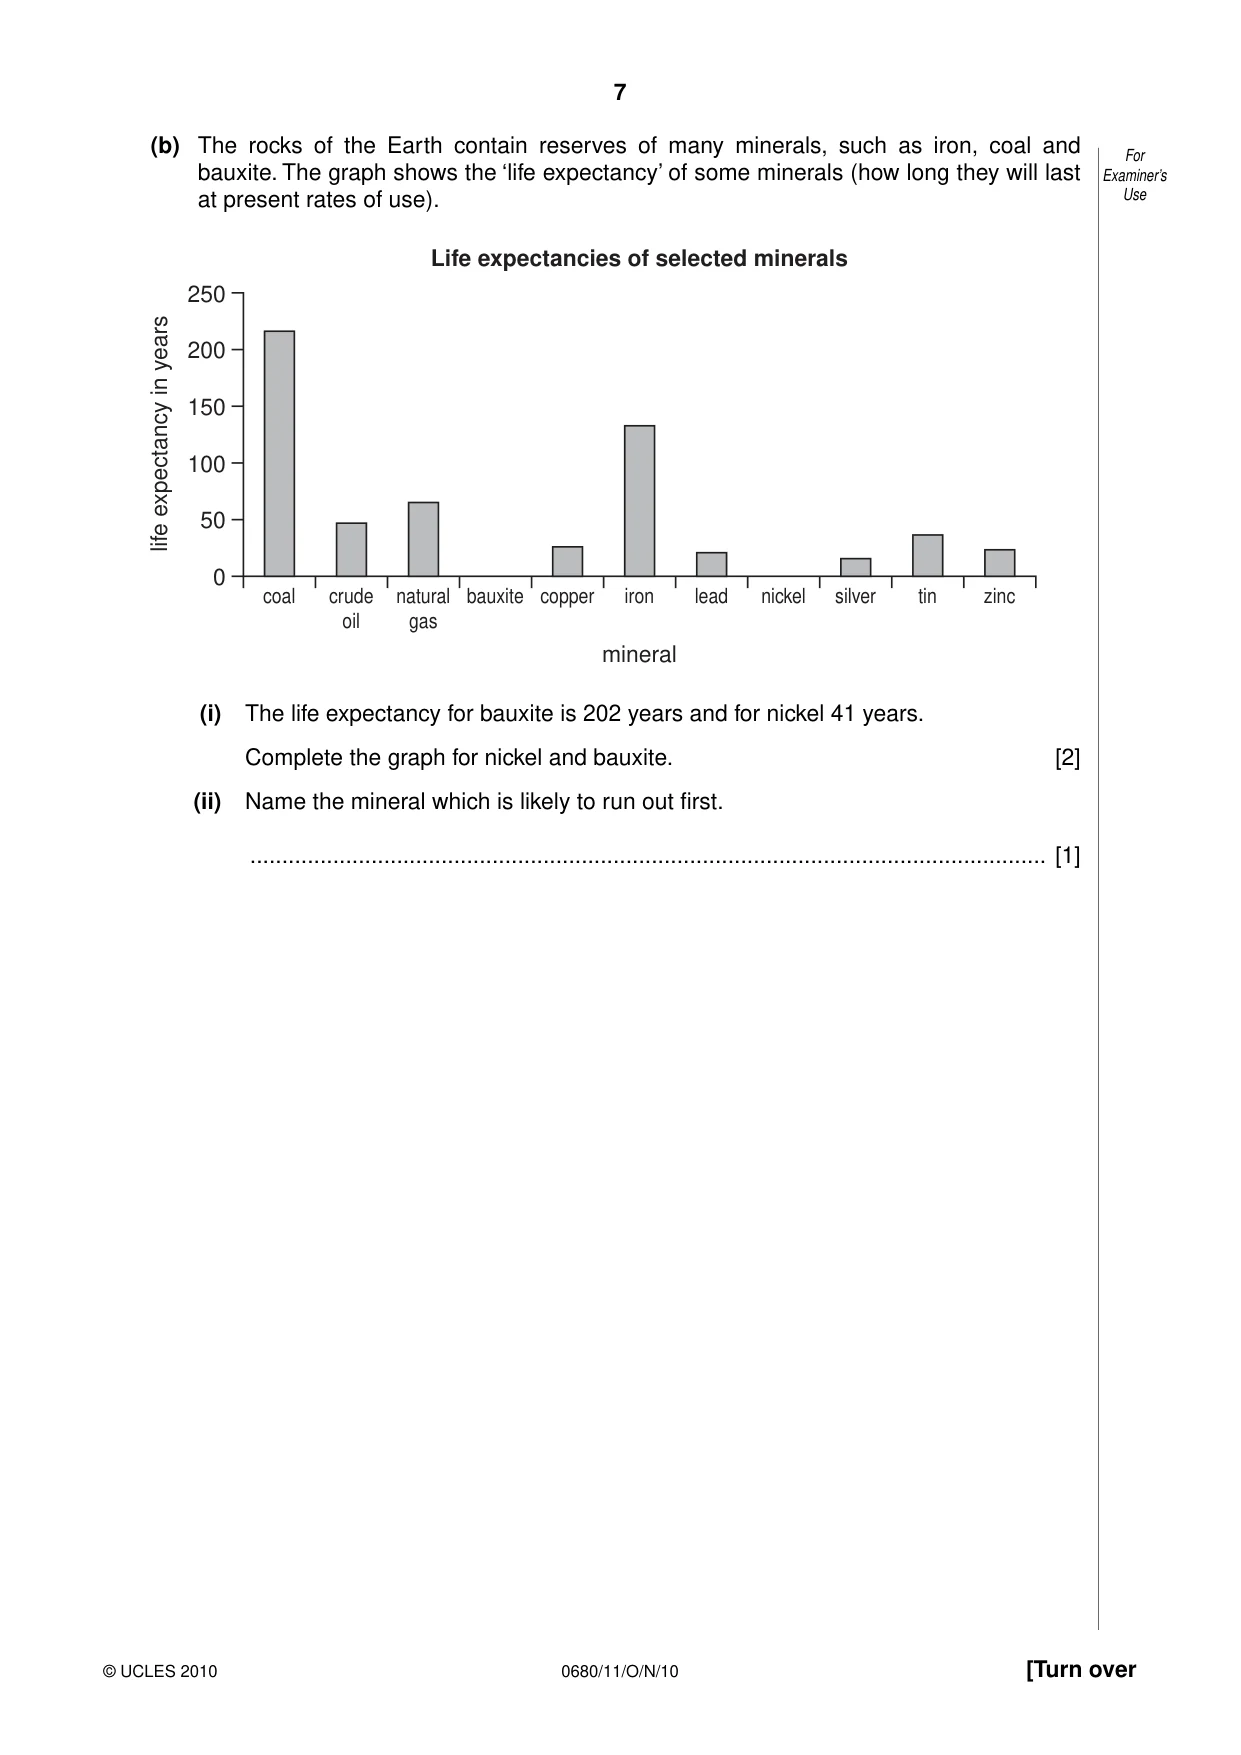
7 0680/11/O/N/10 © UCLES 2010 [Turn over For Examiner’s Use (b) The rocks of the Earth contain reserves of many minerals, such as iron, coal and bauxite. The graph shows the ‘life expectancy’ of some minerals (how long they will last at present rates of use). 250 200 150 life expectancy in years 100 50 0 coal crude oil natural gas bauxite copper iron mineral Life expectancies of selected minerals lead nickel silver tin zinc (i) The life expectancy for bauxite is 202 years and for nickel 41 years. Complete the graph for nickel and bauxite. [2] (ii) Name the mineral which is likely to run out first. … [1]
Question paper, page 8
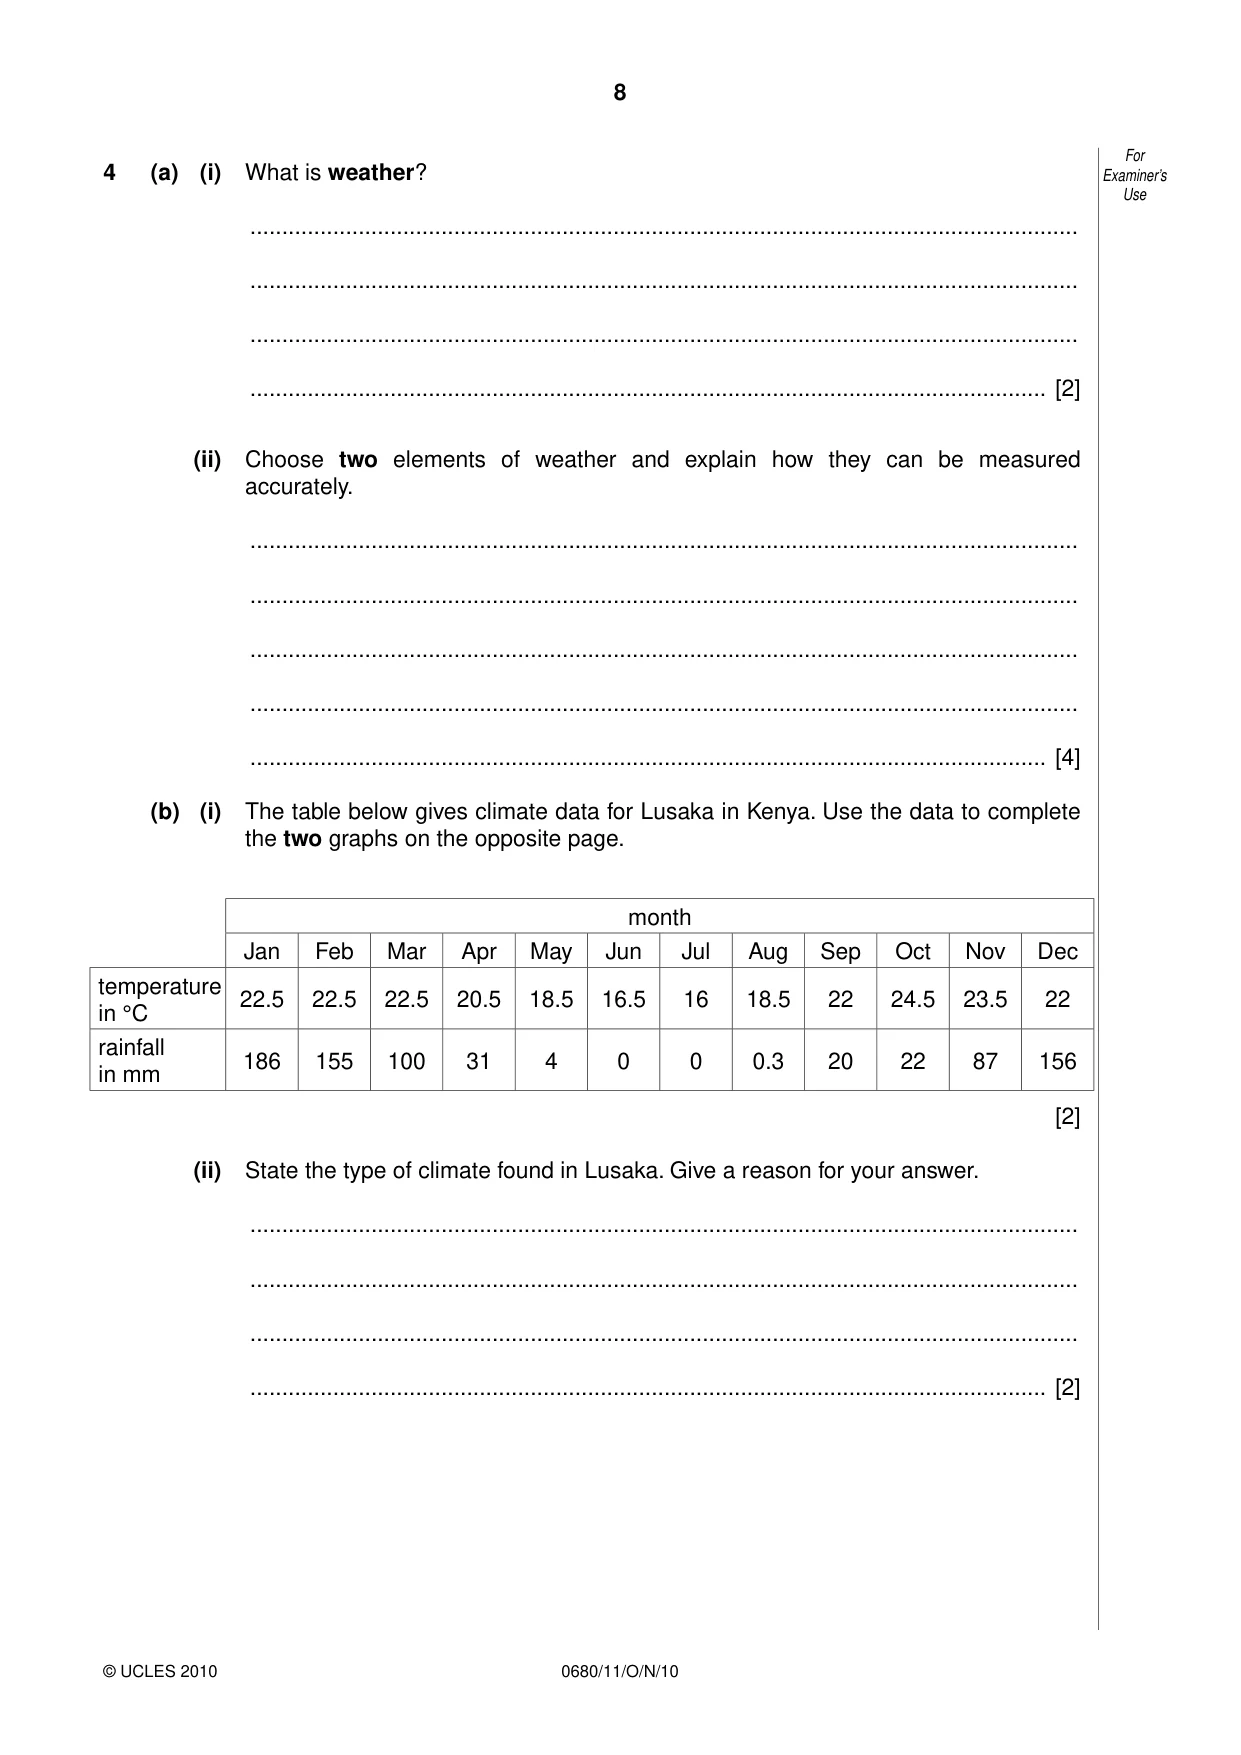
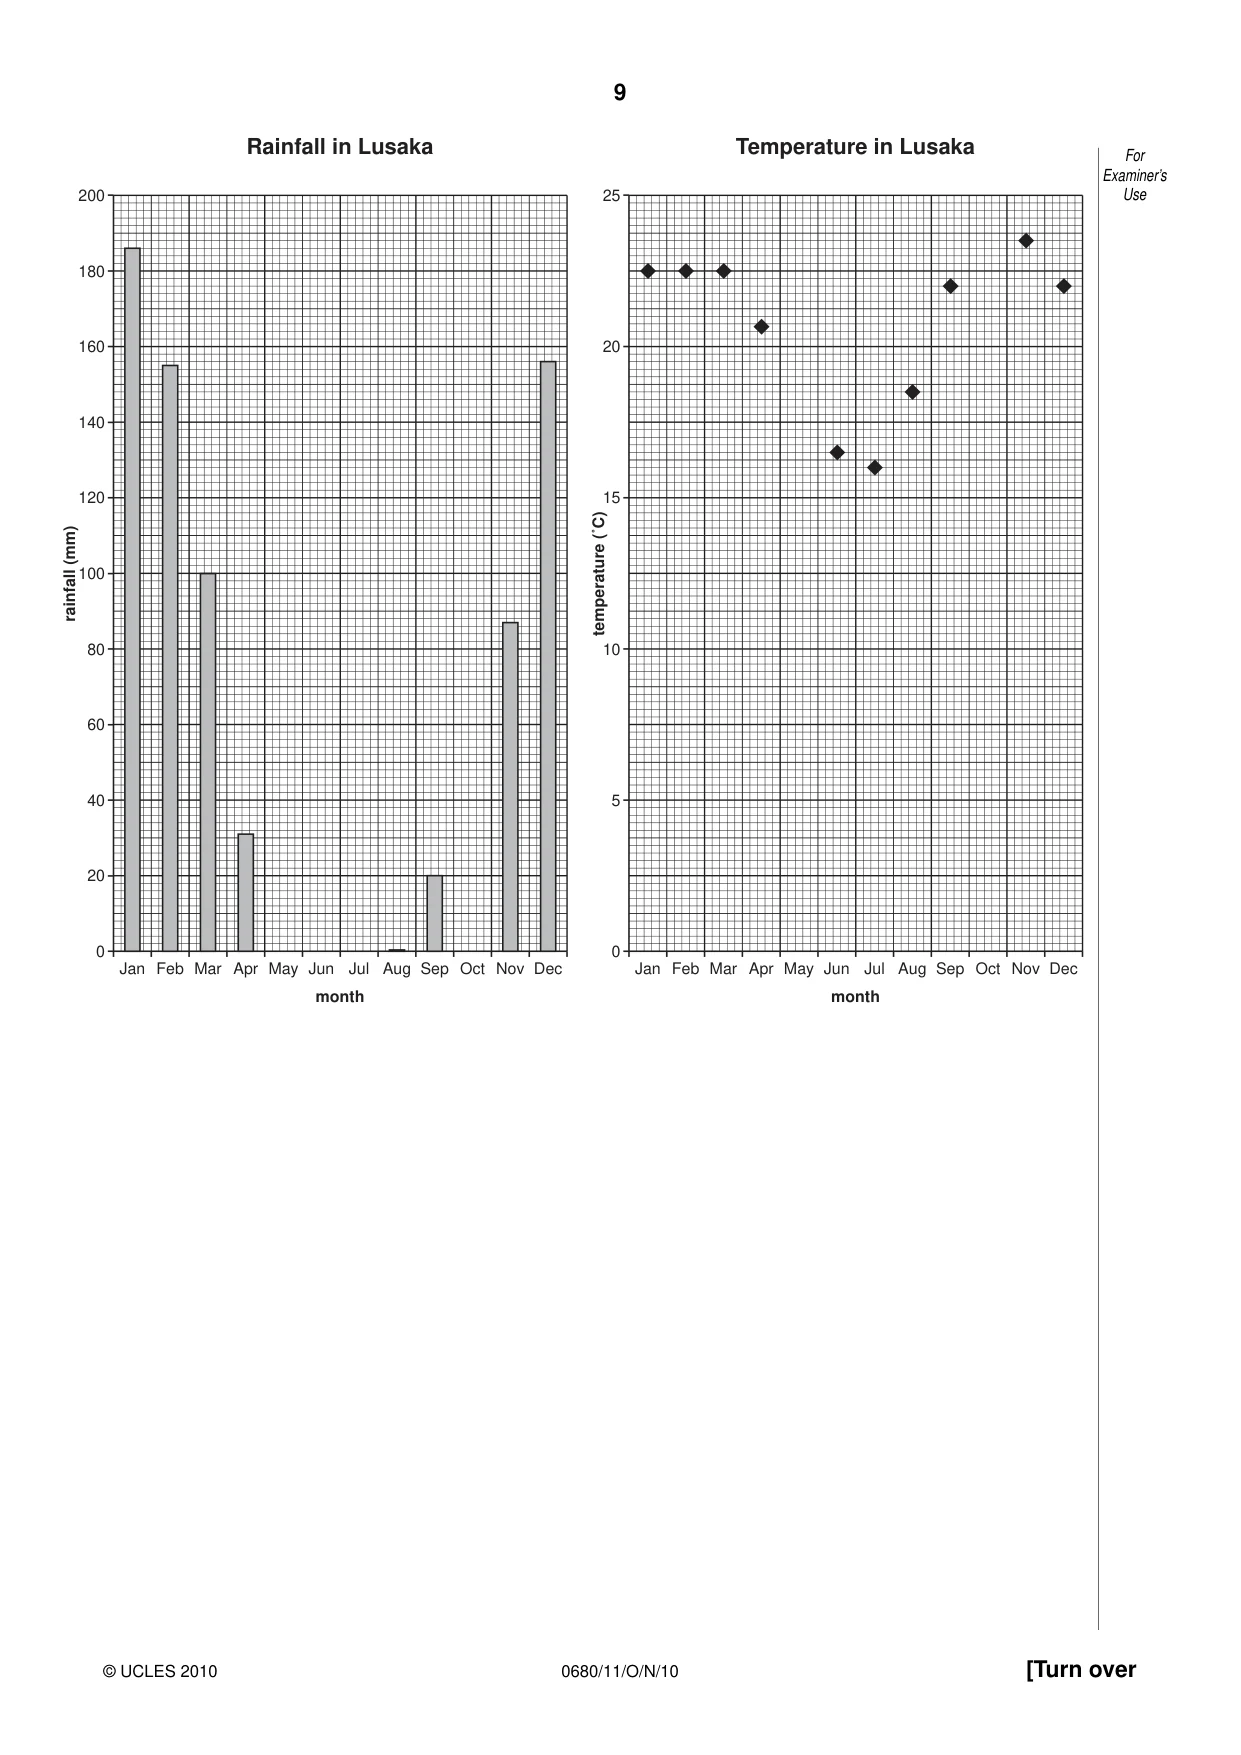
8 0680/11/O/N/10 © UCLES 2010 For Examiner’s Use 4 (a) (i) What is weather? … … … … [2] (ii) Choose two elements of weather and explain how they can be measured accurately. … … … … … [4] (b) (i) The table below gives climate data for Lusaka in Kenya. Use the data to complete the two graphs on the opposite page. month Jan Feb Mar Apr May Jun Jul Aug Sep Oct Nov Dec temperature in °C 22.5 22.5 22.5 20.5 18.5 16.5 16 18.5 22 24.5 23.5 22 rainfall in mm 186 155 100 31 4 0 0 0.3 20 22 87 156 [2] (ii) State the type of climate found in Lusaka. Give a reason for your answer. … … … … [2]
Question paper, page 9
9 0680/11/O/N/10 © UCLES 2010 [Turn over For Examiner’s Use Jan 0 20 40 60 80 100 rainfall (mm) 120 140 160 180 200 Feb Mar Apr May Jun Jul month Aug Sep Oct Nov Dec Jan 0 5 10 temperature (˚C) 15 20 25 Feb Mar Apr May Jun Jul month Rainfall in Lusaka Temperature in Lusaka Aug Sep Oct Nov Dec
Question paper, page 10
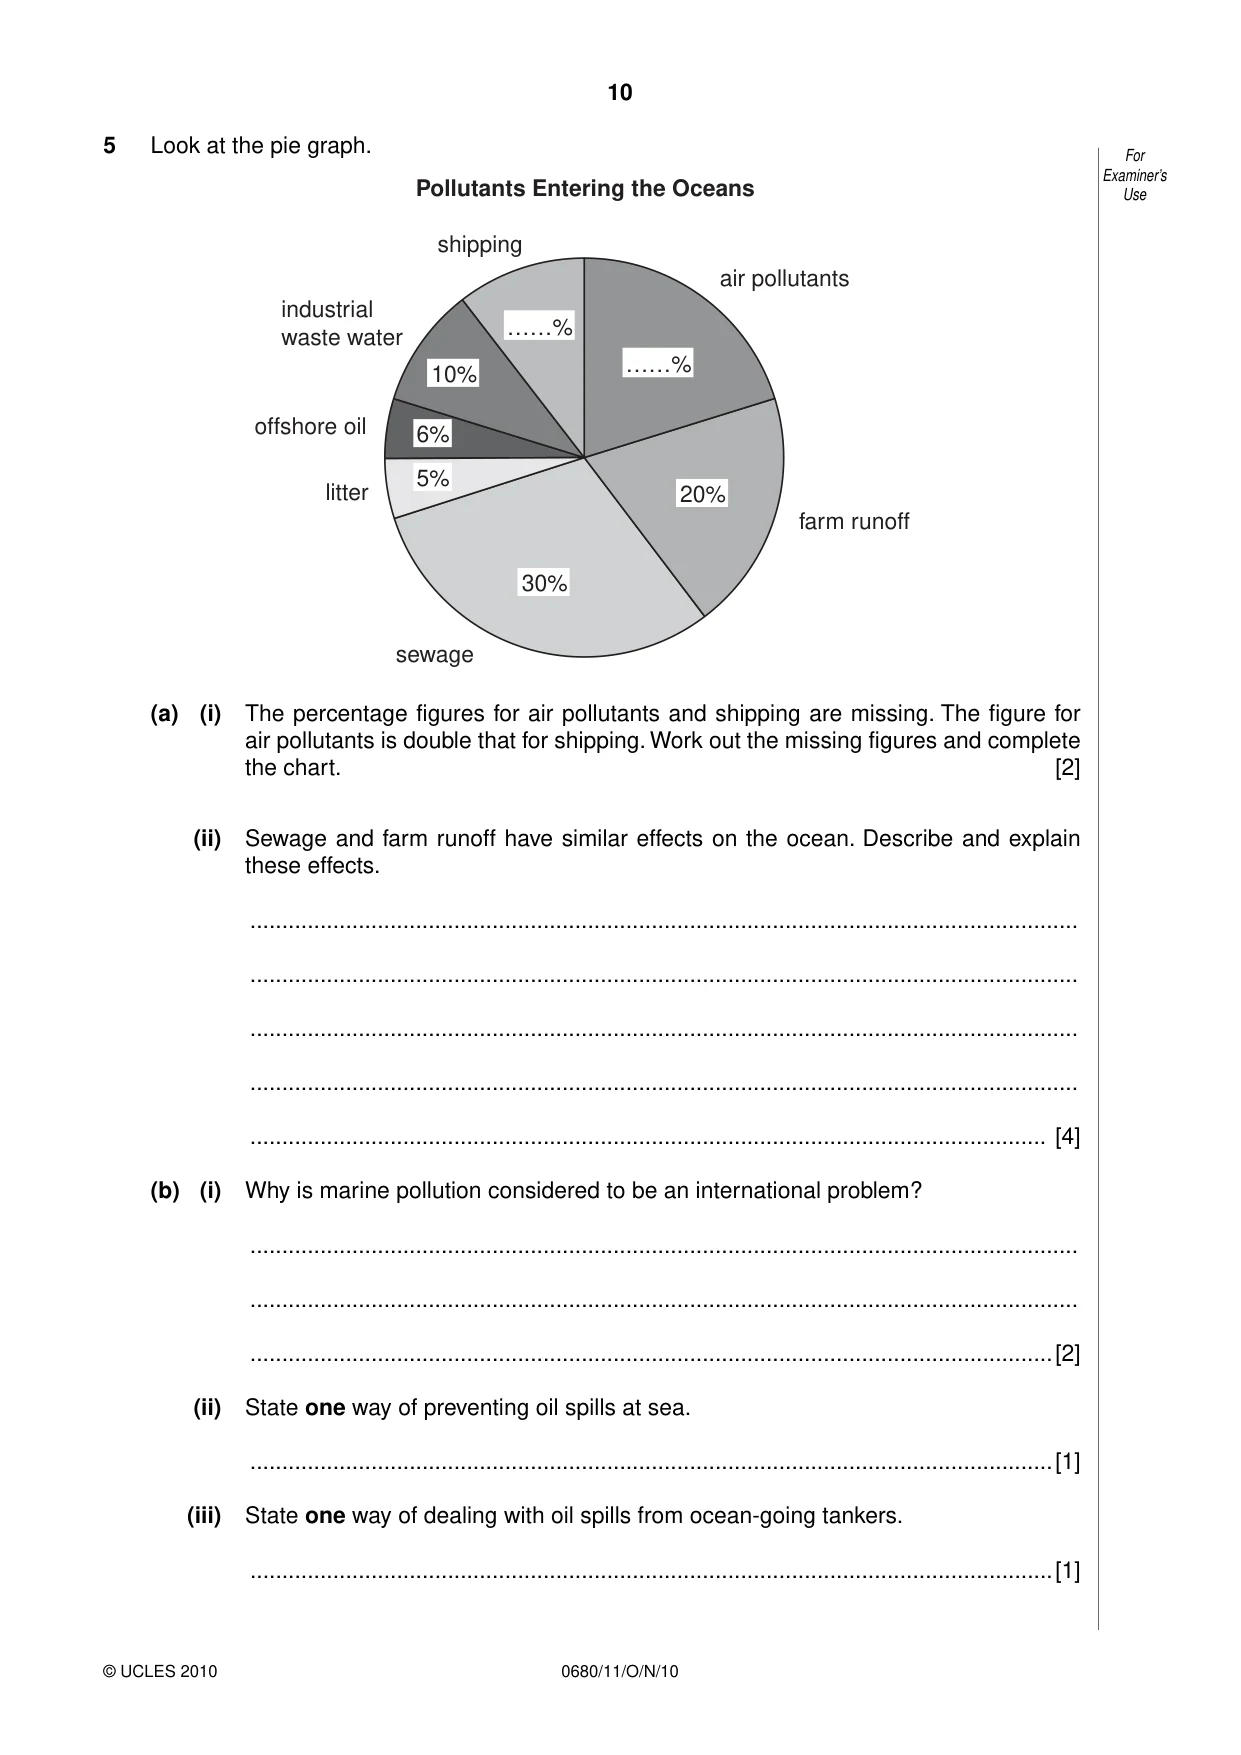
10 0680/11/O/N/10 © UCLES 2010 For Examiner’s Use 5 Look at the pie graph. Pollutants Entering the Oceans air pollutants farm runoff sewage litter offshore oil industrial waste water shipping 20% ……% ……% 30% 5% 6% 10% (a) (i) The percentage figures for air pollutants and shipping are missing. The figure for air pollutants is double that for shipping. Work out the missing figures and complete the chart. [2] (ii) Sewage and farm runoff have similar effects on the ocean. Describe and explain these effects. … … … … … [4] (b) (i) Why is marine pollution considered to be an international problem? … … …[2] (ii) State one way of preventing oil spills at sea. …[1] (iii) State one way of dealing with oil spills from ocean-going tankers. …[1]
Question paper, page 11
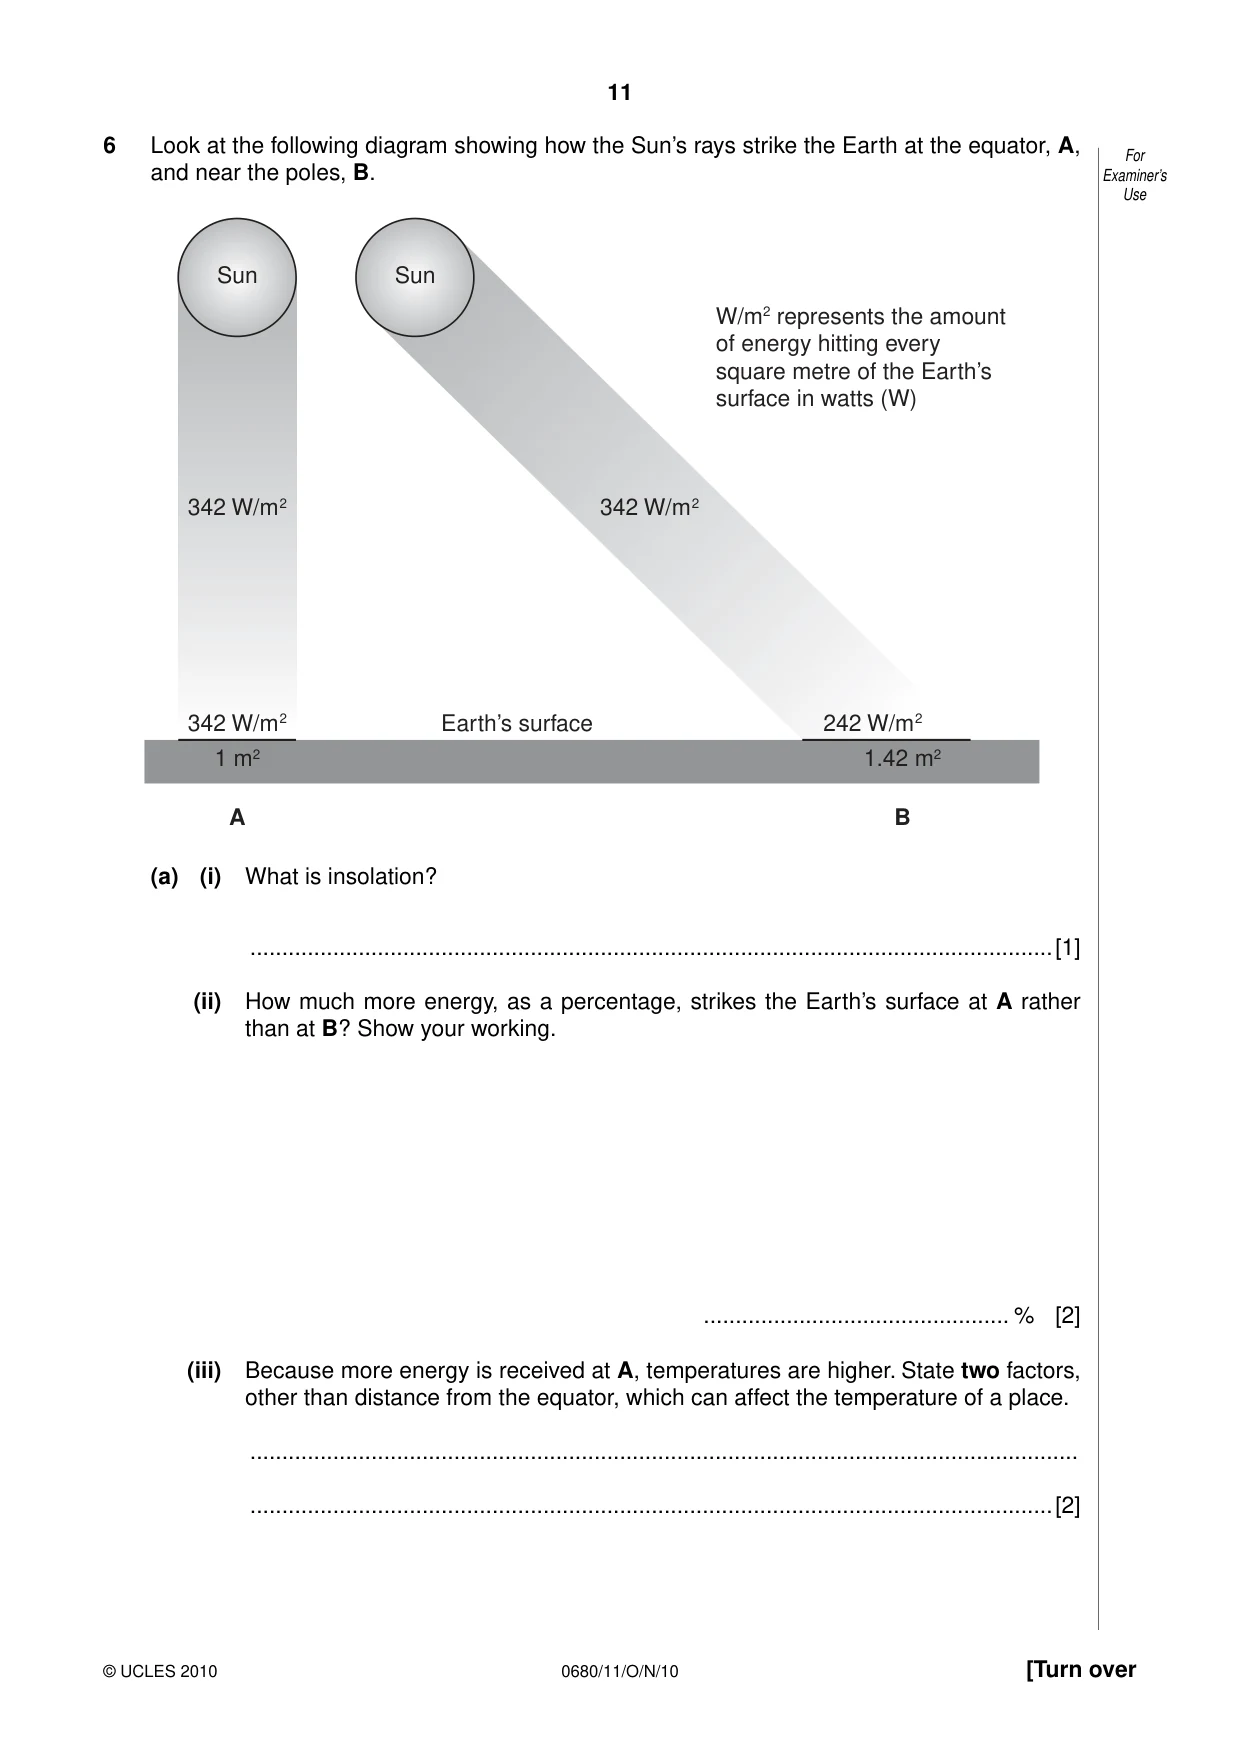
11 0680/11/O/N/10 © UCLES 2010 [Turn over For Examiner’s Use 6 Look at the following diagram showing how the Sun’s rays strike the Earth at the equator, A, and near the poles, B. Sun Sun 342 W/m2 342 W/m2 342 W/m2 242 W/m2 1 m2 1.42 m2 A B Earth’s surface W/m2 represents the amount of energy hitting every square metre of the Earth’s surface in watts (W) (a) (i) What is insolation? …[1] (ii) How much more energy, as a percentage, strikes the Earth’s surface at A rather than at B? Show your working. … % [2] (iii) Because more energy is received at A, temperatures are higher. State two factors, other than distance from the equator, which can affect the temperature of a place. … …[2]
Question paper, page 12
12 0680/11/O/N/10 © UCLES 2010 For Examiner’s Use Permission to reproduce items where third-party owned material protected by copyright is included has been sought and cleared where possible. Every reasonable effort has been made by the publisher (UCLES) to trace copyright holders, but if any items requiring clearance have unwittingly been included, the publisher will be pleased to make amends at the earliest possible opportunity. University of Cambridge International Examinations is part of the Cambridge Assessment Group. Cambridge Assessment is the brand name of University of Cambridge Local Examinations Syndicate (UCLES), which is itself a department of the University of Cambridge. (b) (i) Solar energy can be used as an alternative to fossil fuels. Why is it a good idea to find substitutes for fossil fuels such as coal and oil? … … … …[3] (ii) Apart from solar power, describe another source of energy that could be used as an alternative to fossil fuels. … …[2]
Mark scheme, page 1
UNIVERSITY OF CAMBRIDGE INTERNATIONAL EXAMINATIONS International General Certificate of Secondary Education MARK SCHEME for the October/November 2010 question paper for the guidance of teachers 0680 ENVIRONMENTAL MANAGEMENT 0680/11 Paper 1, maximum raw mark 60 This mark scheme is published as an aid to teachers and candidates, to indicate the requirements of the examination. It shows the basis on which Examiners were instructed to award marks. It does not indicate the details of the discussions that took place at an Examiners’ meeting before marking began, which would have considered the acceptability of alternative answers. Mark schemes must be read in conjunction with the question papers and the report on the examination. • CIE will not enter into discussions or correspondence in connection with these mark schemes. CIE is publishing the mark schemes for the October/November 2010 question papers for most IGCSE, GCE Advanced Level and Advanced Subsidiary Level syllabuses and some Ordinary Level syllabuses. www.XtremePapers.com
Mark scheme, page 2
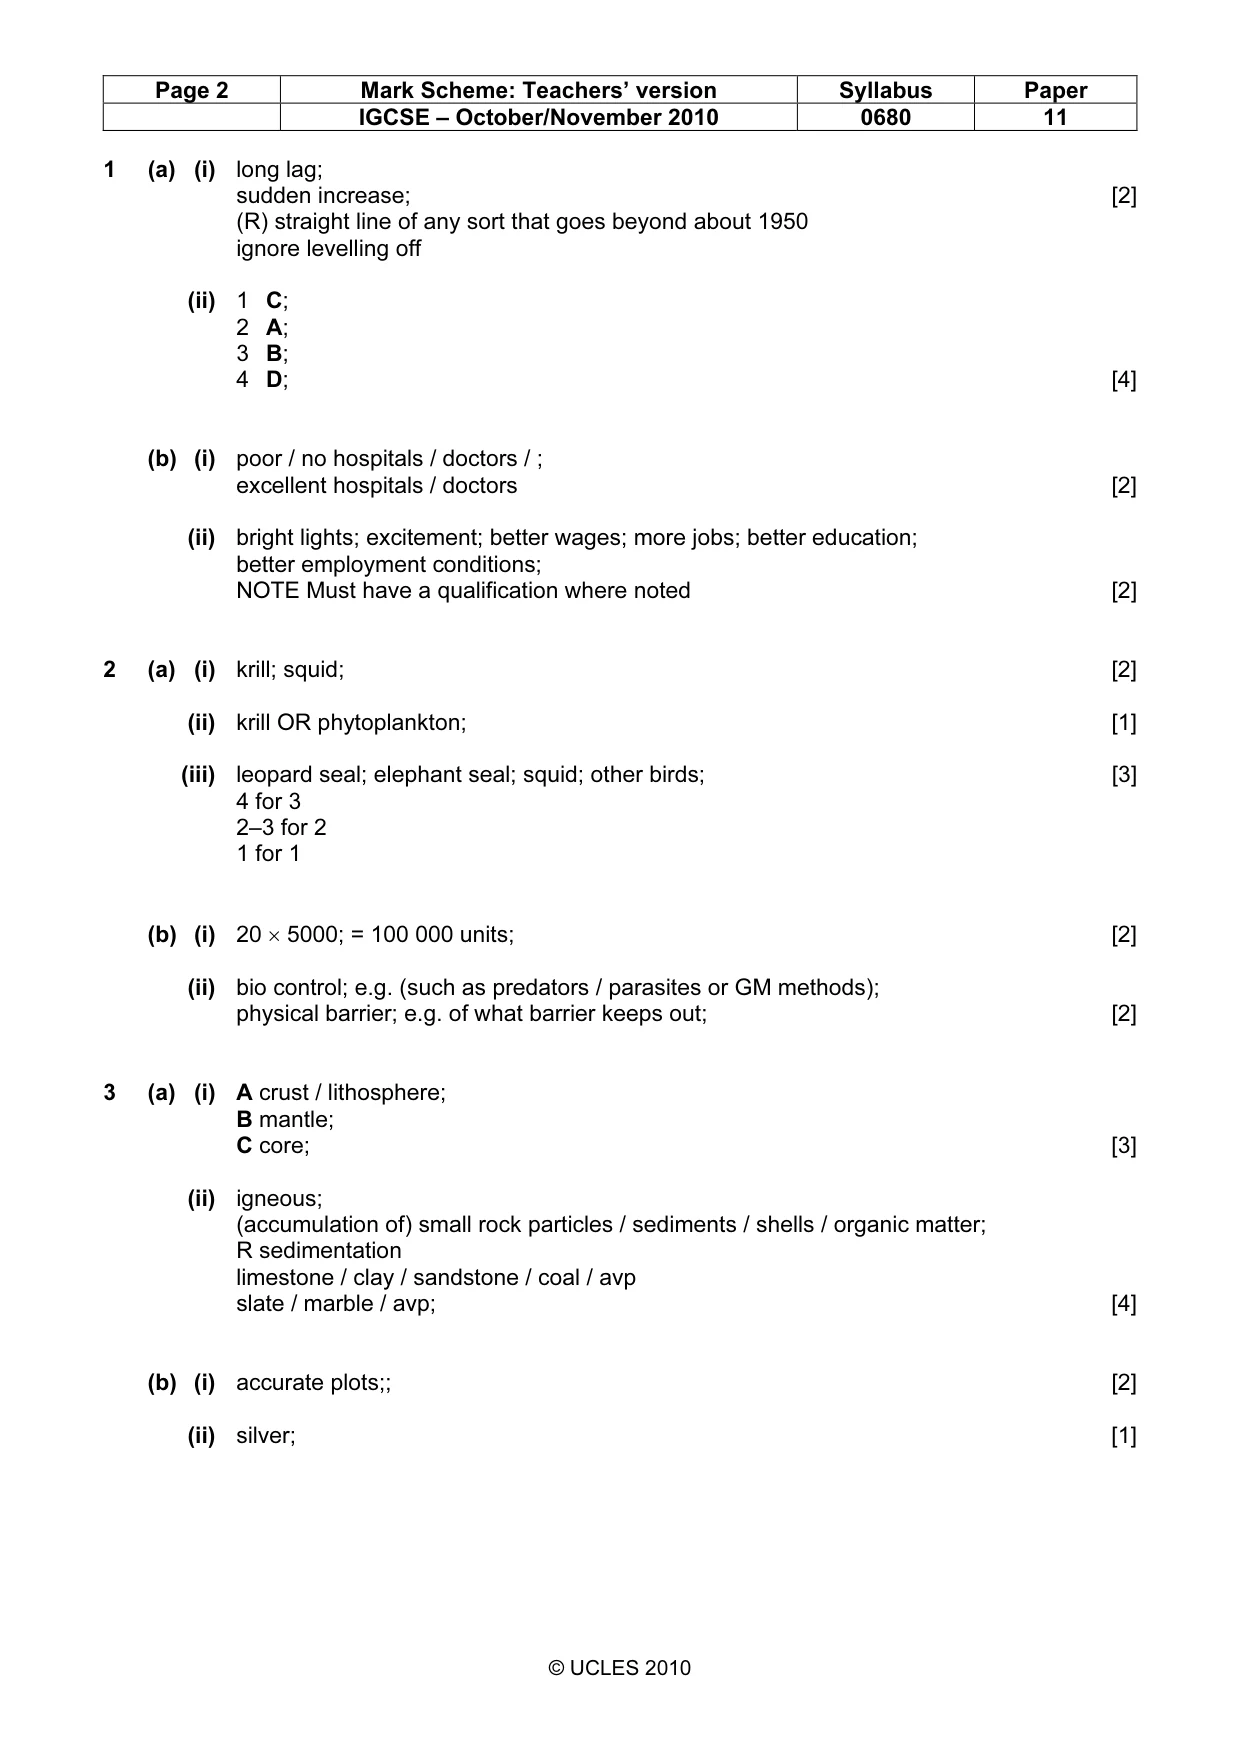
Page 2 Mark Scheme: Teachers’ version Syllabus Paper IGCSE – October/November 2010 0680 11 © UCLES 2010 1 (a) (i) long lag; sudden increase; [2] (R) straight line of any sort that goes beyond about 1950 ignore levelling off (ii) 1 C; 2 A; 3 B; 4 D; [4] (b) (i) poor / no hospitals / doctors / ; excellent hospitals / doctors [2] (ii) bright lights; excitement; better wages; more jobs; better education; better employment conditions; NOTE Must have a qualification where noted [2] 2 (a) (i) krill; squid; [2] (ii) krill OR phytoplankton; [1] (iii) leopard seal; elephant seal; squid; other birds; [3] 4 for 3 2–3 for 2 1 for 1 (b) (i) 20 × 5000; = 100 000 units; [2] (ii) bio control; e.g. (such as predators / parasites or GM methods); physical barrier; e.g. of what barrier keeps out; [2] 3 (a) (i) A crust / lithosphere; B mantle; C core; [3] (ii) igneous; (accumulation of) small rock particles / sediments / shells / organic matter; R sedimentation limestone / clay / sandstone / coal / avp slate / marble / avp; [4] (b) (i) accurate plots;; [2] (ii) silver; [1]
Mark scheme, page 3
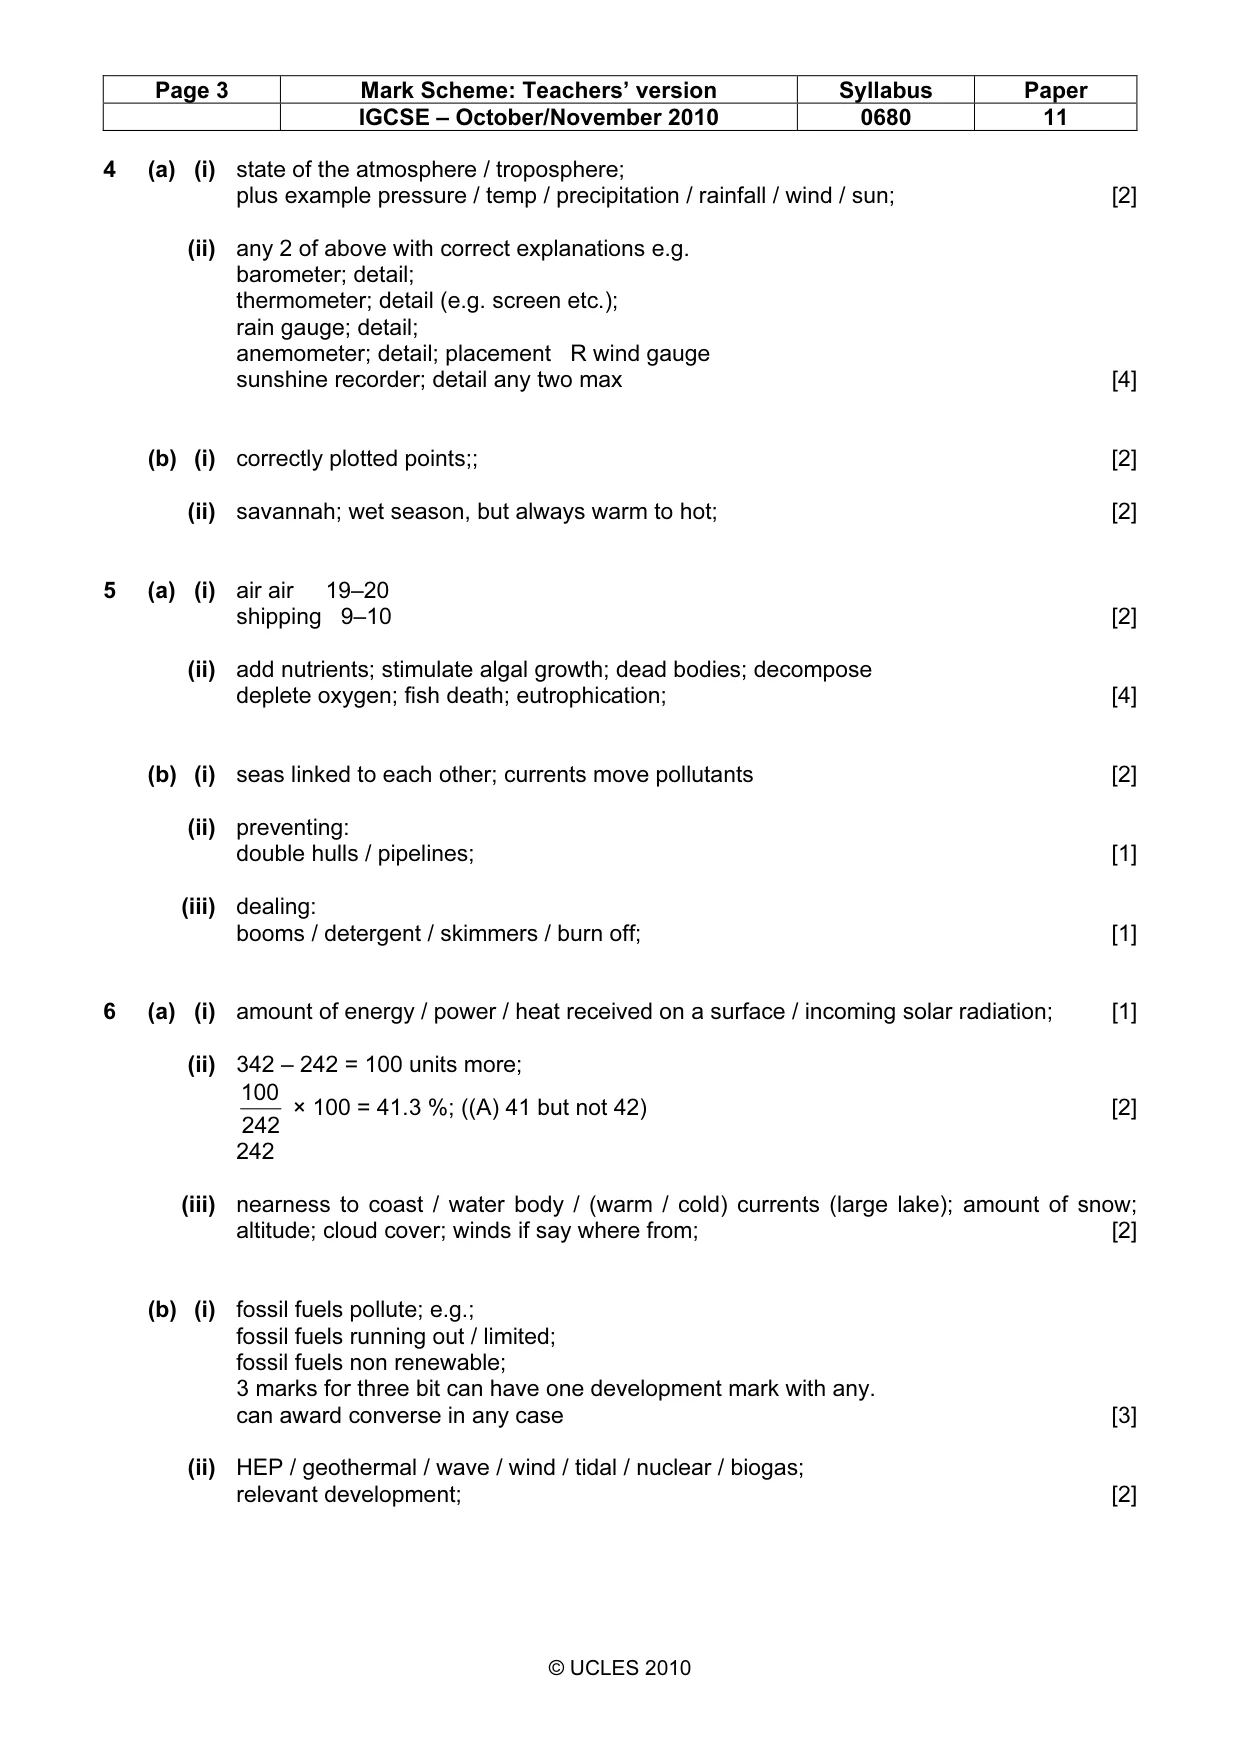
Page 3 Mark Scheme: Teachers’ version Syllabus Paper IGCSE – October/November 2010 0680 11 © UCLES 2010 4 (a) (i) state of the atmosphere / troposphere; plus example pressure / temp / precipitation / rainfall / wind / sun; [2] (ii) any 2 of above with correct explanations e.g. barometer; detail; thermometer; detail (e.g. screen etc.); rain gauge; detail; anemometer; detail; placement R wind gauge sunshine recorder; detail any two max [4] (b) (i) correctly plotted points;; [2] (ii) savannah; wet season, but always warm to hot; [2] 5 (a) (i) air air 19–20 shipping 9–10 [2] (ii) add nutrients; stimulate algal growth; dead bodies; decompose deplete oxygen; fish death; eutrophication; [4] (b) (i) seas linked to each other; currents move pollutants [2] (ii) preventing: double hulls / pipelines; [1] (iii) dealing: booms / detergent / skimmers / burn off; [1] 6 (a) (i) amount of energy / power / heat received on a surface / incoming solar radiation; [1] (ii) 342 – 242 = 100 units more; 242 100 × 100 = 41.3 %; ((A) 41 but not 42) [2] 242 (iii) nearness to coast / water body / (warm / cold) currents (large lake); amount of snow; altitude; cloud cover; winds if say where from; [2] (b) (i) fossil fuels pollute; e.g.; fossil fuels running out / limited; fossil fuels non renewable; 3 marks for three bit can have one development mark with any. can award converse in any case [3] (ii) HEP / geothermal / wave / wind / tidal / nuclear / biogas; relevant development; [2]
What you needed in this session
Cambridge’s own grade thresholds for 2010 Oct/Nov, Paper 1 · Variant 1. A higher threshold means an easier paper — the bar moves with how the cohort did.