Cambridge IGCSE Environmental Management 0680 — 2009 Oct/Nov Paper 2 · Variant 1
0680/21/O/N/09 · 80 marks · ≈90 min
The question paper and its mark scheme, free to read here and free to download. This is Cambridge’s own paper, exactly as it was sat.
Question paper16 pages
Mark scheme7 pages
Answers below. Sit the paper first if you are practising.
Paper as text
Question paper, page 1
This document consists of 16 printed pages. DC (NF/SW) 15851/4 © UCLES 2009 [Turn over UNIVERSITY OF CAMBRIDGE INTERNATIONAL EXAMINATIONS International General Certificate of Secondary Education READ THESE INSTRUCTIONS FIRST Write your Centre number, candidate number and name on all the work you hand in. Write in dark blue or black pen. You may use a soft pencil for any diagrams, graphs or rough working. Do not use staples, paper clips, highlighters, glue or correction fluid. DO NOT WRITE IN ANY BARCODES. Answer both questions. At the end of the examination, fasten all your work securely together. The number of marks is given in brackets [ ] at the end of each question or part question. * 8 8 4 0 7 9 5 6 7 5 * ENVIRONMENTAL MANAGEMENT 0680/02 Paper 2 October/November 2009 1 hour 45 minutes Candidates answer on the Question Paper. Additional Materials: Ruler For Examiner’s Use 1 2 Total www.XtremePapers.com
Question paper, page 2
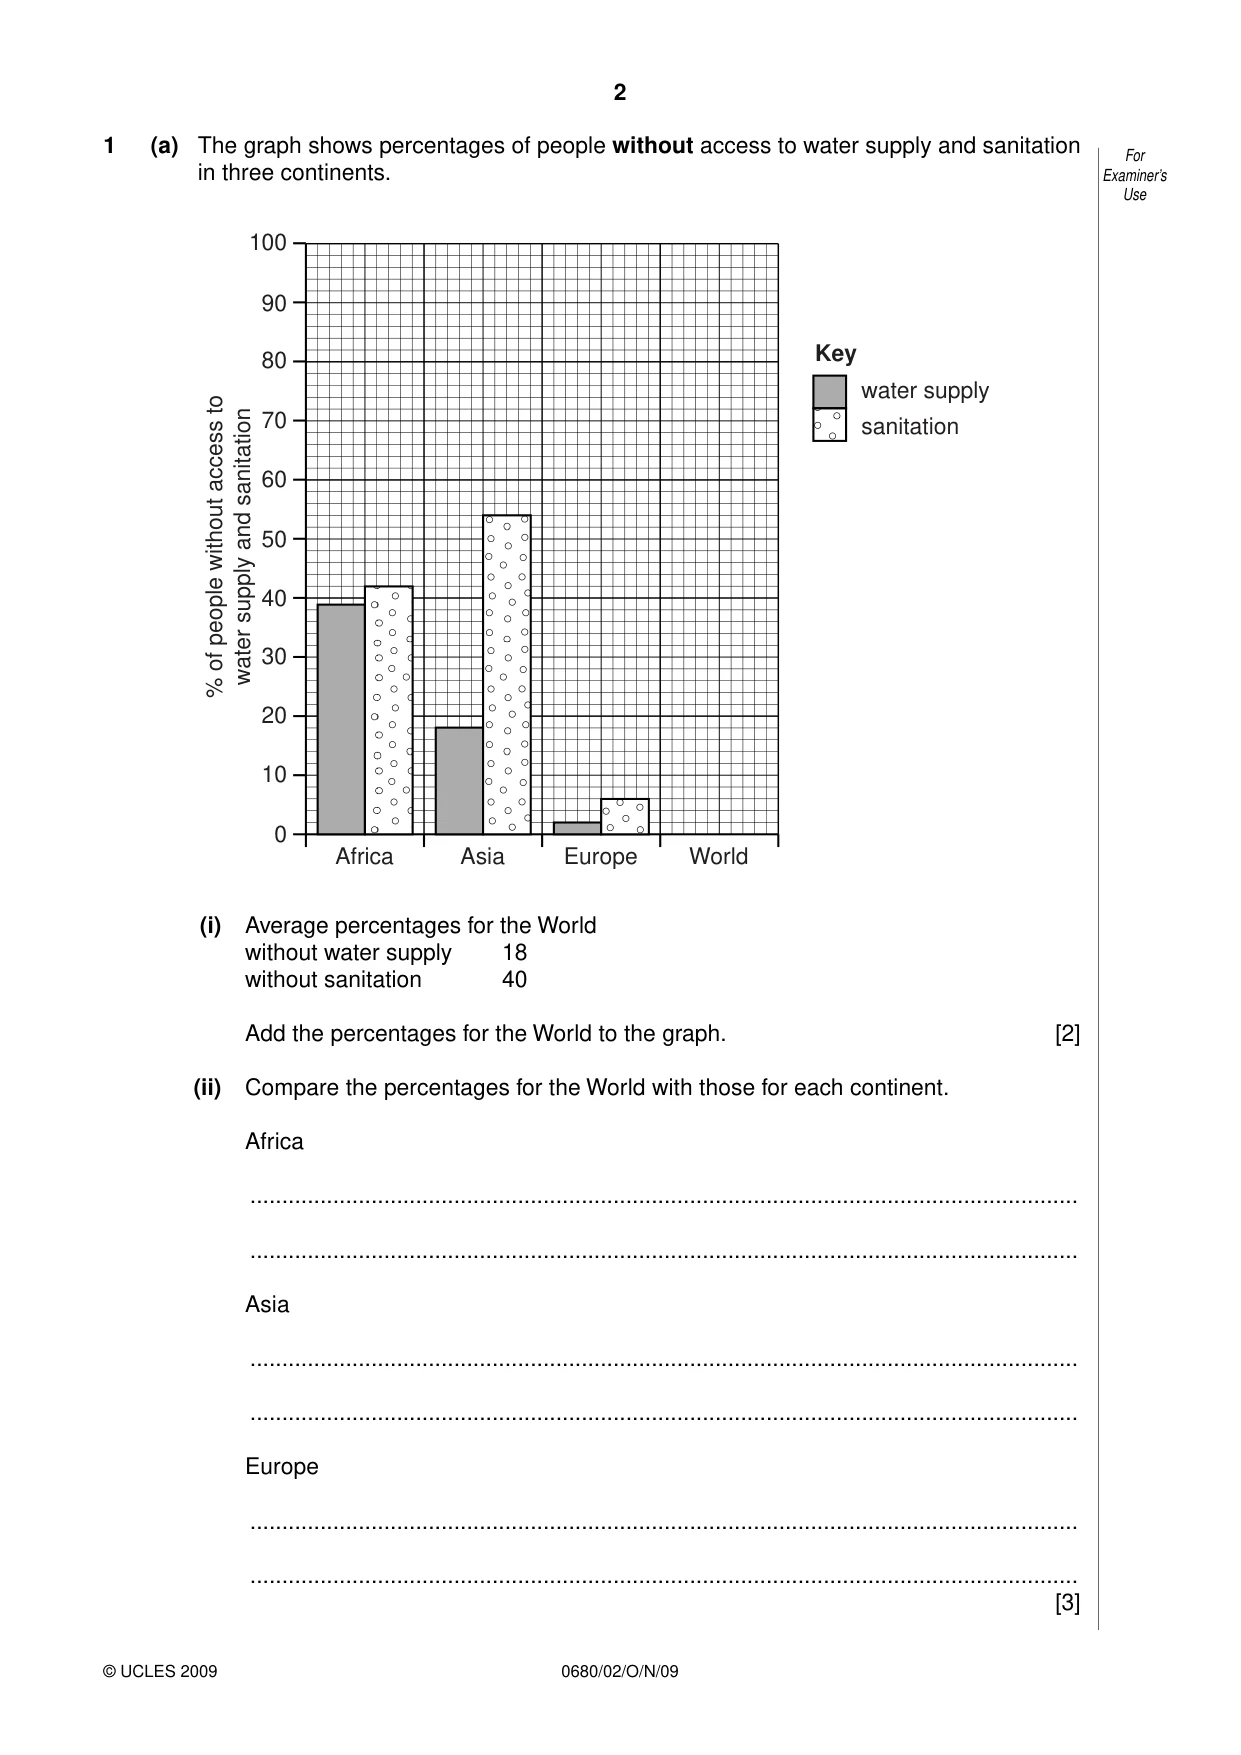
2 0680/02/O/N/09 © UCLES 2009 For Examiner’s Use 1 (a) The graph shows percentages of people without access to water supply and sanitation in three continents. 0 10 20 30 40 % of people without access to water supply and sanitation 50 60 70 80 90 100 Africa water supply Key sanitation Asia Europe World (i) Average percentages for the World without water supply 18 without sanitation 40 Add the percentages for the World to the graph. [2] (ii) Compare the percentages for the World with those for each continent. Africa … … Asia … … Europe … … [3]
Question paper, page 3
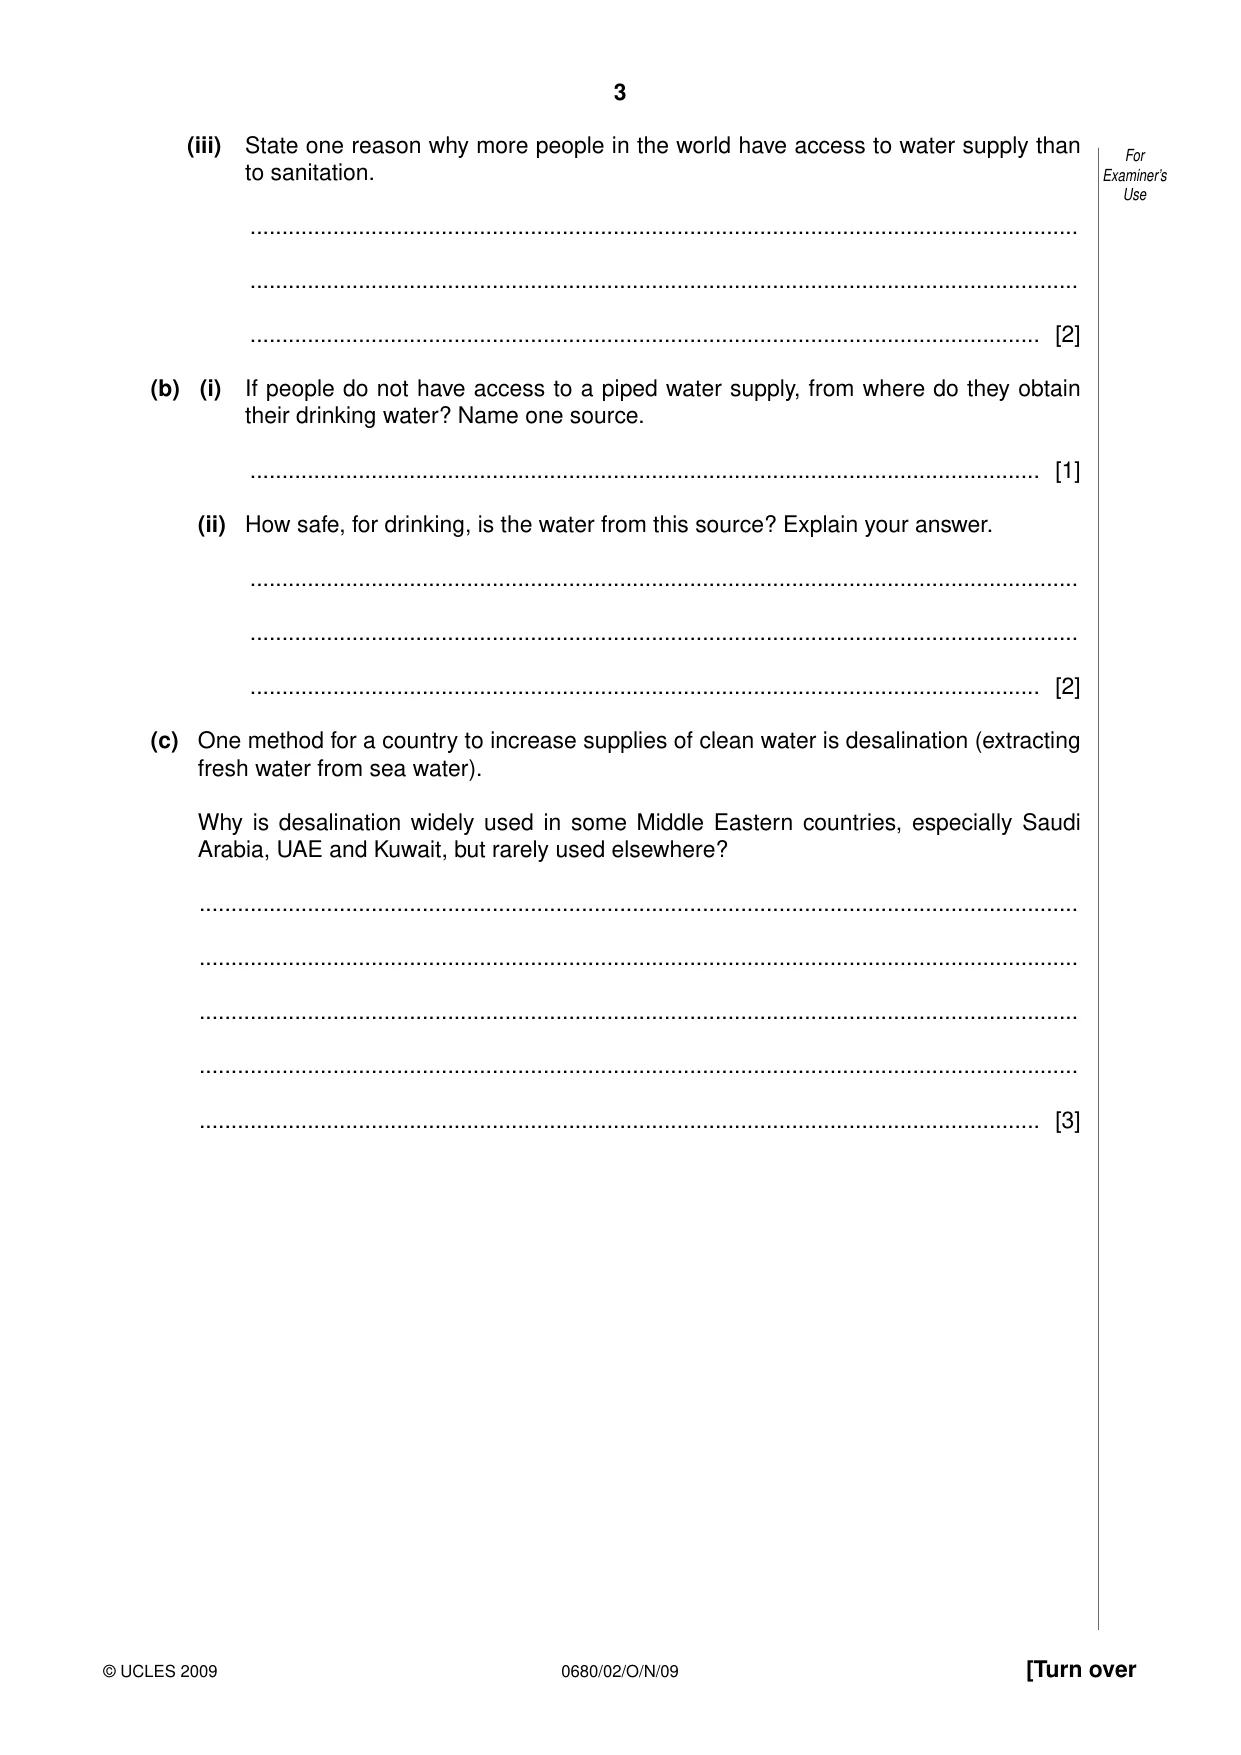
3 0680/02/O/N/09 © UCLES 2009 [Turn over For Examiner’s Use (iii) State one reason why more people in the world have access to water supply than to sanitation. … … … [2] (b) (i) If people do not have access to a piped water supply, from where do they obtain their drinking water? Name one source. … [1] (ii) How safe, for drinking, is the water from this source? Explain your answer. … … … [2] (c) One method for a country to increase supplies of clean water is desalination (extracting fresh water from sea water). Why is desalination widely used in some Middle Eastern countries, especially Saudi Arabia, UAE and Kuwait, but rarely used elsewhere? … … … … … [3]
Question paper, page 4
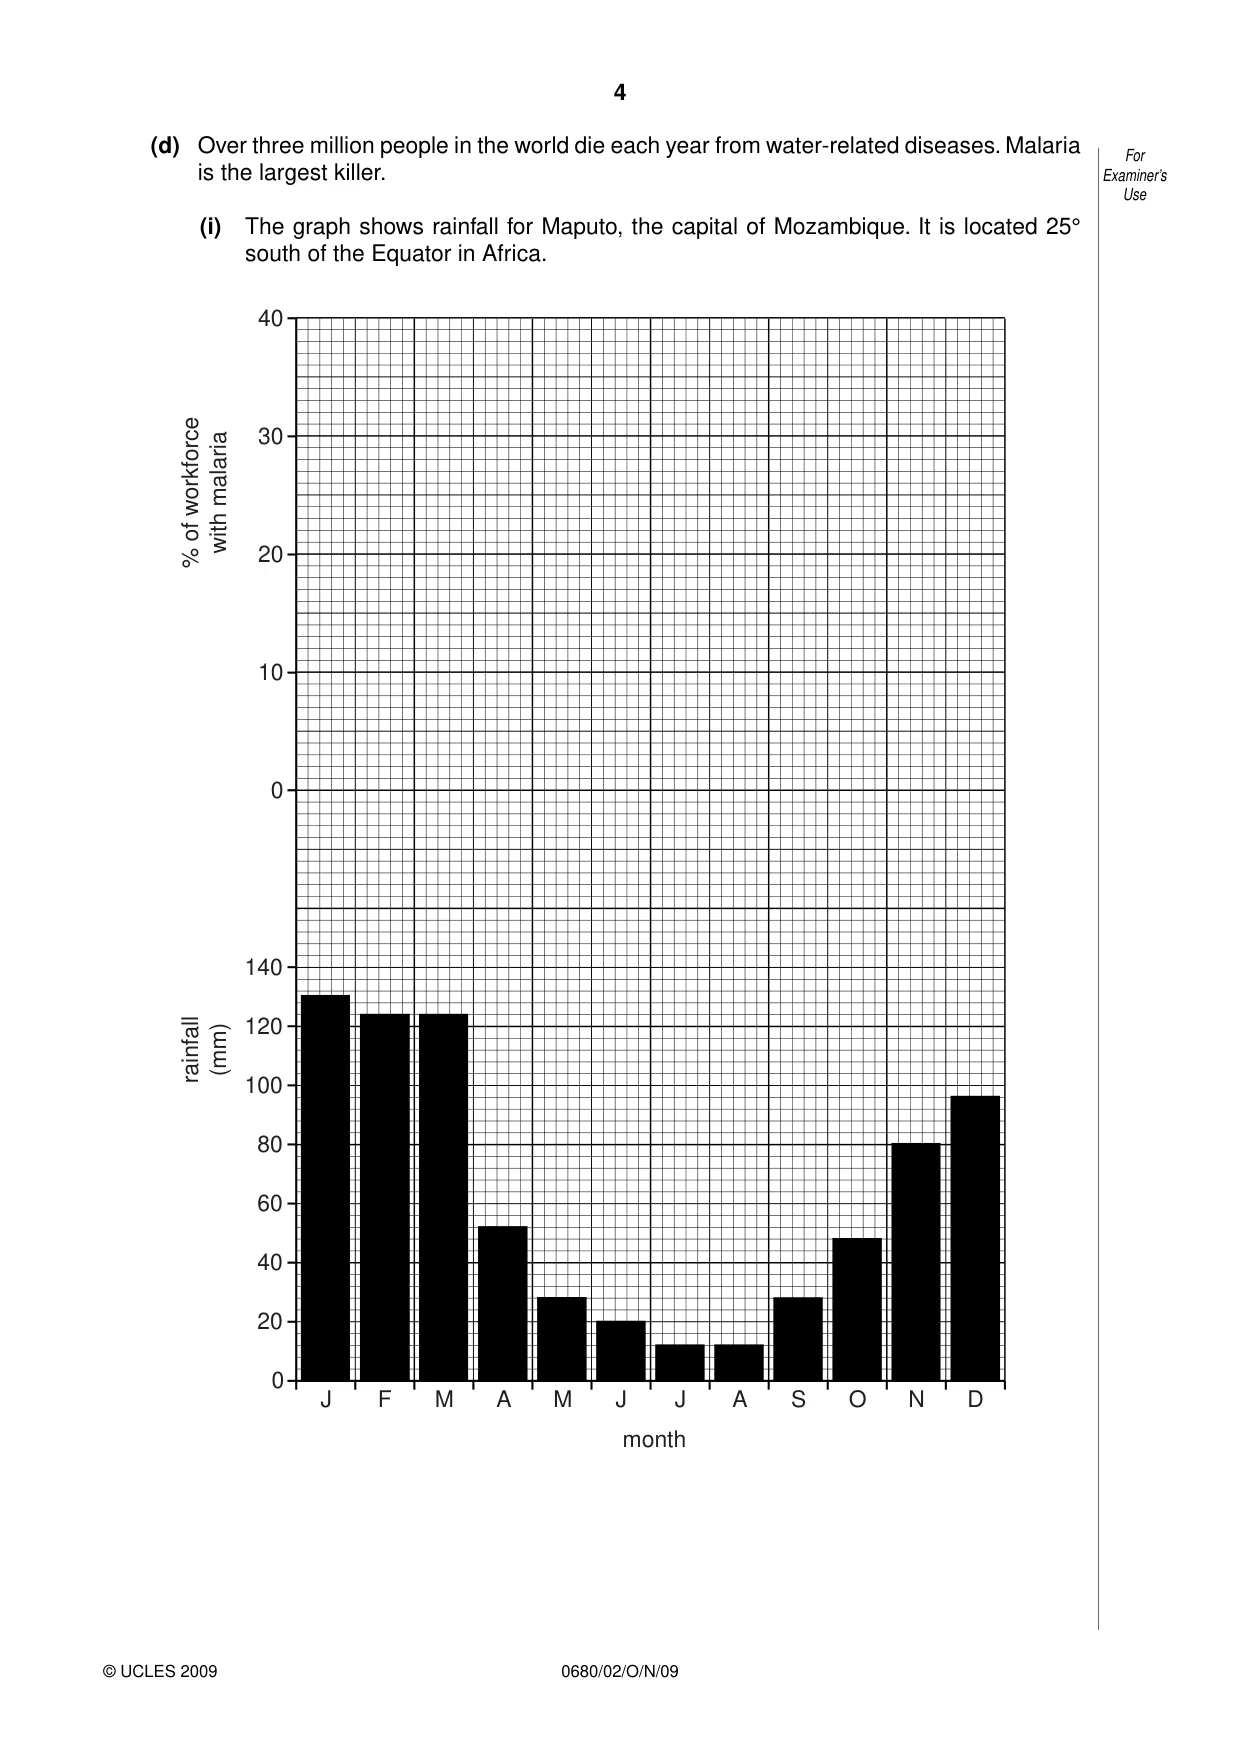
4 0680/02/O/N/09 © UCLES 2009 For Examiner’s Use (d) Over three million people in the world die each year from water-related diseases. Malaria is the largest killer. (i) The graph shows rainfall for Maputo, the capital of Mozambique. It is located 25° south of the Equator in Africa. J F M A M J month J A S O N D 0 20 40 60 80 100 120 140 0 10 20 30 40 rainfall (mm) % of workforce with malaria
Question paper, page 5
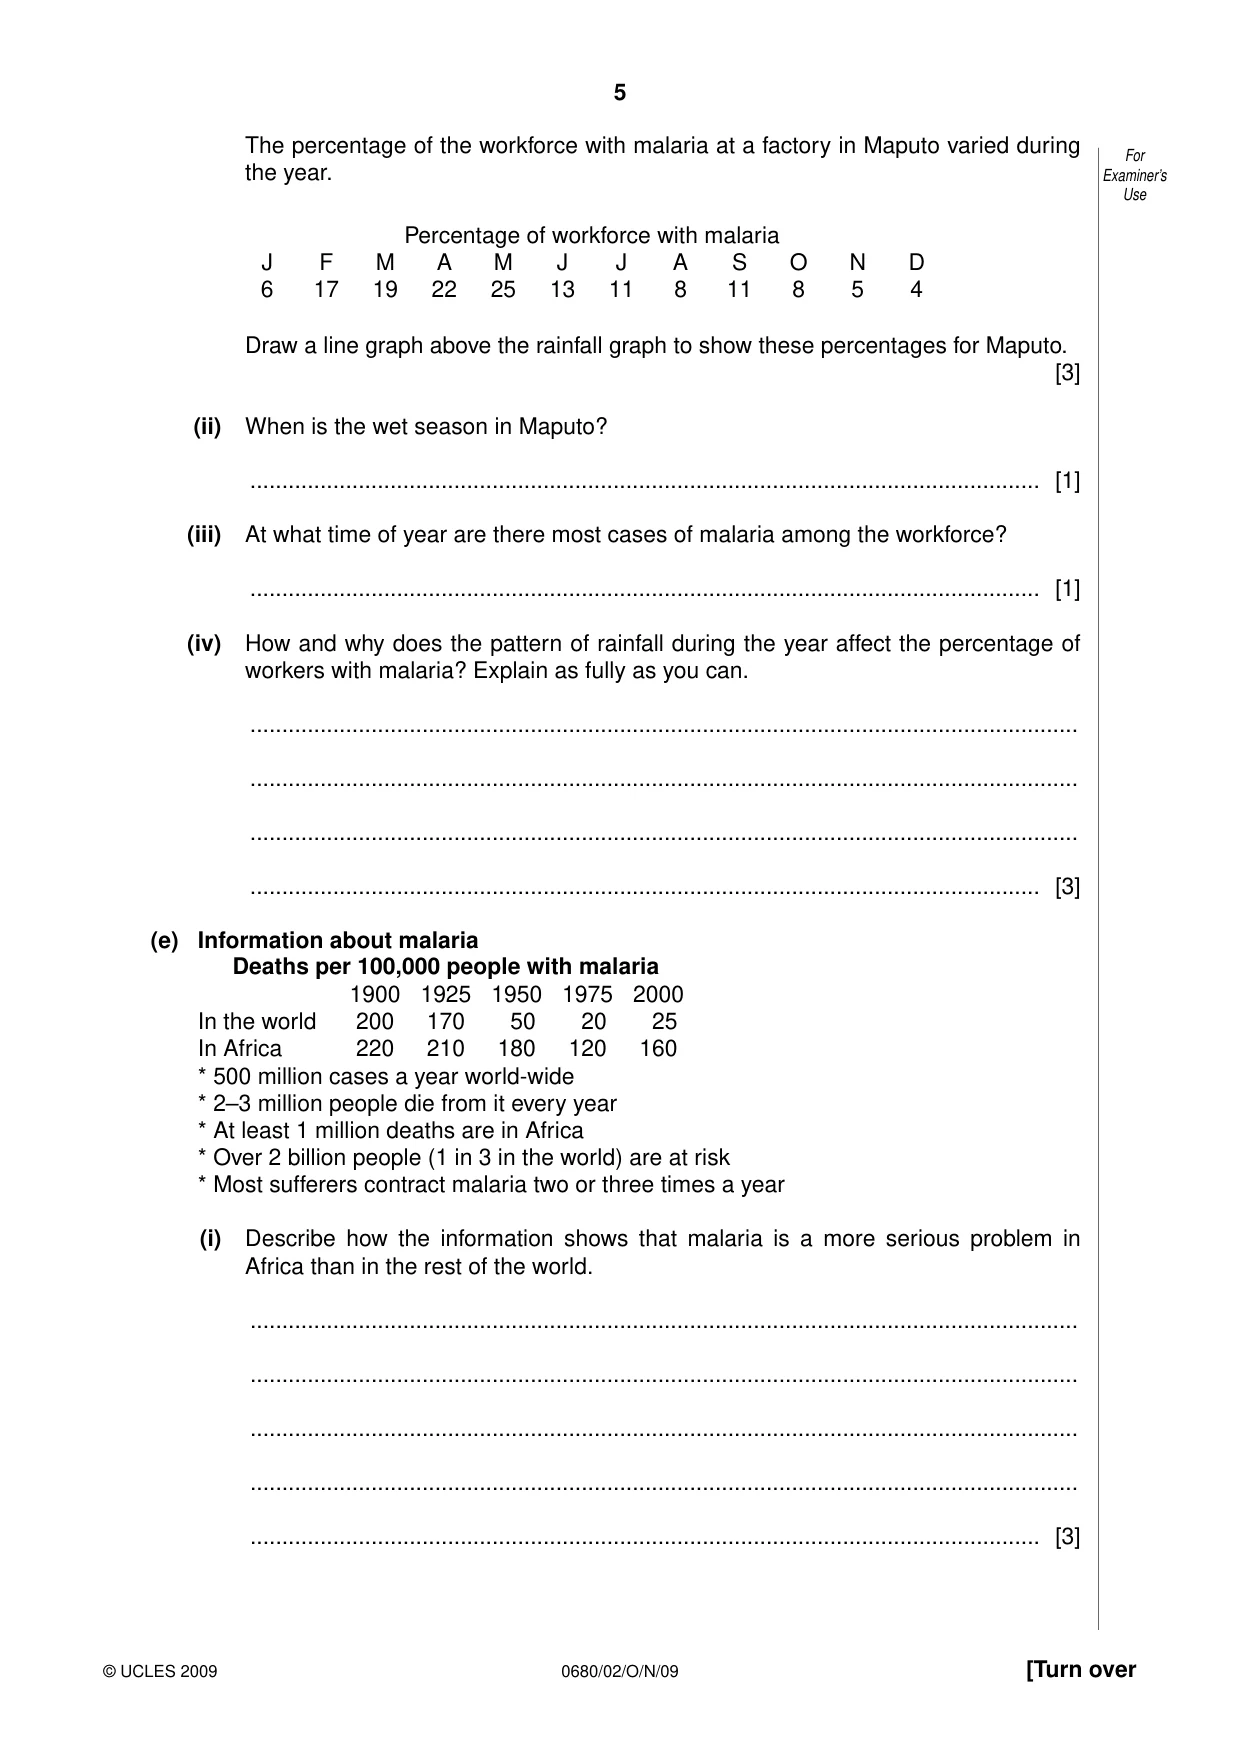
5 0680/02/O/N/09 © UCLES 2009 [Turn over For Examiner’s Use The percentage of the workforce with malaria at a factory in Maputo varied during the year. Percentage of workforce with malaria J F M A M J J A S O N D 6 17 19 22 25 13 11 8 11 8 5 4 Draw a line graph above the rainfall graph to show these percentages for Maputo. [3] (ii) When is the wet season in Maputo? … [1] (iii) At what time of year are there most cases of malaria among the workforce? … [1] (iv) How and why does the pattern of rainfall during the year affect the percentage of workers with malaria? Explain as fully as you can. … … … … [3] (e) Information about malaria Deaths per 100,000 people with malaria 1900 1925 1950 1975 2000 In the world 200 170 50 20 25 In Africa 220 210 180 120 160 * 500 million cases a year world-wide * 2–3 million people die from it every year * At least 1 million deaths are in Africa * Over 2 billion people (1 in 3 in the world) are at risk * Most sufferers contract malaria two or three times a year (i) Describe how the information shows that malaria is a more serious problem in Africa than in the rest of the world. … … … … … [3]
Question paper, page 6
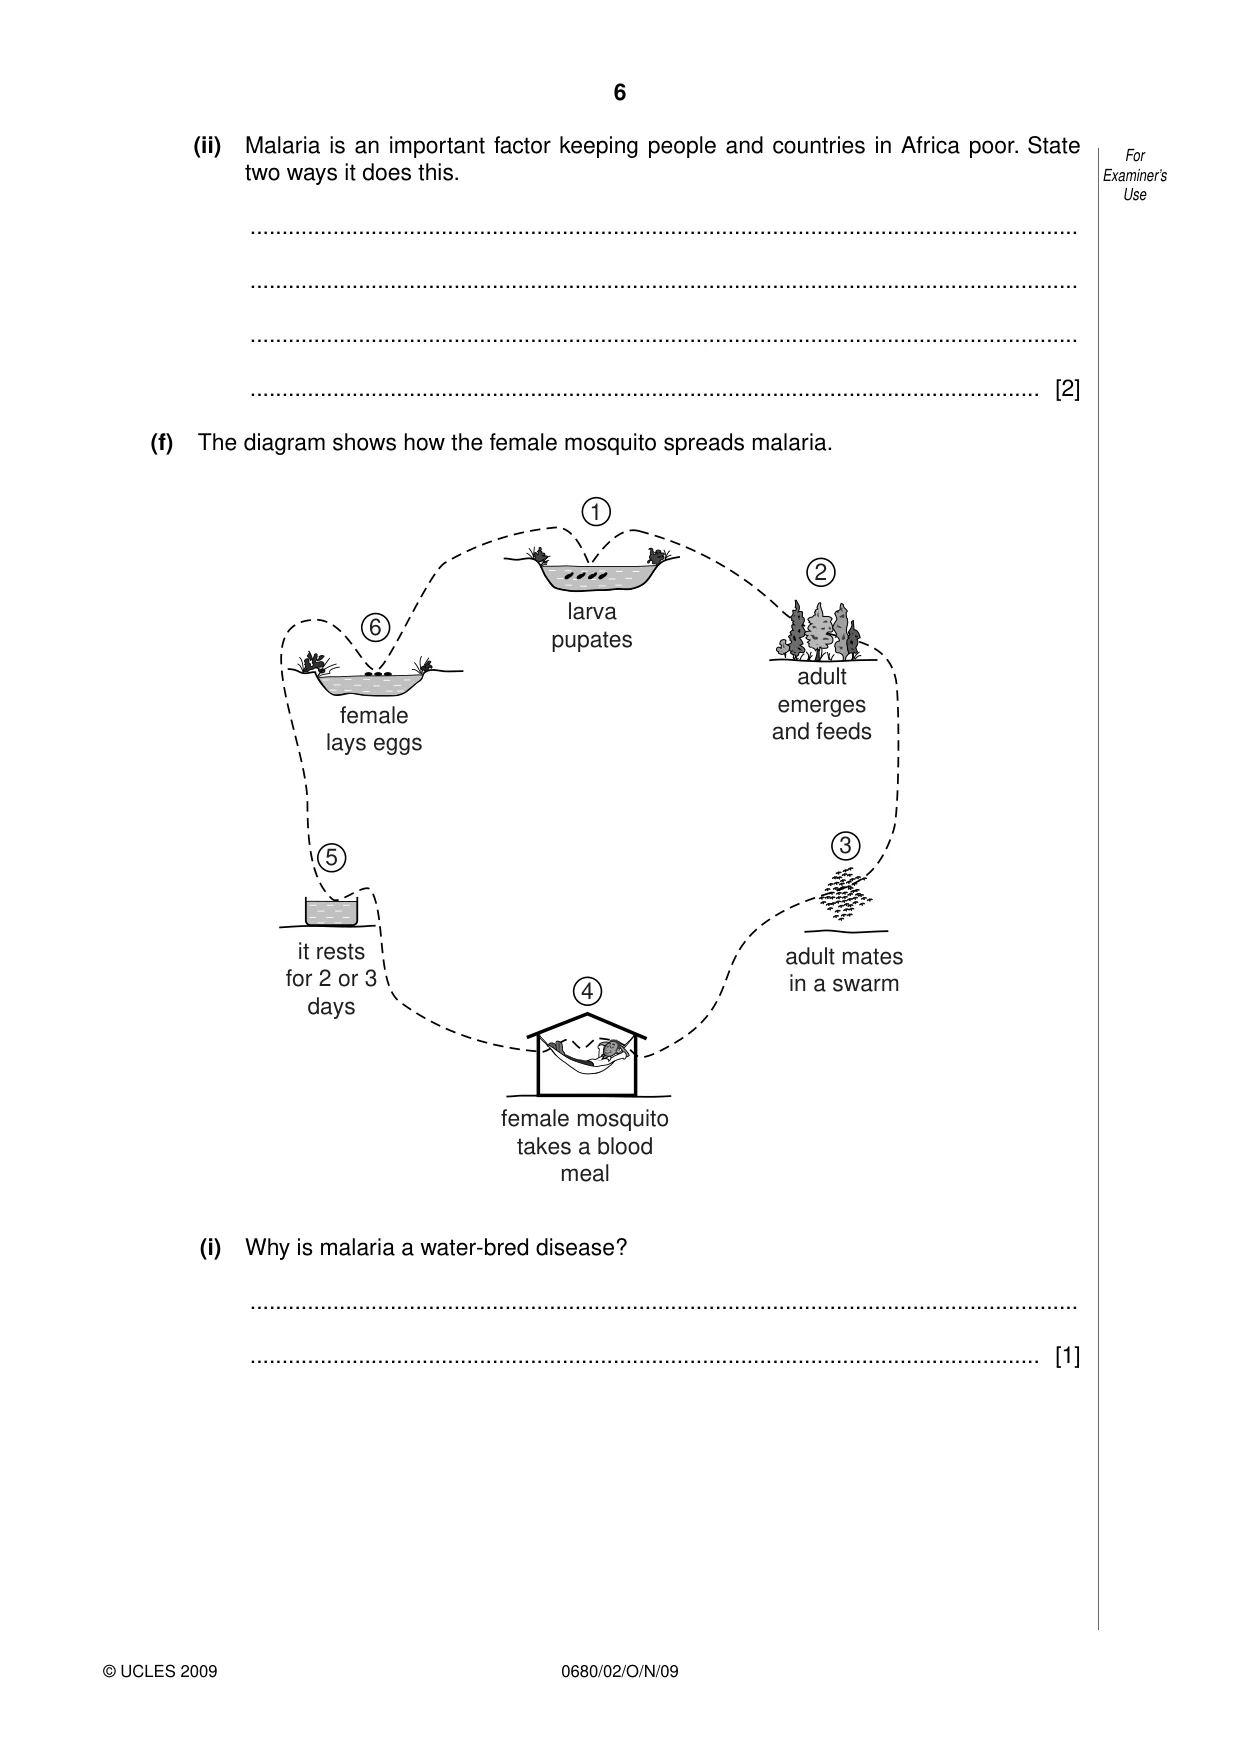
6 0680/02/O/N/09 © UCLES 2009 For Examiner’s Use (ii) Malaria is an important factor keeping people and countries in Africa poor. State two ways it does this. … … … … [2] (f) The diagram shows how the female mosquito spreads malaria. larva pupates 1 adult emerges and feeds 2 adult mates in a swarm 3 female mosquito takes a blood meal 4 it rests for 2 or 3 days 5 female lays eggs 6 (i) Why is malaria a water-bred disease? … … [1]
Question paper, page 7
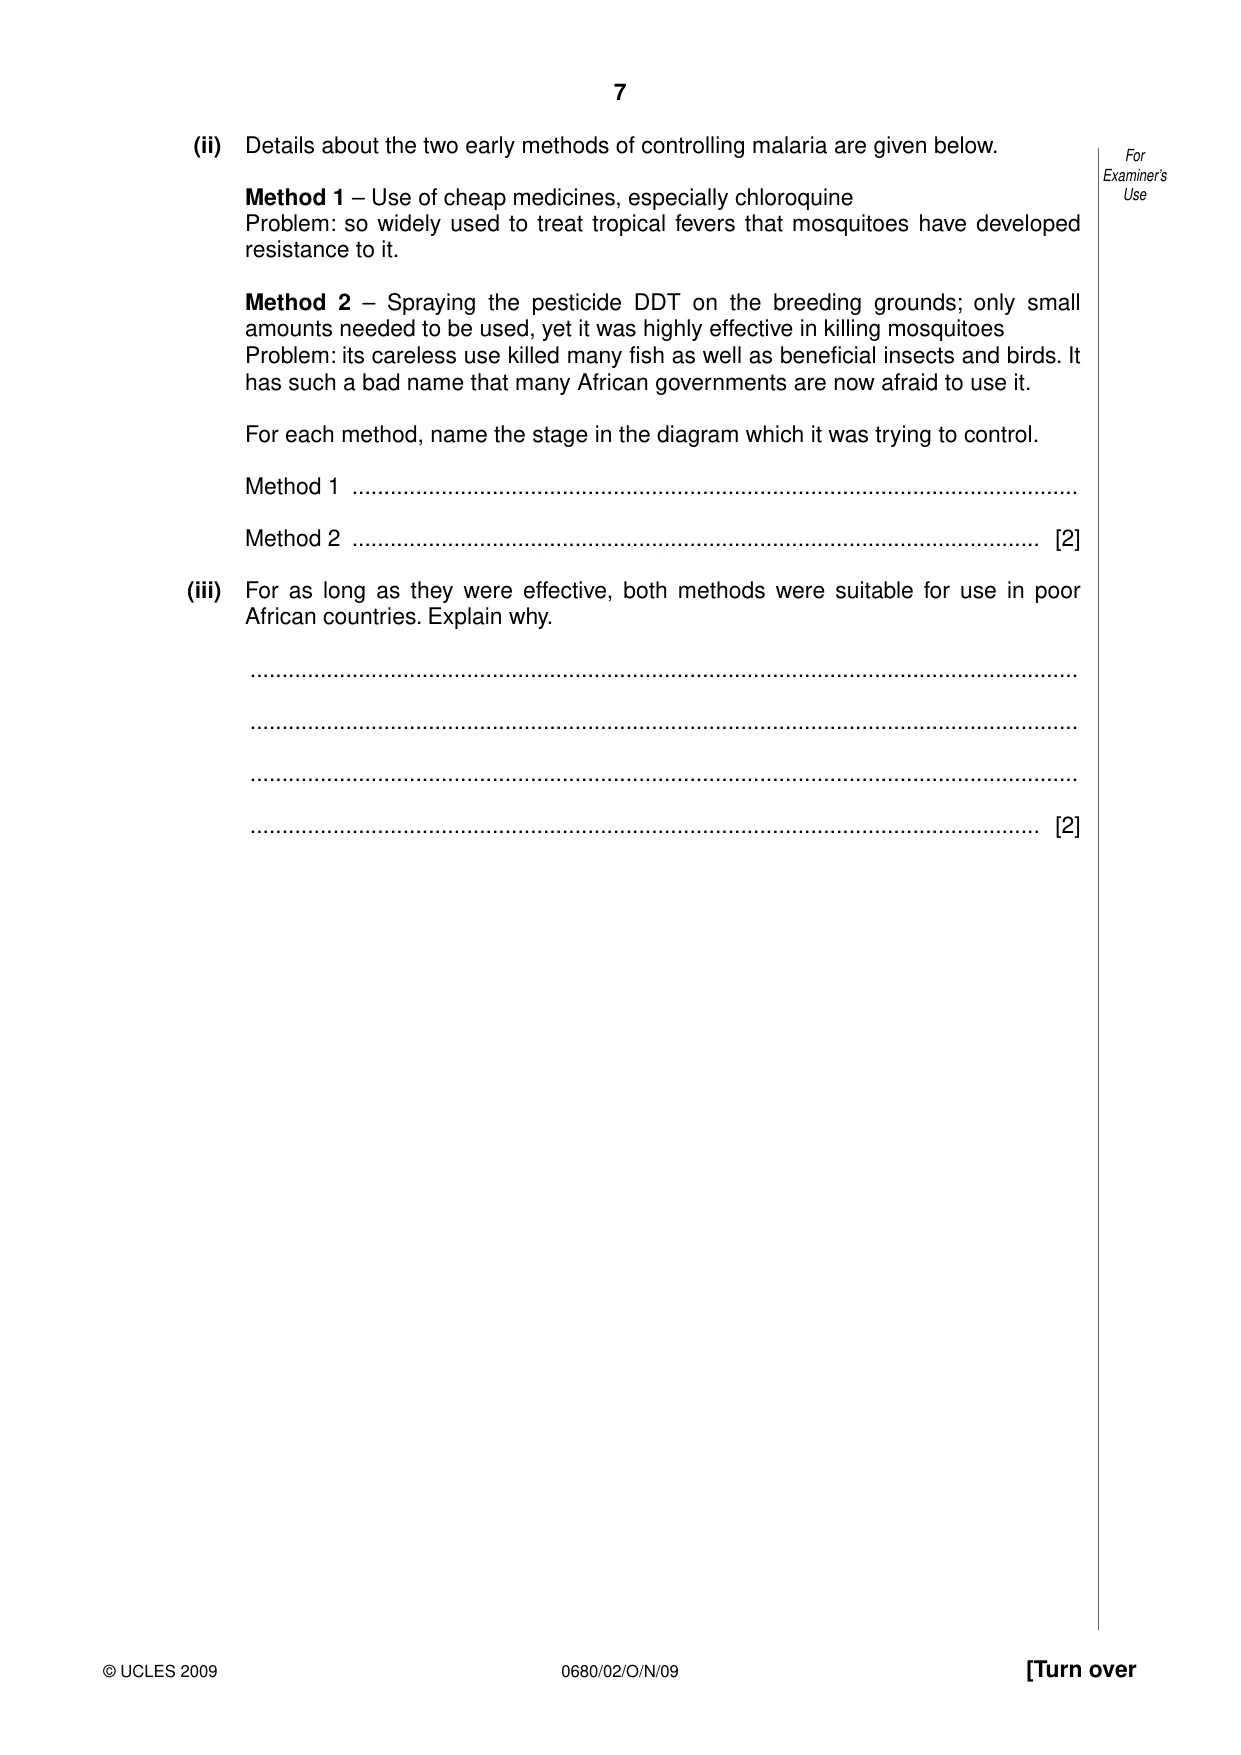
7 0680/02/O/N/09 © UCLES 2009 [Turn over For Examiner’s Use (ii) Details about the two early methods of controlling malaria are given below. Method 1 – Use of cheap medicines, especially chloroquine Problem: so widely used to treat tropical fevers that mosquitoes have developed resistance to it. Method 2 – Spraying the pesticide DDT on the breeding grounds; only small amounts needed to be used, yet it was highly effective in killing mosquitoes Problem: its careless use killed many fish as well as beneficial insects and birds. It has such a bad name that many African governments are now afraid to use it. For each method, name the stage in the diagram which it was trying to control. Method 1 … Method 2 … [2] (iii) For as long as they were effective, both methods were suitable for use in poor African countries. Explain why. … … … … [2]
Question paper, page 8
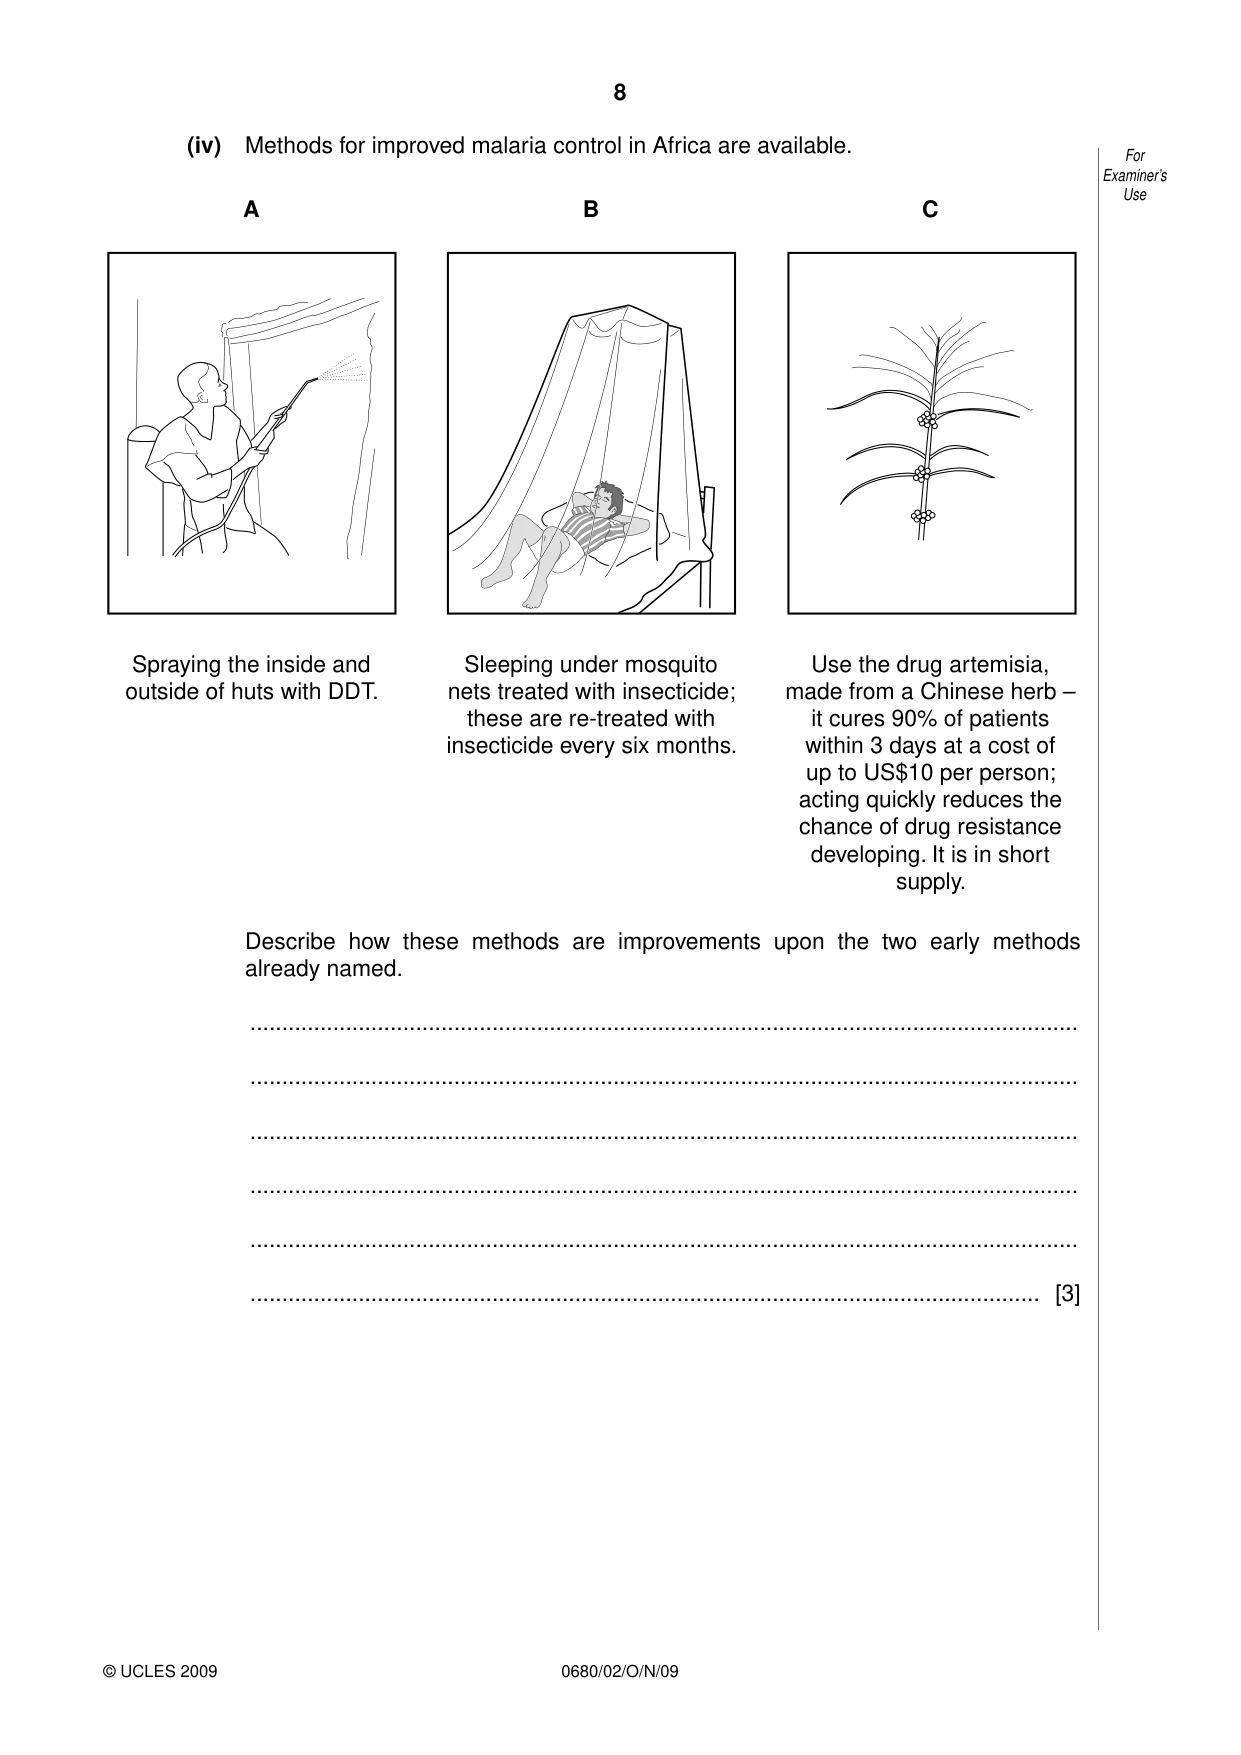
8 0680/02/O/N/09 © UCLES 2009 For Examiner’s Use (iv) Methods for improved malaria control in Africa are available. A B C Spraying the inside and Sleeping under mosquito Use the drug artemisia, outside of huts with DDT. nets treated with insecticide; made from a Chinese herb – these are re-treated with it cures 90% of patients insecticide every six months. within 3 days at a cost of up to US$10 per person; acting quickly reduces the chance of drug resistance developing. It is in short supply. Describe how these methods are improvements upon the two early methods already named. … … … … … … [3]
Question paper, page 9
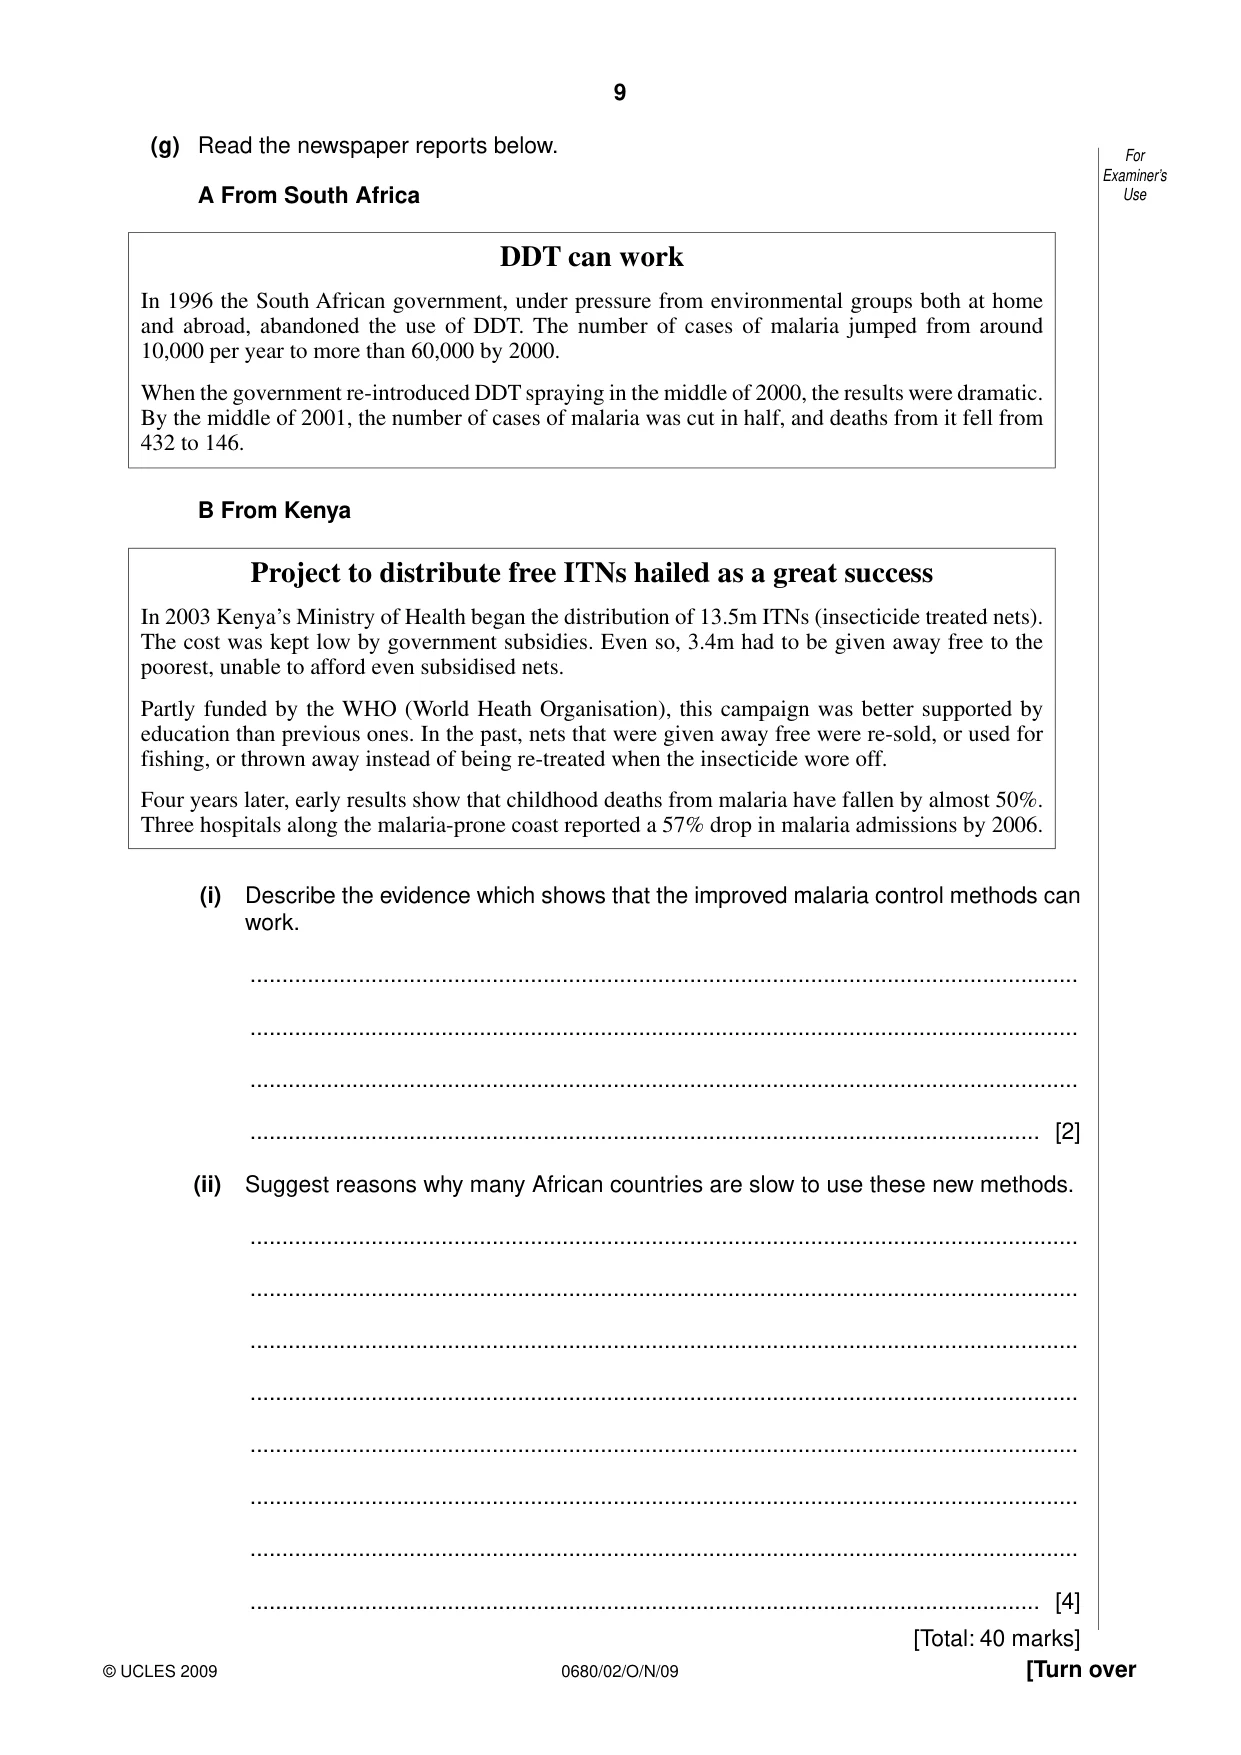
9 0680/02/O/N/09 © UCLES 2009 [Turn over For Examiner’s Use (g) Read the newspaper reports below. A From South Africa DDT can work In 1996 the South African government, under pressure from environmental groups both at home and abroad, abandoned the use of DDT. The number of cases of malaria jumped from around 10,000 per year to more than 60,000 by 2000. When the government re-introduced DDT spraying in the middle of 2000, the results were dramatic. By the middle of 2001, the number of cases of malaria was cut in half, and deaths from it fell from 432 to 146. B From Kenya Project to distribute free ITNs hailed as a great success In 2003 Kenya’s Ministry of Health began the distribution of 13.5m ITNs (insecticide treated nets). The cost was kept low by government subsidies. Even so, 3.4m had to be given away free to the poorest, unable to afford even subsidised nets. Partly funded by the WHO (World Heath Organisation), this campaign was better supported by education than previous ones. In the past, nets that were given away free were re-sold, or used for fishing, or thrown away instead of being re-treated when the insecticide wore off. Four years later, early results show that childhood deaths from malaria have fallen by almost 50%. Three hospitals along the malaria-prone coast reported a 57% drop in malaria admissions by 2006. (i) Describe the evidence which shows that the improved malaria control methods can work. … … … … [2] (ii) Suggest reasons why many African countries are slow to use these new methods. … … … … … … … … [4] [Total: 40 marks]
Question paper, page 10
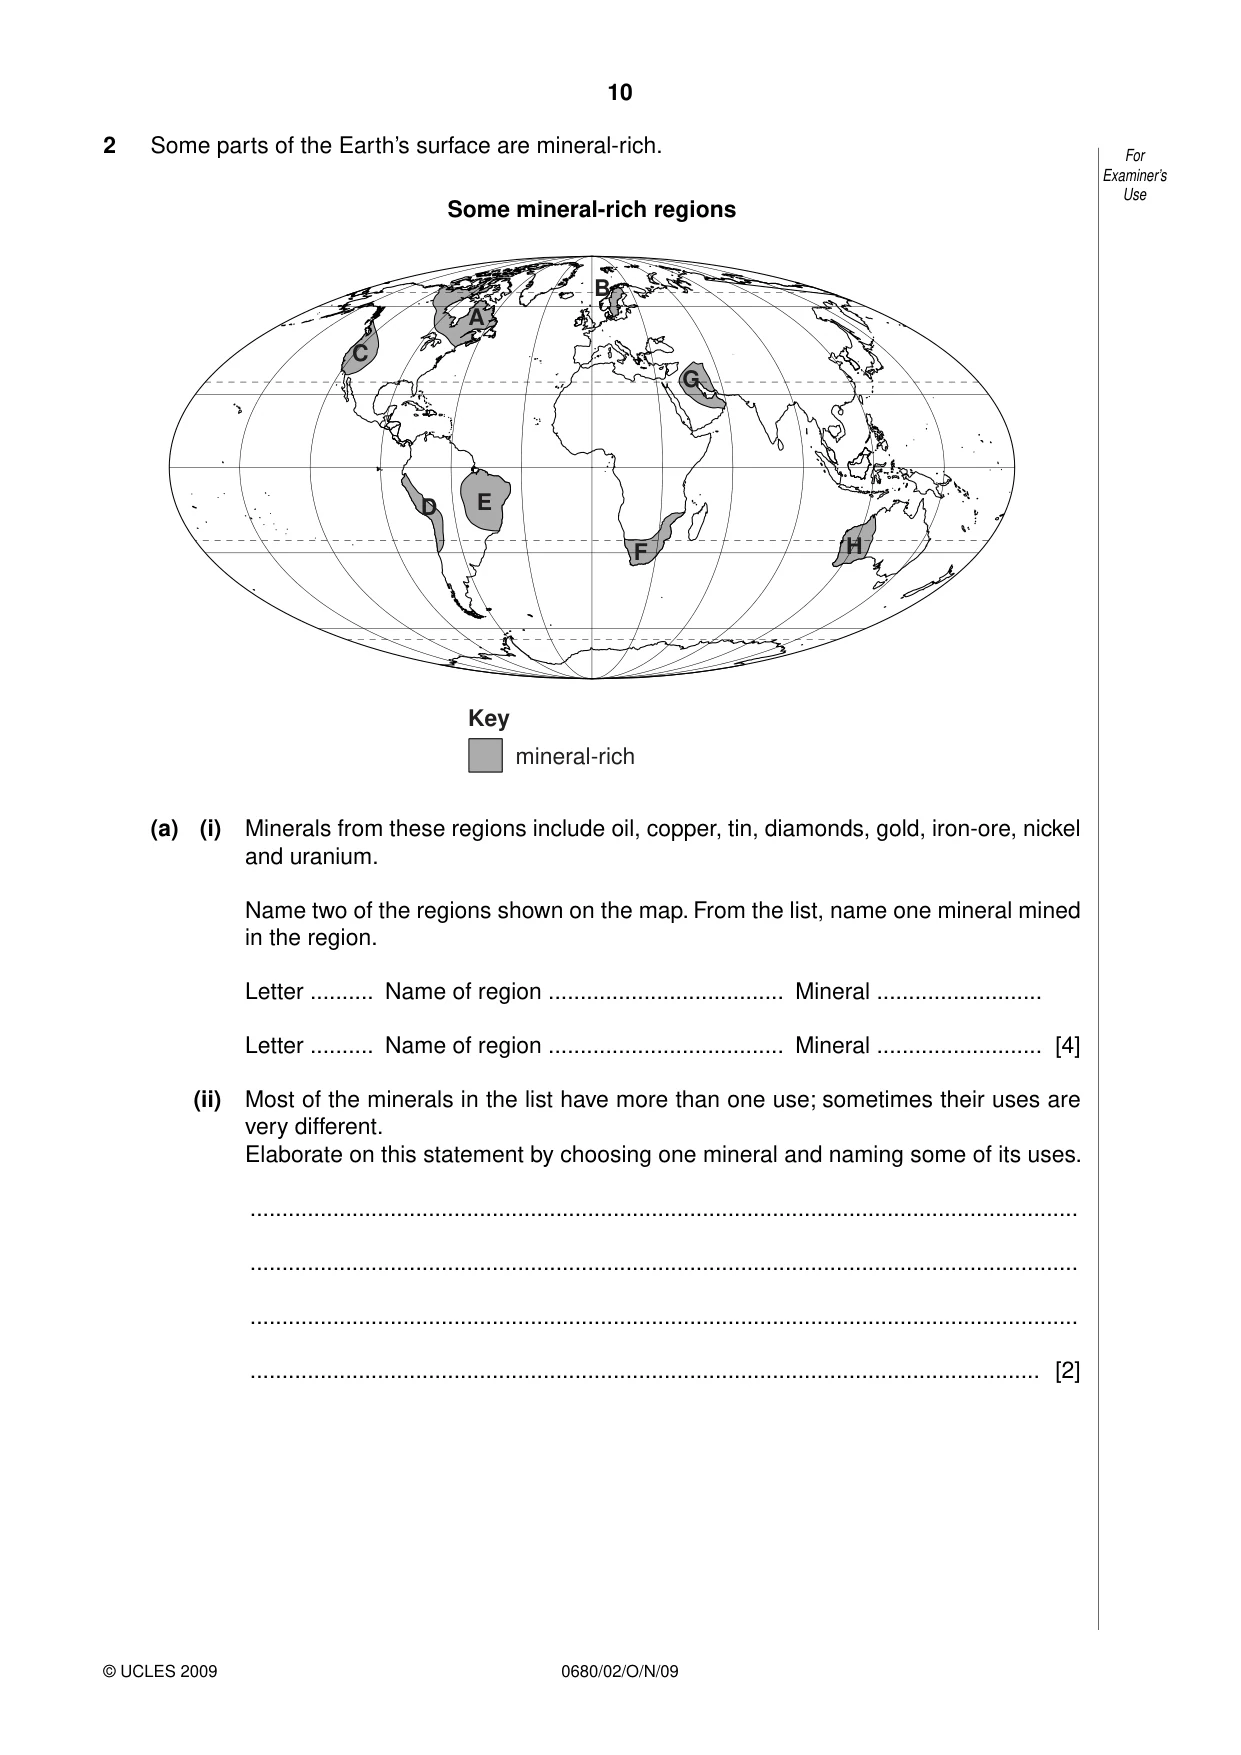
10 0680/02/O/N/09 © UCLES 2009 For Examiner’s Use 2 Some parts of the Earth’s surface are mineral-rich. Some mineral-rich regions mineral-rich Key A C E F G B H D (a) (i) Minerals from these regions include oil, copper, tin, diamonds, gold, iron-ore, nickel and uranium. Name two of the regions shown on the map. From the list, name one mineral mined in the region. Letter … Name of region … Mineral … Letter … Name of region … Mineral … [4] (ii) Most of the minerals in the list have more than one use; sometimes their uses are very different. Elaborate on this statement by choosing one mineral and naming some of its uses. … … … … [2]
Question paper, page 11
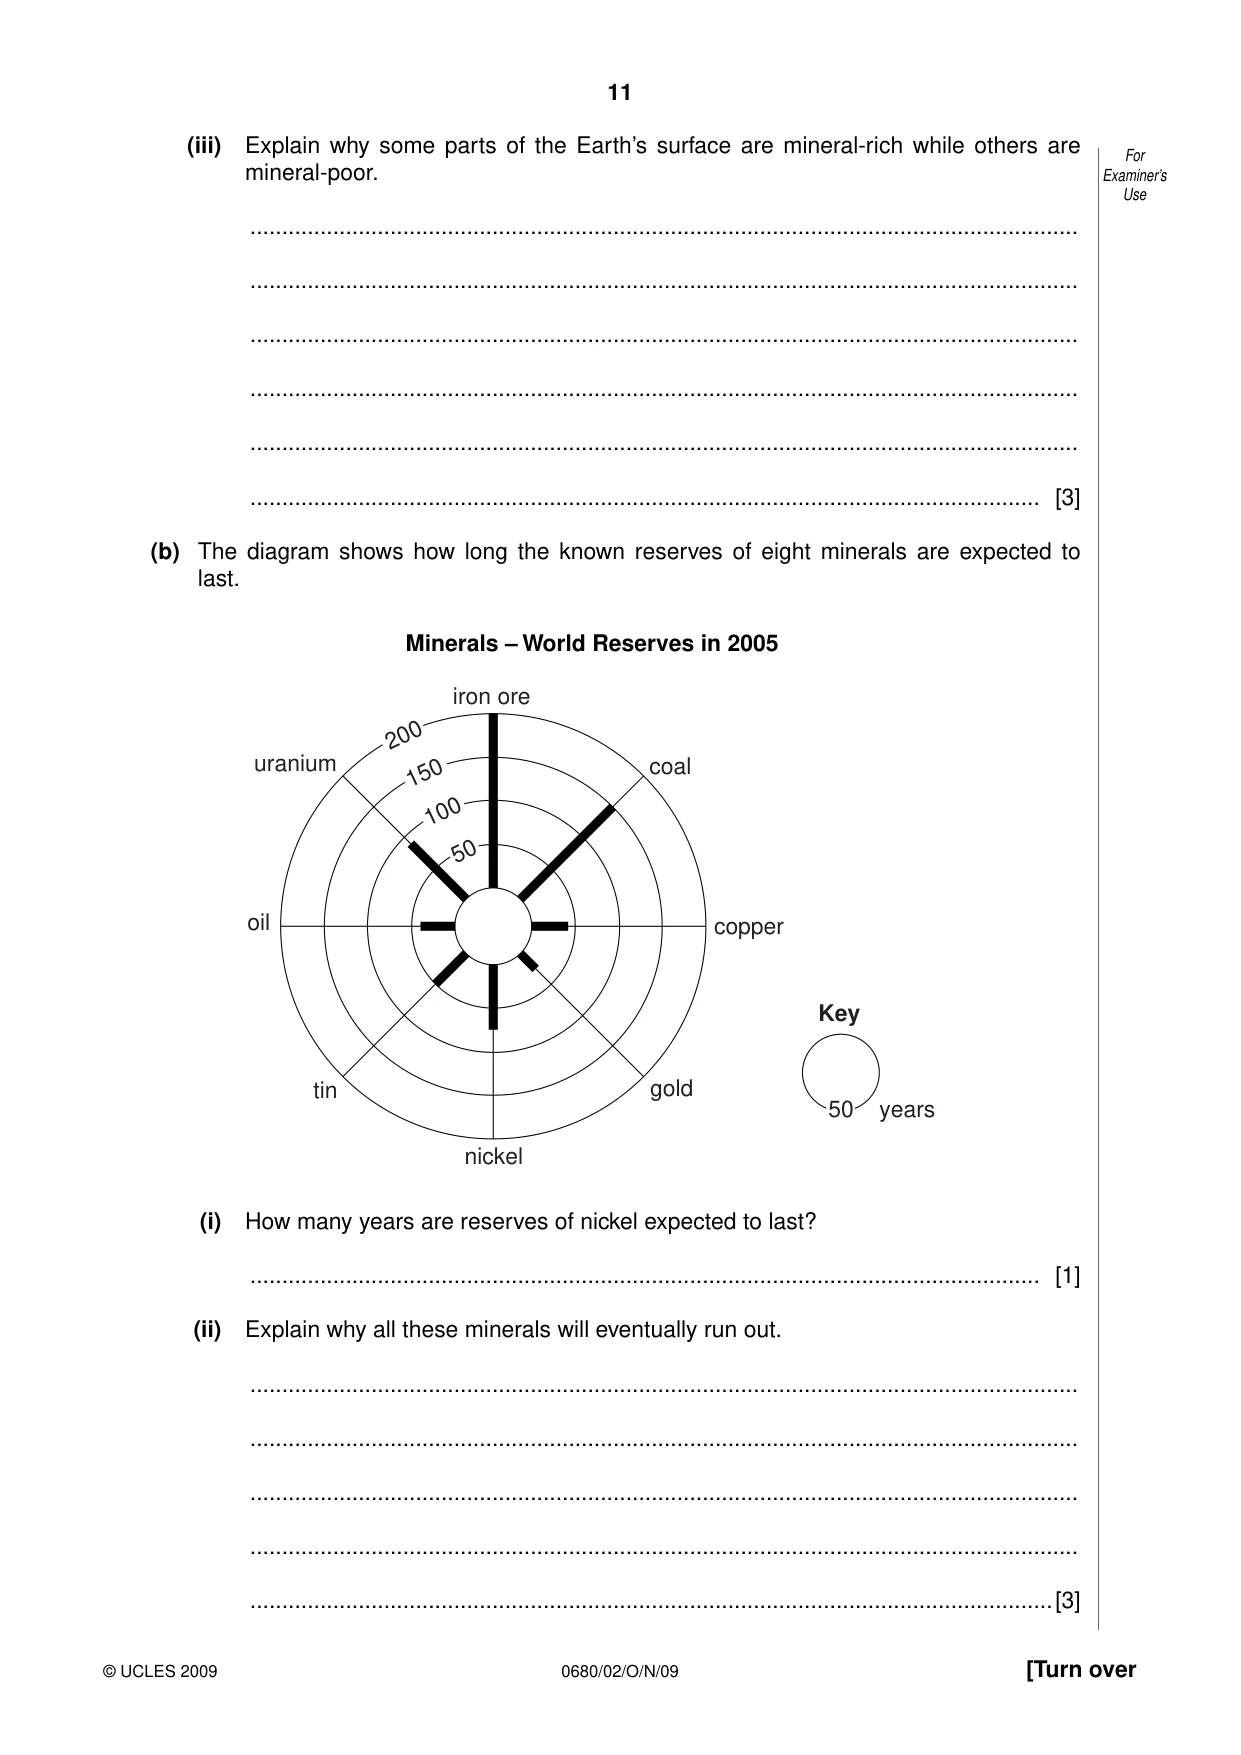
11 0680/02/O/N/09 © UCLES 2009 [Turn over For Examiner’s Use (iii) Explain why some parts of the Earth’s surface are mineral-rich while others are mineral-poor. … … … … … … [3] (b) The diagram shows how long the known reserves of eight minerals are expected to last. Minerals – World Reserves in 2005 tin nickel gold copper Key coal iron ore uranium oil 200 150 100 50 50 years (i) How many years are reserves of nickel expected to last? … [1] (ii) Explain why all these minerals will eventually run out. … … … … …[3]
Question paper, page 12
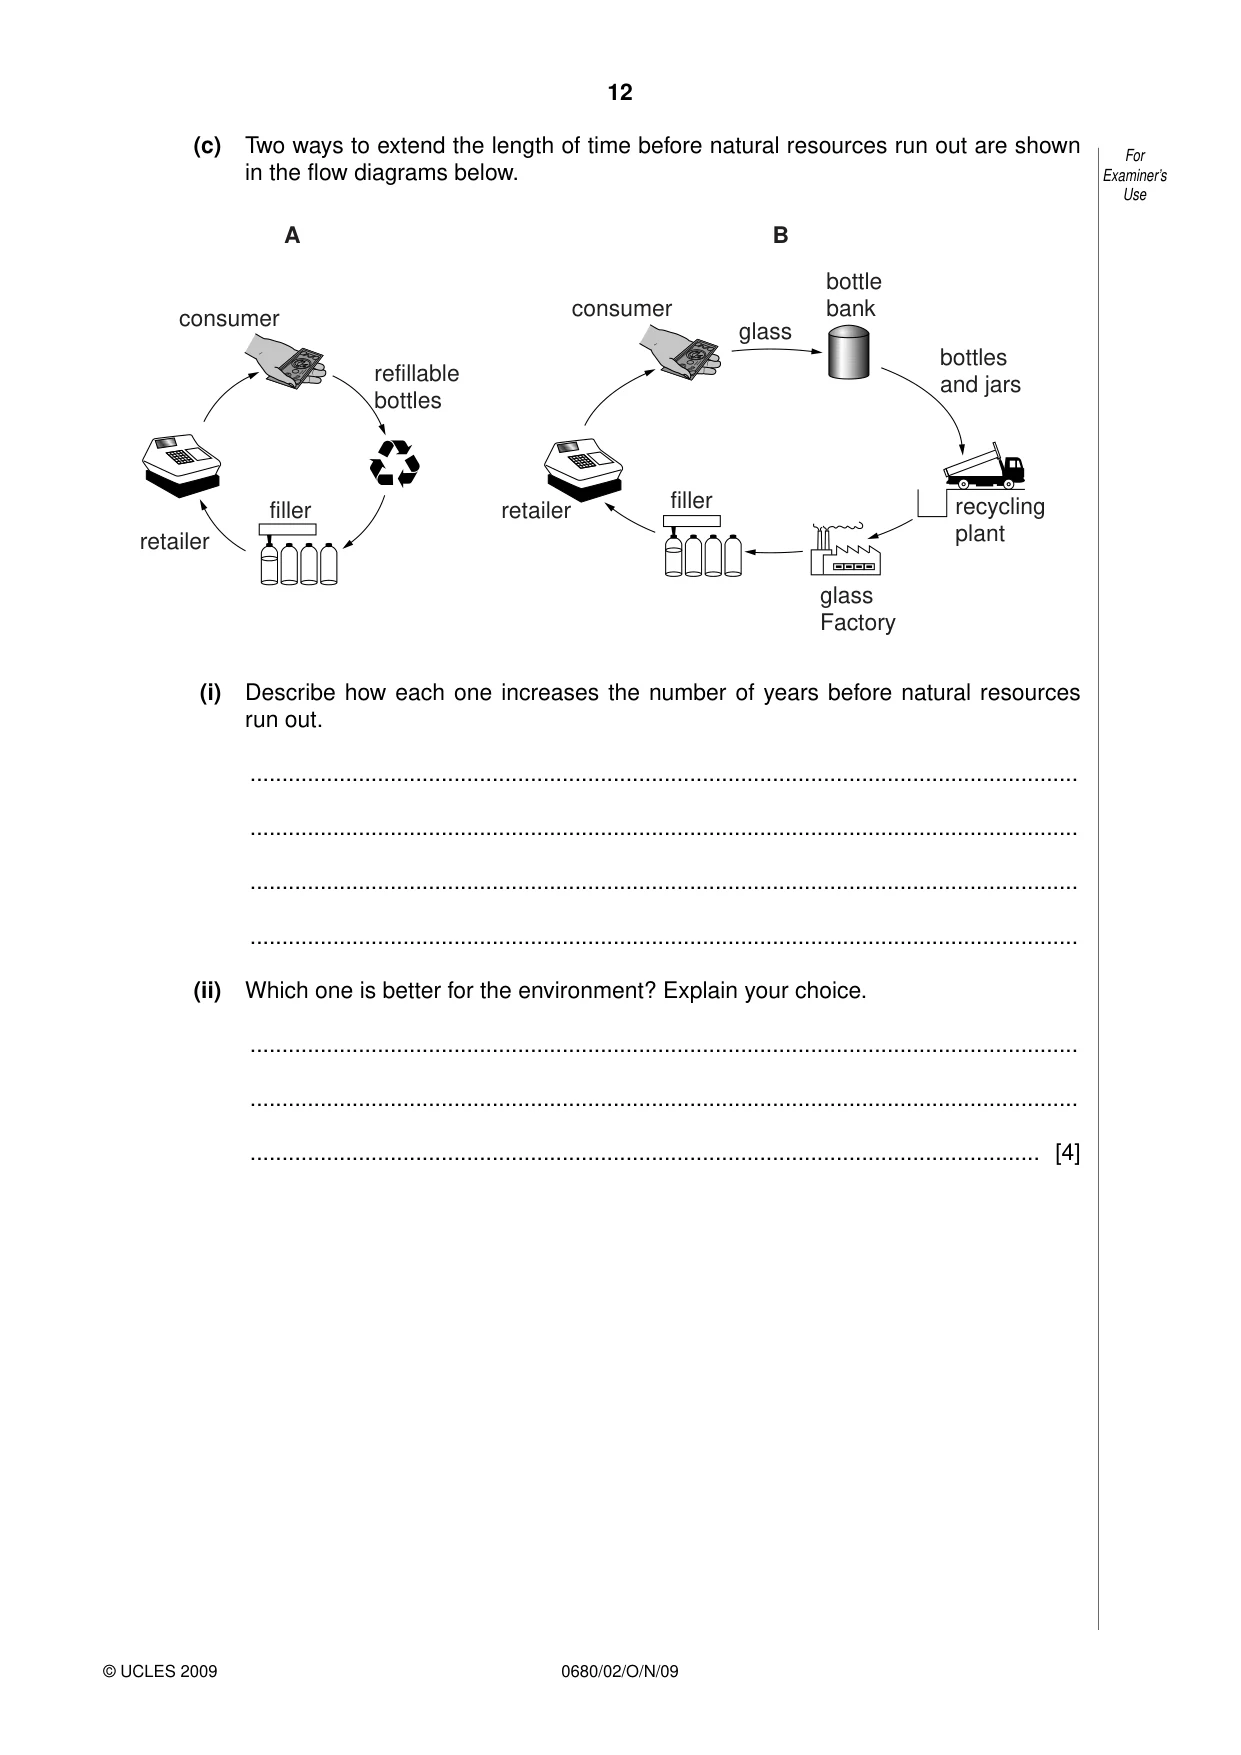
12 0680/02/O/N/09 © UCLES 2009 For Examiner’s Use (c) Two ways to extend the length of time before natural resources run out are shown in the flow diagrams below. consumer A B consumer refillable bottles filler filler glass Factory recycling plant bottles and jars bottle bank glass retailer retailer (i) Describe how each one increases the number of years before natural resources run out. … … … … (ii) Which one is better for the environment? Explain your choice. … … … [4]
Question paper, page 13
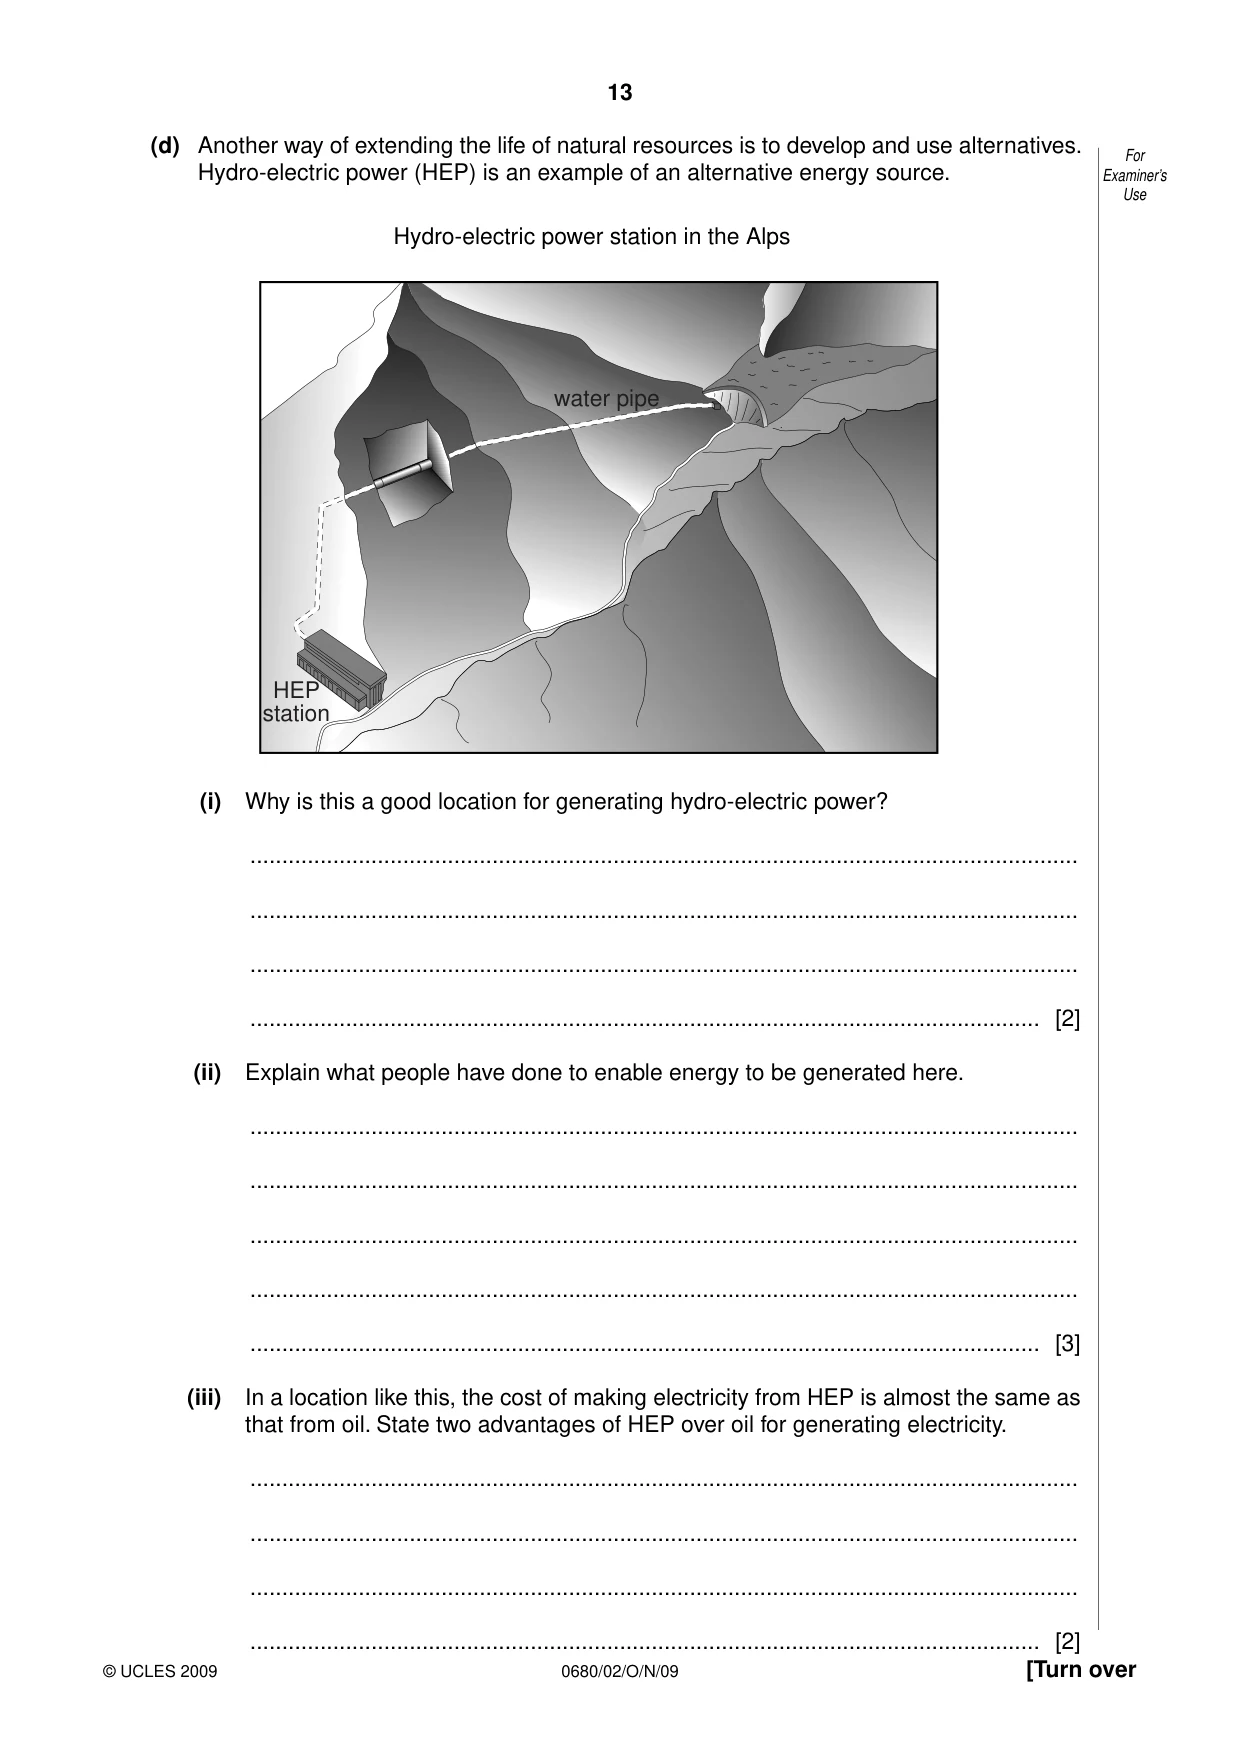
13 0680/02/O/N/09 © UCLES 2009 [Turn over For Examiner’s Use (d) Another way of extending the life of natural resources is to develop and use alternatives. Hydro-electric power (HEP) is an example of an alternative energy source. Hydro-electric power station in the Alps water pipe HEP station (i) Why is this a good location for generating hydro-electric power? … … … … [2] (ii) Explain what people have done to enable energy to be generated here. … … … … … [3] (iii) In a location like this, the cost of making electricity from HEP is almost the same as that from oil. State two advantages of HEP over oil for generating electricity. … … … … [2]
Question paper, page 14
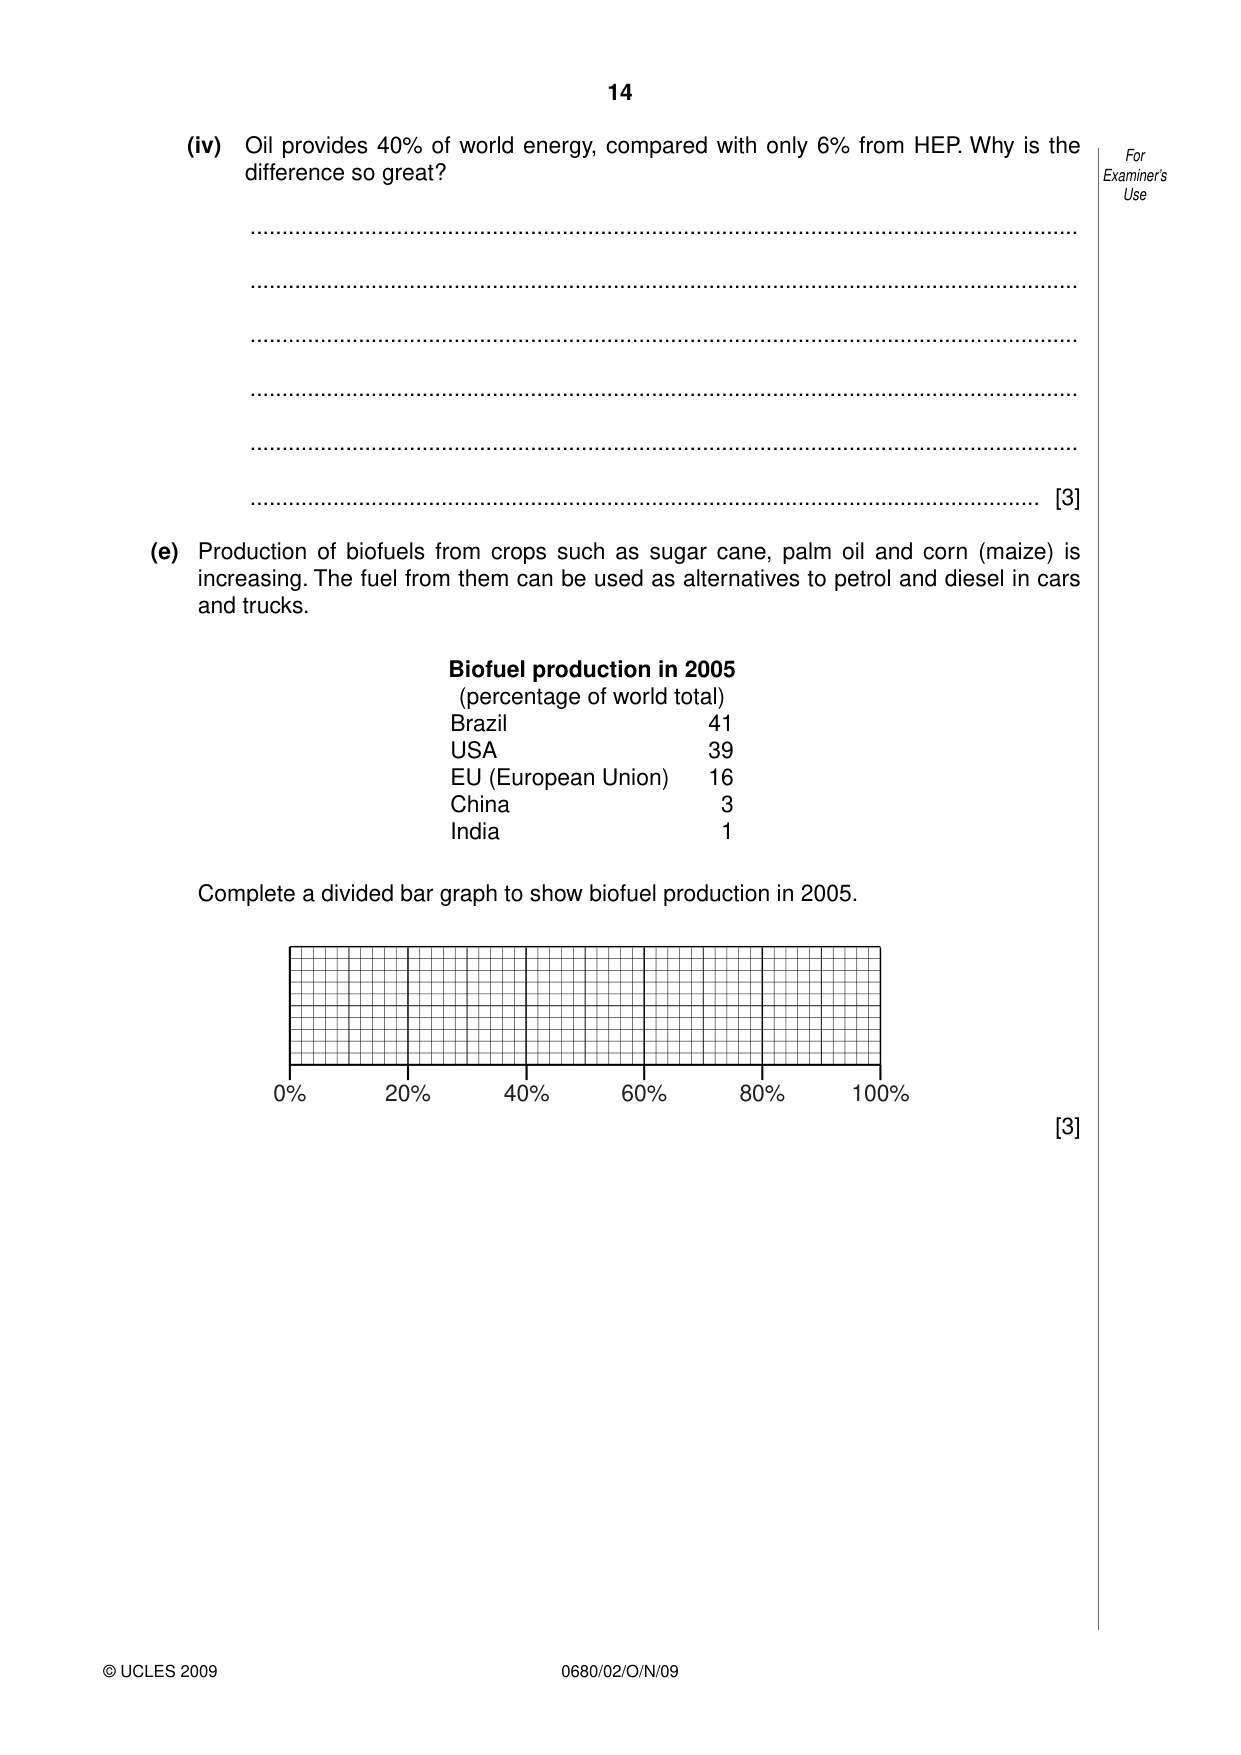
14 0680/02/O/N/09 © UCLES 2009 For Examiner’s Use (iv) Oil provides 40% of world energy, compared with only 6% from HEP. Why is the difference so great? … … … … … … [3] (e) Production of biofuels from crops such as sugar cane, palm oil and corn (maize) is increasing. The fuel from them can be used as alternatives to petrol and diesel in cars and trucks. Biofuel production in 2005 (percentage of world total) Brazil 41 USA 39 EU (European Union) 16 China 3 India 1 Complete a divided bar graph to show biofuel production in 2005. 0% 20% 40% 60% 80% 100% [3]
Question paper, page 15
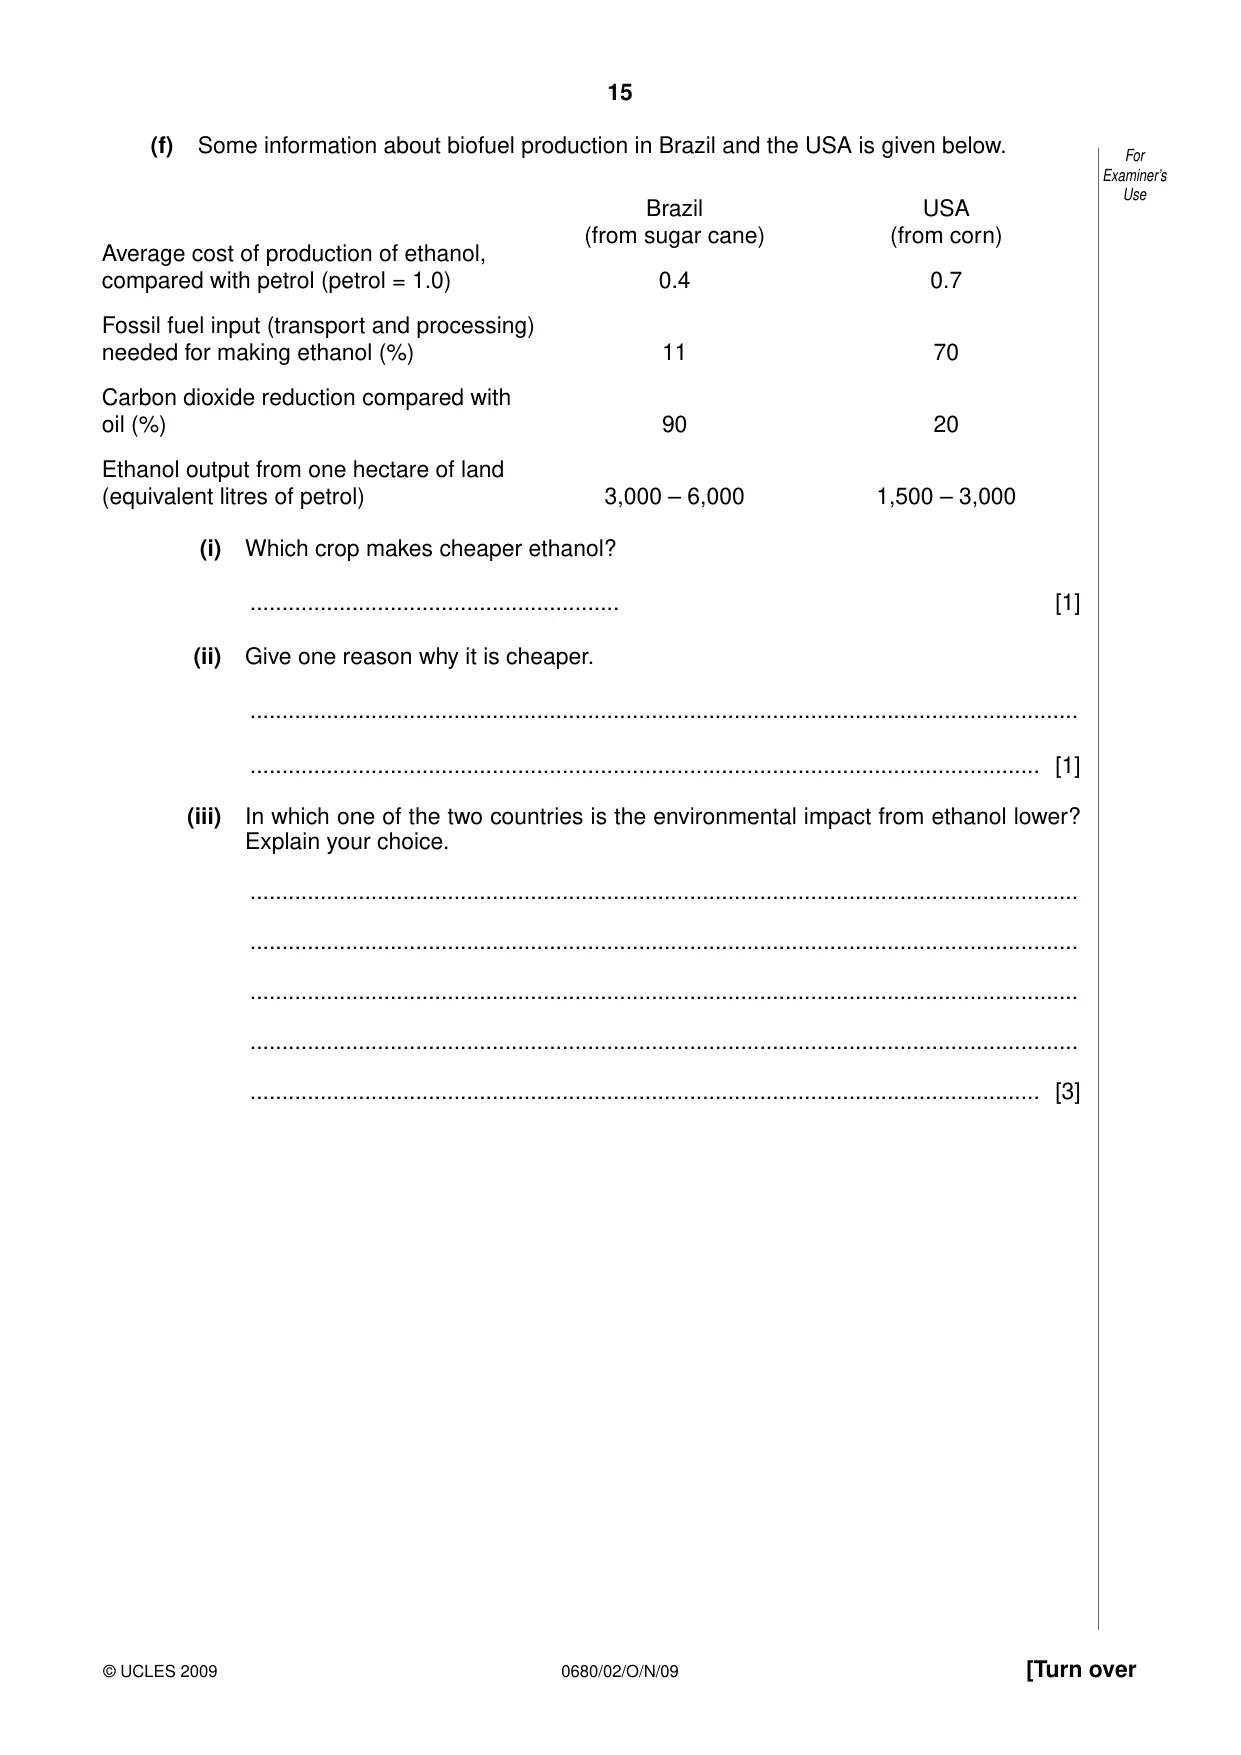
15 0680/02/O/N/09 © UCLES 2009 For Examiner’s Use (f) Some information about biofuel production in Brazil and the USA is given below. Brazil (from sugar cane) USA (from corn) Average cost of production of ethanol, compared with petrol (petrol = 1.0) 0.4 0.7 Fossil fuel input (transport and processing) needed for making ethanol (%) 11 70 Carbon dioxide reduction compared with oil (%) 90 20 Ethanol output from one hectare of land (equivalent litres of petrol) 3,000 – 6,000 1,500 – 3,000 (i) Which crop makes cheaper ethanol? … [1] (ii) Give one reason why it is cheaper. … … [1] (iii) In which one of the two countries is the environmental impact from ethanol lower? Explain your choice. … … … … … [3] [Turn over
Question paper, page 16
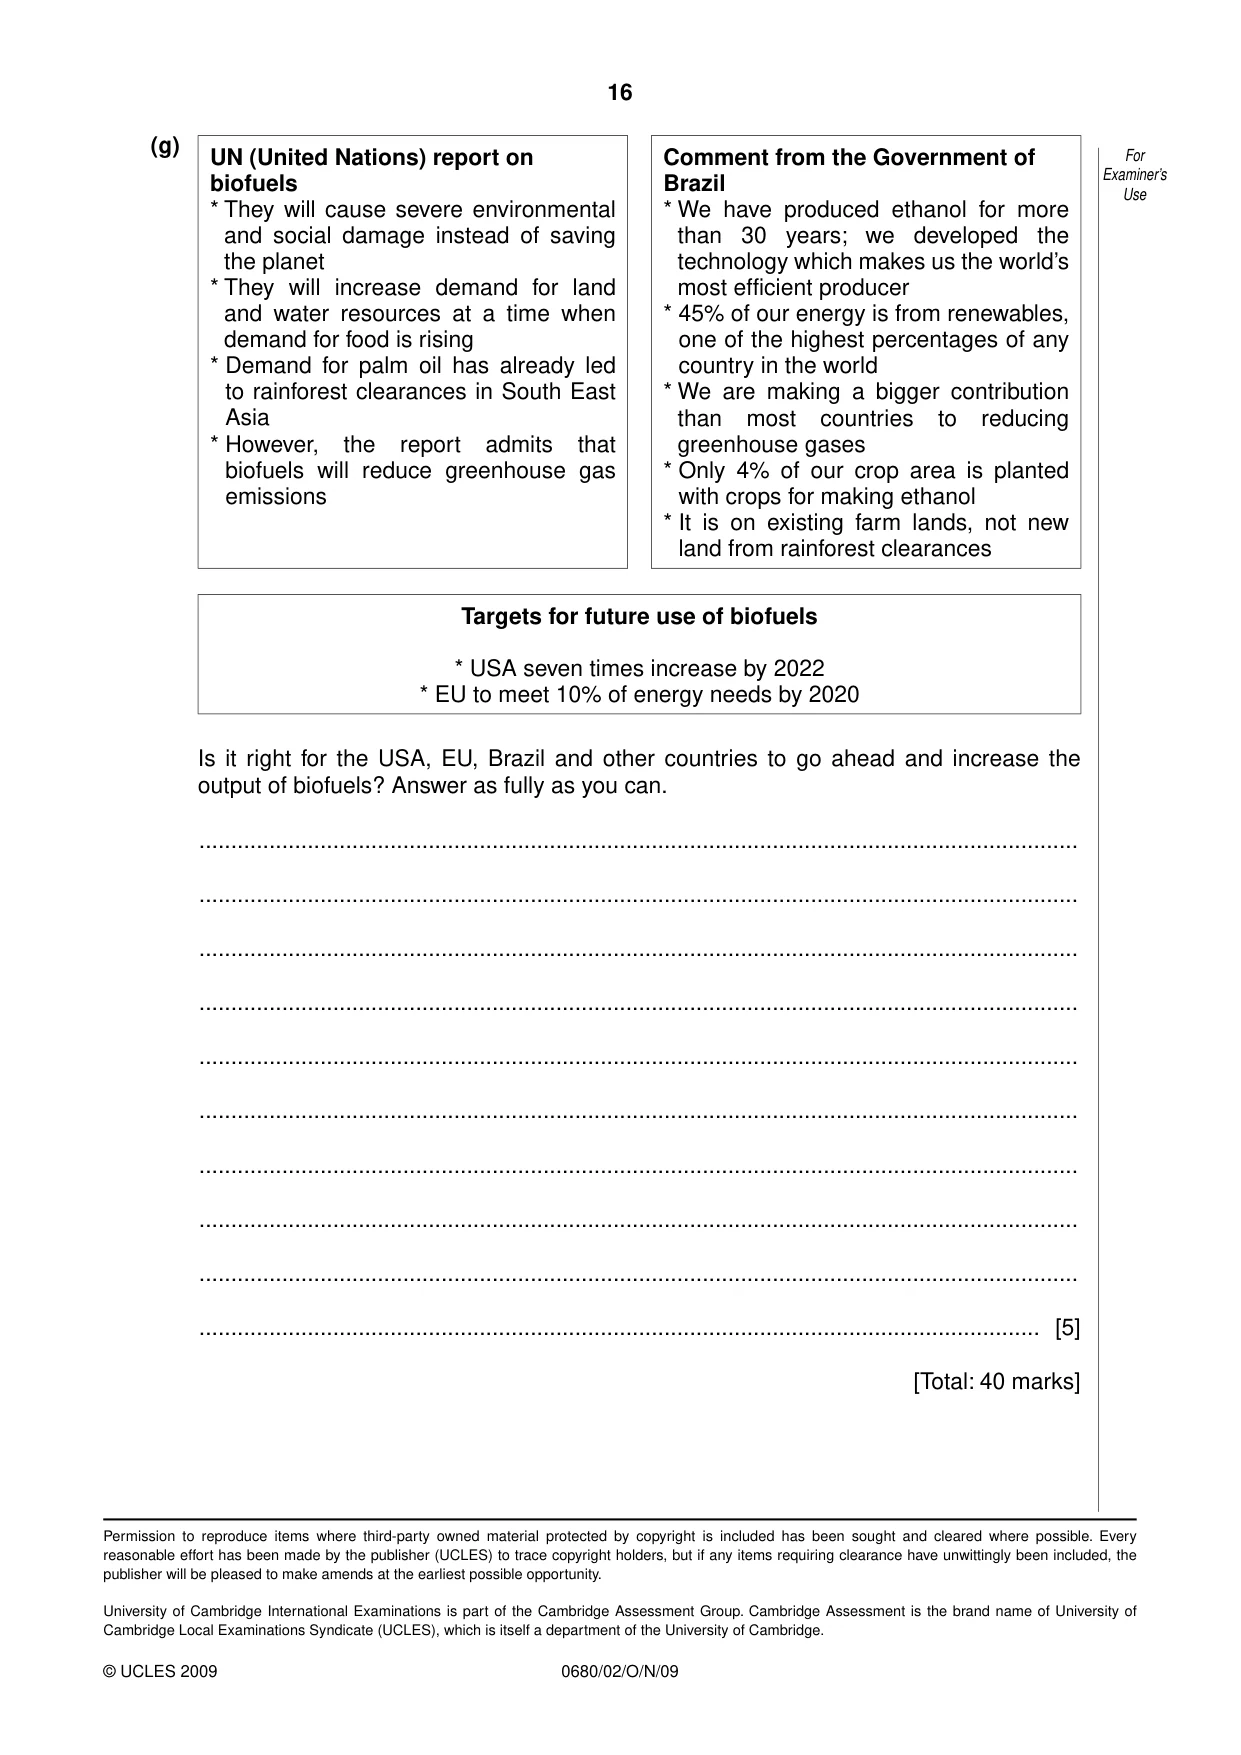
16 0680/02/O/N/09 © UCLES 2009 Permission to reproduce items where third-party owned material protected by copyright is included has been sought and cleared where possible. Every reasonable effort has been made by the publisher (UCLES) to trace copyright holders, but if any items requiring clearance have unwittingly been included, the publisher will be pleased to make amends at the earliest possible opportunity. University of Cambridge International Examinations is part of the Cambridge Assessment Group. Cambridge Assessment is the brand name of University of Cambridge Local Examinations Syndicate (UCLES), which is itself a department of the University of Cambridge. (g) UN (United Nations) report on biofuels * They will cause severe environmental and social damage instead of saving the planet * They will increase demand for land and water resources at a time when demand for food is rising * Demand for palm oil has already led to rainforest clearances in South East Asia * However, the report admits that biofuels will reduce greenhouse gas emissions Comment from the Government of Brazil * We have produced ethanol for more than 30 years; we developed the technology which makes us the world’s most efficient producer * 45% of our energy is from renewables, one of the highest percentages of any country in the world * We are making a bigger contribution than most countries to reducing greenhouse gases * Only 4% of our crop area is planted with crops for making ethanol * It is on existing farm lands, not new land from rainforest clearances Targets for future use of biofuels * USA seven times increase by 2022 * EU to meet 10% of energy needs by 2020 Is it right for the USA, EU, Brazil and other countries to go ahead and increase the output of biofuels? Answer as fully as you can. … … … … … … … … … … [5] [Total: 40 marks] For Examiner’s Use
Mark scheme, page 1
UNIVERSITY OF CAMBRIDGE INTERNATIONAL EXAMINATIONS International General Certificate of Secondary Education MARK SCHEME for the October/November 2009 question paper for the guidance of teachers 0680 ENVIRONMENTAL MANAGEMENT 0680/02 Paper 2, maximum raw mark 80 This mark scheme is published as an aid to teachers and candidates, to indicate the requirements of the examination. It shows the basis on which Examiners were instructed to award marks. It does not indicate the details of the discussions that took place at an Examiners’ meeting before marking began, which would have considered the acceptability of alternative answers. Mark schemes must be read in conjunction with the question papers and the report on the examination. • CIE will not enter into discussions or correspondence in connection with these mark schemes. CIE is publishing the mark schemes for the October/November 2009 question papers for most IGCSE, GCE Advanced Level and Advanced Subsidiary Level syllabuses and some Ordinary Level syllabuses. www.XtremePapers.com
Mark scheme, page 2
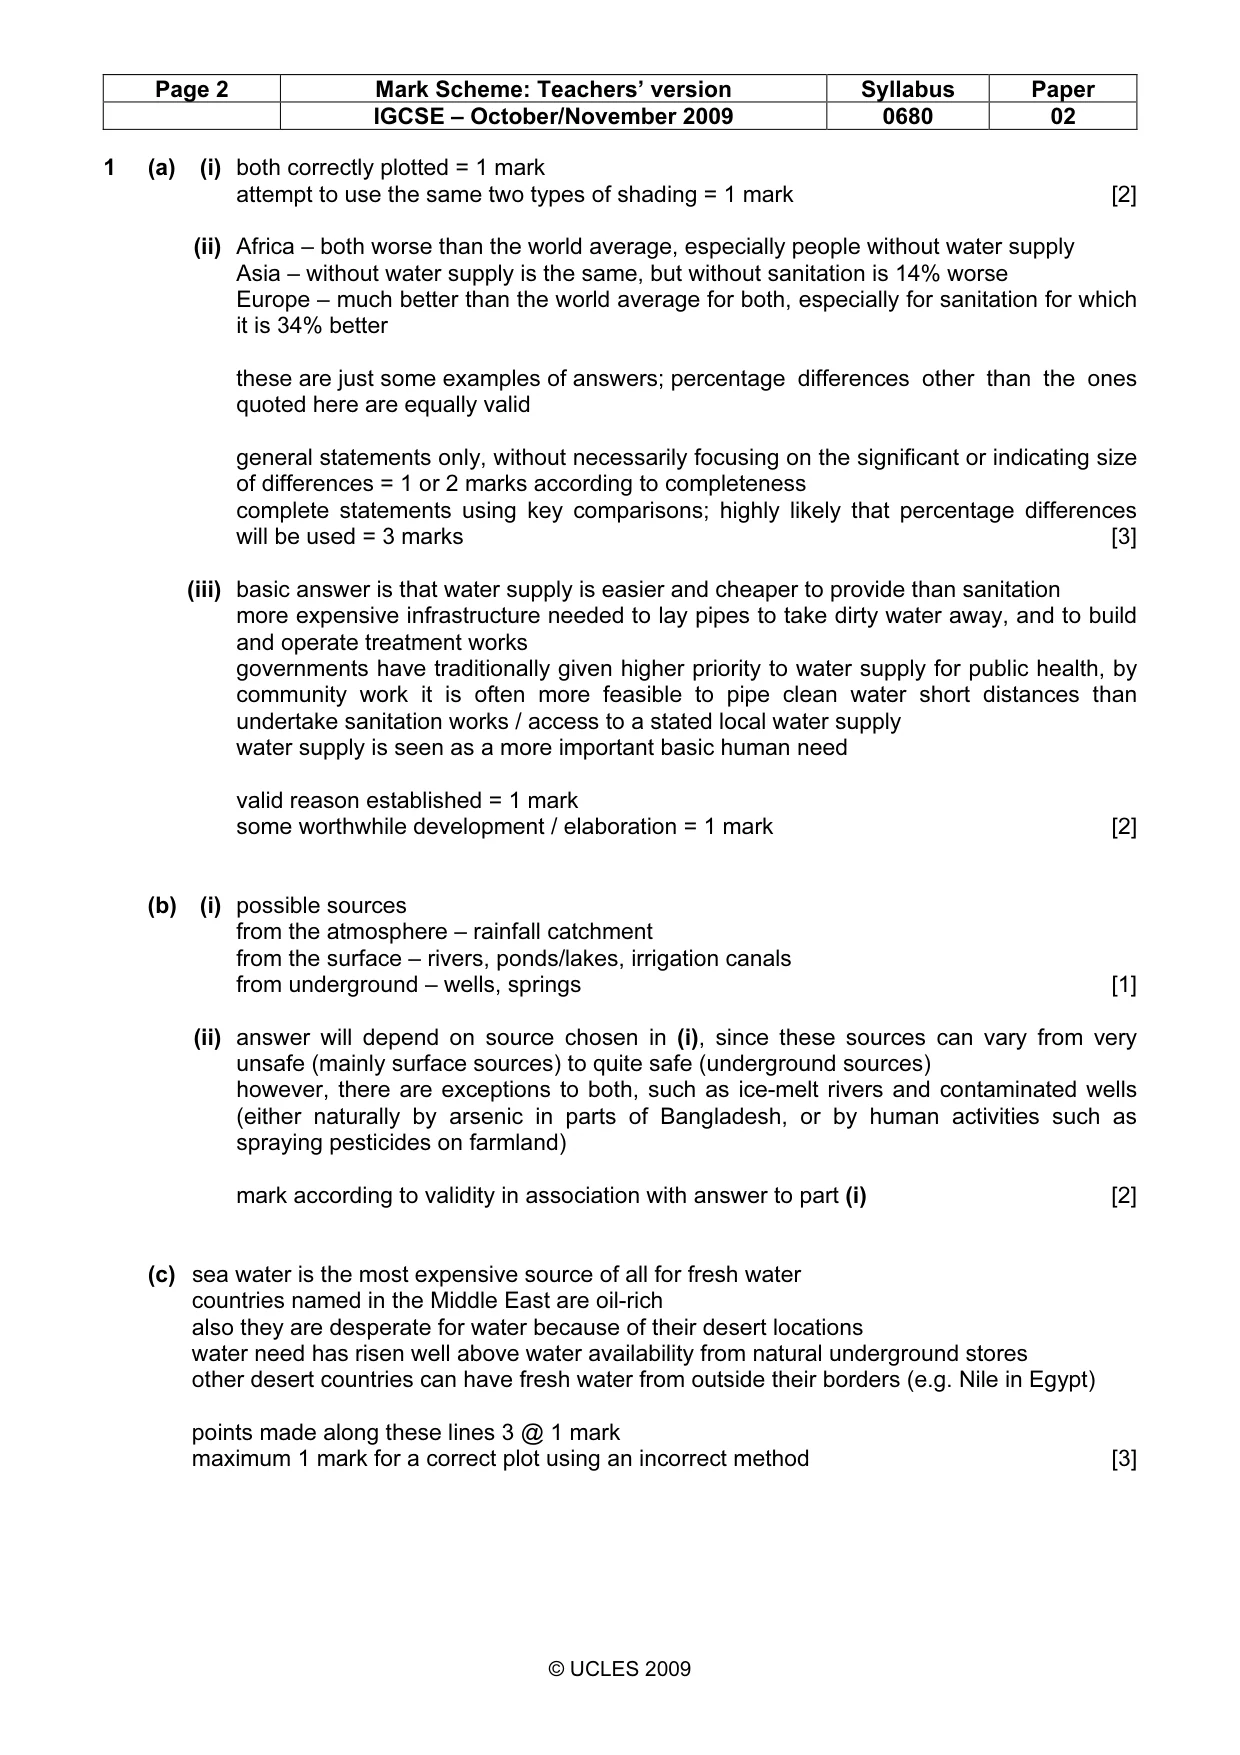
Page 2 Mark Scheme: Teachers’ version Syllabus Paper IGCSE – October/November 2009 0680 02 © UCLES 2009 1 (a) (i) both correctly plotted = 1 mark attempt to use the same two types of shading = 1 mark [2] (ii) Africa – both worse than the world average, especially people without water supply Asia – without water supply is the same, but without sanitation is 14% worse Europe – much better than the world average for both, especially for sanitation for which it is 34% better these are just some examples of answers; percentage differences other than the ones quoted here are equally valid general statements only, without necessarily focusing on the significant or indicating size of differences = 1 or 2 marks according to completeness complete statements using key comparisons; highly likely that percentage differences will be used = 3 marks [3] (iii) basic answer is that water supply is easier and cheaper to provide than sanitation more expensive infrastructure needed to lay pipes to take dirty water away, and to build and operate treatment works governments have traditionally given higher priority to water supply for public health, by community work it is often more feasible to pipe clean water short distances than undertake sanitation works / access to a stated local water supply water supply is seen as a more important basic human need valid reason established = 1 mark some worthwhile development / elaboration = 1 mark [2] (b) (i) possible sources from the atmosphere – rainfall catchment from the surface – rivers, ponds/lakes, irrigation canals from underground – wells, springs [1] (ii) answer will depend on source chosen in (i), since these sources can vary from very unsafe (mainly surface sources) to quite safe (underground sources) however, there are exceptions to both, such as ice-melt rivers and contaminated wells (either naturally by arsenic in parts of Bangladesh, or by human activities such as spraying pesticides on farmland) mark according to validity in association with answer to part (i) [2] (c) sea water is the most expensive source of all for fresh water countries named in the Middle East are oil-rich also they are desperate for water because of their desert locations water need has risen well above water availability from natural underground stores other desert countries can have fresh water from outside their borders (e.g. Nile in Egypt) points made along these lines 3 @ 1 mark maximum 1 mark for a correct plot using an incorrect method [3]
Mark scheme, page 3
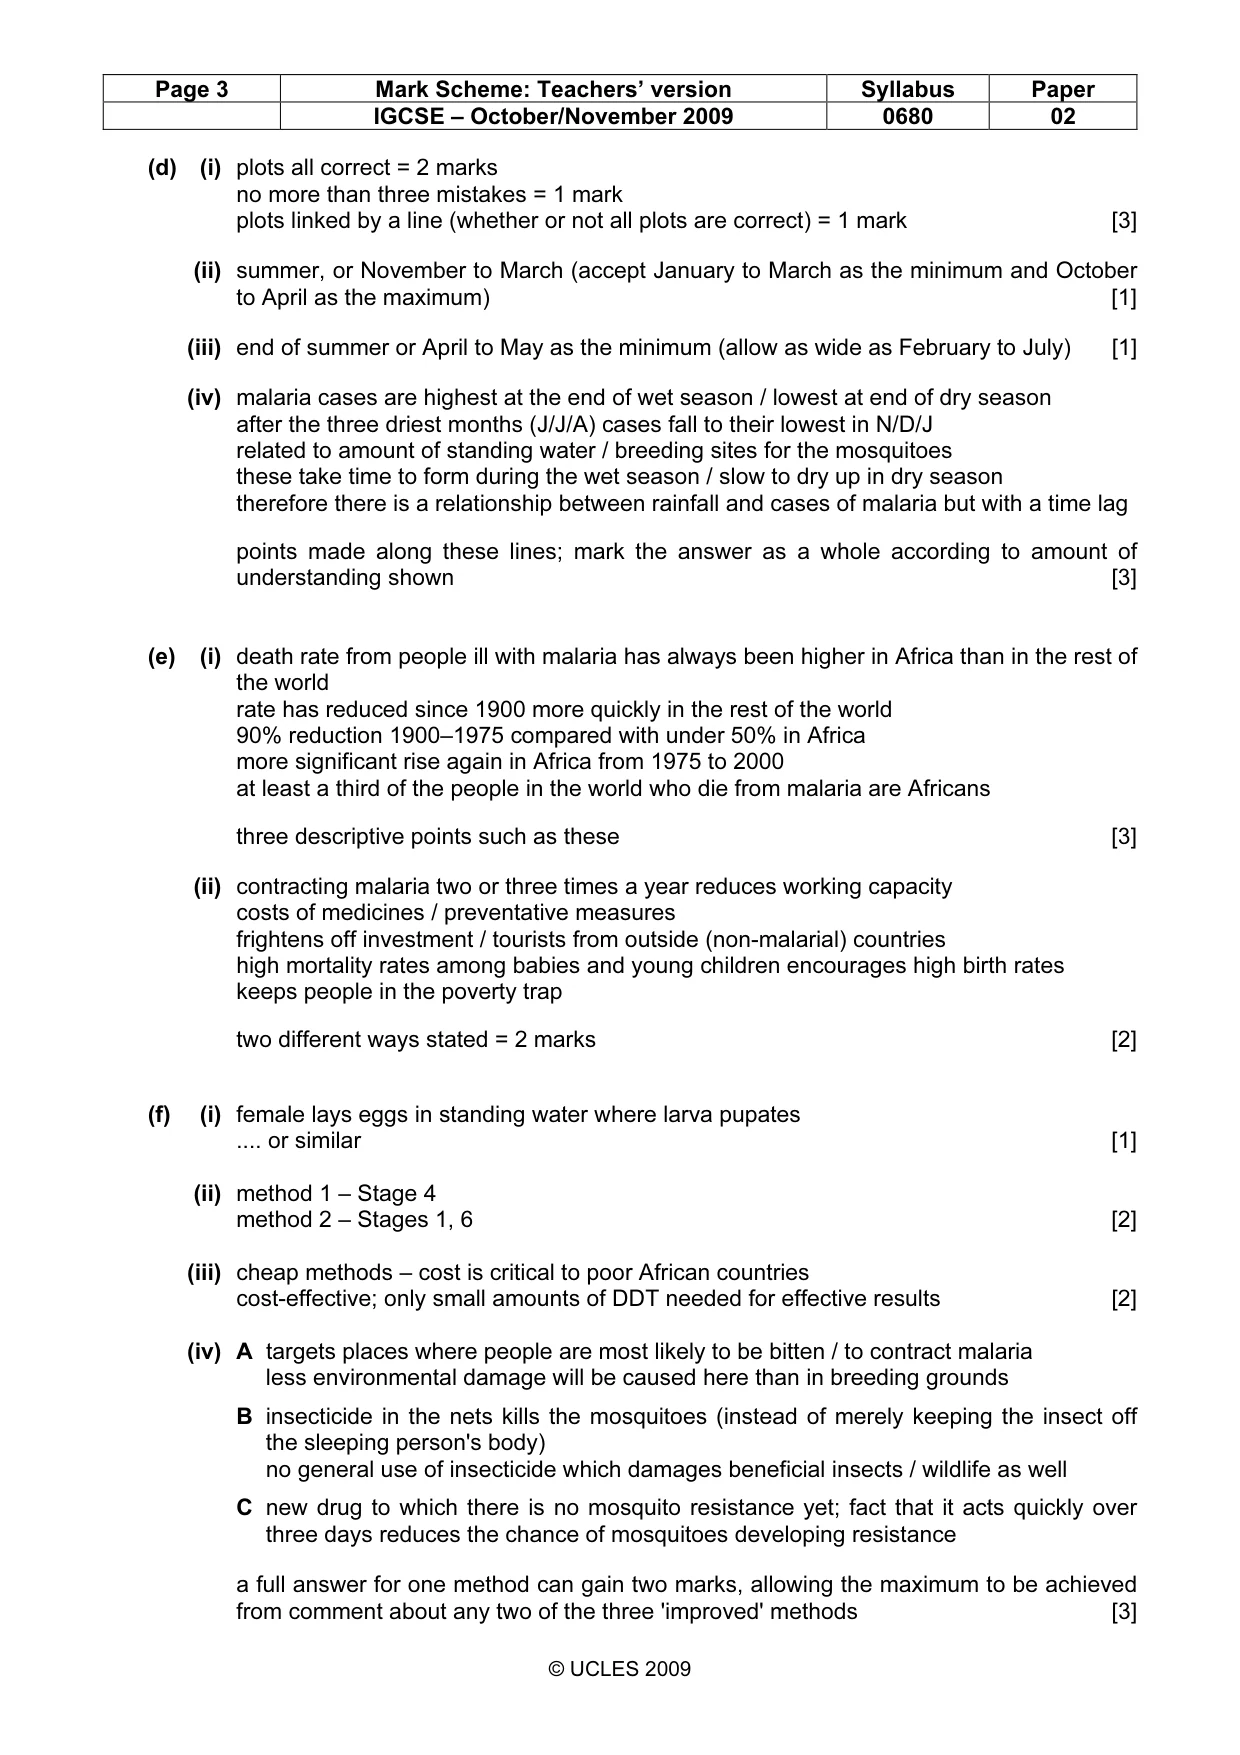
Page 3 Mark Scheme: Teachers’ version Syllabus Paper IGCSE – October/November 2009 0680 02 © UCLES 2009 (d) (i) plots all correct = 2 marks no more than three mistakes = 1 mark plots linked by a line (whether or not all plots are correct) = 1 mark [3] (ii) summer, or November to March (accept January to March as the minimum and October to April as the maximum) [1] (iii) end of summer or April to May as the minimum (allow as wide as February to July) [1] (iv) malaria cases are highest at the end of wet season / lowest at end of dry season after the three driest months (J/J/A) cases fall to their lowest in N/D/J related to amount of standing water / breeding sites for the mosquitoes these take time to form during the wet season / slow to dry up in dry season therefore there is a relationship between rainfall and cases of malaria but with a time lag points made along these lines; mark the answer as a whole according to amount of understanding shown [3] (e) (i) death rate from people ill with malaria has always been higher in Africa than in the rest of the world rate has reduced since 1900 more quickly in the rest of the world 90% reduction 1900–1975 compared with under 50% in Africa more significant rise again in Africa from 1975 to 2000 at least a third of the people in the world who die from malaria are Africans three descriptive points such as these [3] (ii) contracting malaria two or three times a year reduces working capacity costs of medicines / preventative measures frightens off investment / tourists from outside (non-malarial) countries high mortality rates among babies and young children encourages high birth rates keeps people in the poverty trap two different ways stated = 2 marks [2] (f) (i) female lays eggs in standing water where larva pupates … or similar [1] (ii) method 1 – Stage 4 method 2 – Stages 1, 6 [2] (iii) cheap methods – cost is critical to poor African countries cost-effective; only small amounts of DDT needed for effective results [2] (iv) A targets places where people are most likely to be bitten / to contract malaria less environmental damage will be caused here than in breeding grounds B insecticide in the nets kills the mosquitoes (instead of merely keeping the insect off the sleeping person's body) no general use of insecticide which damages beneficial insects / wildlife as well C new drug to which there is no mosquito resistance yet; fact that it acts quickly over three days reduces the chance of mosquitoes developing resistance a full answer for one method can gain two marks, allowing the maximum to be achieved from comment about any two of the three 'improved' methods [3]
Mark scheme, page 4
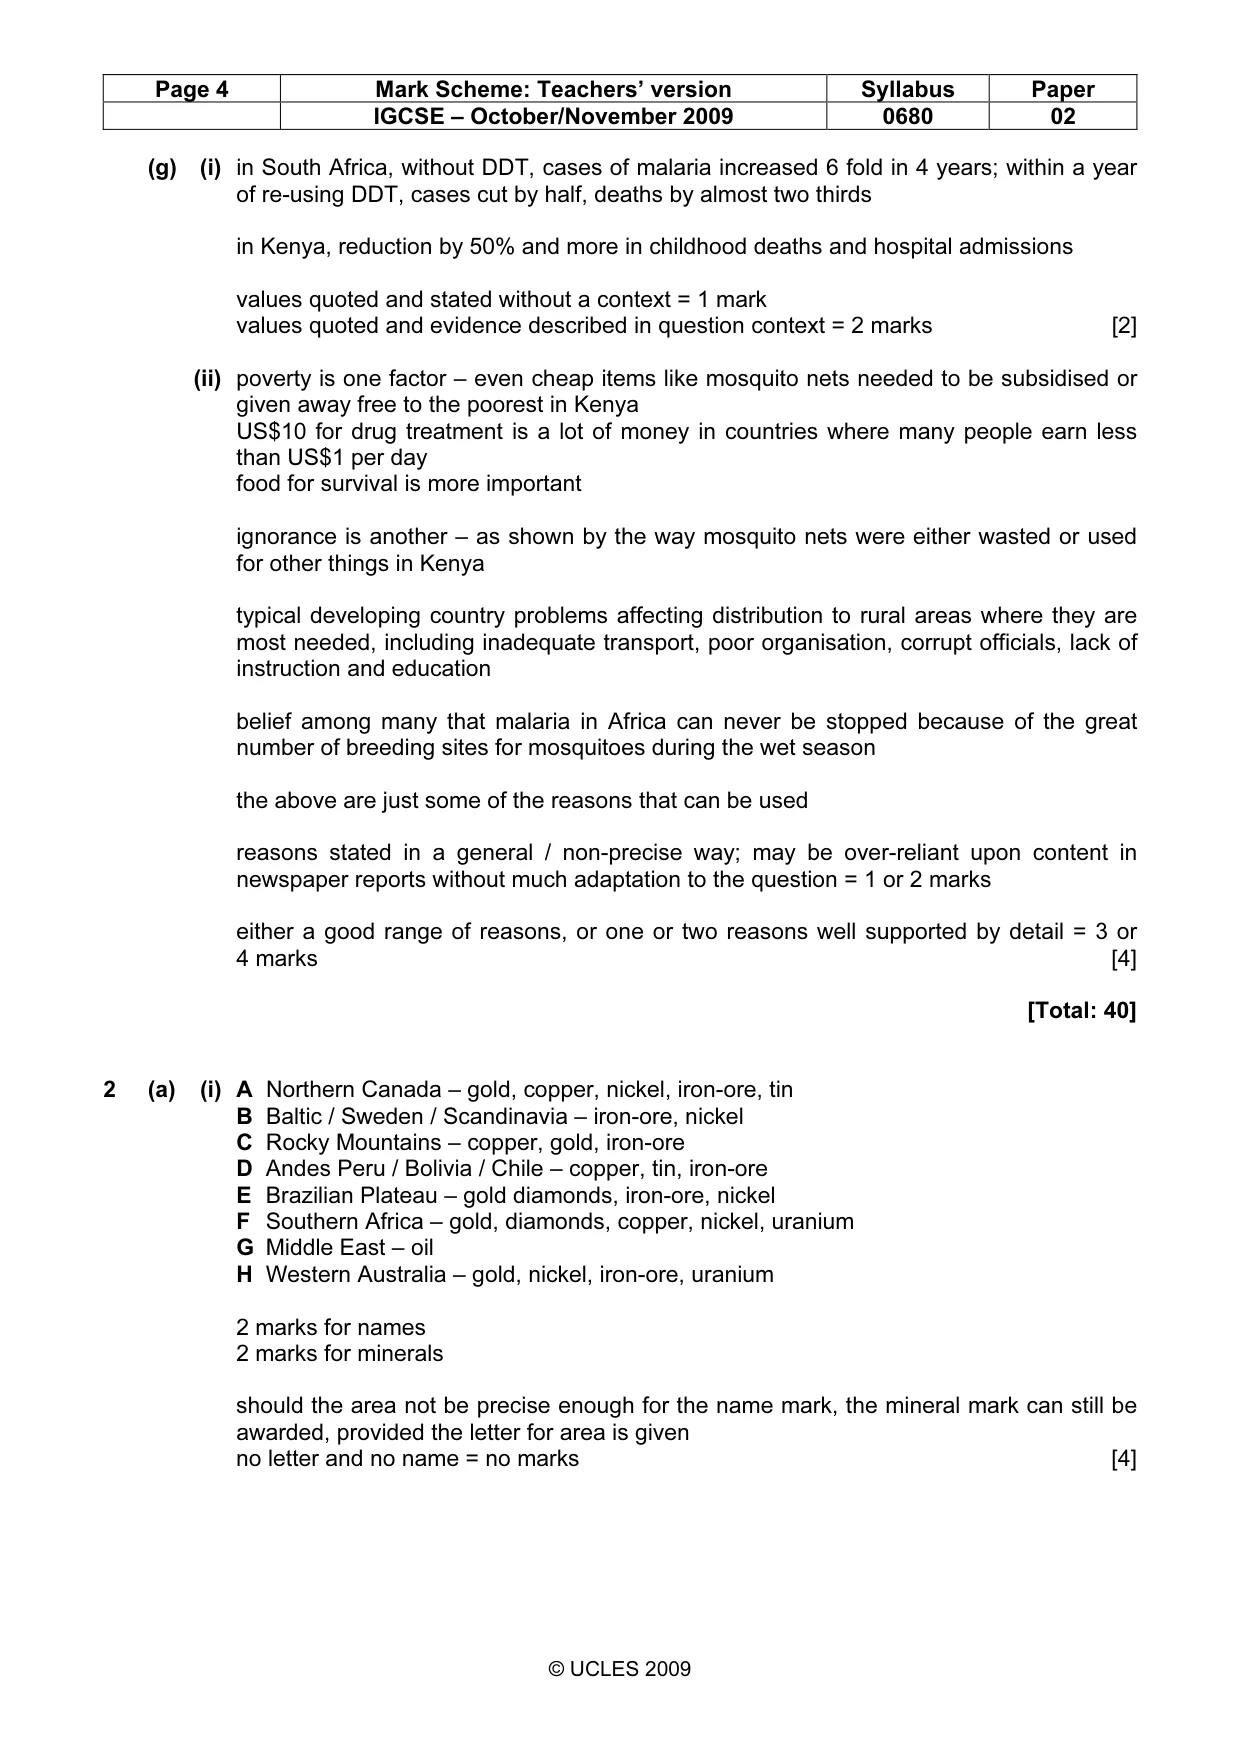
Page 4 Mark Scheme: Teachers’ version Syllabus Paper IGCSE – October/November 2009 0680 02 © UCLES 2009 (g) (i) in South Africa, without DDT, cases of malaria increased 6 fold in 4 years; within a year of re-using DDT, cases cut by half, deaths by almost two thirds in Kenya, reduction by 50% and more in childhood deaths and hospital admissions values quoted and stated without a context = 1 mark values quoted and evidence described in question context = 2 marks [2] (ii) poverty is one factor – even cheap items like mosquito nets needed to be subsidised or given away free to the poorest in Kenya US$10 for drug treatment is a lot of money in countries where many people earn less than US$1 per day food for survival is more important ignorance is another – as shown by the way mosquito nets were either wasted or used for other things in Kenya typical developing country problems affecting distribution to rural areas where they are most needed, including inadequate transport, poor organisation, corrupt officials, lack of instruction and education belief among many that malaria in Africa can never be stopped because of the great number of breeding sites for mosquitoes during the wet season the above are just some of the reasons that can be used reasons stated in a general / non-precise way; may be over-reliant upon content in newspaper reports without much adaptation to the question = 1 or 2 marks either a good range of reasons, or one or two reasons well supported by detail = 3 or 4 marks [4] [Total: 40] 2 (a) (i) A Northern Canada – gold, copper, nickel, iron-ore, tin B Baltic / Sweden / Scandinavia – iron-ore, nickel C Rocky Mountains – copper, gold, iron-ore D Andes Peru / Bolivia / Chile – copper, tin, iron-ore E Brazilian Plateau – gold diamonds, iron-ore, nickel F Southern Africa – gold, diamonds, copper, nickel, uranium G Middle East – oil H Western Australia – gold, nickel, iron-ore, uranium 2 marks for names 2 marks for minerals should the area not be precise enough for the name mark, the mineral mark can still be awarded, provided the letter for area is given no letter and no name = no marks [4]
Mark scheme, page 5
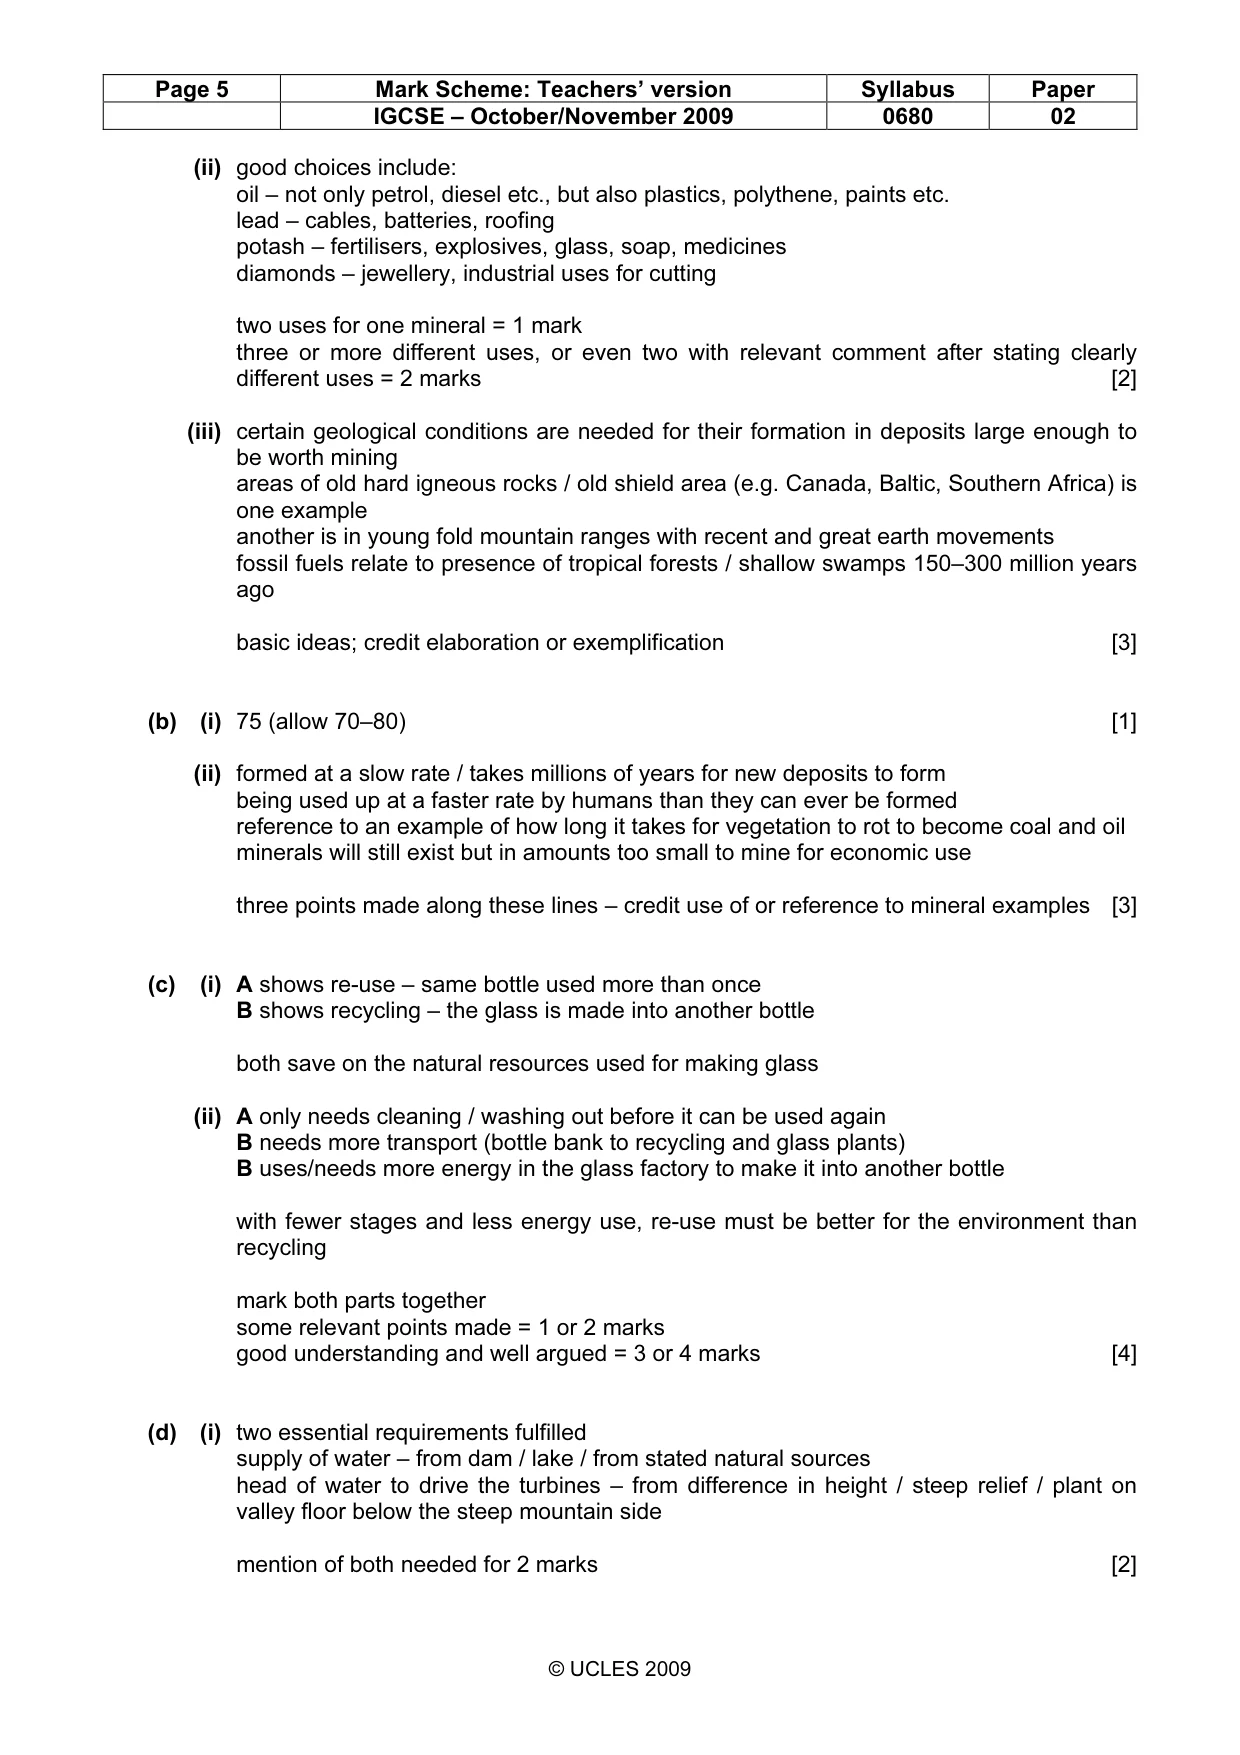
Page 5 Mark Scheme: Teachers’ version Syllabus Paper IGCSE – October/November 2009 0680 02 © UCLES 2009 (ii) good choices include: oil – not only petrol, diesel etc., but also plastics, polythene, paints etc. lead – cables, batteries, roofing potash – fertilisers, explosives, glass, soap, medicines diamonds – jewellery, industrial uses for cutting two uses for one mineral = 1 mark three or more different uses, or even two with relevant comment after stating clearly different uses = 2 marks [2] (iii) certain geological conditions are needed for their formation in deposits large enough to be worth mining areas of old hard igneous rocks / old shield area (e.g. Canada, Baltic, Southern Africa) is one example another is in young fold mountain ranges with recent and great earth movements fossil fuels relate to presence of tropical forests / shallow swamps 150–300 million years ago basic ideas; credit elaboration or exemplification [3] (b) (i) 75 (allow 70–80) [1] (ii) formed at a slow rate / takes millions of years for new deposits to form being used up at a faster rate by humans than they can ever be formed reference to an example of how long it takes for vegetation to rot to become coal and oil minerals will still exist but in amounts too small to mine for economic use three points made along these lines – credit use of or reference to mineral examples [3] (c) (i) A shows re-use – same bottle used more than once B shows recycling – the glass is made into another bottle both save on the natural resources used for making glass (ii) A only needs cleaning / washing out before it can be used again B needs more transport (bottle bank to recycling and glass plants) B uses/needs more energy in the glass factory to make it into another bottle with fewer stages and less energy use, re-use must be better for the environment than recycling mark both parts together some relevant points made = 1 or 2 marks good understanding and well argued = 3 or 4 marks [4] (d) (i) two essential requirements fulfilled supply of water – from dam / lake / from stated natural sources head of water to drive the turbines – from difference in height / steep relief / plant on valley floor below the steep mountain side mention of both needed for 2 marks [2]
Mark scheme, page 6
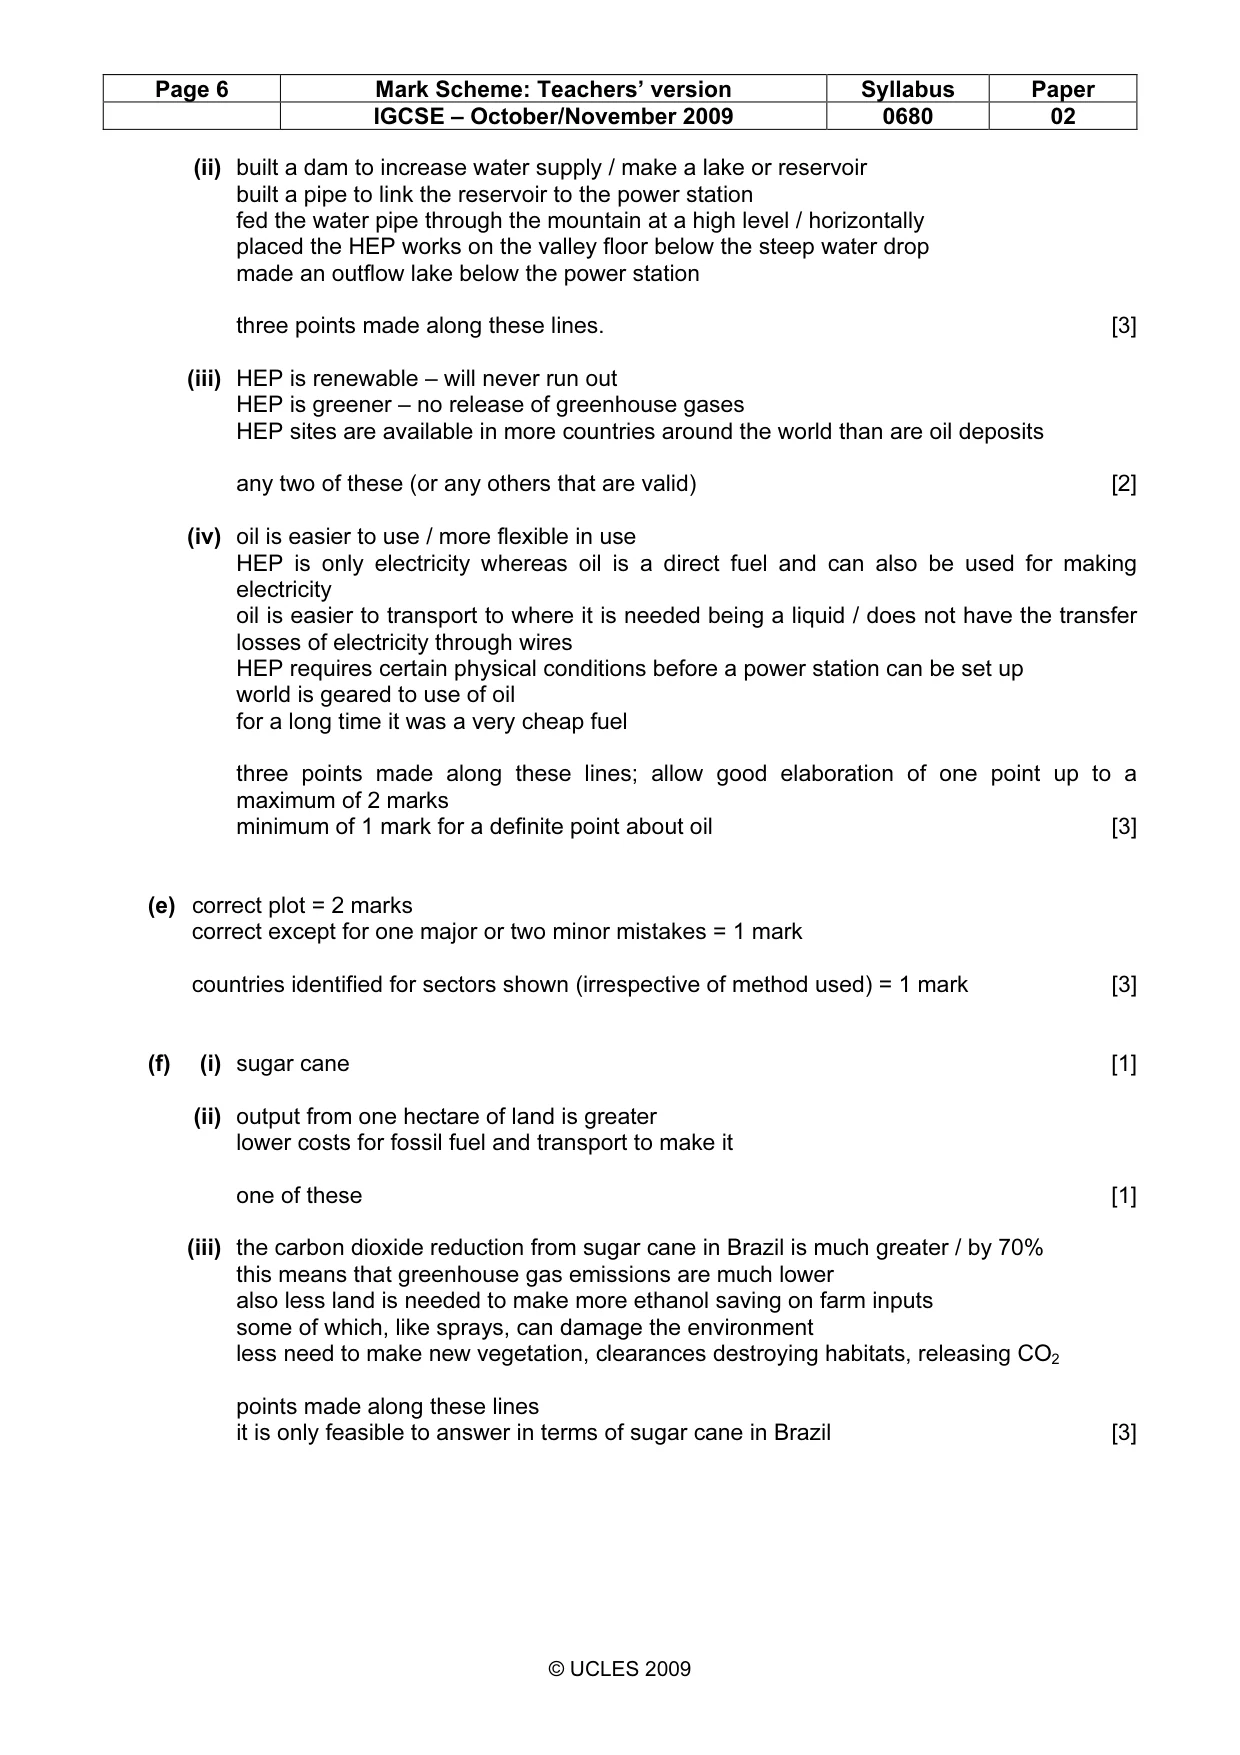
Page 6 Mark Scheme: Teachers’ version Syllabus Paper IGCSE – October/November 2009 0680 02 © UCLES 2009 (ii) built a dam to increase water supply / make a lake or reservoir built a pipe to link the reservoir to the power station fed the water pipe through the mountain at a high level / horizontally placed the HEP works on the valley floor below the steep water drop made an outflow lake below the power station three points made along these lines. [3] (iii) HEP is renewable – will never run out HEP is greener – no release of greenhouse gases HEP sites are available in more countries around the world than are oil deposits any two of these (or any others that are valid) [2] (iv) oil is easier to use / more flexible in use HEP is only electricity whereas oil is a direct fuel and can also be used for making electricity oil is easier to transport to where it is needed being a liquid / does not have the transfer losses of electricity through wires HEP requires certain physical conditions before a power station can be set up world is geared to use of oil for a long time it was a very cheap fuel three points made along these lines; allow good elaboration of one point up to a maximum of 2 marks minimum of 1 mark for a definite point about oil [3] (e) correct plot = 2 marks correct except for one major or two minor mistakes = 1 mark countries identified for sectors shown (irrespective of method used) = 1 mark [3] (f) (i) sugar cane [1] (ii) output from one hectare of land is greater lower costs for fossil fuel and transport to make it one of these [1] (iii) the carbon dioxide reduction from sugar cane in Brazil is much greater / by 70% this means that greenhouse gas emissions are much lower also less land is needed to make more ethanol saving on farm inputs some of which, like sprays, can damage the environment less need to make new vegetation, clearances destroying habitats, releasing CO2 points made along these lines it is only feasible to answer in terms of sugar cane in Brazil [3]
Mark scheme, page 7
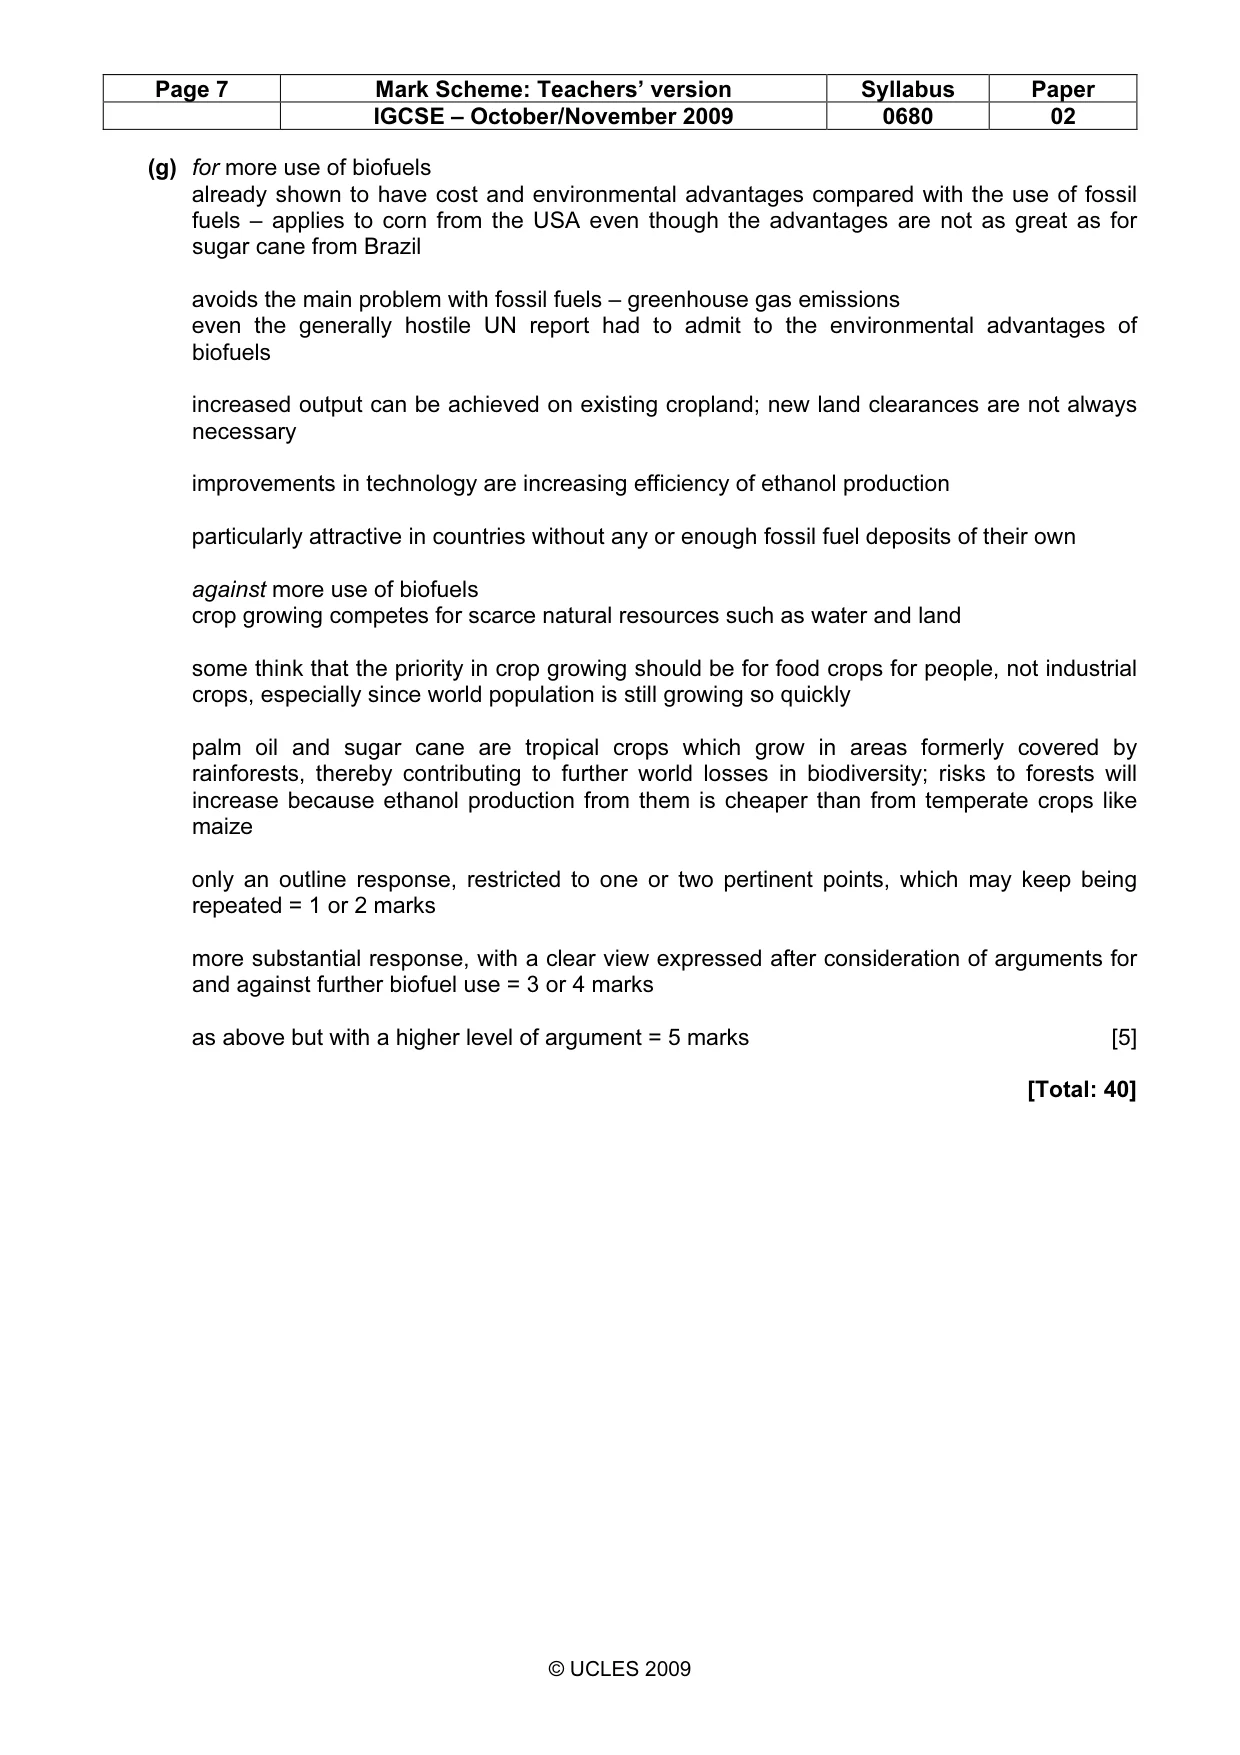
Page 7 Mark Scheme: Teachers’ version Syllabus Paper IGCSE – October/November 2009 0680 02 © UCLES 2009 (g) for more use of biofuels already shown to have cost and environmental advantages compared with the use of fossil fuels – applies to corn from the USA even though the advantages are not as great as for sugar cane from Brazil avoids the main problem with fossil fuels – greenhouse gas emissions even the generally hostile UN report had to admit to the environmental advantages of biofuels increased output can be achieved on existing cropland; new land clearances are not always necessary improvements in technology are increasing efficiency of ethanol production particularly attractive in countries without any or enough fossil fuel deposits of their own against more use of biofuels crop growing competes for scarce natural resources such as water and land some think that the priority in crop growing should be for food crops for people, not industrial crops, especially since world population is still growing so quickly palm oil and sugar cane are tropical crops which grow in areas formerly covered by rainforests, thereby contributing to further world losses in biodiversity; risks to forests will increase because ethanol production from them is cheaper than from temperate crops like maize only an outline response, restricted to one or two pertinent points, which may keep being repeated = 1 or 2 marks more substantial response, with a clear view expressed after consideration of arguments for and against further biofuel use = 3 or 4 marks as above but with a higher level of argument = 5 marks [5] [Total: 40]
What you needed in this session
Cambridge’s own grade thresholds for 2009 Oct/Nov, Paper 2 · Variant 1. A higher threshold means an easier paper — the bar moves with how the cohort did.