Cambridge IGCSE Environmental Management 0680 — 2009 May/June Paper 2 · Variant 1
0680/21/M/J/09 · 80 marks · ≈90 min
The question paper and its mark scheme, free to read here and free to download. This is Cambridge’s own paper, exactly as it was sat.
Question paper20 pages



Mark scheme10 pages
Answers below. Sit the paper first if you are practising.
Paper as text
Question paper, page 1
This document consists of 17 printed pages and 3 blank pages. SPA (SHW 00245 4/08) T72284/2 © UCLES 2009 [Turn over UNIVERSITY OF CAMBRIDGE INTERNATIONAL EXAMINATIONS International General Certificate of Secondary Education READ THESE INSTRUCTIONS FIRST Write your Centre number, candidate number and name on all the work you hand in. Write in dark blue or black pen. You may use a soft pencil for any diagrams, graphs or rough working. Do not use staples, paper clips, highlighters, glue or correction fluid. DO NOT WRITE IN ANY BARCODES. Answer both questions. At the end of the examination, fasten all your work securely together. The number of marks is given in brackets [ ] at the end of each question or part question. * 5 8 2 7 1 5 3 8 5 0 * ENVIRONMENTAL MANAGEMENT 0680/02 Paper 2 May/June 2009 1 hour 45 minutes Candidates answer on the Question Paper. Additional Materials: Ruler For Examiner’s Use 1 2 Total www.XtremePapers.com
Question paper, page 2
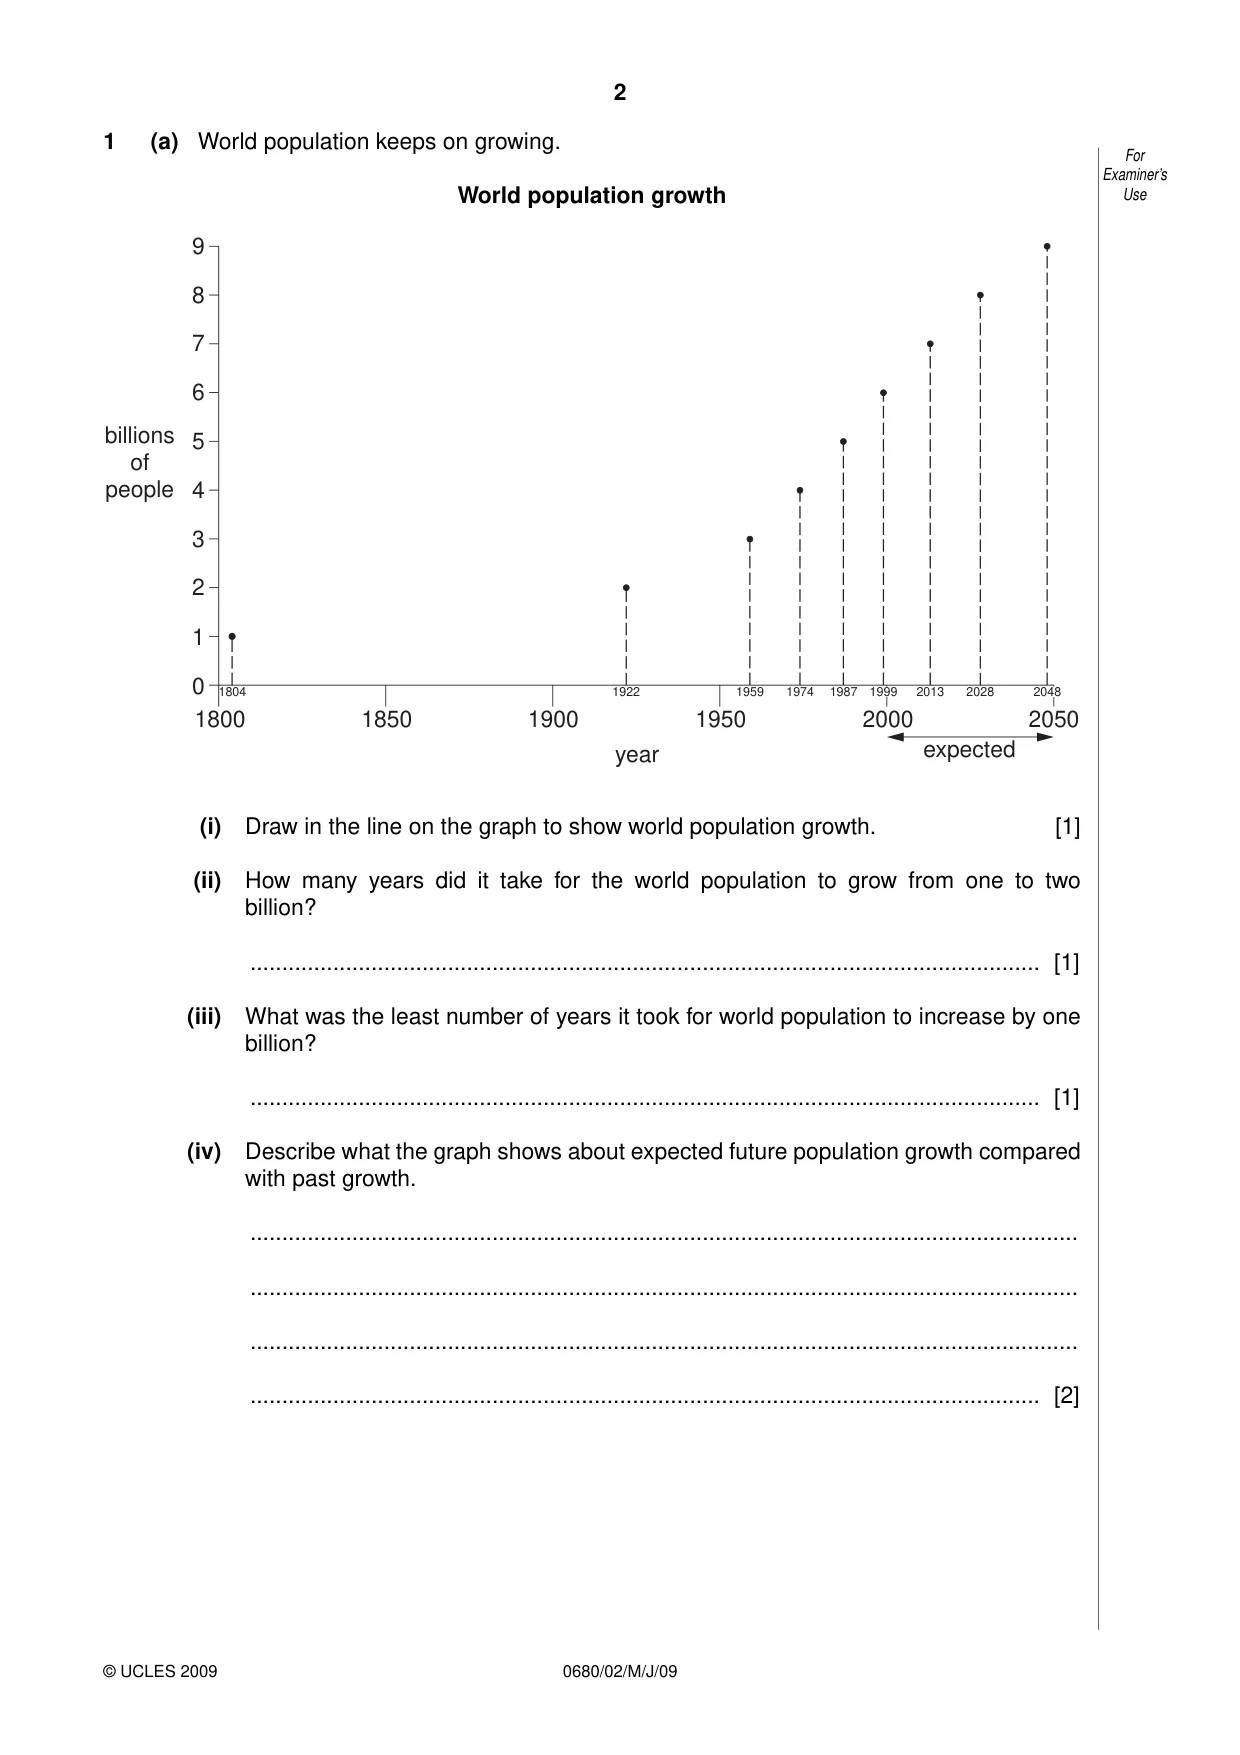
2 0680/02/M/J/09 © UCLES 2009 For Examiner’s Use 1 (a) World population keeps on growing. World population growth billions of people 2050 2000 1950 1900 year expected 1850 1804 1922 1959 1974 1987 2013 2028 1800 0 1 2 3 4 5 6 7 8 9 1999 2048 (i) Draw in the line on the graph to show world population growth. [1] (ii) How many years did it take for the world population to grow from one to two billion? … [1] (iii) What was the least number of years it took for world population to increase by one billion? … [1] (iv) Describe what the graph shows about expected future population growth compared with past growth. … … … … [2]
Question paper, page 3
3 0680/02/M/J/09 [Turn over © UCLES 2009 For Examiner’s Use (b) Some countries have population policies to reduce rates of population growth. (i) Name one country which has a population policy. … (ii) Describe its main features. … … … … … (iii) Comment on whether or not it has been successful. … … … [5] (c) State two reasons why governments in some developing countries have not introduced a population policy. … … … … [2]
Question paper, page 4
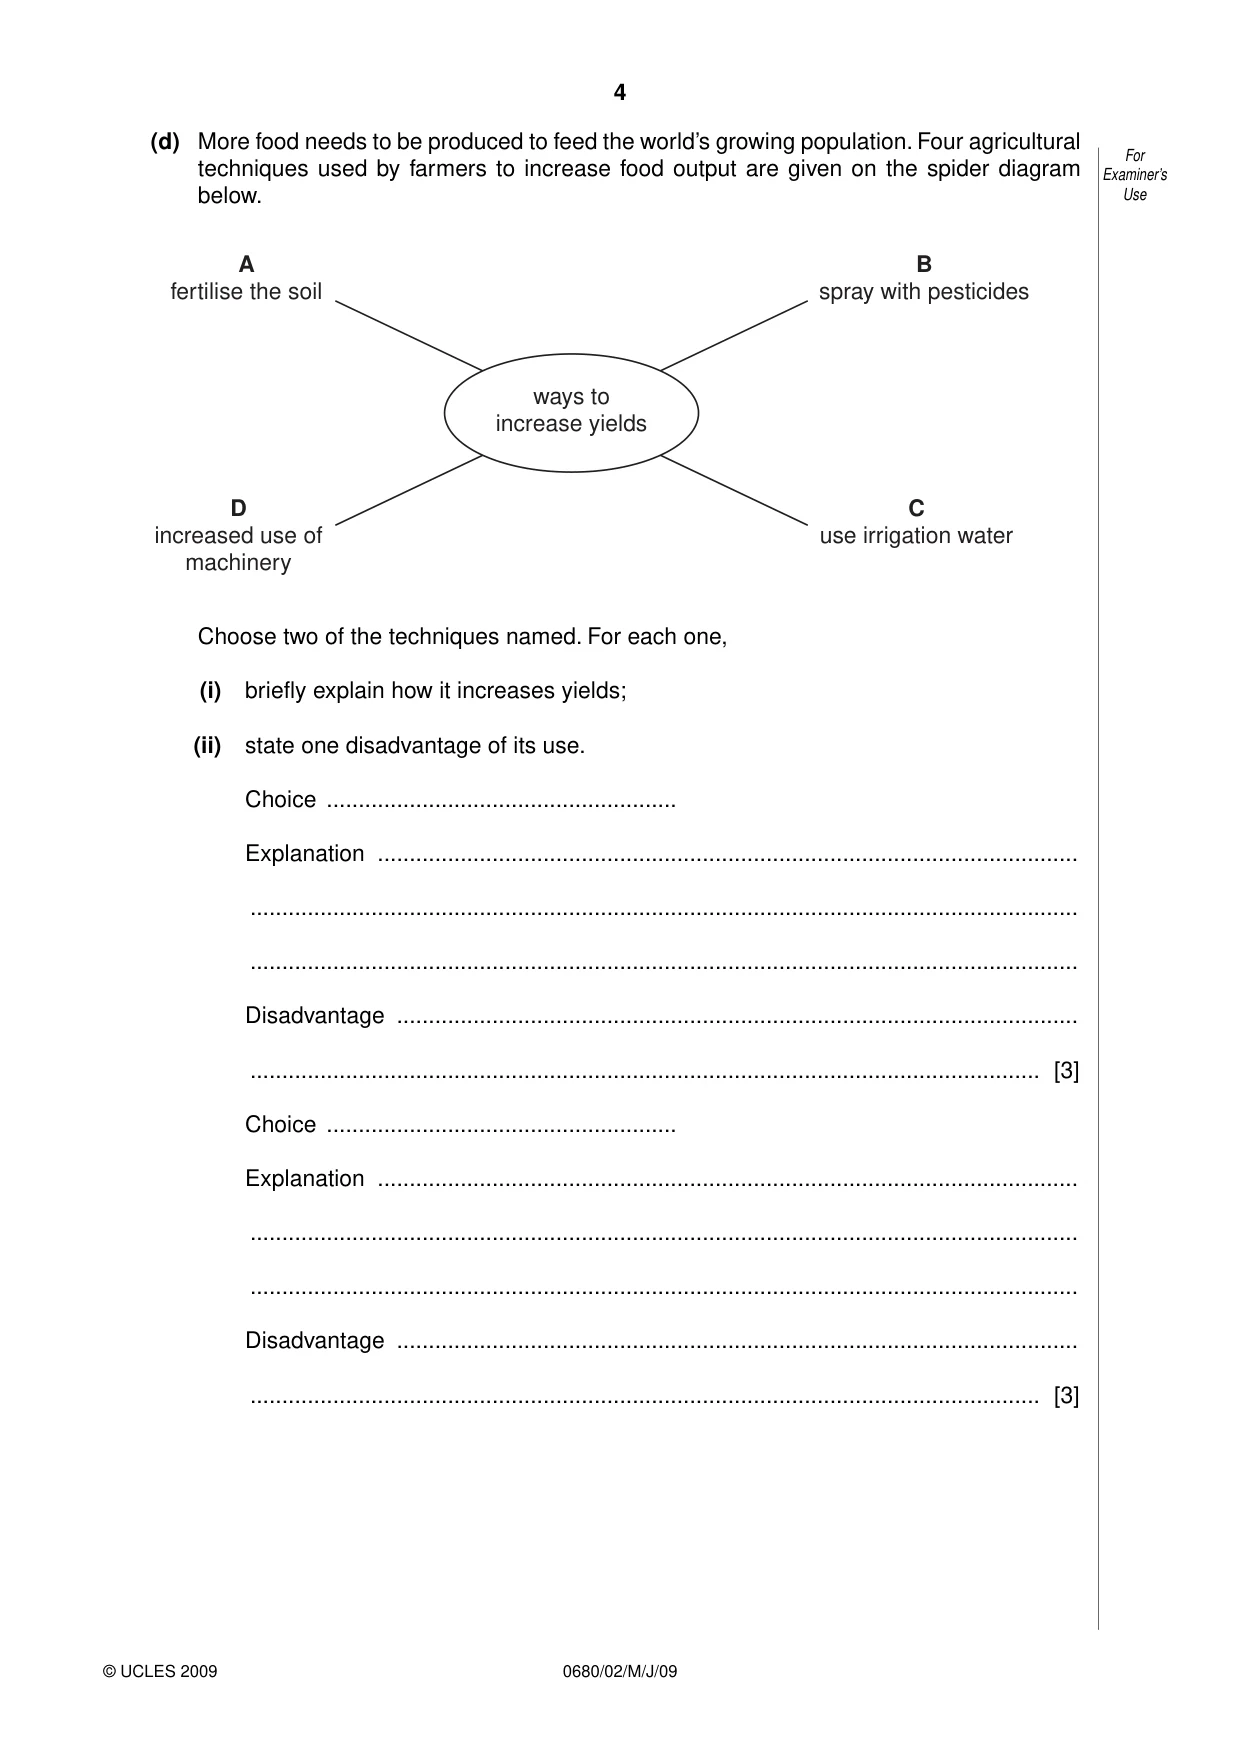
4 0680/02/M/J/09 © UCLES 2009 For Examiner’s Use (d) More food needs to be produced to feed the world’s growing population. Four agricultural techniques used by farmers to increase food output are given on the spider diagram below. ways to increase yields A fertilise the soil B spray with pesticides D increased use of machinery C use irrigation water Choose two of the techniques named. For each one, (i) briefly explain how it increases yields; (ii) state one disadvantage of its use. Choice … Explanation … … … Disadvantage … … [3] Choice … Explanation … … … Disadvantage … … [3]
Question paper, page 5
5 0680/02/M/J/09 [Turn over © UCLES 2009 For Examiner’s Use (e) Another way of increasing farm yield is to use new seeds. Sowing the seeds of change In 1959 researchers in the Philippines cross-bred two rice plants: a semi-dwarf plant from China with a strong, tall Indonesian plant. The result was a sturdy short plant called IR8. How it compared with traditional varieties of rice plants is shown below. tall plant, can fall over easily grows rapidly Old plant needs to be planted far apart 5 months growing season average yield 1.5 tonnes per ha shorter, stronger plant can be planted close together, needs little space New plant needs fertiliser and pesticides 4 months growing season average yield 5.0 tonnes per ha (i) Why was this method given the name ‘Green Revolution’? … [1] (ii) From the information above, give two different reasons why use of the new seeds resulted in higher food output. … … … … [2] (iii) State one reason why the new plants were less at risk from bad weather during the growing season than the old plants. … … … [2]
Question paper, page 6
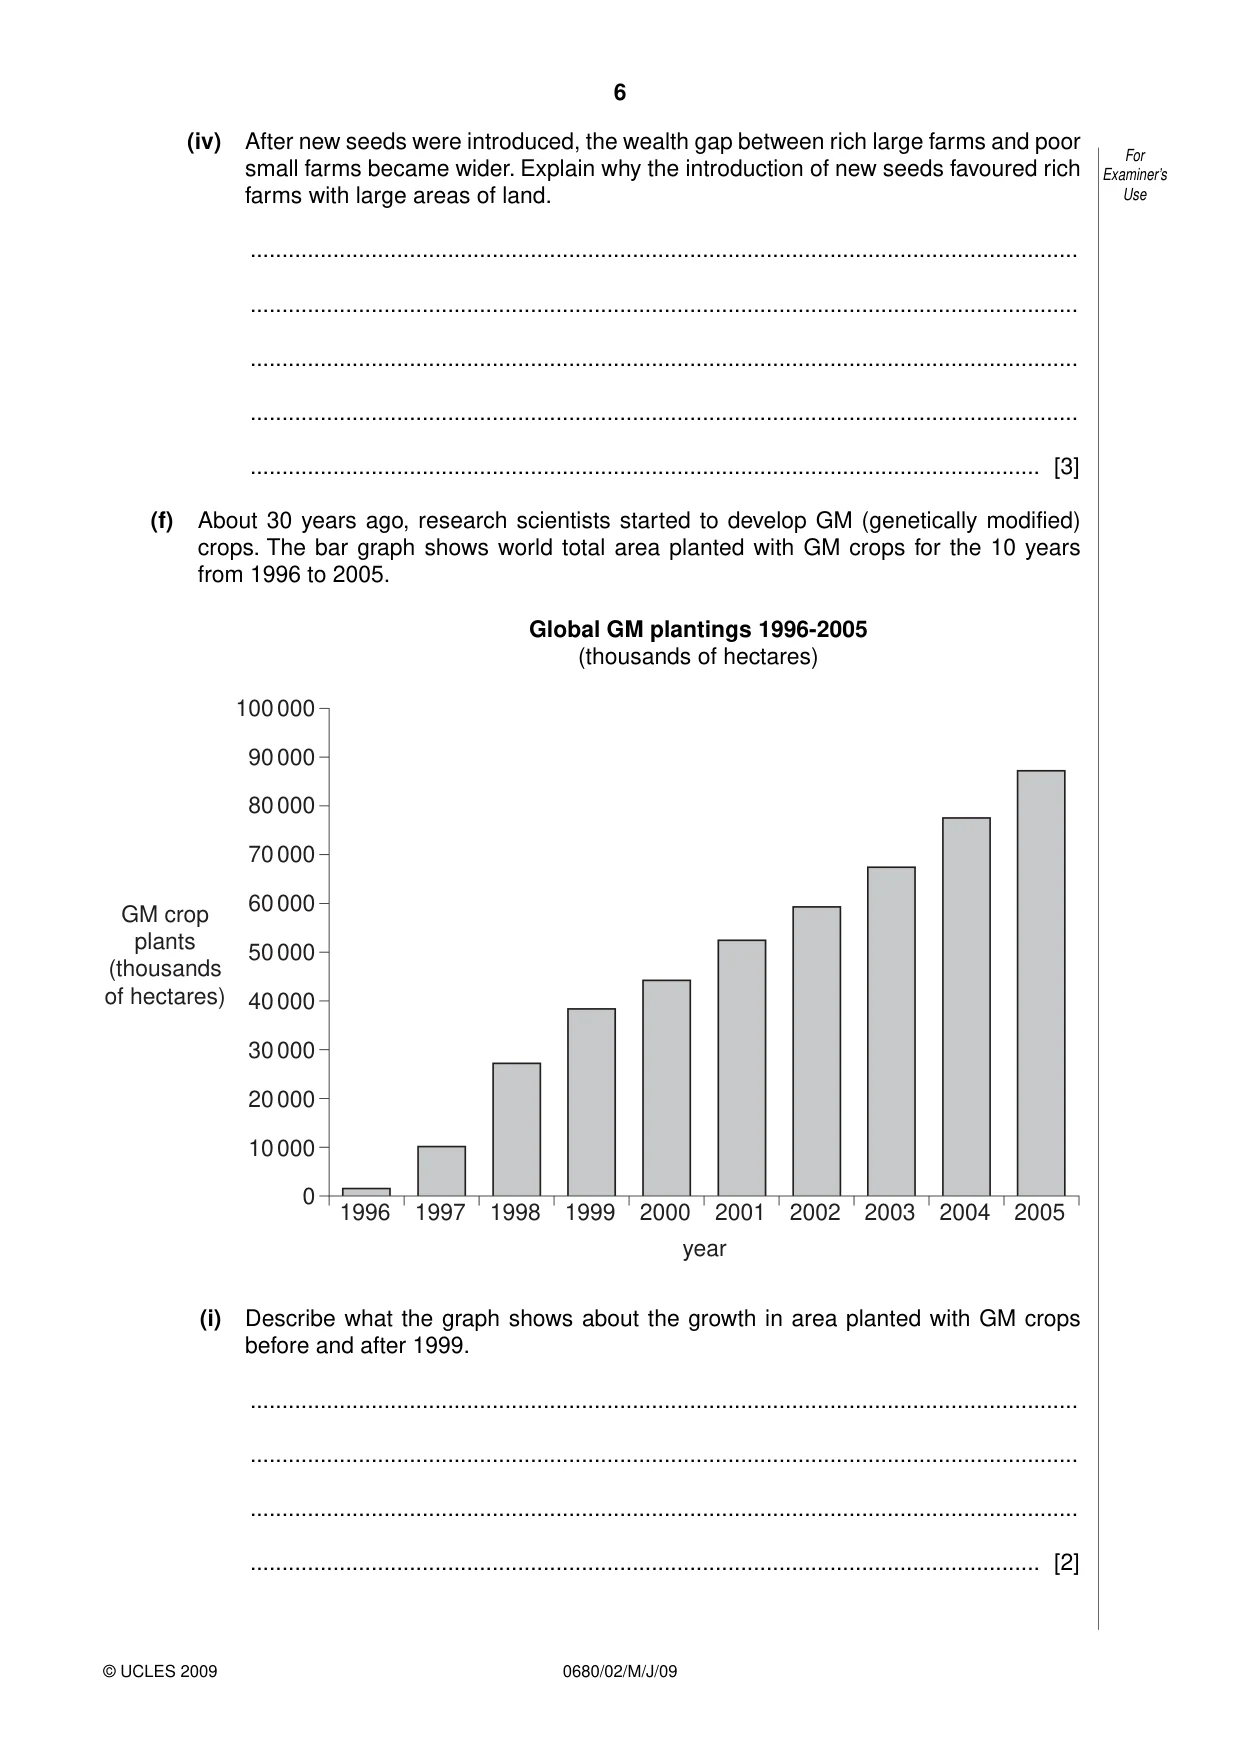
6 0680/02/M/J/09 © UCLES 2009 For Examiner’s Use (iv) After new seeds were introduced, the wealth gap between rich large farms and poor small farms became wider. Explain why the introduction of new seeds favoured rich farms with large areas of land. … … … … … [3] (f) About 30 years ago, research scientists started to develop GM (genetically modified) crops. The bar graph shows world total area planted with GM crops for the 10 years from 1996 to 2005. Global GM plantings 1996-2005 (thousands of hectares) GM crop plants (thousands of hectares) year 1996 1997 1998 1999 2000 2001 2002 2003 2004 2005 0 10 000 20 000 30 000 40 000 50 000 60 000 70 000 80 000 90 000 100 000 (i) Describe what the graph shows about the growth in area planted with GM crops before and after 1999. … … … … [2]
Question paper, page 7
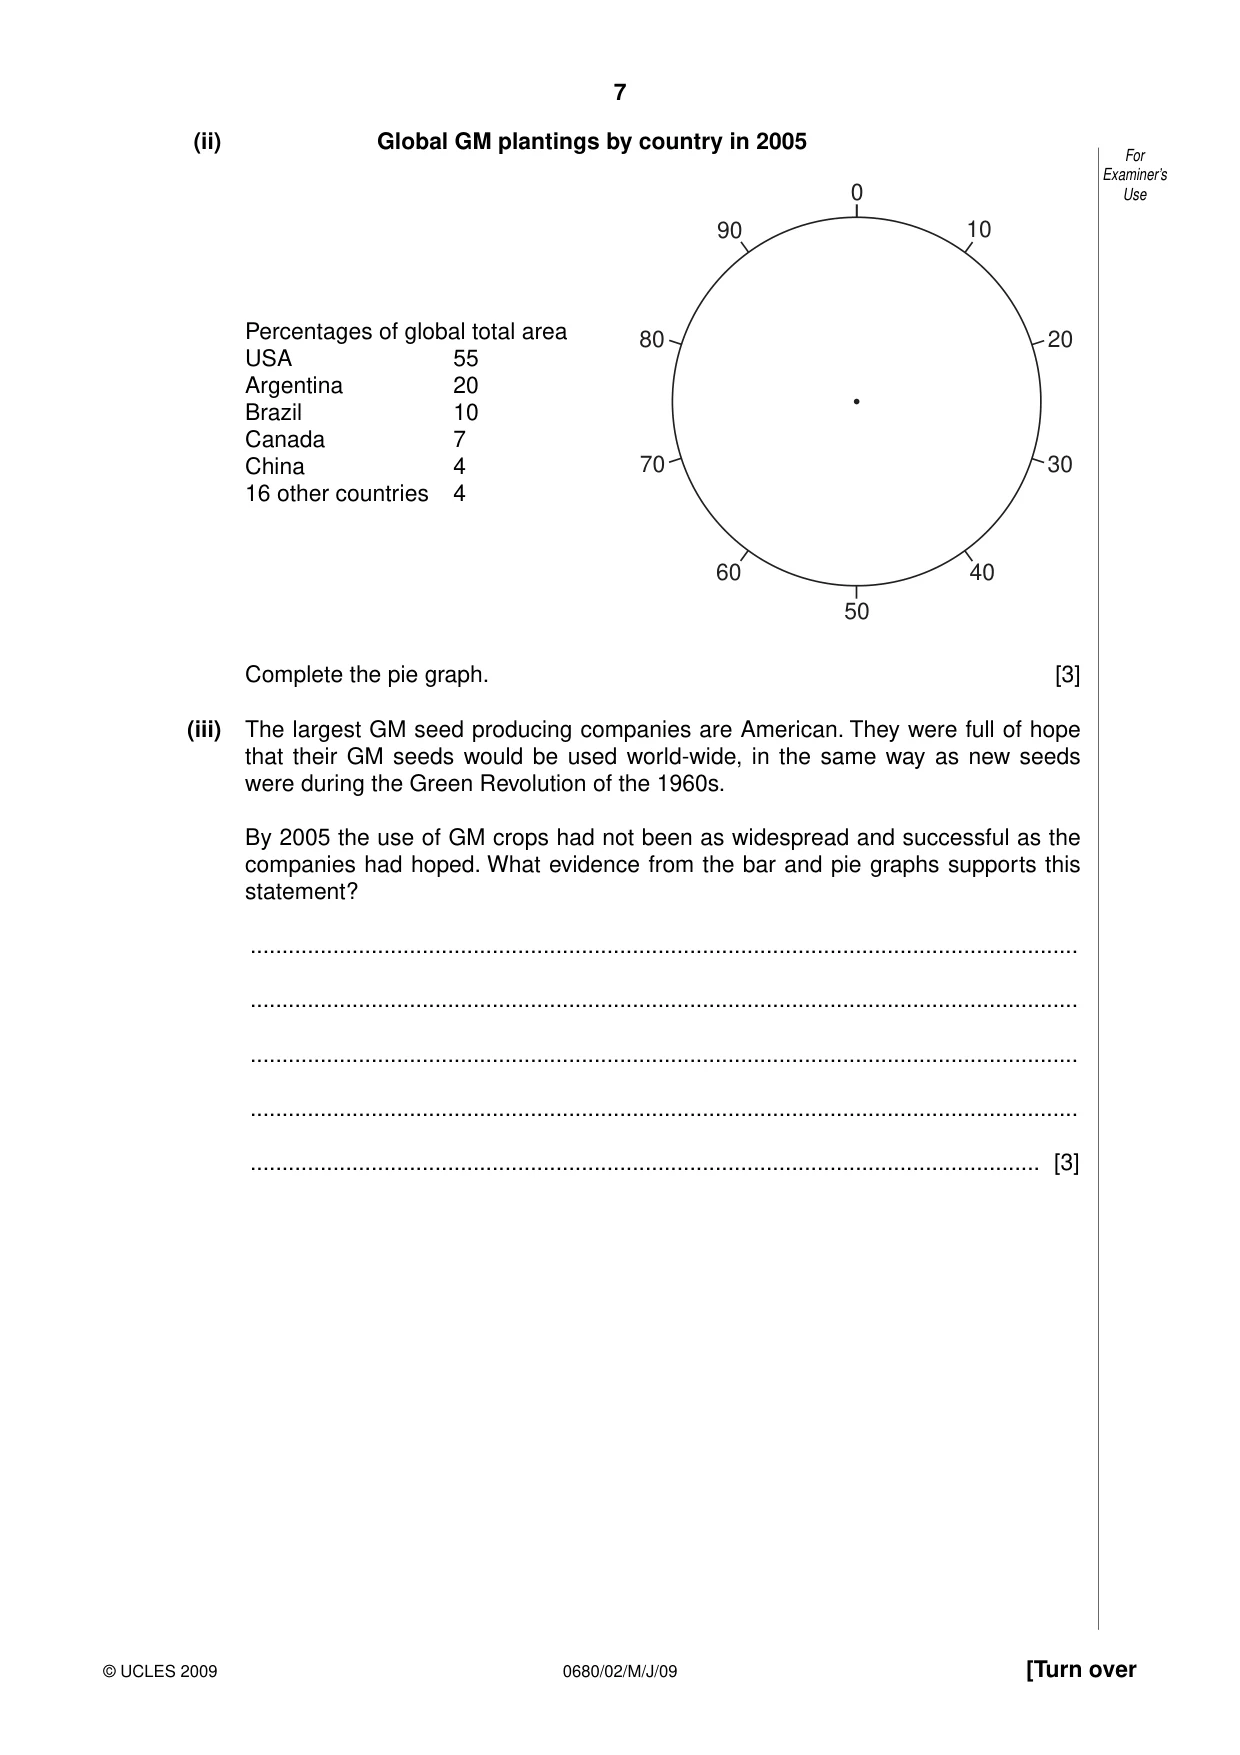
7 0680/02/M/J/09 [Turn over © UCLES 2009 For Examiner’s Use (ii) Global GM plantings by country in 2005 Percentages of global total area 0 50 40 60 30 70 20 80 10 90 0 50 40 60 30 70 20 80 10 90 USA 55 Argentina 20 Brazil 10 Canada 7 China 4 16 other countries 4 Complete the pie graph. [3] (iii) The largest GM seed producing companies are American. They were full of hope that their GM seeds would be used world-wide, in the same way as new seeds were during the Green Revolution of the 1960s. By 2005 the use of GM crops had not been as widespread and successful as the companies had hoped. What evidence from the bar and pie graphs supports this statement? … … … … … [3]
Question paper, page 8
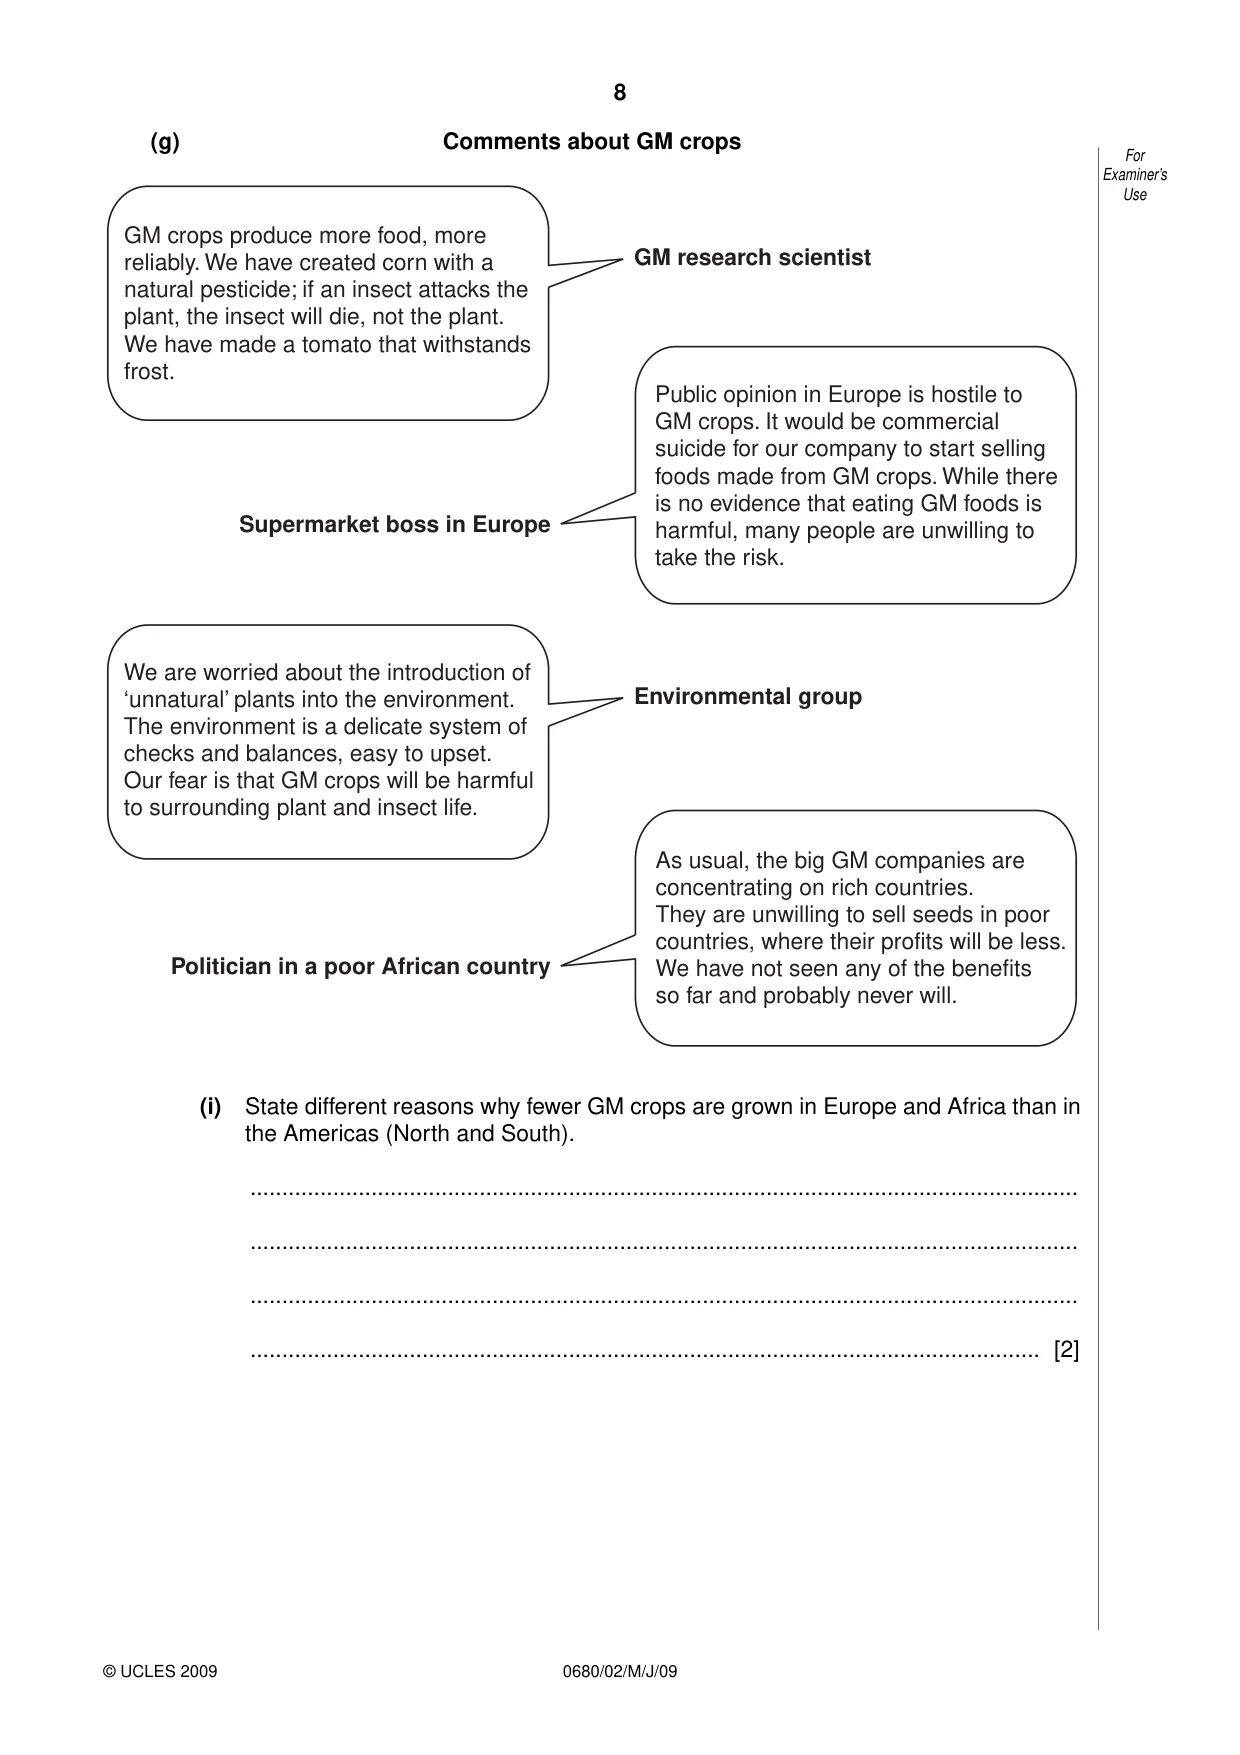
8 0680/02/M/J/09 © UCLES 2009 For Examiner’s Use (g) Comments about GM crops GM crops produce more food, more reliably. We have created corn with a natural pesticide; if an insect attacks the plant, the insect will die, not the plant. We have made a tomato that withstands frost. GM research scientist Public opinion in Europe is hostile to GM crops. It would be commercial suicide for our company to start selling foods made from GM crops. While there is no evidence that eating GM foods is harmful, many people are unwilling to take the risk. Supermarket boss in Europe We are worried about the introduction of ‘unnatural’ plants into the environment. The environment is a delicate system of checks and balances, easy to upset. Our fear is that GM crops will be harmful to surrounding plant and insect life. Environmental group As usual, the big GM companies are concentrating on rich countries. They are unwilling to sell seeds in poor countries, where their profits will be less. We have not seen any of the benefits so far and probably never will. Politician in a poor African country (i) State different reasons why fewer GM crops are grown in Europe and Africa than in the Americas (North and South). … … … … [2]
Question paper, page 9
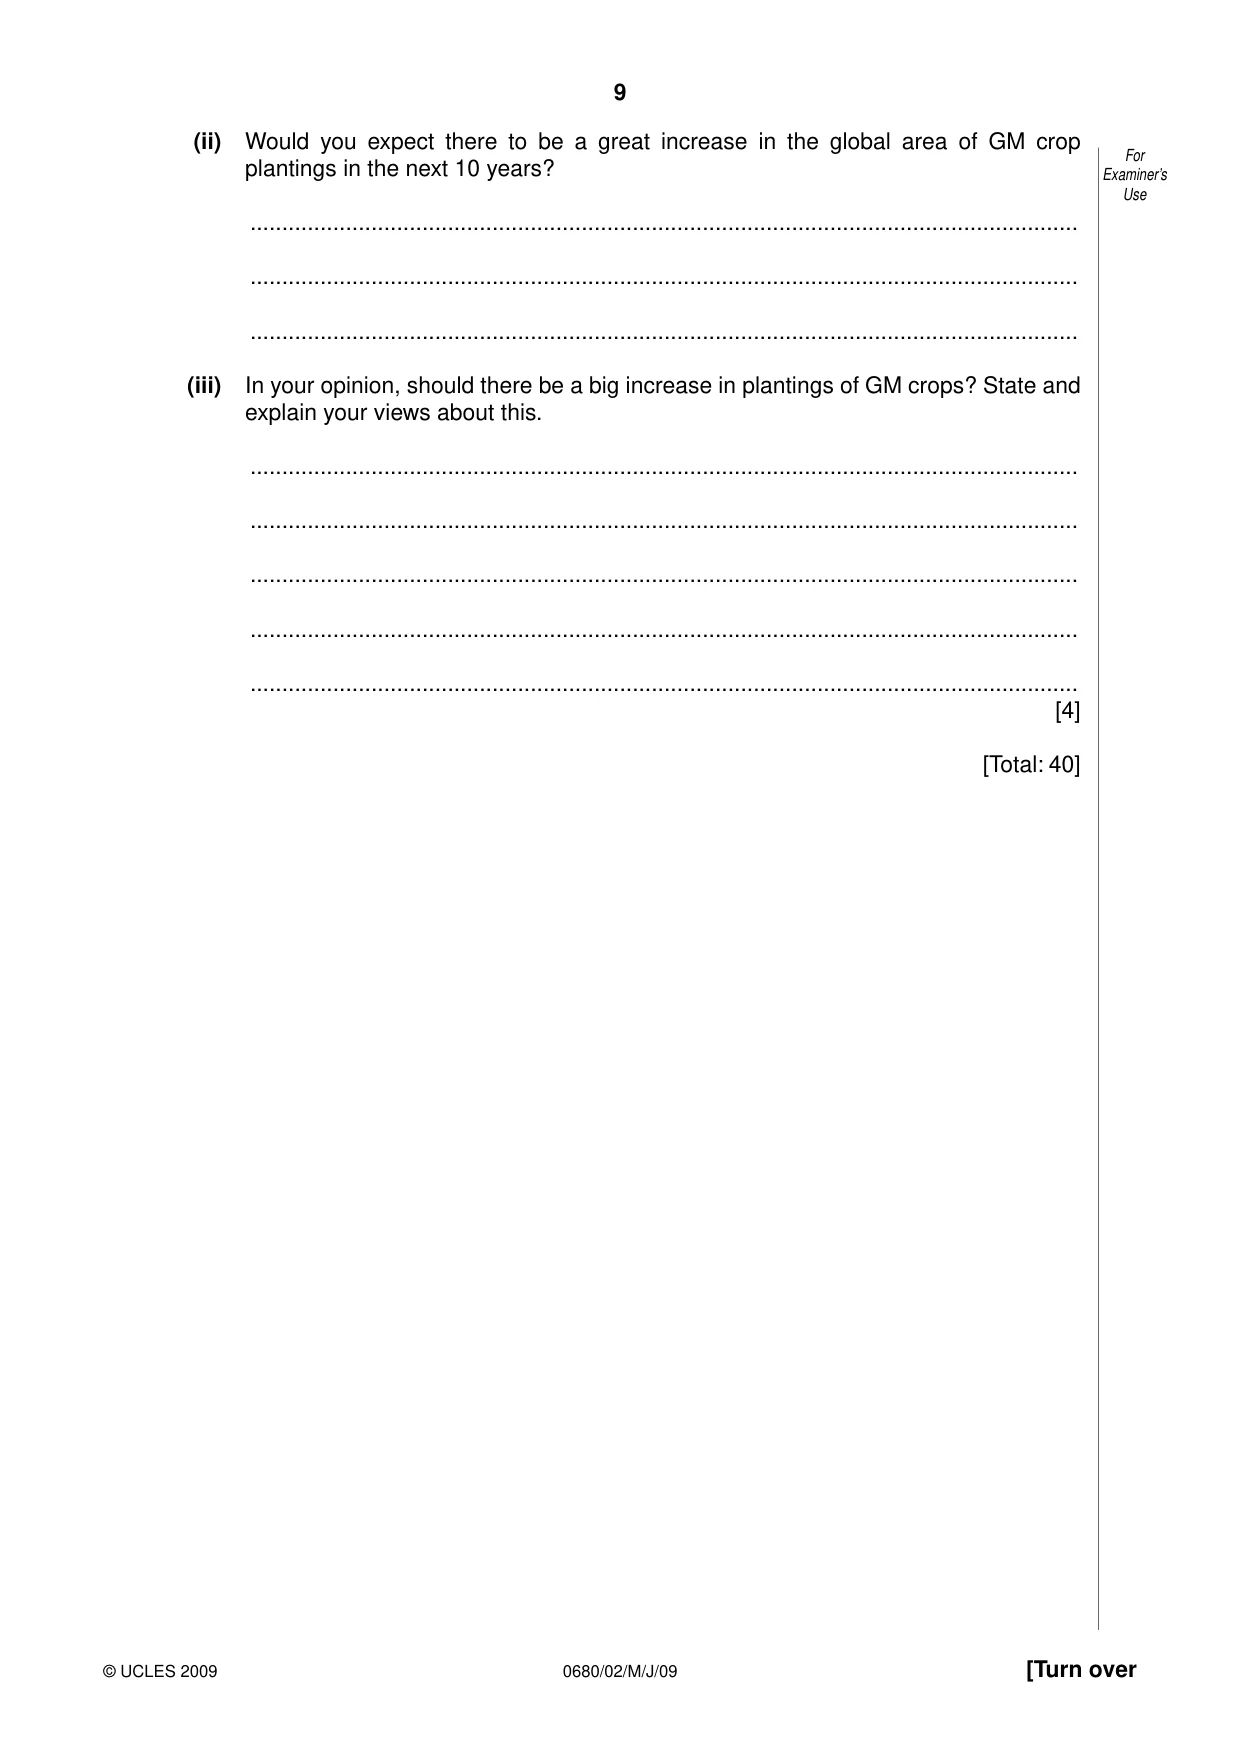
9 0680/02/M/J/09 [Turn over © UCLES 2009 For Examiner’s Use (ii) Would you expect there to be a great increase in the global area of GM crop plantings in the next 10 years? … … … (iii) In your opinion, should there be a big increase in plantings of GM crops? State and explain your views about this. … … … … … [4] [Total: 40]
Question paper, page 10
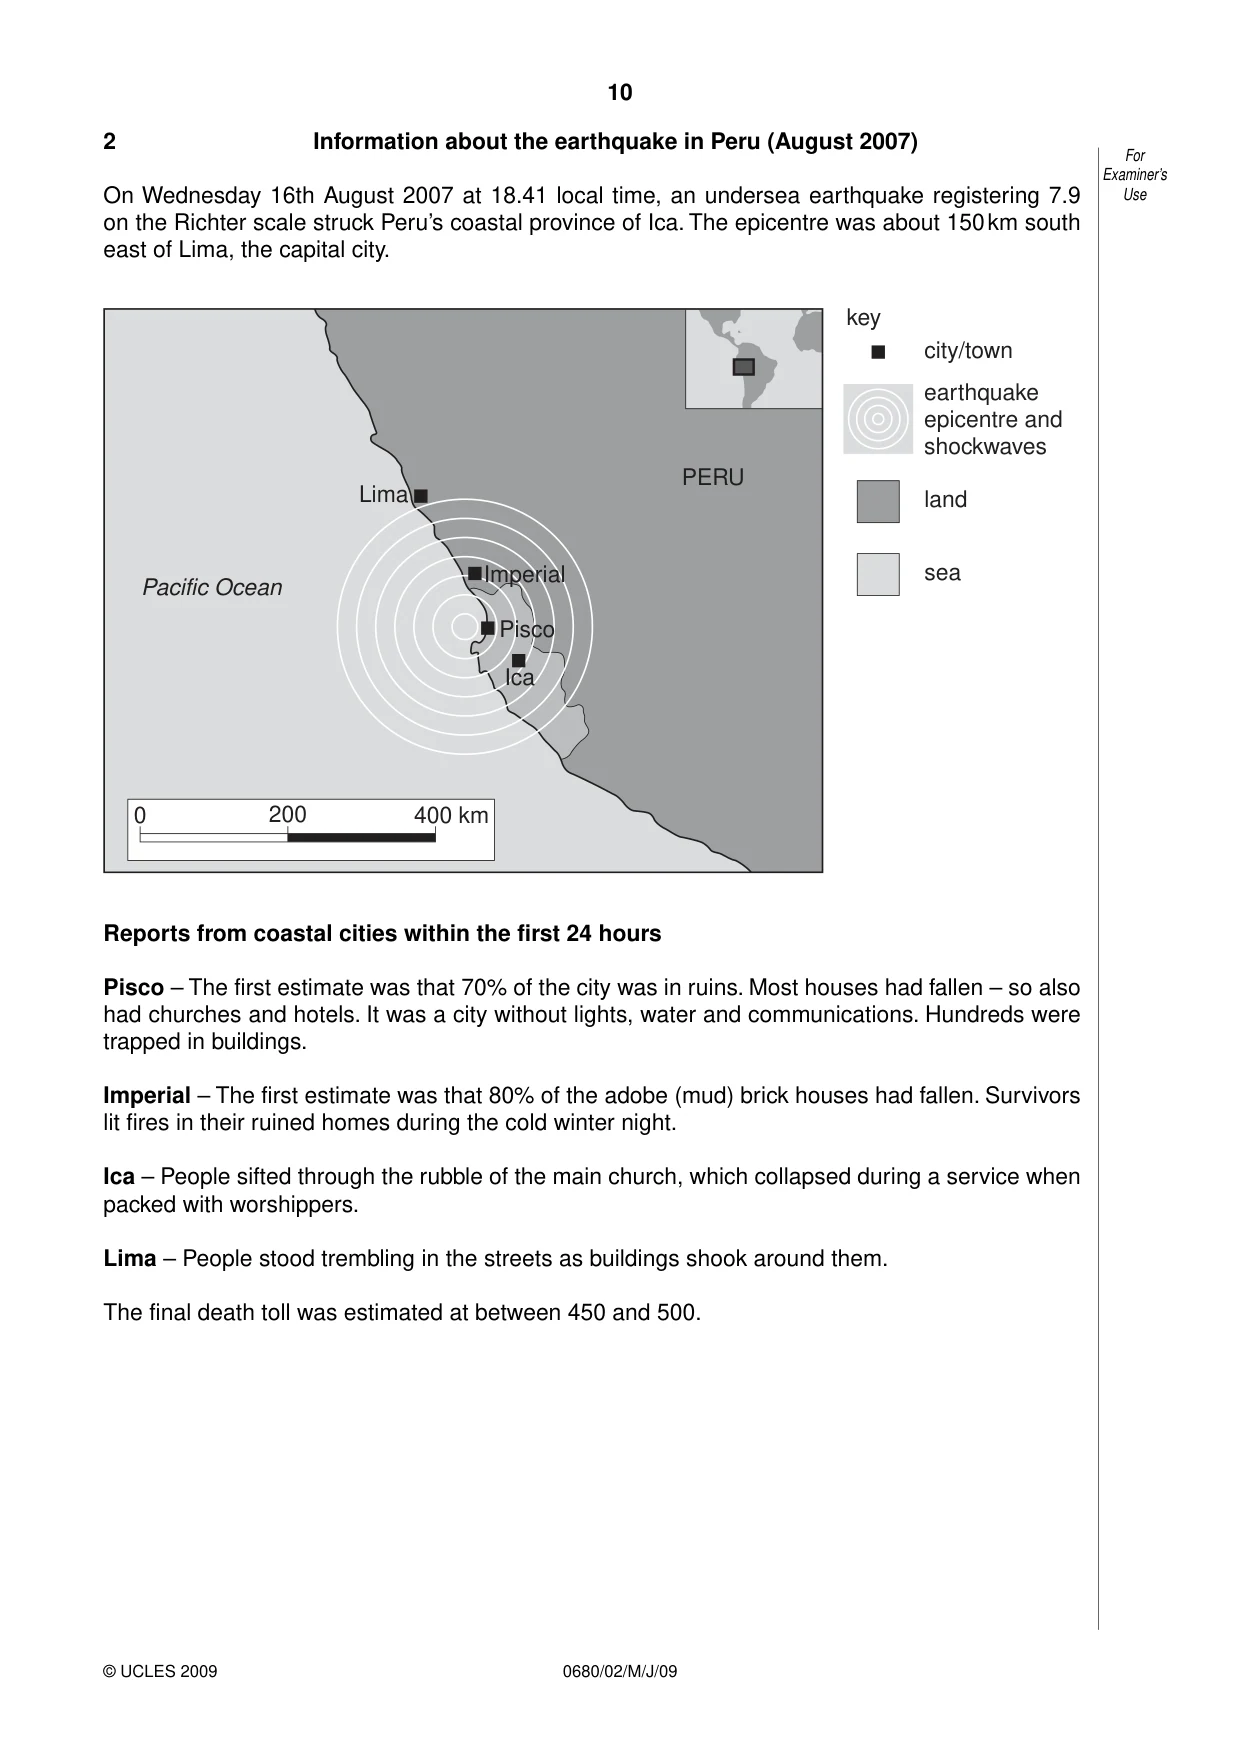
10 0680/02/M/J/09 © UCLES 2009 For Examiner’s Use 2 Information about the earthquake in Peru (August 2007) On Wednesday 16th August 2007 at 18.41 local time, an undersea earthquake registering 7.9 on the Richter scale struck Peru’s coastal province of Ica. The epicentre was about 150 km south east of Lima, the capital city. Pacific Ocean 0 200 400 km Lima PERU city/town earthquake epicentre and shockwaves key sea land Ica Imperial Pisco Reports from coastal cities within the first 24 hours Pisco – The first estimate was that 70% of the city was in ruins. Most houses had fallen – so also had churches and hotels. It was a city without lights, water and communications. Hundreds were trapped in buildings. Imperial – The first estimate was that 80% of the adobe (mud) brick houses had fallen. Survivors lit fires in their ruined homes during the cold winter night. Ica – People sifted through the rubble of the main church, which collapsed during a service when packed with worshippers. Lima – People stood trembling in the streets as buildings shook around them. The final death toll was estimated at between 450 and 500.
Question paper, page 11
11 0680/02/M/J/09 [Turn over © UCLES 2009 For Examiner’s Use (a) State where the centre of the Peru earthquake was located in 2007. … … [1] (b) (i) How far away from the centre were the effects of the earthquake felt? … [1] (ii) Describe how the impacts of the earthquake varied with distance from the centre. … … … … … [3]
Question paper, page 12
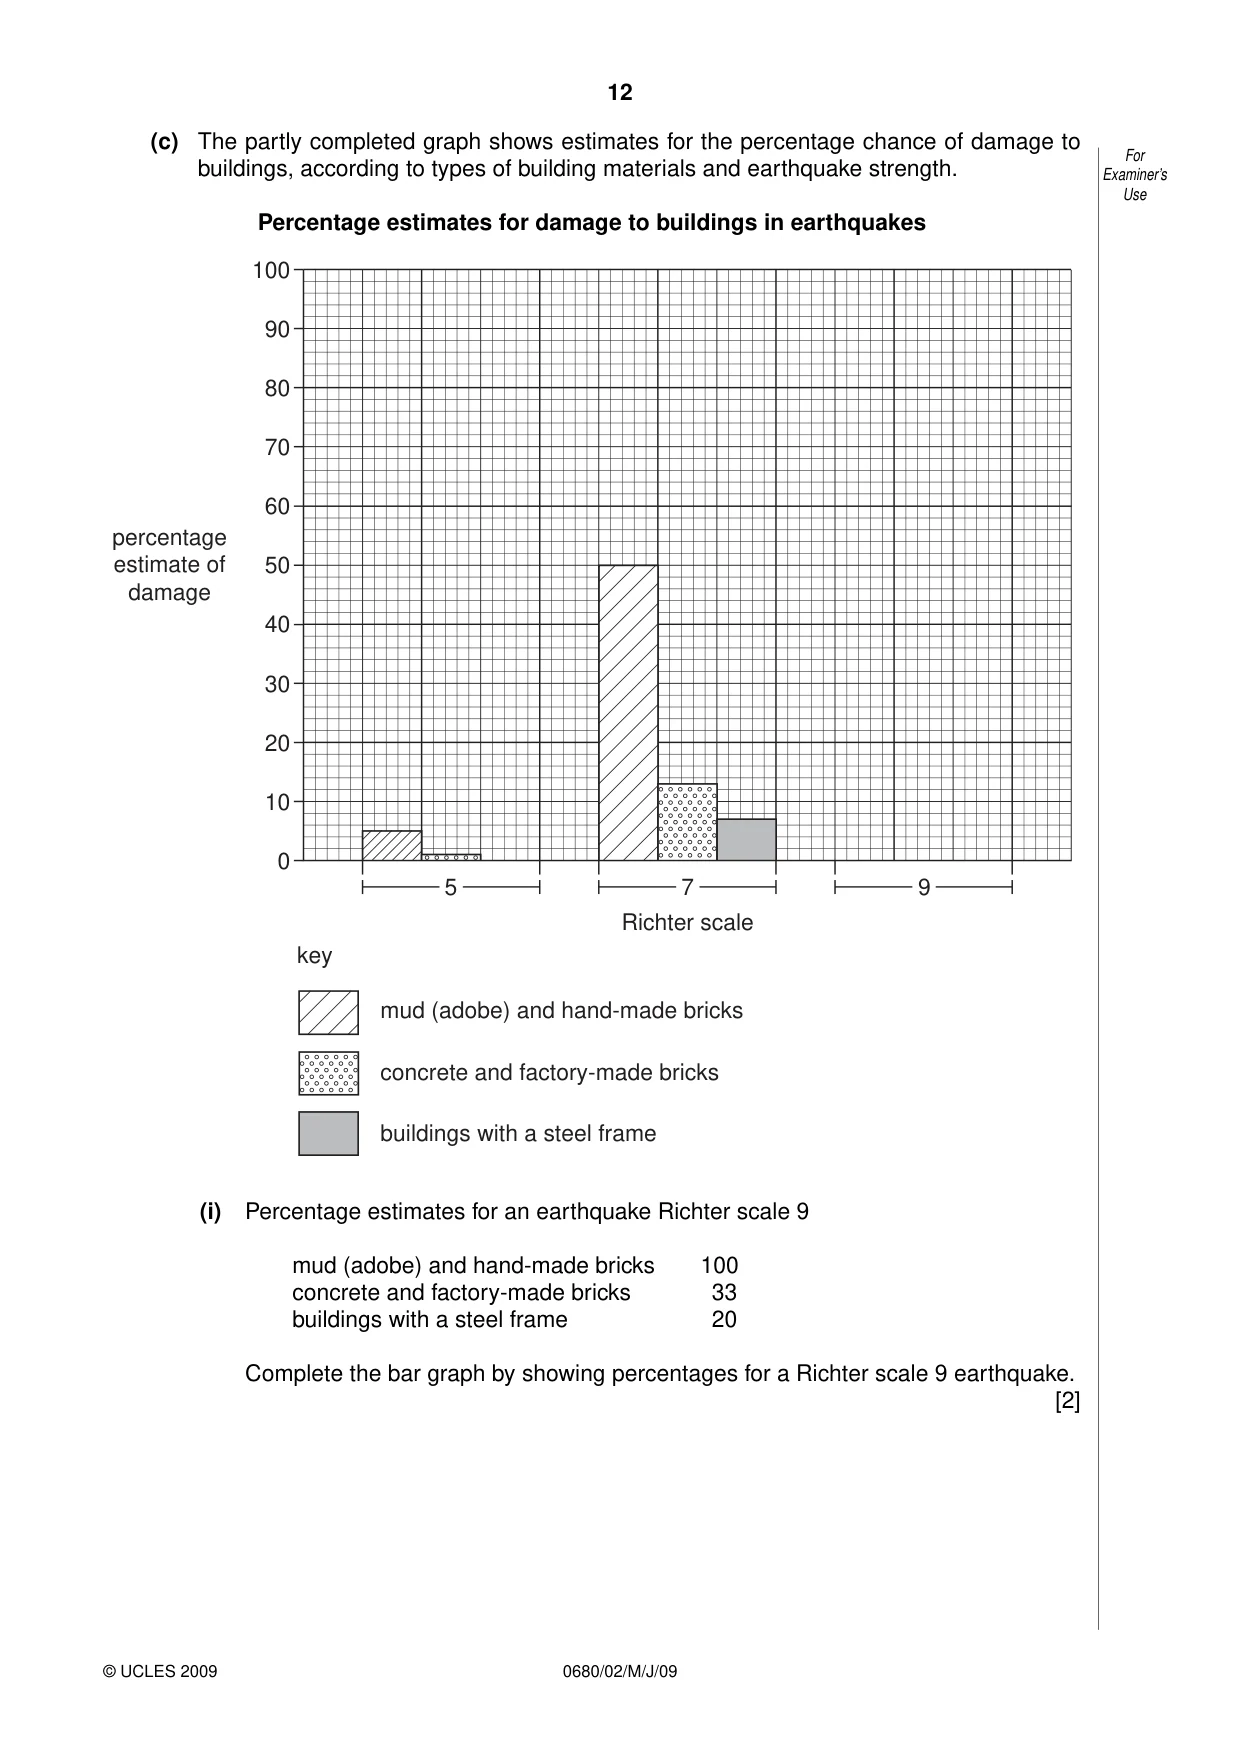
12 0680/02/M/J/09 © UCLES 2009 For Examiner’s Use (c) The partly completed graph shows estimates for the percentage chance of damage to buildings, according to types of building materials and earthquake strength. Percentage estimates for damage to buildings in earthquakes 0 Richter scale percentage estimate of damage 7 10 20 30 40 50 60 70 80 90 100 key mud (adobe) and hand-made bricks concrete and factory-made bricks buildings with a steel frame 5 9 (i) Percentage estimates for an earthquake Richter scale 9 mud (adobe) and hand-made bricks 100 concrete and factory-made bricks 33 buildings with a steel frame 20 Complete the bar graph by showing percentages for a Richter scale 9 earthquake. [2]
Question paper, page 13
13 0680/02/M/J/09 [Turn over © UCLES 2009 For Examiner’s Use (ii) Describe what the graph shows about the percentage chance of damage to buildings according to increasing earthquake strength and types of building materials used. Increasing earthquake strength … … … Types of building materials … … … [3] (iii) Was the damage to buildings in the Peru earthquake similar to that expected for an earthquake around 8.0 on the Richter scale? Explain as fully as you can from the information given. … … … … … … [3]
Question paper, page 14
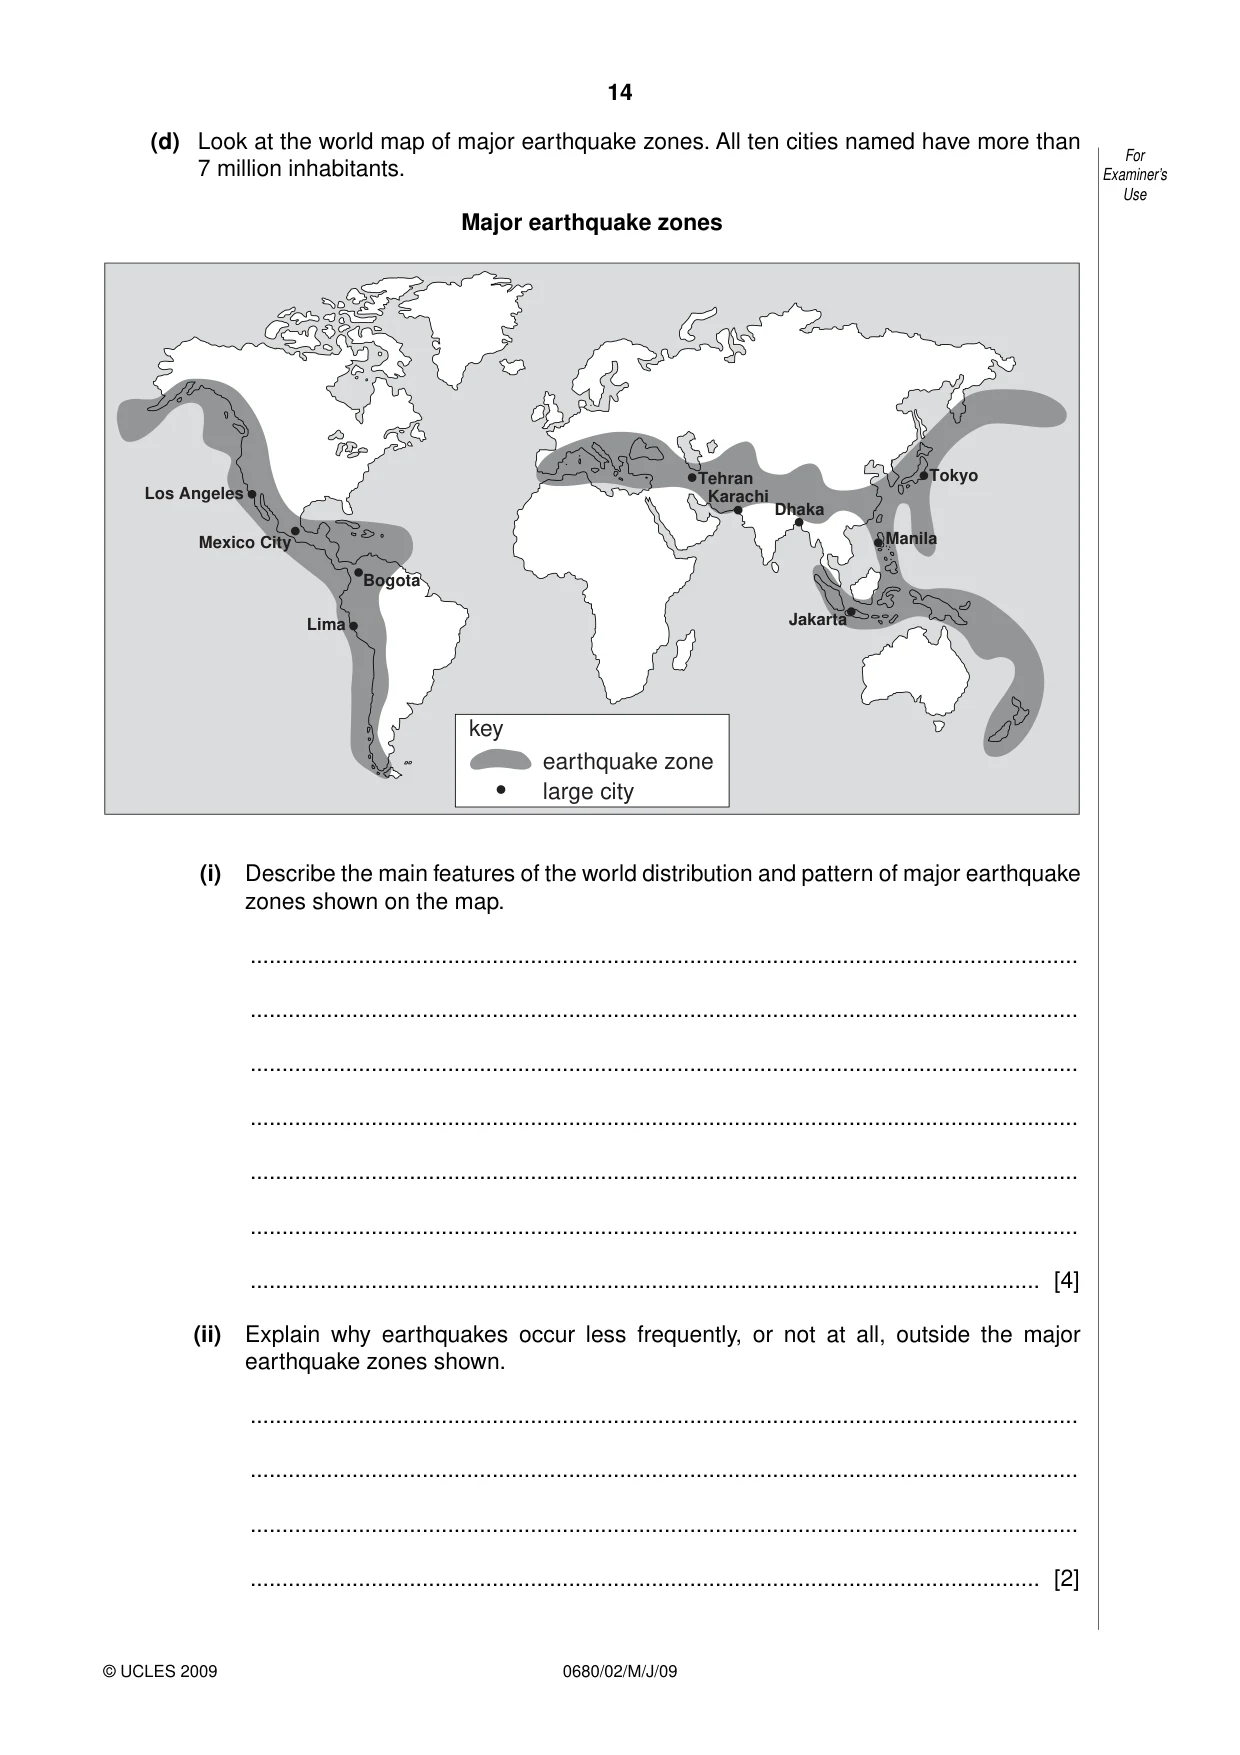
14 0680/02/M/J/09 © UCLES 2009 For Examiner’s Use (d) Look at the world map of major earthquake zones. All ten cities named have more than 7 million inhabitants. Major earthquake zones Tokyo Manila Jakarta Karachi Tehran Bogota Dhaka Mexico City Lima Los Angeles key earthquake zone large city (i) Describe the main features of the world distribution and pattern of major earthquake zones shown on the map. … … … … … … … [4] (ii) Explain why earthquakes occur less frequently, or not at all, outside the major earthquake zones shown. … … … … [2]
Question paper, page 15
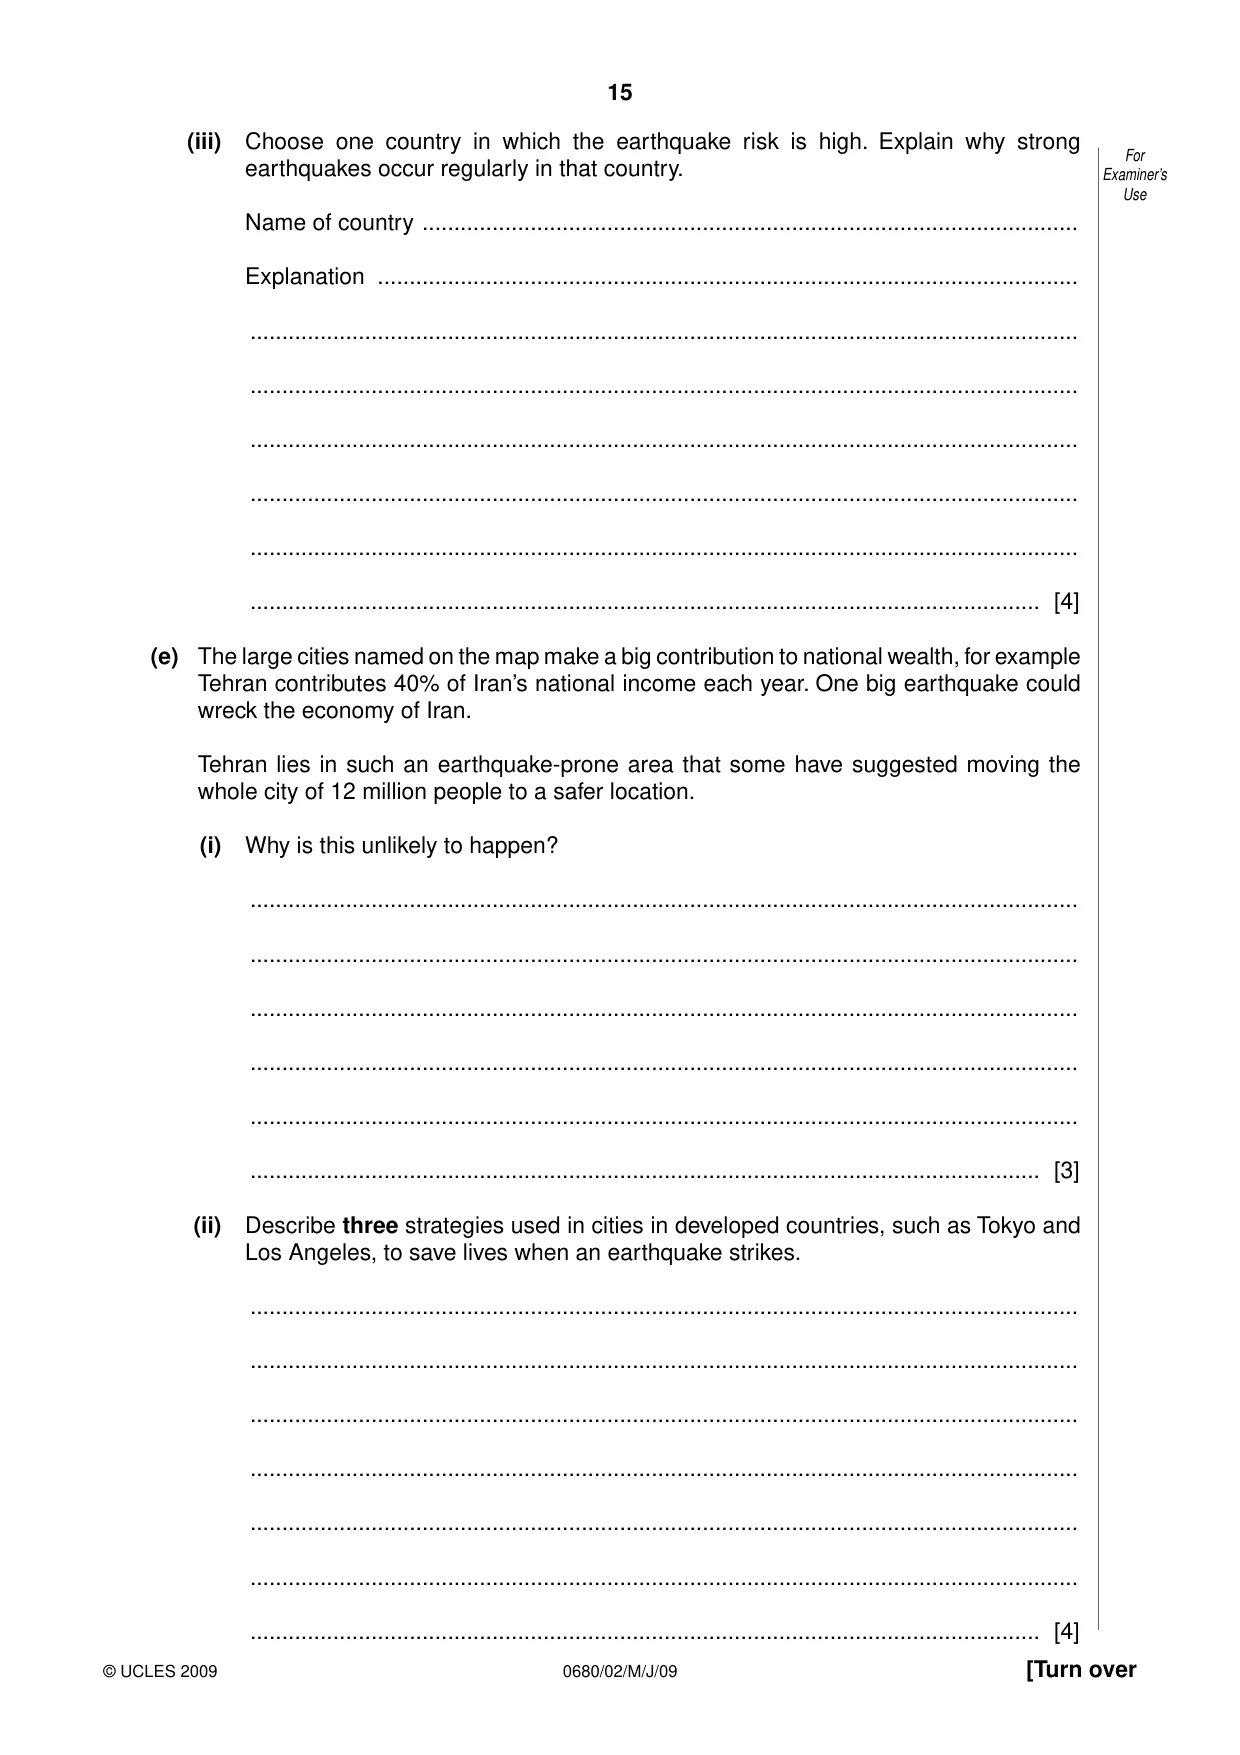
15 0680/02/M/J/09 [Turn over © UCLES 2009 For Examiner’s Use (iii) Choose one country in which the earthquake risk is high. Explain why strong earthquakes occur regularly in that country. Name of country … Explanation … … … … … … … [4] (e) The large cities named on the map make a big contribution to national wealth, for example Tehran contributes 40% of Iran’s national income each year. One big earthquake could wreck the economy of Iran. Tehran lies in such an earthquake-prone area that some have suggested moving the whole city of 12 million people to a safer location. (i) Why is this unlikely to happen? … … … … … … [3] (ii) Describe three strategies used in cities in developed countries, such as Tokyo and Los Angeles, to save lives when an earthquake strikes. … … … … … … … [4]
Question paper, page 16
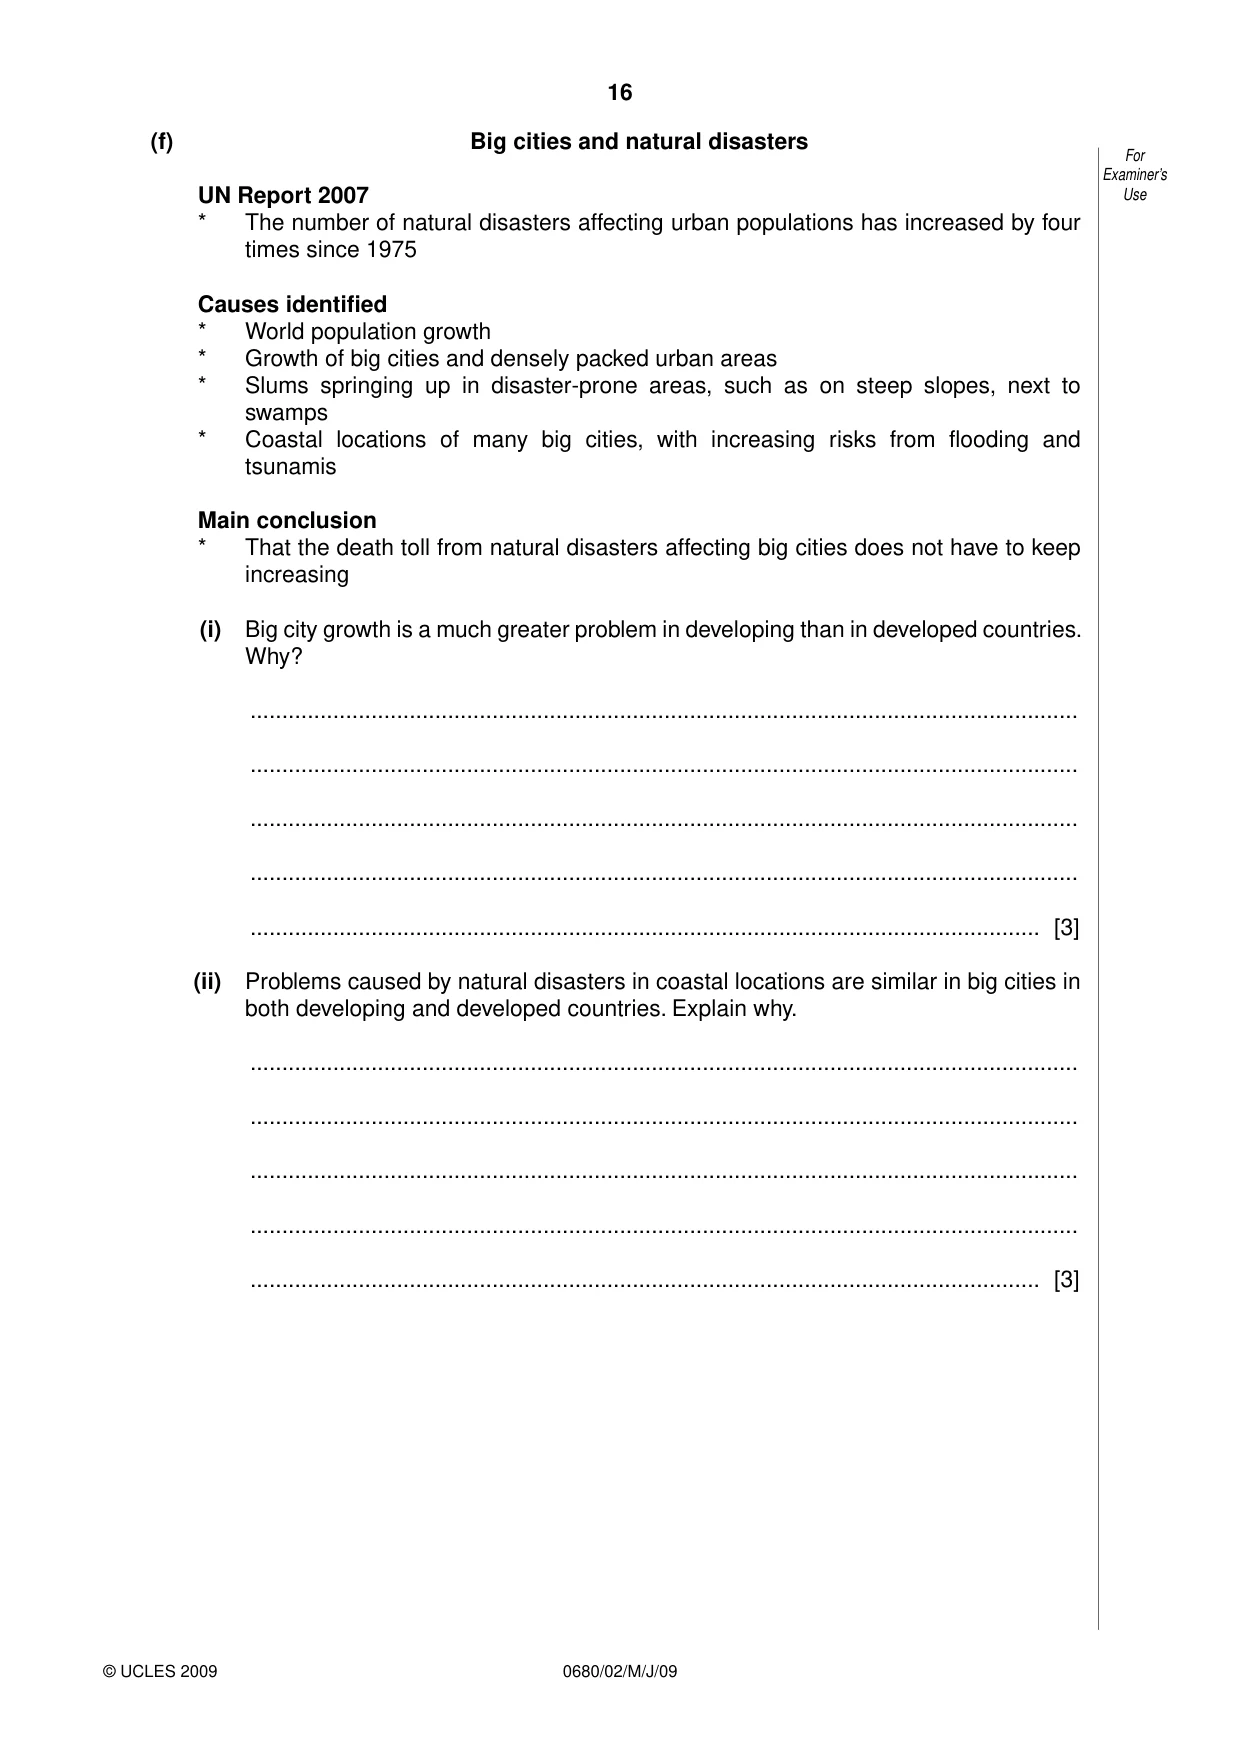
16 0680/02/M/J/09 © UCLES 2009 For Examiner’s Use (f) Big cities and natural disasters UN Report 2007 * The number of natural disasters affecting urban populations has increased by four times since 1975 Causes identified * World population growth * Growth of big cities and densely packed urban areas * Slums springing up in disaster-prone areas, such as on steep slopes, next to swamps * Coastal locations of many big cities, with increasing risks from flooding and tsunamis Main conclusion * That the death toll from natural disasters affecting big cities does not have to keep increasing (i) Big city growth is a much greater problem in developing than in developed countries. Why? … … … … … [3] (ii) Problems caused by natural disasters in coastal locations are similar in big cities in both developing and developed countries. Explain why. … … … … … [3]
Question paper, page 17
17 0680/02/M/J/09 © UCLES 2009 For Examiner’s Use (iii) How likely is it that the death toll from natural disasters affecting large cities will stop increasing, as the UN says it should? State and explain your views about this. … … … … … … … … [4] [Total: 40]
Question paper, page 20
20 0680/02/M/J/09 BLANK PAGE Permission to reproduce items where third-party owned material protected by copyright is included has been sought and cleared where possible. Every reasonable effort has been made by the publisher (UCLES) to trace copyright holders, but if any items requiring clearance have unwittingly been included, the publisher will be pleased to make amends at the earliest possible opportunity. University of Cambridge International Examinations is part of the Cambridge Assessment Group. Cambridge Assessment is the brand name of University of Cambridge Local Examinations Syndicate (UCLES), which is itself a department of the University of Cambridge.
Mark scheme, page 1
UNIVERSITY OF CAMBRIDGE INTERNATIONAL EXAMINATIONS International General Certificate of Secondary Education MARK SCHEME for the May/June 2009 question paper for the guidance of teachers 0680 ENVIRONMENTAL MANAGEMENT 0680/02 Paper 2, maximum raw mark 80 This mark scheme is published as an aid to teachers and candidates, to indicate the requirements of the examination. It shows the basis on which Examiners were instructed to award marks. It does not indicate the details of the discussions that took place at an Examiners’ meeting before marking began, which would have considered the acceptability of alternative answers. Mark schemes must be read in conjunction with the question papers and the report on the examination. • CIE will not enter into discussions or correspondence in connection with these mark schemes. CIE is publishing the mark schemes for the May/June 2009 question papers for most IGCSE, GCE Advanced Level and Advanced Subsidiary Level syllabuses and some Ordinary Level syllabuses. www.XtremePapers.com
Mark scheme, page 2
Page 2 Mark Scheme: Teachers’ version Syllabus Paper IGCSE – May/June 2009 0680 02 © UCLES 2009 1 (a) (i) Line drawn linking the dots on the graph [1] (ii) 118 years [1] (iii) 12 years [1] (iv) growth expected to slow down, especially after 2028, expected to take 20 years to increase by one billion (from 14 and 15 years previously), growth still a lot faster than past growth up to 1959. Basic point = 1 mark Elaboration based on graph use = 2nd mark [2] (b) (i) No mark for the country name, but an acceptable name will be essential for full marks from the other two parts of the question. (ii) Reference to methods for achieving aims – general features of population policies include education and family planning advice, ready availability of contraceptives, permissable use of sterilisation and abortion, statutory limits on numbers of children with penalties, financial incentives, and promoting social change such as later marriages. Policies can be everything from strong and enforced, as in China, to weak and voluntary, as in the many African and Middle Eastern countries. Up to three marks for general answers not applied well, or at all, to a named country Up to four marks for answers which demonstrably refer to the named country (iii) Basic comment on success = 1 mark. Reserve one mark for this part, which can only be gained in the context of an accepted named country. Up to three marks available for this part for reference to advantages and/or disadvantages of the population policy and comments, which are clearly relevant to the named country. [5] (c) Possible reasons; poverty/lack of funds, other more pressing needs e.g. recovering from natural/human disasters, against social traditions/religious beliefs, political corruption and inefficiency, oil rich/wealthy so no need to worry about population growth, population growth considered necessary for international status/against rivals Two reasons @ 1 mark [2]
Mark scheme, page 3
Page 3 Mark Scheme: Teachers’ version Syllabus Paper IGCSE – May/June 2009 0680 02 © UCLES 2009 (d) Fertiliser; improves soil fertility, replaces nutrients taken out of soil by previous crops, organic fertilisers maintain soil texture/structure ... or similar points disadvantage – possible choices include cost, over-use of chemical fertilisers leading to leaks into surface water courses/underground stores, unfavourable environmental consequences Pesticides; destroys insects etc. which eat/damage crops, kills weeds which would compete for nutrients/water with the crops ... or similar disadvantage – chemical pesticides also kill other useful insects, destroy habitats for birds and wildlife, has knock-on effects in natural food chains Irrigation water; water allows plant growth when rainfall is too little or too unreliable, allows use of otherwise favourable conditions for crops (such as fertile soils, sunshine), increases size of crops/fruit and the amount produced ... or similar disadvantage – overuse leading to salinisation, costs (of all types) of building infrastructure for supply (especially large dams), competing use for a scarce natural resource Machinery; sowing/spraying etc. done more evenly/in a more controlled way, more can be done more quickly while weather conditions are favourable, large scale/more efficient operations possible, larger areas brought into cultivation by new technology ... or similar disadvantage – heavy machinery compresses soil/damages soil structure, encourages loss of wildlife habitats through clearance of vegetation for easy use of machinery, high costs to small farmers in developing countries In general, it will be two marks for explanation and one for disadvantage, because only one disadvantage is required; however, good/full elaboration about the one disadvantage can receive two marks when the explanation is not worth two marks. Keep one mark for each part. 2 @ 3 marks = 6 marks [3][3]
Mark scheme, page 4
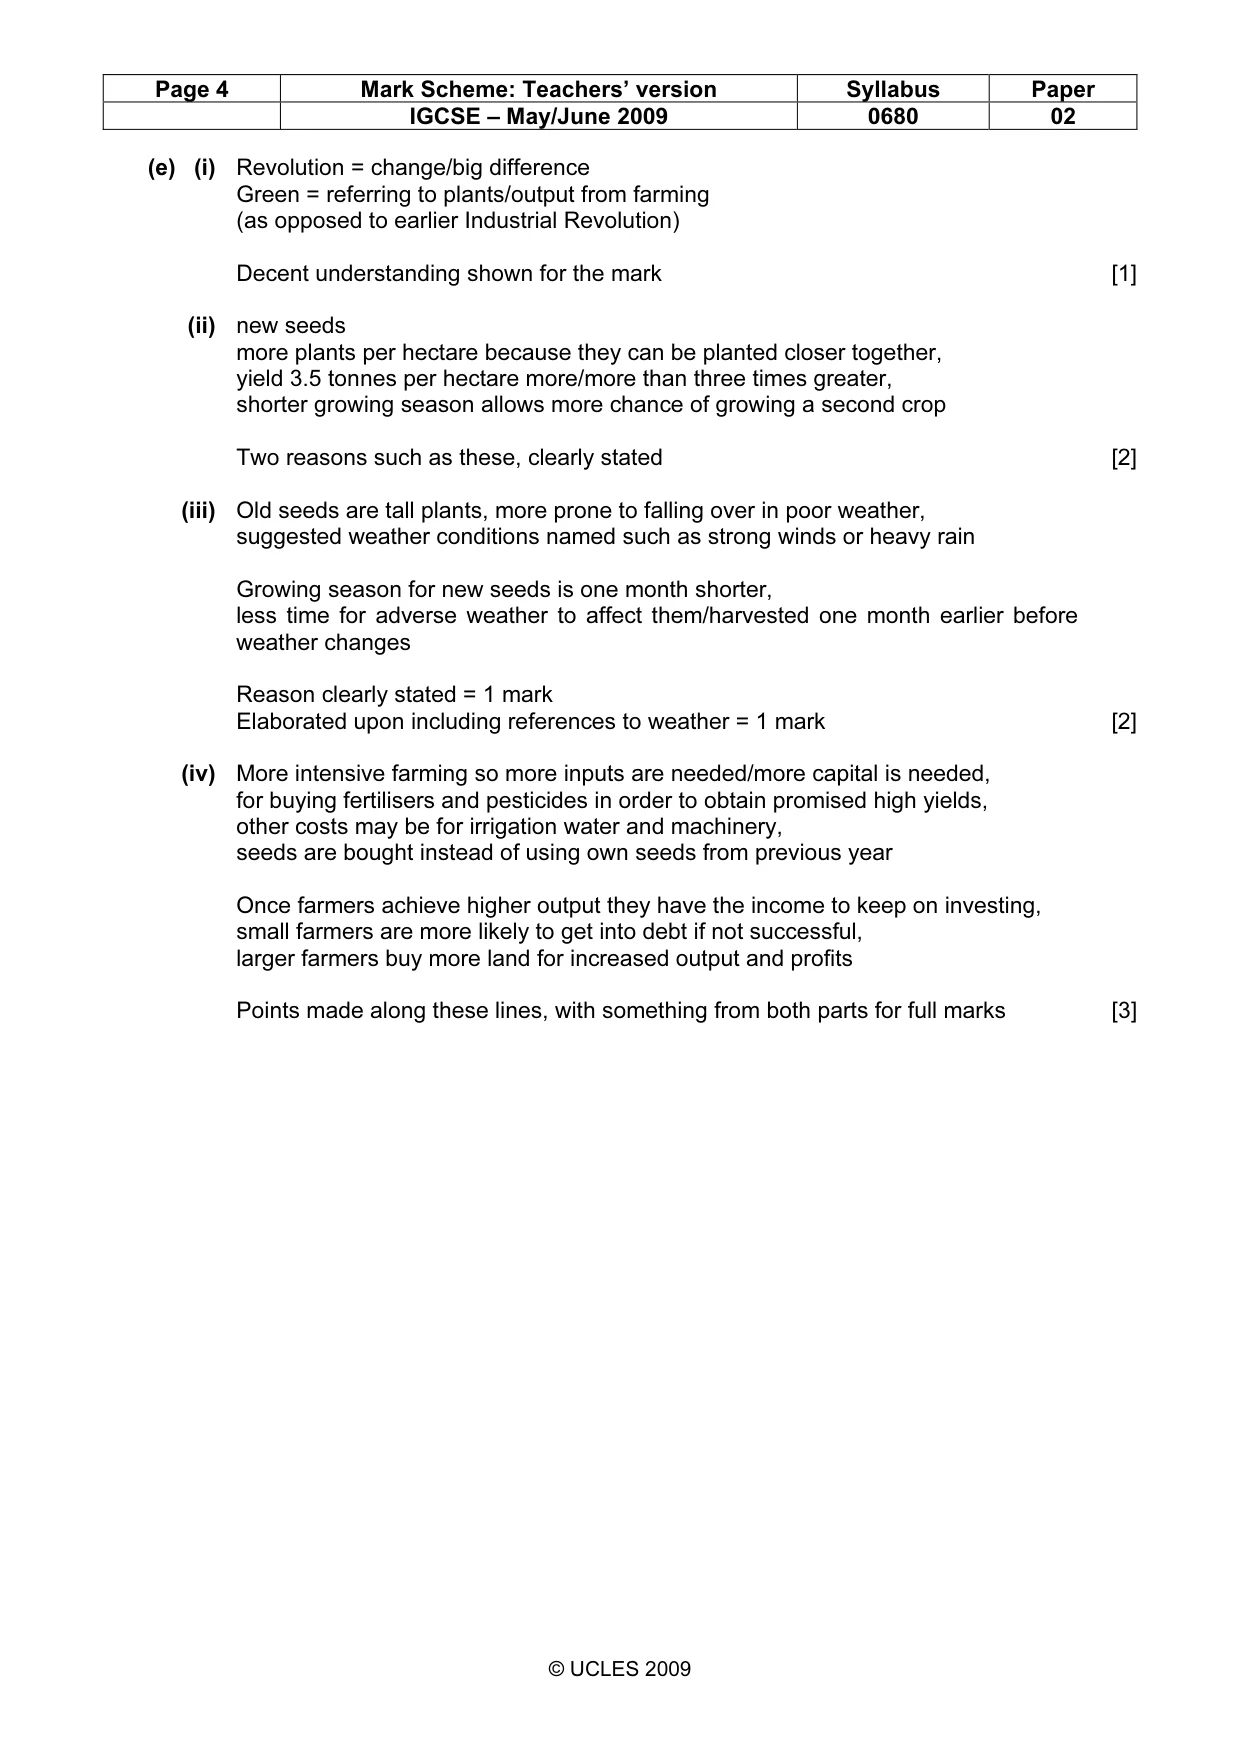
Page 4 Mark Scheme: Teachers’ version Syllabus Paper IGCSE – May/June 2009 0680 02 © UCLES 2009 (e) (i) Revolution = change/big difference Green = referring to plants/output from farming (as opposed to earlier Industrial Revolution) Decent understanding shown for the mark [1] (ii) new seeds more plants per hectare because they can be planted closer together, yield 3.5 tonnes per hectare more/more than three times greater, shorter growing season allows more chance of growing a second crop Two reasons such as these, clearly stated [2] (iii) Old seeds are tall plants, more prone to falling over in poor weather, suggested weather conditions named such as strong winds or heavy rain Growing season for new seeds is one month shorter, less time for adverse weather to affect them/harvested one month earlier before weather changes Reason clearly stated = 1 mark Elaborated upon including references to weather = 1 mark [2] (iv) More intensive farming so more inputs are needed/more capital is needed, for buying fertilisers and pesticides in order to obtain promised high yields, other costs may be for irrigation water and machinery, seeds are bought instead of using own seeds from previous year Once farmers achieve higher output they have the income to keep on investing, small farmers are more likely to get into debt if not successful, larger farmers buy more land for increased output and profits Points made along these lines, with something from both parts for full marks [3]
Mark scheme, page 5
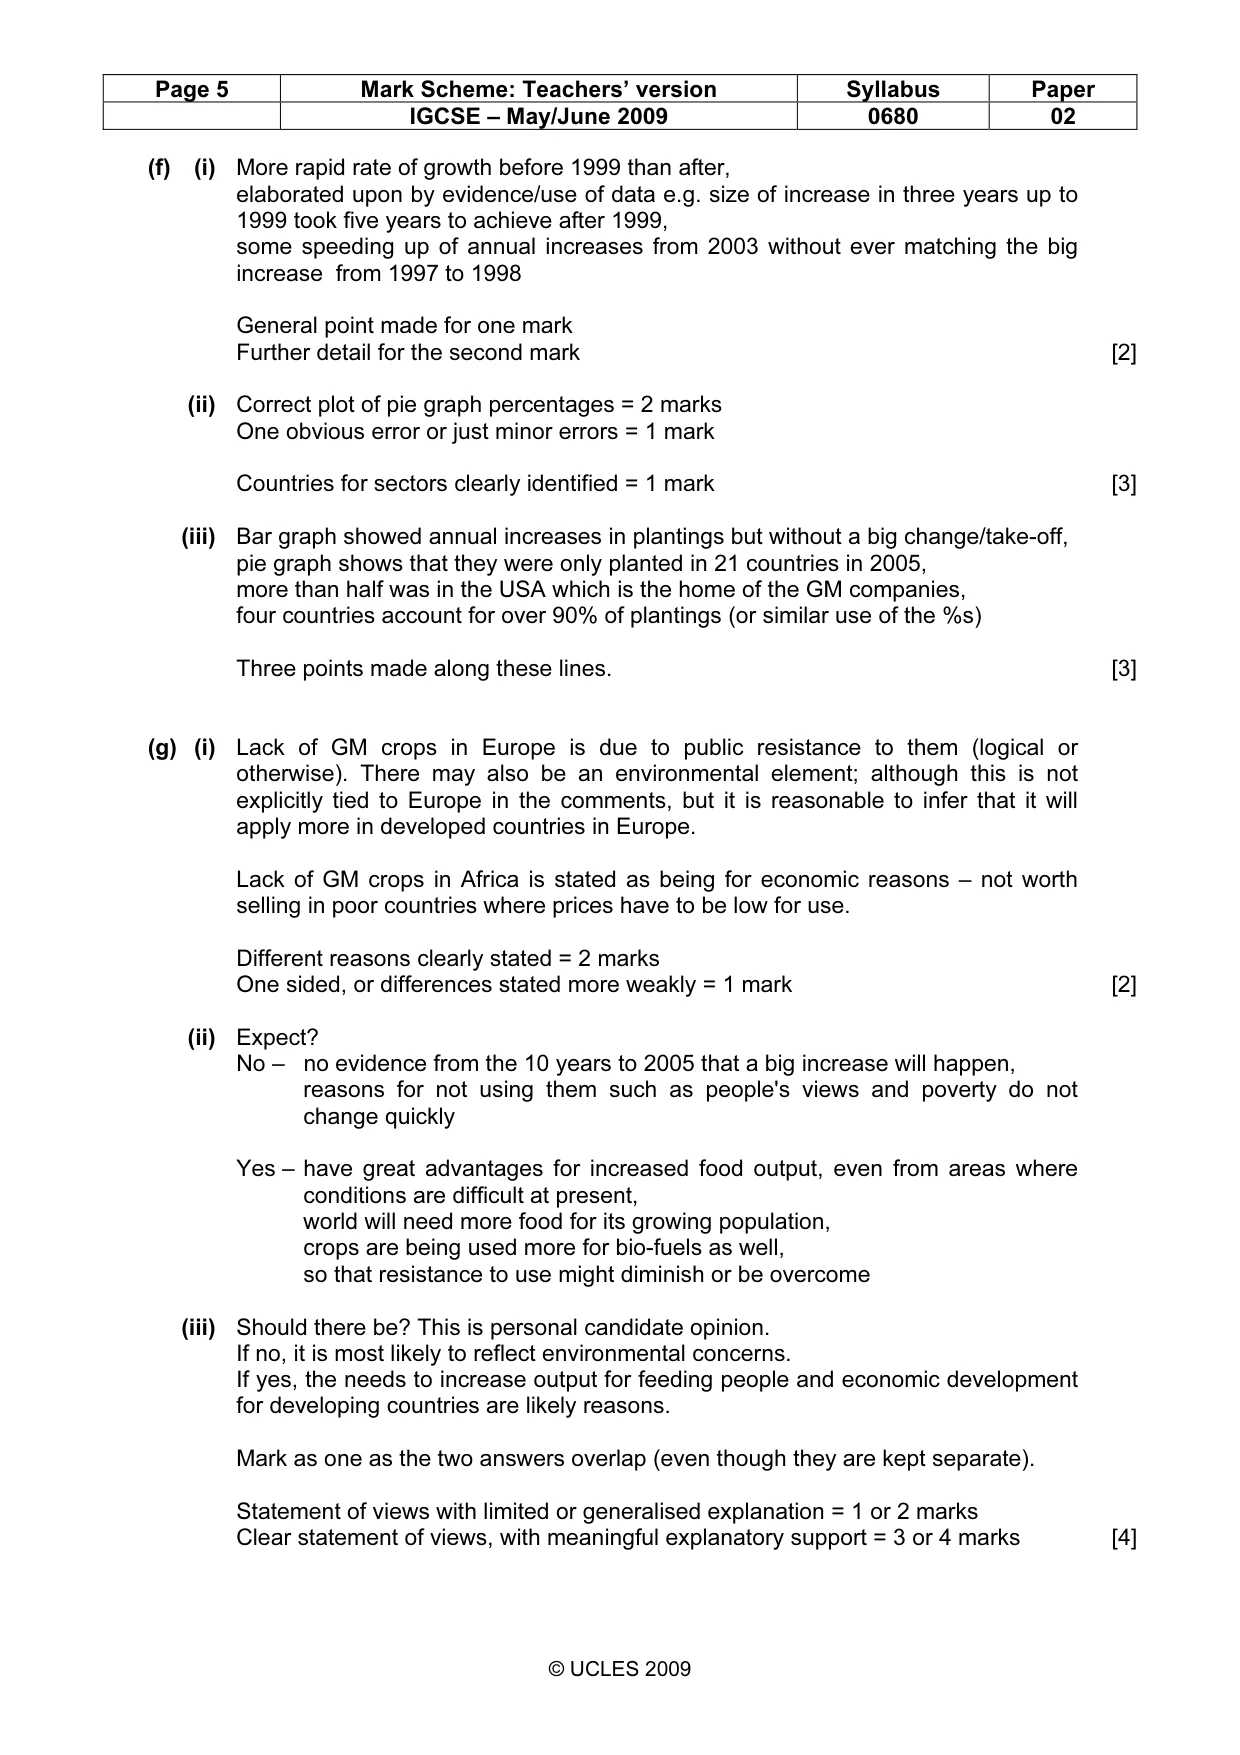
Page 5 Mark Scheme: Teachers’ version Syllabus Paper IGCSE – May/June 2009 0680 02 © UCLES 2009 (f) (i) More rapid rate of growth before 1999 than after, elaborated upon by evidence/use of data e.g. size of increase in three years up to 1999 took five years to achieve after 1999, some speeding up of annual increases from 2003 without ever matching the big increase from 1997 to 1998 General point made for one mark Further detail for the second mark [2] (ii) Correct plot of pie graph percentages = 2 marks One obvious error or just minor errors = 1 mark Countries for sectors clearly identified = 1 mark [3] (iii) Bar graph showed annual increases in plantings but without a big change/take-off, pie graph shows that they were only planted in 21 countries in 2005, more than half was in the USA which is the home of the GM companies, four countries account for over 90% of plantings (or similar use of the %s) Three points made along these lines. [3] (g) (i) Lack of GM crops in Europe is due to public resistance to them (logical or otherwise). There may also be an environmental element; although this is not explicitly tied to Europe in the comments, but it is reasonable to infer that it will apply more in developed countries in Europe. Lack of GM crops in Africa is stated as being for economic reasons – not worth selling in poor countries where prices have to be low for use. Different reasons clearly stated = 2 marks One sided, or differences stated more weakly = 1 mark [2] (ii) Expect? No – no evidence from the 10 years to 2005 that a big increase will happen, reasons for not using them such as people's views and poverty do not change quickly Yes – have great advantages for increased food output, even from areas where conditions are difficult at present, world will need more food for its growing population, crops are being used more for bio-fuels as well, so that resistance to use might diminish or be overcome (iii) Should there be? This is personal candidate opinion. If no, it is most likely to reflect environmental concerns. If yes, the needs to increase output for feeding people and economic development for developing countries are likely reasons. Mark as one as the two answers overlap (even though they are kept separate). Statement of views with limited or generalised explanation = 1 or 2 marks Clear statement of views, with meaningful explanatory support = 3 or 4 marks [4]
Mark scheme, page 6
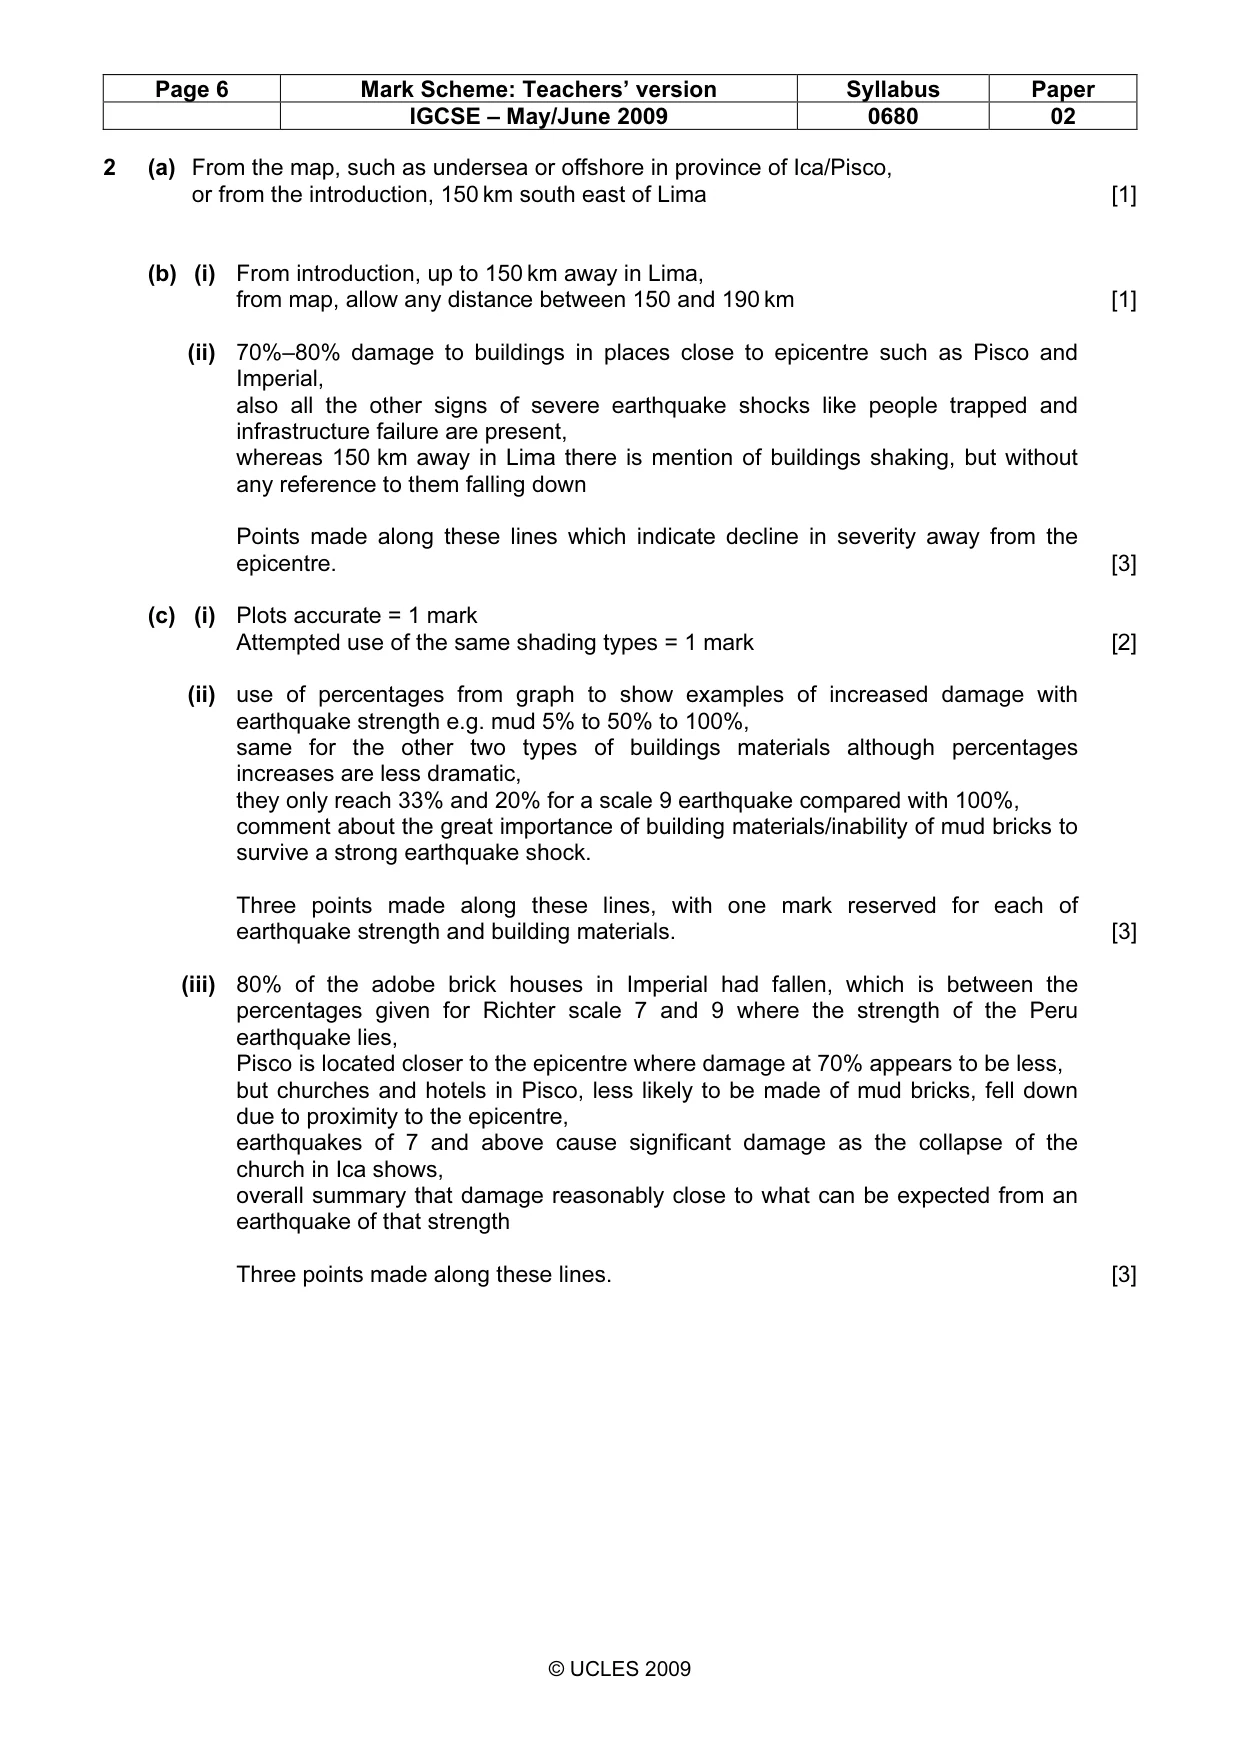
Page 6 Mark Scheme: Teachers’ version Syllabus Paper IGCSE – May/June 2009 0680 02 © UCLES 2009 2 (a) From the map, such as undersea or offshore in province of Ica/Pisco, or from the introduction, 150 km south east of Lima [1] (b) (i) From introduction, up to 150 km away in Lima, from map, allow any distance between 150 and 190 km [1] (ii) 70%–80% damage to buildings in places close to epicentre such as Pisco and Imperial, also all the other signs of severe earthquake shocks like people trapped and infrastructure failure are present, whereas 150 km away in Lima there is mention of buildings shaking, but without any reference to them falling down Points made along these lines which indicate decline in severity away from the epicentre. [3] (c) (i) Plots accurate = 1 mark Attempted use of the same shading types = 1 mark [2] (ii) use of percentages from graph to show examples of increased damage with earthquake strength e.g. mud 5% to 50% to 100%, same for the other two types of buildings materials although percentages increases are less dramatic, they only reach 33% and 20% for a scale 9 earthquake compared with 100%, comment about the great importance of building materials/inability of mud bricks to survive a strong earthquake shock. Three points made along these lines, with one mark reserved for each of earthquake strength and building materials. [3] (iii) 80% of the adobe brick houses in Imperial had fallen, which is between the percentages given for Richter scale 7 and 9 where the strength of the Peru earthquake lies, Pisco is located closer to the epicentre where damage at 70% appears to be less, but churches and hotels in Pisco, less likely to be made of mud bricks, fell down due to proximity to the epicentre, earthquakes of 7 and above cause significant damage as the collapse of the church in Ica shows, overall summary that damage reasonably close to what can be expected from an earthquake of that strength Three points made along these lines. [3]
Mark scheme, page 7
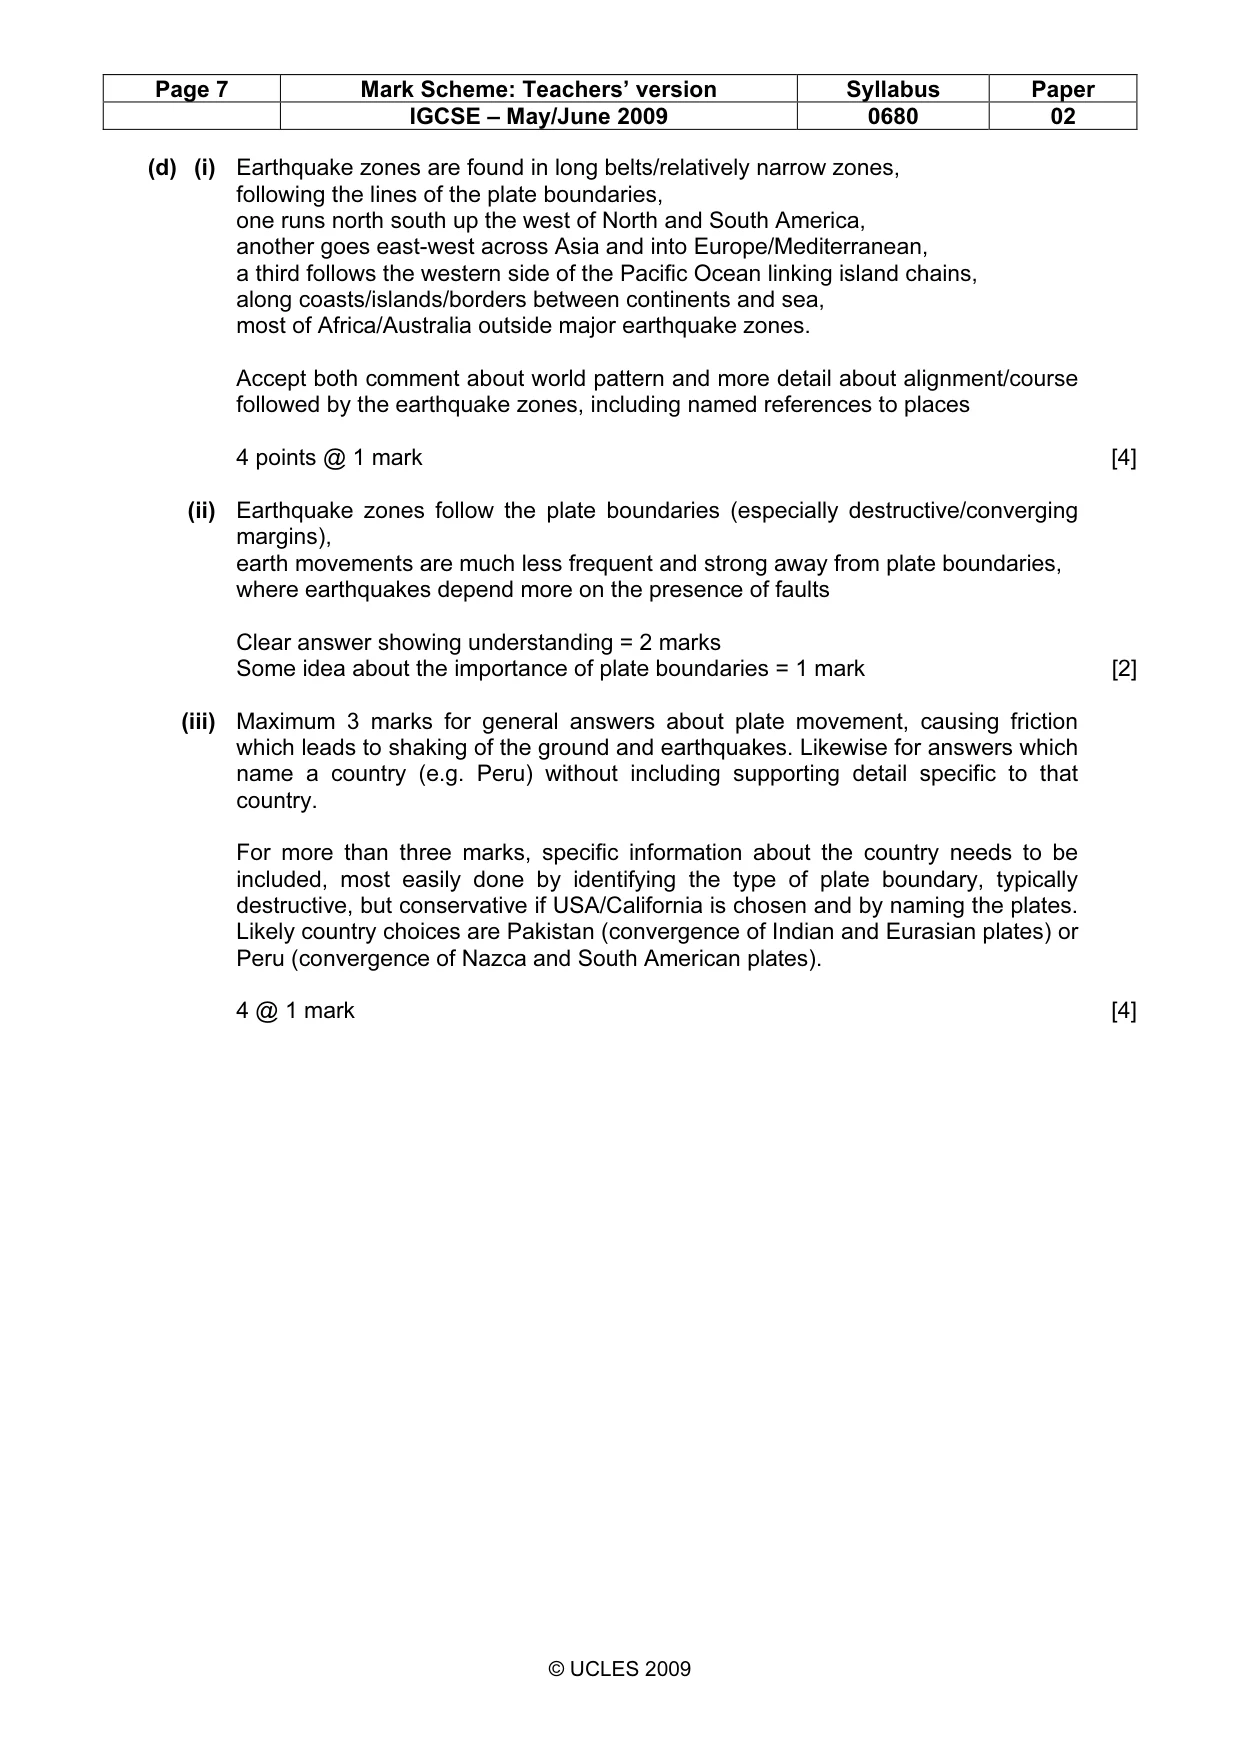
Page 7 Mark Scheme: Teachers’ version Syllabus Paper IGCSE – May/June 2009 0680 02 © UCLES 2009 (d) (i) Earthquake zones are found in long belts/relatively narrow zones, following the lines of the plate boundaries, one runs north south up the west of North and South America, another goes east-west across Asia and into Europe/Mediterranean, a third follows the western side of the Pacific Ocean linking island chains, along coasts/islands/borders between continents and sea, most of Africa/Australia outside major earthquake zones. Accept both comment about world pattern and more detail about alignment/course followed by the earthquake zones, including named references to places 4 points @ 1 mark [4] (ii) Earthquake zones follow the plate boundaries (especially destructive/converging margins), earth movements are much less frequent and strong away from plate boundaries, where earthquakes depend more on the presence of faults Clear answer showing understanding = 2 marks Some idea about the importance of plate boundaries = 1 mark [2] (iii) Maximum 3 marks for general answers about plate movement, causing friction which leads to shaking of the ground and earthquakes. Likewise for answers which name a country (e.g. Peru) without including supporting detail specific to that country. For more than three marks, specific information about the country needs to be included, most easily done by identifying the type of plate boundary, typically destructive, but conservative if USA/California is chosen and by naming the plates. Likely country choices are Pakistan (convergence of Indian and Eurasian plates) or Peru (convergence of Nazca and South American plates). 4 @ 1 mark [4]
Mark scheme, page 8
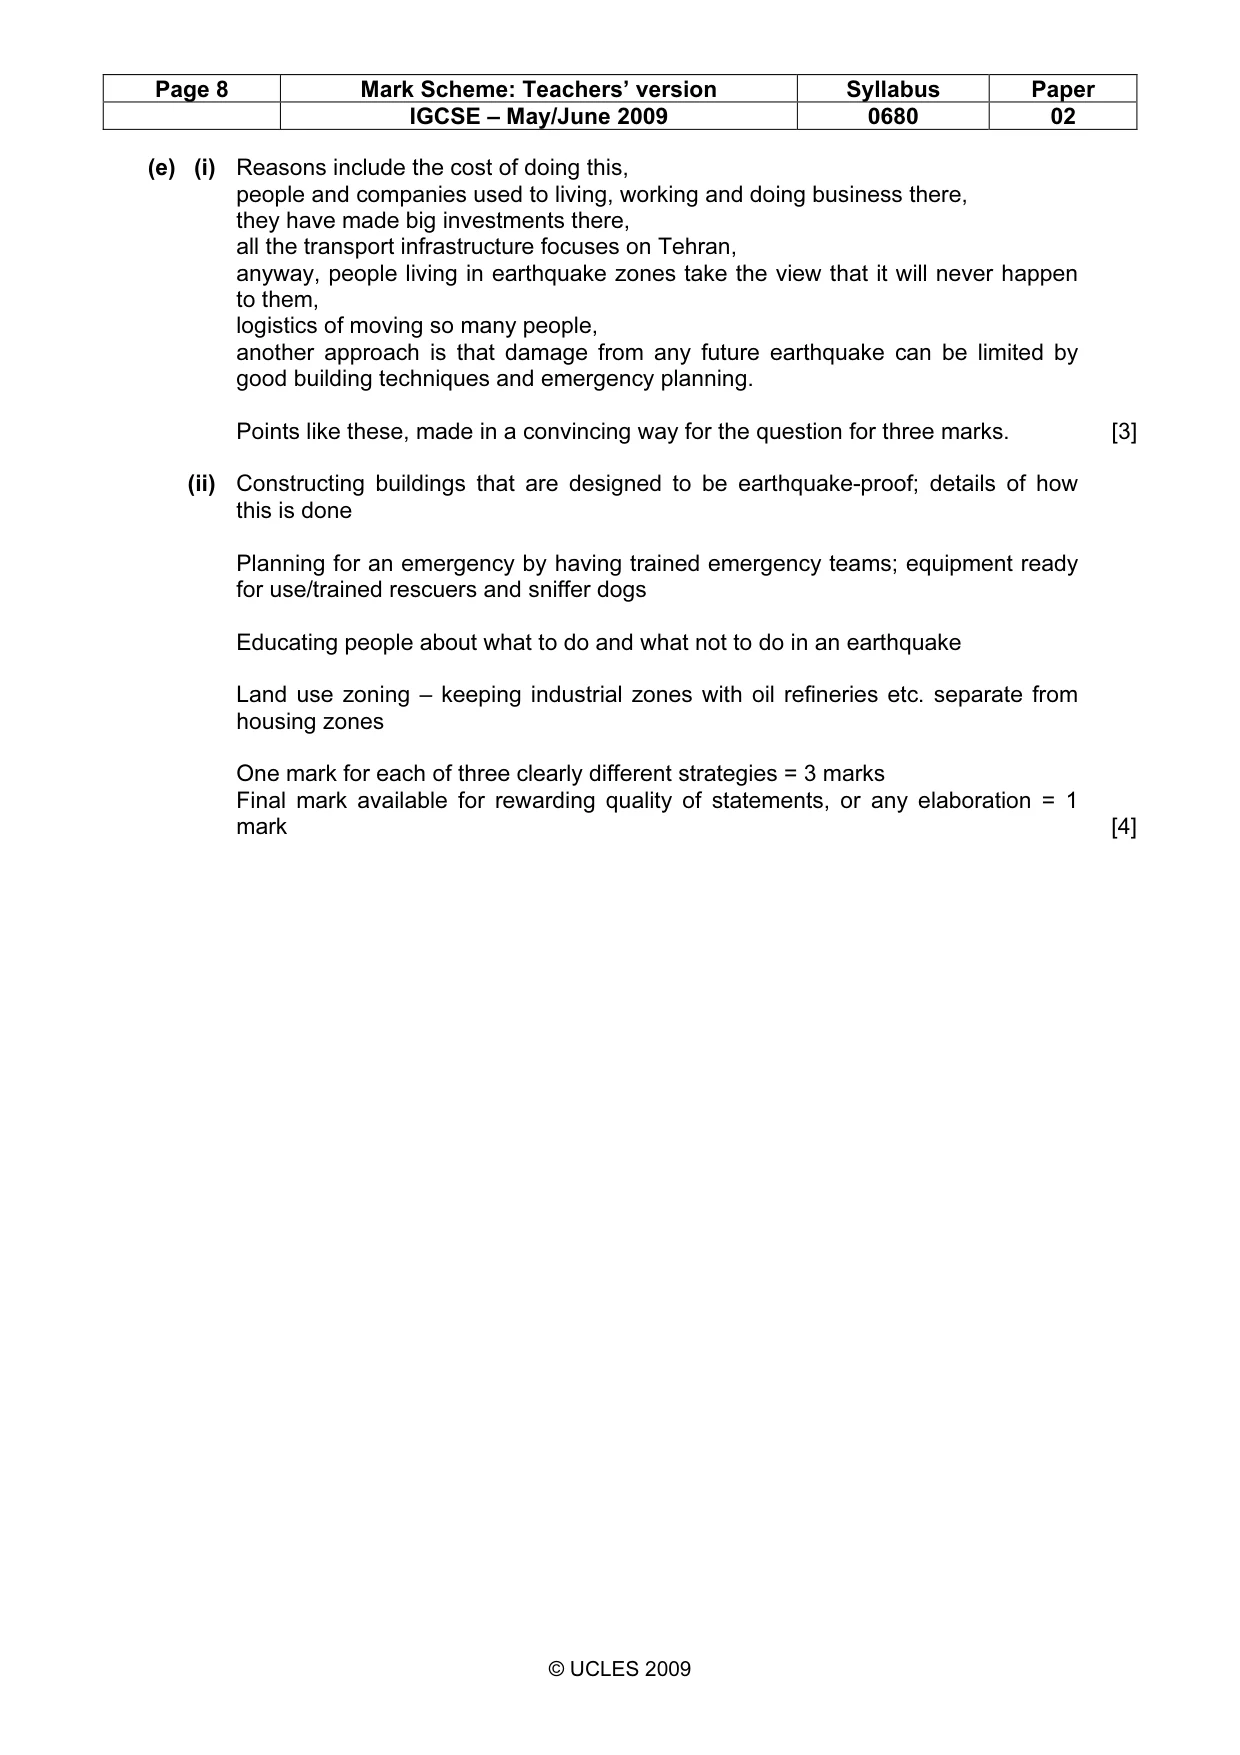
Page 8 Mark Scheme: Teachers’ version Syllabus Paper IGCSE – May/June 2009 0680 02 © UCLES 2009 (e) (i) Reasons include the cost of doing this, people and companies used to living, working and doing business there, they have made big investments there, all the transport infrastructure focuses on Tehran, anyway, people living in earthquake zones take the view that it will never happen to them, logistics of moving so many people, another approach is that damage from any future earthquake can be limited by good building techniques and emergency planning. Points like these, made in a convincing way for the question for three marks. [3] (ii) Constructing buildings that are designed to be earthquake-proof; details of how this is done Planning for an emergency by having trained emergency teams; equipment ready for use/trained rescuers and sniffer dogs Educating people about what to do and what not to do in an earthquake Land use zoning – keeping industrial zones with oil refineries etc. separate from housing zones One mark for each of three clearly different strategies = 3 marks Final mark available for rewarding quality of statements, or any elaboration = 1 mark [4]
Mark scheme, page 9
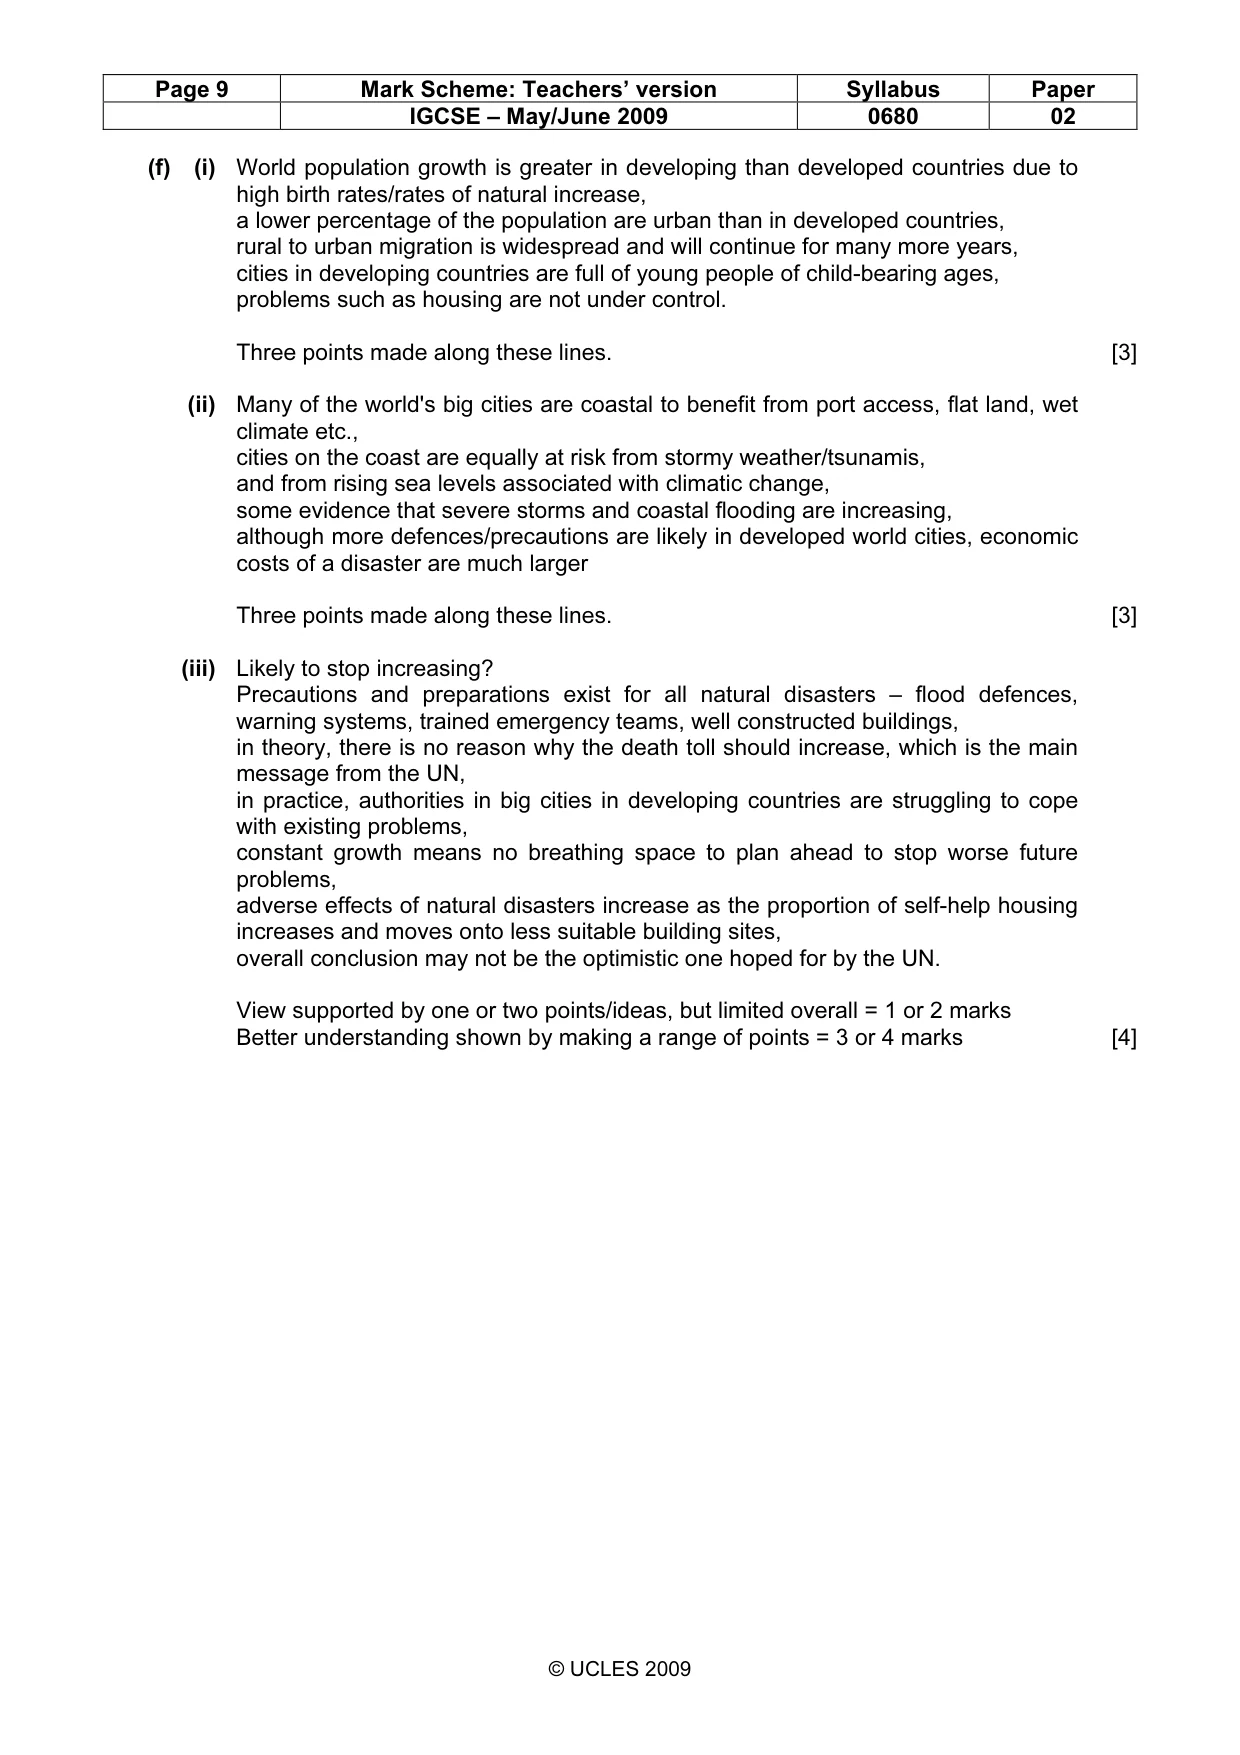
Page 9 Mark Scheme: Teachers’ version Syllabus Paper IGCSE – May/June 2009 0680 02 © UCLES 2009 (f) (i) World population growth is greater in developing than developed countries due to high birth rates/rates of natural increase, a lower percentage of the population are urban than in developed countries, rural to urban migration is widespread and will continue for many more years, cities in developing countries are full of young people of child-bearing ages, problems such as housing are not under control. Three points made along these lines. [3] (ii) Many of the world's big cities are coastal to benefit from port access, flat land, wet climate etc., cities on the coast are equally at risk from stormy weather/tsunamis, and from rising sea levels associated with climatic change, some evidence that severe storms and coastal flooding are increasing, although more defences/precautions are likely in developed world cities, economic costs of a disaster are much larger Three points made along these lines. [3] (iii) Likely to stop increasing? Precautions and preparations exist for all natural disasters – flood defences, warning systems, trained emergency teams, well constructed buildings, in theory, there is no reason why the death toll should increase, which is the main message from the UN, in practice, authorities in big cities in developing countries are struggling to cope with existing problems, constant growth means no breathing space to plan ahead to stop worse future problems, adverse effects of natural disasters increase as the proportion of self-help housing increases and moves onto less suitable building sites, overall conclusion may not be the optimistic one hoped for by the UN. View supported by one or two points/ideas, but limited overall = 1 or 2 marks Better understanding shown by making a range of points = 3 or 4 marks [4]
Mark scheme, page 10
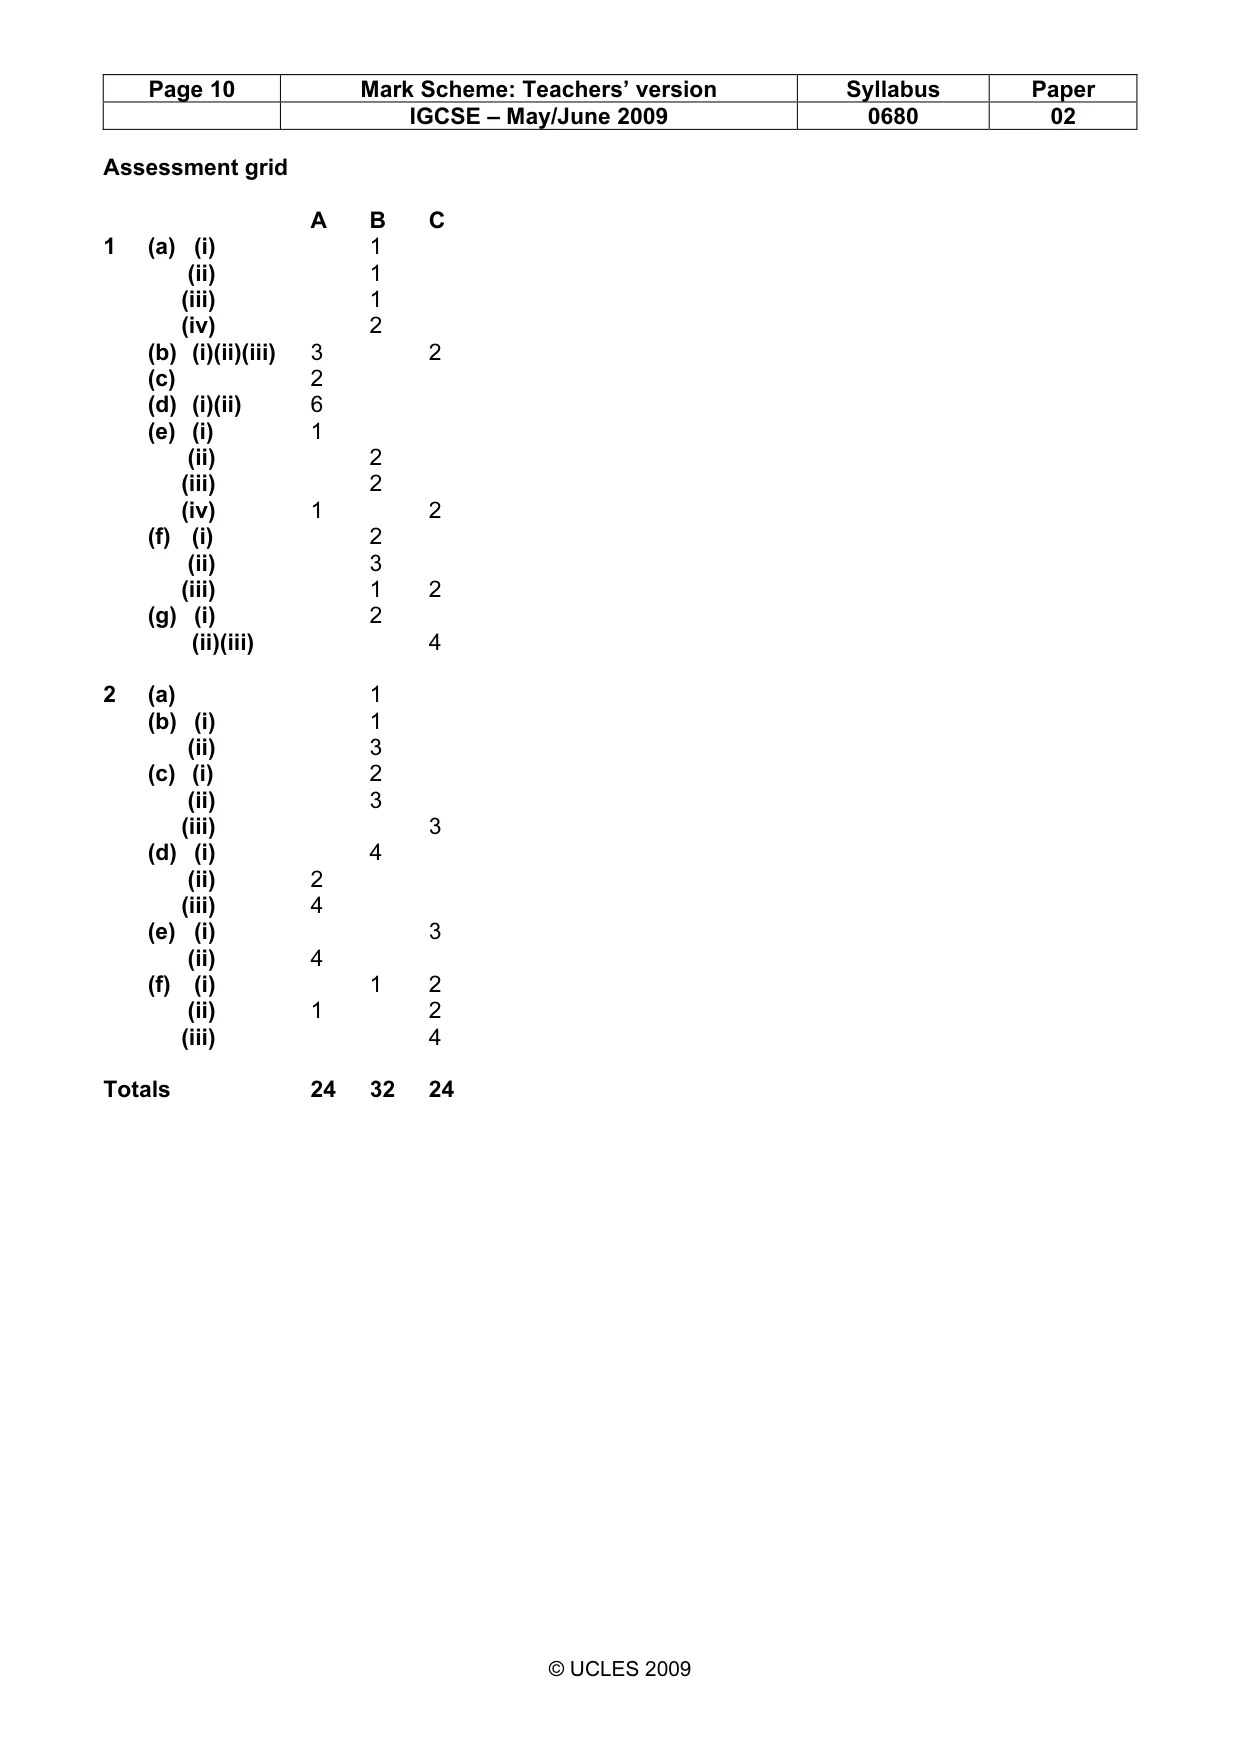
Page 10 Mark Scheme: Teachers’ version Syllabus Paper IGCSE – May/June 2009 0680 02 © UCLES 2009 Assessment grid A B C 1 (a) (i) 1 (ii) 1 (iii) 1 (iv) 2 (b) (i)(ii)(iii) 3 2 (c) 2 (d) (i)(ii) 6 (e) (i) 1 (ii) 2 (iii) 2 (iv) 1 2 (f) (i) 2 (ii) 3 (iii) 1 2 (g) (i) 2 (ii)(iii) 4 2 (a) 1 (b) (i) 1 (ii) 3 (c) (i) 2 (ii) 3 (iii) 3 (d) (i) 4 (ii) 2 (iii) 4 (e) (i) 3 (ii) 4 (f) (i) 1 2 (ii) 1 2 (iii) 4 Totals 24 32 24
What you needed in this session
Cambridge’s own grade thresholds for 2009 May/June, Paper 2 · Variant 1. A higher threshold means an easier paper — the bar moves with how the cohort did.