Cambridge IGCSE Environmental Management 0680 — 2008 May/June Paper 2 · Variant 1
0680/21/M/J/08 · 80 marks · ≈90 min
The question paper and its mark scheme, free to read here and free to download. This is Cambridge’s own paper, exactly as it was sat.
Question paper20 pages




Mark scheme9 pages
Answers below. Sit the paper first if you are practising.
Paper as text
Question paper, page 1
READ THESE INSTRUCTIONS FIRST Write your Centre number, candidate number and name on all the work you hand in. Write in dark blue or black pen. You may use a soft pencil for any diagrams, graphs or rough working. Do not use staples, paper clips, highlighters, glue or correction fluid. DO NOT WRITE IN ANY BARCODES. Answer both questions. At the end of the examination, fasten all your work securely together. The number of marks is given in brackets [ ] at the end of each question or part question. For Examiner’s Use 1 2 Total This document consists of 17 printed pages and 3 blank pages. SPA (KN) T48214/2 © UCLES 2008 [Turn over UNIVERSITY OF CAMBRIDGE INTERNATIONAL EXAMINATIONS International General Certificate of Secondary Education * 2 6 7 8 4 4 4 1 4 4 * ENVIRONMENTAL MANAGEMENT 0680/02 Paper 2 May/June 2008 1 hour 45 minutes Candidates answer on the Question Paper. Additional Materials: Ruler www.XtremePapers.com
Question paper, page 2
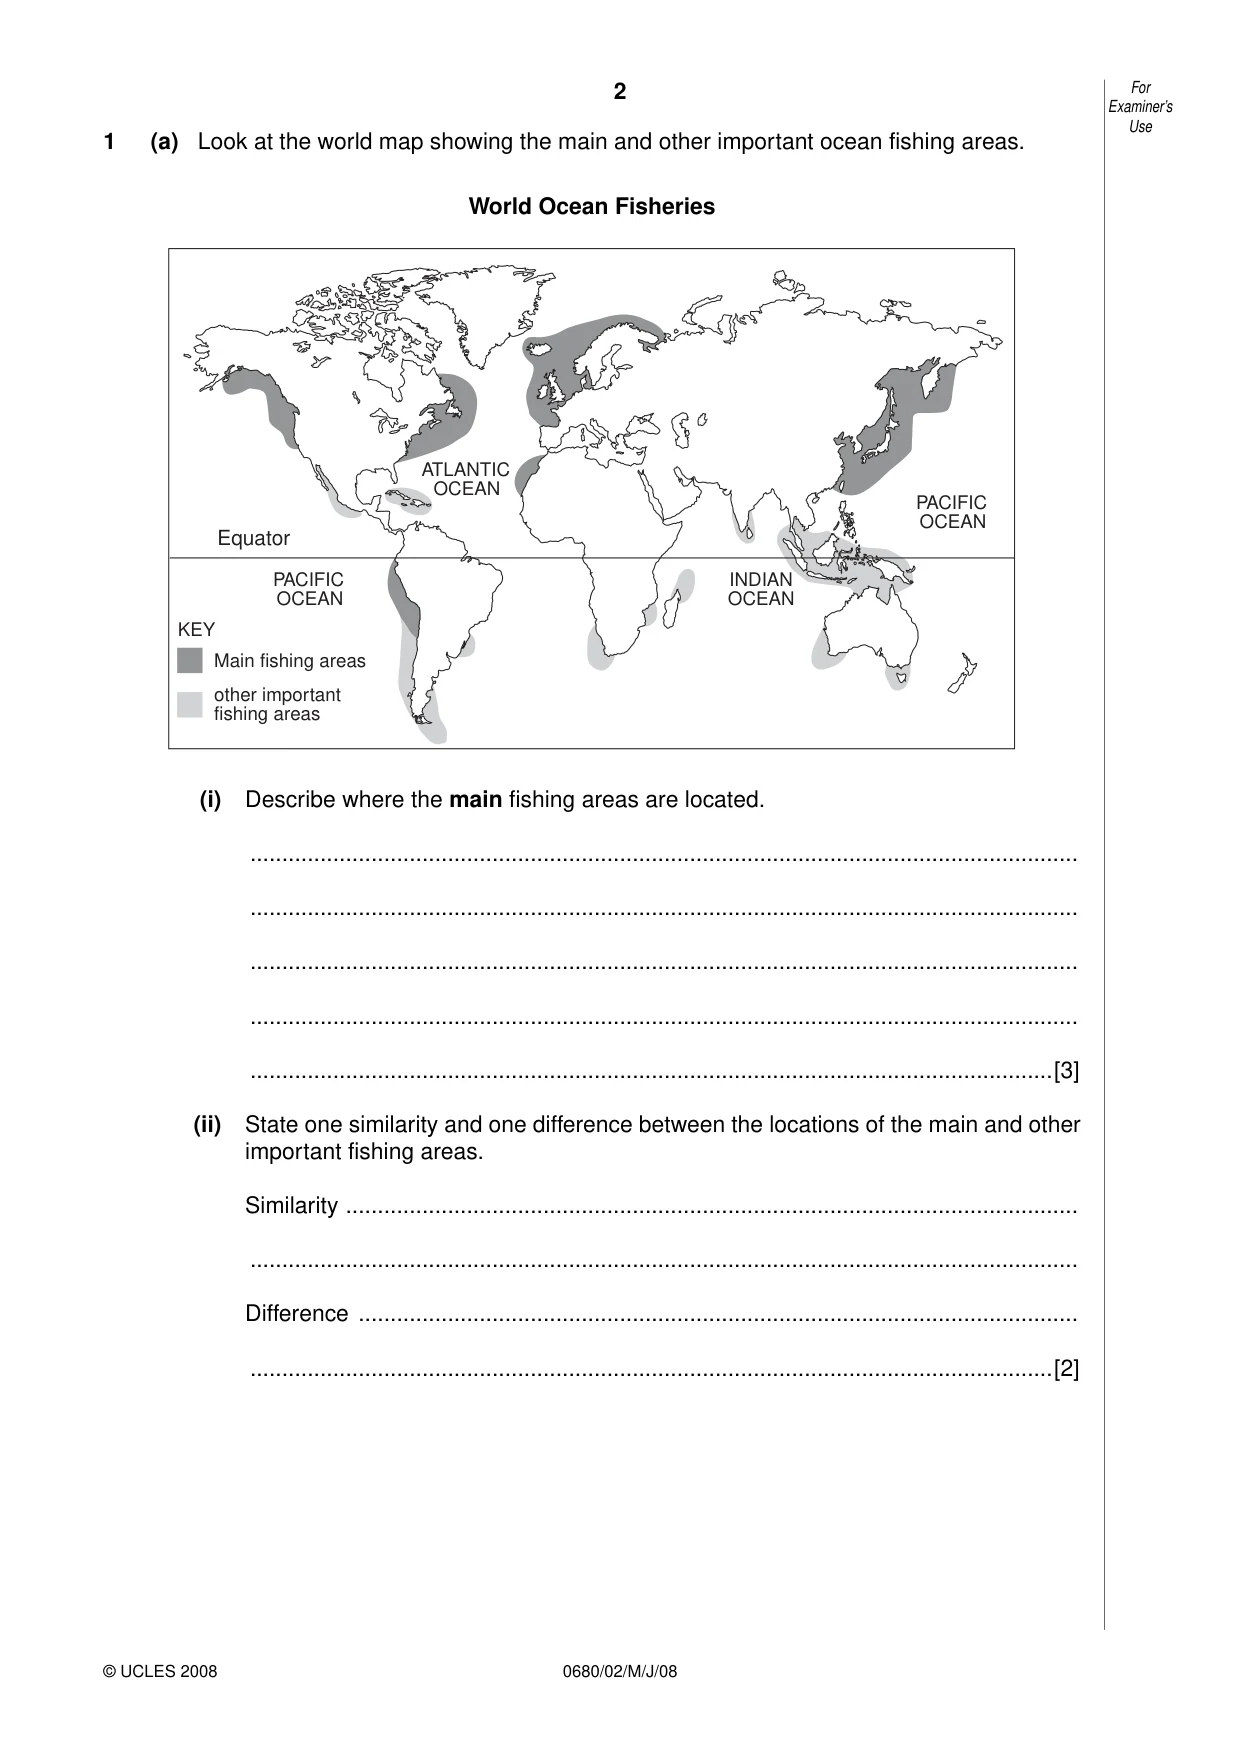
2 0680/02/M/J/08 For Examiner’s Use © UCLES 2008 1 (a) Look at the world map showing the main and other important ocean fishing areas. World Ocean Fisheries Equator Main fishing areas PACIFIC OCEAN ATLANTIC OCEAN INDIAN OCEAN PACIFIC OCEAN other important fishing areas KEY (i) Describe where the main fishing areas are located. … … … … …[3] (ii) State one similarity and one difference between the locations of the main and other important fishing areas. Similarity … … Difference … …[2]
Question paper, page 3
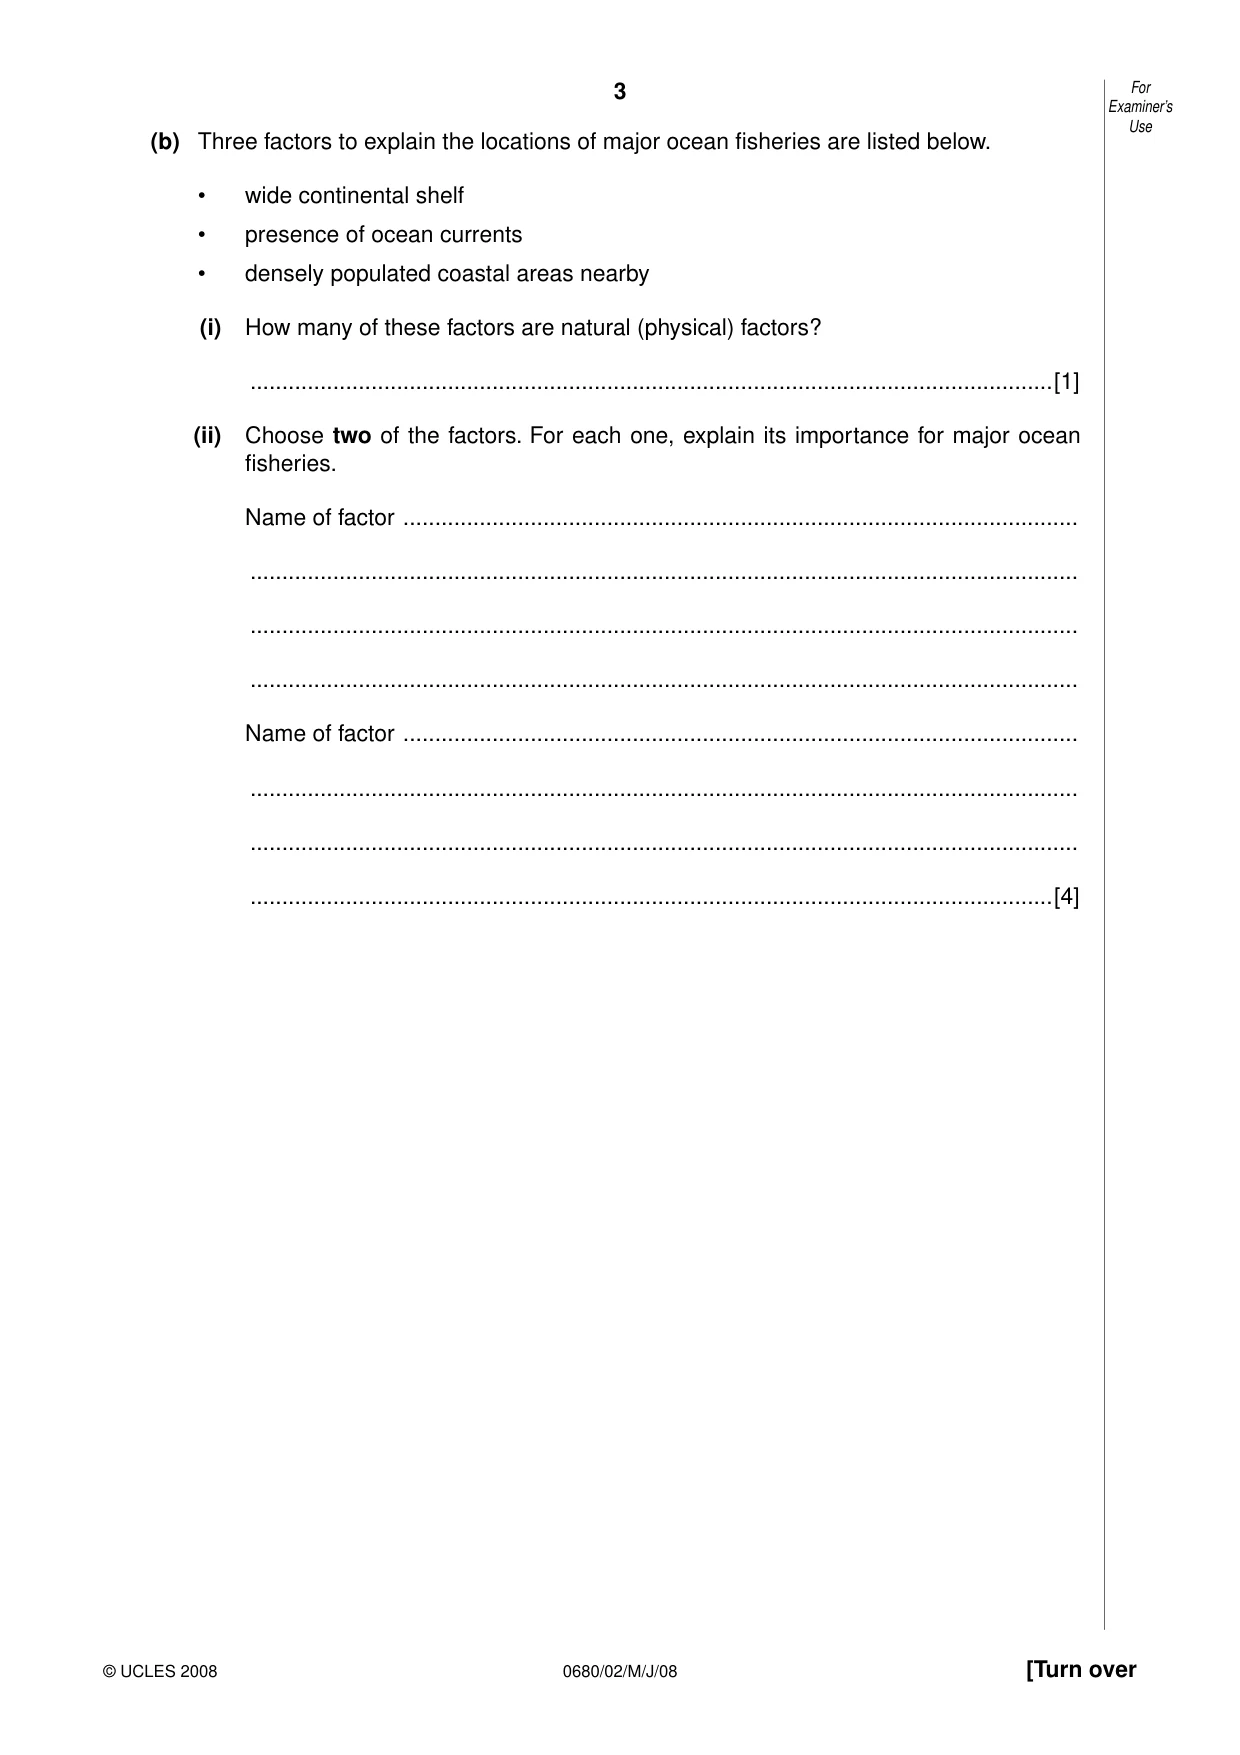
3 0680/02/M/J/08 [Turn over For Examiner’s Use © UCLES 2008 (b) Three factors to explain the locations of major ocean fisheries are listed below. • wide continental shelf • presence of ocean currents • densely populated coastal areas nearby (i) How many of these factors are natural (physical) factors? …[1] (ii) Choose two of the factors. For each one, explain its importance for major ocean fisheries. Name of factor … … … … Name of factor … … … …[4]
Question paper, page 4
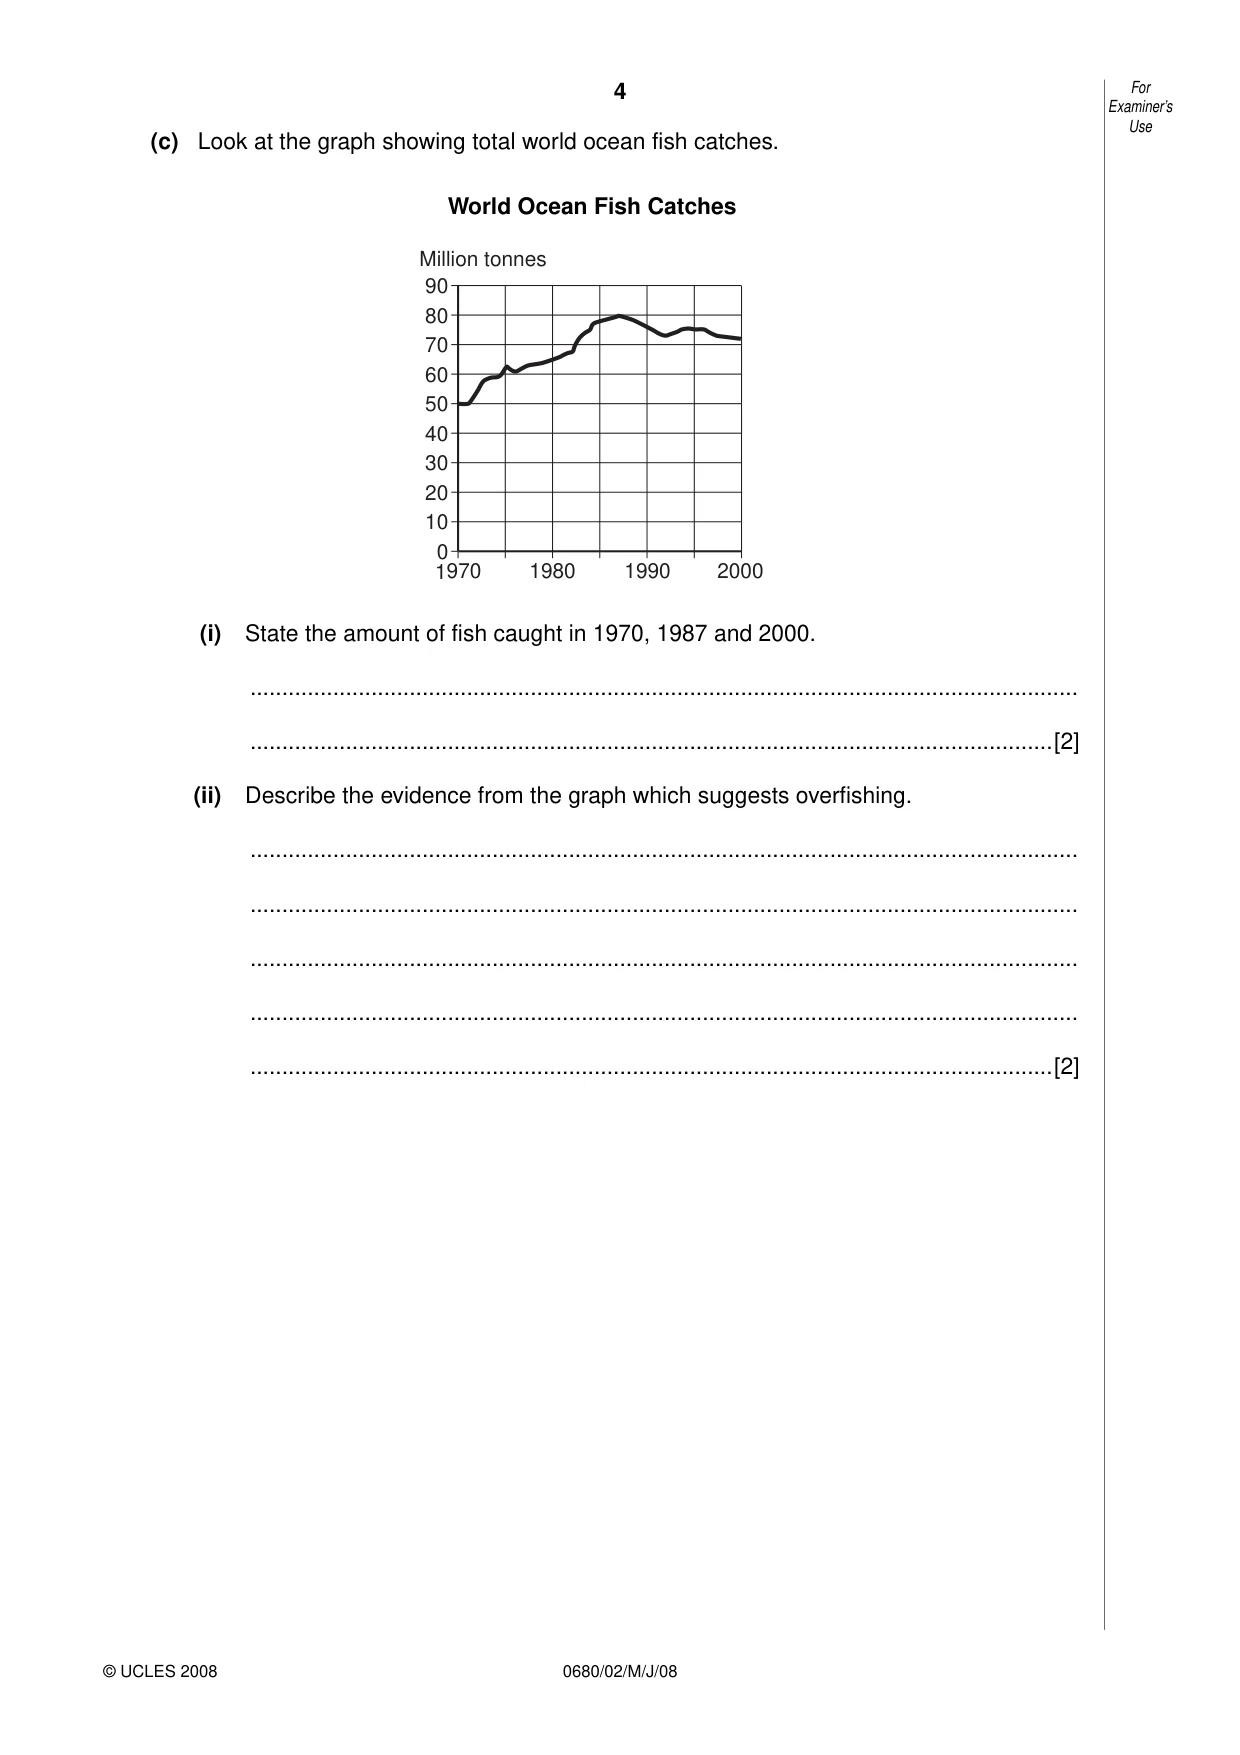
4 0680/02/M/J/08 For Examiner’s Use © UCLES 2008 (c) Look at the graph showing total world ocean fish catches. World Ocean Fish Catches 0 10 20 30 40 50 60 70 80 90 1970 1980 1990 2000 Million tonnes (i) State the amount of fish caught in 1970, 1987 and 2000. … …[2] (ii) Describe the evidence from the graph which suggests overfishing. … … … … …[2]
Question paper, page 5
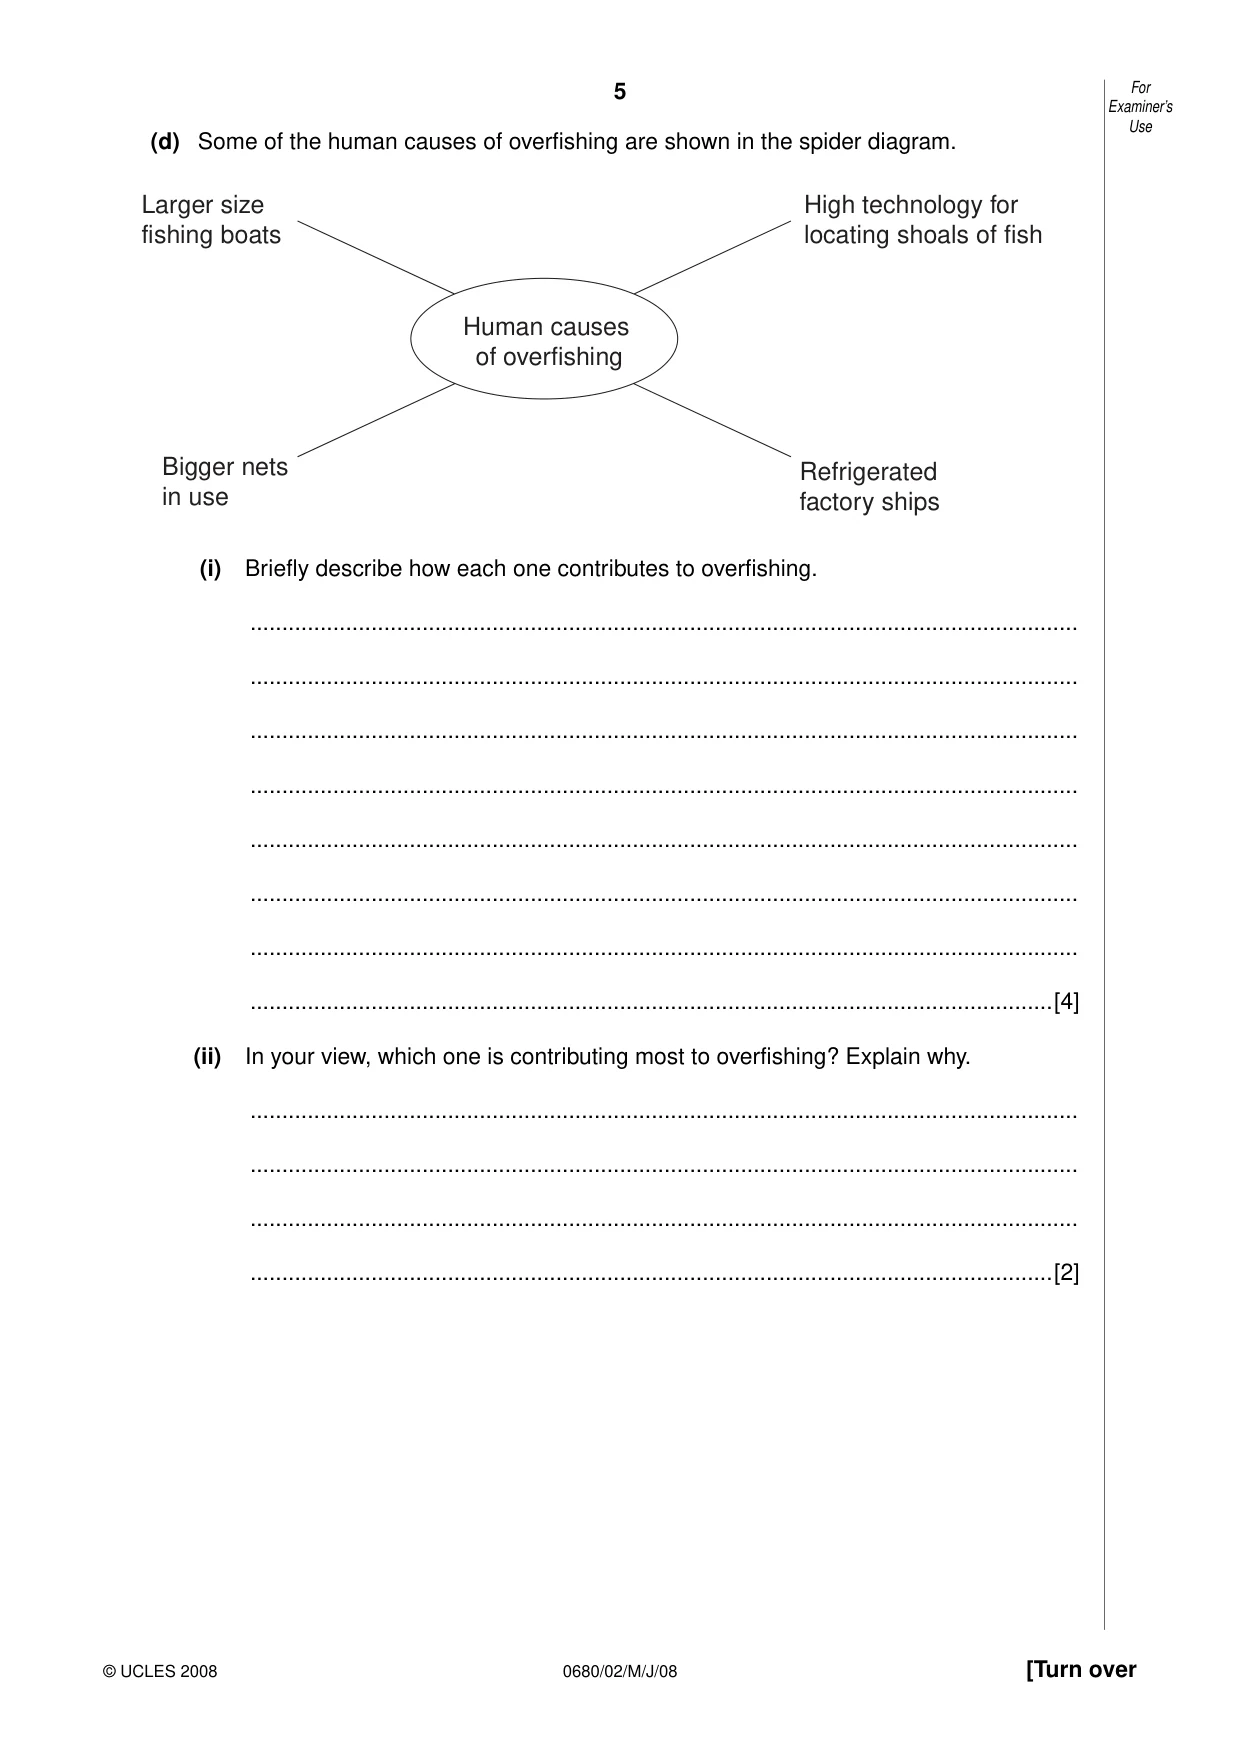
5 0680/02/M/J/08 [Turn over For Examiner’s Use © UCLES 2008 (d) Some of the human causes of overfishing are shown in the spider diagram. Human causes of overfishing High technology for locating shoals of fish Larger size fishing boats Bigger nets in use Refrigerated factory ships (i) Briefly describe how each one contributes to overfishing. … … … … … … … …[4] (ii) In your view, which one is contributing most to overfishing? Explain why. … … … …[2]
Question paper, page 6
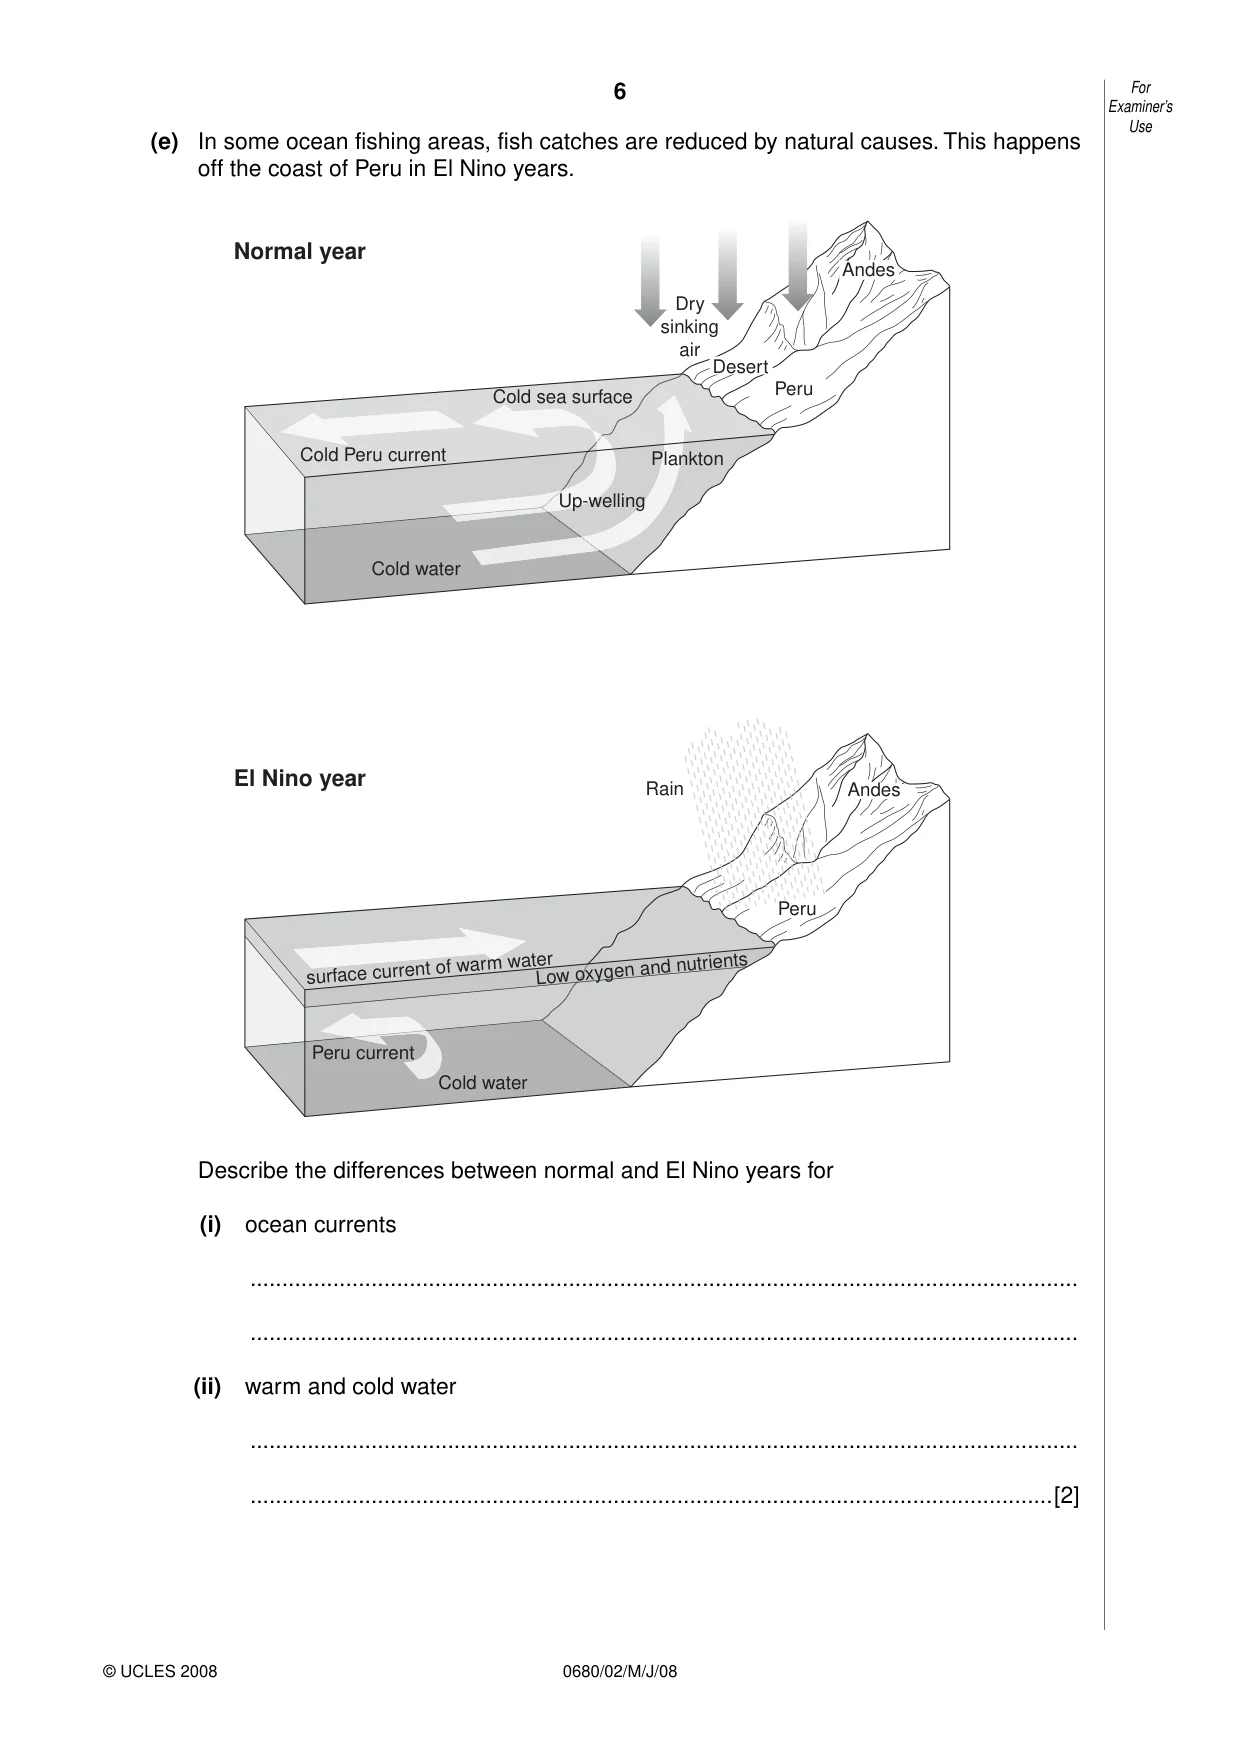
6 0680/02/M/J/08 For Examiner’s Use © UCLES 2008 (e) In some ocean fishing areas, fish catches are reduced by natural causes. This happens off the coast of Peru in El Nino years. Dry sinking air Peru Peru Rain Desert Andes Plankton Up-welling Cold sea surface Cold Peru current Peru current Cold water Cold water surface current of warm water Normal year El Nino year Low oxygen and nutrients Andes Describe the differences between normal and El Nino years for (i) ocean currents … … (ii) warm and cold water … …[2]
Question paper, page 7
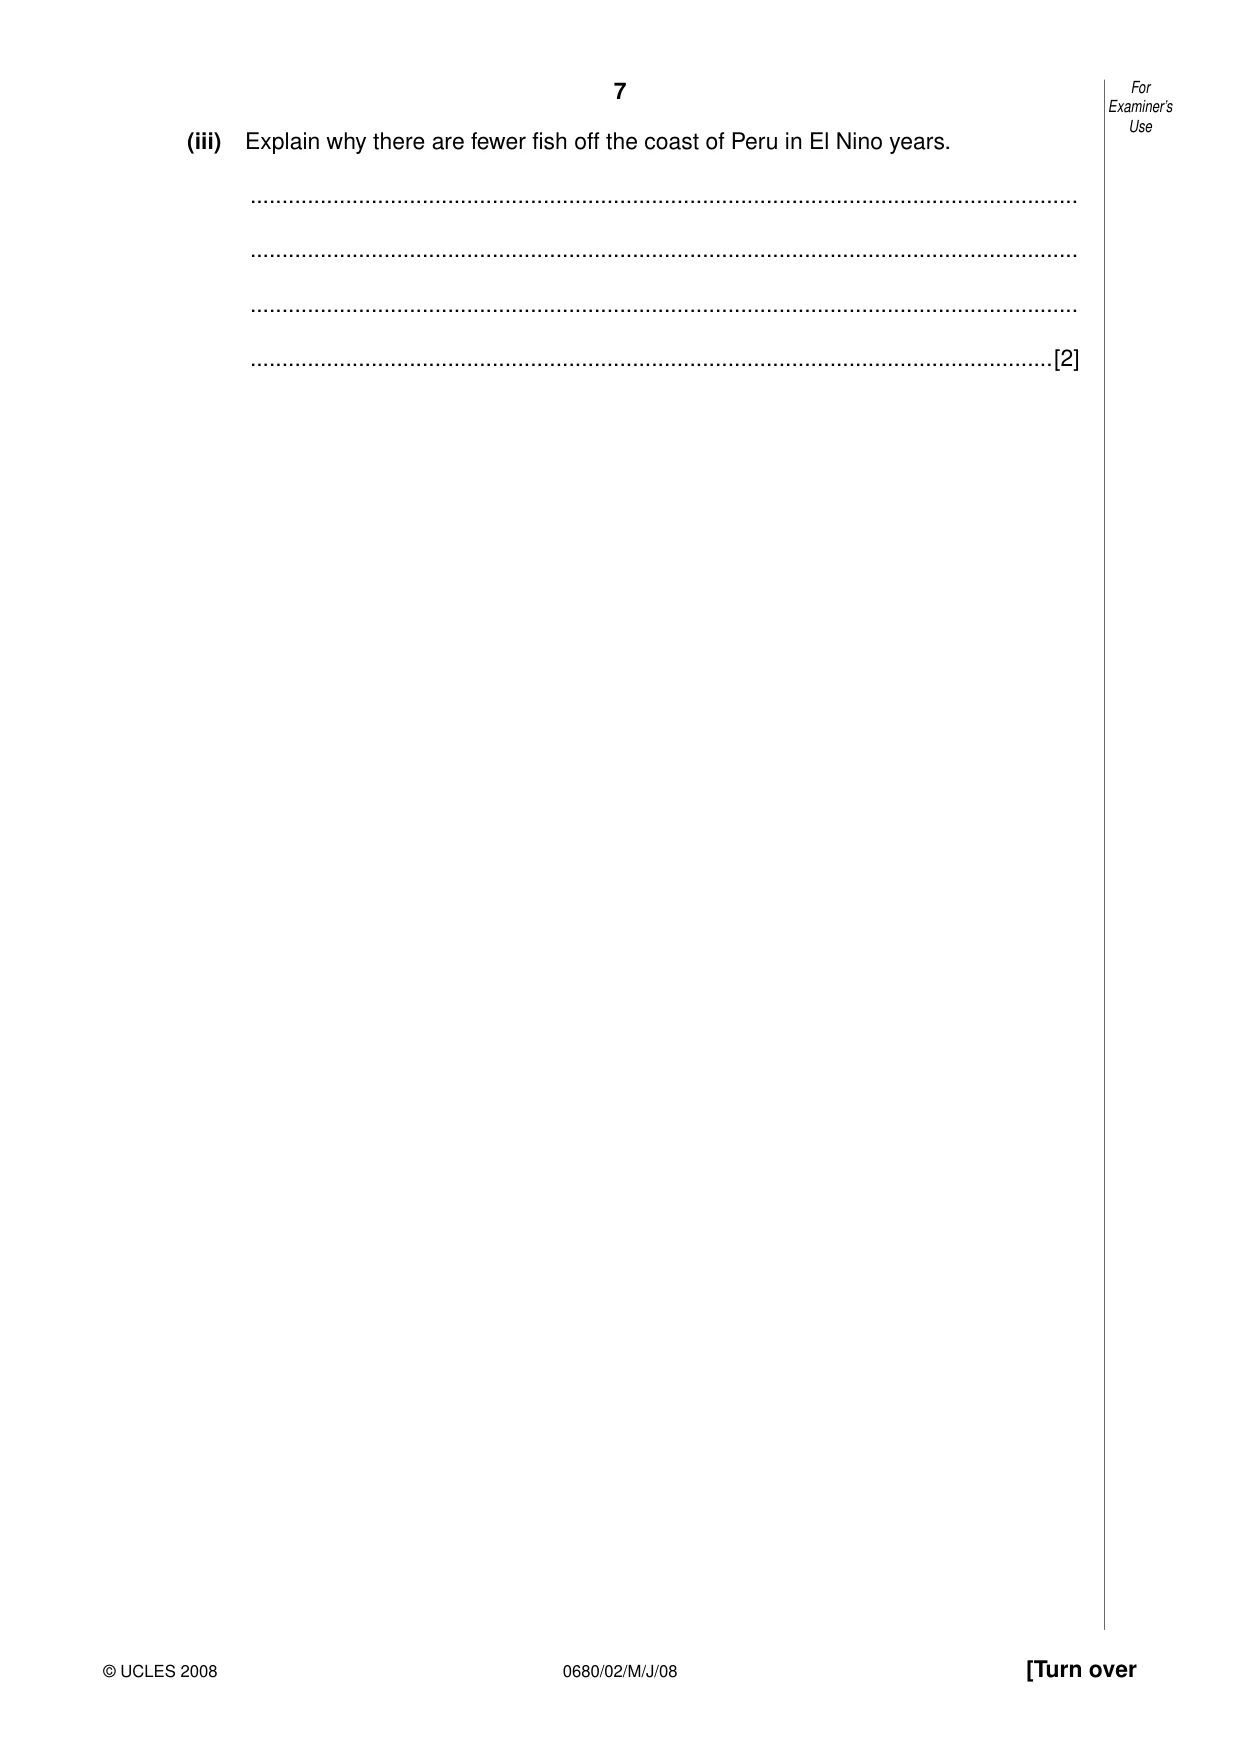
7 0680/02/M/J/08 [Turn over For Examiner’s Use © UCLES 2008 (iii) Explain why there are fewer fish off the coast of Peru in El Nino years. … … … …[2]
Question paper, page 8
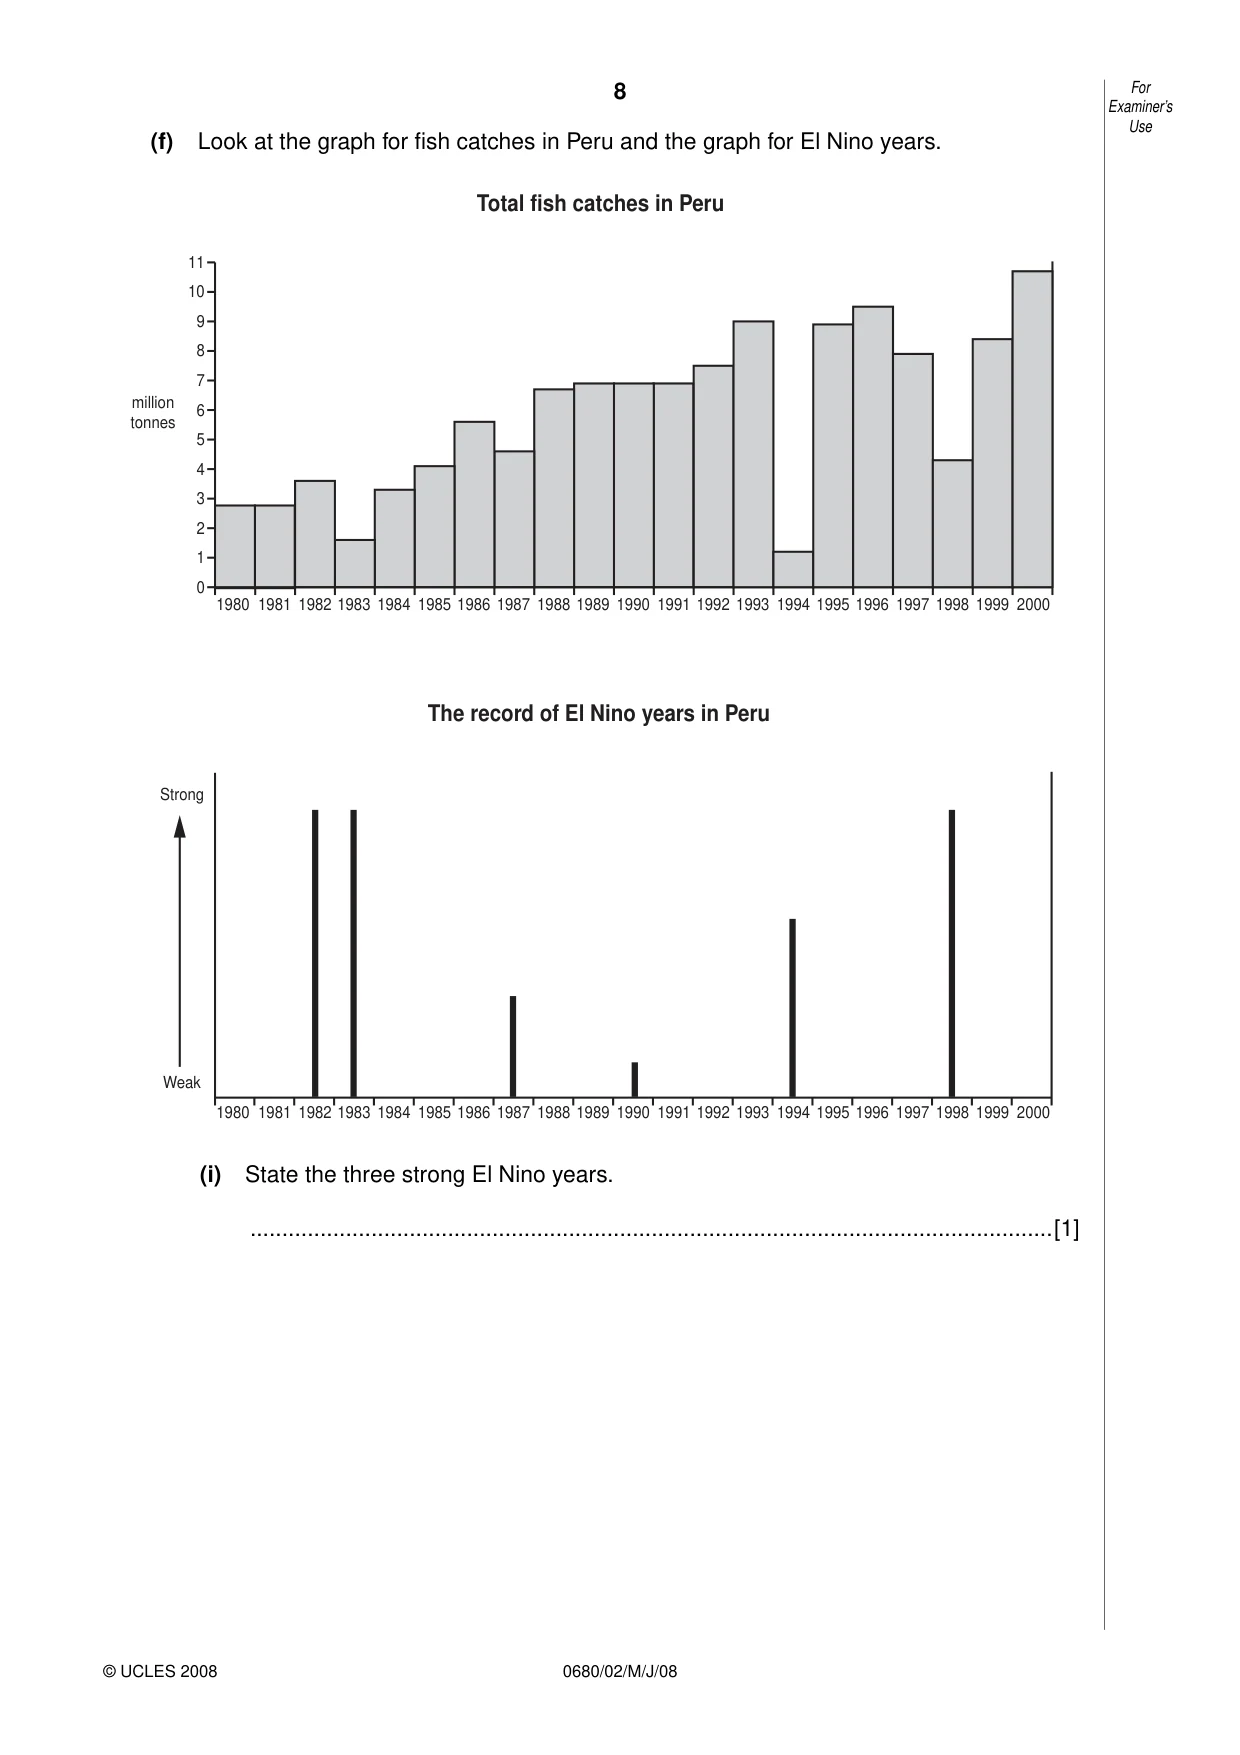
8 0680/02/M/J/08 For Examiner’s Use © UCLES 2008 (f) Look at the graph for fish catches in Peru and the graph for El Nino years. 1980 1981 1982 1983 1984 1985 1986 1987 1988 1989 1990 1991 1992 1993 1994 1995 1996 1997 1998 1999 2000 1980 1981 1982 1983 1984 1985 1986 1987 1988 1989 1990 1991 1992 1993 1994 1995 1996 1997 1998 1999 2000 0 1 2 3 4 5 6 7 8 9 million tonnes 10 11 Total fish catches in Peru Strong Weak The record of El Nino years in Peru (i) State the three strong El Nino years. …[1]
Question paper, page 9
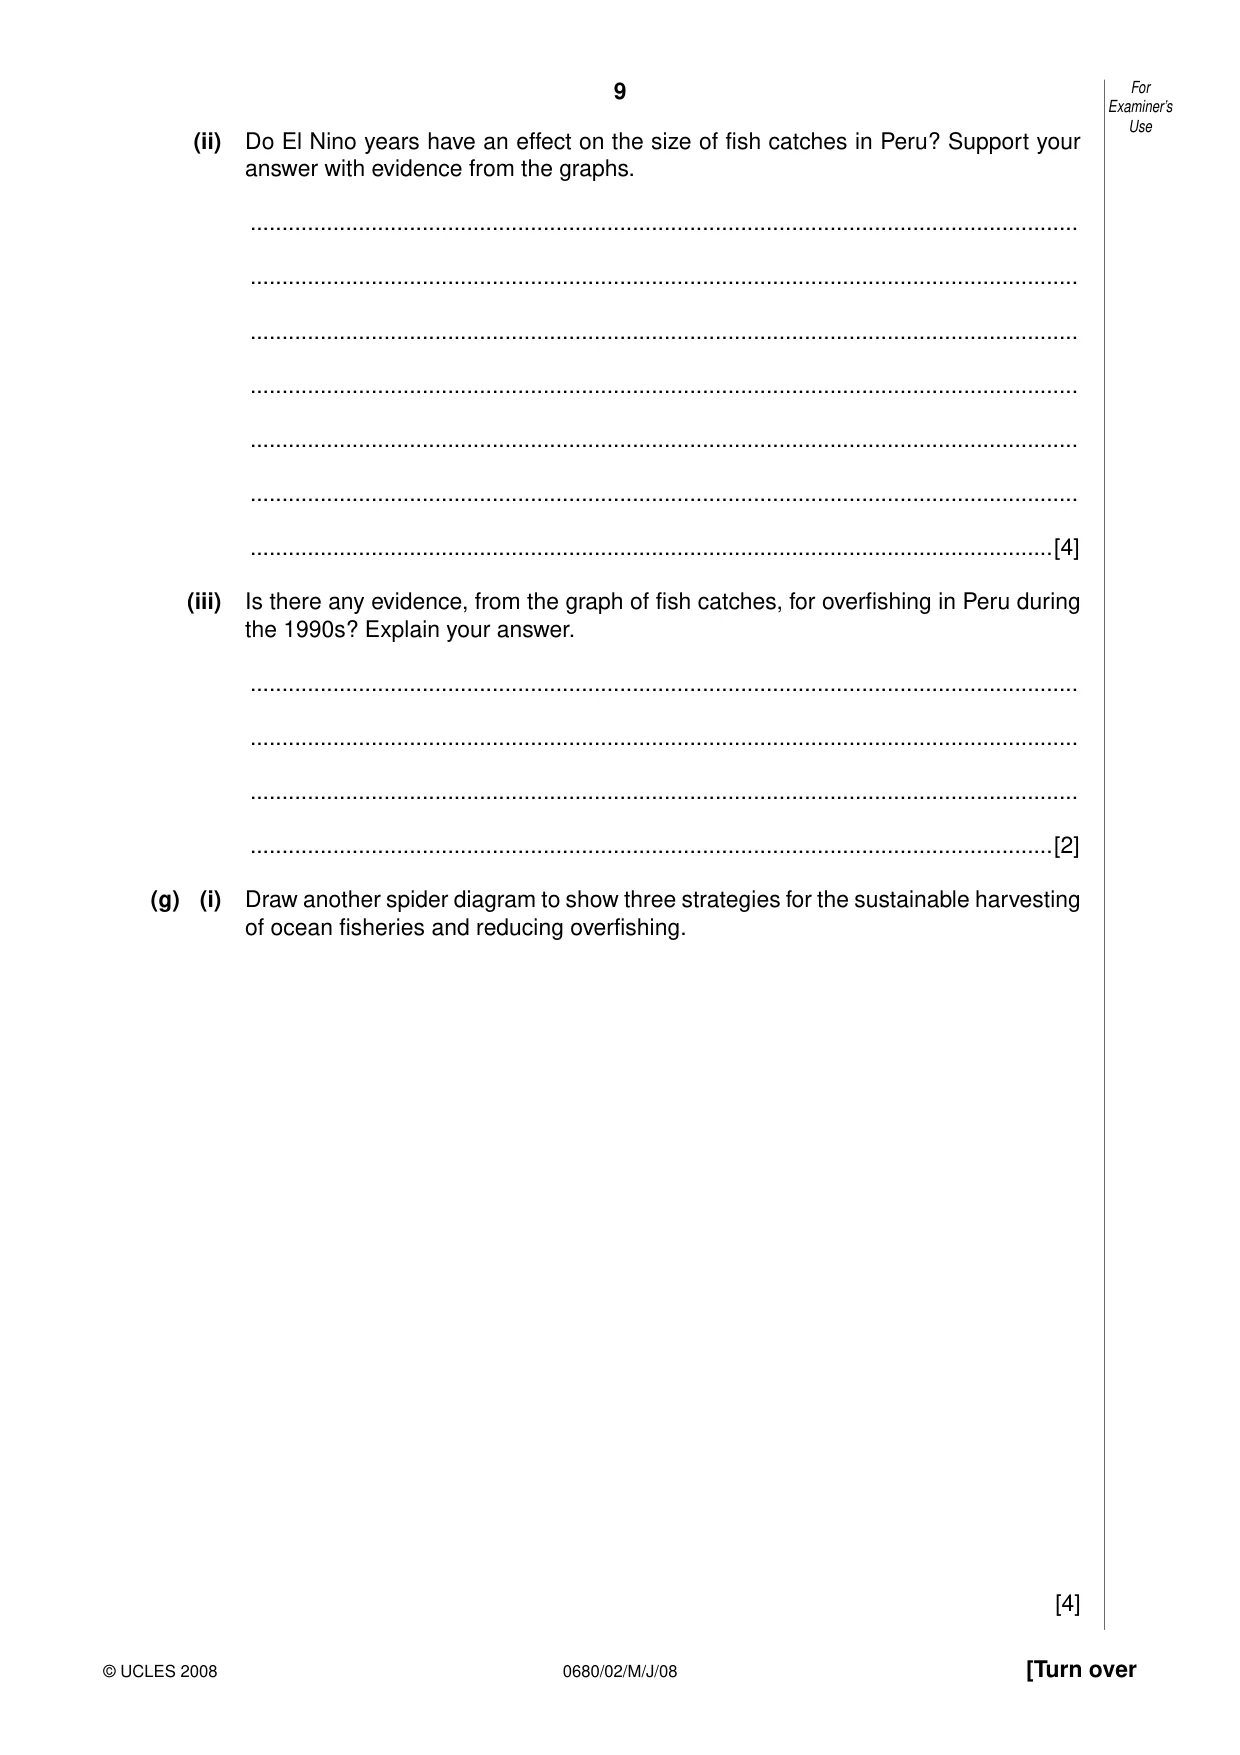
9 0680/02/M/J/08 [Turn over For Examiner’s Use © UCLES 2008 (ii) Do El Nino years have an effect on the size of fish catches in Peru? Support your answer with evidence from the graphs. … … … … … … …[4] (iii) Is there any evidence, from the graph of fish catches, for overfishing in Peru during the 1990s? Explain your answer. … … … …[2] (g) (i) Draw another spider diagram to show three strategies for the sustainable harvesting of ocean fisheries and reducing overfishing. [4]
Question paper, page 10
10 0680/02/M/J/08 For Examiner’s Use © UCLES 2008 (ii) Are these strategies for the sustainable harvesting of ocean fisheries easy or difficult to carry out? Explain your views on this. … … … … … … … … … …[5] [Total: 40]
Question paper, page 11
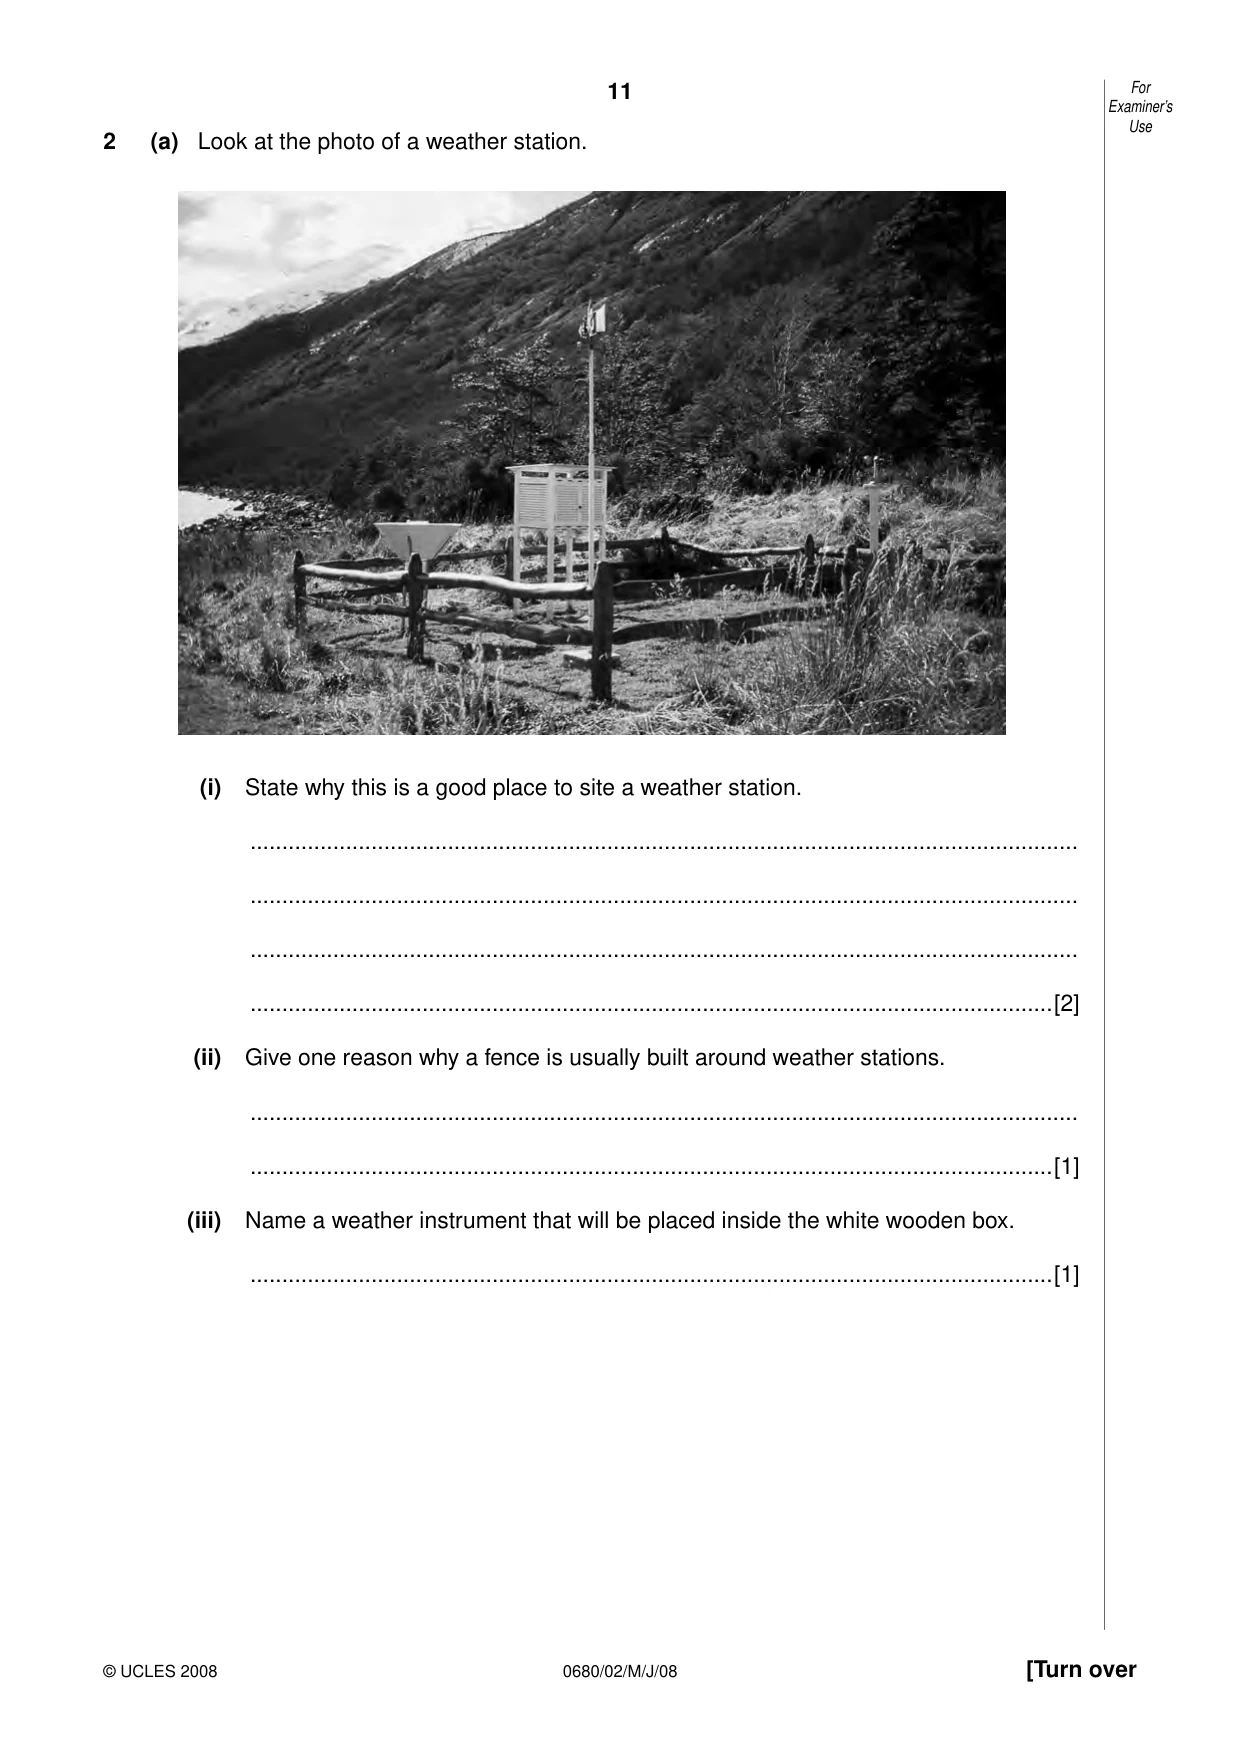
11 0680/02/M/J/08 [Turn over For Examiner’s Use © UCLES 2008 2 (a) Look at the photo of a weather station. (i) State why this is a good place to site a weather station. … … … …[2] (ii) Give one reason why a fence is usually built around weather stations. … …[1] (iii) Name a weather instrument that will be placed inside the white wooden box. …[1]
Question paper, page 12
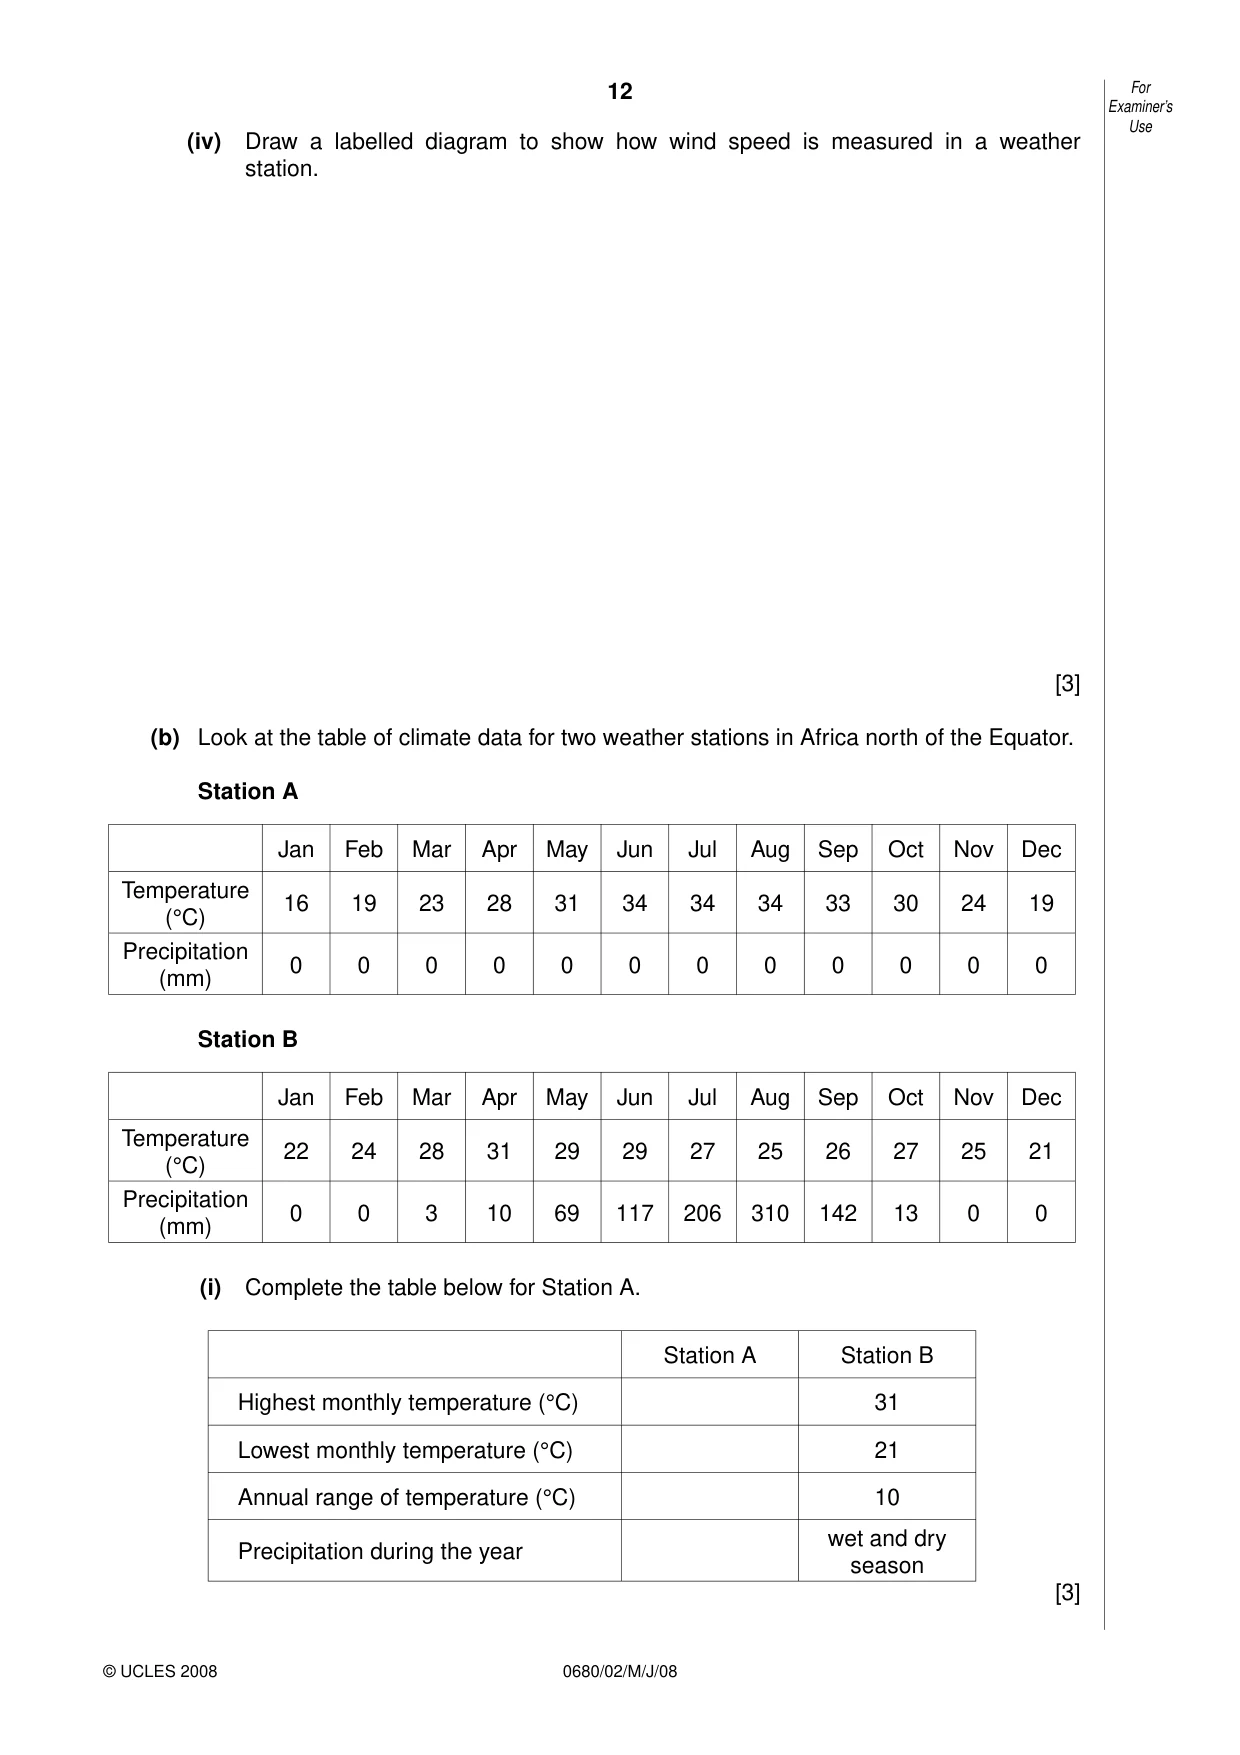
12 0680/02/M/J/08 For Examiner’s Use © UCLES 2008 (iv) Draw a labelled diagram to show how wind speed is measured in a weather station. [3] (b) Look at the table of climate data for two weather stations in Africa north of the Equator. Station A Jan Feb Mar Apr May Jun Jul Aug Sep Oct Nov Dec Temperature (°C) 16 19 23 28 31 34 34 34 33 30 24 19 Precipitation (mm) 0 0 0 0 0 0 0 0 0 0 0 0 Station B Jan Feb Mar Apr May Jun Jul Aug Sep Oct Nov Dec Temperature (°C) 22 24 28 31 29 29 27 25 26 27 25 21 Precipitation (mm) 0 0 3 10 69 117 206 310 142 13 0 0 (i) Complete the table below for Station A. Station A Station B Highest monthly temperature (°C) 31 Lowest monthly temperature (°C) 21 Annual range of temperature (°C) 10 Precipitation during the year wet and dry season [3]
Question paper, page 13
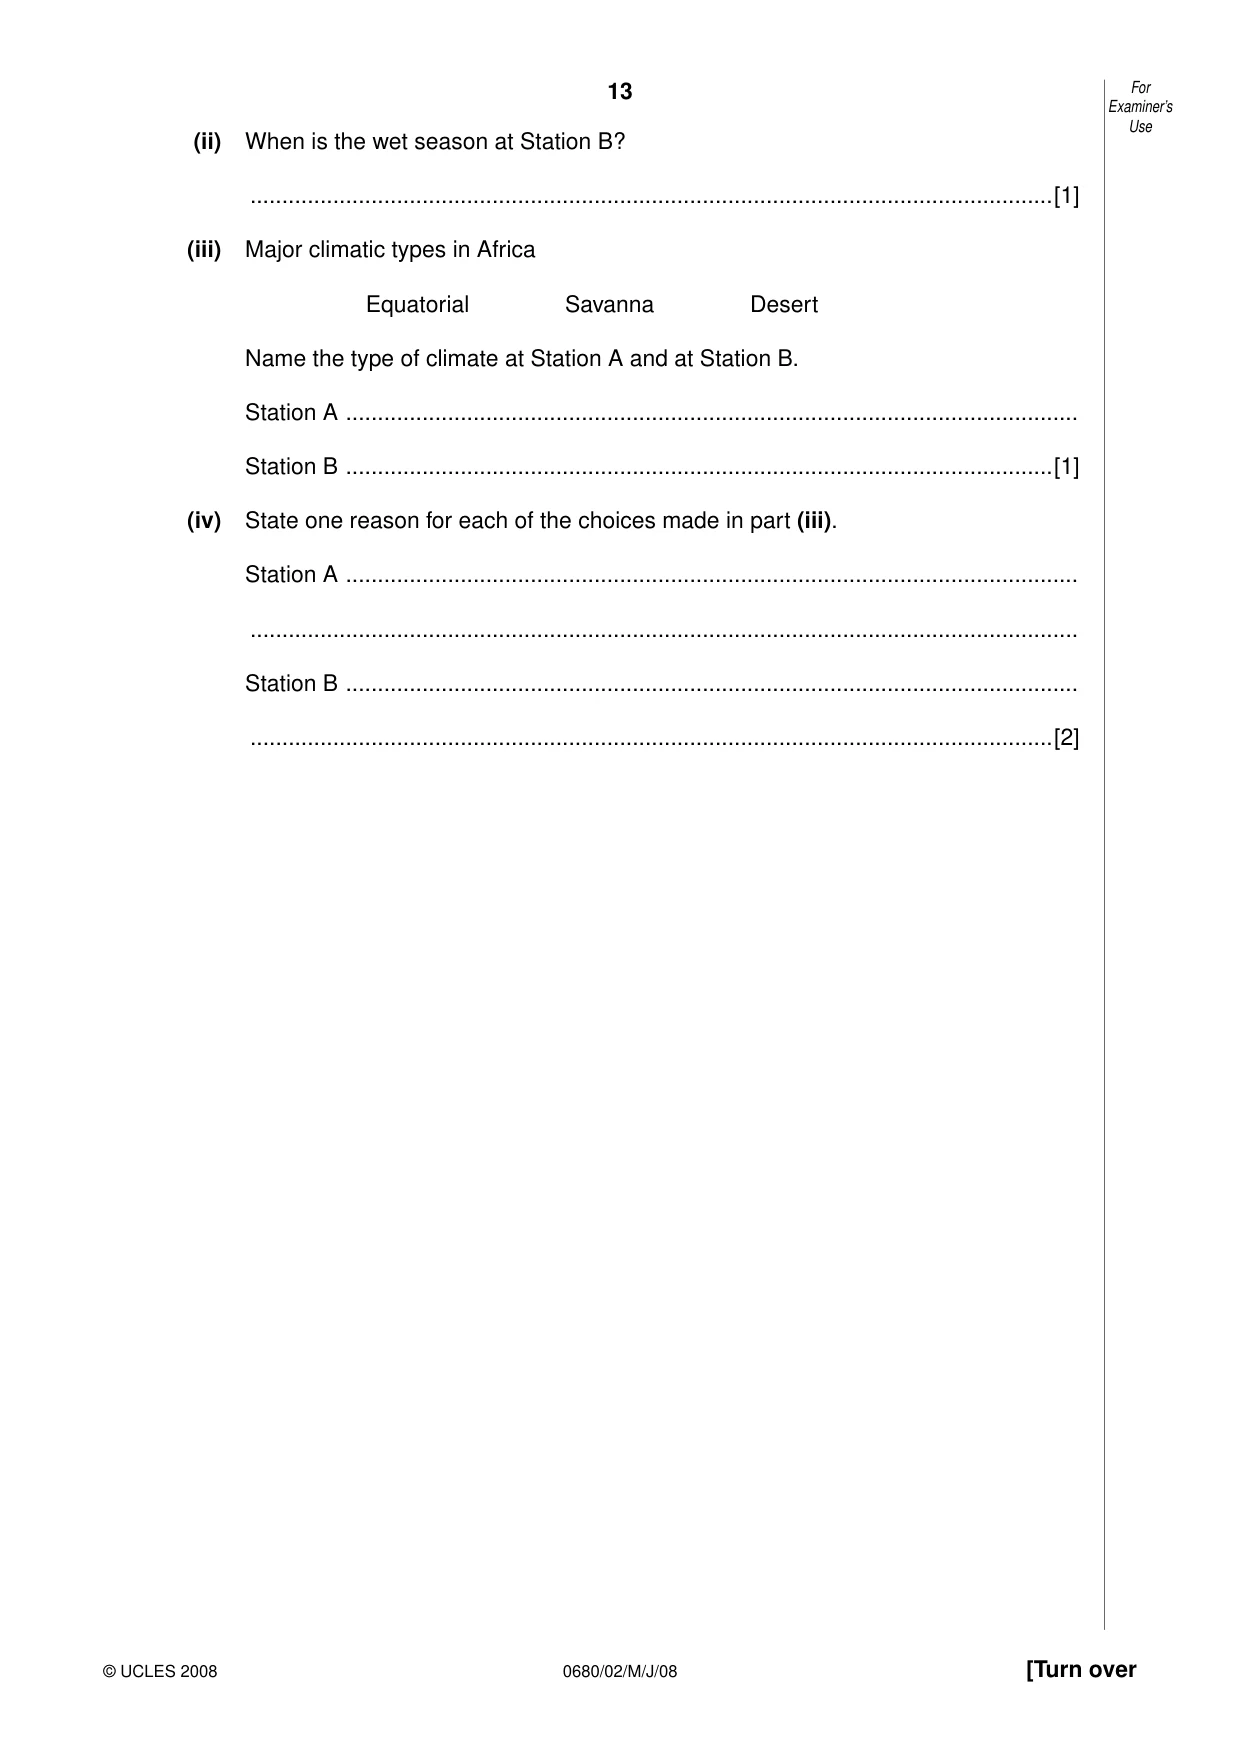
13 0680/02/M/J/08 [Turn over For Examiner’s Use © UCLES 2008 (ii) When is the wet season at Station B? …[1] (iii) Major climatic types in Africa Equatorial Savanna Desert Name the type of climate at Station A and at Station B. Station A … Station B …[1] (iv) State one reason for each of the choices made in part (iii). Station A … … Station B … …[2]
Question paper, page 14
14 0680/02/M/J/08 For Examiner’s Use © UCLES 2008 (c) Many parts of Africa are too dry for cultivation for part or all of the year. Four options to allow farming in dry areas are listed below. 1 Practise extensive livestock farming 2 Plant new varieties of crops 3 Government builds large dams, reservoirs and irrigation canals 4 Use underground water supplies for trickle drip irrigation (i) For three of the options, state one advantage and one disadvantage of each for farming in dry areas. Option number … … … … … Option number … … … … … Option number … … … … …[6] (ii) In your view, which one of the four options is the most sustainable for farming in dry areas? Explain your choice. … … … … … …[3]
Question paper, page 15
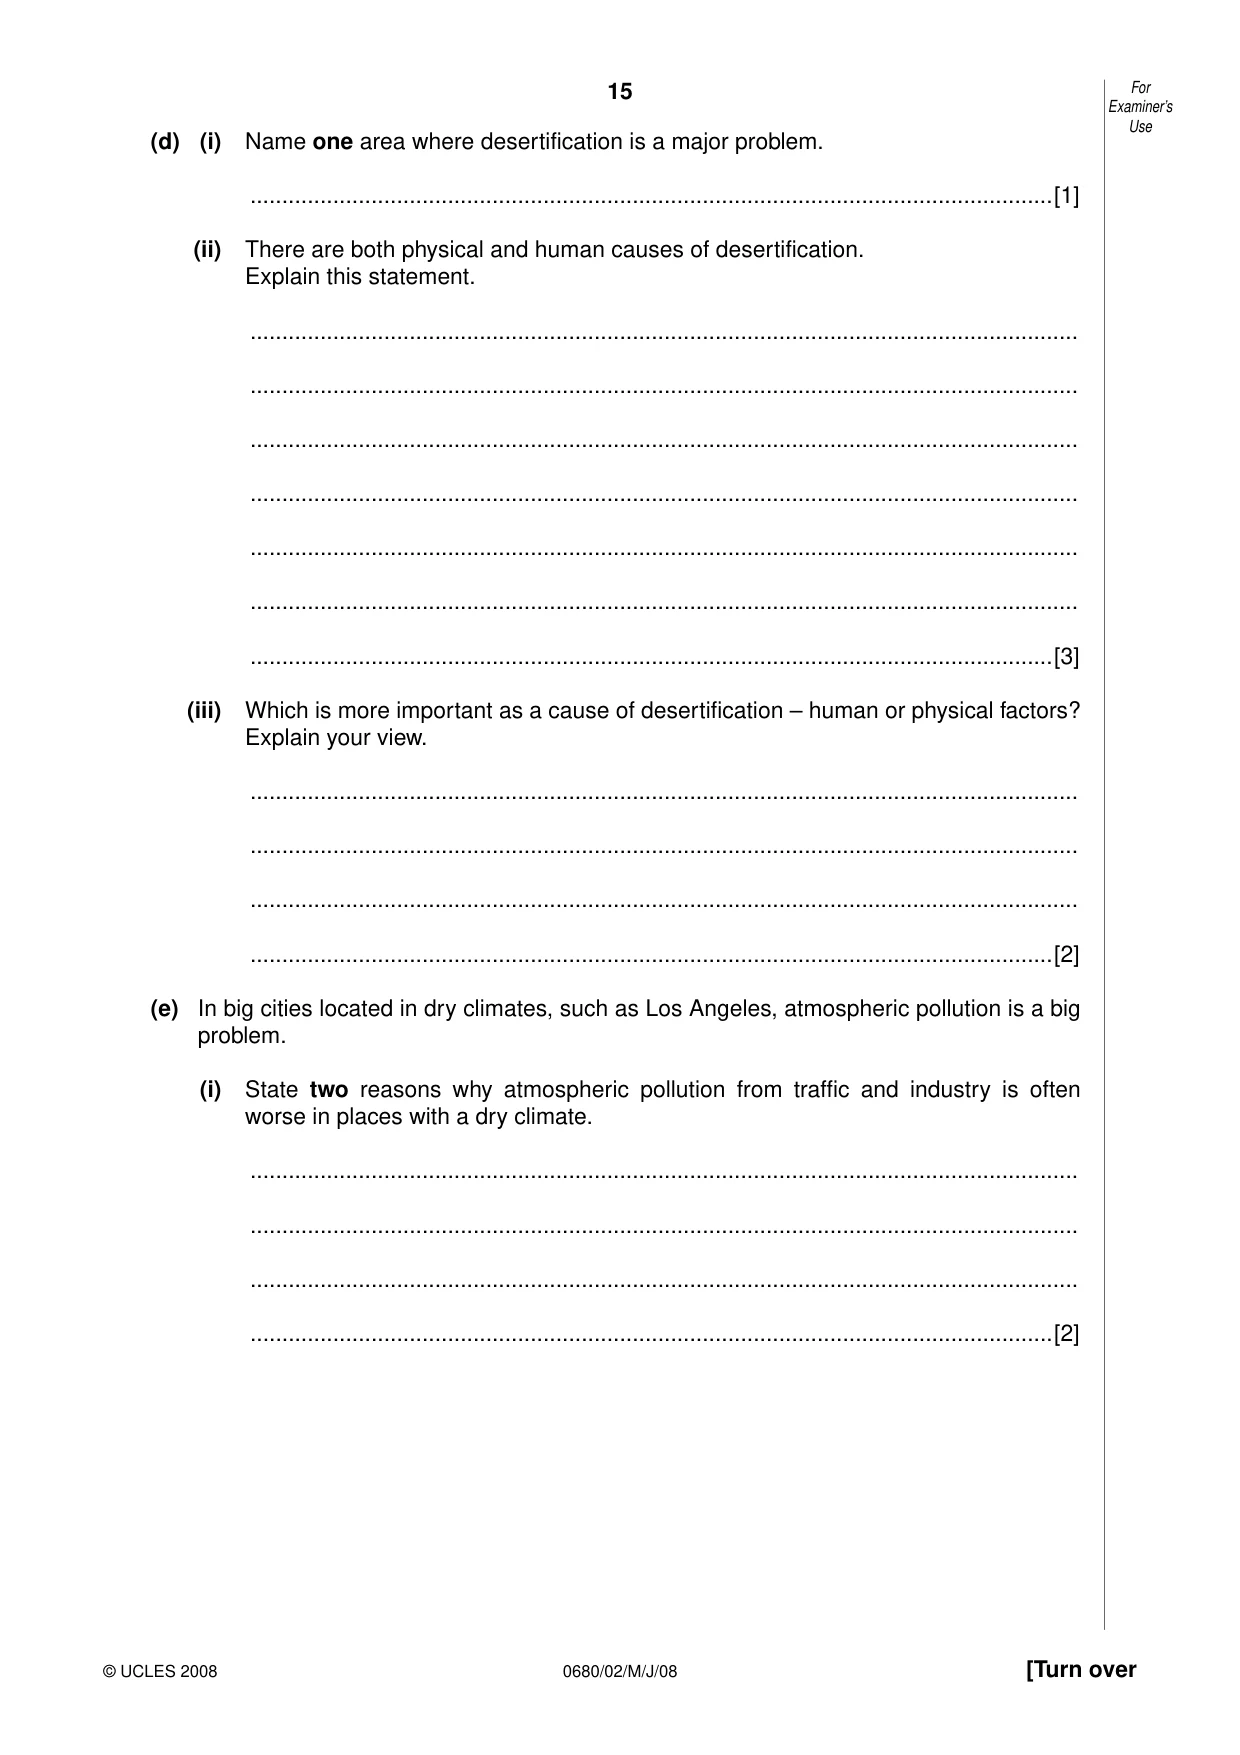
15 0680/02/M/J/08 [Turn over For Examiner’s Use © UCLES 2008 (d) (i) Name one area where desertification is a major problem. …[1] (ii) There are both physical and human causes of desertification. Explain this statement. … … … … … … …[3] (iii) Which is more important as a cause of desertification – human or physical factors? Explain your view. … … … …[2] (e) In big cities located in dry climates, such as Los Angeles, atmospheric pollution is a big problem. (i) State two reasons why atmospheric pollution from traffic and industry is often worse in places with a dry climate. … … … …[2]
Question paper, page 16
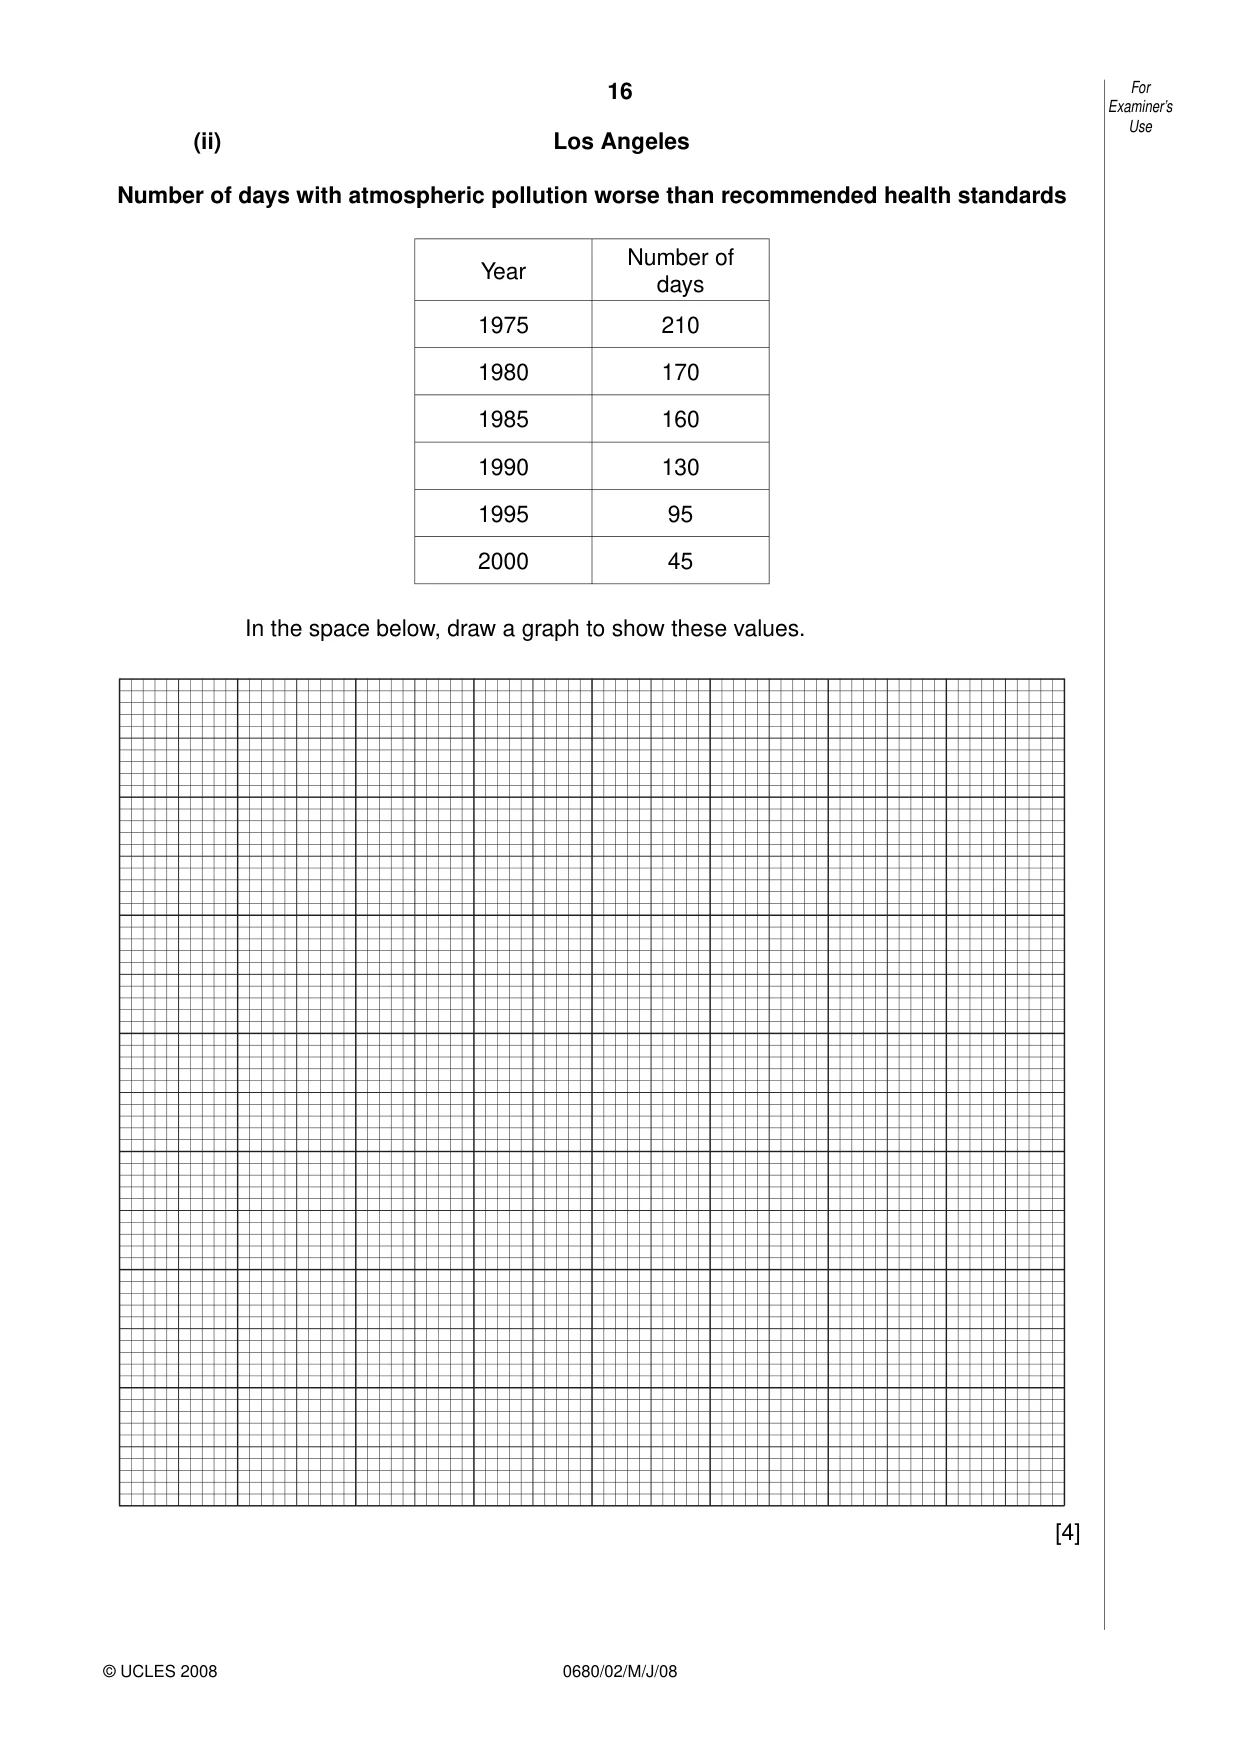
16 0680/02/M/J/08 For Examiner’s Use © UCLES 2008 (ii) Los Angeles Number of days with atmospheric pollution worse than recommended health standards Year Number of days 1975 210 1980 170 1985 160 1990 130 1995 95 2000 45 In the space below, draw a graph to show these values. [4]
Question paper, page 17
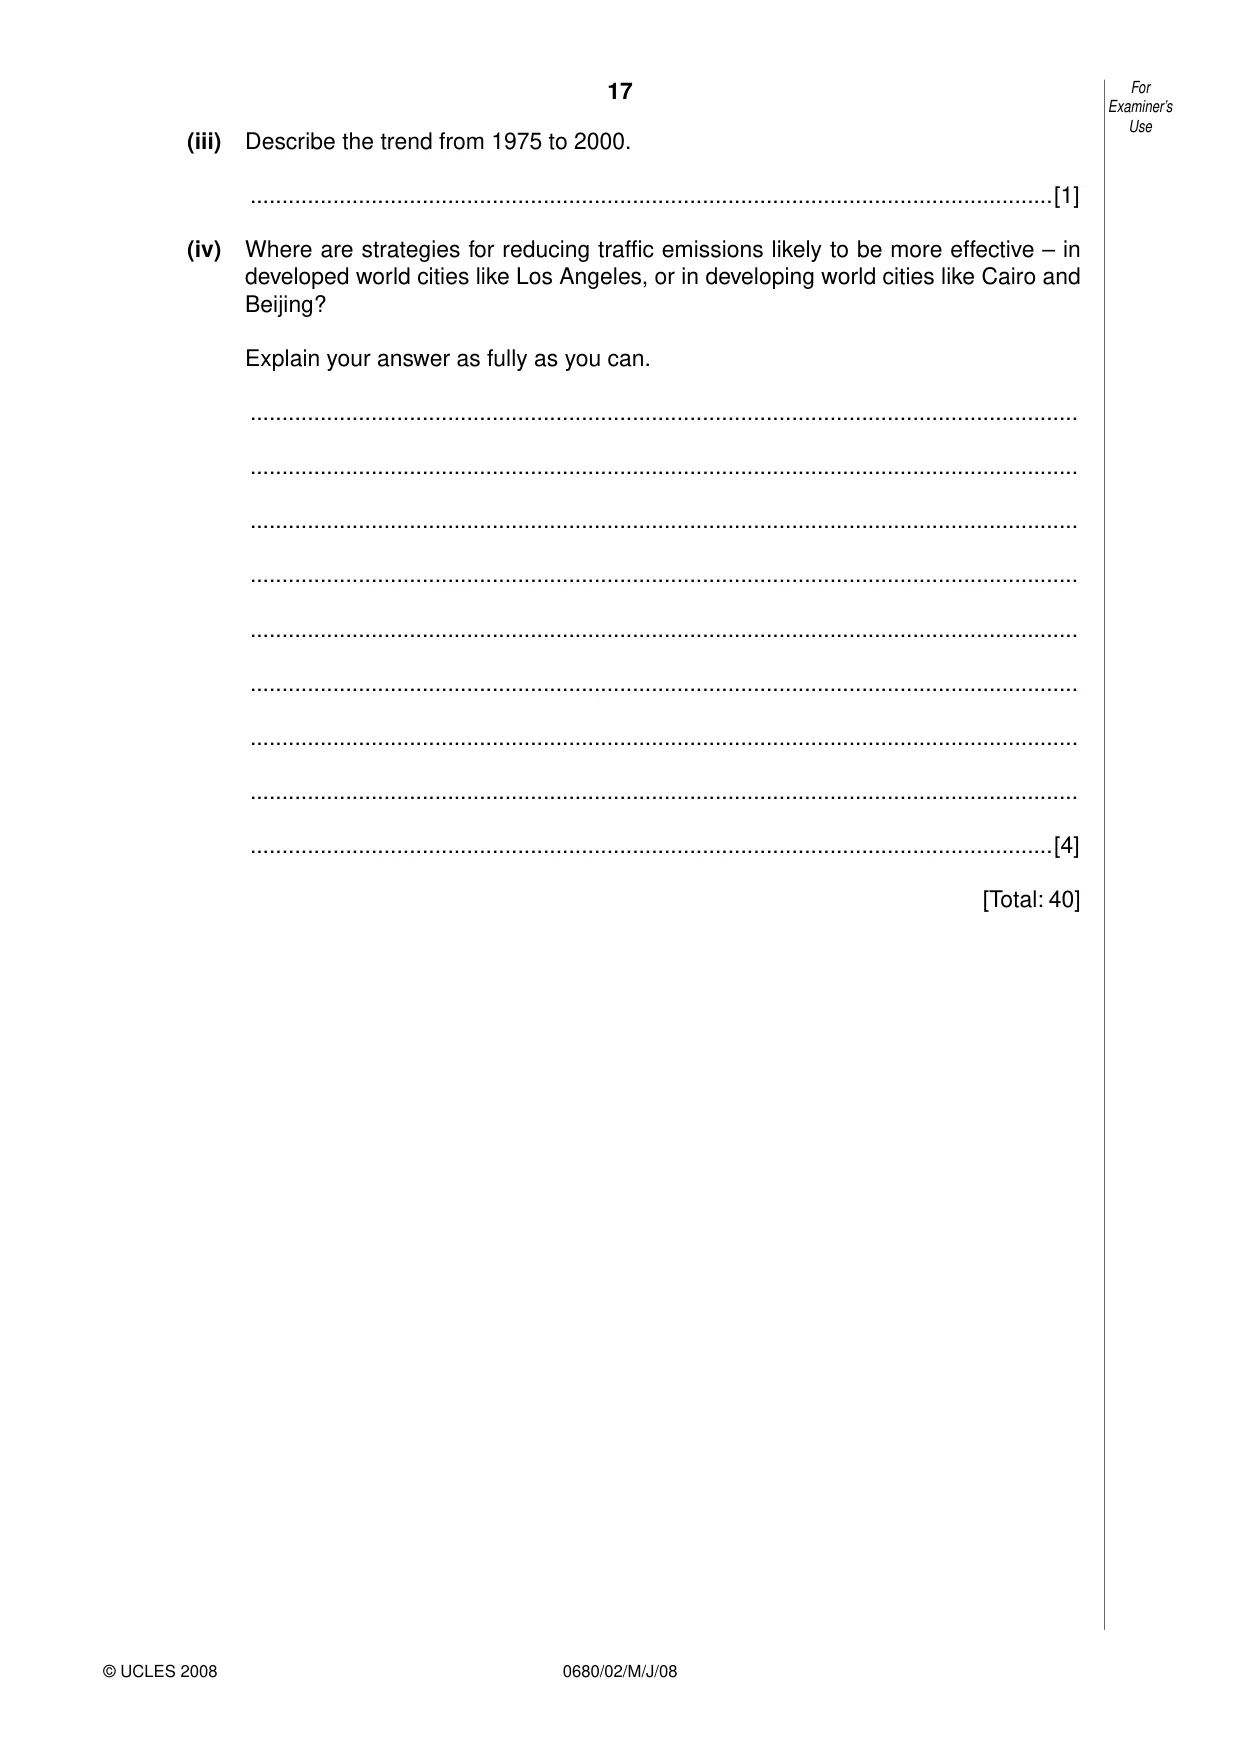
17 0680/02/M/J/08 For Examiner’s Use © UCLES 2008 (iii) Describe the trend from 1975 to 2000. …[1] (iv) Where are strategies for reducing traffic emissions likely to be more effective – in developed world cities like Los Angeles, or in developing world cities like Cairo and Beijing? Explain your answer as fully as you can. … … … … … … … … …[4] [Total: 40]
Question paper, page 20
20 0680/02/M/J/08 BLANK PAGE Copyright Acknowledgements: Question 1 (c) © Millennium Ecosystem Assessment. Question 2 (a) © J. Pallister. Permission to reproduce items where third-party owned material protected by copyright is included has been sought and cleared where possible. Every reasonable effort has been made by the publisher (UCLES) to trace copyright holders, but if any items requiring clearance have unwittingly been included, the publisher will be pleased to make amends at the earliest possible opportunity. University of Cambridge International Examinations is part of the Cambridge Assessment Group. Cambridge Assessment is the brand name of University of Cambridge Local Examinations Syndicate (UCLES), which is itself a department of the University of Cambridge.
Mark scheme, page 1
UNIVERSITY OF CAMBRIDGE INTERNATIONAL EXAMINATIONS International General Certificate of Secondary Education MARK SCHEME for the May/June 2008 question paper 0680 ENVIRONMENTAL MANAGEMENT 0680/02 Paper 2, maximum raw mark 80 This mark scheme is published as an aid to teachers and candidates, to indicate the requirements of the examination. It shows the basis on which Examiners were instructed to award marks. It does not indicate the details of the discussions that took place at an Examiners’ meeting before marking began. All Examiners are instructed that alternative correct answers and unexpected approaches in candidates’ scripts must be given marks that fairly reflect the relevant knowledge and skills demonstrated. Mark schemes must be read in conjunction with the question papers and the report on the examination. • CIE will not enter into discussions or correspondence in connection with these mark schemes. CIE is publishing the mark schemes for the May/June 2008 question papers for most IGCSE, GCE Advanced Level and Advanced Subsidiary Level syllabuses and some Ordinary Level syllabuses. www.XtremePapers.com
Mark scheme, page 2
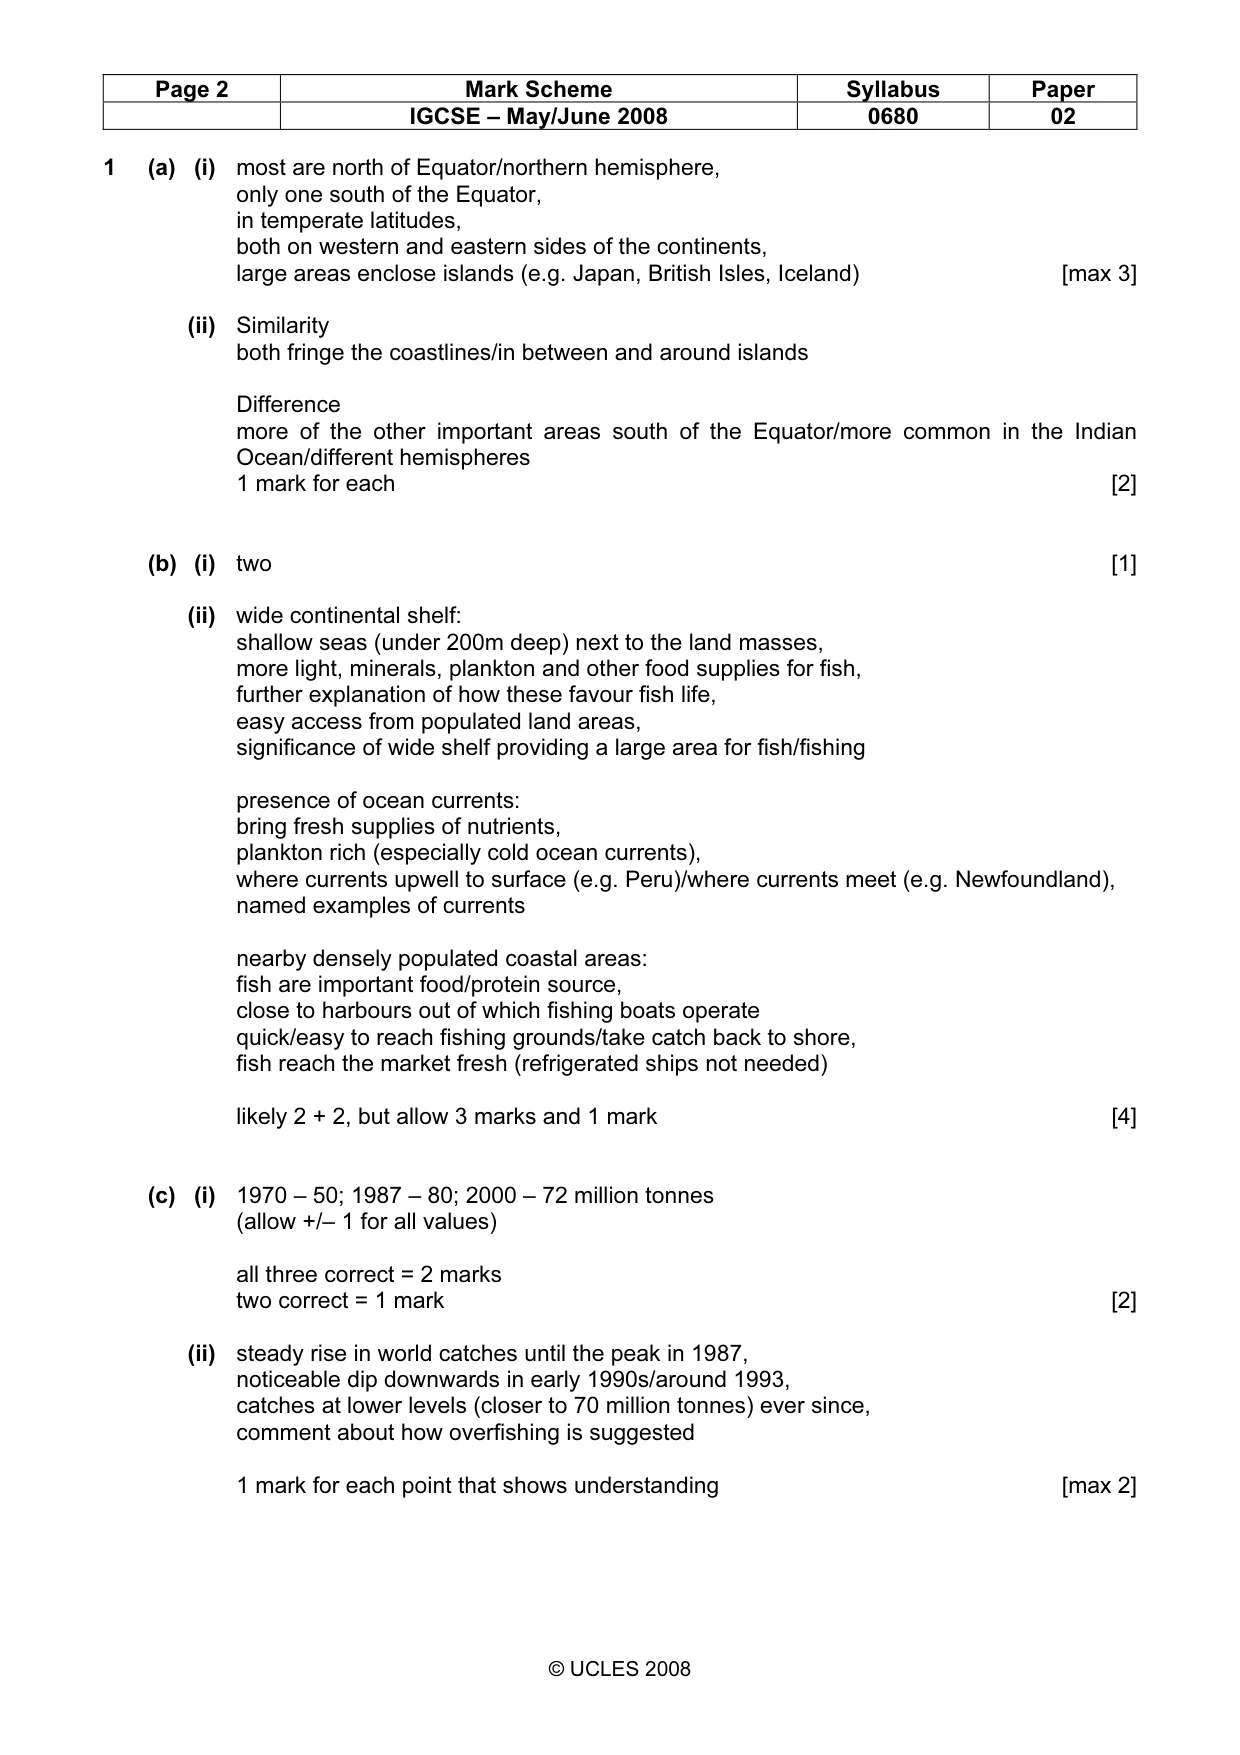
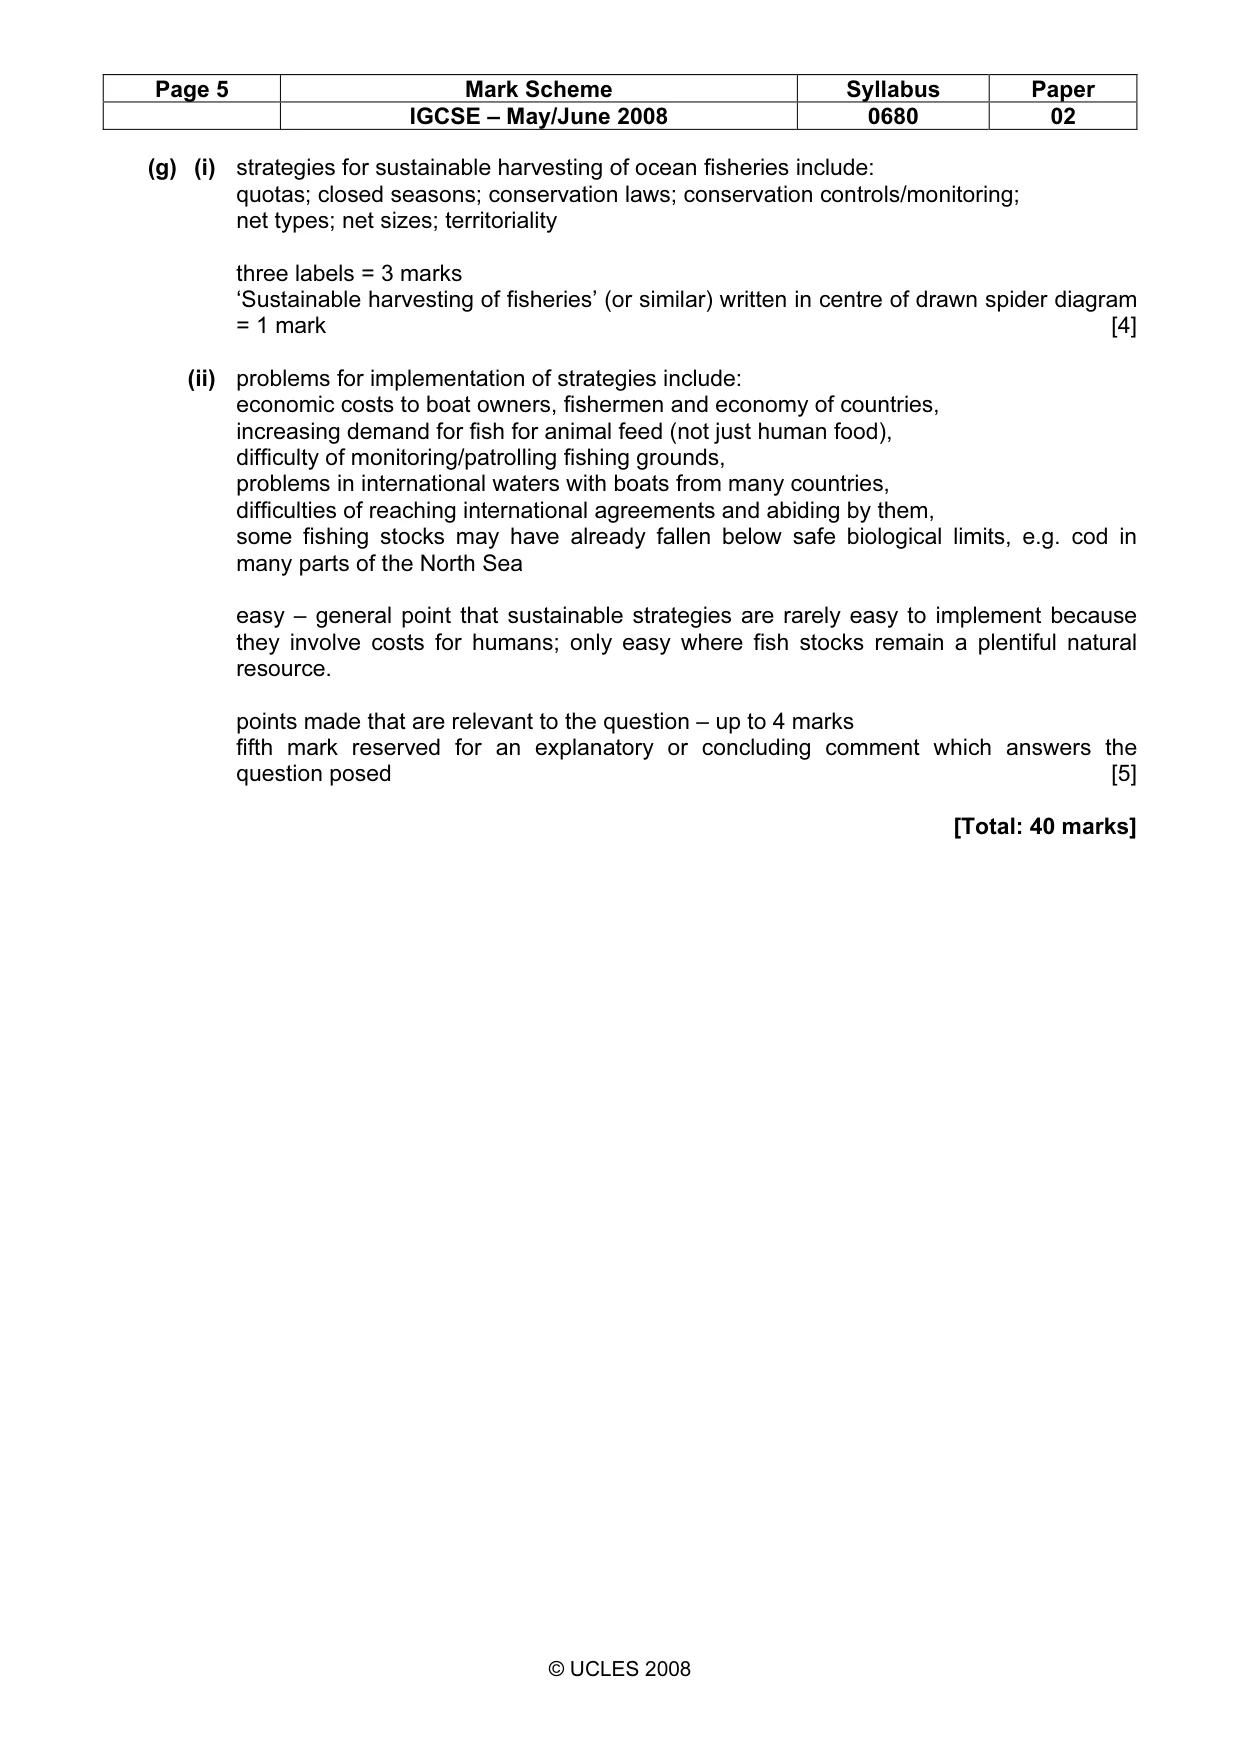
Page 2 Mark Scheme Syllabus Paper IGCSE – May/June 2008 0680 02 © UCLES 2008 1 (a) (i) most are north of Equator/northern hemisphere, only one south of the Equator, in temperate latitudes, both on western and eastern sides of the continents, large areas enclose islands (e.g. Japan, British Isles, Iceland) [max 3] (ii) Similarity both fringe the coastlines/in between and around islands Difference more of the other important areas south of the Equator/more common in the Indian Ocean/different hemispheres 1 mark for each [2] (b) (i) two [1] (ii) wide continental shelf: shallow seas (under 200m deep) next to the land masses, more light, minerals, plankton and other food supplies for fish, further explanation of how these favour fish life, easy access from populated land areas, significance of wide shelf providing a large area for fish/fishing presence of ocean currents: bring fresh supplies of nutrients, plankton rich (especially cold ocean currents), where currents upwell to surface (e.g. Peru)/where currents meet (e.g. Newfoundland), named examples of currents nearby densely populated coastal areas: fish are important food/protein source, close to harbours out of which fishing boats operate quick/easy to reach fishing grounds/take catch back to shore, fish reach the market fresh (refrigerated ships not needed) likely 2 + 2, but allow 3 marks and 1 mark [4] (c) (i) 1970 – 50; 1987 – 80; 2000 – 72 million tonnes (allow +/– 1 for all values) all three correct = 2 marks two correct = 1 mark [2] (ii) steady rise in world catches until the peak in 1987, noticeable dip downwards in early 1990s/around 1993, catches at lower levels (closer to 70 million tonnes) ever since, comment about how overfishing is suggested 1 mark for each point that shows understanding [max 2]
Mark scheme, page 3
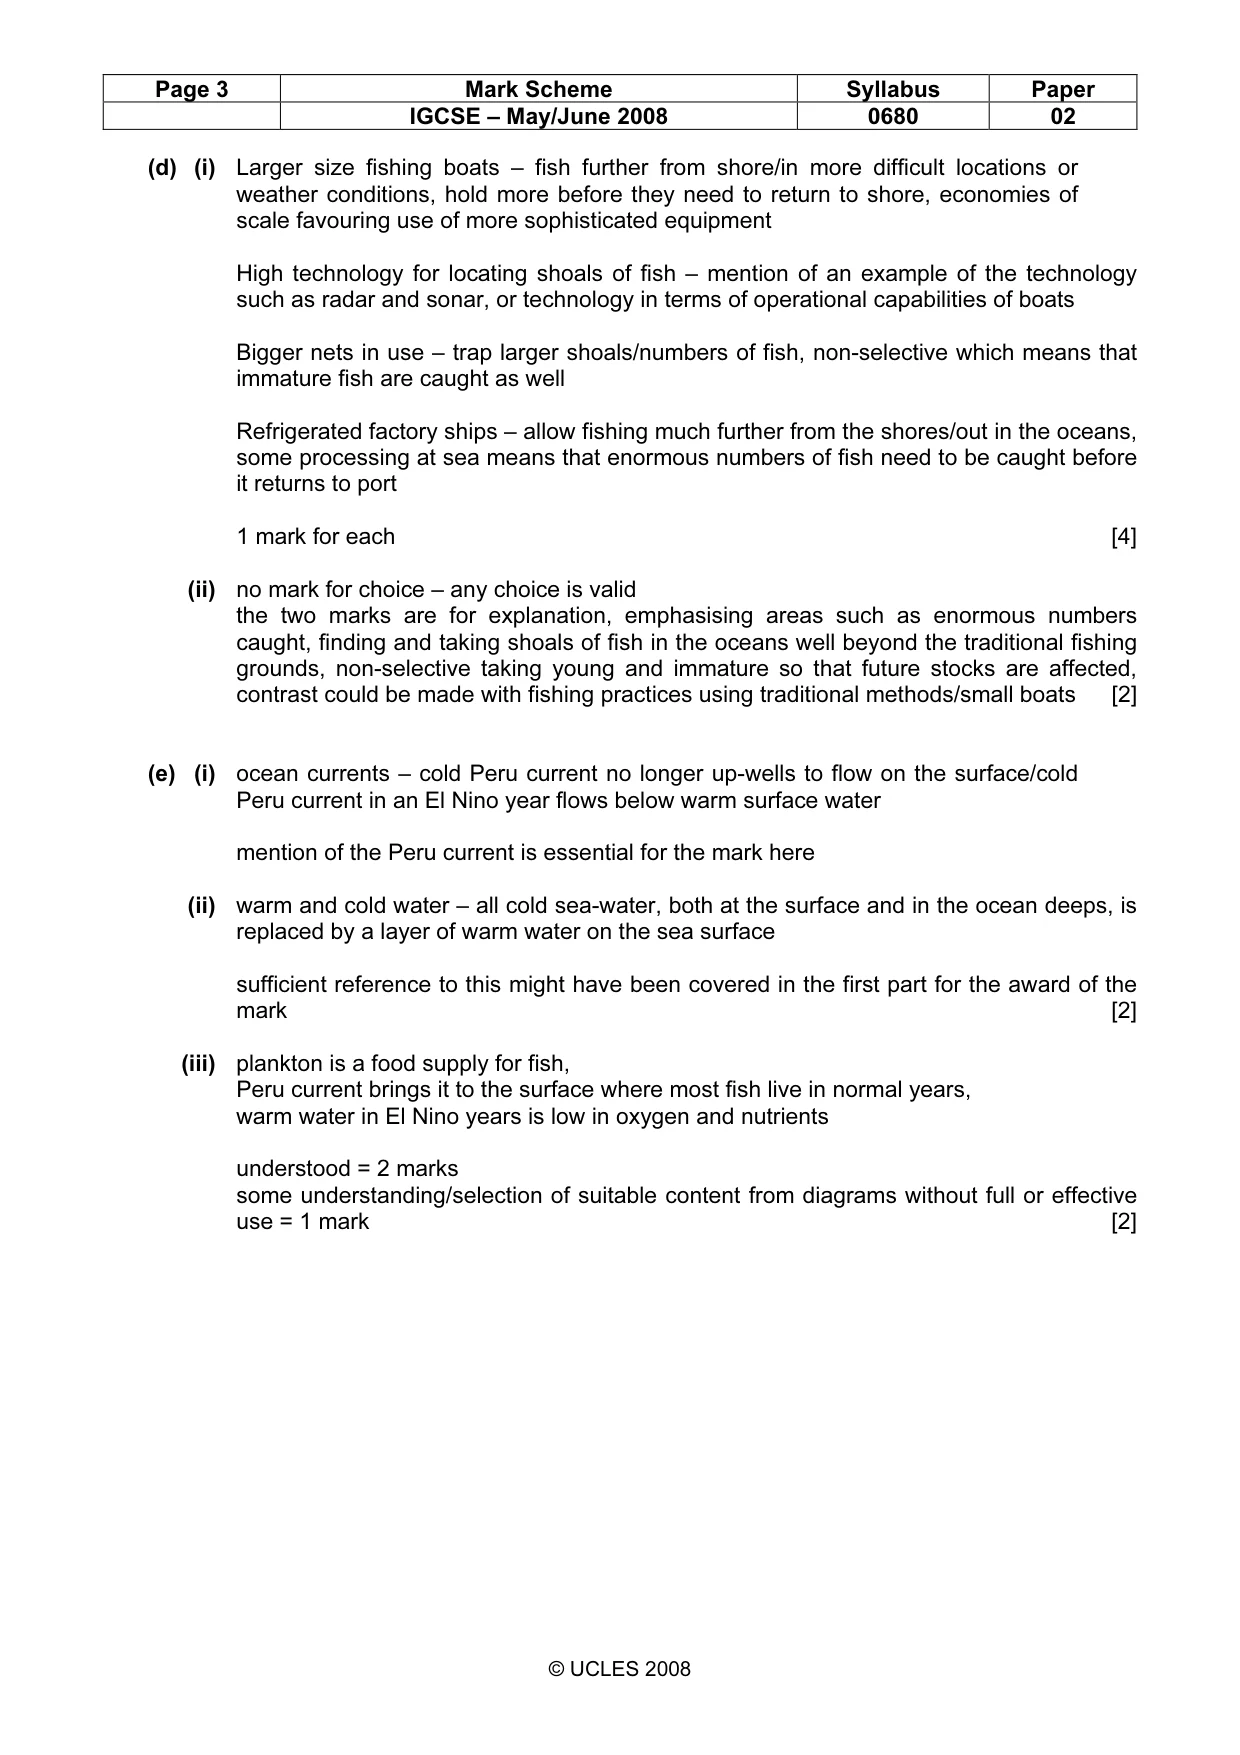
Page 3 Mark Scheme Syllabus Paper IGCSE – May/June 2008 0680 02 © UCLES 2008 (d) (i) Larger size fishing boats – fish further from shore/in more difficult locations or weather conditions, hold more before they need to return to shore, economies of scale favouring use of more sophisticated equipment High technology for locating shoals of fish – mention of an example of the technology such as radar and sonar, or technology in terms of operational capabilities of boats Bigger nets in use – trap larger shoals/numbers of fish, non-selective which means that immature fish are caught as well Refrigerated factory ships – allow fishing much further from the shores/out in the oceans, some processing at sea means that enormous numbers of fish need to be caught before it returns to port 1 mark for each [4] (ii) no mark for choice – any choice is valid the two marks are for explanation, emphasising areas such as enormous numbers caught, finding and taking shoals of fish in the oceans well beyond the traditional fishing grounds, non-selective taking young and immature so that future stocks are affected, contrast could be made with fishing practices using traditional methods/small boats [2] (e) (i) ocean currents – cold Peru current no longer up-wells to flow on the surface/cold Peru current in an El Nino year flows below warm surface water mention of the Peru current is essential for the mark here (ii) warm and cold water – all cold sea-water, both at the surface and in the ocean deeps, is replaced by a layer of warm water on the sea surface sufficient reference to this might have been covered in the first part for the award of the mark [2] (iii) plankton is a food supply for fish, Peru current brings it to the surface where most fish live in normal years, warm water in El Nino years is low in oxygen and nutrients understood = 2 marks some understanding/selection of suitable content from diagrams without full or effective use = 1 mark [2]
Mark scheme, page 4
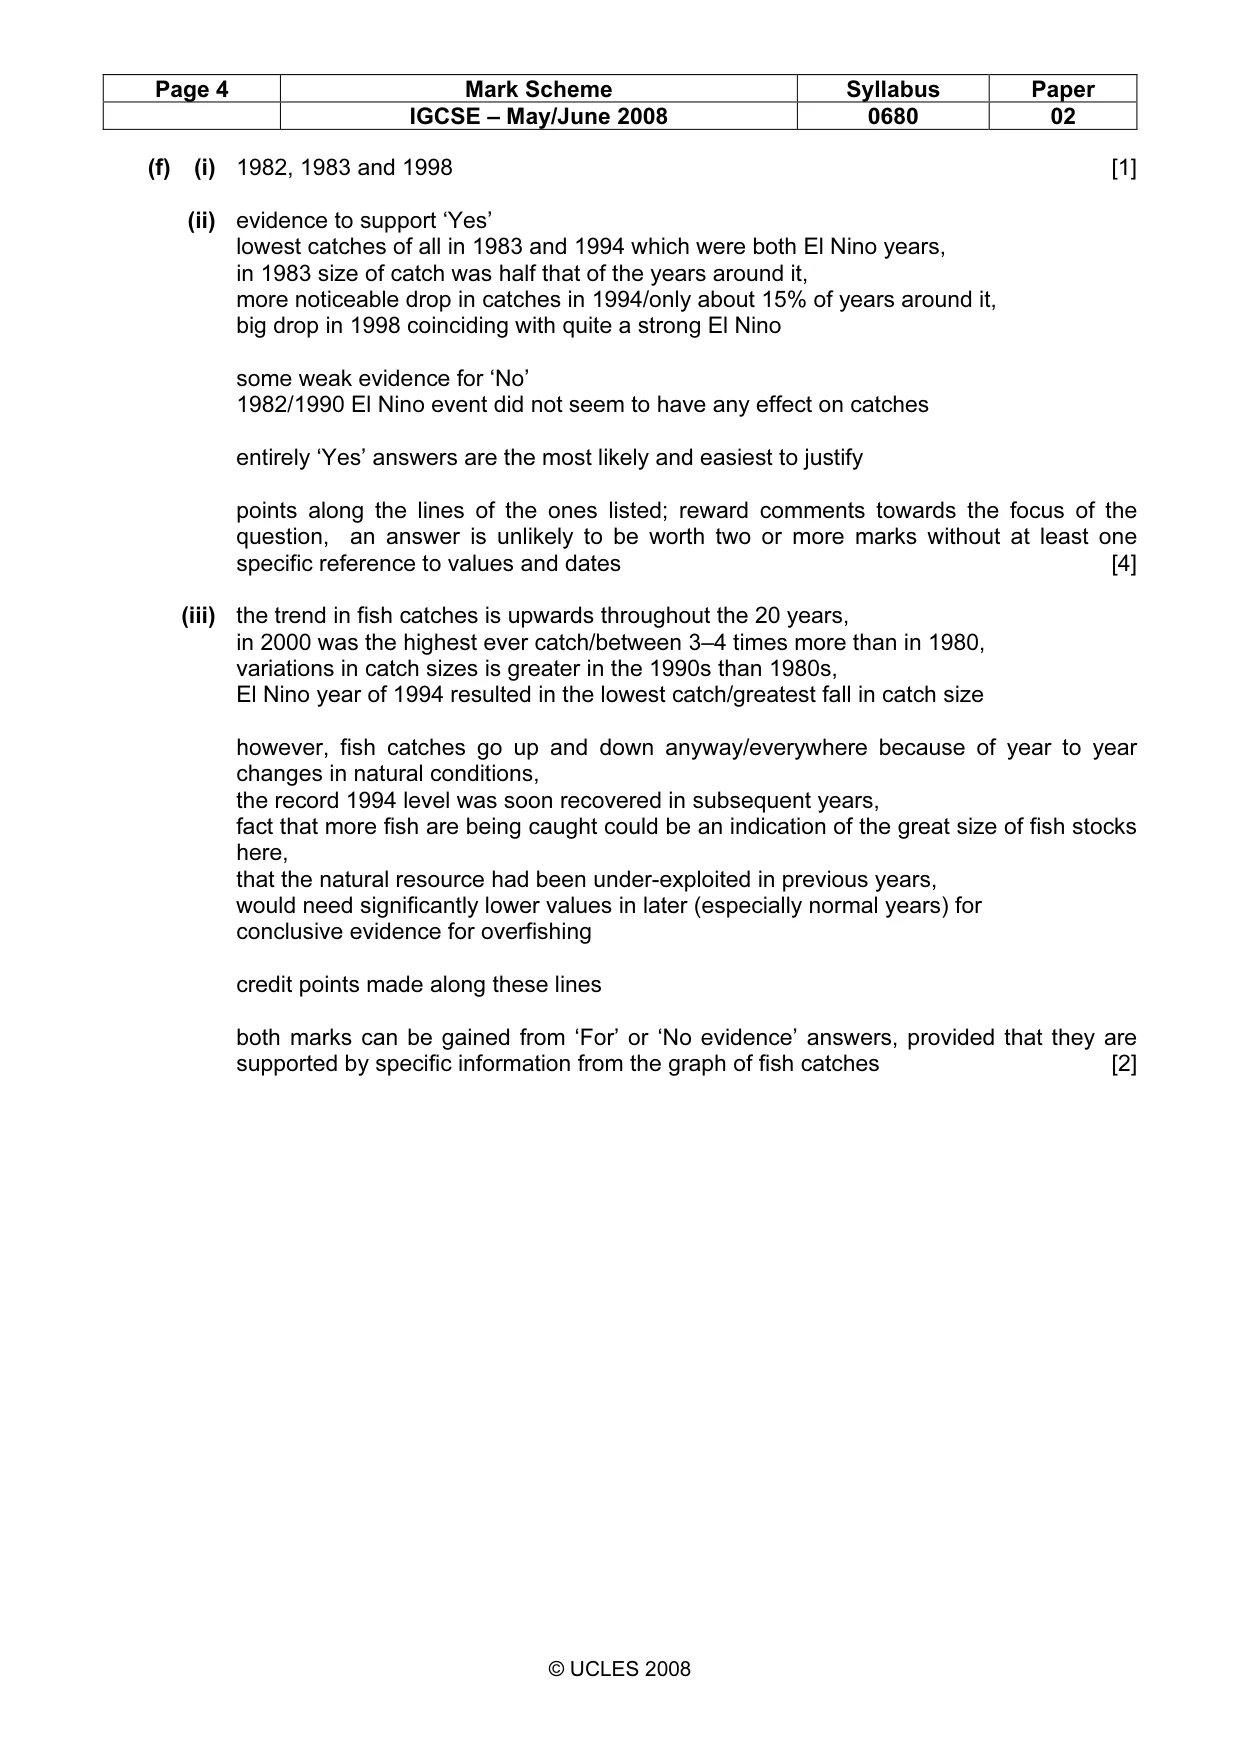
Page 4 Mark Scheme Syllabus Paper IGCSE – May/June 2008 0680 02 © UCLES 2008 (f) (i) 1982, 1983 and 1998 [1] (ii) evidence to support ‘Yes’ lowest catches of all in 1983 and 1994 which were both El Nino years, in 1983 size of catch was half that of the years around it, more noticeable drop in catches in 1994/only about 15% of years around it, big drop in 1998 coinciding with quite a strong El Nino some weak evidence for ‘No’ 1982/1990 El Nino event did not seem to have any effect on catches entirely ‘Yes’ answers are the most likely and easiest to justify points along the lines of the ones listed; reward comments towards the focus of the question, an answer is unlikely to be worth two or more marks without at least one specific reference to values and dates [4] (iii) the trend in fish catches is upwards throughout the 20 years, in 2000 was the highest ever catch/between 3–4 times more than in 1980, variations in catch sizes is greater in the 1990s than 1980s, El Nino year of 1994 resulted in the lowest catch/greatest fall in catch size however, fish catches go up and down anyway/everywhere because of year to year changes in natural conditions, the record 1994 level was soon recovered in subsequent years, fact that more fish are being caught could be an indication of the great size of fish stocks here, that the natural resource had been under-exploited in previous years, would need significantly lower values in later (especially normal years) for conclusive evidence for overfishing credit points made along these lines both marks can be gained from ‘For’ or ‘No evidence’ answers, provided that they are supported by specific information from the graph of fish catches [2]
Mark scheme, page 5
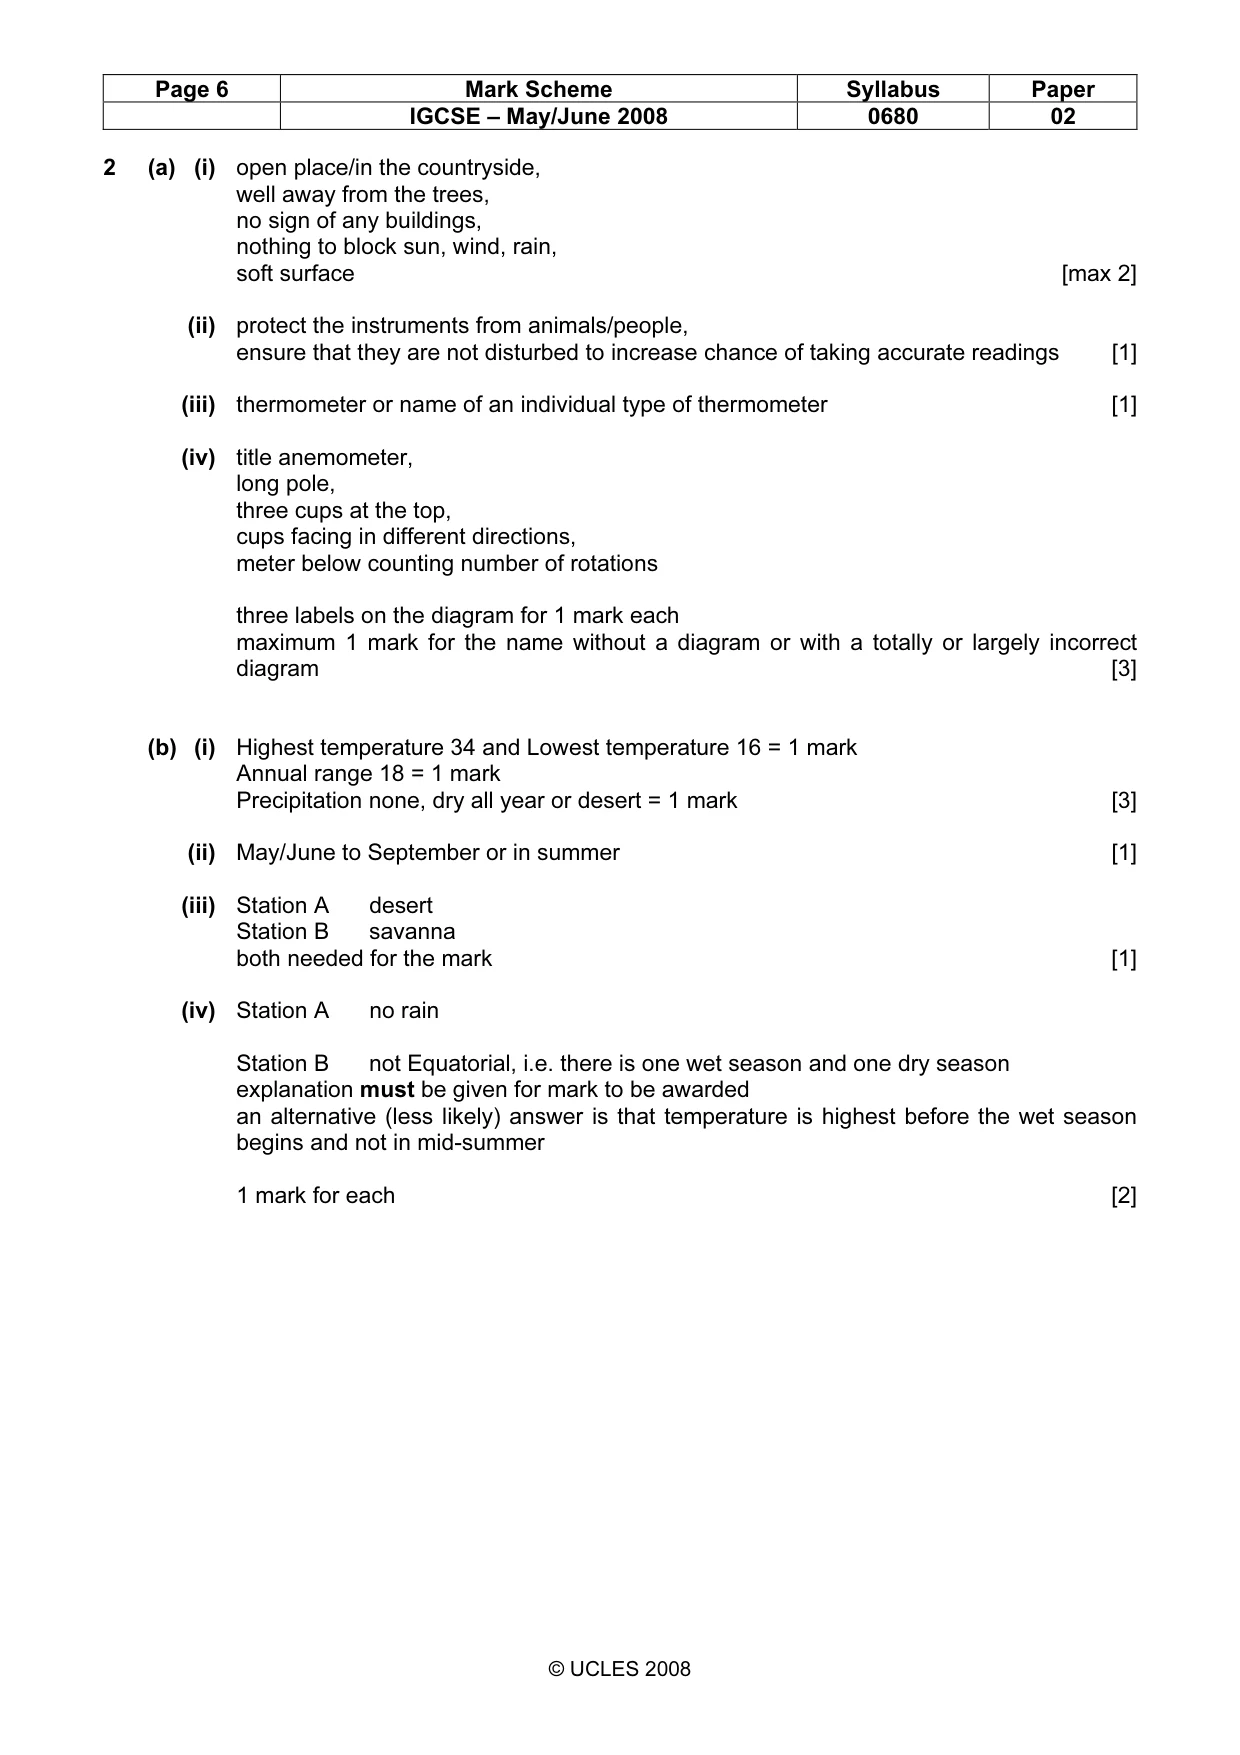
Page 5 Mark Scheme Syllabus Paper IGCSE – May/June 2008 0680 02 © UCLES 2008 (g) (i) strategies for sustainable harvesting of ocean fisheries include: quotas; closed seasons; conservation laws; conservation controls/monitoring; net types; net sizes; territoriality three labels = 3 marks ‘Sustainable harvesting of fisheries’ (or similar) written in centre of drawn spider diagram = 1 mark [4] (ii) problems for implementation of strategies include: economic costs to boat owners, fishermen and economy of countries, increasing demand for fish for animal feed (not just human food), difficulty of monitoring/patrolling fishing grounds, problems in international waters with boats from many countries, difficulties of reaching international agreements and abiding by them, some fishing stocks may have already fallen below safe biological limits, e.g. cod in many parts of the North Sea easy – general point that sustainable strategies are rarely easy to implement because they involve costs for humans; only easy where fish stocks remain a plentiful natural resource. points made that are relevant to the question – up to 4 marks fifth mark reserved for an explanatory or concluding comment which answers the question posed [5] [Total: 40 marks]
Mark scheme, page 6
Page 6 Mark Scheme Syllabus Paper IGCSE – May/June 2008 0680 02 © UCLES 2008 2 (a) (i) open place/in the countryside, well away from the trees, no sign of any buildings, nothing to block sun, wind, rain, soft surface [max 2] (ii) protect the instruments from animals/people, ensure that they are not disturbed to increase chance of taking accurate readings [1] (iii) thermometer or name of an individual type of thermometer [1] (iv) title anemometer, long pole, three cups at the top, cups facing in different directions, meter below counting number of rotations three labels on the diagram for 1 mark each maximum 1 mark for the name without a diagram or with a totally or largely incorrect diagram [3] (b) (i) Highest temperature 34 and Lowest temperature 16 = 1 mark Annual range 18 = 1 mark Precipitation none, dry all year or desert = 1 mark [3] (ii) May/June to September or in summer [1] (iii) Station A desert Station B savanna both needed for the mark [1] (iv) Station A no rain Station B not Equatorial, i.e. there is one wet season and one dry season explanation must be given for mark to be awarded an alternative (less likely) answer is that temperature is highest before the wet season begins and not in mid-summer 1 mark for each [2]
Mark scheme, page 7
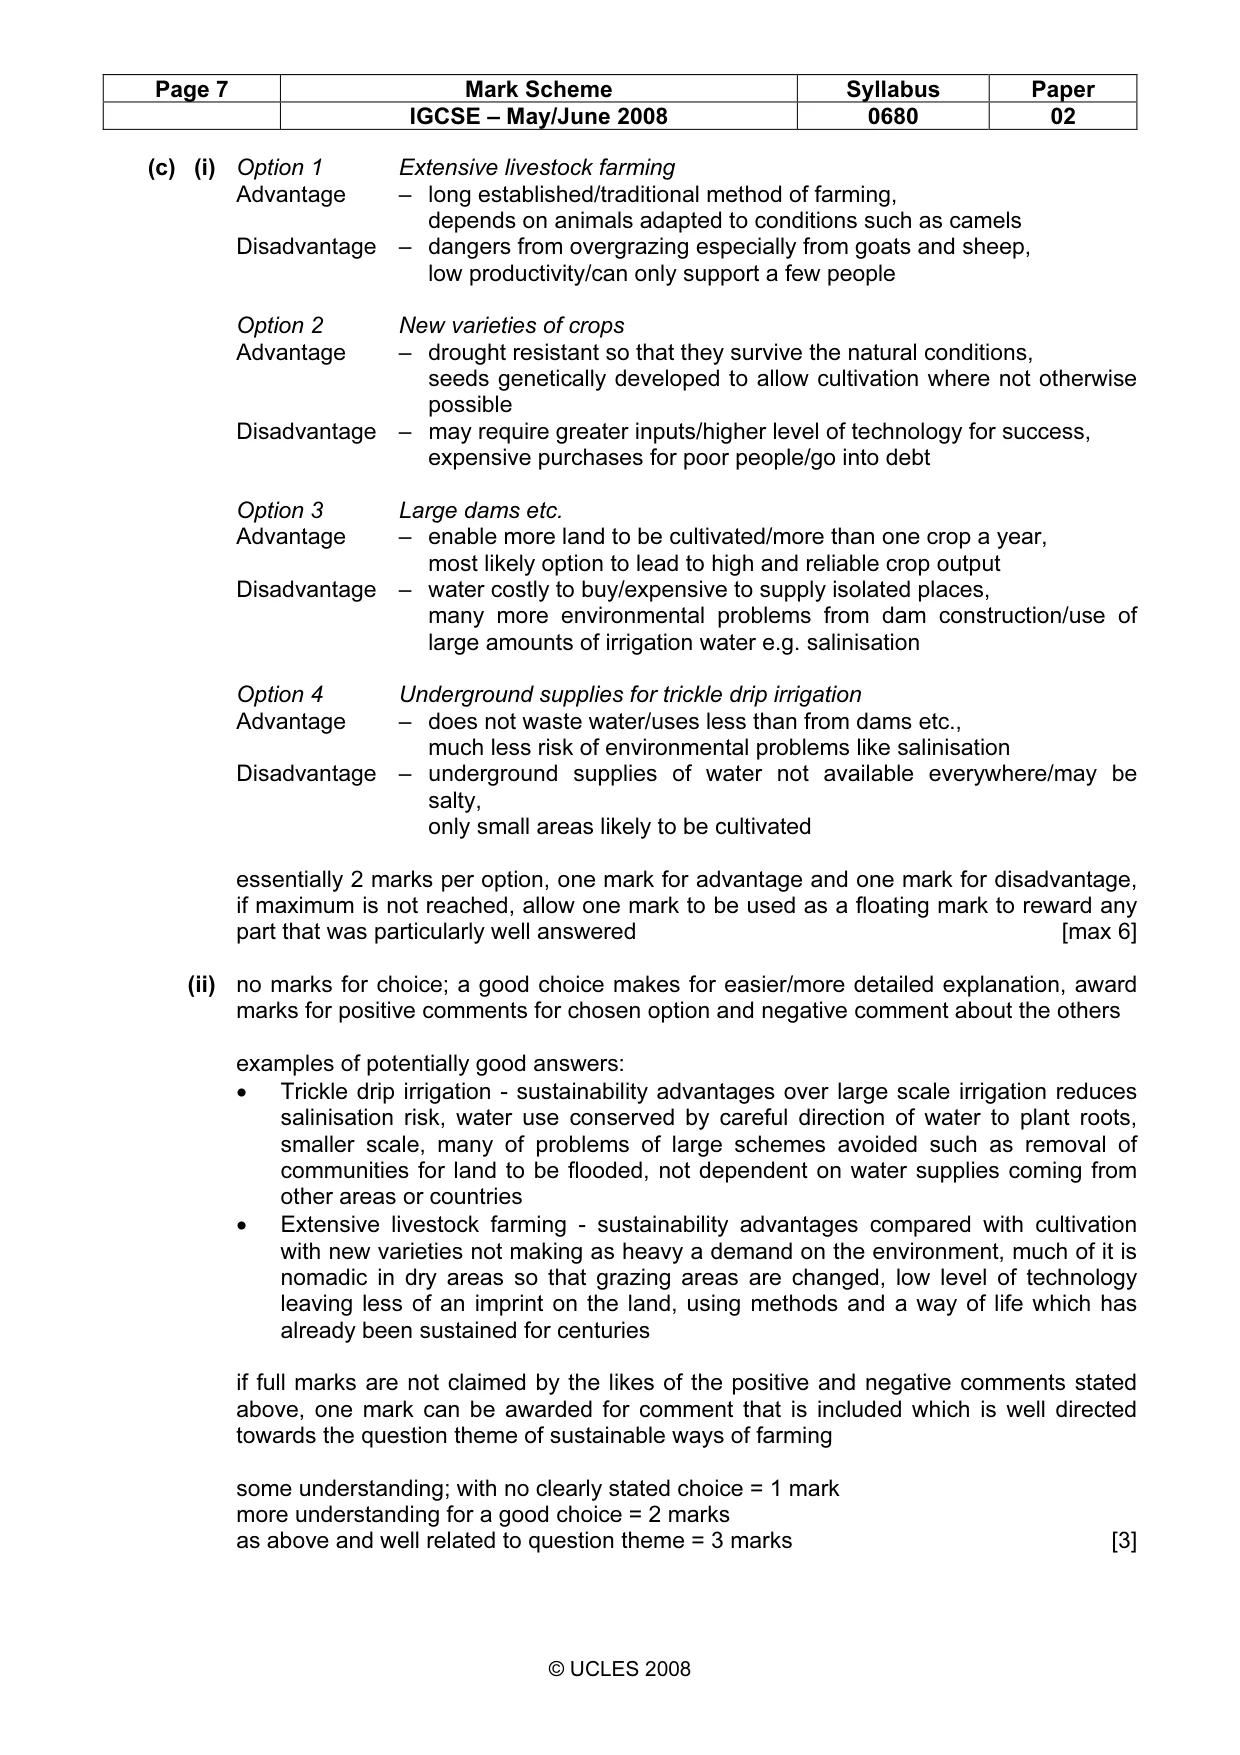
Page 7 Mark Scheme Syllabus Paper IGCSE – May/June 2008 0680 02 © UCLES 2008 (c) (i) Option 1 Extensive livestock farming Advantage – long established/traditional method of farming, depends on animals adapted to conditions such as camels Disadvantage – dangers from overgrazing especially from goats and sheep, low productivity/can only support a few people Option 2 New varieties of crops Advantage – drought resistant so that they survive the natural conditions, seeds genetically developed to allow cultivation where not otherwise possible Disadvantage – may require greater inputs/higher level of technology for success, expensive purchases for poor people/go into debt Option 3 Large dams etc. Advantage – enable more land to be cultivated/more than one crop a year, most likely option to lead to high and reliable crop output Disadvantage – water costly to buy/expensive to supply isolated places, many more environmental problems from dam construction/use of large amounts of irrigation water e.g. salinisation Option 4 Underground supplies for trickle drip irrigation Advantage – does not waste water/uses less than from dams etc., much less risk of environmental problems like salinisation Disadvantage – underground supplies of water not available everywhere/may be salty, only small areas likely to be cultivated essentially 2 marks per option, one mark for advantage and one mark for disadvantage, if maximum is not reached, allow one mark to be used as a floating mark to reward any part that was particularly well answered [max 6] (ii) no marks for choice; a good choice makes for easier/more detailed explanation, award marks for positive comments for chosen option and negative comment about the others examples of potentially good answers: • Trickle drip irrigation - sustainability advantages over large scale irrigation reduces salinisation risk, water use conserved by careful direction of water to plant roots, smaller scale, many of problems of large schemes avoided such as removal of communities for land to be flooded, not dependent on water supplies coming from other areas or countries • Extensive livestock farming - sustainability advantages compared with cultivation with new varieties not making as heavy a demand on the environment, much of it is nomadic in dry areas so that grazing areas are changed, low level of technology leaving less of an imprint on the land, using methods and a way of life which has already been sustained for centuries if full marks are not claimed by the likes of the positive and negative comments stated above, one mark can be awarded for comment that is included which is well directed towards the question theme of sustainable ways of farming some understanding; with no clearly stated choice = 1 mark more understanding for a good choice = 2 marks as above and well related to question theme = 3 marks [3]
Mark scheme, page 8
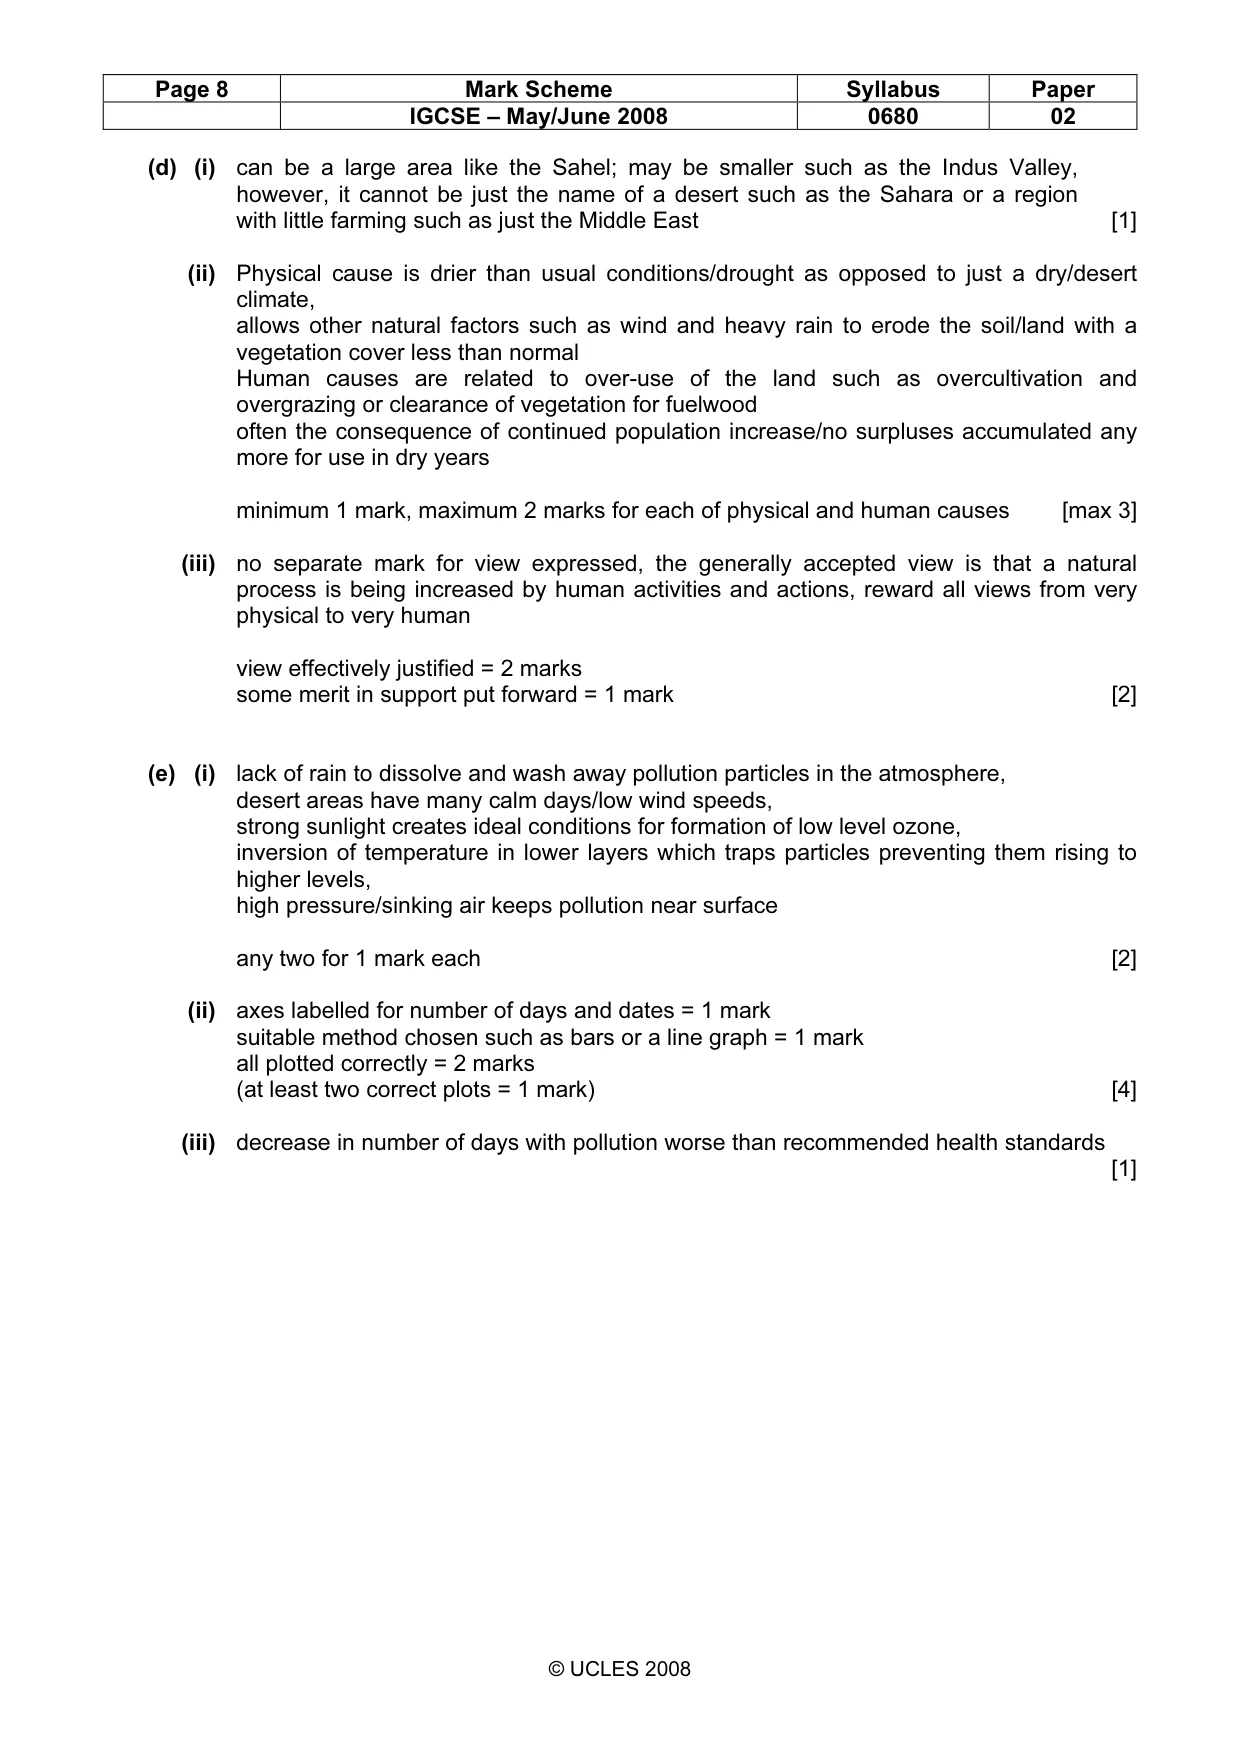
Page 8 Mark Scheme Syllabus Paper IGCSE – May/June 2008 0680 02 © UCLES 2008 (d) (i) can be a large area like the Sahel; may be smaller such as the Indus Valley, however, it cannot be just the name of a desert such as the Sahara or a region with little farming such as just the Middle East [1] (ii) Physical cause is drier than usual conditions/drought as opposed to just a dry/desert climate, allows other natural factors such as wind and heavy rain to erode the soil/land with a vegetation cover less than normal Human causes are related to over-use of the land such as overcultivation and overgrazing or clearance of vegetation for fuelwood often the consequence of continued population increase/no surpluses accumulated any more for use in dry years minimum 1 mark, maximum 2 marks for each of physical and human causes [max 3] (iii) no separate mark for view expressed, the generally accepted view is that a natural process is being increased by human activities and actions, reward all views from very physical to very human view effectively justified = 2 marks some merit in support put forward = 1 mark [2] (e) (i) lack of rain to dissolve and wash away pollution particles in the atmosphere, desert areas have many calm days/low wind speeds, strong sunlight creates ideal conditions for formation of low level ozone, inversion of temperature in lower layers which traps particles preventing them rising to higher levels, high pressure/sinking air keeps pollution near surface any two for 1 mark each [2] (ii) axes labelled for number of days and dates = 1 mark suitable method chosen such as bars or a line graph = 1 mark all plotted correctly = 2 marks (at least two correct plots = 1 mark) [4] (iii) decrease in number of days with pollution worse than recommended health standards [1]
Mark scheme, page 9
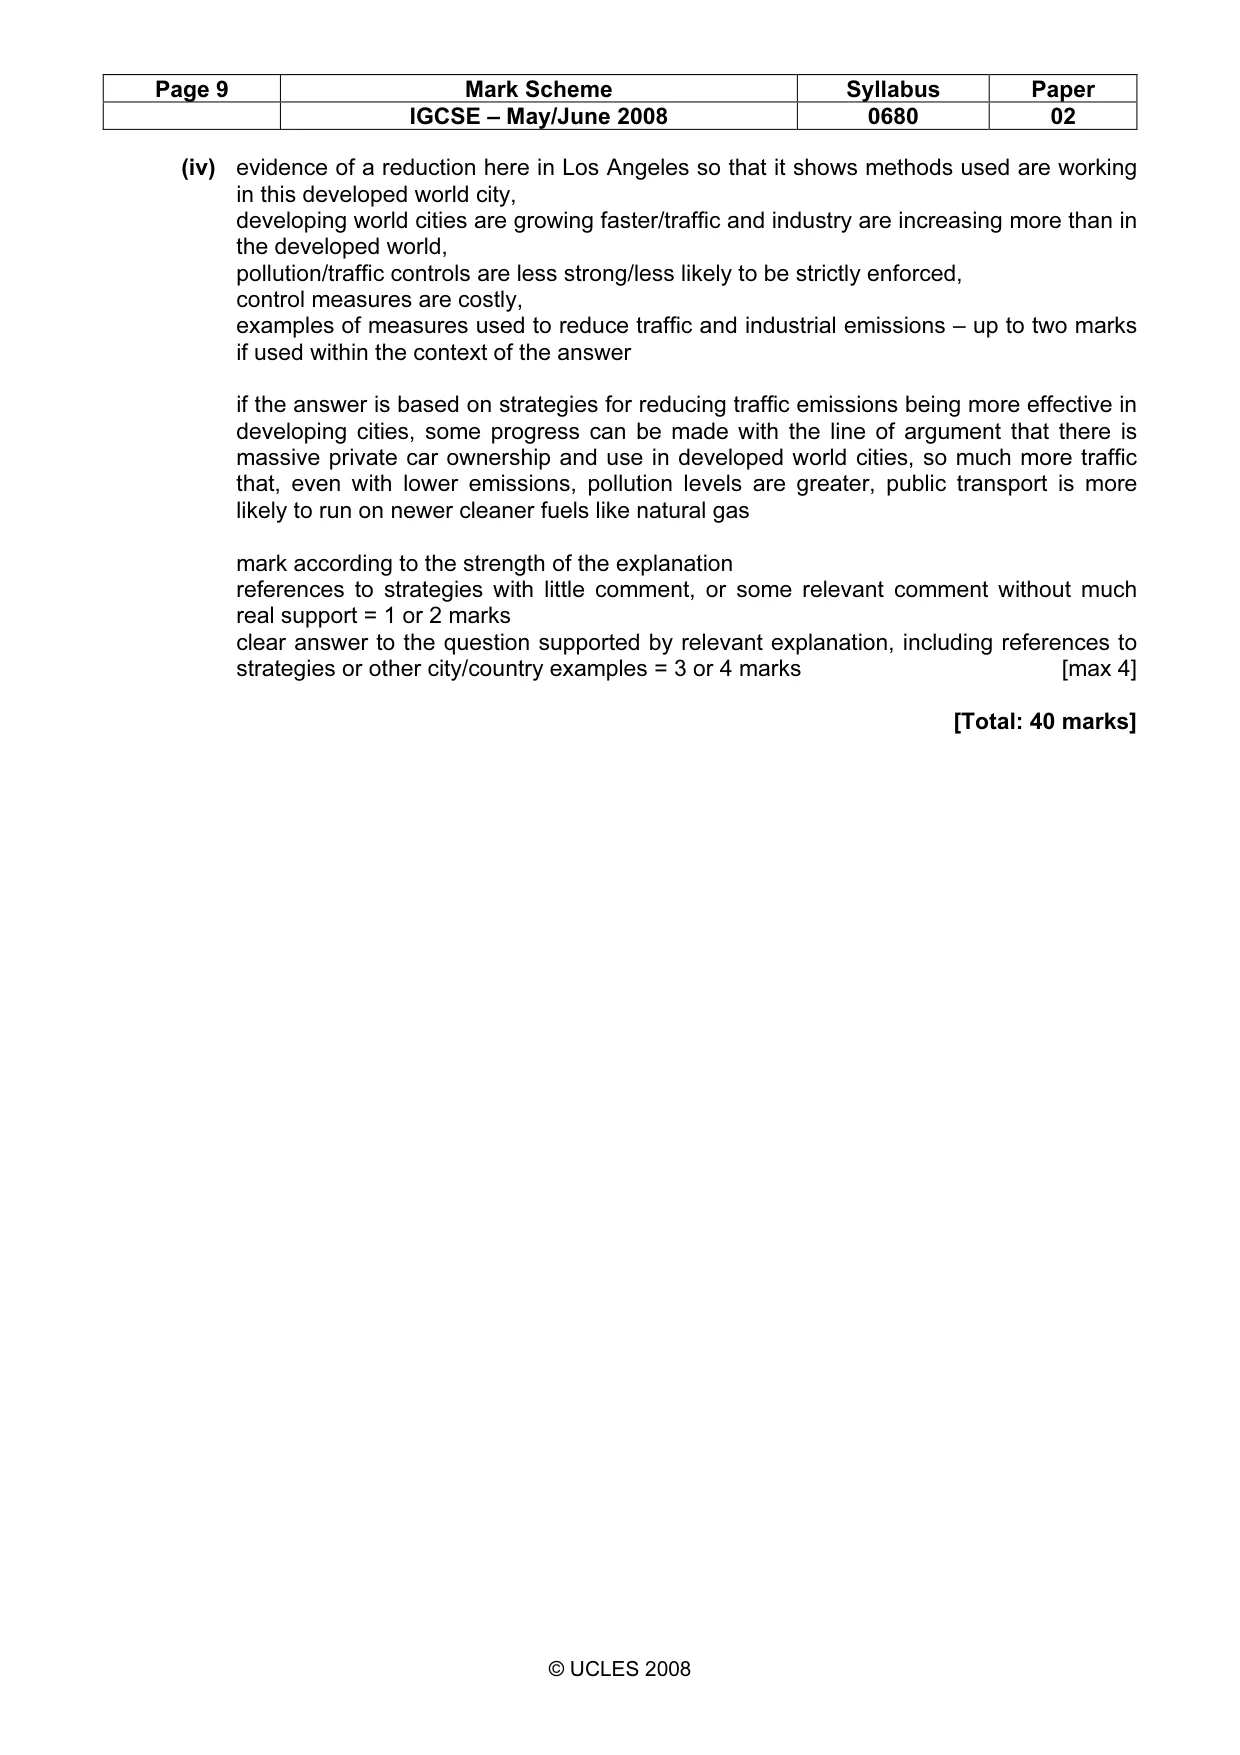
Page 9 Mark Scheme Syllabus Paper IGCSE – May/June 2008 0680 02 © UCLES 2008 (iv) evidence of a reduction here in Los Angeles so that it shows methods used are working in this developed world city, developing world cities are growing faster/traffic and industry are increasing more than in the developed world, pollution/traffic controls are less strong/less likely to be strictly enforced, control measures are costly, examples of measures used to reduce traffic and industrial emissions – up to two marks if used within the context of the answer if the answer is based on strategies for reducing traffic emissions being more effective in developing cities, some progress can be made with the line of argument that there is massive private car ownership and use in developed world cities, so much more traffic that, even with lower emissions, pollution levels are greater, public transport is more likely to run on newer cleaner fuels like natural gas mark according to the strength of the explanation references to strategies with little comment, or some relevant comment without much real support = 1 or 2 marks clear answer to the question supported by relevant explanation, including references to strategies or other city/country examples = 3 or 4 marks [max 4] [Total: 40 marks]
What you needed in this session
Cambridge’s own grade thresholds for 2008 May/June, Paper 2 · Variant 1. A higher threshold means an easier paper — the bar moves with how the cohort did.