Cambridge IGCSE Environmental Management 0680 — 2007 Oct/Nov Paper 2 · Variant 1
0680/21/O/N/07 · 80 marks · ≈90 min
The question paper and its mark scheme, free to read here and free to download. This is Cambridge’s own paper, exactly as it was sat.
Question paper20 pages
Mark scheme7 pages
Answers below. Sit the paper first if you are practising.
Paper as text
Question paper, page 1
This document consists of 19 printed pages and 1 blank page. SP (SM/CGW) T25422/4 © UCLES 2007 [Turn over UNIVERSITY OF CAMBRIDGE INTERNATIONAL EXAMINATIONS International General Certificate of Secondary Education READ THESE INSTRUCTIONS FIRST Write your Centre number, candidate number and name on all the work you hand in. Write in dark blue or black pen. You may use a soft pencil for any diagrams, graphs or rough working. Do not use staples, paper clips, highlighters, glue or correction fluid. DO NOT WRITE IN ANY BARCODES. Answer both questions. At the end of the examination, fasten all your work securely together. The number of marks is given in brackets [ ] at the end of each question or part question. * 7 6 6 3 1 5 1 3 3 5 * ENVIRONMENTAL MANAGEMENT 0680/02 Paper 2 October/November 2007 1 hour 45 minutes Candidates answer on the Question Paper. Additional Materials: Ruler For Examiner’s Use 1 2 Total www.XtremePapers.com
Question paper, page 2
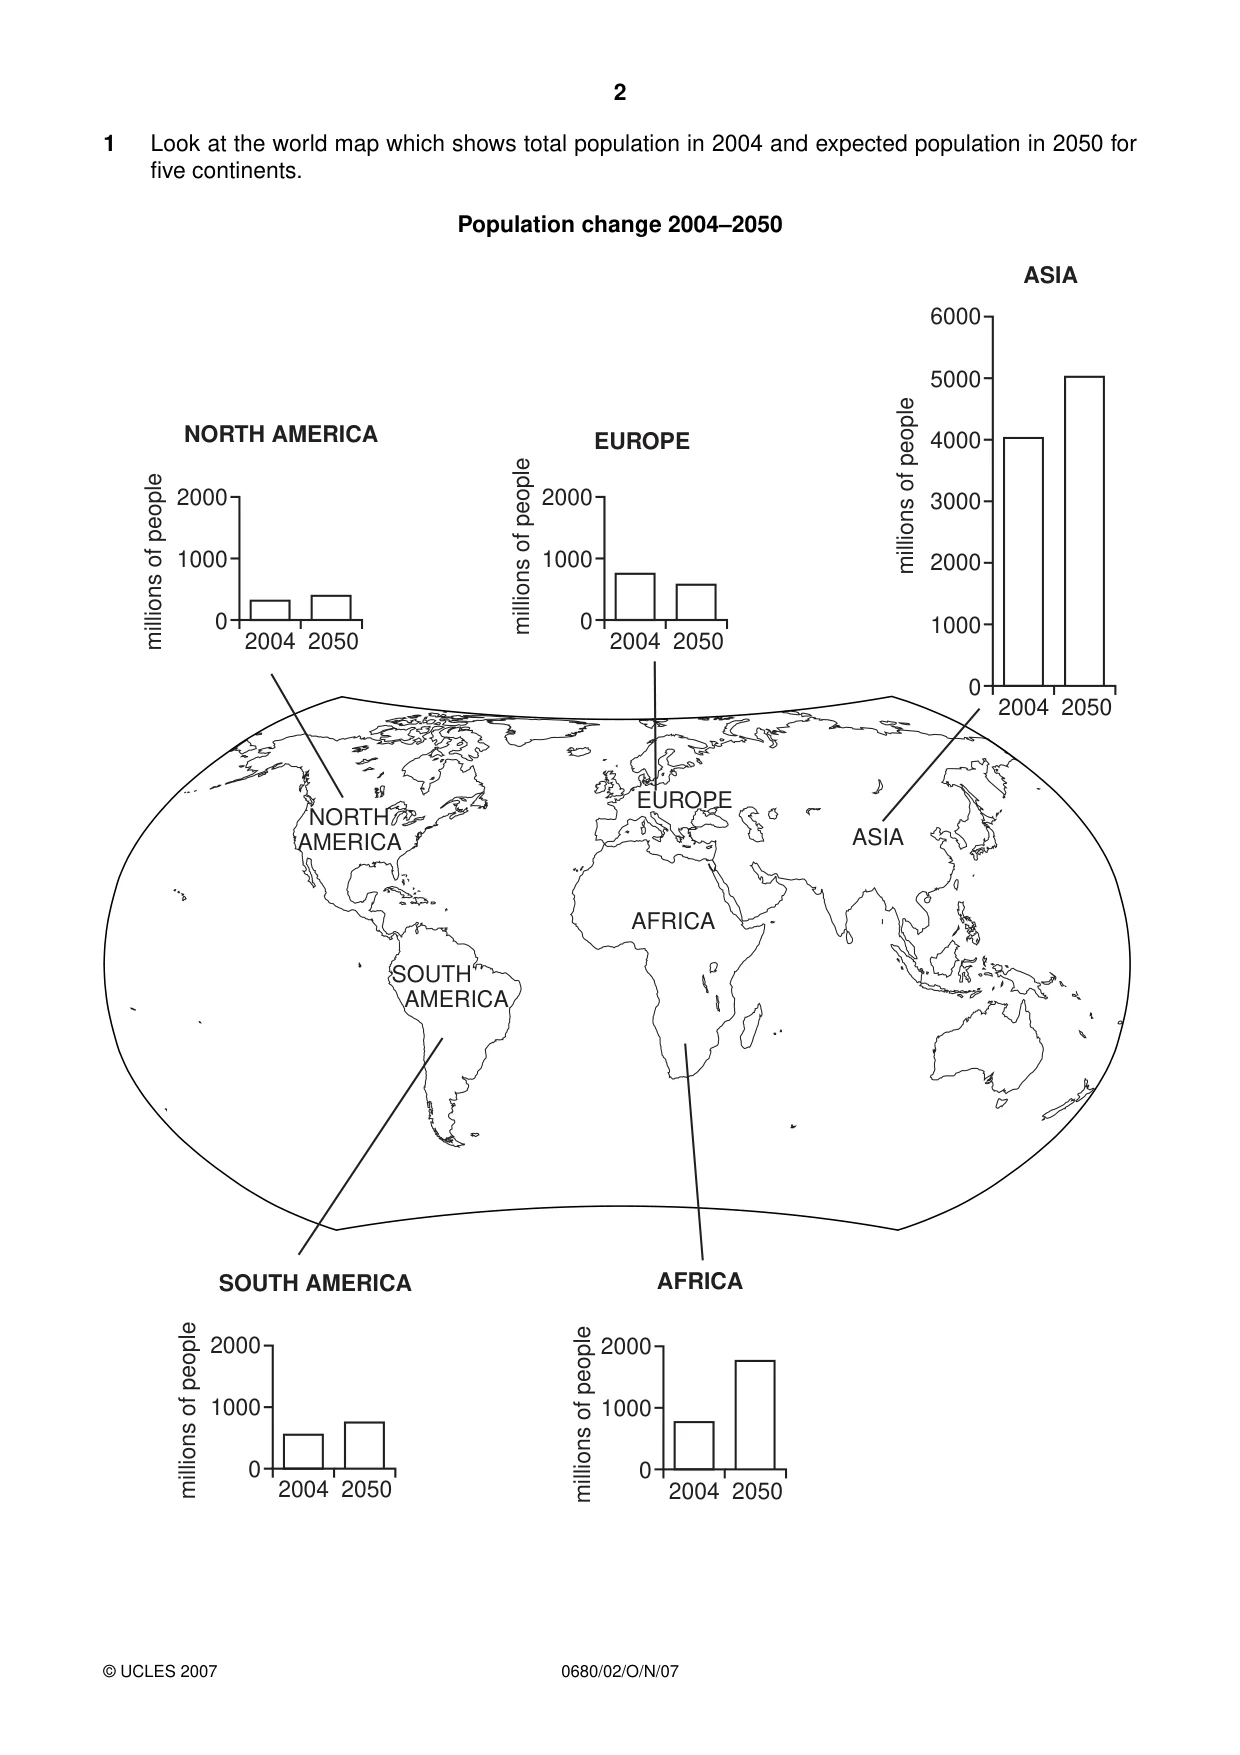
2 0680/02/O/N/07 © UCLES 2007 1 Look at the world map which shows total population in 2004 and expected population in 2050 for five continents. Population change 2004–2050 AFRICA EUROPE ASIA NORTH AMERICA SOUTH AMERICA 0 2004 2050 2004 2050 NORTH AMERICA ASIA AFRICA 1000 2000 0 2004 2050 SOUTH AMERICA 1000 2000 0 1000 2000 3000 4000 5000 6000 2004 2050 0 1000 2000 millions of people millions of people millions of people millions of people millions of people EUROPE 2004 2050 0 1000 2000
Question paper, page 3
3 0680/02/O/N/07 [Turn over For Examiner’s Use © UCLES 2007 (a) (i) By how much is the population of Asia expected to increase between 2004 and 2050? …[1] (ii) Compared with the other continents, what is expected to be different about population change in Europe from 2004 to 2050? …[1] (iii) In which continent is the fastest rate of population growth expected between 2004 and 2050? …[1]
Question paper, page 4
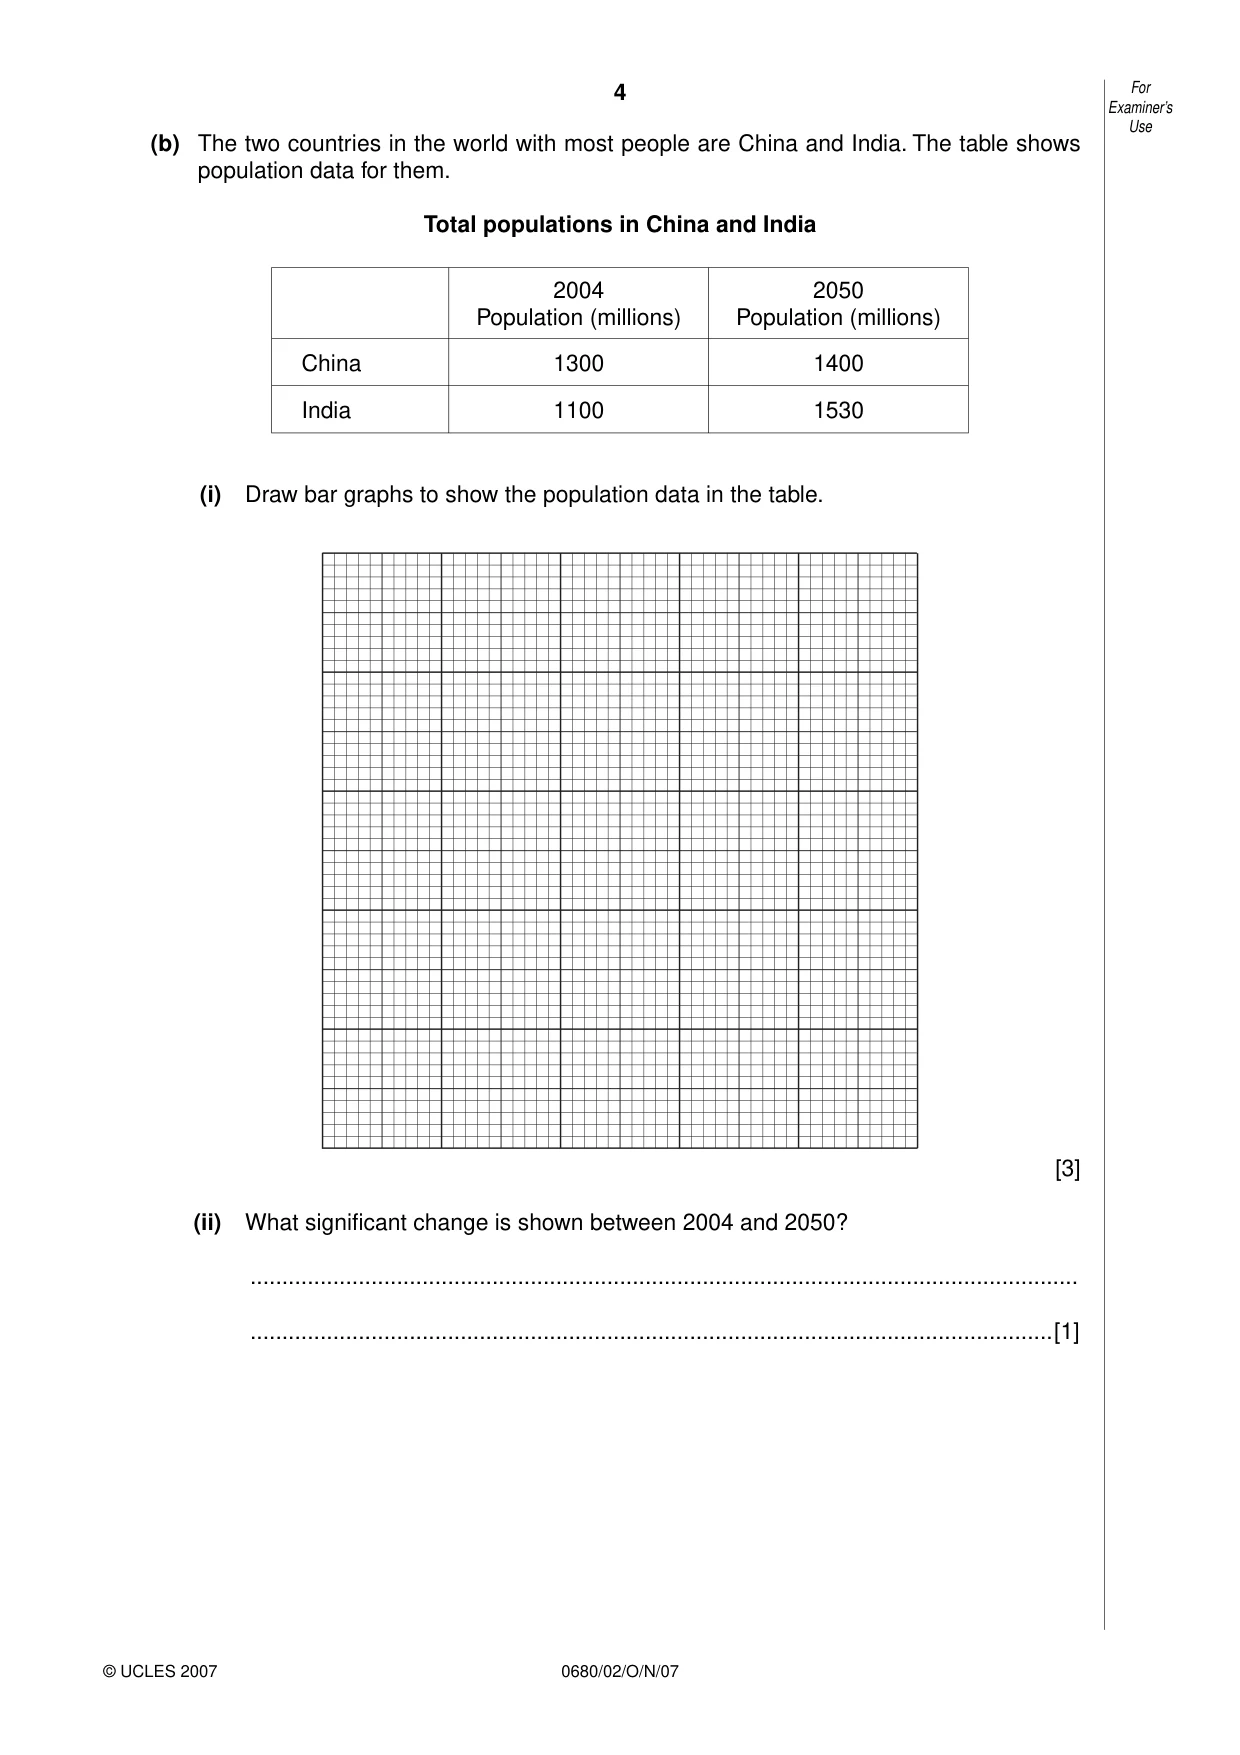
4 0680/02/O/N/07 For Examiner’s Use © UCLES 2007 (b) The two countries in the world with most people are China and India. The table shows population data for them. Total populations in China and India 2004 Population (millions) 2050 Population (millions) China 1300 1400 India 1100 1530 (i) Draw bar graphs to show the population data in the table. [3] (ii) What significant change is shown between 2004 and 2050? … …[1]
Question paper, page 5
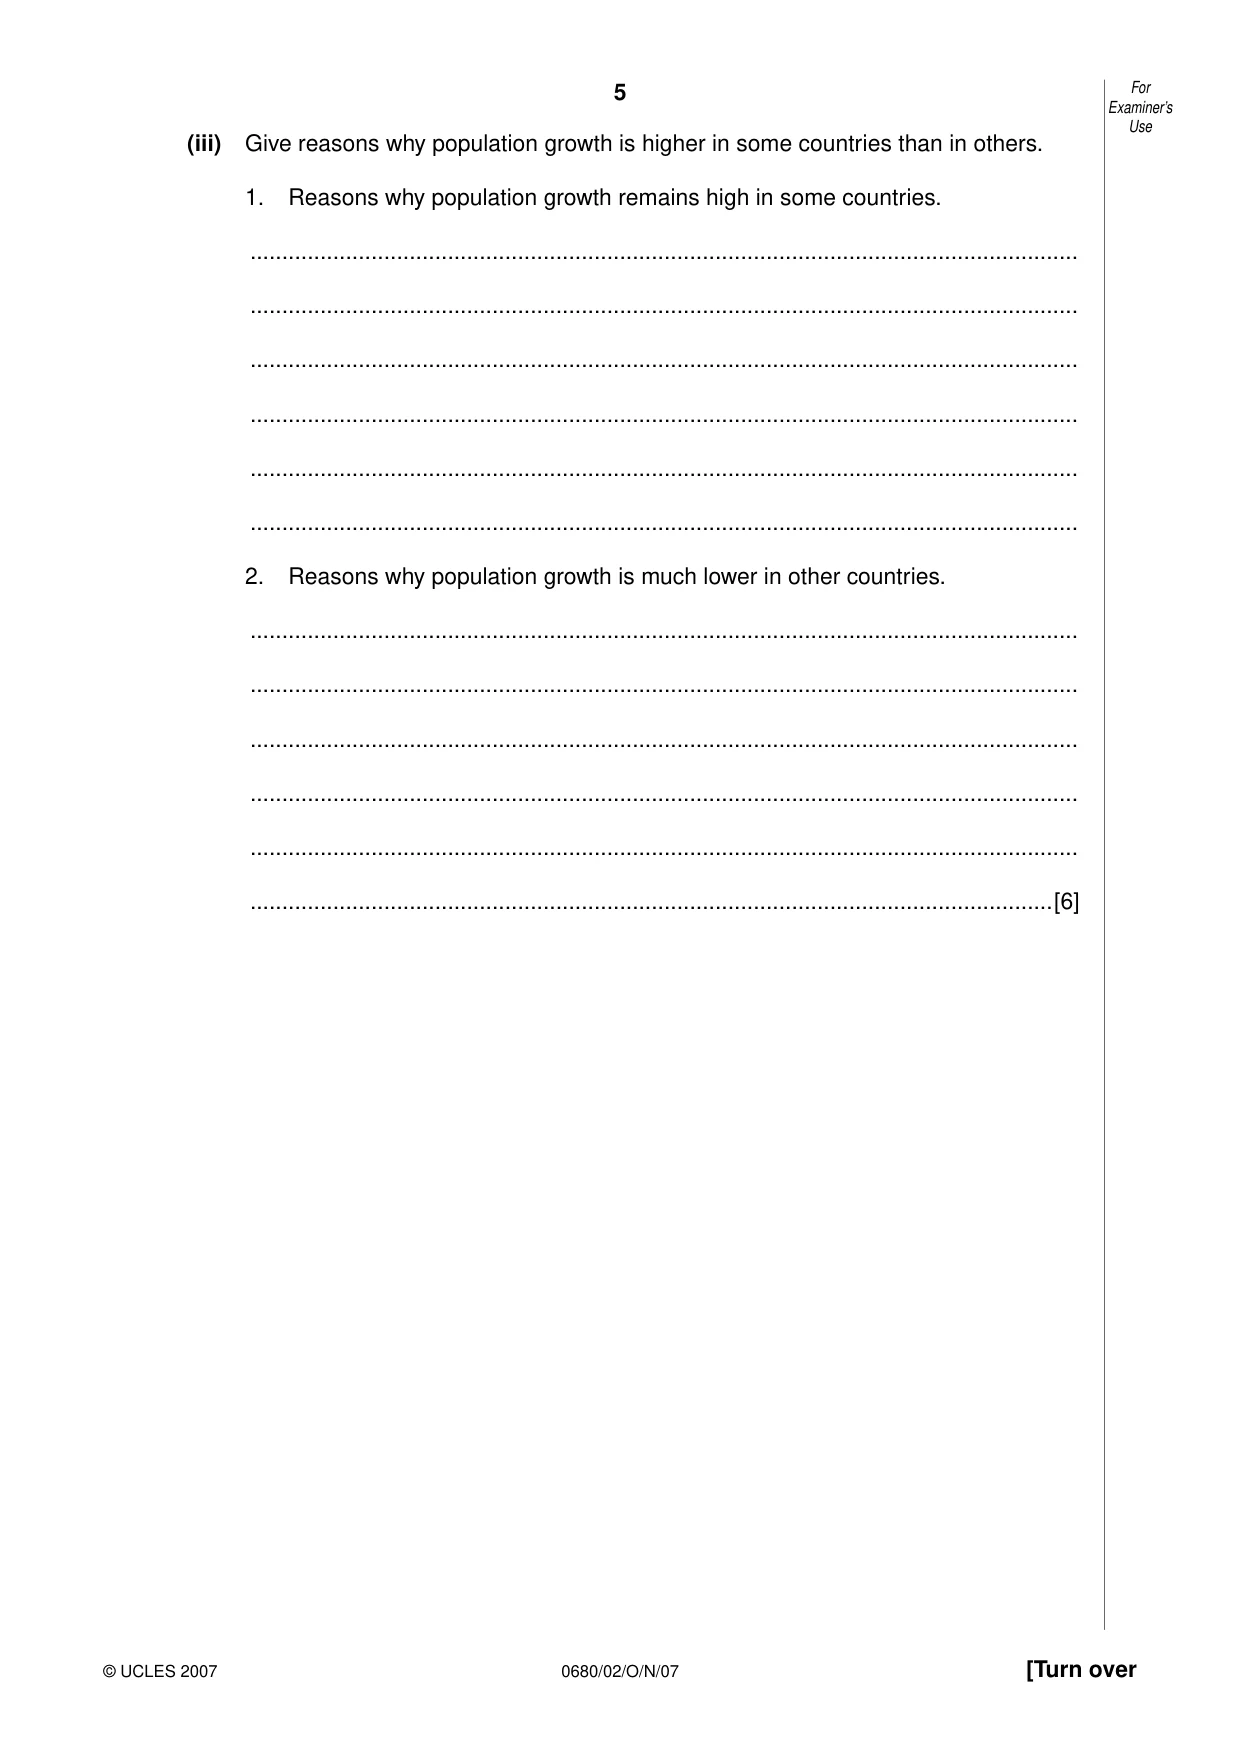
5 0680/02/O/N/07 [Turn over For Examiner’s Use © UCLES 2007 (iii) Give reasons why population growth is higher in some countries than in others. 1. Reasons why population growth remains high in some countries. … … … … … … 2. Reasons why population growth is much lower in other countries. … … … … … …[6]
Question paper, page 6
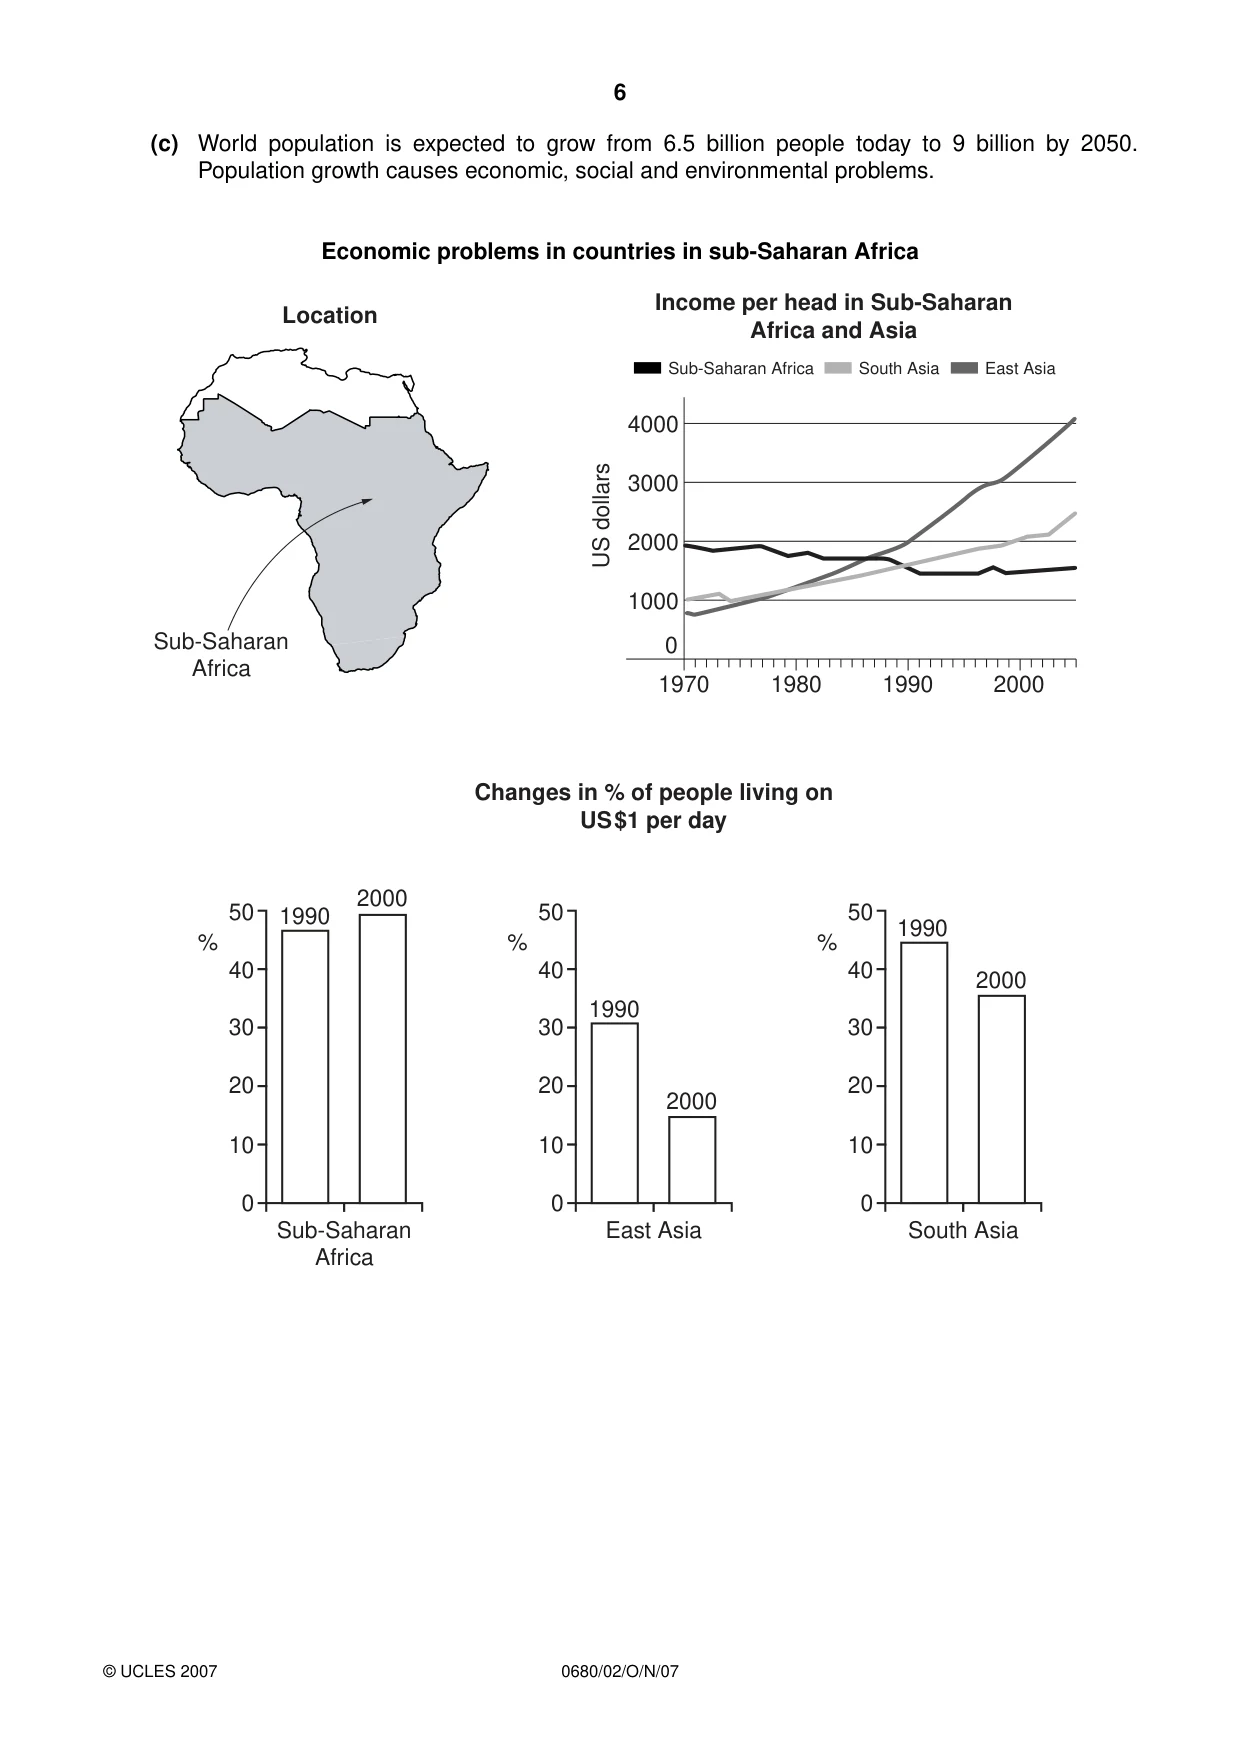
6 0680/02/O/N/07 © UCLES 2007 (c) World population is expected to grow from 6.5 billion people today to 9 billion by 2050. Population growth causes economic, social and environmental problems. Economic problems in countries in sub-Saharan Africa Location Sub-Saharan Africa 3000 2000 1000 1970 1980 1990 2000 0 US dollars 4000 Income per head in Sub-Saharan Africa and Asia Sub-Saharan Africa South Asia East Asia 50 2000 1990 % 40 30 20 Sub-Saharan Africa 10 0 50 2000 1990 % 40 30 20 East Asia Changes in % of people living on US$1 per day 10 0 50 2000 1990 % 40 30 20 South Asia 10 0
Question paper, page 7
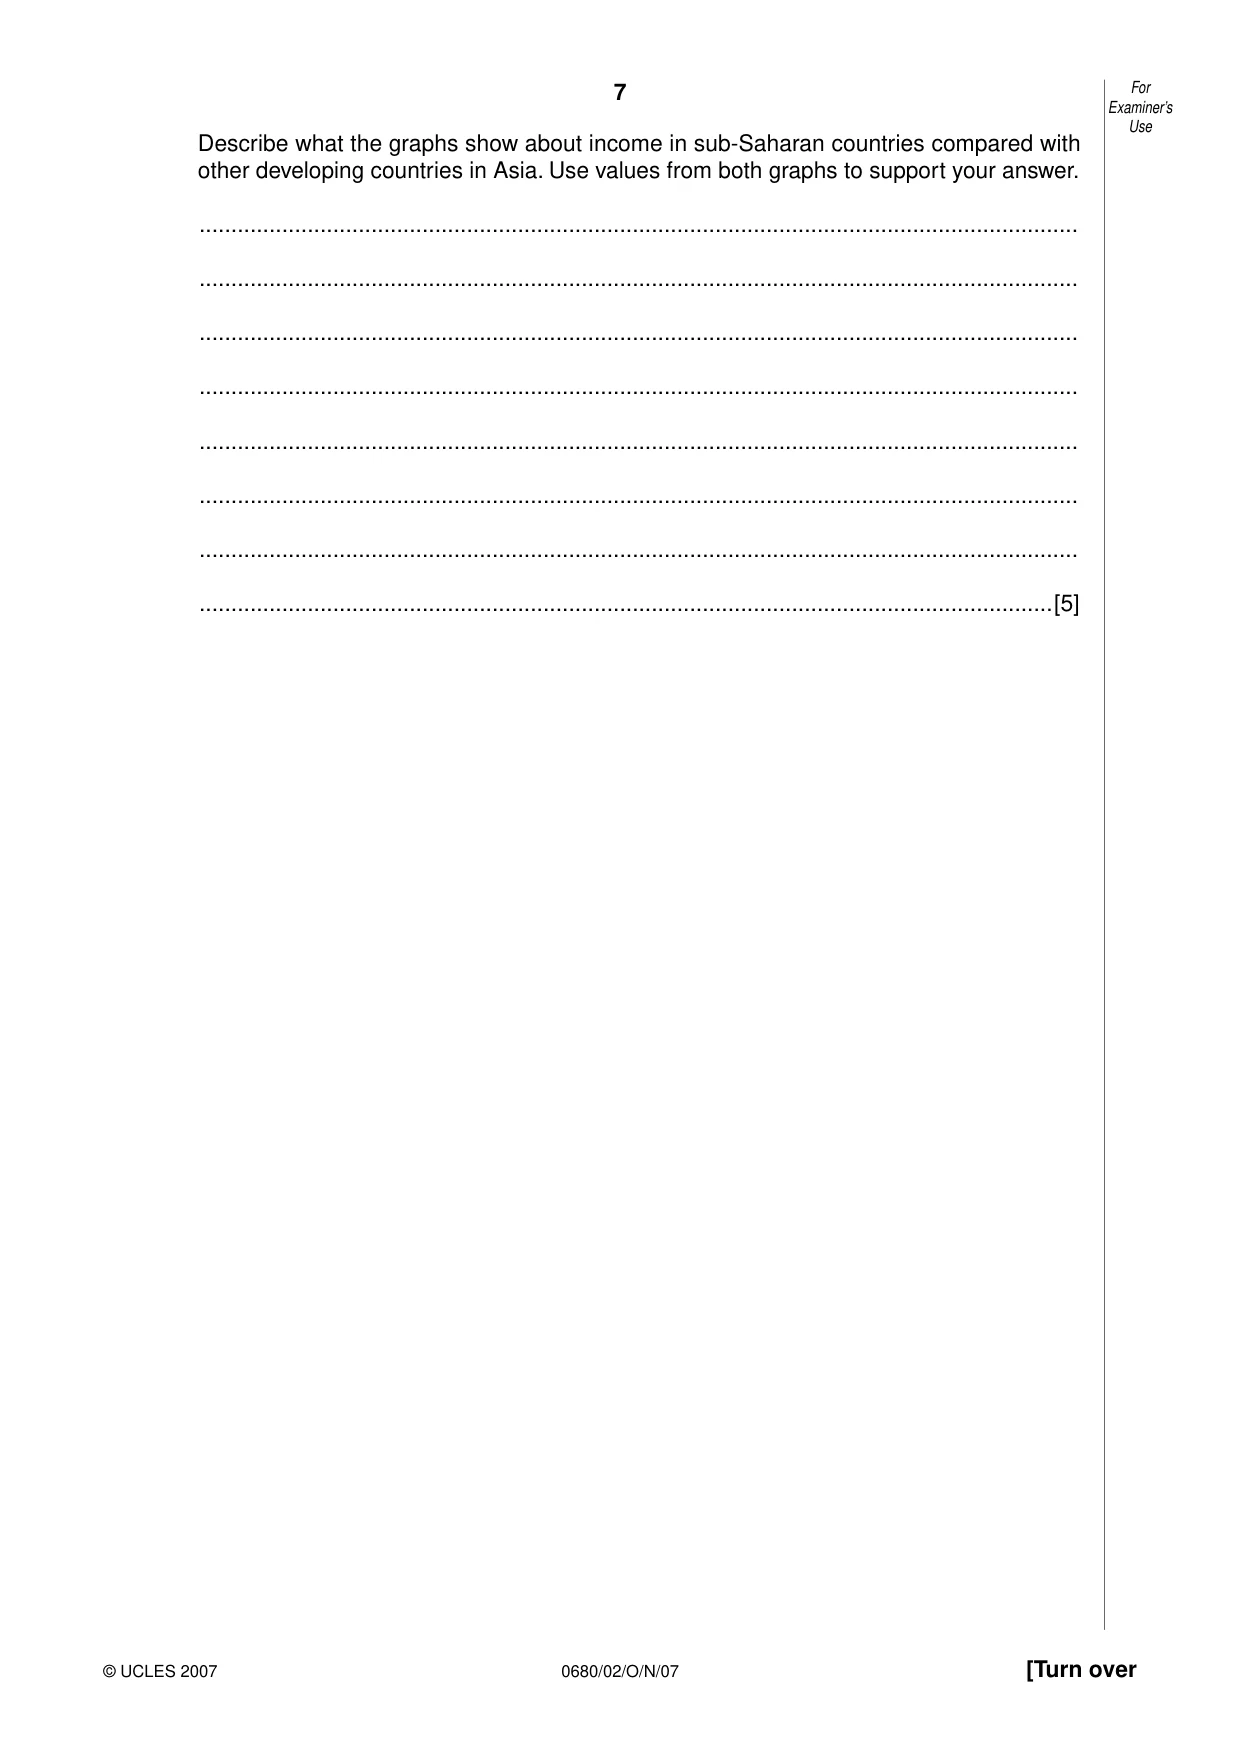
7 0680/02/O/N/07 [Turn over For Examiner’s Use © UCLES 2007 Describe what the graphs show about income in sub-Saharan countries compared with other developing countries in Asia. Use values from both graphs to support your answer. … … … … … … … …[5]
Question paper, page 8
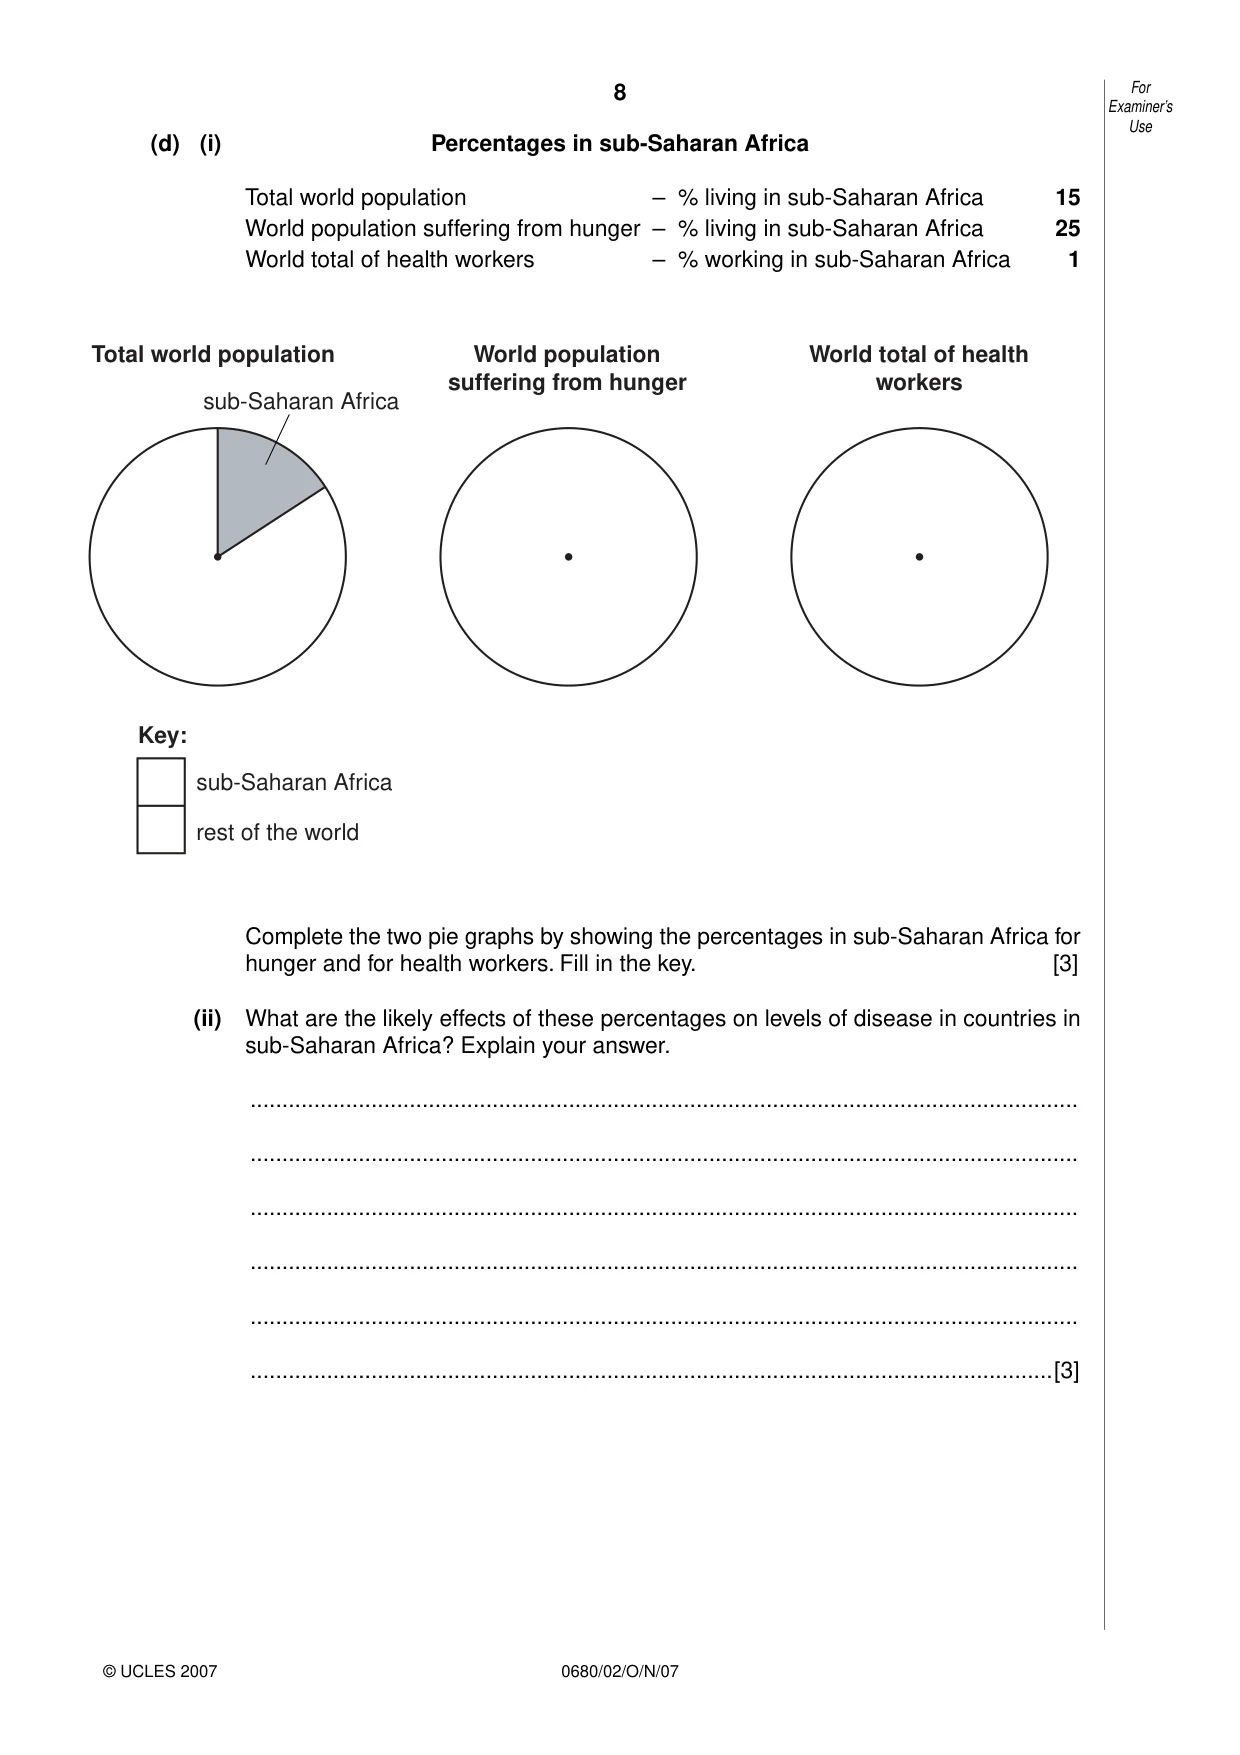
8 0680/02/O/N/07 © UCLES 2007 (d) (i) Percentages in sub-Saharan Africa Total world population – % living in sub-Saharan Africa 15 World population suffering from hunger – % living in sub-Saharan Africa 25 World total of health workers – % working in sub-Saharan Africa 1 Complete the two pie graphs by showing the percentages in sub-Saharan Africa for hunger and for health workers. Fill in the key. [3] (ii) What are the likely effects of these percentages on levels of disease in countries in sub-Saharan Africa? Explain your answer. … … … … … …[3] For Examiner’s Use Total world population World population suffering from hunger World total of health workers Key: sub-Saharan Africa sub-Saharan Africa rest of the world
Question paper, page 9
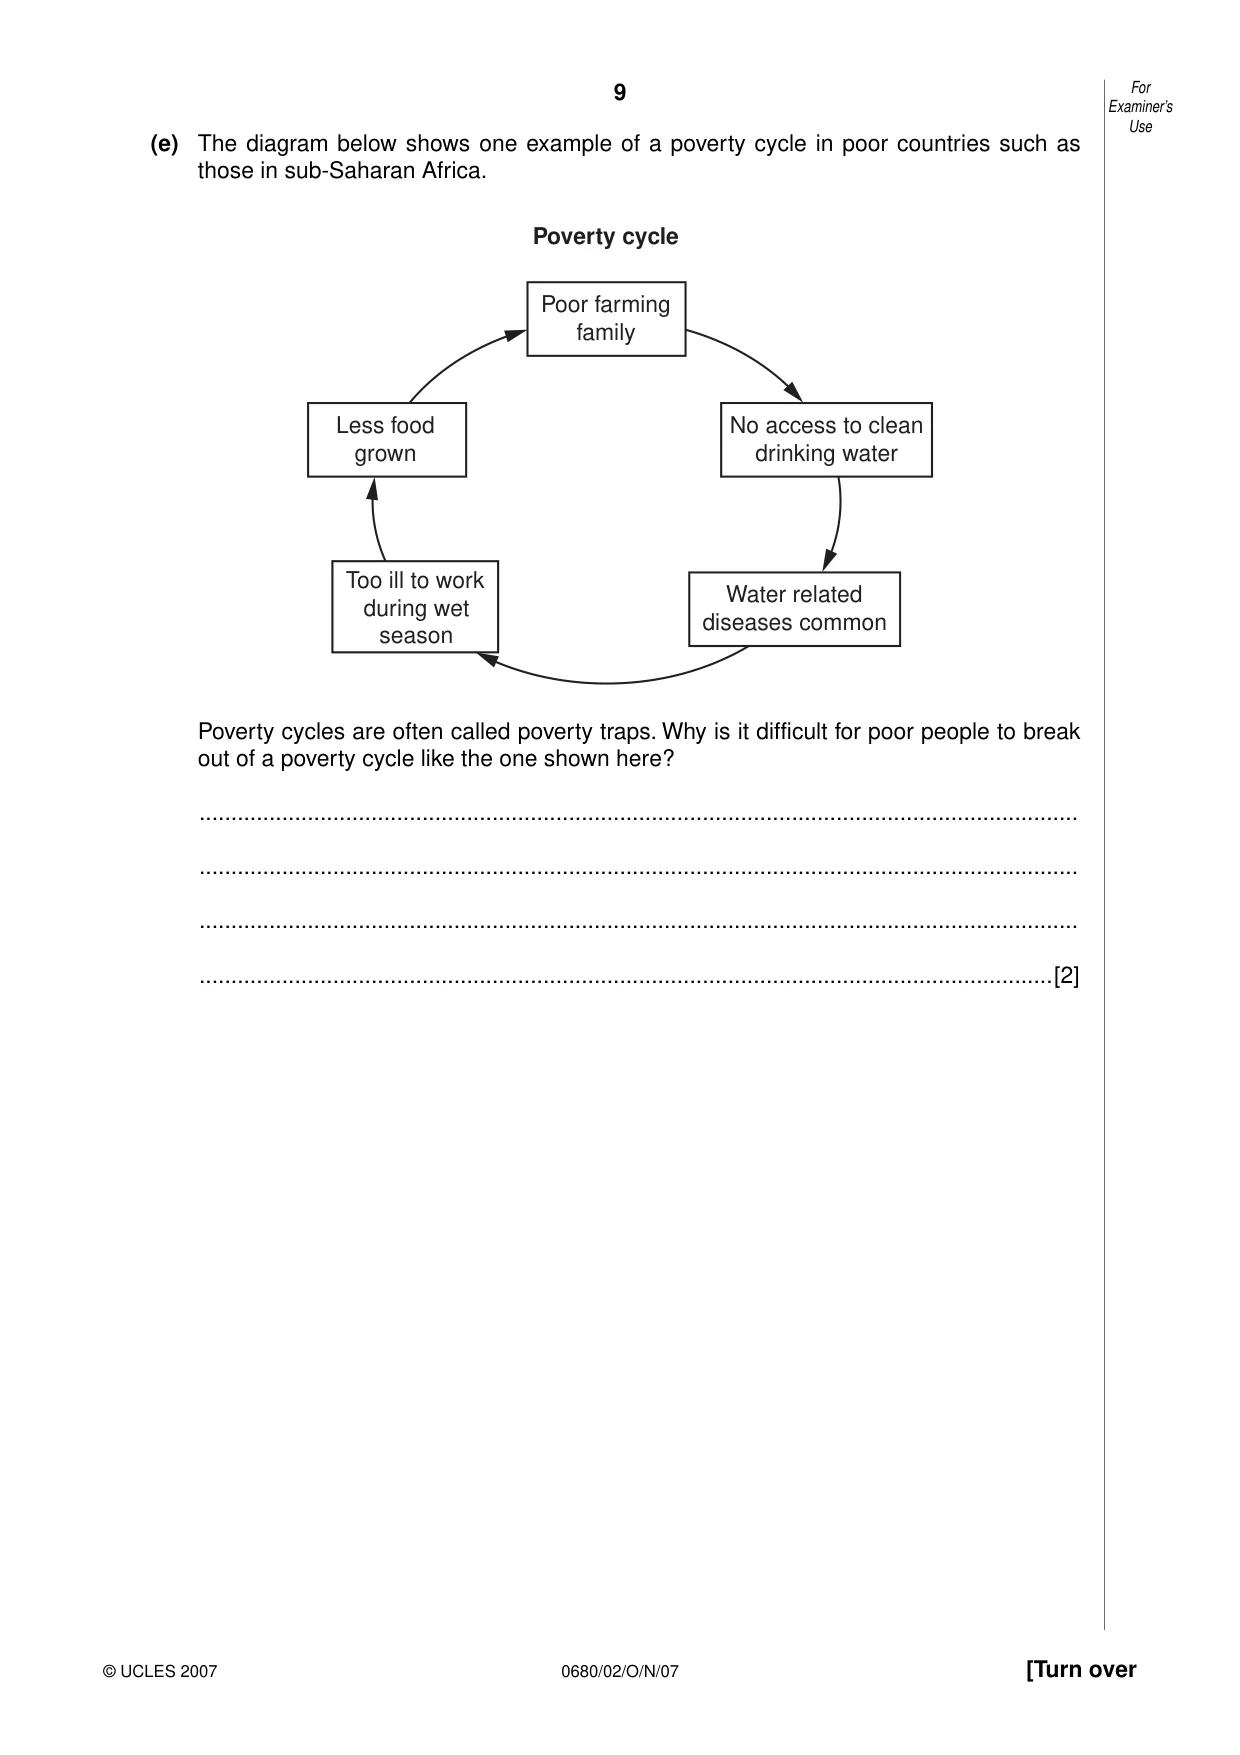
9 0680/02/O/N/07 [Turn over © UCLES 2007 (e) The diagram below shows one example of a poverty cycle in poor countries such as those in sub-Saharan Africa. Poor farming family Poverty cycle No access to clean drinking water Less food grown Water related diseases common Too ill to work during wet season Poverty cycles are often called poverty traps. Why is it difficult for poor people to break out of a poverty cycle like the one shown here? … … … …[2] For Examiner’s Use
Question paper, page 10
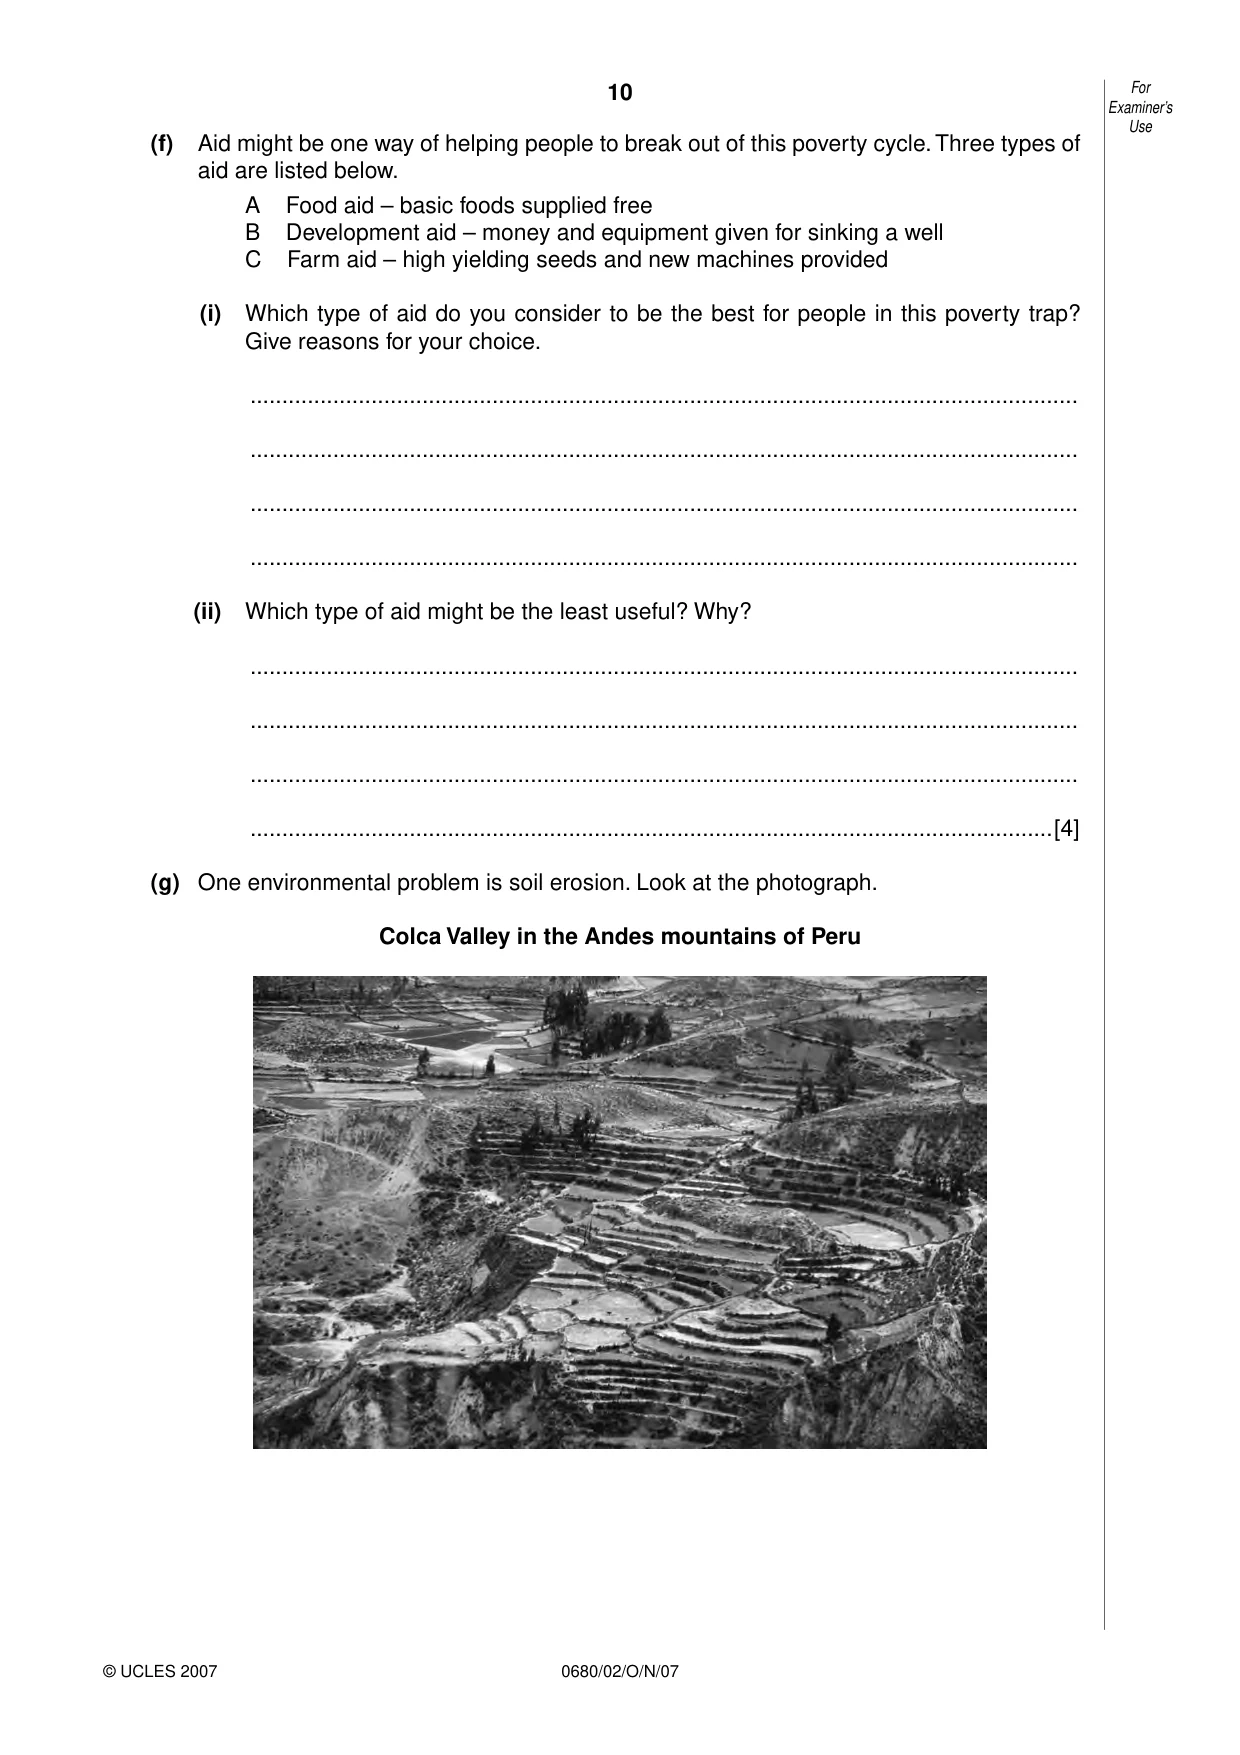
10 0680/02/O/N/07 For Examiner’s Use © UCLES 2007 (f) Aid might be one way of helping people to break out of this poverty cycle. Three types of aid are listed below. A Food aid – basic foods supplied free B Development aid – money and equipment given for sinking a well C Farm aid – high yielding seeds and new machines provided (i) Which type of aid do you consider to be the best for people in this poverty trap? Give reasons for your choice. … … … … (ii) Which type of aid might be the least useful? Why? … … … …[4] (g) One environmental problem is soil erosion. Look at the photograph. Colca Valley in the Andes mountains of Peru
Question paper, page 11
11 0680/02/O/N/07 [Turn over For Examiner’s Use © UCLES 2007 (i) Describe the natural features which show that there is a high risk of soil erosion in this area. … … … … … …[4] (ii) Using the photograph, describe what has already been done in the area on the photograph to reduce the likelihood of soil erosion occurring. … … …[2] (iii) What else might farmers in this area do to prevent soil erosion? Describe two soil conservation strategies which could be used by farmers in this area. … … … … … … … …[4] [Total: 40 marks]
Question paper, page 12
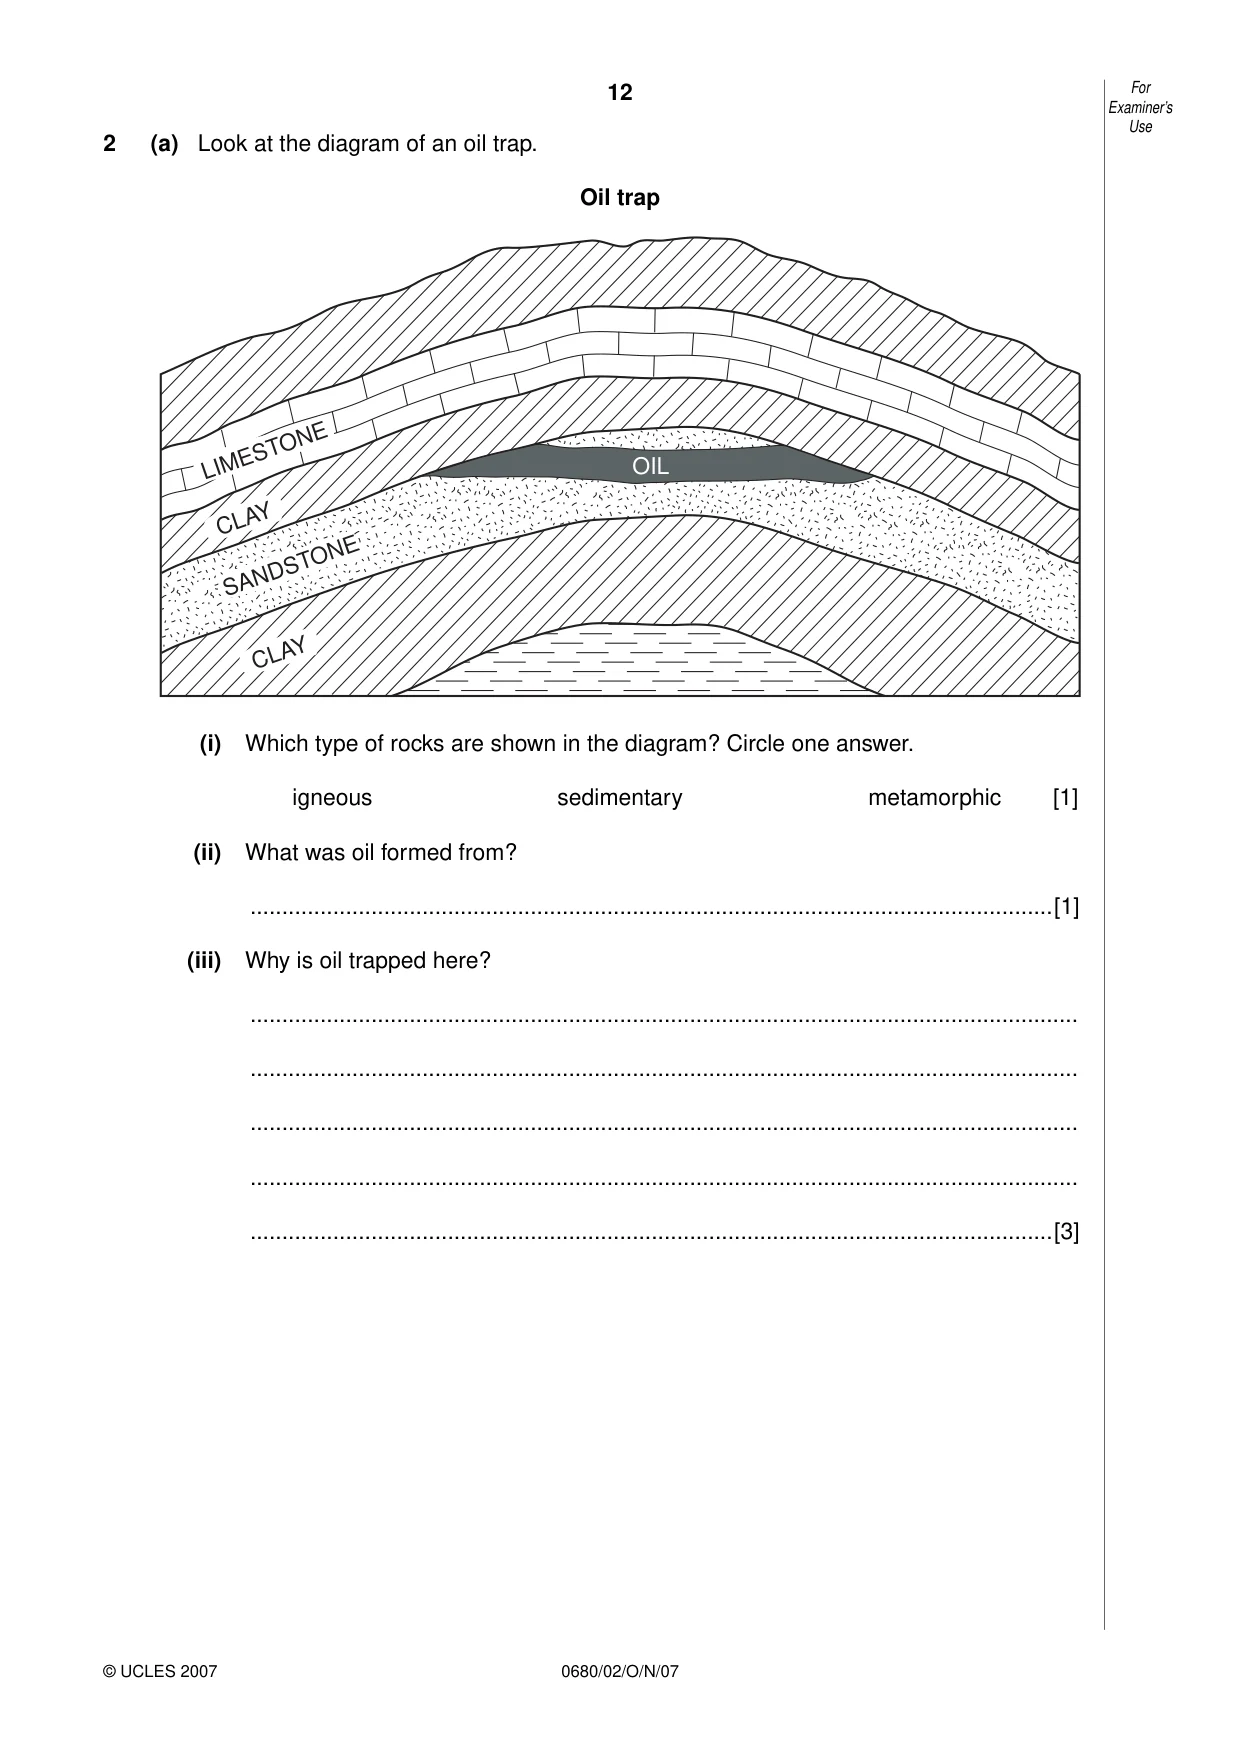
12 0680/02/O/N/07 For Examiner’s Use © UCLES 2007 2 (a) Look at the diagram of an oil trap. Oil trap OIL LIMESTONE CLAY CLAY SANDSTONE (i) Which type of rocks are shown in the diagram? Circle one answer. igneous sedimentary metamorphic [1] (ii) What was oil formed from? …[1] (iii) Why is oil trapped here? … … … … …[3]
Question paper, page 13
13 0680/02/O/N/07 [Turn over For Examiner’s Use © UCLES 2007 (iv) Explain the methods used by oil companies to extract oil from underground traps like the one shown. … … … … … …[3] (v) State one danger for people working in oilfields. … …[1]
Question paper, page 14
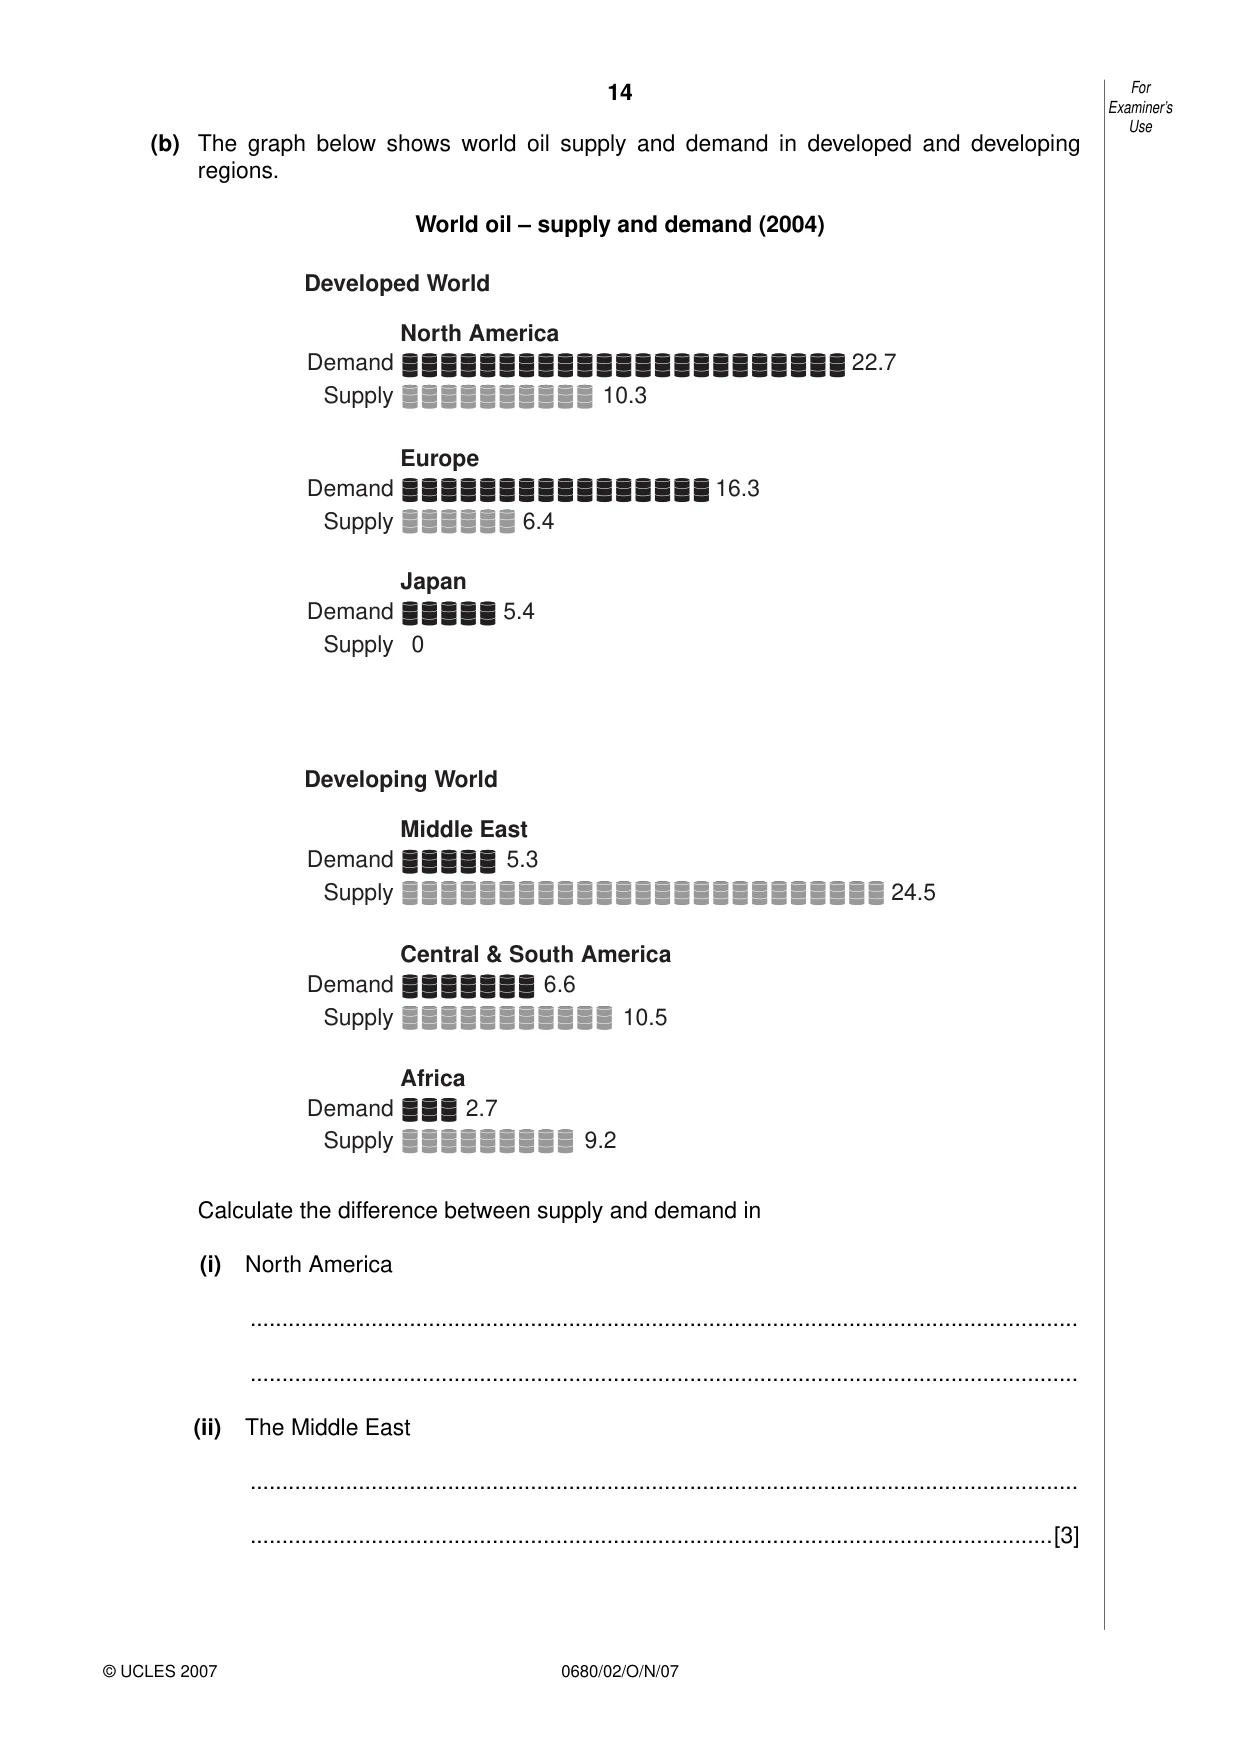
14 0680/02/O/N/07 For Examiner’s Use © UCLES 2007 (b) The graph below shows world oil supply and demand in developed and developing regions. World oil – supply and demand (2004) Supply Demand Supply Demand North America Developed World Europe Supply Demand Japan Supply Demand Supply Demand Middle East Developing World Central & South America Supply Demand 10.3 22.7 6.4 16.3 0 5.4 24.5 5.3 10.5 6.6 9.2 2.7 Africa Calculate the difference between supply and demand in (i) North America … … (ii) The Middle East … …[3]
Question paper, page 15
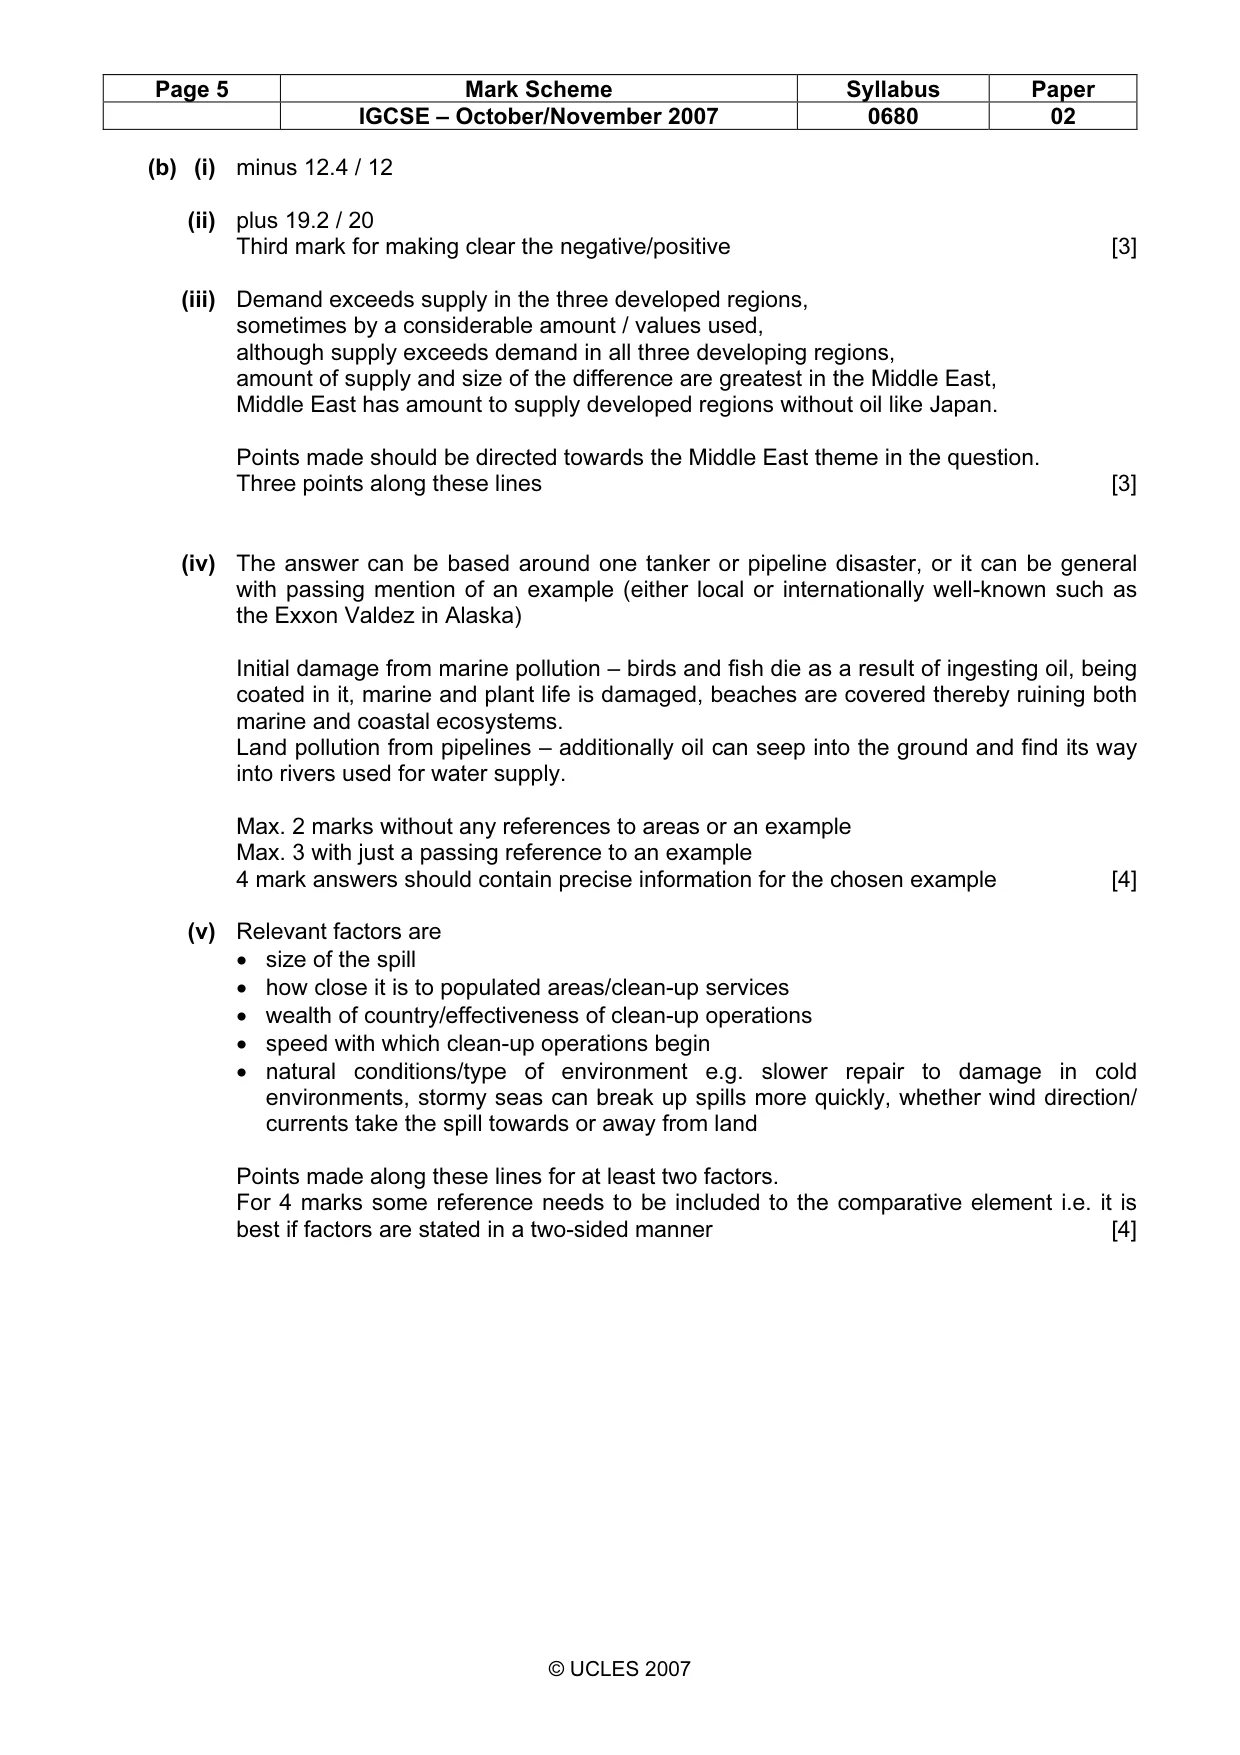
15 0680/02/O/N/07 © UCLES 2007 (iii) How important is the Middle East as a supplier of oil to other regions of the world? Explain your answer. … … … … … …[3] (iv) Describe the types of environmental damage that result from transporting oil by pipelines and tankers. Refer to an example in your answer. … … … … … … …[4] (v) Explain why some oil spills can be cleaned up more quickly and effectively than others. … … … … … … … …[4] [Turn over For Examiner’s Use
Question paper, page 16
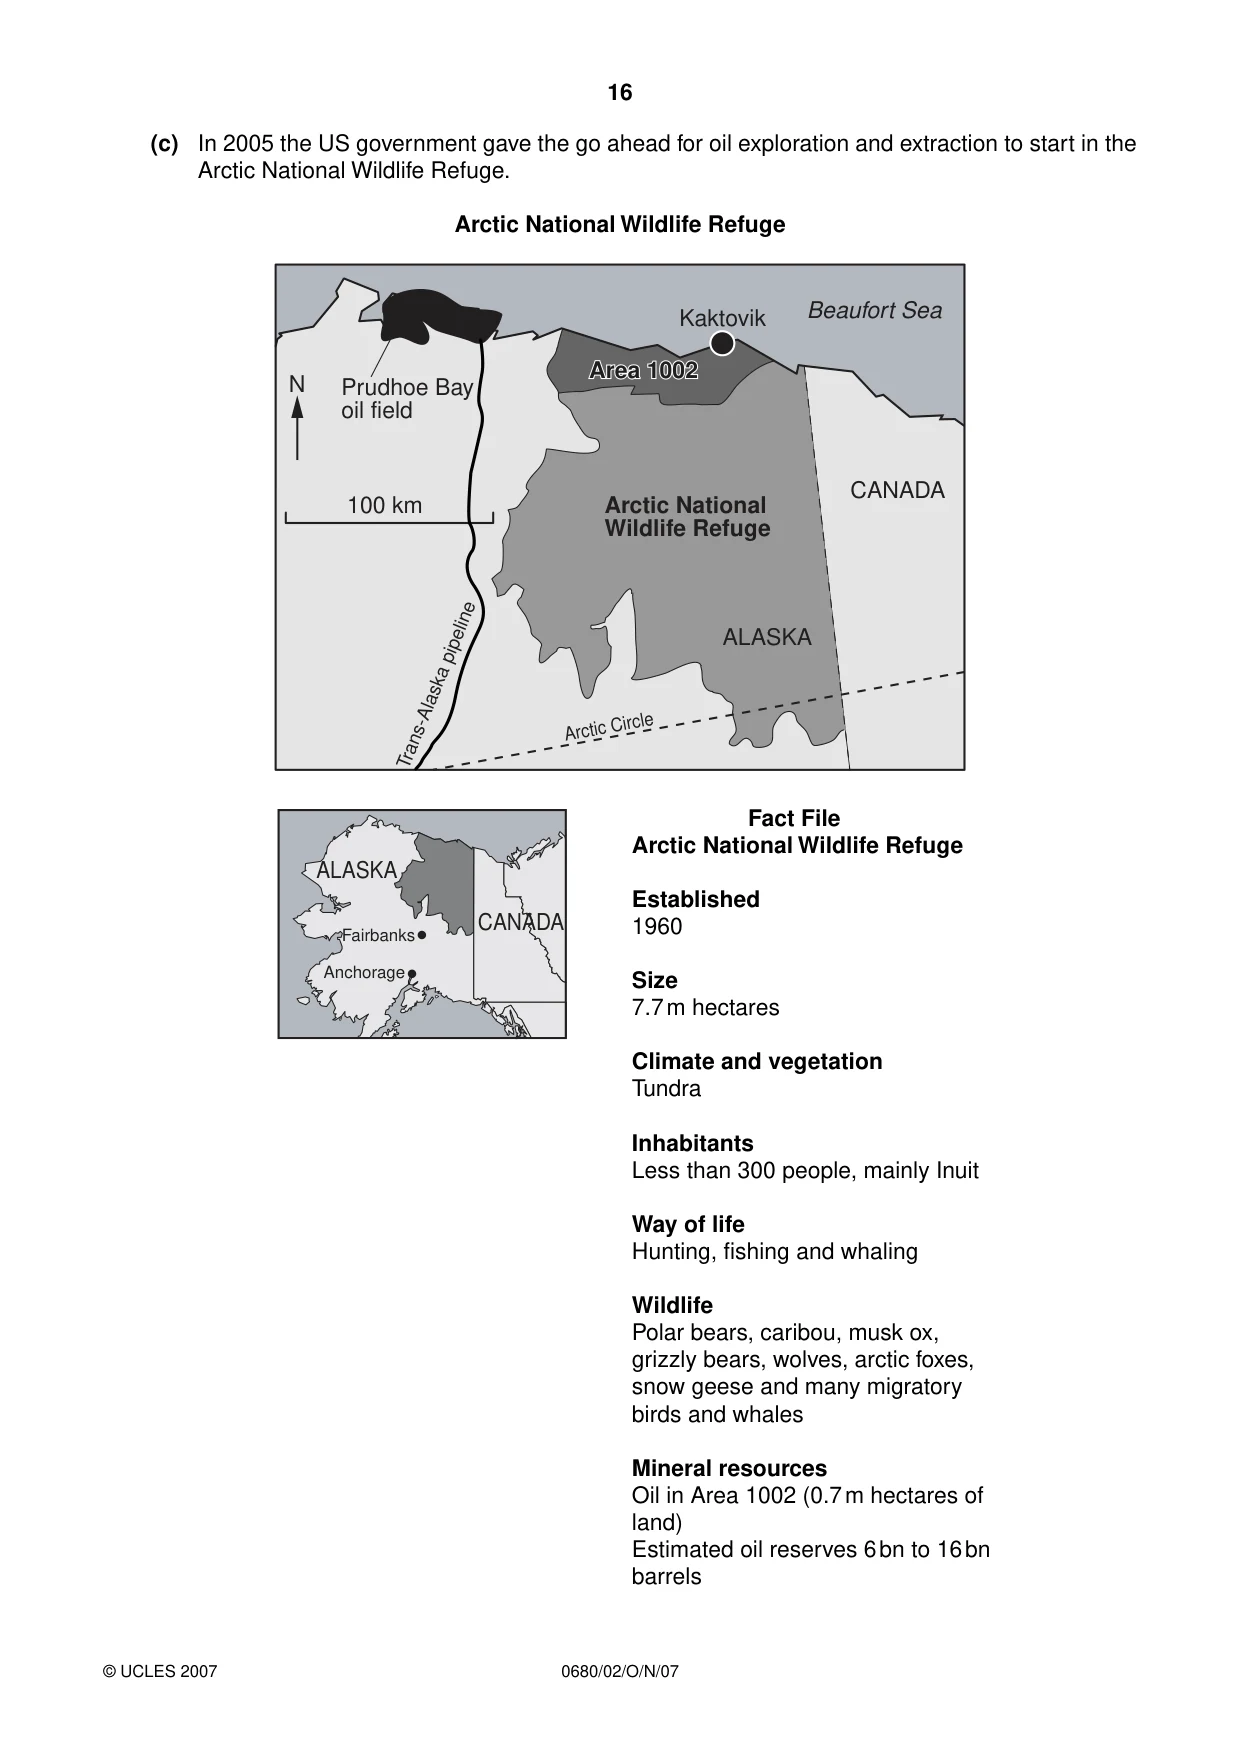
16 0680/02/O/N/07 (c) In 2005 the US government gave the go ahead for oil exploration and extraction to start in the Arctic National Wildlife Refuge. Arctic National Wildlife Refuge ALASKA Arctic Circle 100 km Trans-Alaska pipeline Prudhoe Bay oil field N Kaktovik Beaufort Sea CANADA Area 1002 Area 1002 Arctic National Wildlife Refuge Area 1002 Fact File Arctic National Wildlife Refuge Established 1960 Size 7.7 m hectares Climate and vegetation Tundra Inhabitants Less than 300 people, mainly Inuit Way of life Hunting, fishing and whaling Wildlife Polar bears, caribou, musk ox, grizzly bears, wolves, arctic foxes, snow geese and many migratory birds and whales Mineral resources Oil in Area 1002 (0.7 m hectares of land) Estimated oil reserves 6 bn to 16 bn barrels © UCLES 2007 CANADA ALASKA Fairbanks Anchorage
Question paper, page 17
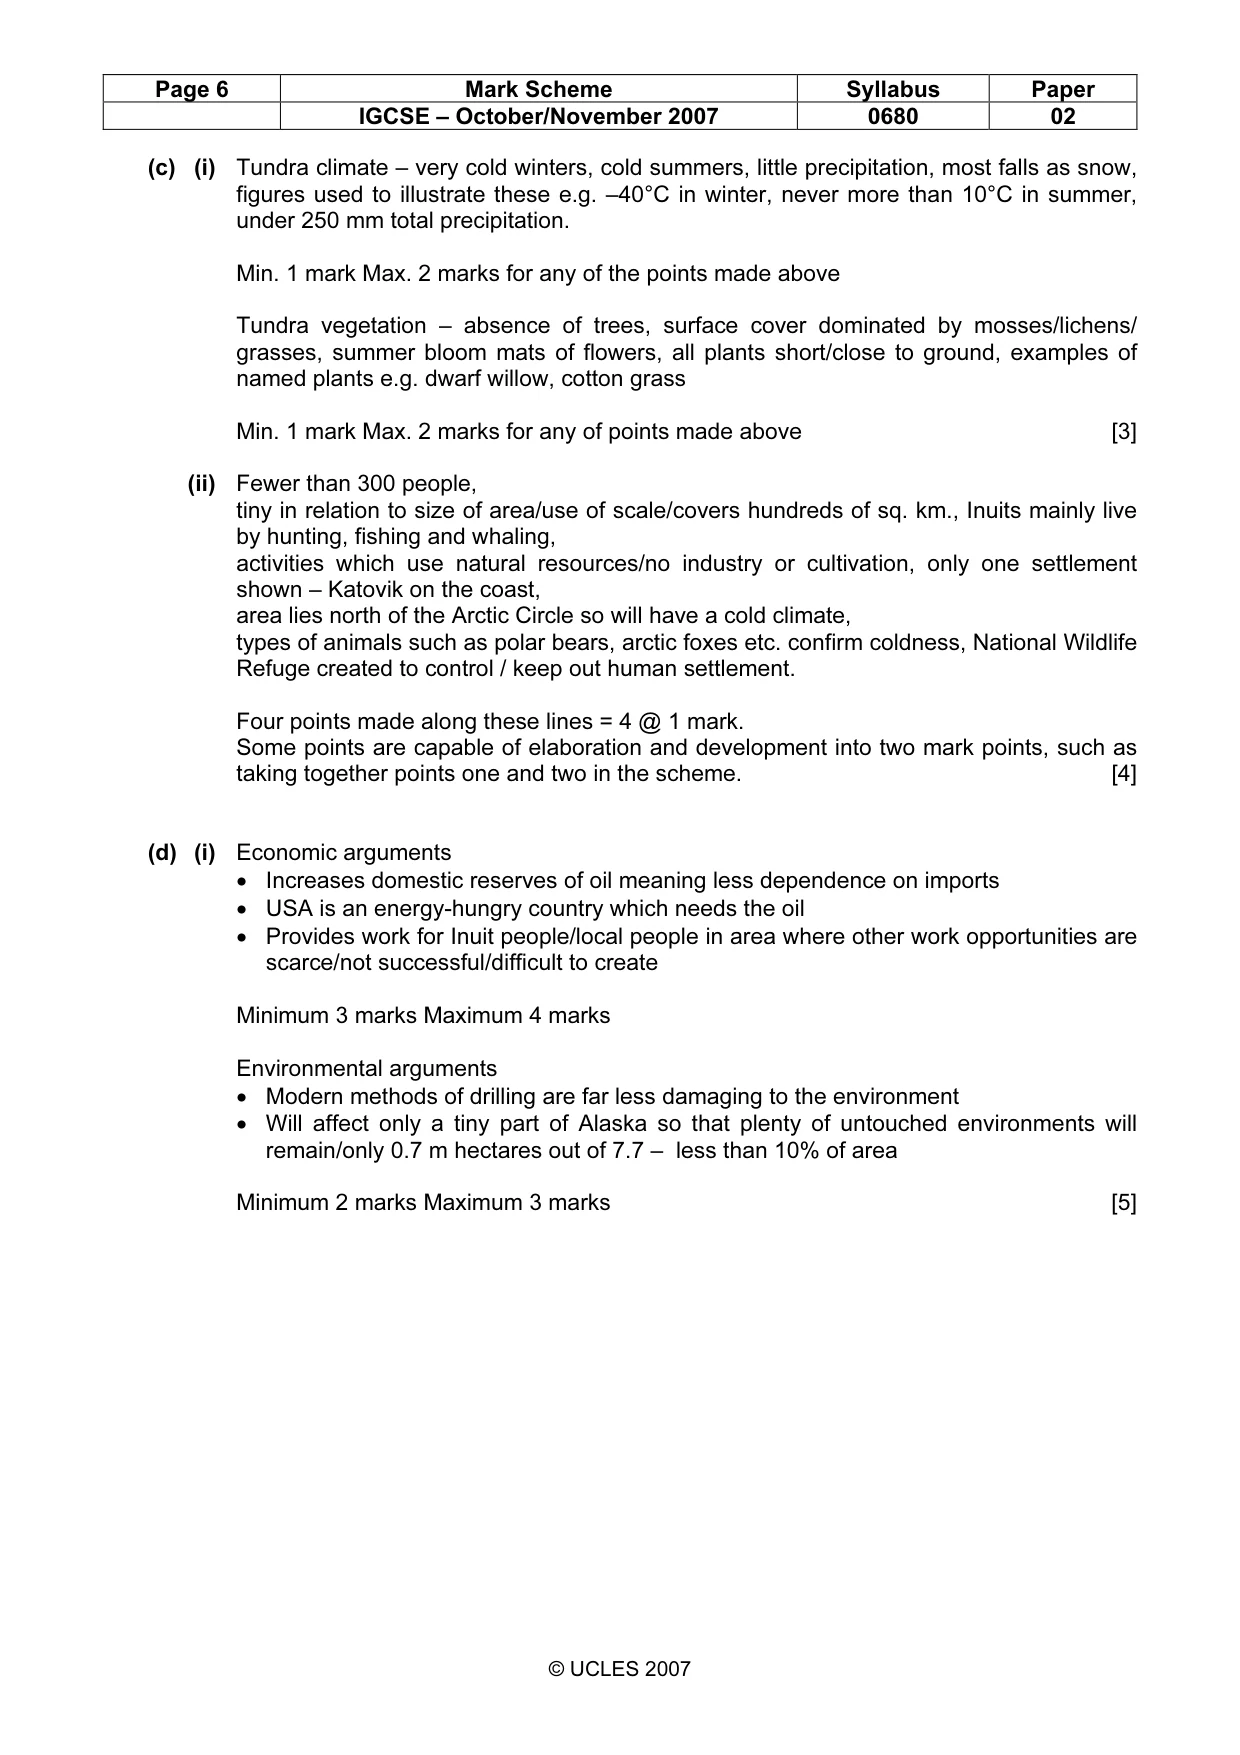
17 0680/02/O/N/07 [Turn over For Examiner’s Use (i) Describe the characteristics of the tundra climate and vegetation. … … … … …[3] (ii) The Arctic National Wildlife Refuge was set up because it is a wilderness. A wilderness is an area of undeveloped land which is still natural. Describe how the map and information in the Fact File show that at present the Arctic Refuge is a wilderness. … … … … … … …[4] © UCLES 2007
Question paper, page 18
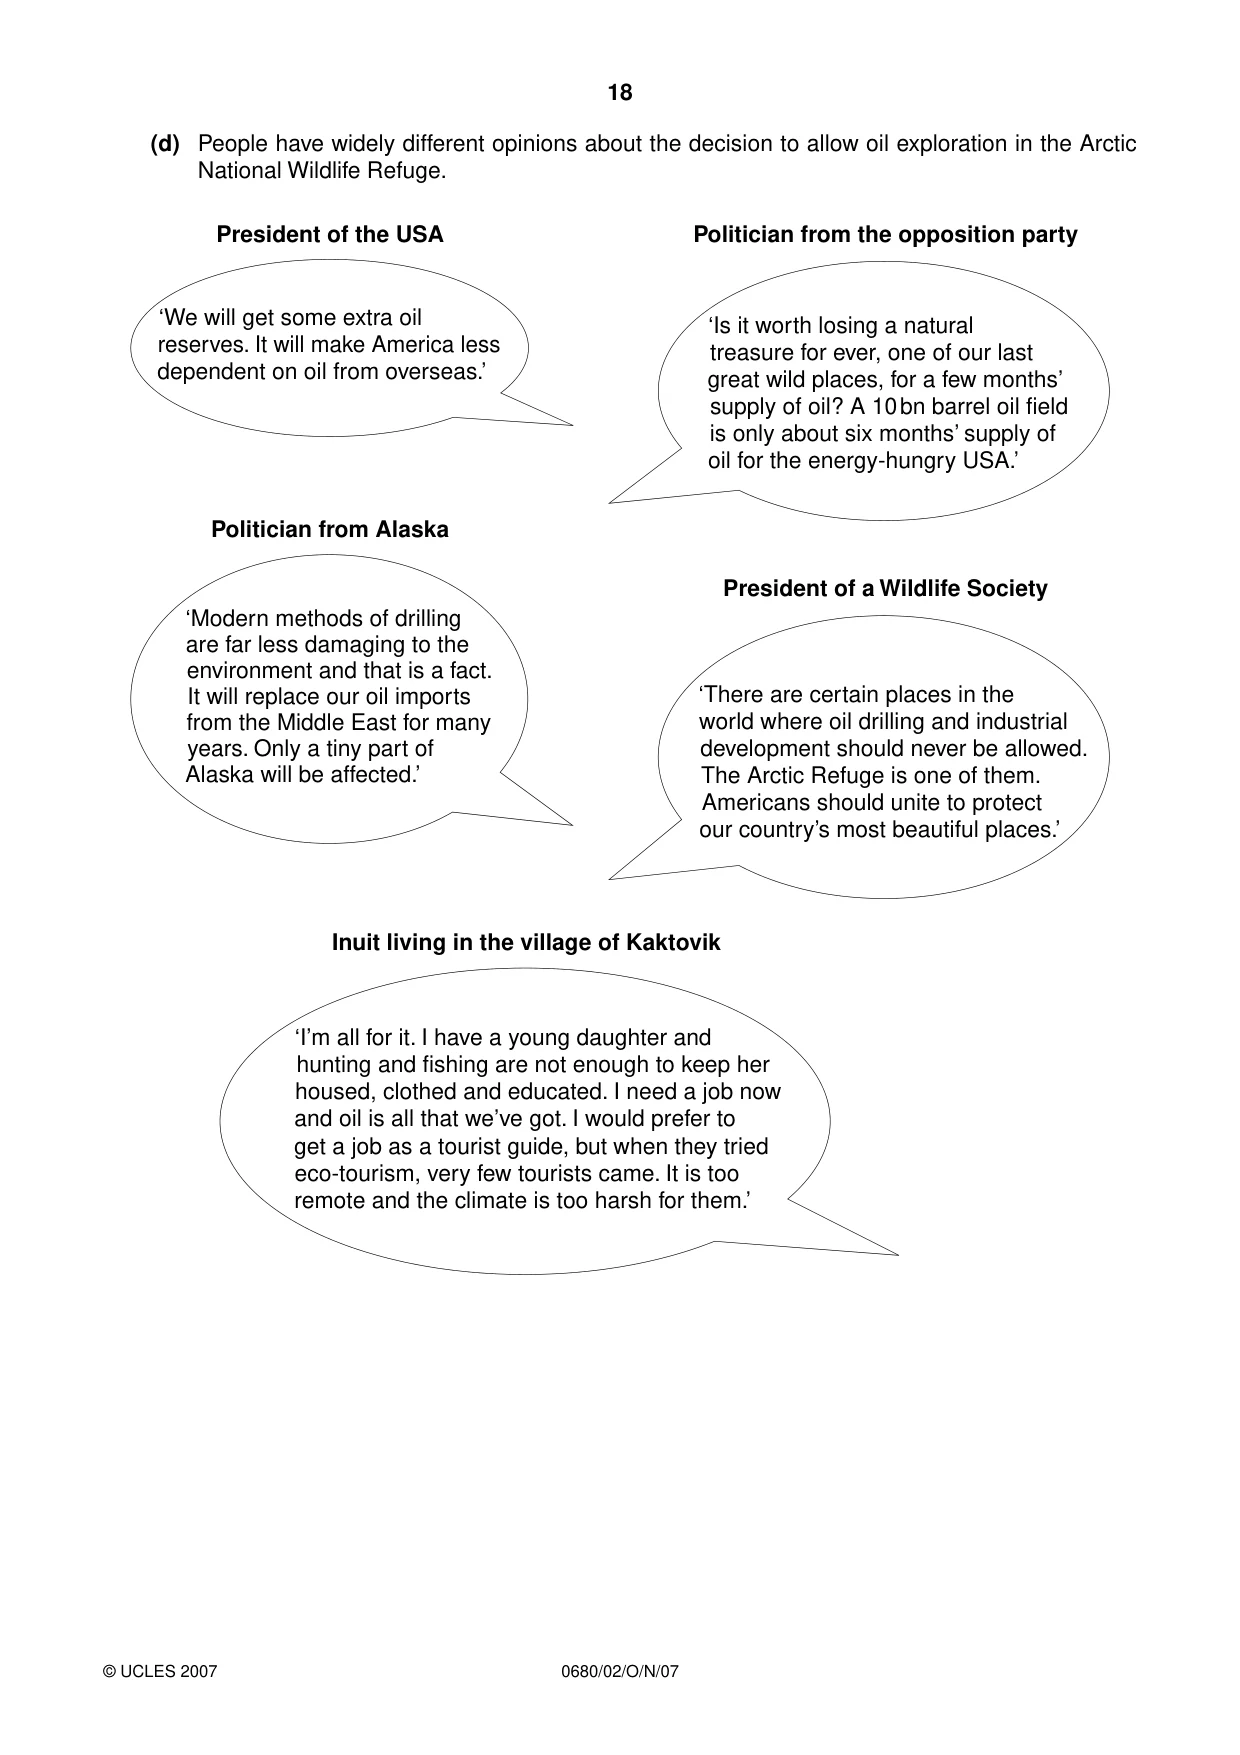
18 0680/02/O/N/07 © UCLES 2007 (d) People have widely different opinions about the decision to allow oil exploration in the Arctic National Wildlife Refuge. ‘We will get some extra oil reserves. It will make America less dependent on oil from overseas.’ President of the USA ‘Is it worth losing a natural treasure for ever, one of our last great wild places, for a few months’ supply of oil? A 10 bn barrel oil field is only about six months’ supply of oil for the energy-hungry USA.’ Politician from the opposition party ‘Modern methods of drilling are far less damaging to the environment and that is a fact. It will replace our oil imports from the Middle East for many years. Only a tiny part of Alaska will be affected.’ Politician from Alaska ‘There are certain places in the world where oil drilling and industrial development should never be allowed. The Arctic Refuge is one of them. Americans should unite to protect our country’s most beautiful places.’ President of a Wildlife Society ‘I’m all for it. I have a young daughter and hunting and fishing are not enough to keep her housed, clothed and educated. I need a job now and oil is all that we’ve got. I would prefer to get a job as a tourist guide, but when they tried eco-tourism, very few tourists came. It is too remote and the climate is too harsh for them.’ Inuit living in the village of Kaktovik
Question paper, page 19
19 0680/02/O/N/07 For Examiner’s Use © UCLES 2007 (i) Describe the economic and environmental arguments made by those people who support the decision to allow oil extraction in Area 1002. Economic … … … … … Environmental … … … … …[5] (ii) Explain your opinion about whether new oil extraction in Alaska should be allowed. … … … … … … … … … … … …[5] [Total: 40 marks]
Question paper, page 20
20 0680/02/O/N/07 BLANK PAGE Copyright Acknowledgements: Question 1(g) J. Pallister © UCLES. Question 2(b) © BP Statistical Review for 2005. Permission to reproduce items where third-party owned material protected by copyright is included has been sought and cleared where possible. Every reasonable effort has been made by the publisher (UCLES) to trace copyright holders, but if any items requiring clearance have unwittingly been included, the publisher will be pleased to make amends at the earliest possible opportunity. University of Cambridge International Examinations is part of the Cambridge Assessment Group. Cambridge Assessment is the brand name of University of Cambridge Local Examinations Syndicate (UCLES), which is itself a department of the University of Cambridge.
Mark scheme, page 1
UNIVERSITY OF CAMBRIDGE INTERNATIONAL EXAMINATIONS International General Certificate of Secondary Education MARK SCHEME for the October/November 2007 question paper 0680 ENVIRONMENTAL MANAGEMENT 0680/02 Paper 2, maximum raw mark 80 This mark scheme is published as an aid to teachers and candidates, to indicate the requirements of the examination. It shows the basis on which Examiners were instructed to award marks. It does not indicate the details of the discussions that took place at an Examiners’ meeting before marking began. All Examiners are instructed that alternative correct answers and unexpected approaches in candidates’ scripts must be given marks that fairly reflect the relevant knowledge and skills demonstrated. Mark schemes must be read in conjunction with the question papers and the report on the examination. • CIE will not enter into discussions or correspondence in connection with these mark schemes. CIE is publishing the mark schemes for the October/November 2007 question papers for most IGCSE, GCE Advanced Level and Advanced Subsidiary Level syllabuses and some Ordinary Level syllabuses. www.XtremePapers.com
Mark scheme, page 2
Page 2 Mark Scheme Syllabus Paper IGCSE – October/November 2007 0680 02 © UCLES 2007 1 (a) (i) 1000 million [1] (ii) The only continent with a decrease [1] (iii) Africa [1] (b) (i) Frame drawn and bars used = 1 mark Accurate plots for China = 1 mark Accurate plots for India = 1 mark [3] (ii) India overtakes China as the largest country [1] (iii) Possible reasons for low population growth • Government implements population policy e.g. ‘1-child’ in China • Increased use of family planning / provision of clinics in rural areas • Social changes e.g. improvements in education of women • Economic development changes attitudes towards children • References to migration or increased death rates (e.g. from AIDs) could also be relevant (since it is population growth, not just birth rate) Possible reasons for higher population growth in other countries are largely the opposites of those given above. The emphasis should be on reasons why high birth rates persist, for which poverty and culture, (including the role of women in society and religion), are very significant factors. Credit references to both higher and lower for the same reason, provided that they are stated in a two sided manner. Reward depth especially if provided by use of a relevant example. Mark according to overall worth of the answer; • Answer worth 1 or 2 marks It may be over-dependent upon use of one reason, unsupported by detail or reference to an example. Or a number of reasons are given, but almost list-like without elaboration or comment towards the question theme. • Answer worth 3 or 4 marks Reasons for low population growth given with some development; an example might be used in better answers. More likely to refer to low population growth than to lower population growth (i.e. the relative element isn't included). • Answer worth 5 or 6 marks Effectively conveys reasons why population growth is lower in some/higher in others; use or reference to examples will help for full marks. [6] (c) In sub-Saharan Africa income per head has gone down and % living on less than a dollar a day has increased, whereas in Asia (both South and East) both measures have improved, income in sub-Saharan Africa has fallen by about 300 dollars, from being the richest among the three before 1980 it is now the poorest, numbers on less than a dollar a day have gone up 1-2% in sub-Saharan Africa, whereas they have halved/fallen from 30% to 15% in East Asia, so that sub-Saharan Africa moves backwards while Asia makes economic progress. General points (such as 1, 2 and 7 above) = maximum 3 marks Use of values from both graphs (relevant to question theme) = maximum 4 marks [5]
Mark scheme, page 3
Page 3 Mark Scheme Syllabus Paper IGCSE – October/November 2007 0680 02 © UCLES 2007 (d) (i) 25% sector/90° angle shown in pie graph for hunger, attempt to show tiny percentage (not more than 5°) in health workers pie graph, key completed with shading used to identify sub-Saharan Africa as the minimum. 3 @ 1mark [3] (ii) % of health workers is tiny compared with number of people, inadequate/non-existent health services means that diseases will spread, hungry people have less resistance to disease than those well-fed, young and old are ones who are most vulnerable. Points made along these lines 3 @ 1 mark [3] (e) cycle keeps repeating itself/once it starts it becomes self-perpetuating, often help/investment from outside source (e.g. government, charity) is needed, examples of outside help that cannot be afforded by poor people (e.g. well, clinic). Poverty trap idea shown to be well understood = 2 marks Some understanding/only one basic point made = 1 mark [2] (f) (i) Food aid is the least good choice; it could be justified only as a short term measure to feed people, build up strength and improve resistance to disease. Max 1 mark Development aid is probably the best choice for this question because it addresses ‘no access to clean drinking water. Examples of water related diseases that reduce capacity to work could be given or comment could be made about why well water is usually safe – up to 3 marks Farm aid is the middle choice, likely to lead to 1 or 2 mark answers. The best explanation would be in terms of increasing food supply and improving resistance to disease; increased income would generate income for improvements e.g. wells. Minimum 2 marks, maximum 3 marks for this part (ii) Food aid is the obvious answer here because it solves an immediate problem, but does not address the underlying problems of unsafe water, much disease and low food output – up to 3 marks, including 1 mark for choices made if it follows from development aid above. Farm aid is again a middle choice. Minimum 2 marks, maximum 3 marks for this part [4]
Mark scheme, page 4
Page 4 Mark Scheme Syllabus Paper IGCSE – October/November 2007 0680 02 © UCLES 2007 (g) (i) • Only a few trees, haphazardly distributed (– so unlikely to give shelter against the wind) • Some steep slopes, many variations in relief (– more likely that soil will move down slope after rain) • Bare ground can be seen in places e.g. middle and bottom left (– no protection for ground against wind and rain) • General absence of vegetation cover, even in the fields All marks can be obtained by describing physical features as asked by the question; in the best answers there will be some attempt to locate or give an idea of extent. Reward elaboration which places the observation in context for soil erosion similar to the comments in brackets above; however, it must start with description to be credited. Any mixture of 1 mark (description) and 2 mark (description + context) answers up to 4 marks. [4] (ii) Terraces = 1 mark 2nd mark for describing location or extent, or for elaboration such as the creation of level land on sloping terrain [2] (iii) Other relevant soil conservation strategies named in syllabus are tree planting, contour ploughing, dry land farming and windbreaks. Also, if the terraces were not recognised in part (ii) above, they could be used here. Name of strategy plus description = 2 marks. Most likely 2 + 2 marks for two strategies. Allow 3 + 1 marks if one strategy is well described in relation to area shown on photo [4] [Total: 40] 2 (a) (i) sedimentary clearly selected [1] (ii) decomposition of plants and dead creatures [1] (iii) Anticline/upfold in rocks, sandstone is a permeable/porous rock, trapped between impermeable clay layers, oil present towards the top of the rock layer above denser water. Three points made along these lines. [3] (iv) Drill down vertically from surface above, oil derrick erected on the surface, pipes are drilled into the ground until oil is reached, oil forced out by pressure/forcing down liquids. Three points made along these lines. [3] (v) explosions/blow-outs/wells catching fire [1]
Mark scheme, page 5
Page 5 Mark Scheme Syllabus Paper IGCSE – October/November 2007 0680 02 © UCLES 2007 (b) (i) minus 12.4 / 12 (ii) plus 19.2 / 20 Third mark for making clear the negative/positive [3] (iii) Demand exceeds supply in the three developed regions, sometimes by a considerable amount / values used, although supply exceeds demand in all three developing regions, amount of supply and size of the difference are greatest in the Middle East, Middle East has amount to supply developed regions without oil like Japan. Points made should be directed towards the Middle East theme in the question. Three points along these lines [3] (iv) The answer can be based around one tanker or pipeline disaster, or it can be general with passing mention of an example (either local or internationally well-known such as the Exxon Valdez in Alaska) Initial damage from marine pollution – birds and fish die as a result of ingesting oil, being coated in it, marine and plant life is damaged, beaches are covered thereby ruining both marine and coastal ecosystems. Land pollution from pipelines – additionally oil can seep into the ground and find its way into rivers used for water supply. Max. 2 marks without any references to areas or an example Max. 3 with just a passing reference to an example 4 mark answers should contain precise information for the chosen example [4] (v) Relevant factors are • size of the spill • how close it is to populated areas/clean-up services • wealth of country/effectiveness of clean-up operations • speed with which clean-up operations begin • natural conditions/type of environment e.g. slower repair to damage in cold environments, stormy seas can break up spills more quickly, whether wind direction/ currents take the spill towards or away from land Points made along these lines for at least two factors. For 4 marks some reference needs to be included to the comparative element i.e. it is best if factors are stated in a two-sided manner [4]
Mark scheme, page 6
Page 6 Mark Scheme Syllabus Paper IGCSE – October/November 2007 0680 02 © UCLES 2007 (c) (i) Tundra climate – very cold winters, cold summers, little precipitation, most falls as snow, figures used to illustrate these e.g. –40°C in winter, never more than 10°C in summer, under 250 mm total precipitation. Min. 1 mark Max. 2 marks for any of the points made above Tundra vegetation – absence of trees, surface cover dominated by mosses/lichens/ grasses, summer bloom mats of flowers, all plants short/close to ground, examples of named plants e.g. dwarf willow, cotton grass Min. 1 mark Max. 2 marks for any of points made above [3] (ii) Fewer than 300 people, tiny in relation to size of area/use of scale/covers hundreds of sq. km., Inuits mainly live by hunting, fishing and whaling, activities which use natural resources/no industry or cultivation, only one settlement shown – Katovik on the coast, area lies north of the Arctic Circle so will have a cold climate, types of animals such as polar bears, arctic foxes etc. confirm coldness, National Wildlife Refuge created to control / keep out human settlement. Four points made along these lines = 4 @ 1 mark. Some points are capable of elaboration and development into two mark points, such as taking together points one and two in the scheme. [4] (d) (i) Economic arguments • Increases domestic reserves of oil meaning less dependence on imports • USA is an energy-hungry country which needs the oil • Provides work for Inuit people/local people in area where other work opportunities are scarce/not successful/difficult to create Minimum 3 marks Maximum 4 marks Environmental arguments • Modern methods of drilling are far less damaging to the environment • Will affect only a tiny part of Alaska so that plenty of untouched environments will remain/only 0.7 m hectares out of 7.7 – less than 10% of area Minimum 2 marks Maximum 3 marks [5]
Mark scheme, page 7
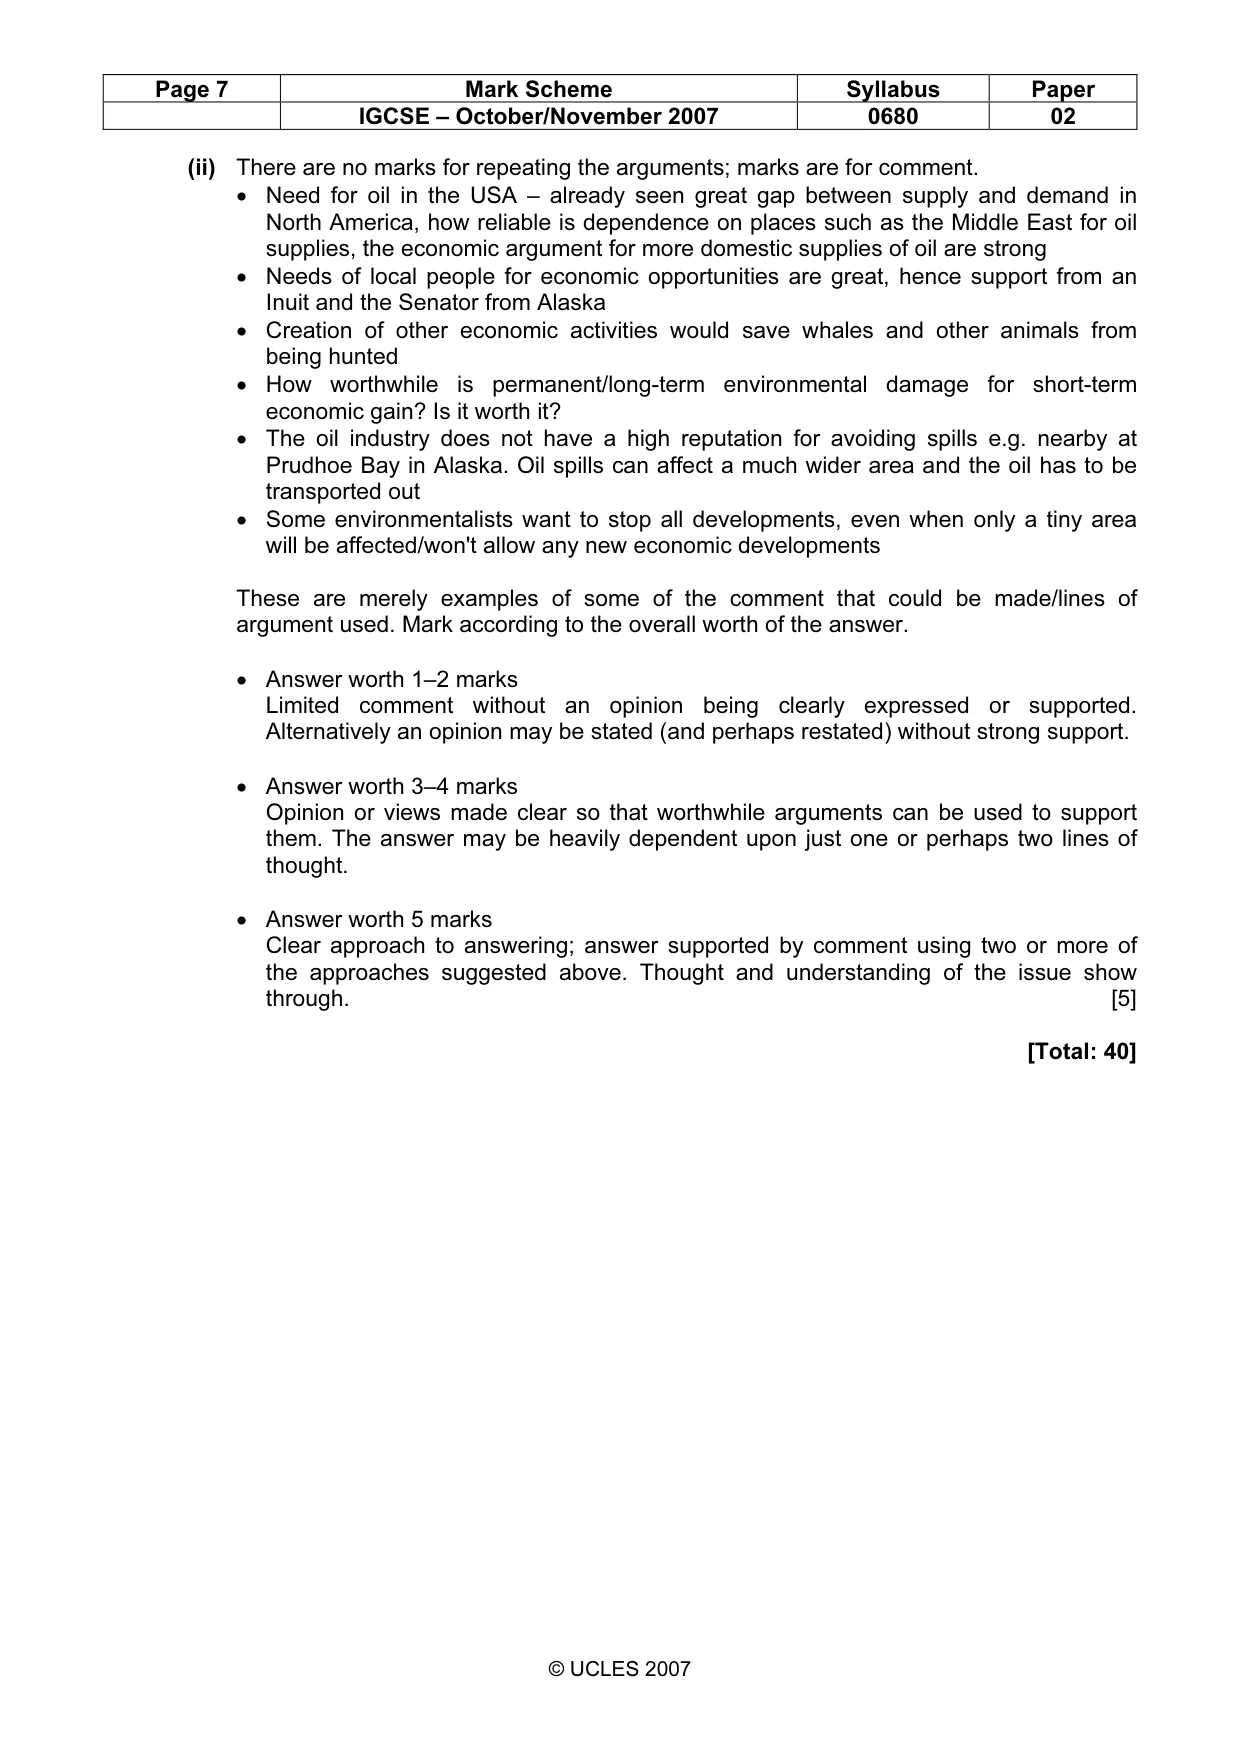
Page 7 Mark Scheme Syllabus Paper IGCSE – October/November 2007 0680 02 © UCLES 2007 (ii) There are no marks for repeating the arguments; marks are for comment. • Need for oil in the USA – already seen great gap between supply and demand in North America, how reliable is dependence on places such as the Middle East for oil supplies, the economic argument for more domestic supplies of oil are strong • Needs of local people for economic opportunities are great, hence support from an Inuit and the Senator from Alaska • Creation of other economic activities would save whales and other animals from being hunted • How worthwhile is permanent/long-term environmental damage for short-term economic gain? Is it worth it? • The oil industry does not have a high reputation for avoiding spills e.g. nearby at Prudhoe Bay in Alaska. Oil spills can affect a much wider area and the oil has to be transported out • Some environmentalists want to stop all developments, even when only a tiny area will be affected/won't allow any new economic developments These are merely examples of some of the comment that could be made/lines of argument used. Mark according to the overall worth of the answer. • Answer worth 1–2 marks Limited comment without an opinion being clearly expressed or supported. Alternatively an opinion may be stated (and perhaps restated) without strong support. • Answer worth 3–4 marks Opinion or views made clear so that worthwhile arguments can be used to support them. The answer may be heavily dependent upon just one or perhaps two lines of thought. • Answer worth 5 marks Clear approach to answering; answer supported by comment using two or more of the approaches suggested above. Thought and understanding of the issue show through. [5] [Total: 40]
What you needed in this session
Cambridge’s own grade thresholds for 2007 Oct/Nov, Paper 2 · Variant 1. A higher threshold means an easier paper — the bar moves with how the cohort did.