Cambridge IGCSE Environmental Management 0680 — 2006 Oct/Nov Paper 2 · Variant 1
0680/21/O/N/06 · 80 marks · ≈90 min
The question paper and its mark scheme, free to read here and free to download. This is Cambridge’s own paper, exactly as it was sat.
Question paper16 pages
Mark scheme6 pages
Answers below. Sit the paper first if you are practising.
Paper as text
Question paper, page 1
This document consists of 16 printed pages. SPA (KN) T17211/5 © UCLES 2006 [Turn over UNIVERSITY OF CAMBRIDGE INTERNATIONAL EXAMINATIONS International General Certificate of Secondary Education ENVIRONMENTAL MANAGEMENT Paper 2 0680/02 October/November 2006 1 hour 45 minutes Candidates answer on the Question Paper. Additional Materials: Ruler READ THESE INSTRUCTIONS FIRST Write your Centre number, candidate number and name on all the work you hand in. Write in dark blue or black pen. You may use a soft pencil for any diagrams, graphs or rough working. Do not use staples, paper clips, highlighters, glue or correction fluid. Answer both questions. At the end of the examination, fasten all your work securely together. The number of marks is given in brackets [ ] at the end of each question or part question. DO NOT WRITE IN THE BARCODE. DO NOT WRITE IN THE GREY AREAS BETWEEN THE PAGES. If you have been given a label, look at the details. If any details are incorrect or missing, please fill in your correct details in the space given at the top of this page. Stick your personal label here, if provided. For Examiner’s Use 1 2 Total www.XtremePapers.com
Question paper, page 2
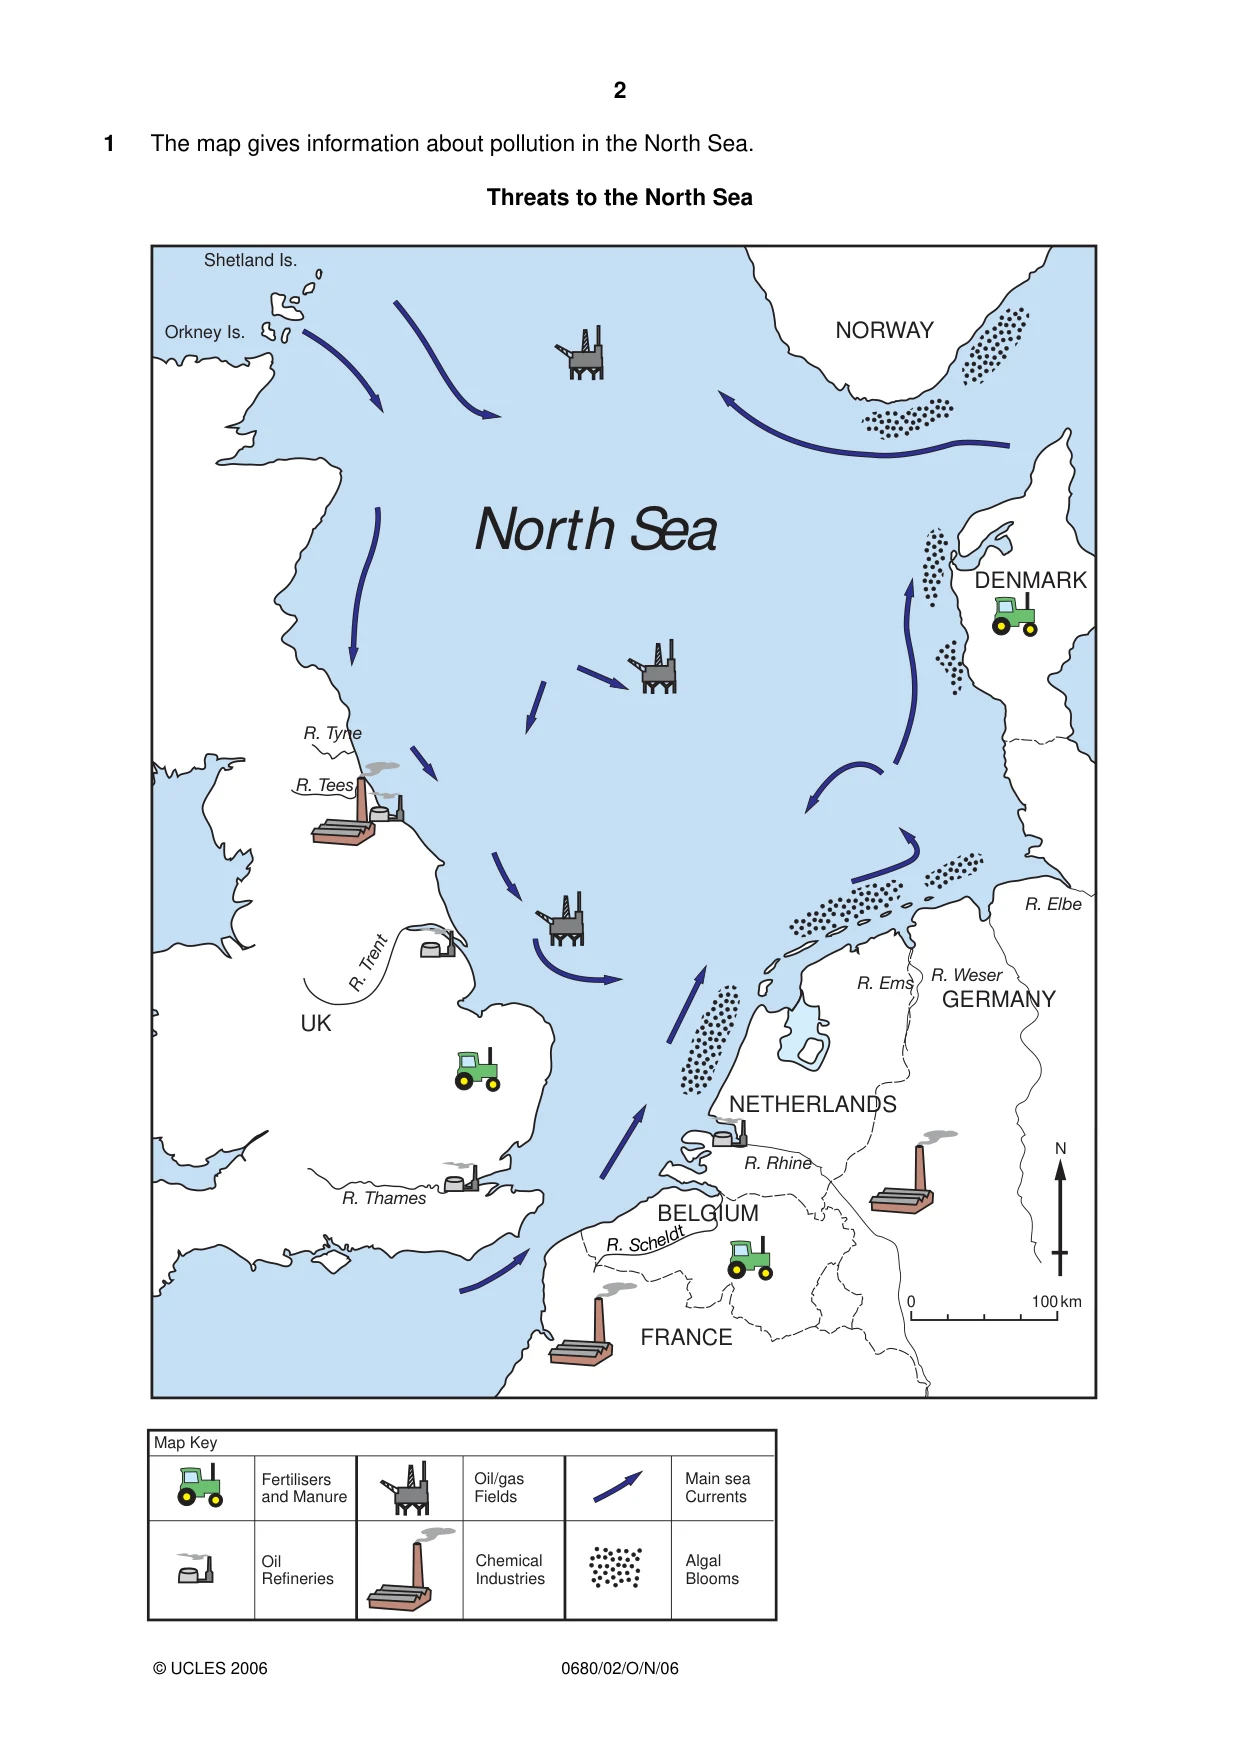
2 0680/02/O/N/06 1 The map gives information about pollution in the North Sea. Threats to the North Sea © UCLES 2006 GERMANY NETHERLANDS FRANCE BELGIUM DENMARK NORWAY Shetland Is. Orkney Is. 0 N 100 km Algal Blooms Map Key Chemical Industries Oil Refineries Oil/gas Fields Fertilisers and Manure Main sea Currents UK R. Weser North Sea R. Elbe R. Ems R. Tyne R. Trent R. Tees R. Thames R. Rhine R . S c h el dt
Question paper, page 3
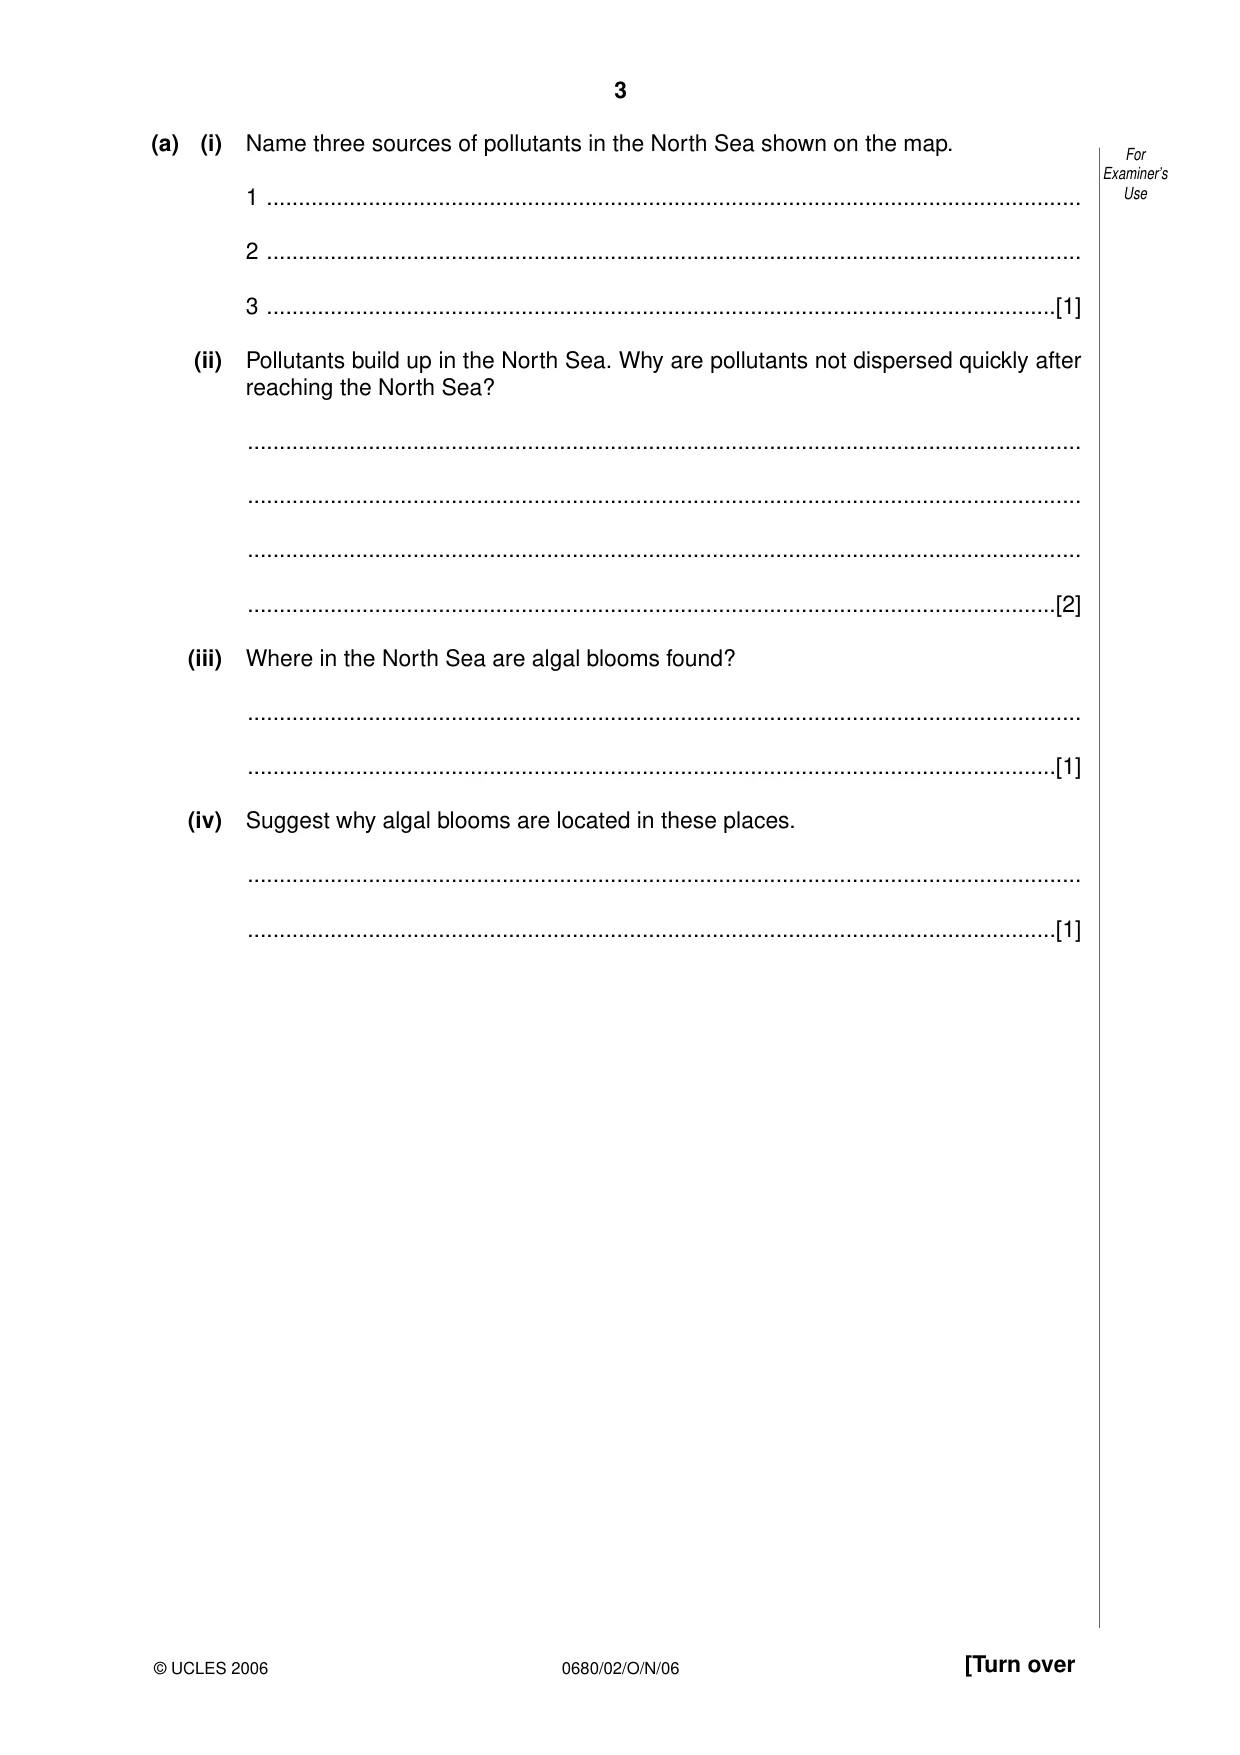
3 0680/02/O/N/06 [Turn over (a) (i) Name three sources of pollutants in the North Sea shown on the map. 1 … 2 … 3 …[1] (ii) Pollutants build up in the North Sea. Why are pollutants not dispersed quickly after reaching the North Sea? … … … …[2] (iii) Where in the North Sea are algal blooms found? … …[1] (iv) Suggest why algal blooms are located in these places. … …[1] For Examiner’s Use © UCLES 2006
Question paper, page 4
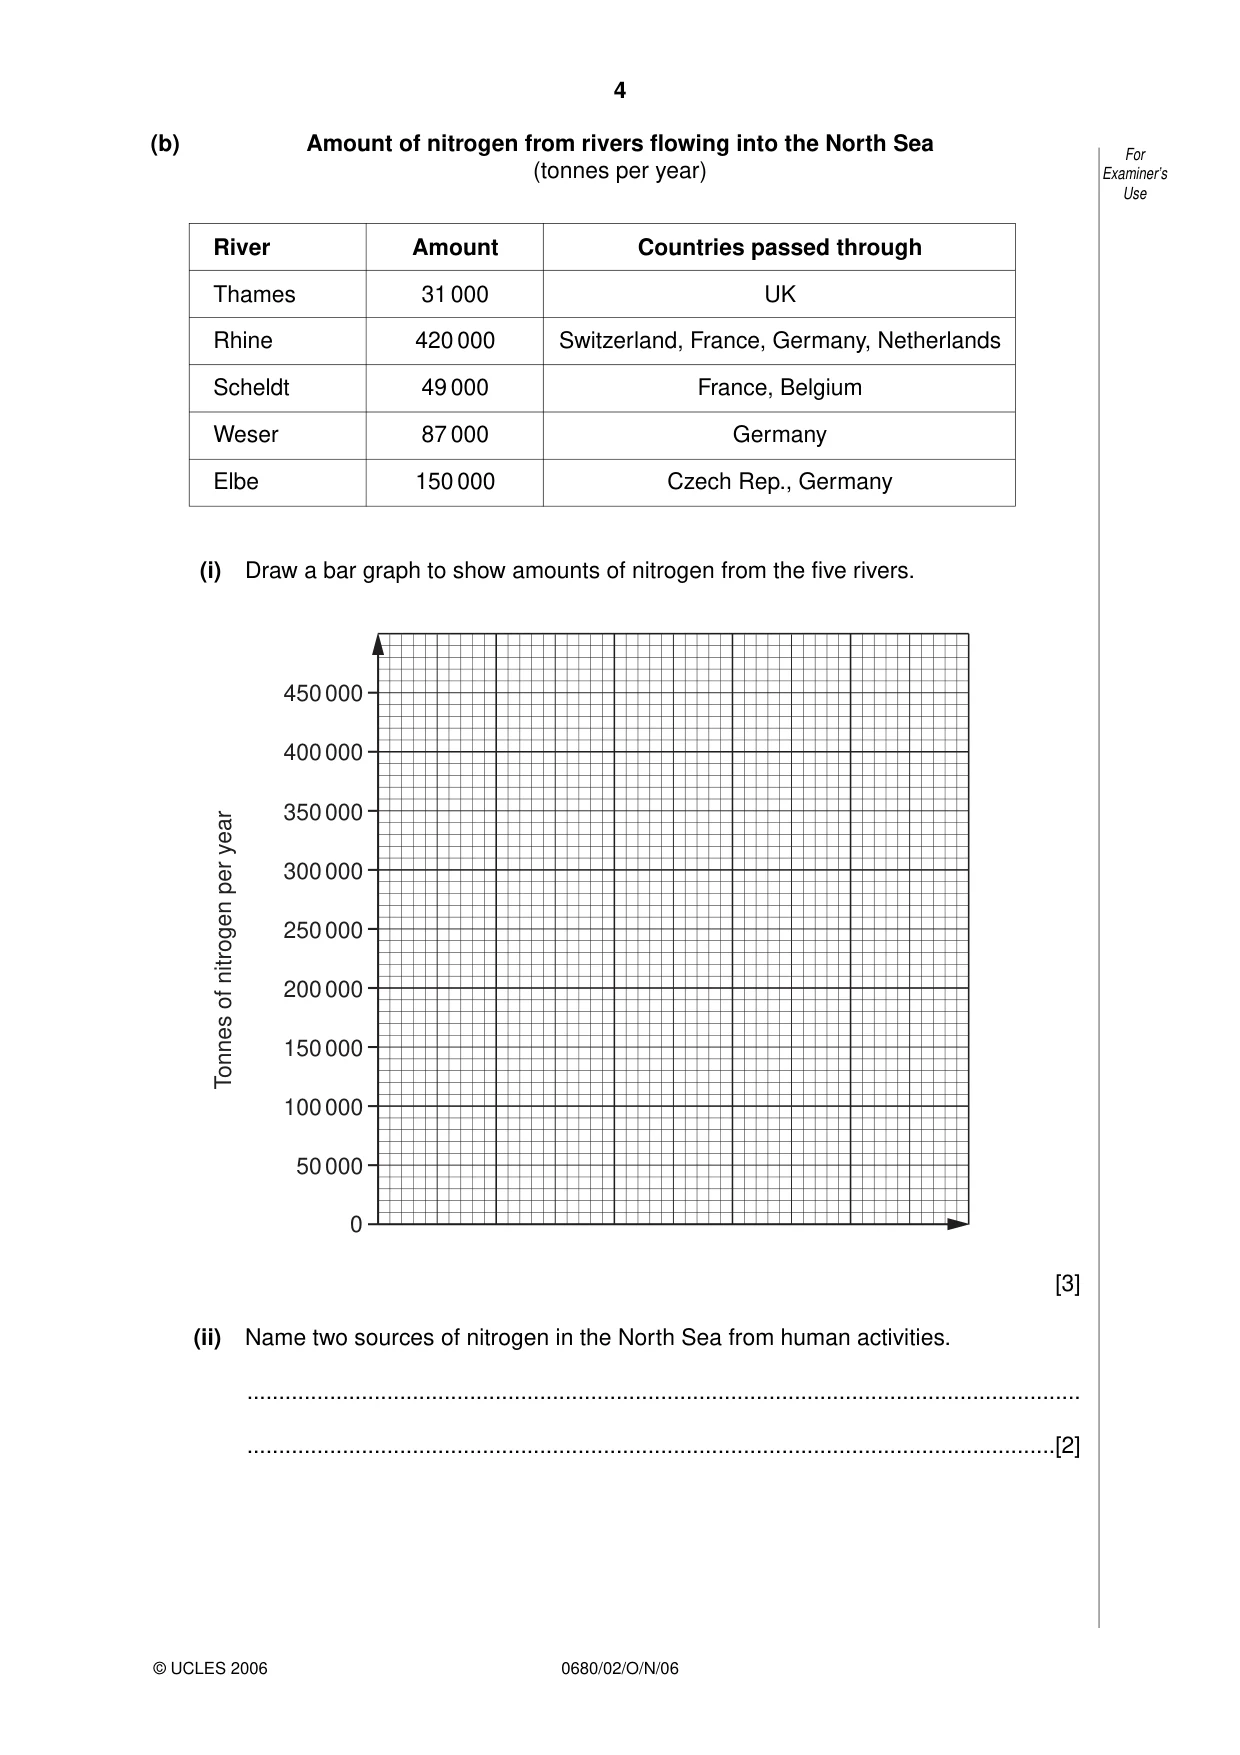
4 0680/02/O/N/06 (b) Amount of nitrogen from rivers flowing into the North Sea (tonnes per year) (i) Draw a bar graph to show amounts of nitrogen from the five rivers. [3] (ii) Name two sources of nitrogen in the North Sea from human activities. … …[2] 0 50 000 100 000 150 000 200 000 250 000 300 000 350 000 400 000 450 000 Tonnes of nitrogen per year For Examiner’s Use © UCLES 2006 River Amount Countries passed through Thames 31 000 UK Rhine 420 000 Switzerland, France, Germany, Netherlands Scheldt 49 000 France, Belgium Weser 87 000 Germany Elbe 150 000 Czech Rep., Germany
Question paper, page 5
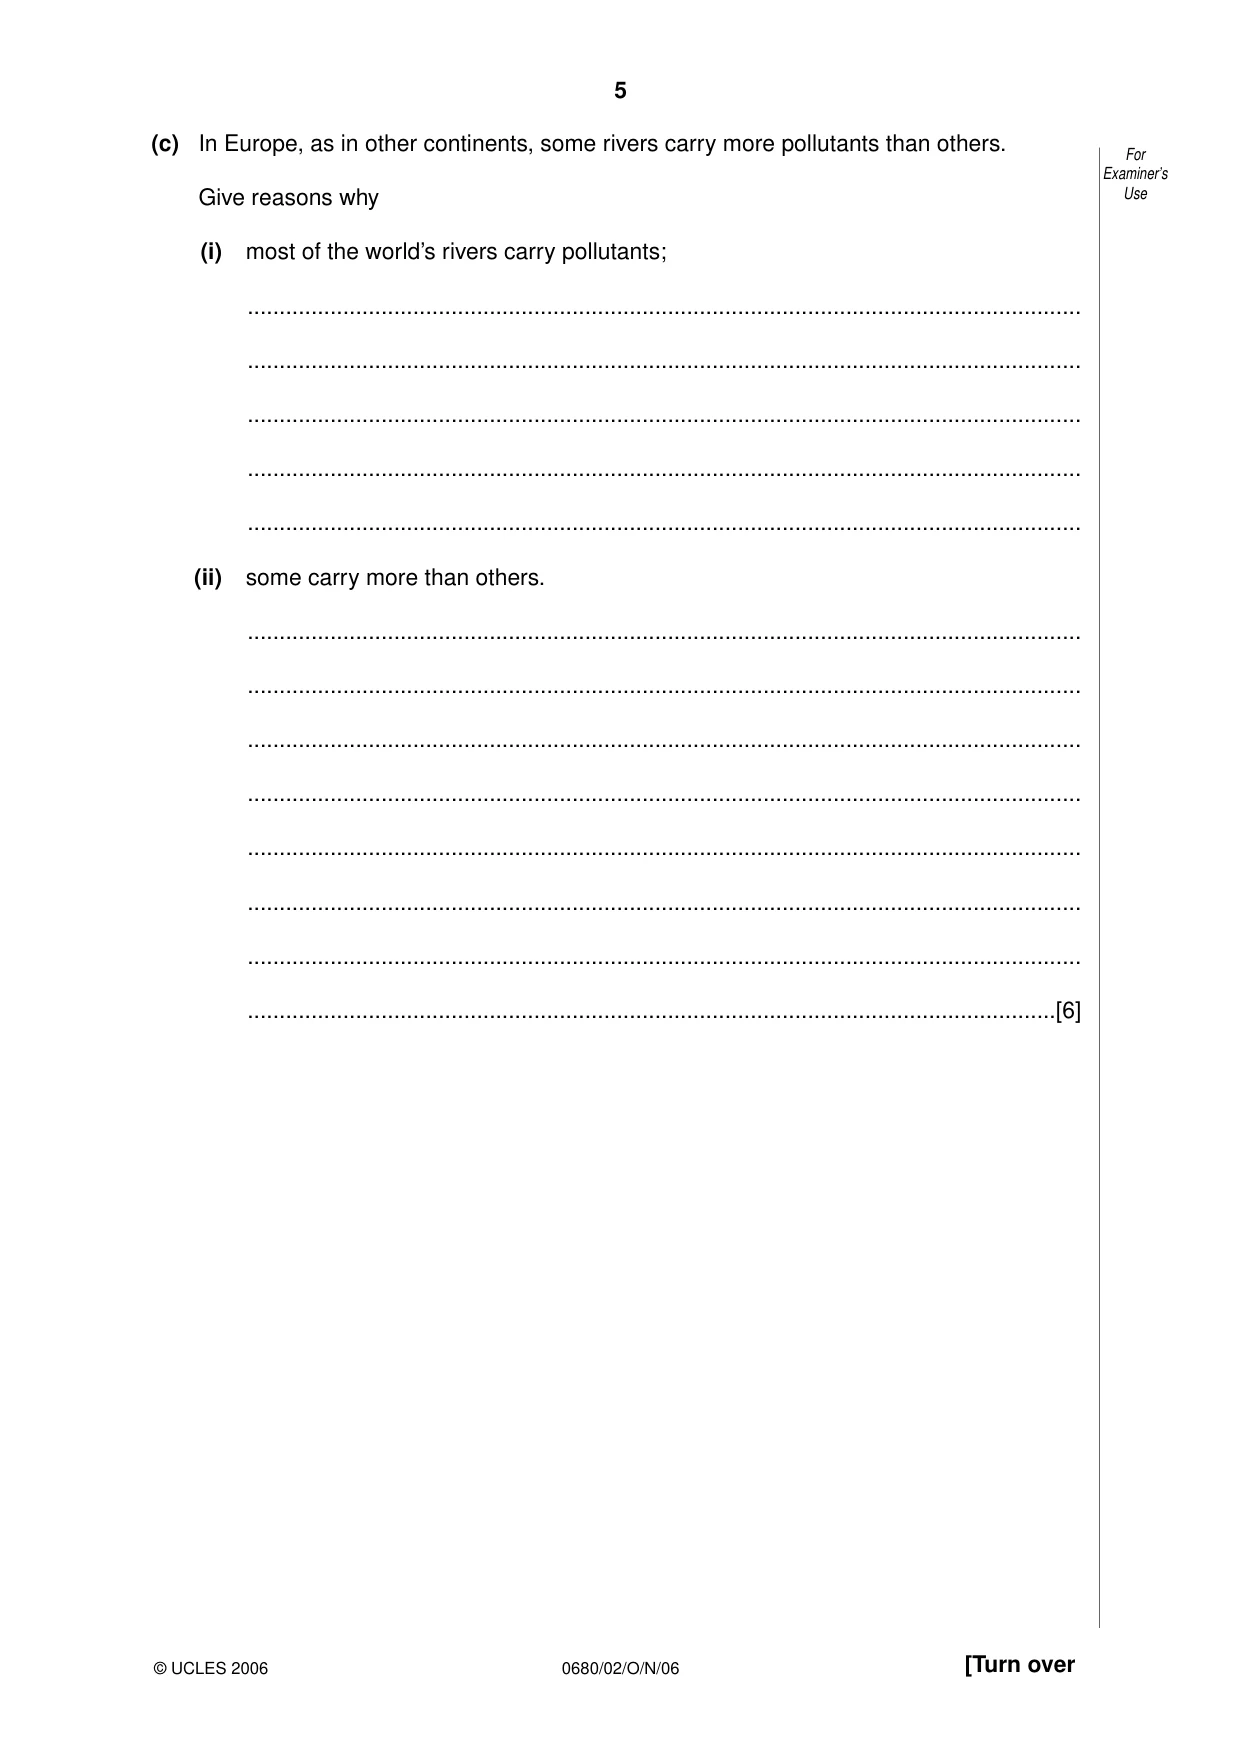
5 0680/02/O/N/06 [Turn over (c) In Europe, as in other continents, some rivers carry more pollutants than others. Give reasons why (i) most of the world’s rivers carry pollutants; … … … … … (ii) some carry more than others. … … … … … … … …[6] For Examiner’s Use © UCLES 2006
Question paper, page 6
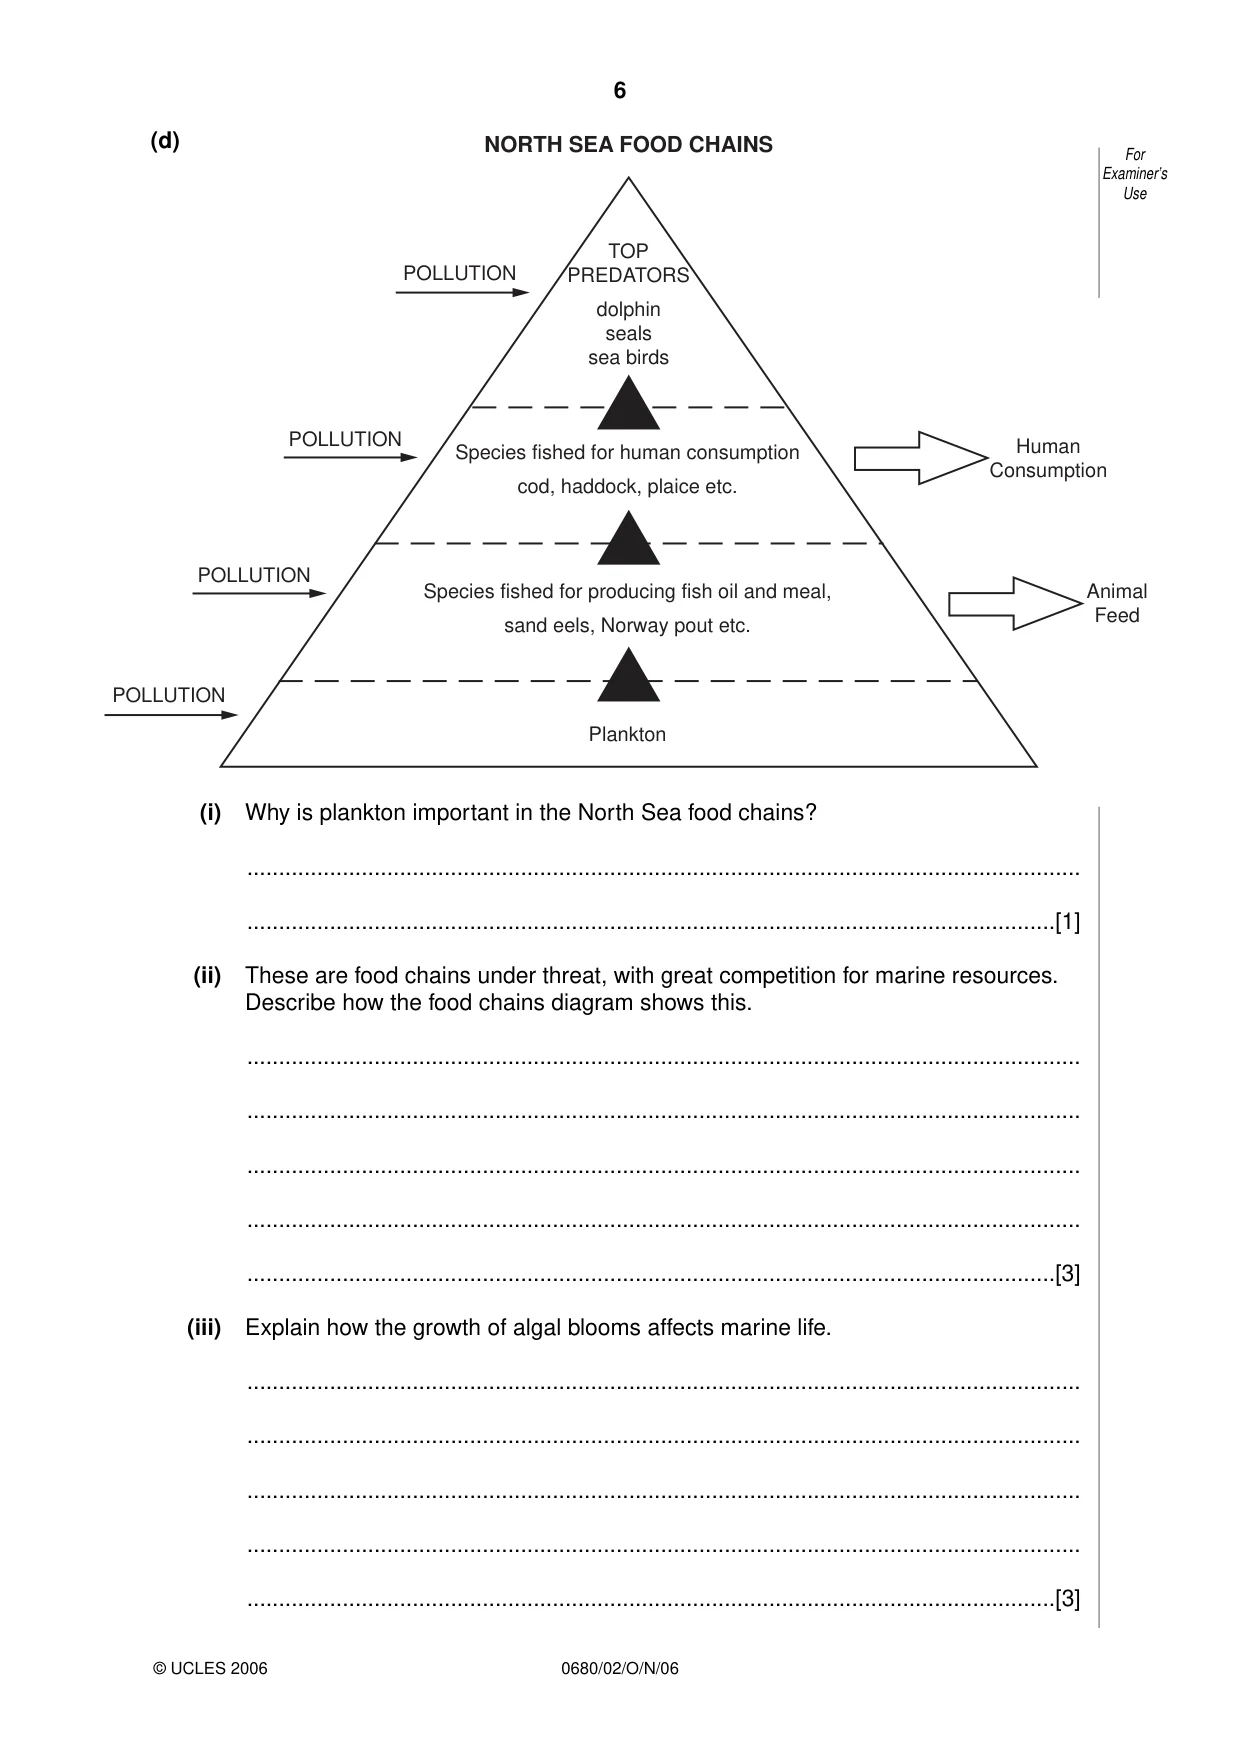
6 0680/02/O/N/06 (d) (i) Why is plankton important in the North Sea food chains? … …[1] (ii) These are food chains under threat, with great competition for marine resources. Describe how the food chains diagram shows this. … … … … …[3] (iii) Explain how the growth of algal blooms affects marine life. … … … … …[3] For Examiner’s Use © UCLES 2006 TOP PREDATORS dolphin seals sea birds Species fished for human consumption cod, haddock, plaice etc. Species fished for producing fish oil and meal, sand eels, Norway pout etc. Plankton Human Consumption Animal Feed NORTH SEA FOOD CHAINS POLLUTION POLLUTION POLLUTION POLLUTION
Question paper, page 7
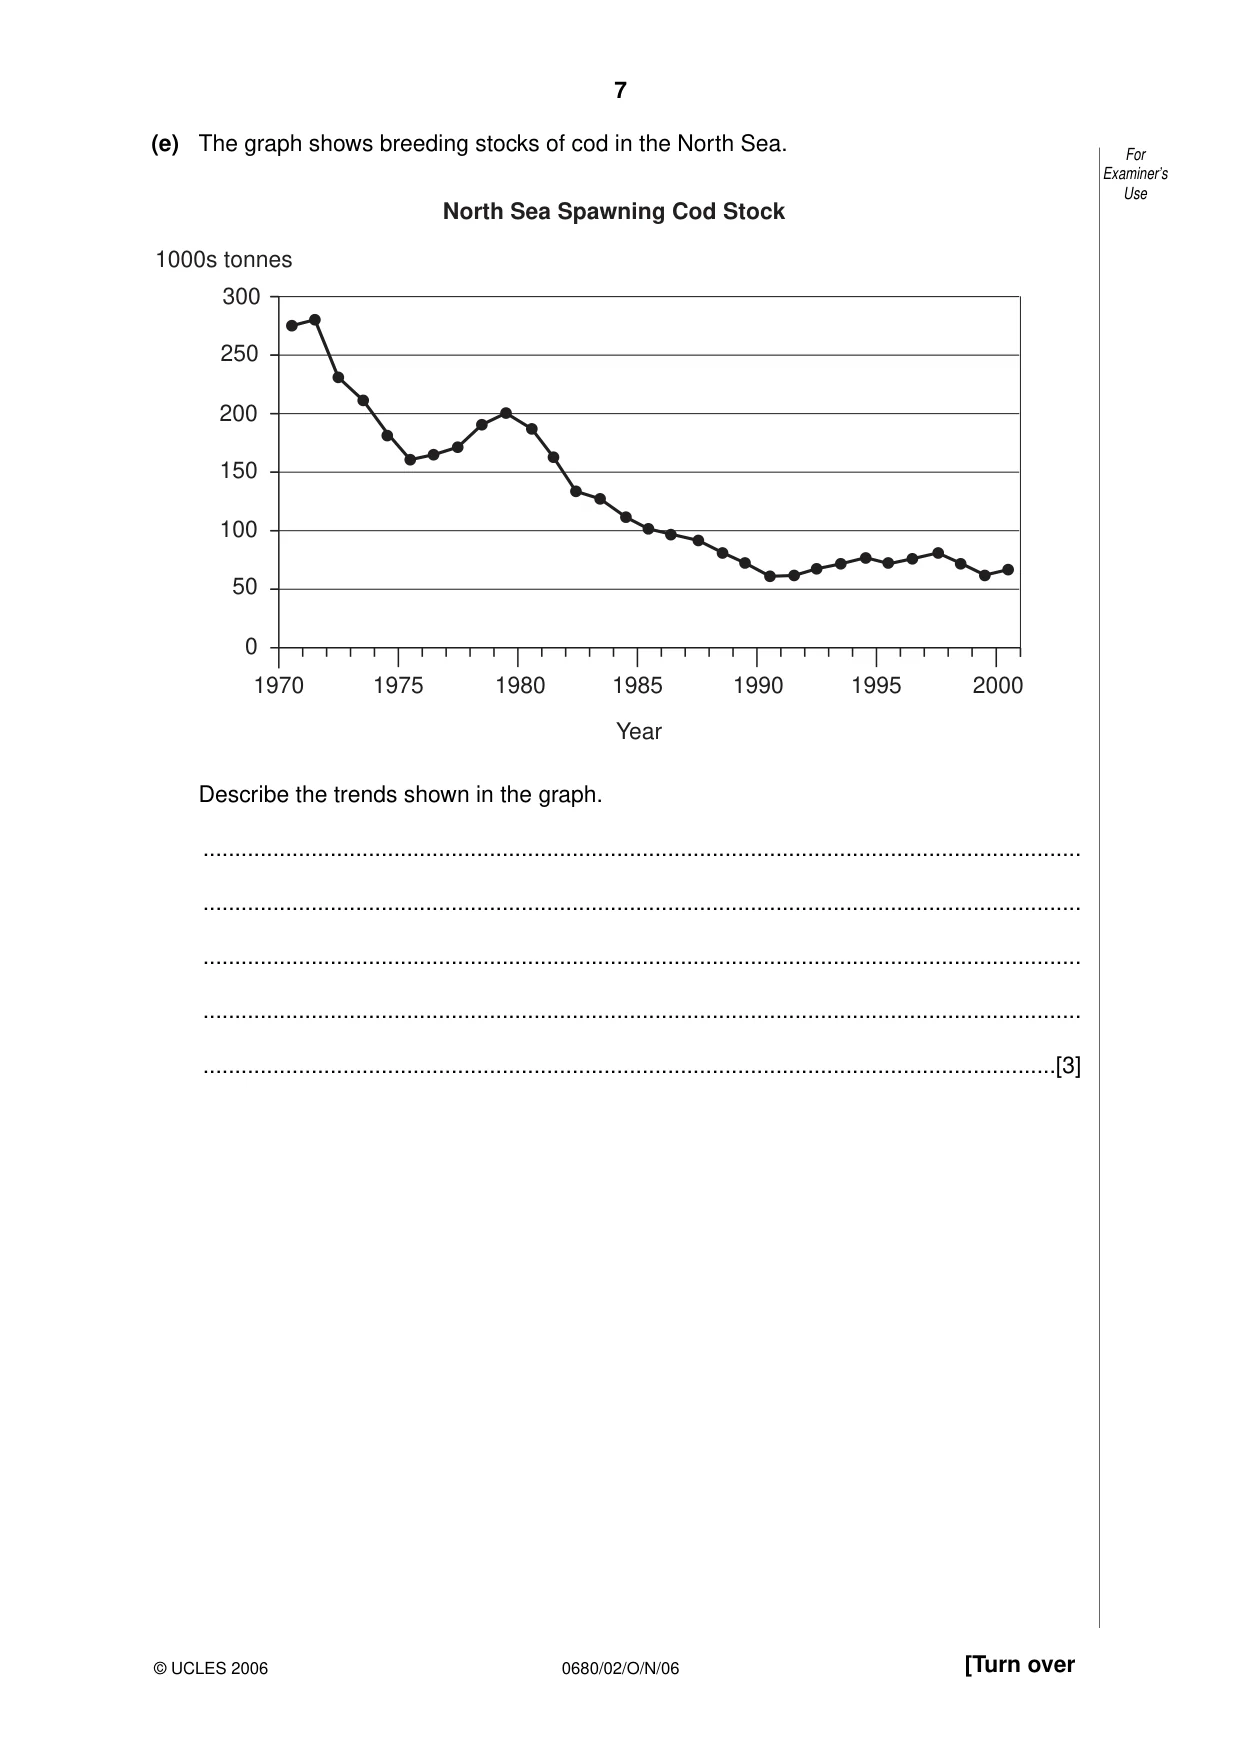
7 0680/02/O/N/06 [Turn over (e) The graph shows breeding stocks of cod in the North Sea. Describe the trends shown in the graph. … … … … …[3] 1970 1975 1980 1985 1990 1995 2000 Year 300 250 200 150 100 50 0 1000s tonnes North Sea Spawning Cod Stock For Examiner’s Use © UCLES 2006
Question paper, page 8
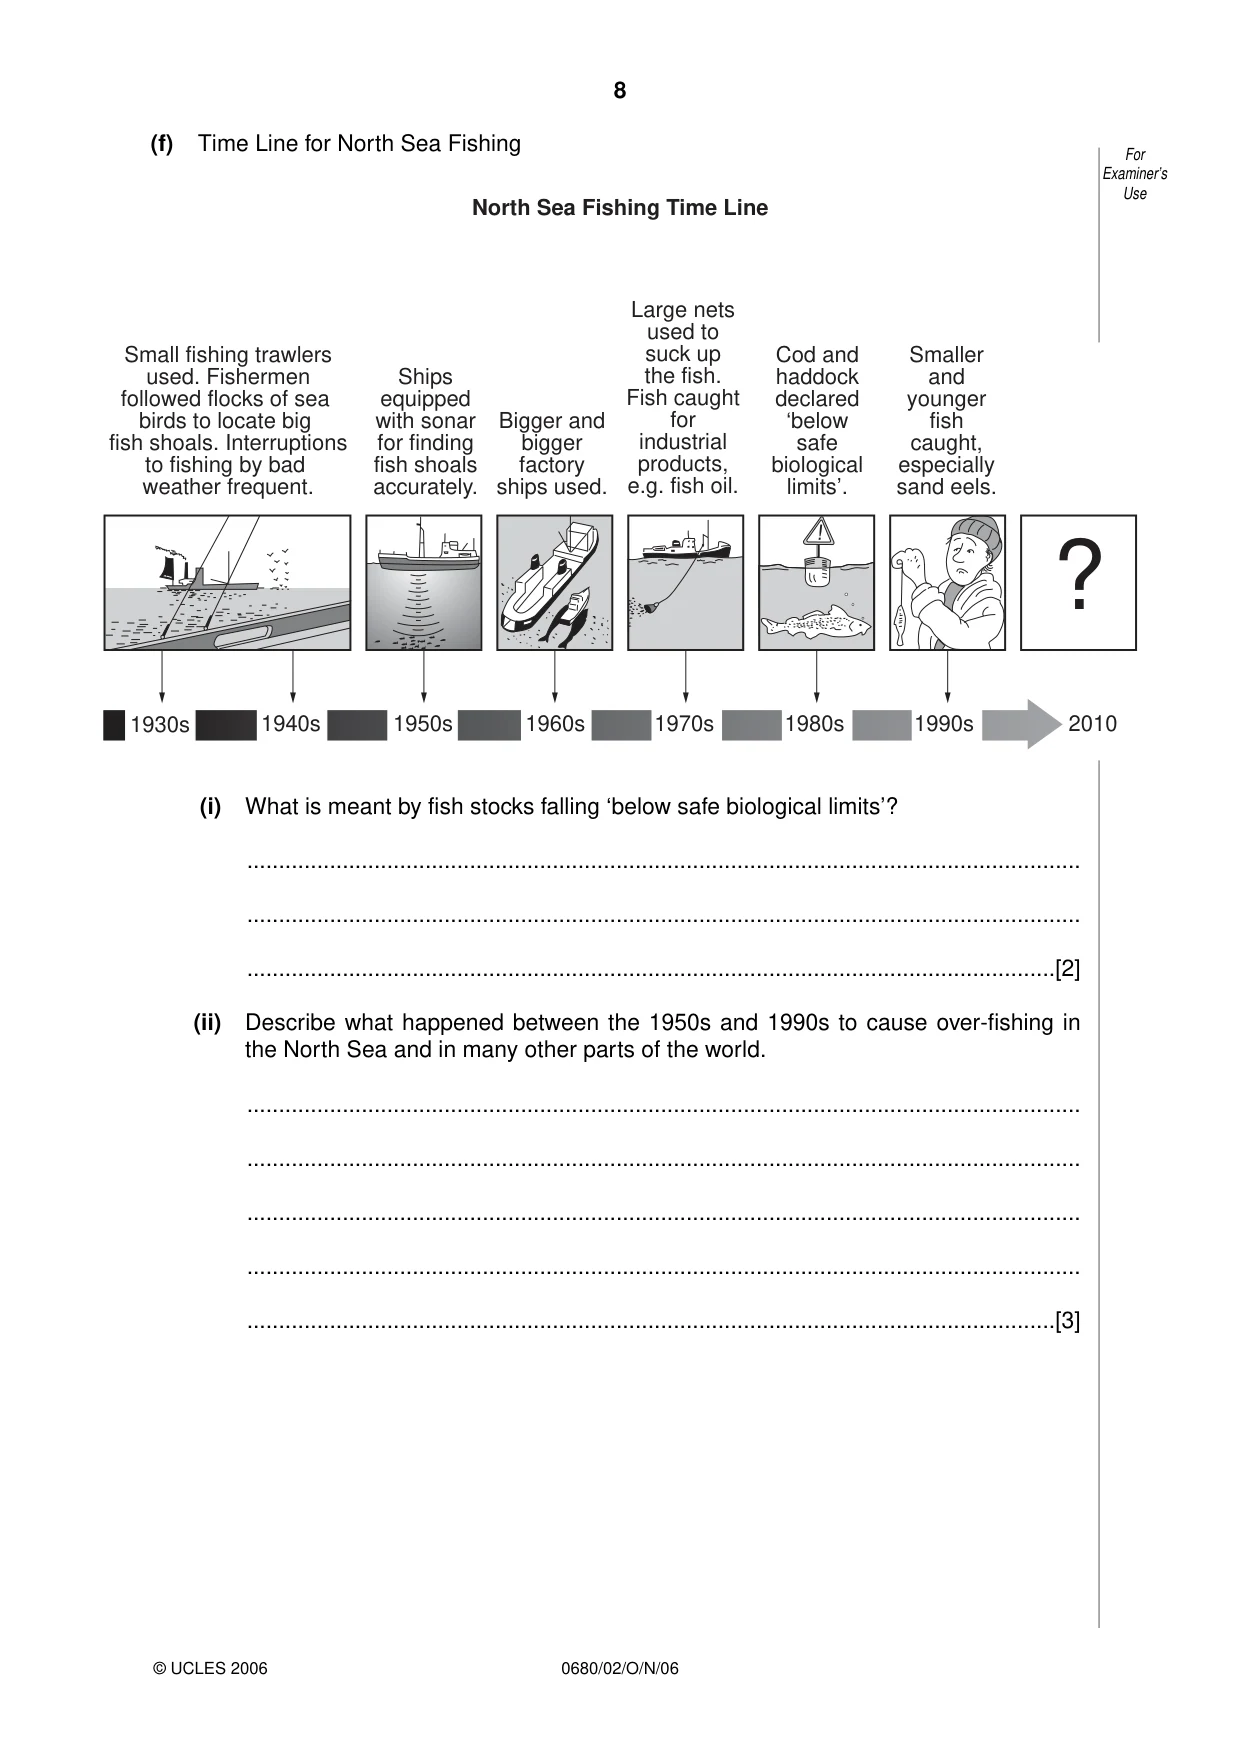
8 0680/02/O/N/06 (f) Time Line for North Sea Fishing (i) What is meant by fish stocks falling ‘below safe biological limits’? … … …[2] (ii) Describe what happened between the 1950s and 1990s to cause over-fishing in the North Sea and in many other parts of the world. … … … … …[3] For Examiner’s Use © UCLES 2006 ! ? 1930s 1940s 1950s 1960s 1970s 1980s 1990s 2010 Small fishing trawlers used. Fishermen followed flocks of sea birds to locate big fish shoals. Interruptions to fishing by bad weather frequent. Ships equipped with sonar for finding fish shoals accurately. Large nets used to suck up the fish. Fish caught for industrial products, e.g. fish oil. Cod and haddock declared ‘below safe biological limits’. Smaller and younger fish caught, especially sand eels. Bigger and bigger factory ships used. North Sea Fishing Time Line
Question paper, page 9
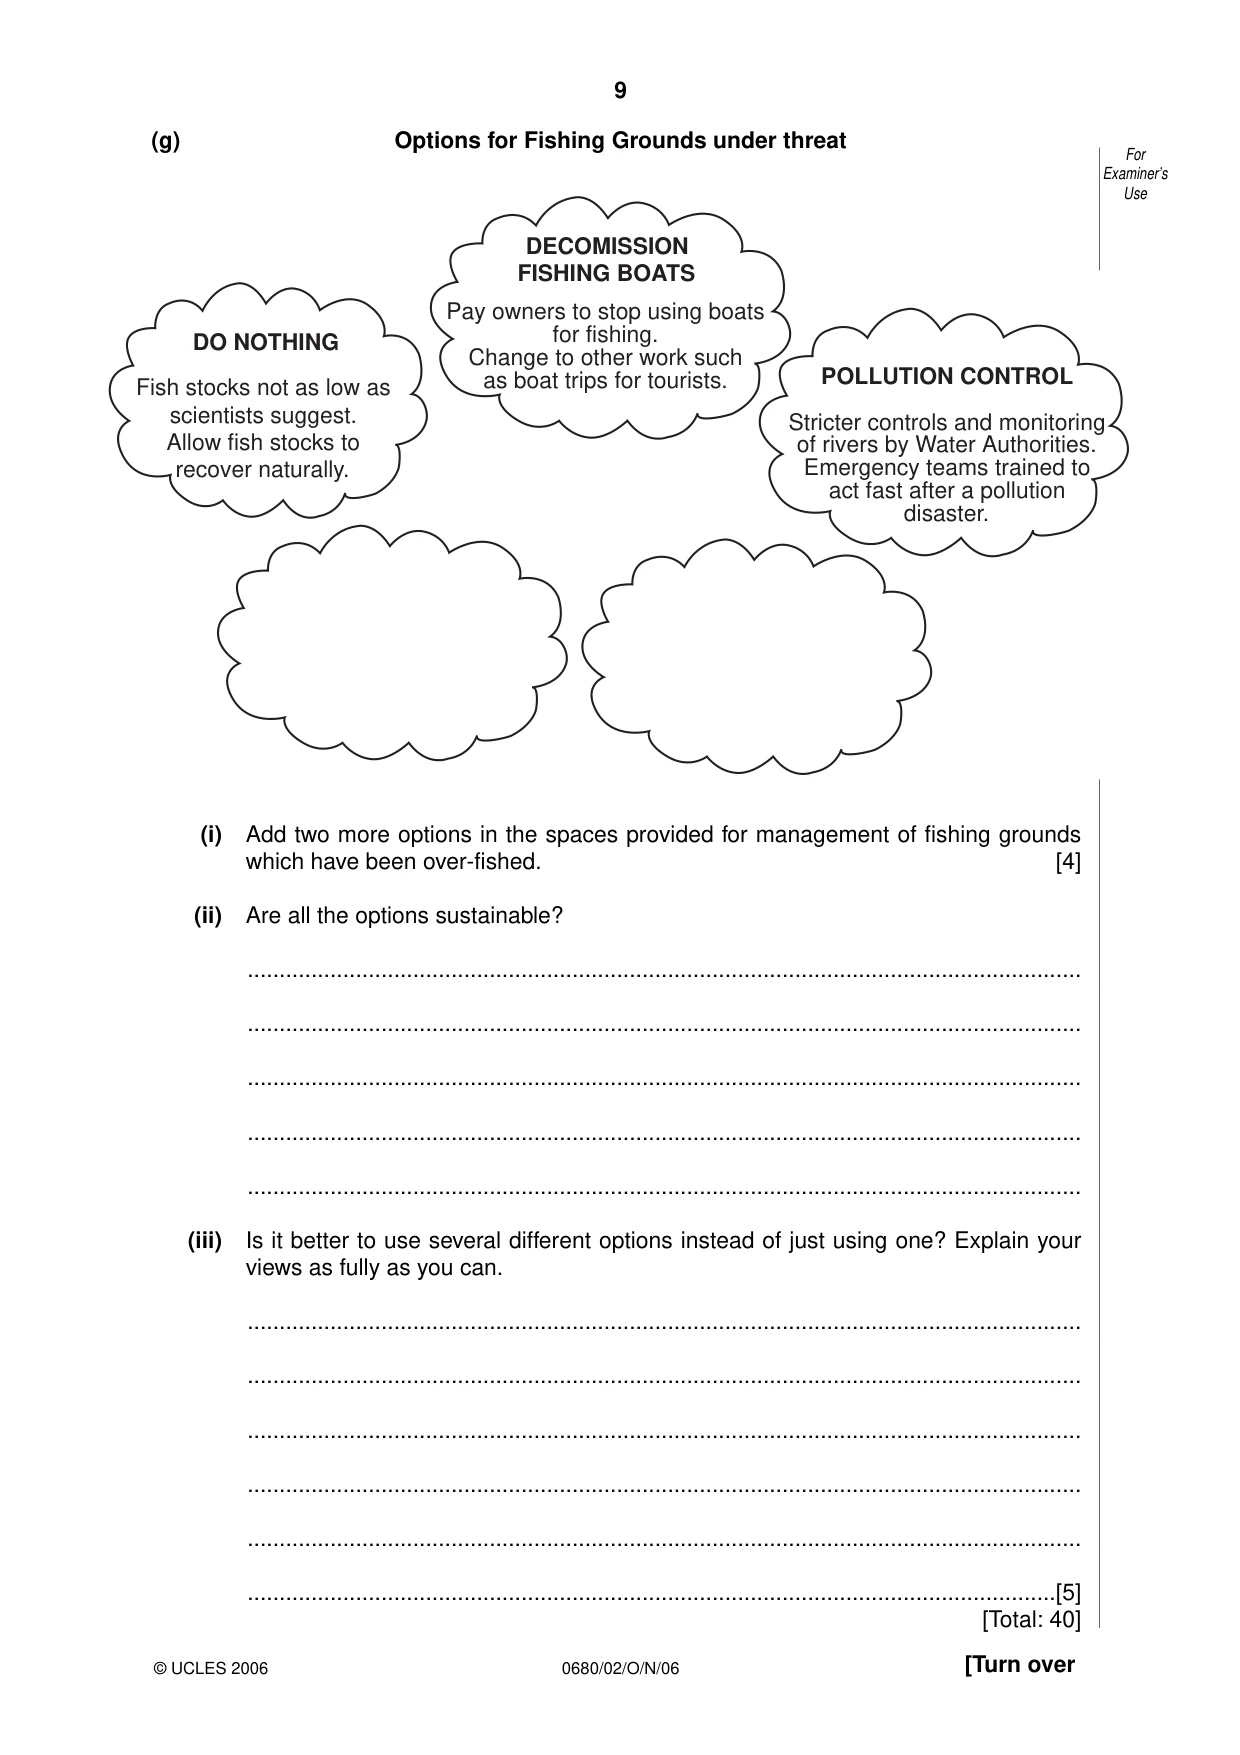
9 0680/02/O/N/06 [Turn over (g) Options for Fishing Grounds under threat (i) Add two more options in the spaces provided for management of fishing grounds which have been over-fished. [4] (ii) Are all the options sustainable? … … … … … (iii) Is it better to use several different options instead of just using one? Explain your views as fully as you can. … … … … … …[5] [Total: 40] For Examiner’s Use © UCLES 2006 Fish stocks not as low as scientists suggest. Allow fish stocks to recover naturally. Pay owners to stop using boats for fishing. Change to other work such as boat trips for tourists. POLLUTION CONTROL Stricter controls and monitoring of rivers by Water Authorities. Emergency teams trained to act fast after a pollution disaster. DO NOTHING DECOMISSION FISHING BOATS
Question paper, page 10
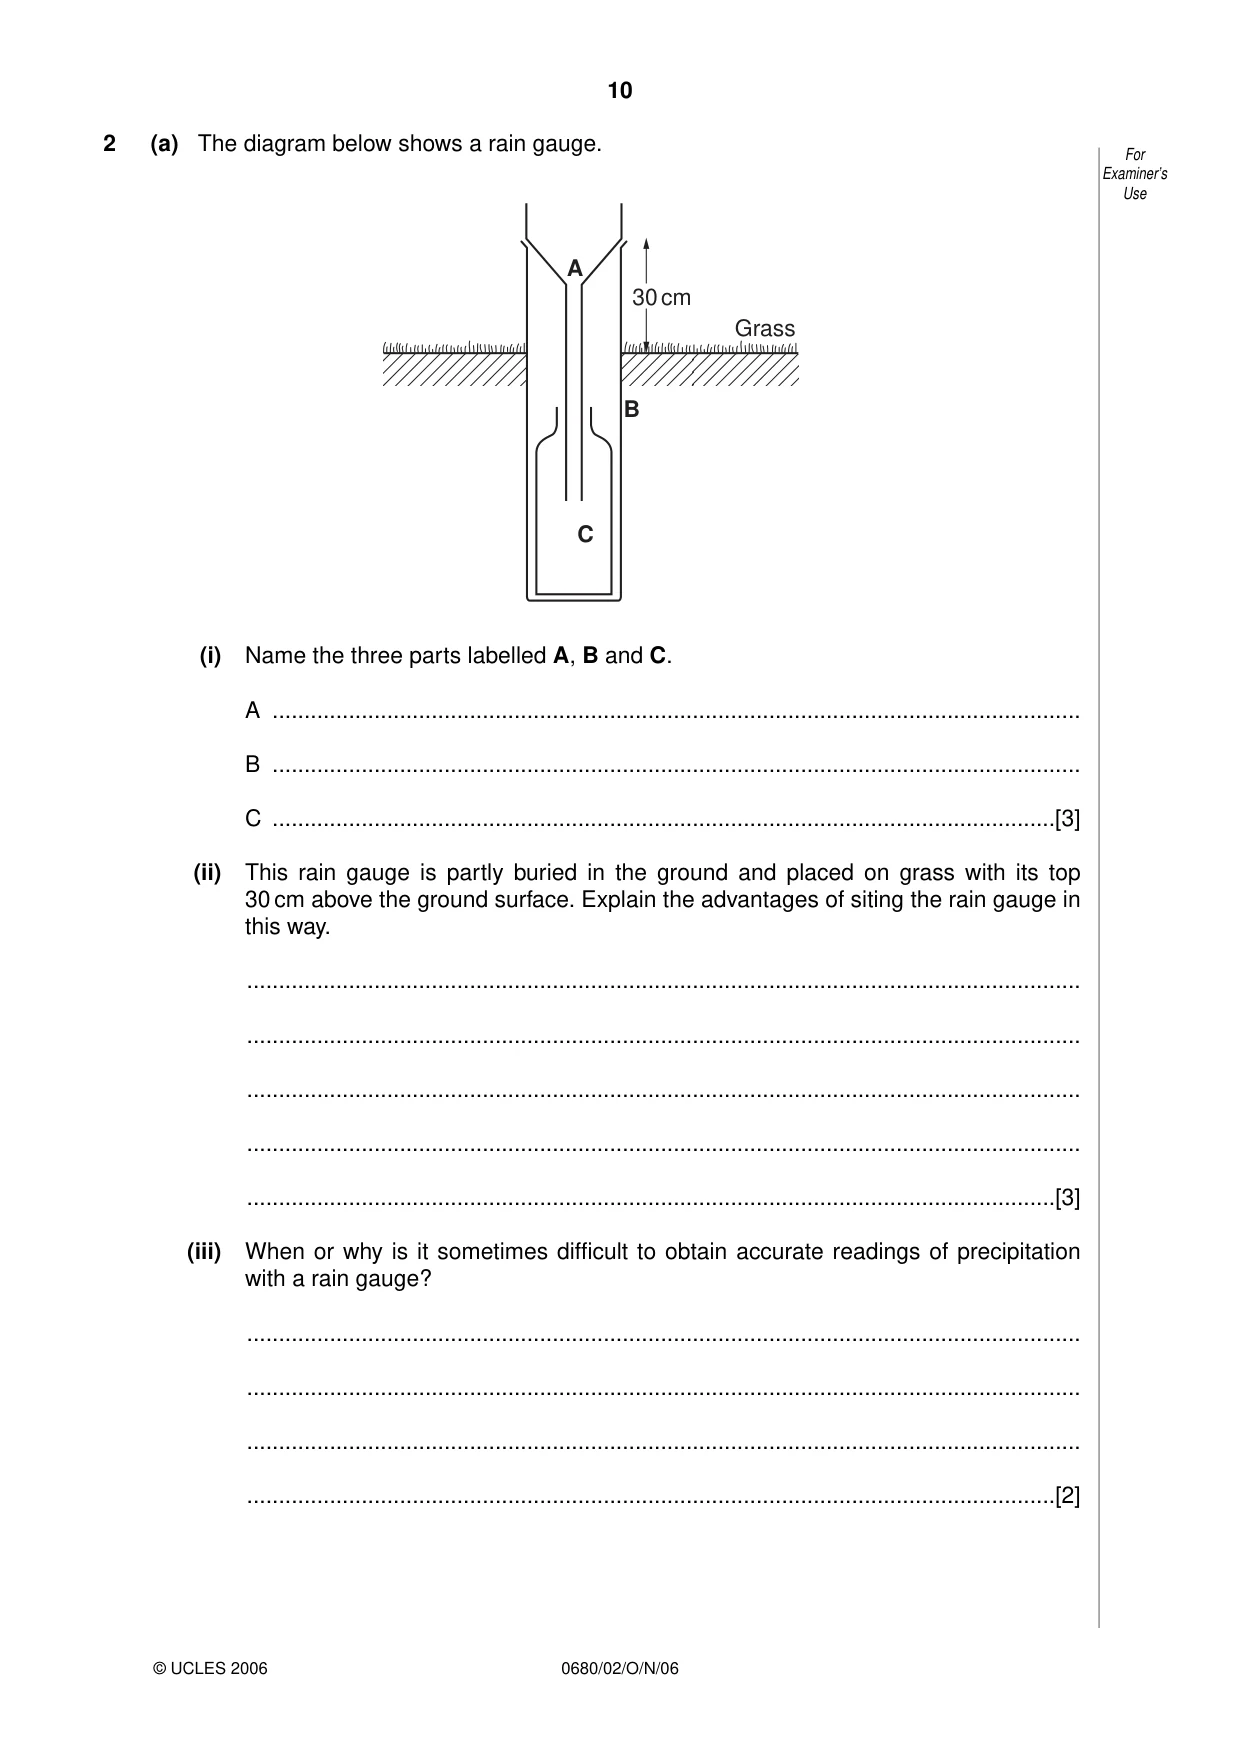
10 0680/02/O/N/06 2 (a) The diagram below shows a rain gauge. (i) Name the three parts labelled A, B and C. A … B … C …[3] (ii) This rain gauge is partly buried in the ground and placed on grass with its top 30 cm above the ground surface. Explain the advantages of siting the rain gauge in this way. … … … … …[3] (iii) When or why is it sometimes difficult to obtain accurate readings of precipitation with a rain gauge? … … … …[2] A B C Grass 30 cm For Examiner’s Use © UCLES 2006
Question paper, page 11
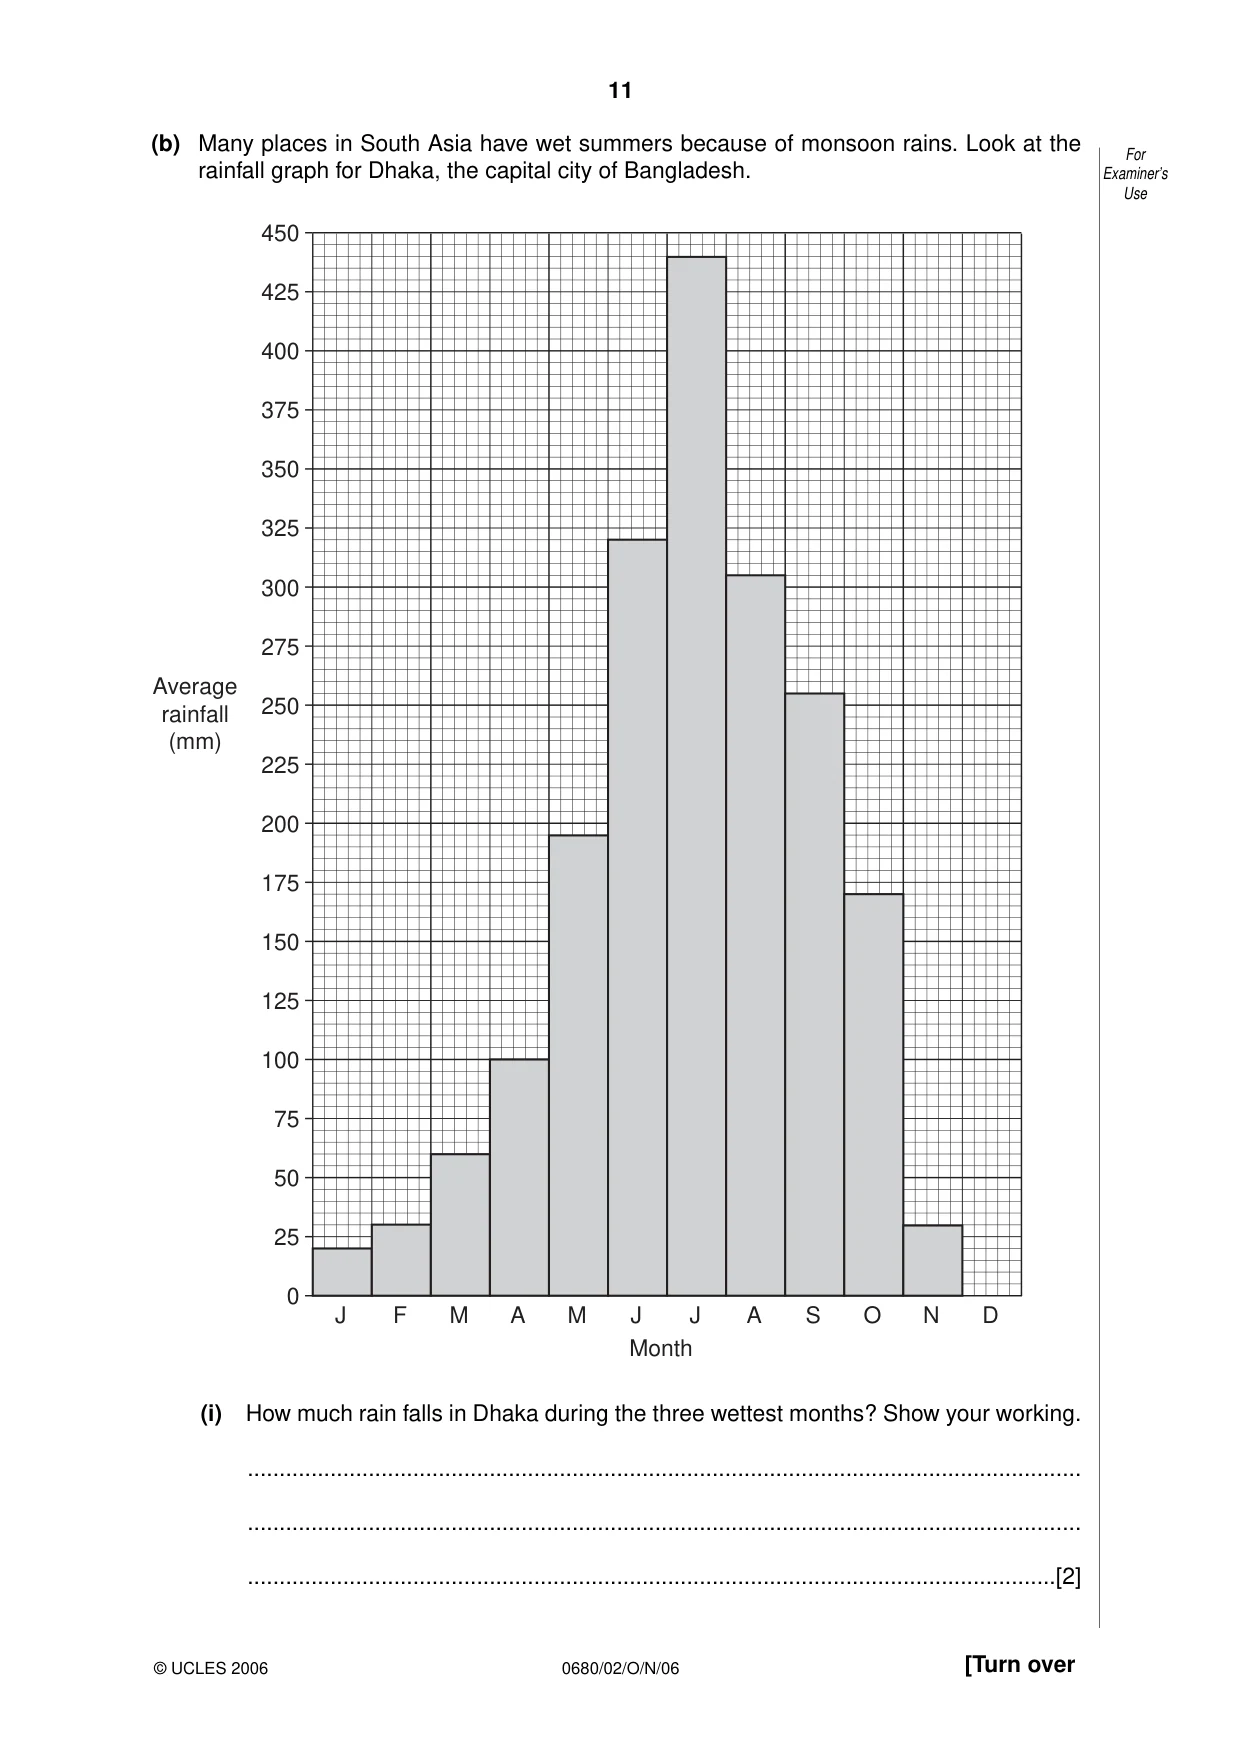
11 0680/02/O/N/06 [Turn over (b) Many places in South Asia have wet summers because of monsoon rains. Look at the rainfall graph for Dhaka, the capital city of Bangladesh. (i) How much rain falls in Dhaka during the three wettest months? Show your working. … … …[2] 0 25 50 75 100 125 150 175 200 225 250 275 300 325 350 375 400 425 450 J F M A M J J A S O N D Average rainfall (mm) Month For Examiner’s Use © UCLES 2006
Question paper, page 12
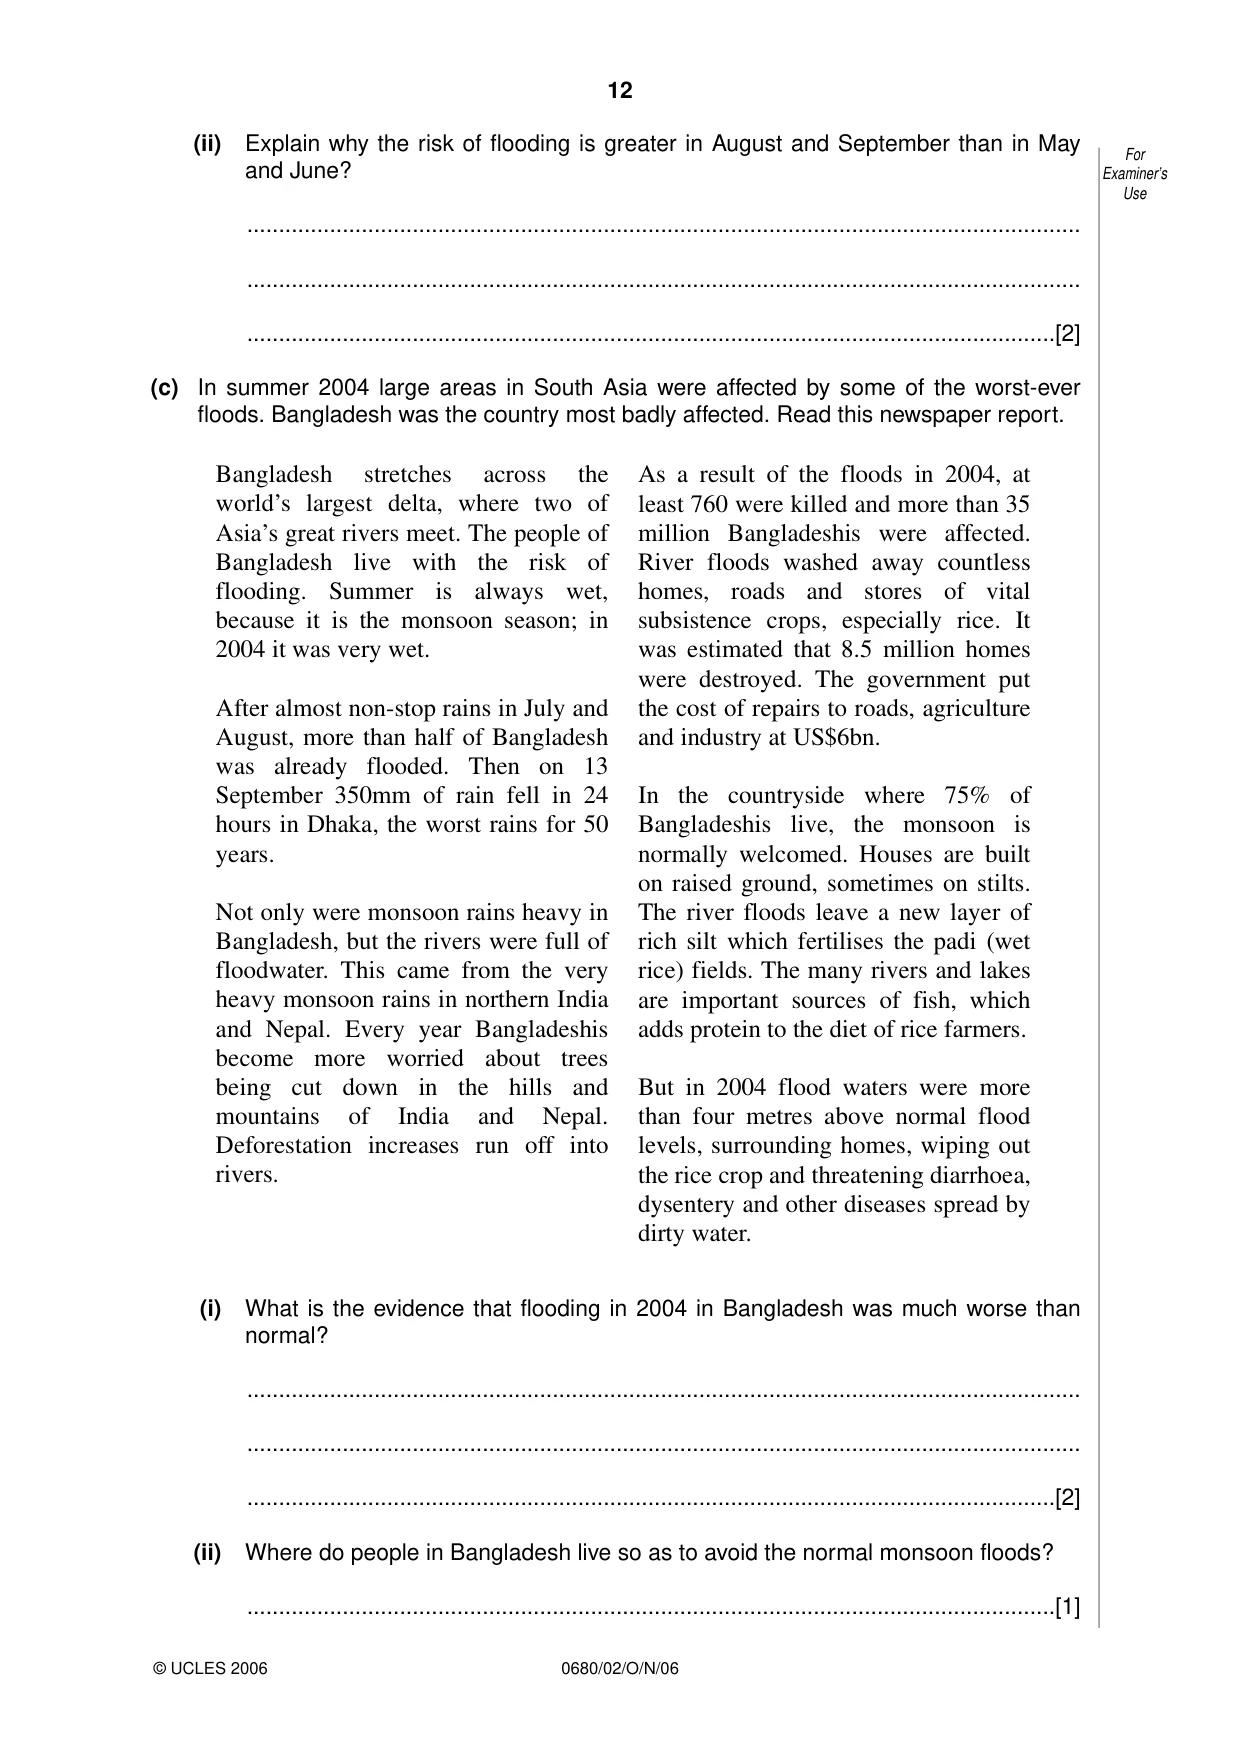
12 0680/02/O/N/06 (ii) Explain why the risk of flooding is greater in August and September than in May and June? … … …[2] (c) In summer 2004 large areas in South Asia were affected by some of the worst-ever floods. Bangladesh was the country most badly affected. Read this newspaper report. (i) What is the evidence that flooding in 2004 in Bangladesh was much worse than normal? … … …[2] (ii) Where do people in Bangladesh live so as to avoid the normal monsoon floods? …[1] For Examiner’s Use © UCLES 2006 Bangladesh stretches across the world’s largest delta, where two of Asia’s great rivers meet. The people of Bangladesh live with the risk of flooding. Summer is always wet, because it is the monsoon season; in 2004 it was very wet. After almost non-stop rains in July and August, more than half of Bangladesh was already flooded. Then on 13 September 350mm of rain fell in 24 hours in Dhaka, the worst rains for 50 years. Not only were monsoon rains heavy in Bangladesh, but the rivers were full of floodwater. This came from the very heavy monsoon rains in northern India and Nepal. Every year Bangladeshis become more worried about trees being cut down in the hills and mountains of India and Nepal. Deforestation increases run off into rivers. As a result of the floods in 2004, at least 760 were killed and more than 35 million Bangladeshis were affected. River floods washed away countless homes, roads and stores of vital subsistence crops, especially rice. It was estimated that 8.5 million homes were destroyed. The government put the cost of repairs to roads, agriculture and industry at US$6bn. In the countryside where 75% of Bangladeshis live, the monsoon is normally welcomed. Houses are built on raised ground, sometimes on stilts. The river floods leave a new layer of rich silt which fertilises the padi (wet rice) fields. The many rivers and lakes are important sources of fish, which adds protein to the diet of rice farmers. But in 2004 flood waters were more than four metres above normal flood levels, surrounding homes, wiping out the rice crop and threatening diarrhoea, dysentery and other diseases spread by dirty water.
Question paper, page 13
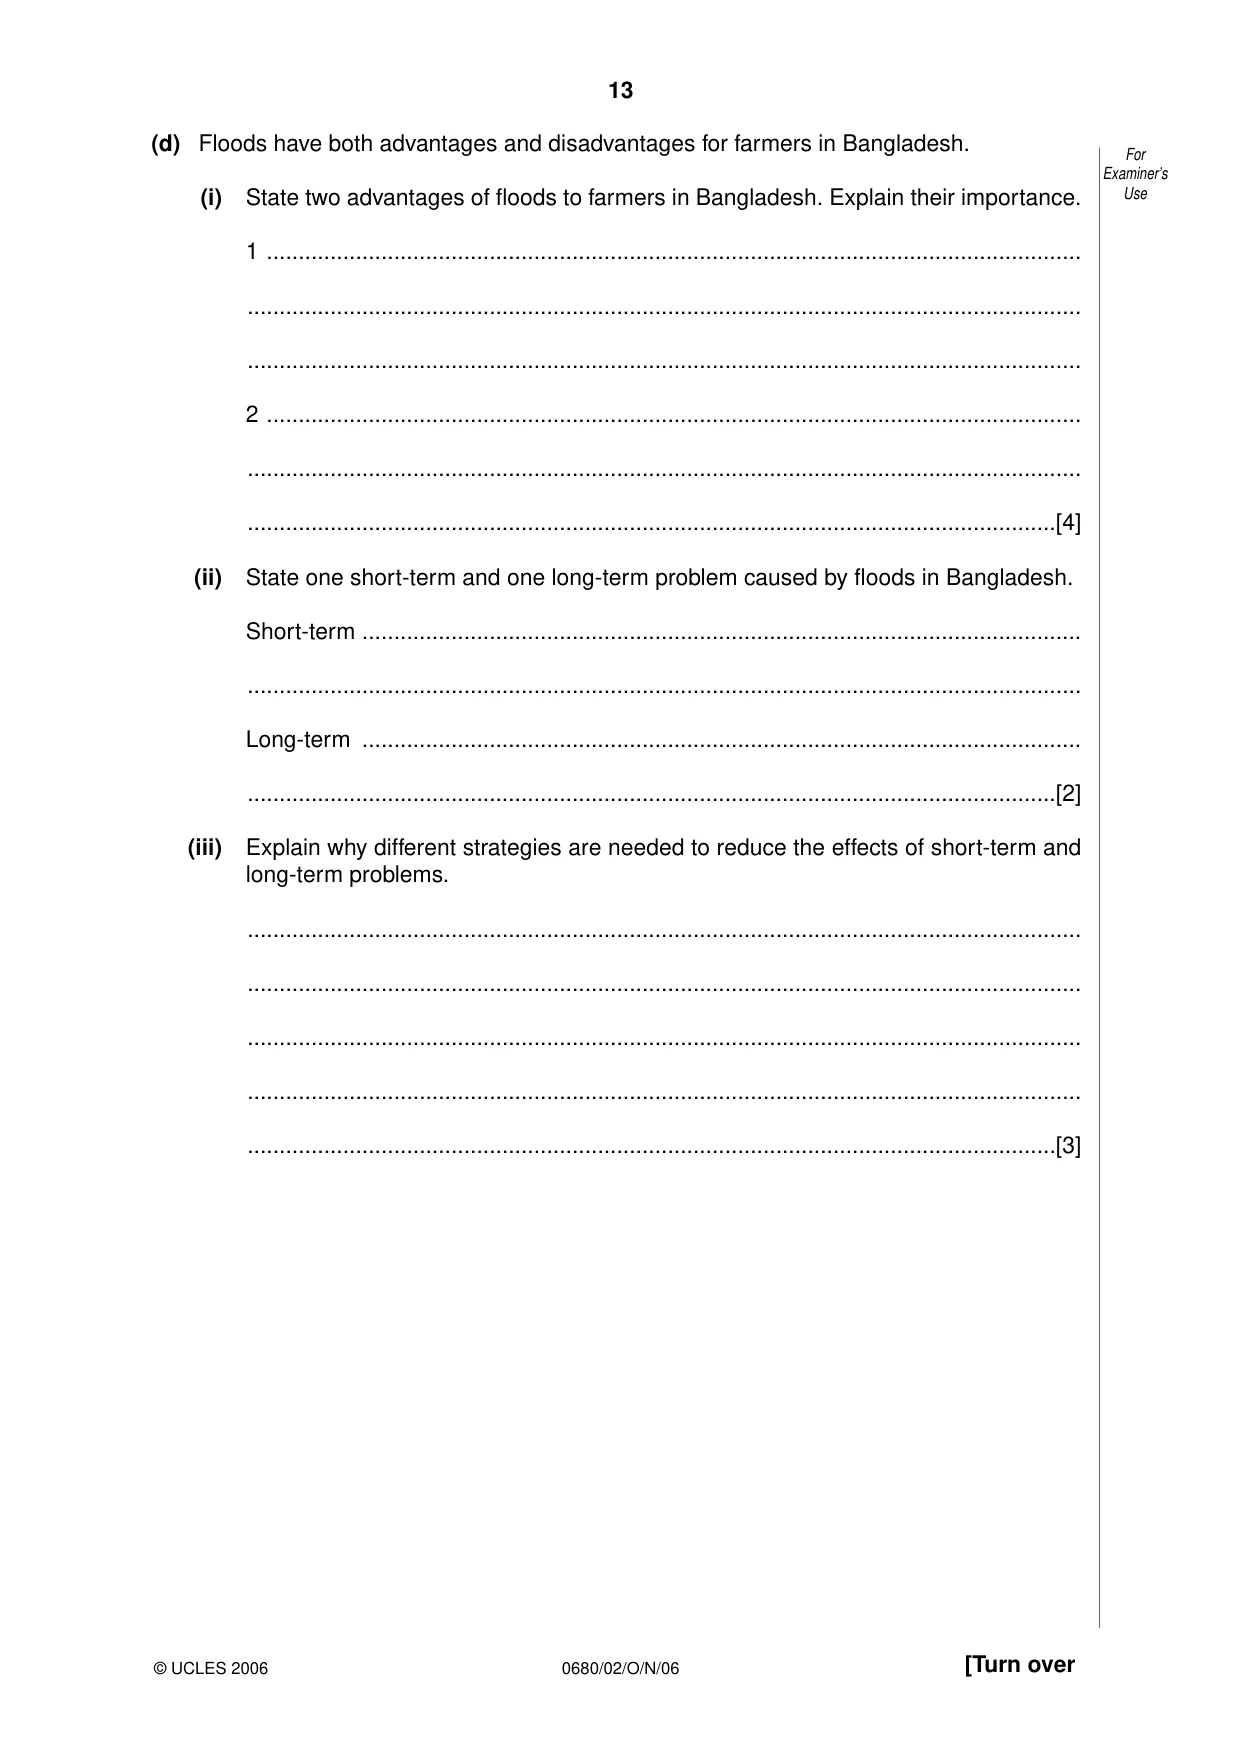
13 0680/02/O/N/06 [Turn over (d) Floods have both advantages and disadvantages for farmers in Bangladesh. (i) State two advantages of floods to farmers in Bangladesh. Explain their importance. 1 … … … 2 … … …[4] (ii) State one short-term and one long-term problem caused by floods in Bangladesh. Short-term … … Long-term … …[2] (iii) Explain why different strategies are needed to reduce the effects of short-term and long-term problems. … … … … …[3] For Examiner’s Use © UCLES 2006
Question paper, page 14
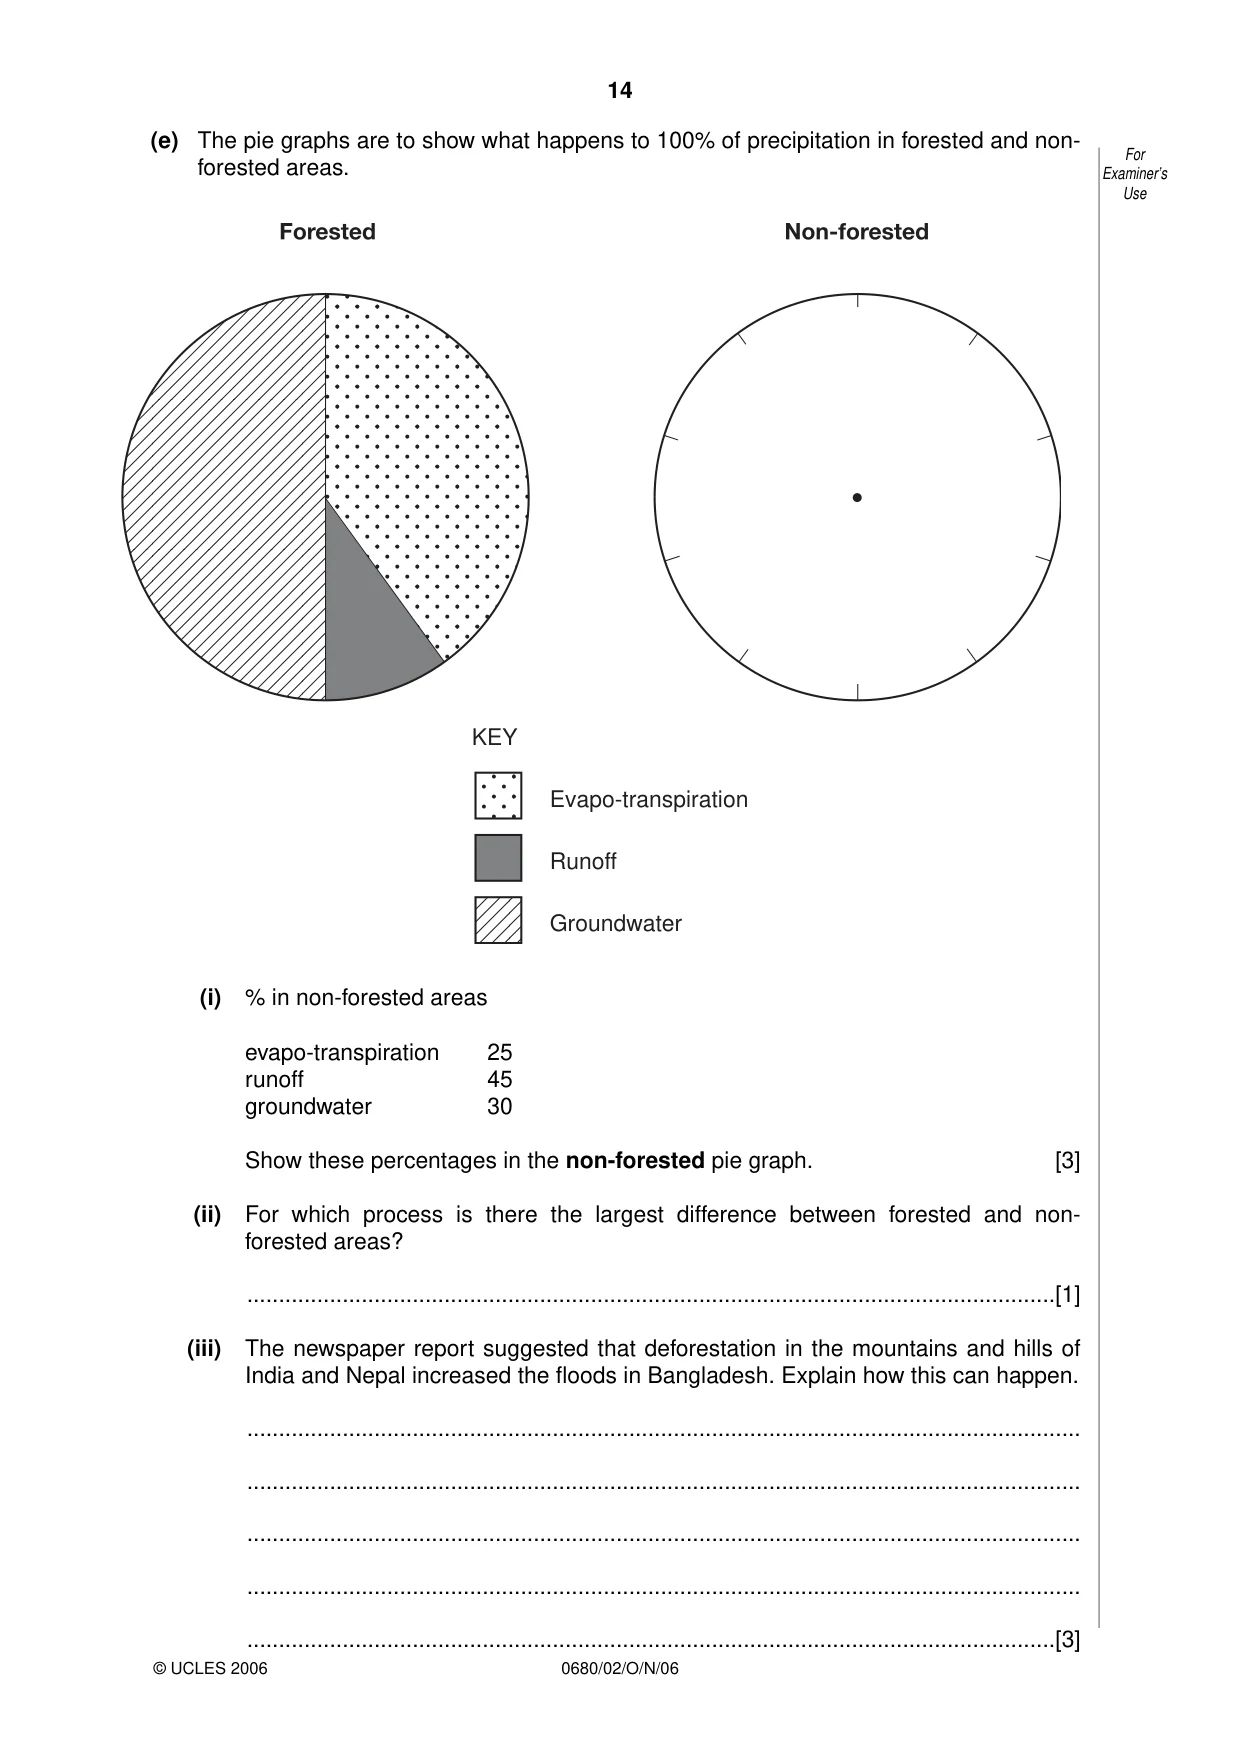
14 0680/02/O/N/06 (e) The pie graphs are to show what happens to 100% of precipitation in forested and non- forested areas. (i) % in non-forested areas evapo-transpiration 25 runoff 45 groundwater 30 Show these percentages in the non-forested pie graph. [3] (ii) For which process is there the largest difference between forested and non- forested areas? …[1] (iii) The newspaper report suggested that deforestation in the mountains and hills of India and Nepal increased the floods in Bangladesh. Explain how this can happen. … … … … …[3] KEY Evapo-transpiration Runoff Groundwater For Examiner’s Use © UCLES 2006
Question paper, page 15
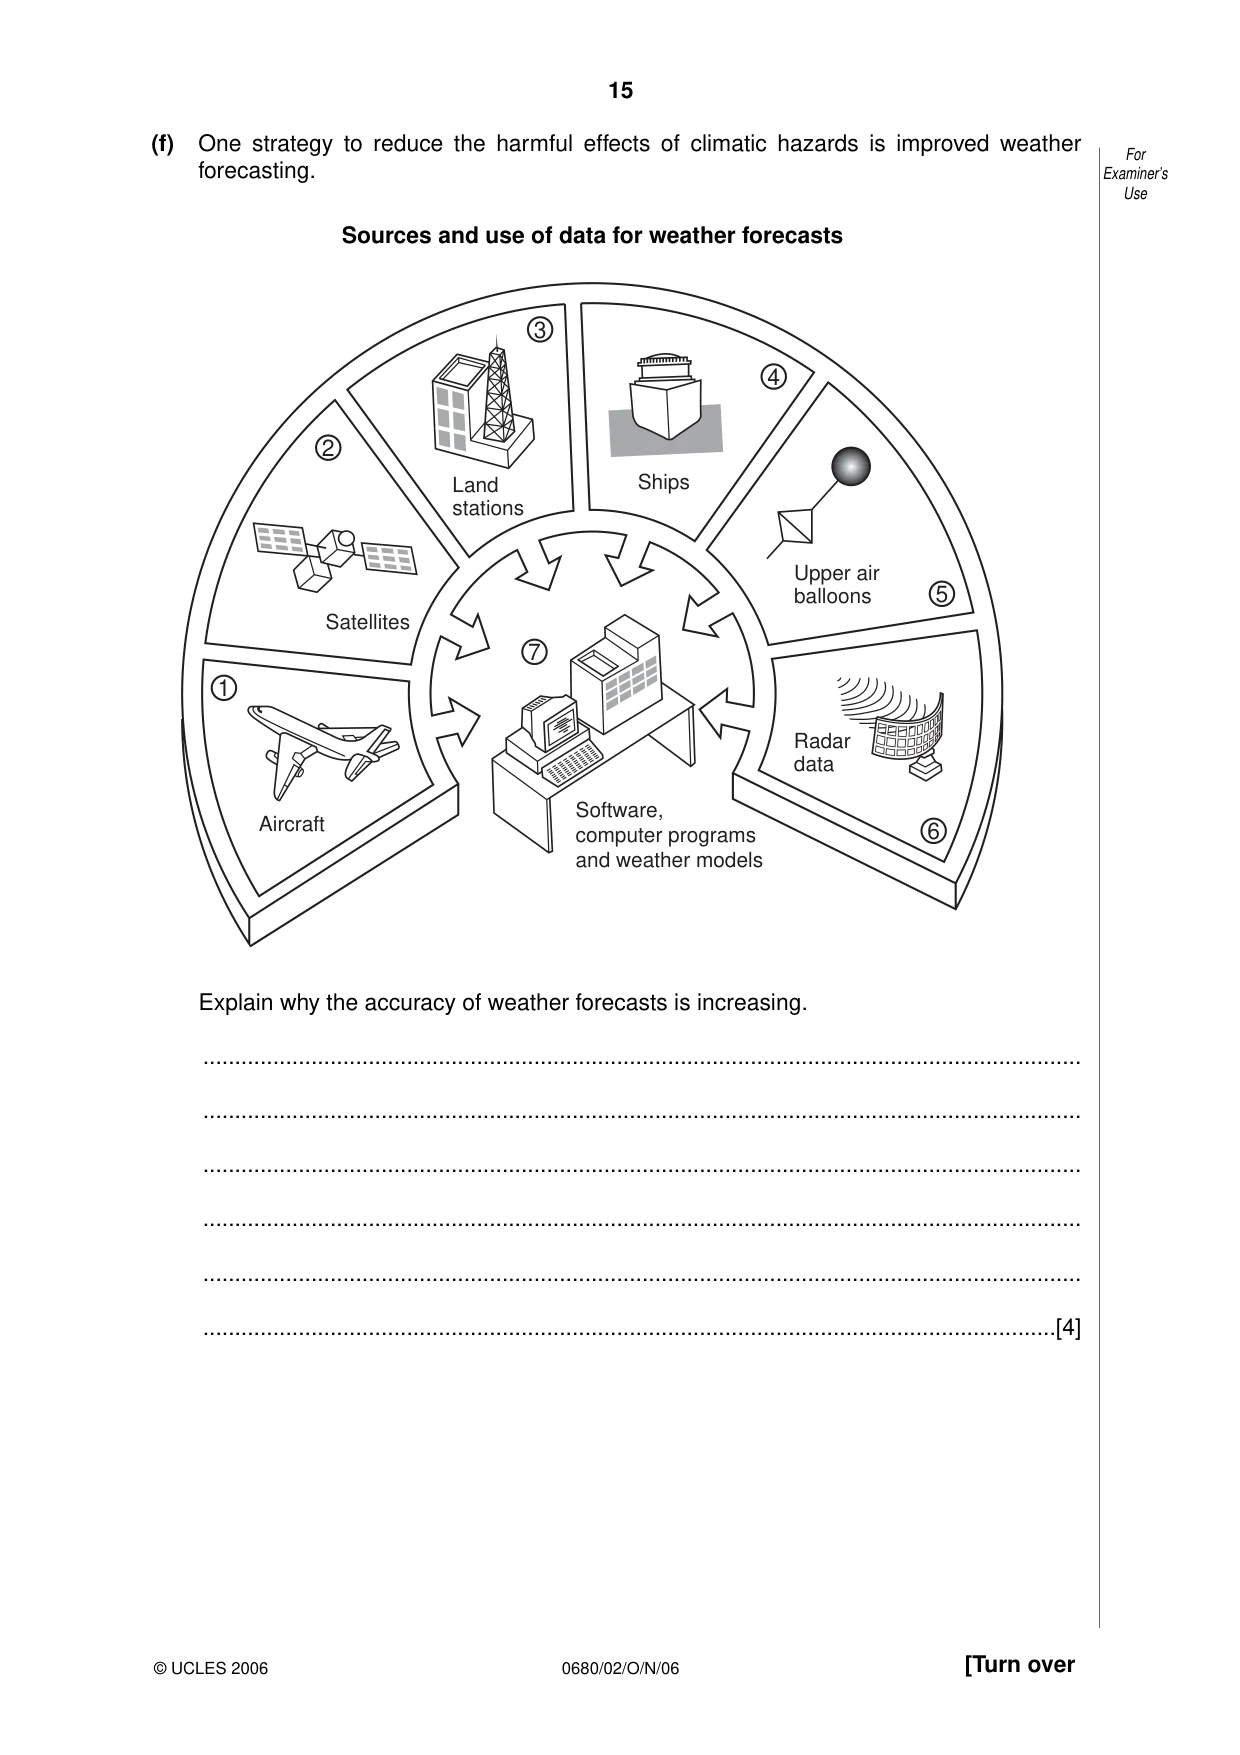
15 0680/02/O/N/06 [Turn over (f) One strategy to reduce the harmful effects of climatic hazards is improved weather forecasting. Sources and use of data for weather forecasts Explain why the accuracy of weather forecasts is increasing. … … … … … …[4] 1 2 3 4 5 6 7 Aircraft Software, computer programs and weather models Satellites Land stations Ships Upper air balloons Radar data For Examiner’s Use © UCLES 2006
Question paper, page 16
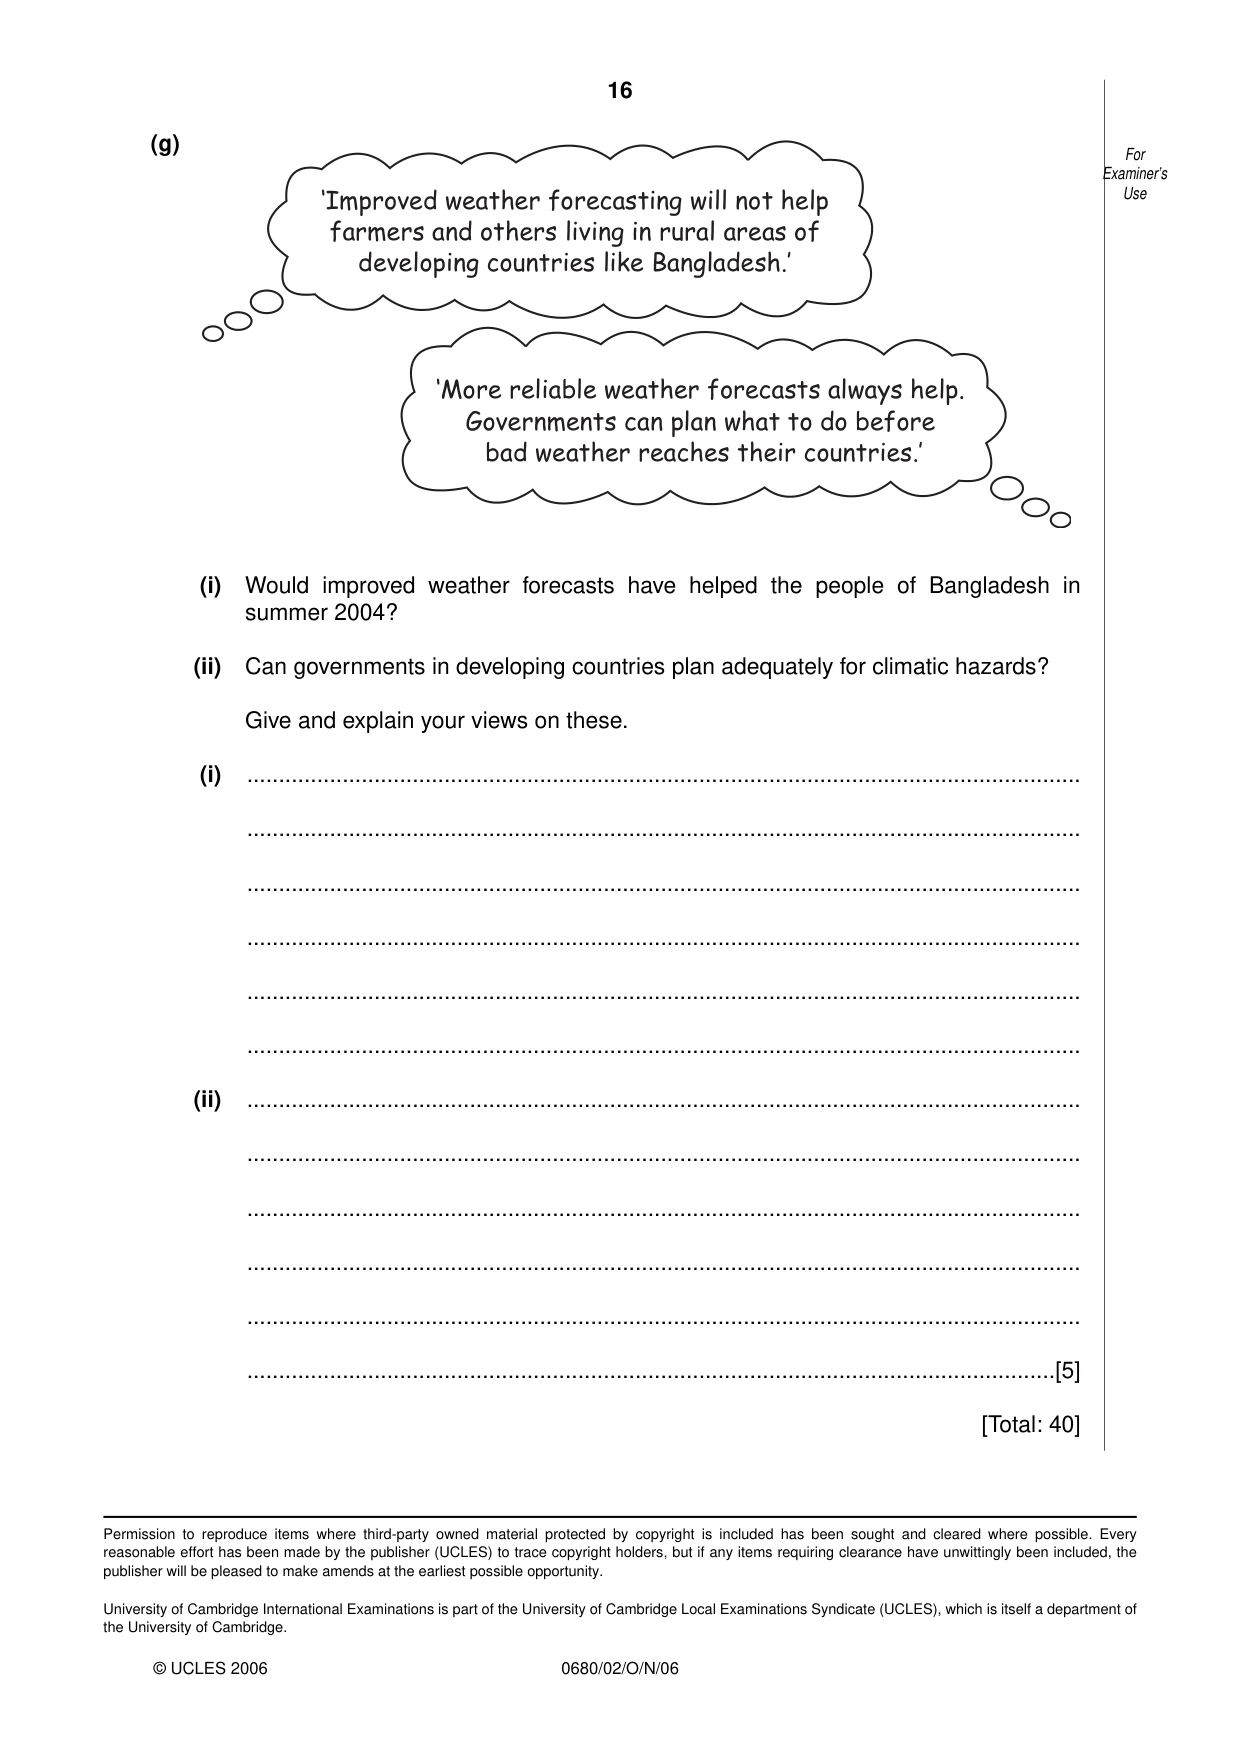
16 0680/02/O/N/06 (g) (i) Would improved weather forecasts have helped the people of Bangladesh in summer 2004? (ii) Can governments in developing countries plan adequately for climatic hazards? Give and explain your views on these. (i) … … … … … … (ii) … … … … … …[5] [Total: 40] ‘Improved weather forecasting will not help farmers and others living in rural areas of developing countries like Bangladesh.’ ‘More reliable weather forecasts always help. Governments can plan what to do before bad weather reaches their countries.’ For Examiner’s Use © UCLES 2006 Permission to reproduce items where third-party owned material protected by copyright is included has been sought and cleared where possible. Every reasonable effort has been made by the publisher (UCLES) to trace copyright holders, but if any items requiring clearance have unwittingly been included, the publisher will be pleased to make amends at the earliest possible opportunity. University of Cambridge International Examinations is part of the University of Cambridge Local Examinations Syndicate (UCLES), which is itself a department of the University of Cambridge.
Mark scheme, page 1
UNIVERSITY OF CAMBRIDGE INTERNATIONAL EXAMINATIONS International General Certificate of Secondary Education MARK SCHEME for the October/November 2006 question paper 0680 ENVIRONMENTAL MANAGEMENT 0680/02 Paper 2, maximum raw mark 80 This mark scheme is published as an aid to teachers and students, to indicate the requirements of the examination. It shows the basis on which Examiners were instructed to award marks. It does not indicate the details of the discussions that took place at an Examiners’ meeting before marking began. All Examiners are instructed that alternative correct answers and unexpected approaches in candidates’ scripts must be given marks that fairly reflect the relevant knowledge and skills demonstrated. Mark schemes must be read in conjunction with the question papers and the report on the examination. The grade thresholds for various grades are published in the report on the examination for most IGCSE, GCE Advanced Level and Advanced Subsidiary Level syllabuses. • CIE will not enter into discussions or correspondence in connection with these mark schemes. CIE is publishing the mark schemes for the October/November 2006 question papers for most IGCSE, GCE Advanced Level and Advanced Subsidiary Level syllabuses and some Ordinary Level syllabuses. www.XtremePapers.com
Mark scheme, page 2
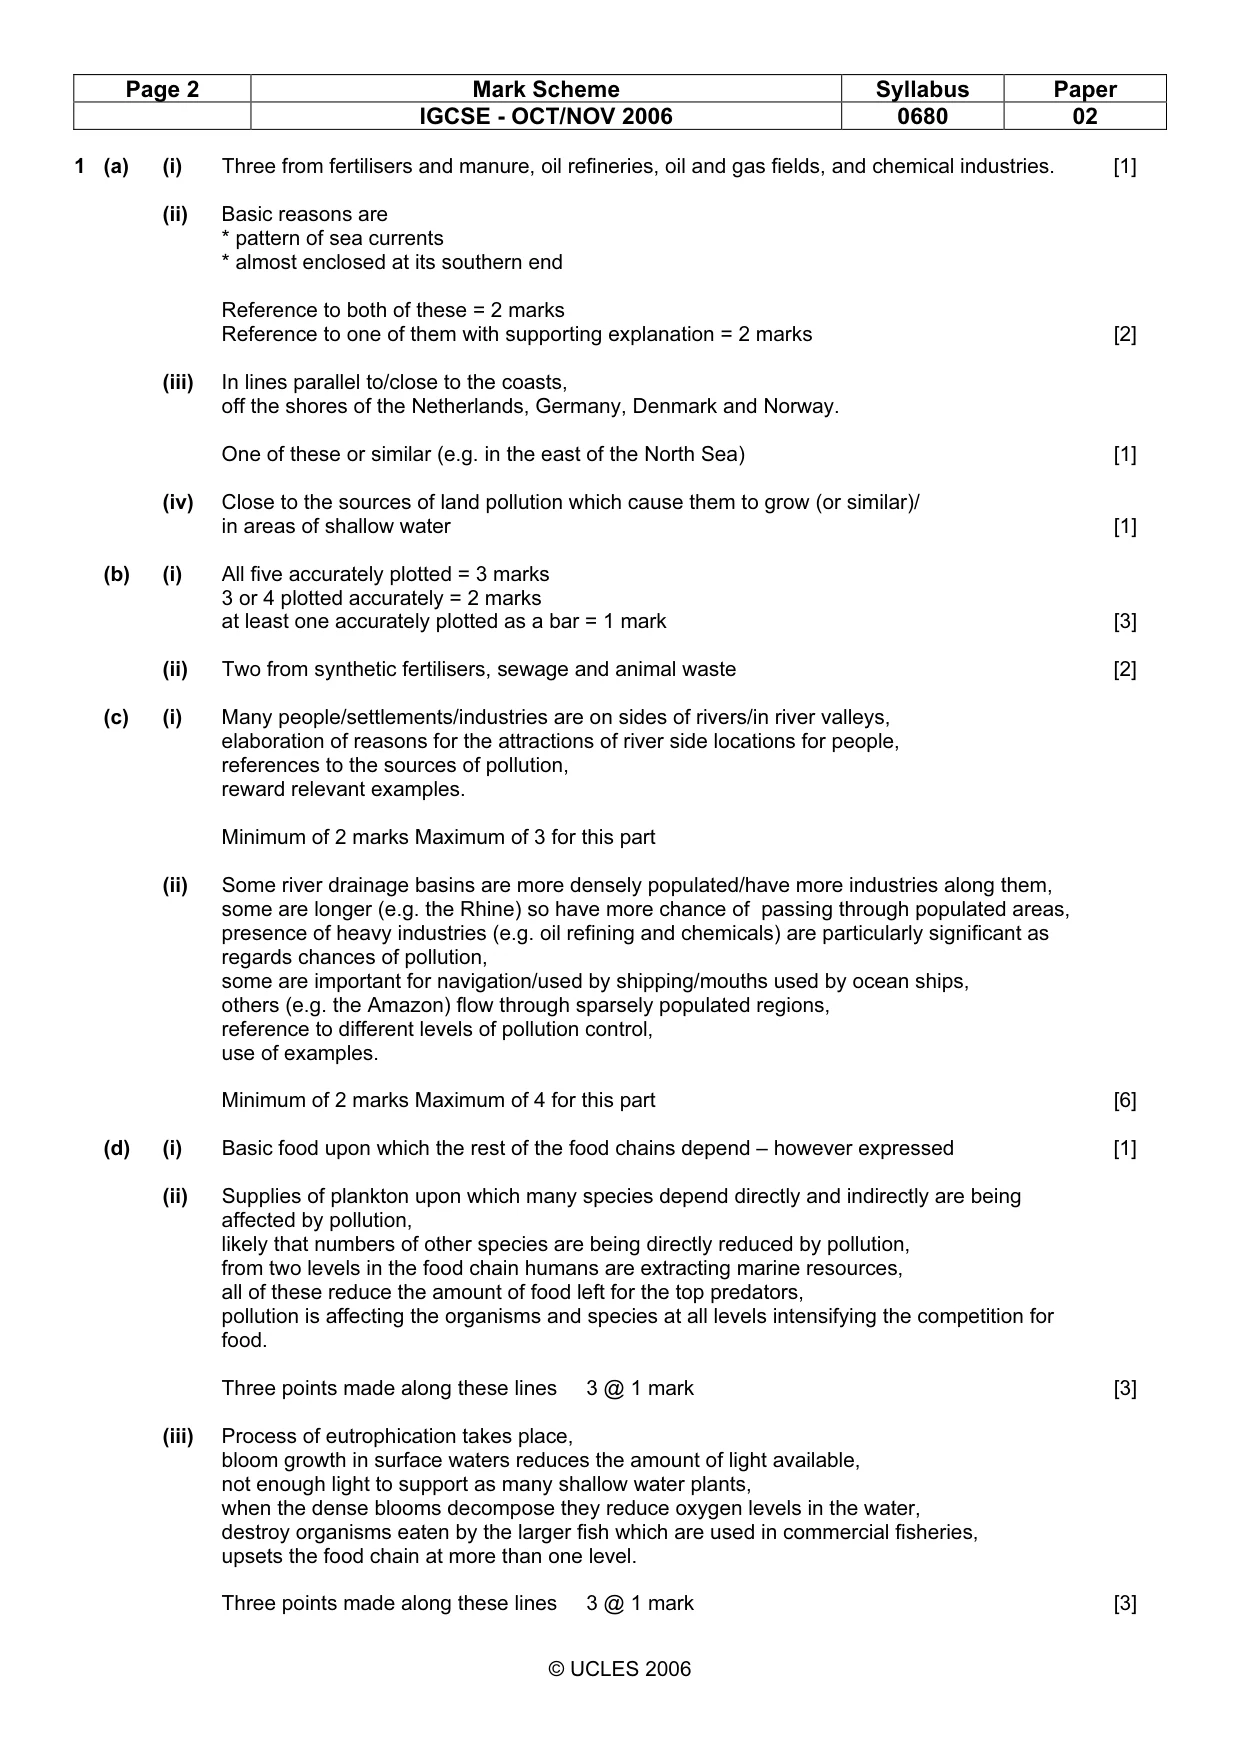
Page 2 Mark Scheme Syllabus Paper IGCSE - OCT/NOV 2006 0680 02 © UCLES 2006 1 (a) (i) Three from fertilisers and manure, oil refineries, oil and gas fields, and chemical industries. [1] (ii) Basic reasons are * pattern of sea currents * almost enclosed at its southern end Reference to both of these = 2 marks Reference to one of them with supporting explanation = 2 marks [2] (iii) In lines parallel to/close to the coasts, off the shores of the Netherlands, Germany, Denmark and Norway. One of these or similar (e.g. in the east of the North Sea) [1] (iv) Close to the sources of land pollution which cause them to grow (or similar)/ in areas of shallow water [1] (b) (i) All five accurately plotted = 3 marks 3 or 4 plotted accurately = 2 marks at least one accurately plotted as a bar = 1 mark [3] (ii) Two from synthetic fertilisers, sewage and animal waste [2] (c) (i) Many people/settlements/industries are on sides of rivers/in river valleys, elaboration of reasons for the attractions of river side locations for people, references to the sources of pollution, reward relevant examples. Minimum of 2 marks Maximum of 3 for this part (ii) Some river drainage basins are more densely populated/have more industries along them, some are longer (e.g. the Rhine) so have more chance of passing through populated areas, presence of heavy industries (e.g. oil refining and chemicals) are particularly significant as regards chances of pollution, some are important for navigation/used by shipping/mouths used by ocean ships, others (e.g. the Amazon) flow through sparsely populated regions, reference to different levels of pollution control, use of examples. Minimum of 2 marks Maximum of 4 for this part [6] (d) (i) Basic food upon which the rest of the food chains depend – however expressed [1] (ii) Supplies of plankton upon which many species depend directly and indirectly are being affected by pollution, likely that numbers of other species are being directly reduced by pollution, from two levels in the food chain humans are extracting marine resources, all of these reduce the amount of food left for the top predators, pollution is affecting the organisms and species at all levels intensifying the competition for food. Three points made along these lines 3 @ 1 mark [3] (iii) Process of eutrophication takes place, bloom growth in surface waters reduces the amount of light available, not enough light to support as many shallow water plants, when the dense blooms decompose they reduce oxygen levels in the water, destroy organisms eaten by the larger fish which are used in commercial fisheries, upsets the food chain at more than one level. Three points made along these lines 3 @ 1 mark [3]
Mark scheme, page 3
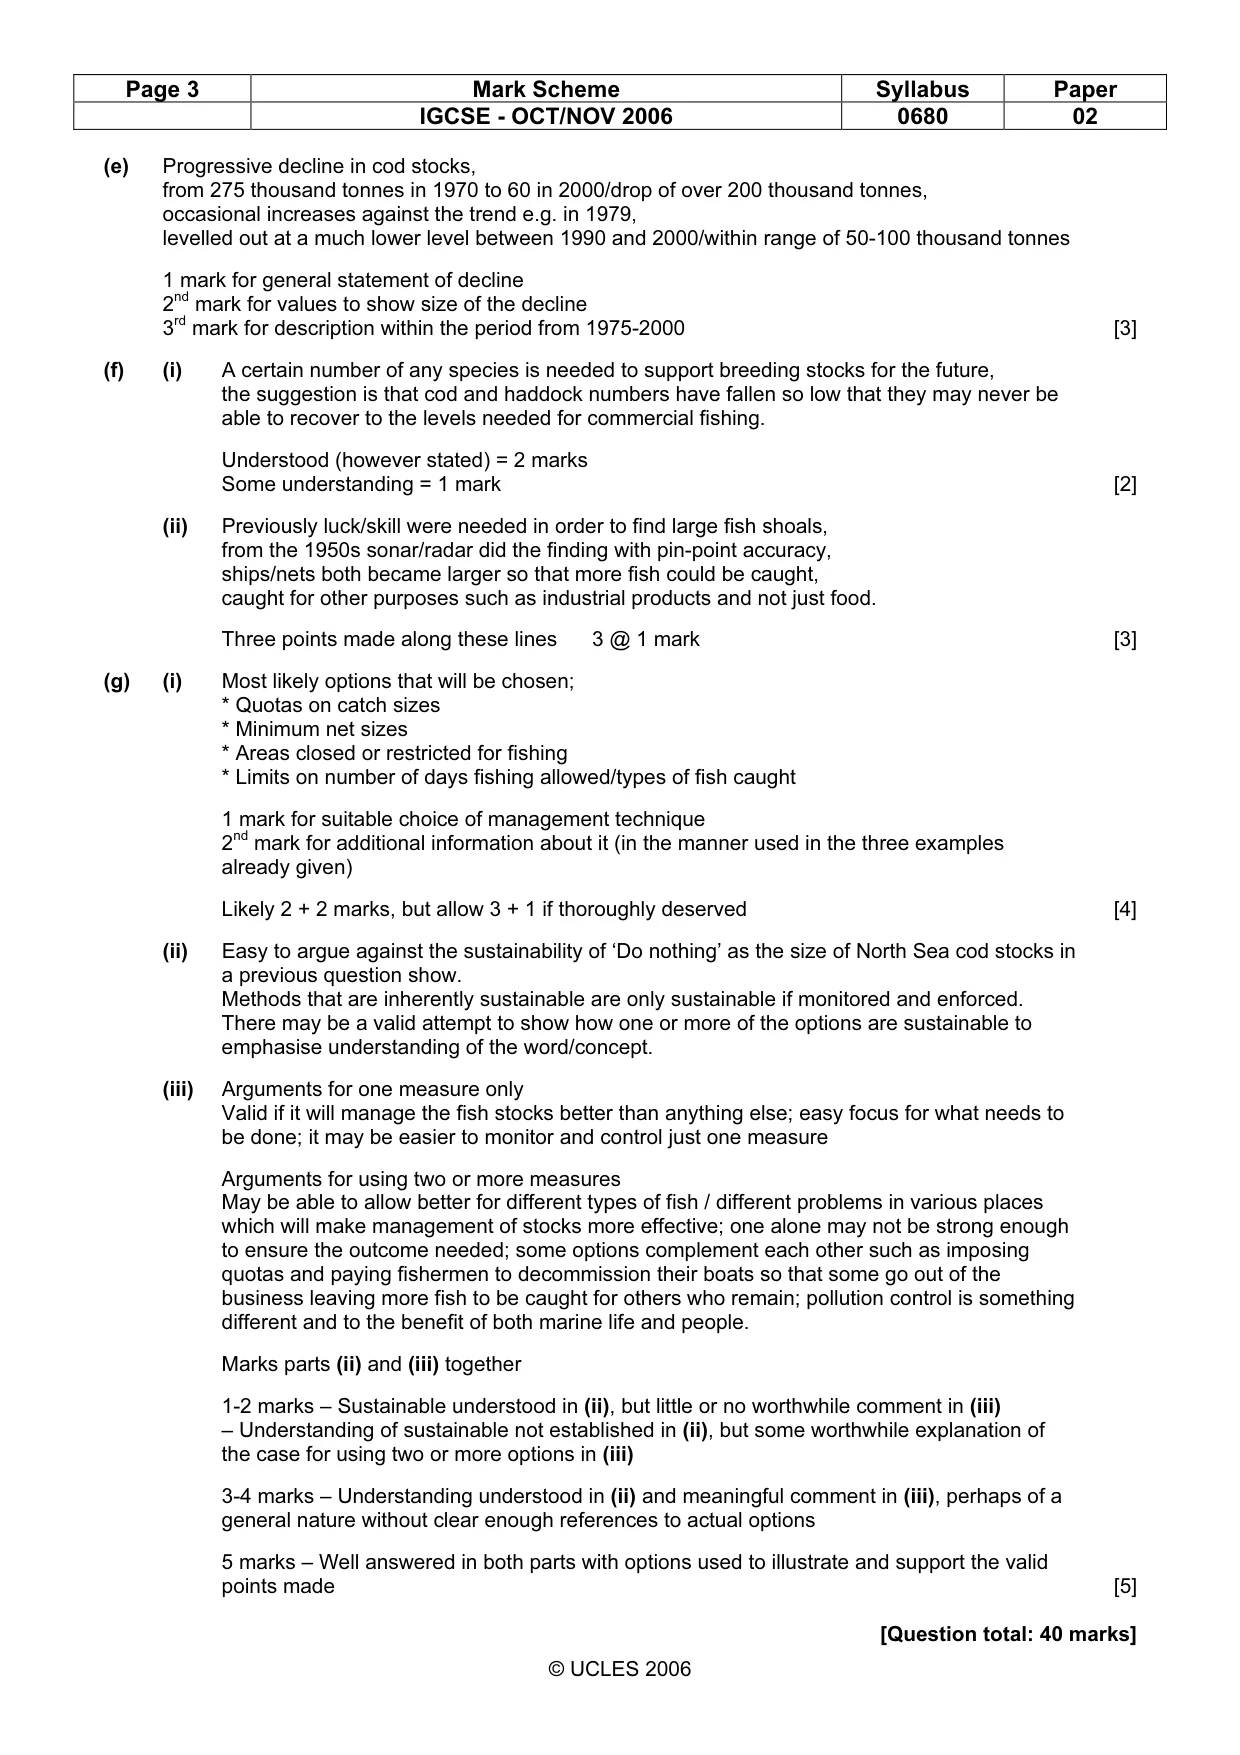
Page 3 Mark Scheme Syllabus Paper IGCSE - OCT/NOV 2006 0680 02 © UCLES 2006 (e) Progressive decline in cod stocks, from 275 thousand tonnes in 1970 to 60 in 2000/drop of over 200 thousand tonnes, occasional increases against the trend e.g. in 1979, levelled out at a much lower level between 1990 and 2000/within range of 50-100 thousand tonnes 1 mark for general statement of decline 2nd mark for values to show size of the decline 3rd mark for description within the period from 1975-2000 [3] (f) (i) A certain number of any species is needed to support breeding stocks for the future, the suggestion is that cod and haddock numbers have fallen so low that they may never be able to recover to the levels needed for commercial fishing. Understood (however stated) = 2 marks Some understanding = 1 mark [2] (ii) Previously luck/skill were needed in order to find large fish shoals, from the 1950s sonar/radar did the finding with pin-point accuracy, ships/nets both became larger so that more fish could be caught, caught for other purposes such as industrial products and not just food. Three points made along these lines 3 @ 1 mark [3] (g) (i) Most likely options that will be chosen; * Quotas on catch sizes * Minimum net sizes * Areas closed or restricted for fishing * Limits on number of days fishing allowed/types of fish caught 1 mark for suitable choice of management technique 2nd mark for additional information about it (in the manner used in the three examples already given) Likely 2 + 2 marks, but allow 3 + 1 if thoroughly deserved [4] (ii) Easy to argue against the sustainability of ‘Do nothing’ as the size of North Sea cod stocks in a previous question show. Methods that are inherently sustainable are only sustainable if monitored and enforced. There may be a valid attempt to show how one or more of the options are sustainable to emphasise understanding of the word/concept. (iii) Arguments for one measure only Valid if it will manage the fish stocks better than anything else; easy focus for what needs to be done; it may be easier to monitor and control just one measure Arguments for using two or more measures May be able to allow better for different types of fish / different problems in various places which will make management of stocks more effective; one alone may not be strong enough to ensure the outcome needed; some options complement each other such as imposing quotas and paying fishermen to decommission their boats so that some go out of the business leaving more fish to be caught for others who remain; pollution control is something different and to the benefit of both marine life and people. Marks parts (ii) and (iii) together 1-2 marks – Sustainable understood in (ii), but little or no worthwhile comment in (iii) – Understanding of sustainable not established in (ii), but some worthwhile explanation of the case for using two or more options in (iii) 3-4 marks – Understanding understood in (ii) and meaningful comment in (iii), perhaps of a general nature without clear enough references to actual options 5 marks – Well answered in both parts with options used to illustrate and support the valid points made [5] [Question total: 40 marks]
Mark scheme, page 4
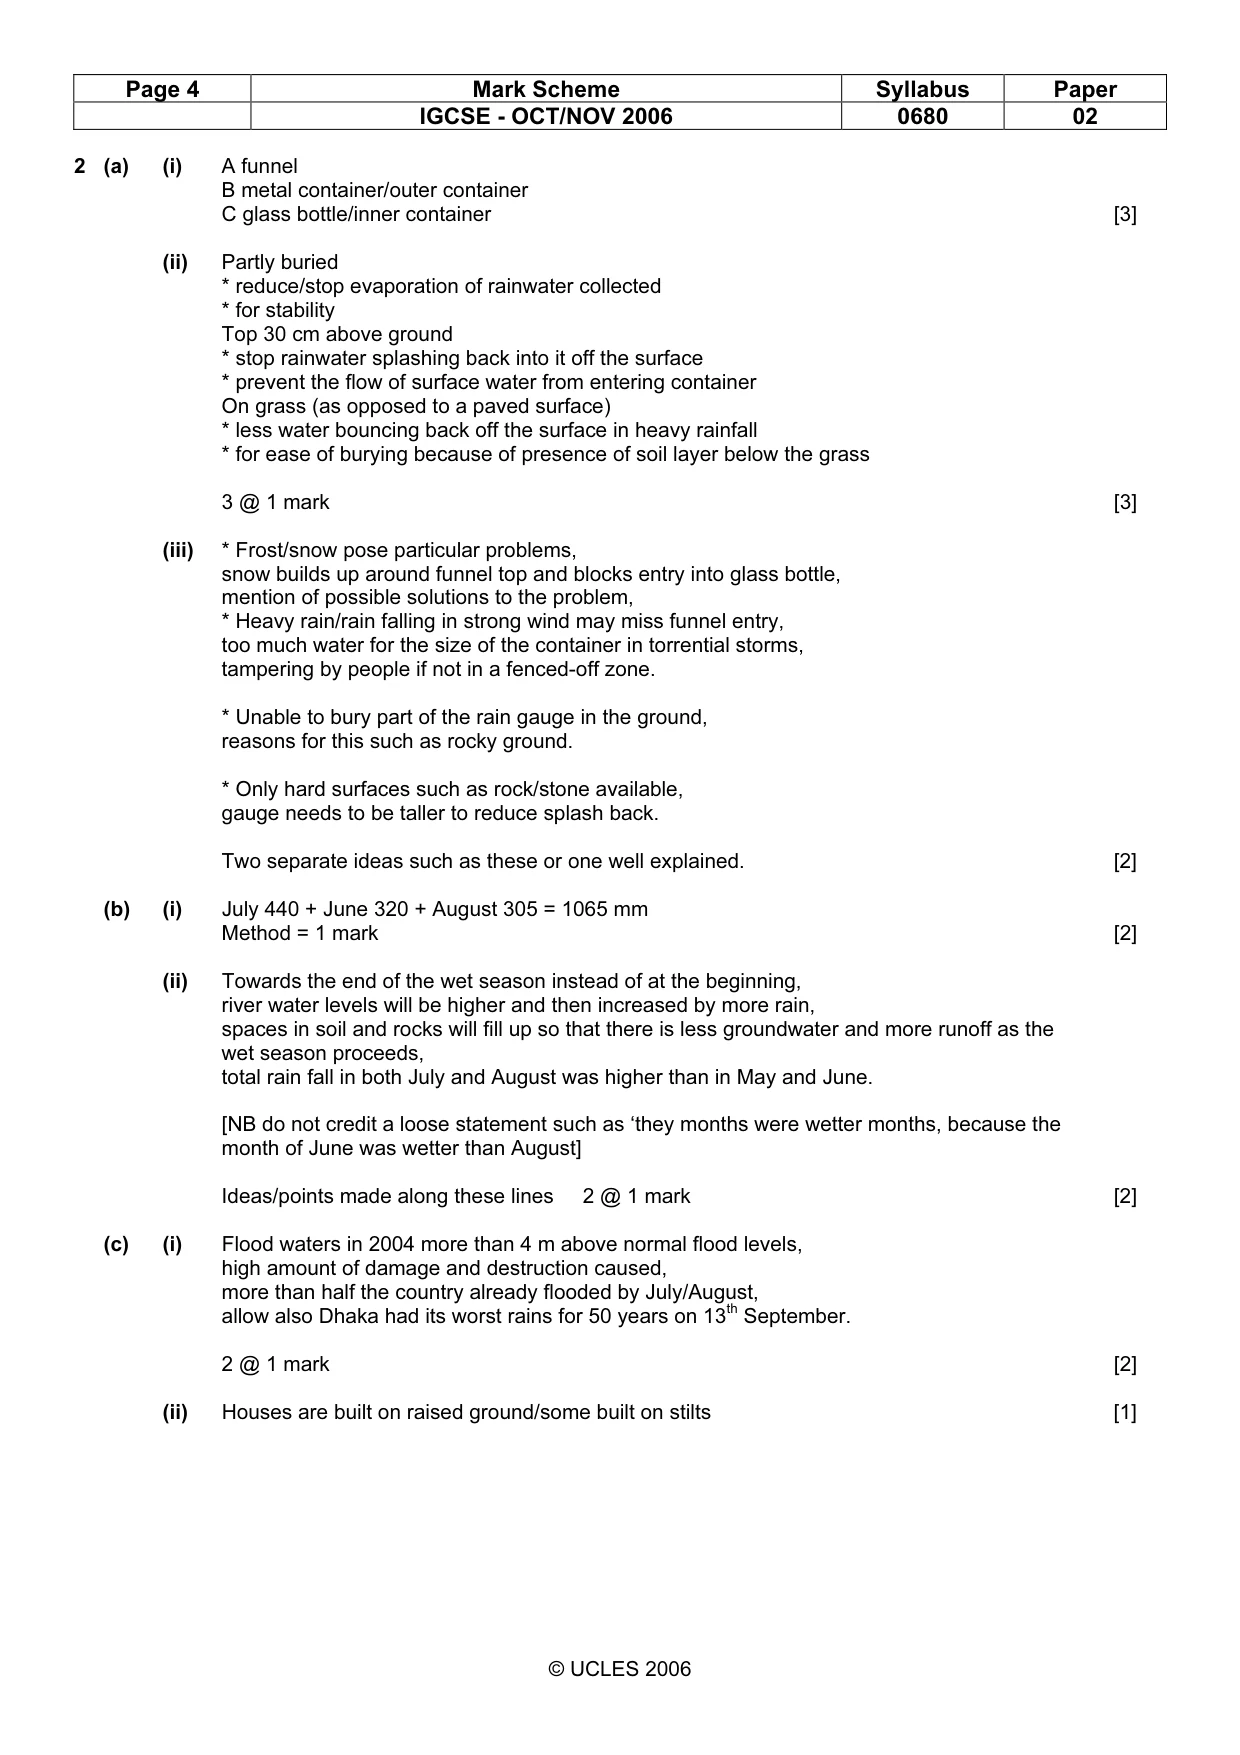
Page 4 Mark Scheme Syllabus Paper IGCSE - OCT/NOV 2006 0680 02 © UCLES 2006 2 (a) (i) A funnel B metal container/outer container C glass bottle/inner container [3] (ii) Partly buried * reduce/stop evaporation of rainwater collected * for stability Top 30 cm above ground * stop rainwater splashing back into it off the surface * prevent the flow of surface water from entering container On grass (as opposed to a paved surface) * less water bouncing back off the surface in heavy rainfall * for ease of burying because of presence of soil layer below the grass 3 @ 1 mark [3] (iii) * Frost/snow pose particular problems, snow builds up around funnel top and blocks entry into glass bottle, mention of possible solutions to the problem, * Heavy rain/rain falling in strong wind may miss funnel entry, too much water for the size of the container in torrential storms, tampering by people if not in a fenced-off zone. * Unable to bury part of the rain gauge in the ground, reasons for this such as rocky ground. * Only hard surfaces such as rock/stone available, gauge needs to be taller to reduce splash back. Two separate ideas such as these or one well explained. [2] (b) (i) July 440 + June 320 + August 305 = 1065 mm Method = 1 mark [2] (ii) Towards the end of the wet season instead of at the beginning, river water levels will be higher and then increased by more rain, spaces in soil and rocks will fill up so that there is less groundwater and more runoff as the wet season proceeds, total rain fall in both July and August was higher than in May and June. [NB do not credit a loose statement such as ‘they months were wetter months, because the month of June was wetter than August] Ideas/points made along these lines 2 @ 1 mark [2] (c) (i) Flood waters in 2004 more than 4 m above normal flood levels, high amount of damage and destruction caused, more than half the country already flooded by July/August, allow also Dhaka had its worst rains for 50 years on 13th September. 2 @ 1 mark [2] (ii) Houses are built on raised ground/some built on stilts [1]
Mark scheme, page 5
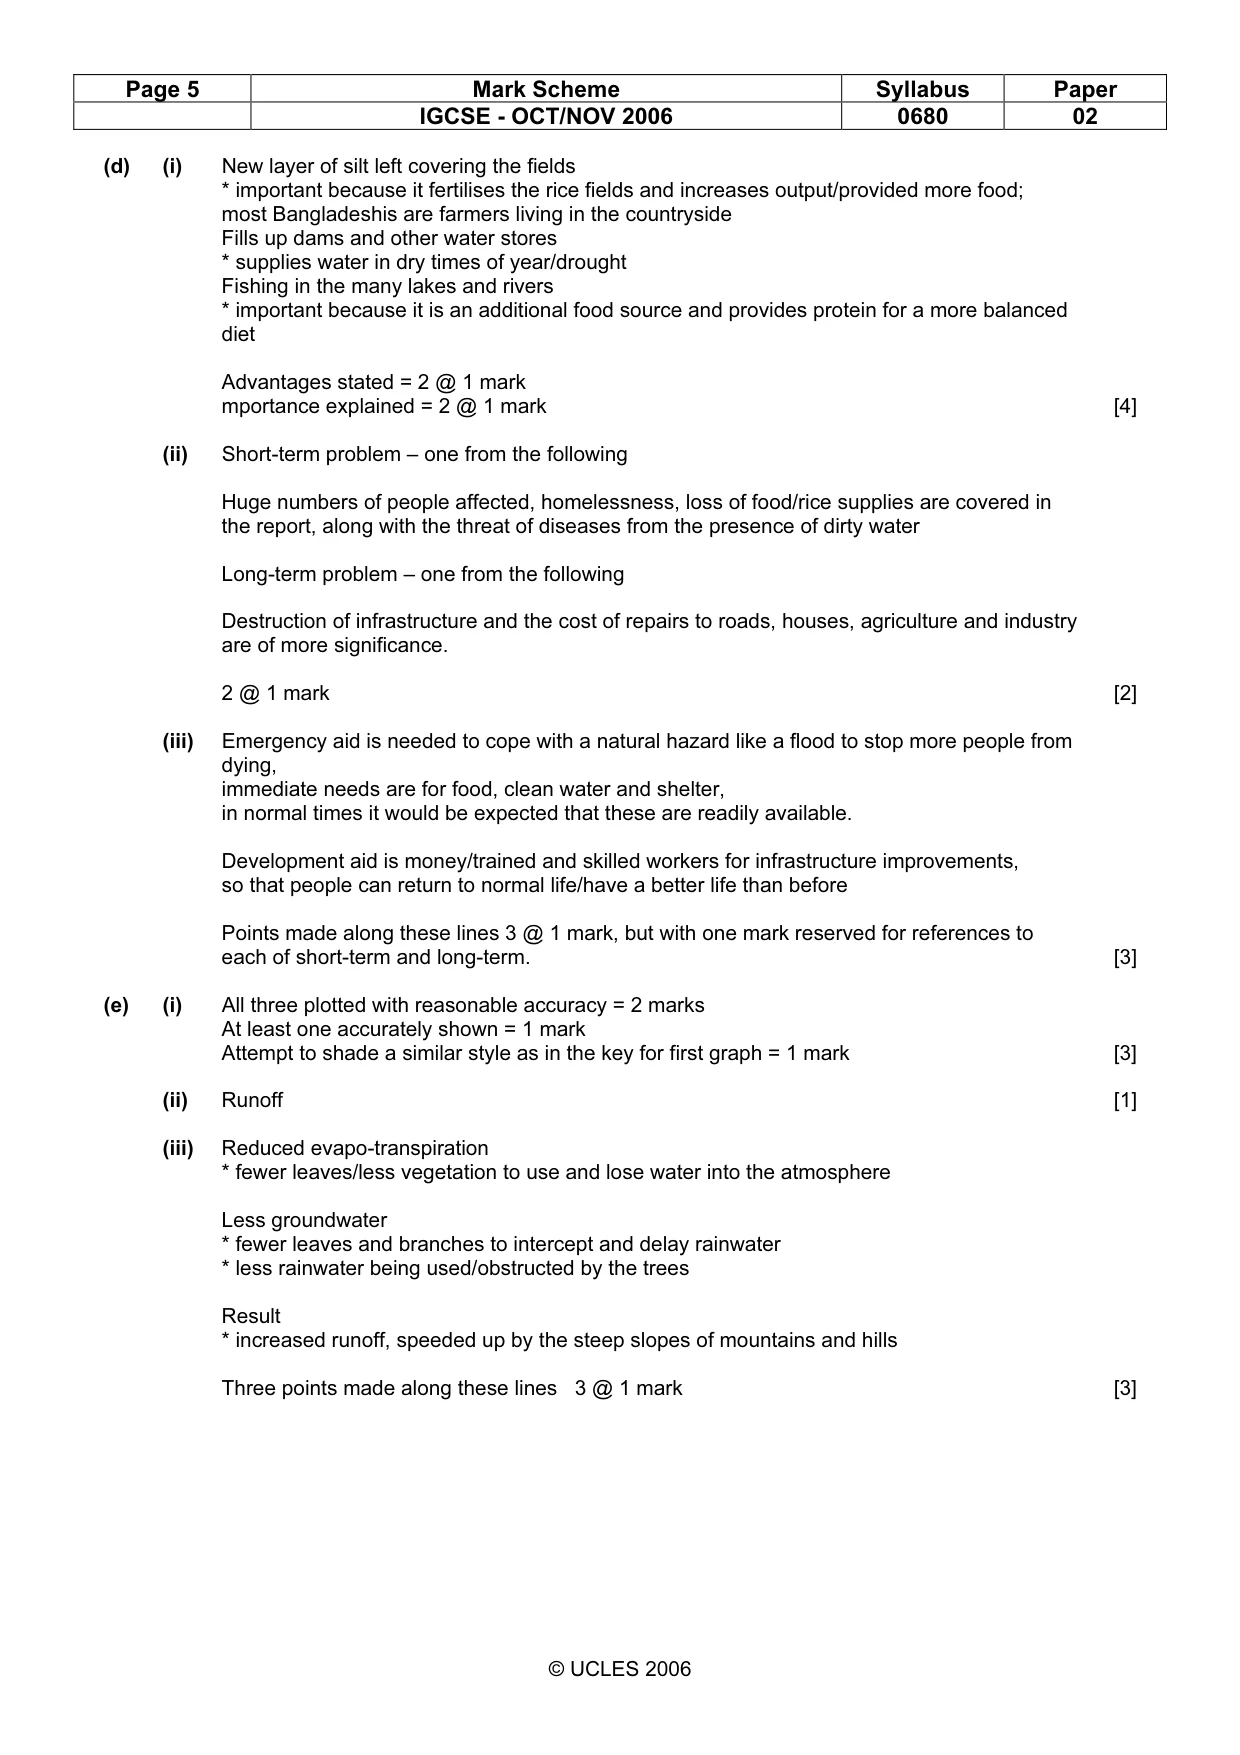
Page 5 Mark Scheme Syllabus Paper IGCSE - OCT/NOV 2006 0680 02 © UCLES 2006 (d) (i) New layer of silt left covering the fields * important because it fertilises the rice fields and increases output/provided more food; most Bangladeshis are farmers living in the countryside Fills up dams and other water stores * supplies water in dry times of year/drought Fishing in the many lakes and rivers * important because it is an additional food source and provides protein for a more balanced diet Advantages stated = 2 @ 1 mark mportance explained = 2 @ 1 mark [4] (ii) Short-term problem – one from the following Huge numbers of people affected, homelessness, loss of food/rice supplies are covered in the report, along with the threat of diseases from the presence of dirty water Long-term problem – one from the following Destruction of infrastructure and the cost of repairs to roads, houses, agriculture and industry are of more significance. 2 @ 1 mark [2] (iii) Emergency aid is needed to cope with a natural hazard like a flood to stop more people from dying, immediate needs are for food, clean water and shelter, in normal times it would be expected that these are readily available. Development aid is money/trained and skilled workers for infrastructure improvements, so that people can return to normal life/have a better life than before Points made along these lines 3 @ 1 mark, but with one mark reserved for references to each of short-term and long-term. [3] (e) (i) All three plotted with reasonable accuracy = 2 marks At least one accurately shown = 1 mark Attempt to shade a similar style as in the key for first graph = 1 mark [3] (ii) Runoff [1] (iii) Reduced evapo-transpiration * fewer leaves/less vegetation to use and lose water into the atmosphere Less groundwater * fewer leaves and branches to intercept and delay rainwater * less rainwater being used/obstructed by the trees Result * increased runoff, speeded up by the steep slopes of mountains and hills Three points made along these lines 3 @ 1 mark [3]
Mark scheme, page 6
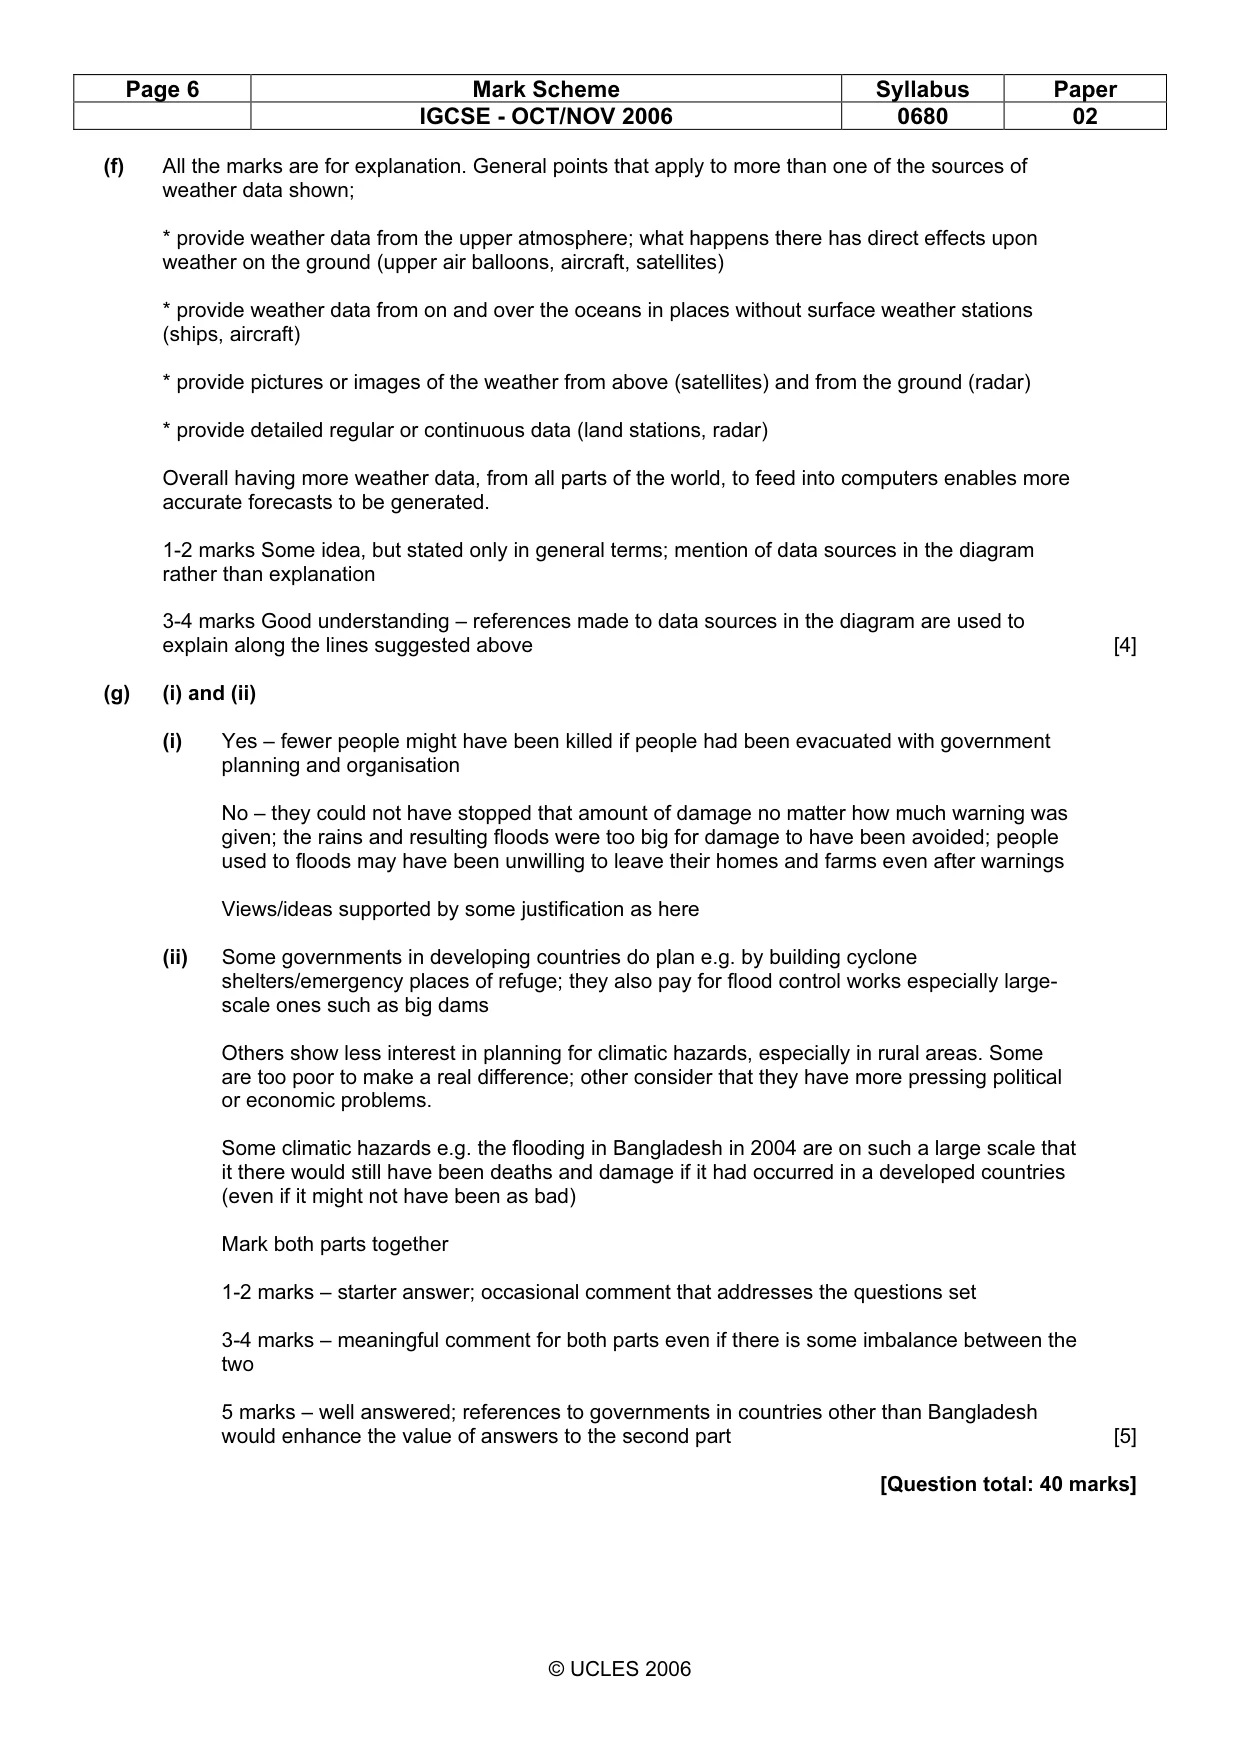
Page 6 Mark Scheme Syllabus Paper IGCSE - OCT/NOV 2006 0680 02 © UCLES 2006 (f) All the marks are for explanation. General points that apply to more than one of the sources of weather data shown; * provide weather data from the upper atmosphere; what happens there has direct effects upon weather on the ground (upper air balloons, aircraft, satellites) * provide weather data from on and over the oceans in places without surface weather stations (ships, aircraft) * provide pictures or images of the weather from above (satellites) and from the ground (radar) * provide detailed regular or continuous data (land stations, radar) Overall having more weather data, from all parts of the world, to feed into computers enables more accurate forecasts to be generated. 1-2 marks Some idea, but stated only in general terms; mention of data sources in the diagram rather than explanation 3-4 marks Good understanding – references made to data sources in the diagram are used to explain along the lines suggested above [4] (g) (i) and (ii) (i) Yes – fewer people might have been killed if people had been evacuated with government planning and organisation No – they could not have stopped that amount of damage no matter how much warning was given; the rains and resulting floods were too big for damage to have been avoided; people used to floods may have been unwilling to leave their homes and farms even after warnings Views/ideas supported by some justification as here (ii) Some governments in developing countries do plan e.g. by building cyclone shelters/emergency places of refuge; they also pay for flood control works especially large- scale ones such as big dams Others show less interest in planning for climatic hazards, especially in rural areas. Some are too poor to make a real difference; other consider that they have more pressing political or economic problems. Some climatic hazards e.g. the flooding in Bangladesh in 2004 are on such a large scale that it there would still have been deaths and damage if it had occurred in a developed countries (even if it might not have been as bad) Mark both parts together 1-2 marks – starter answer; occasional comment that addresses the questions set 3-4 marks – meaningful comment for both parts even if there is some imbalance between the two 5 marks – well answered; references to governments in countries other than Bangladesh would enhance the value of answers to the second part [5] [Question total: 40 marks]
What you needed in this session
Cambridge’s own grade thresholds for 2006 Oct/Nov, Paper 2 · Variant 1. A higher threshold means an easier paper — the bar moves with how the cohort did.