Cambridge IGCSE Environmental Management 0680 — 2006 May/June Paper 2 · Variant 1
0680/21/M/J/06 · 80 marks · ≈90 min
The question paper and its mark scheme, free to read here and free to download. This is Cambridge’s own paper, exactly as it was sat.
Question paper16 pages
Mark scheme7 pages
Answers below. Sit the paper first if you are practising.
Paper as text
Question paper, page 1
This document consists of 15 printed pages and 1 blank page. SP (KN) T01808/4 © UCLES 2006 [Turn over UNIVERSITY OF CAMBRIDGE INTERNATIONAL EXAMINATIONS International General Certificate of Secondary Education ENVIRONMENTAL MANAGEMENT 0680/02 Paper 2 May/June 2006 1 hour 45 minutes Candidates answer on the Question Paper. Additional Materials: Ruler READ THESE INSTRUCTIONS FIRST Write your Centre number, candidate number and name on all the work you hand in. Write in dark blue or black pen. You may use a soft pencil for any diagrams, graphs or rough working. Do not use staples, paper clips, highlighters, glue or correction fluid. Answer both questions. The number of marks is given in brackets [ ] at the end of each question or part question. Centre Number Candidate Number Name For Examiner’s Use 1 2 Total www.XtremePapers.com
Question paper, page 2
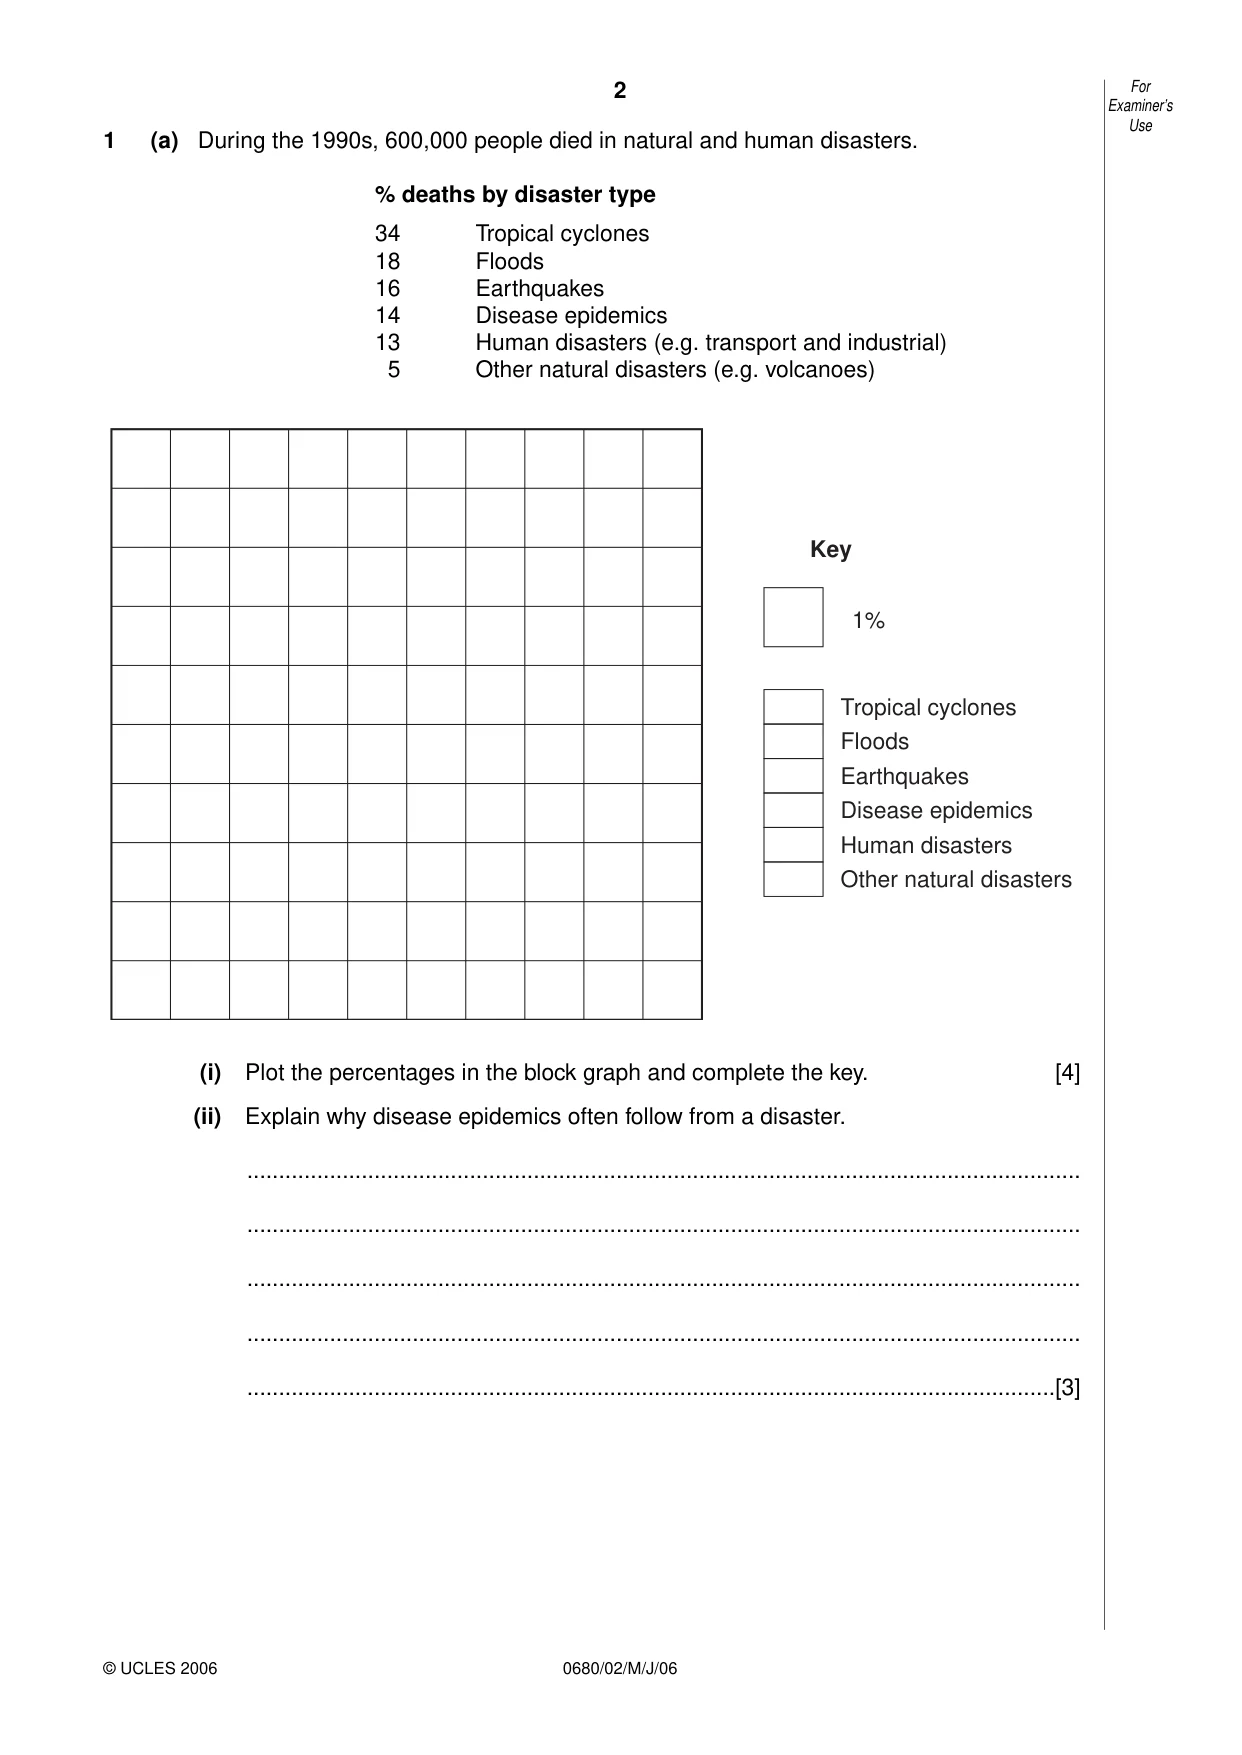
2 0680/02/M/J/06 1 (a) During the 1990s, 600,000 people died in natural and human disasters. % deaths by disaster type 34 Tropical cyclones 18 Floods 16 Earthquakes 14 Disease epidemics 13 Human disasters (e.g. transport and industrial) 5 Other natural disasters (e.g. volcanoes) (i) Plot the percentages in the block graph and complete the key. [4] (ii) Explain why disease epidemics often follow from a disaster. … … … … …[3] For Examiner’s Use © UCLES 2006 Key 1% Tropical cyclones Floods Earthquakes Disease epidemics Human disasters Other natural disasters
Question paper, page 3
3 0680/02/M/J/06 [Turn over (b) (i) What is the difference between an earthquake and a volcano? … … … … …[3] (ii) Why are more people killed by earthquakes than volcanoes? … … … … … …[3] (iii) Name two strategies for preventing loss of life during an earthquake. 1 … 2 …[2] (iv) Why are these strategies usually more effective in developed than in developing countries? … … … … …[3] For Examiner’s Use © UCLES 2006
Question paper, page 4
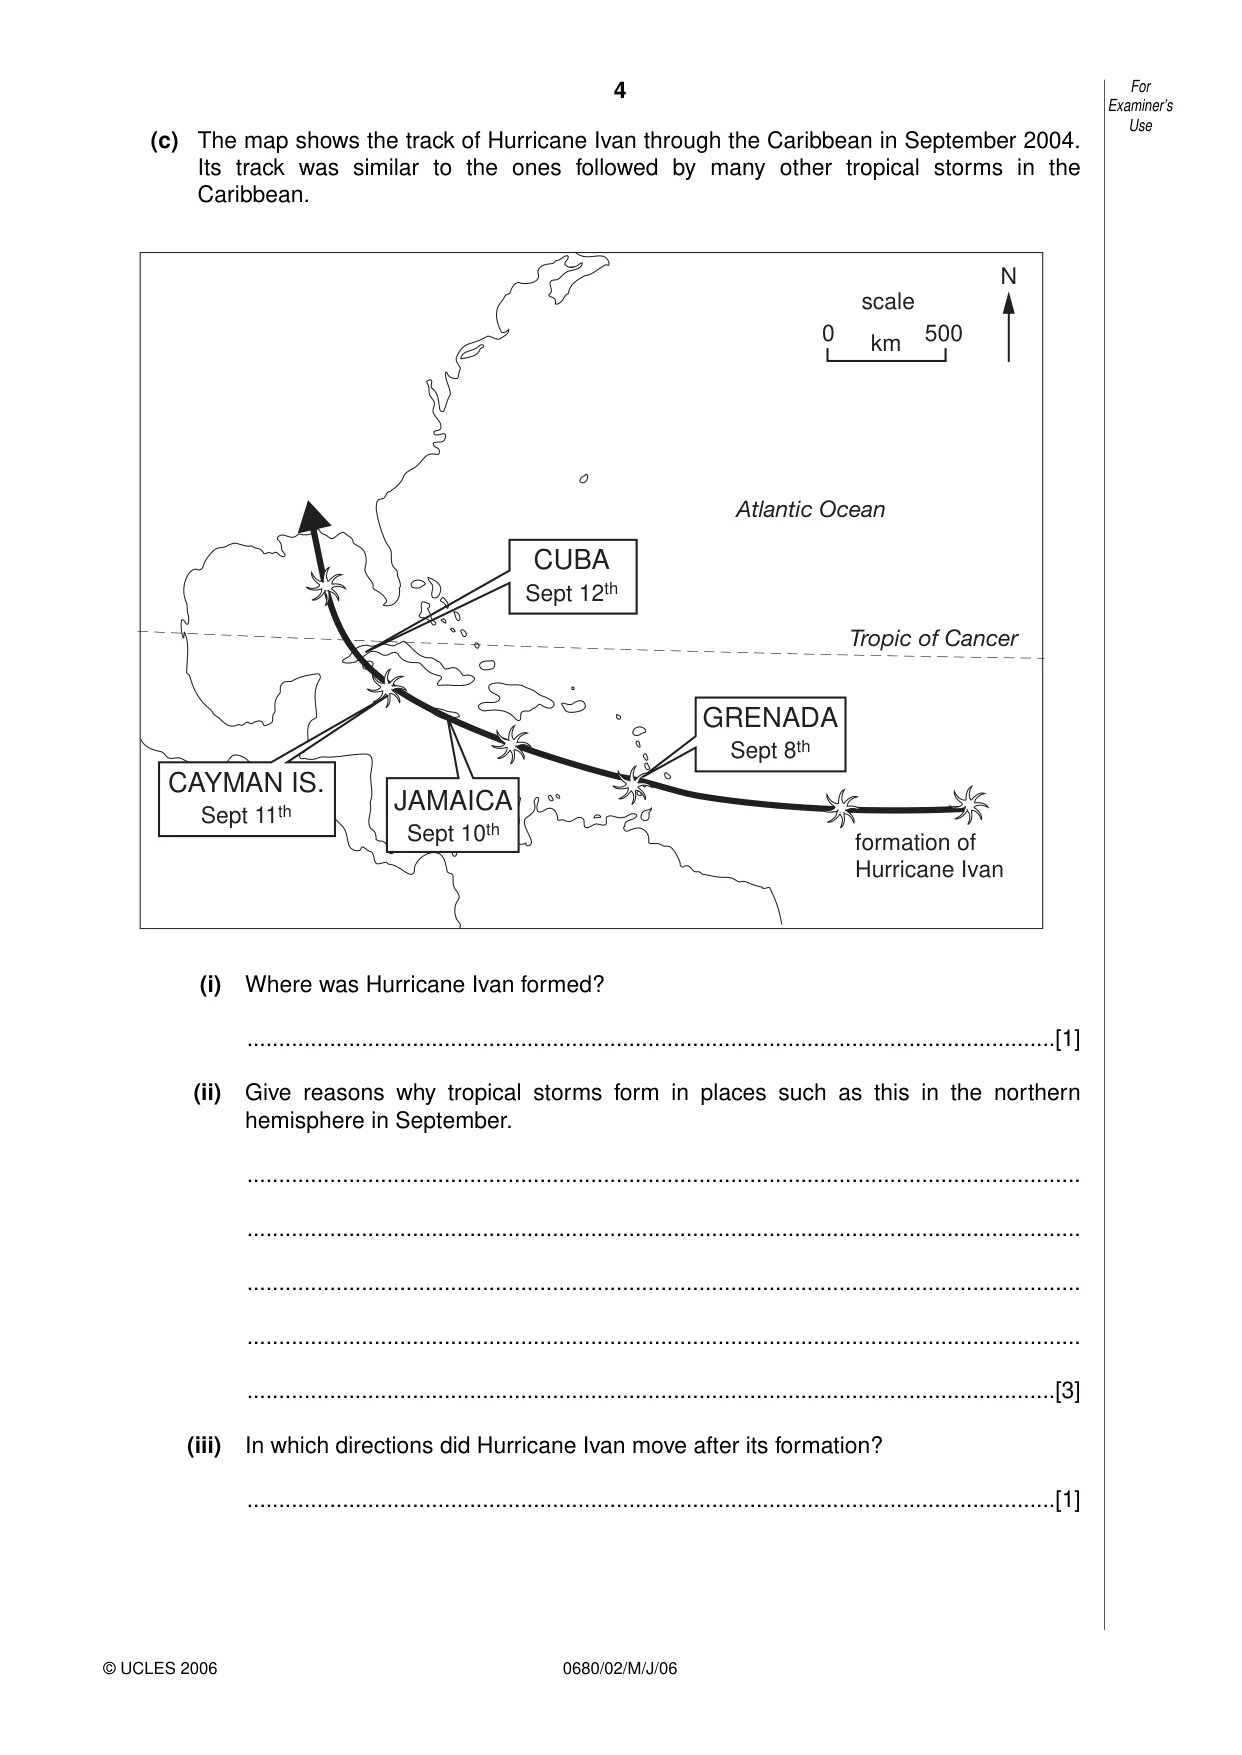
4 0680/02/M/J/06 (c) The map shows the track of Hurricane Ivan through the Caribbean in September 2004. Its track was similar to the ones followed by many other tropical storms in the Caribbean. (i) Where was Hurricane Ivan formed? …[1] (ii) Give reasons why tropical storms form in places such as this in the northern hemisphere in September. … … … … …[3] (iii) In which directions did Hurricane Ivan move after its formation? …[1] CUBA Sept 12th GRENADA Sept 8th CAYMAN IS. Sept 11th JAMAICA Sept 10th Atlantic Ocean Tropic of Cancer formation of Hurricane Ivan 0 500 km N scale For Examiner’s Use © UCLES 2006
Question paper, page 5
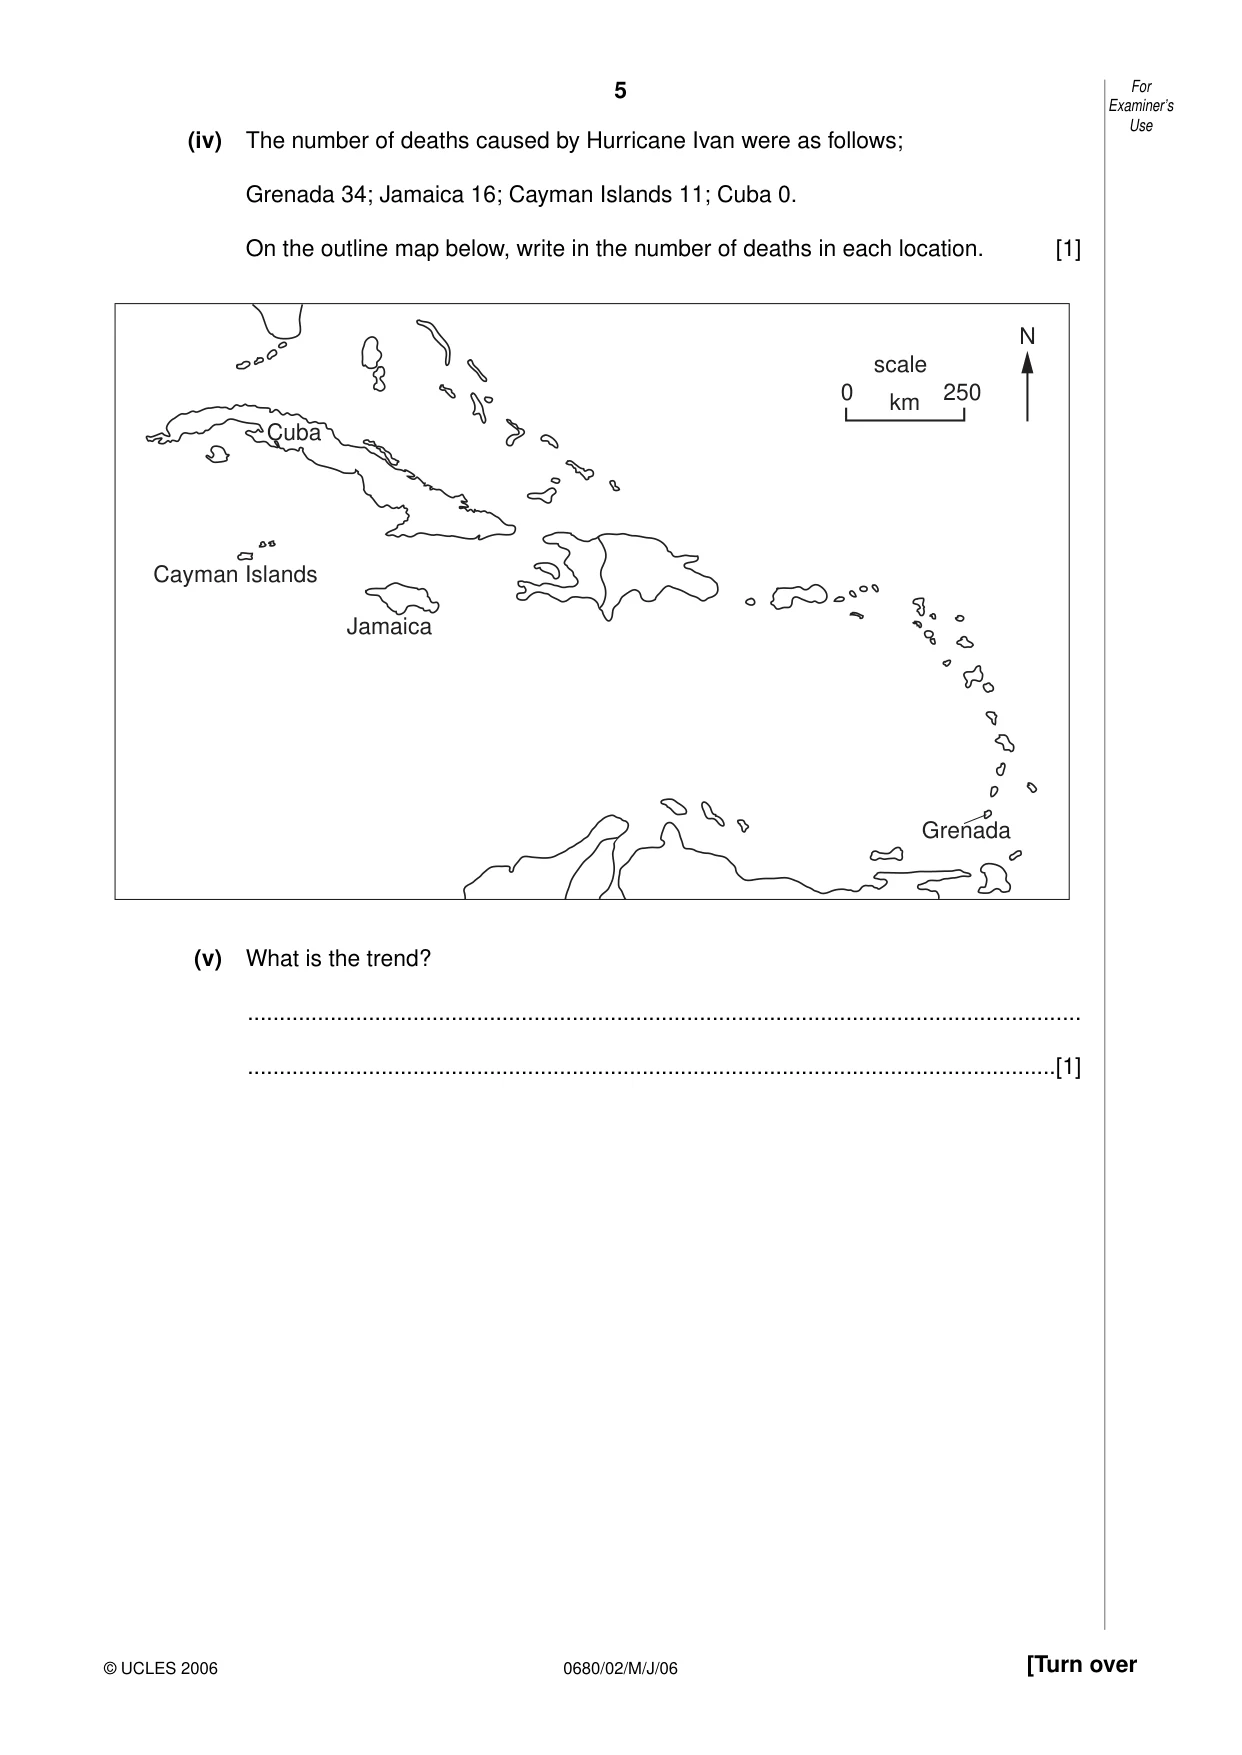
5 0680/02/M/J/06 [Turn over (iv) The number of deaths caused by Hurricane Ivan were as follows; Grenada 34; Jamaica 16; Cayman Islands 11; Cuba 0. On the outline map below, write in the number of deaths in each location. [1] (v) What is the trend? … …[1] For Examiner’s Use © UCLES 2006 Cayman Islands Jamaica Cuba Grenada 0 250 km N scale
Question paper, page 6
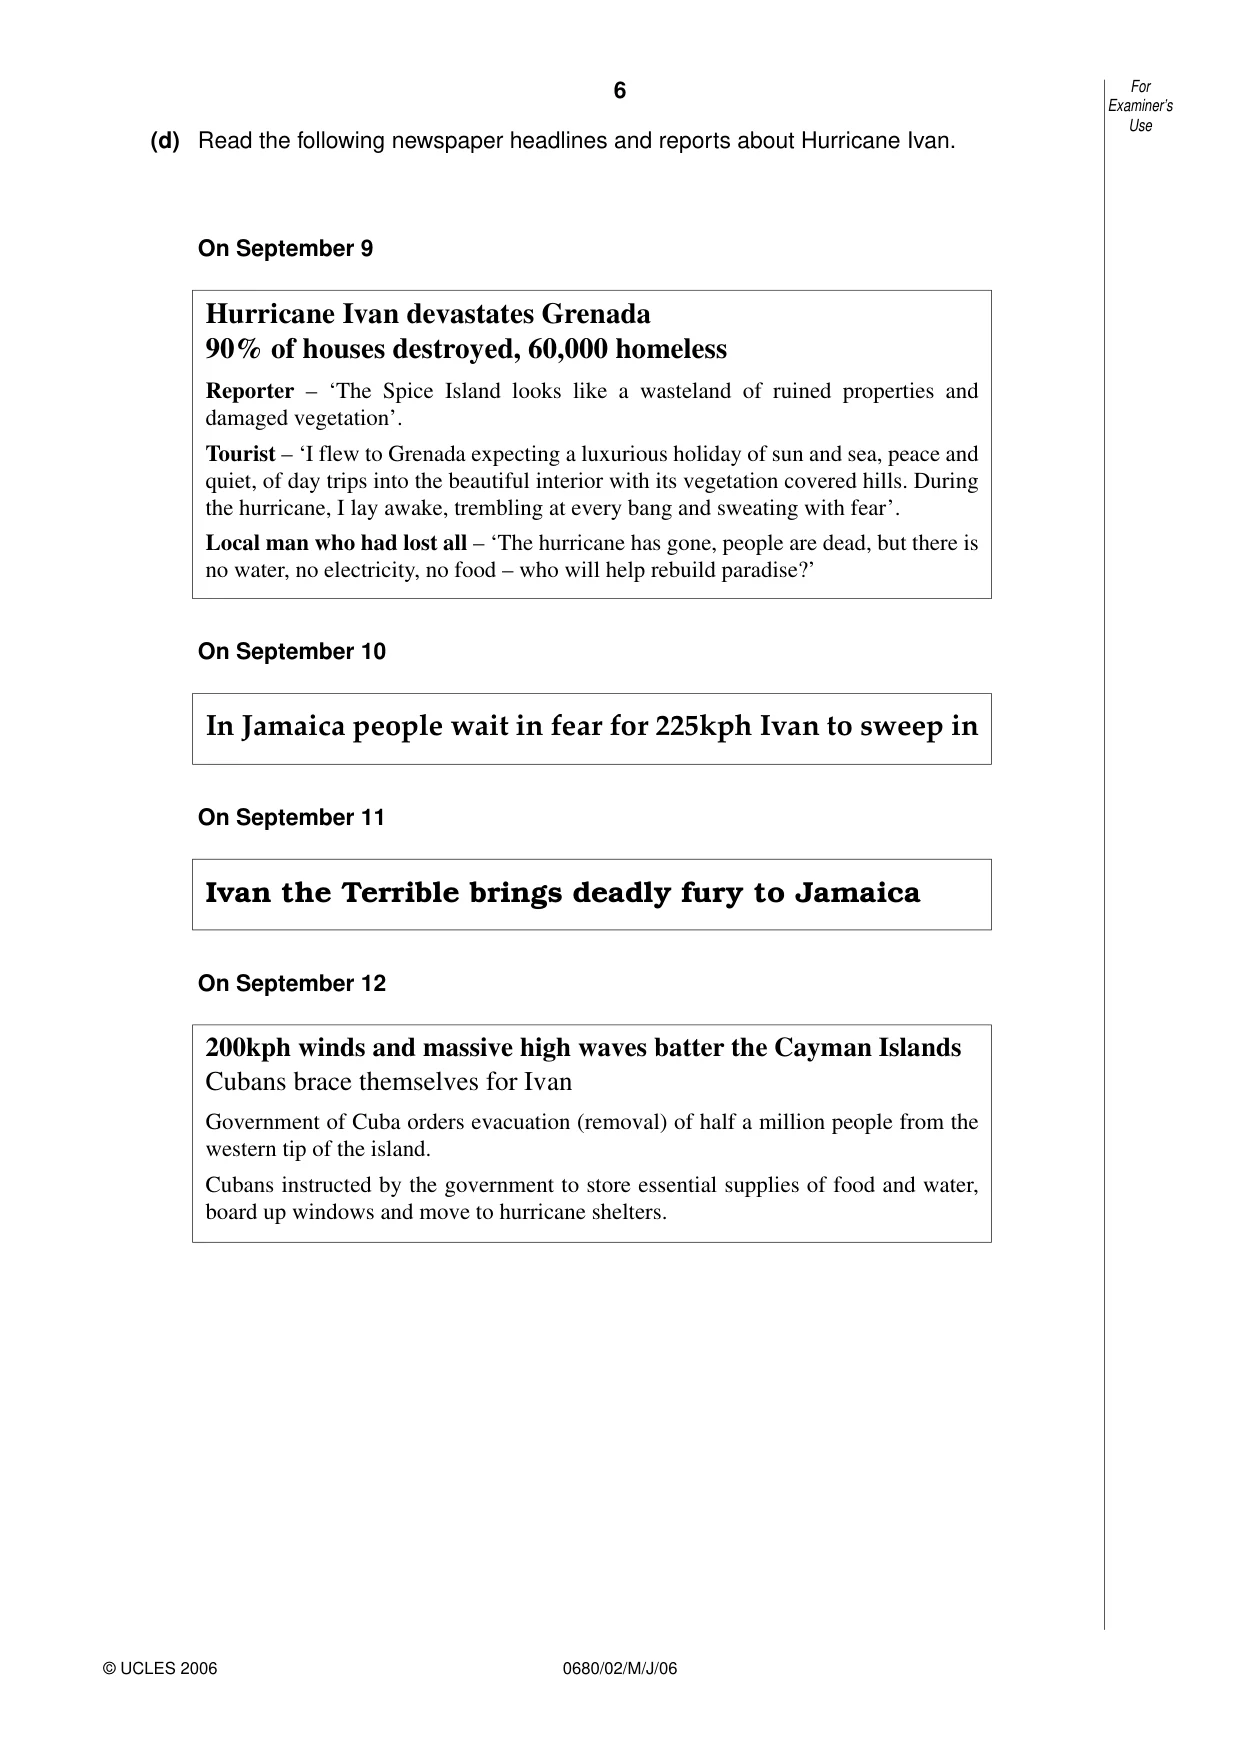
6 0680/02/M/J/06 (d) Read the following newspaper headlines and reports about Hurricane Ivan. On September 9 On September 10 On September 11 On September 12 200kph winds and massive high waves batter the Cayman Islands Cubans brace themselves for Ivan Government of Cuba orders evacuation (removal) of half a million people from the western tip of the island. Cubans instructed by the government to store essential supplies of food and water, board up windows and move to hurricane shelters. Ivan the Terrible brings deadly fury to Jamaica In Jamaica people wait in fear for 225kph Ivan to sweep in Hurricane Ivan devastates Grenada 90% of houses destroyed, 60,000 homeless Reporter – ‘The Spice Island looks like a wasteland of ruined properties and damaged vegetation’. Tourist – ‘I flew to Grenada expecting a luxurious holiday of sun and sea, peace and quiet, of day trips into the beautiful interior with its vegetation covered hills. During the hurricane, I lay awake, trembling at every bang and sweating with fear’. Local man who had lost all – ‘The hurricane has gone, people are dead, but there is no water, no electricity, no food – who will help rebuild paradise?’ For Examiner’s Use © UCLES 2006
Question paper, page 7
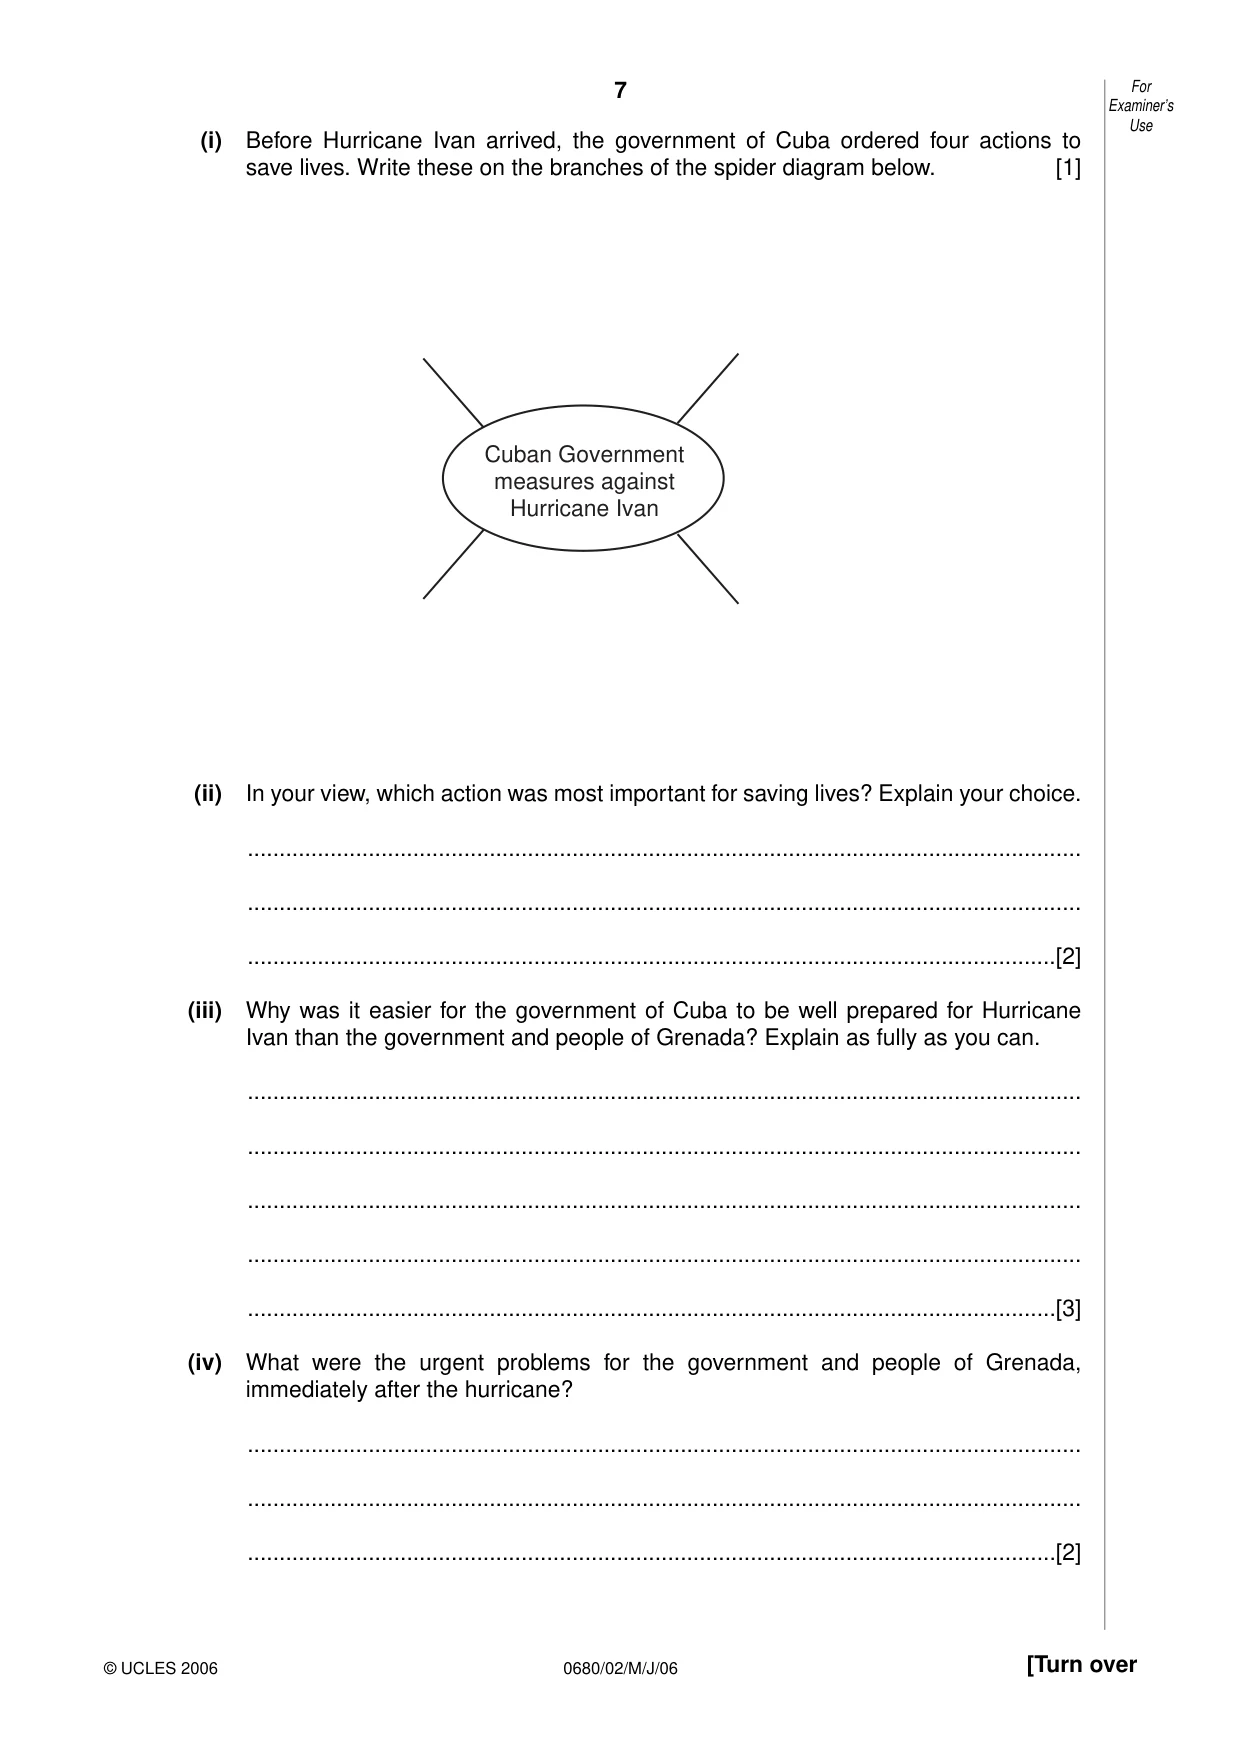
7 0680/02/M/J/06 [Turn over (i) Before Hurricane Ivan arrived, the government of Cuba ordered four actions to save lives. Write these on the branches of the spider diagram below. [1] (ii) In your view, which action was most important for saving lives? Explain your choice. … … …[2] (iii) Why was it easier for the government of Cuba to be well prepared for Hurricane Ivan than the government and people of Grenada? Explain as fully as you can. … … … … …[3] (iv) What were the urgent problems for the government and people of Grenada, immediately after the hurricane? … … …[2] Cuban Government measures against Hurricane Ivan For Examiner’s Use © UCLES 2006
Question paper, page 8
8 0680/02/M/J/06 (v) Describe what was needed to try to overcome these problems. … … …[2] (vi) Before Hurricane Ivan, the main income of Grenada came from the export of crops (mainly spices from bushes and trees) and tourism. How badly will the economy of Grenada be affected over the next two or three years as a result of Hurricane Ivan? State and explain the possibilities. … … … … … … … … … …[5] [Total: 40] For Examiner’s Use © UCLES 2006
Question paper, page 9
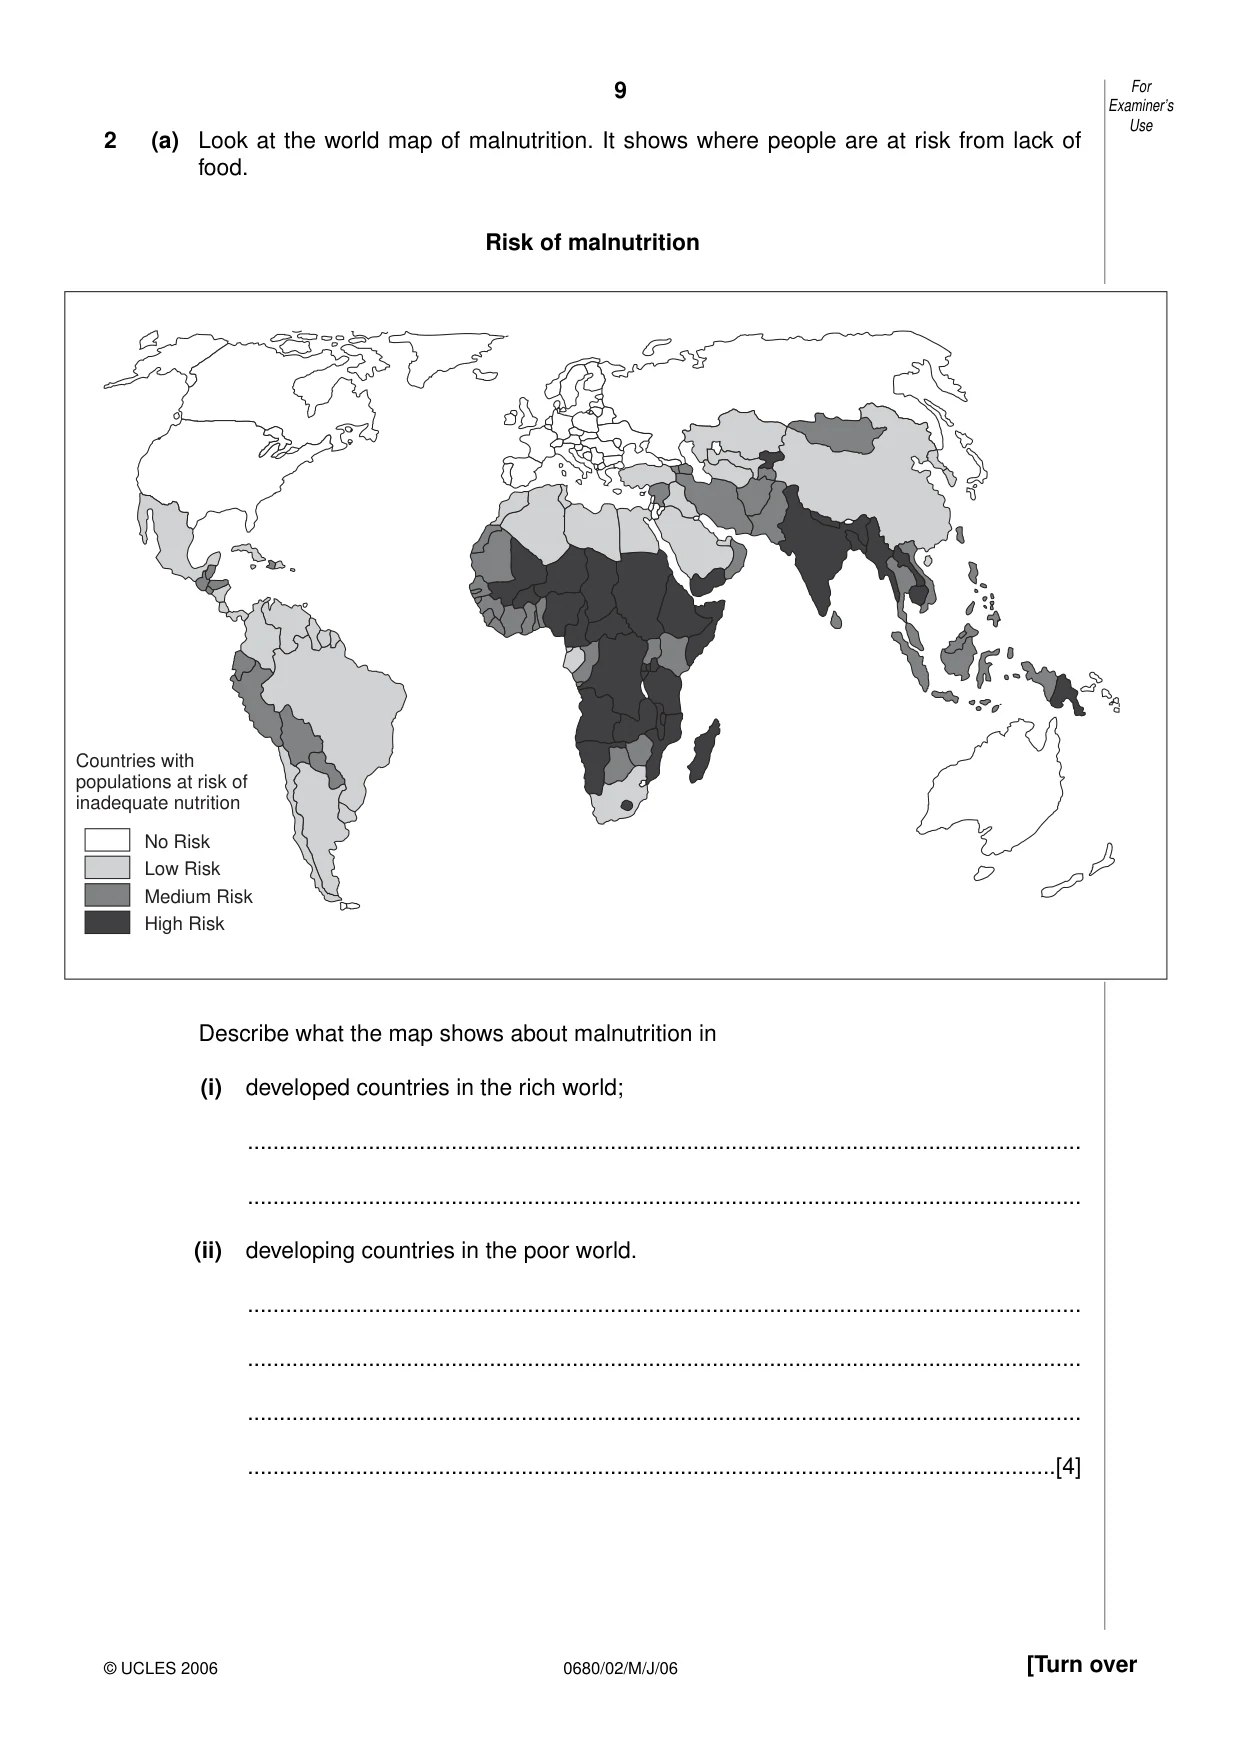
9 0680/02/M/J/06 [Turn over 2 (a) Look at the world map of malnutrition. It shows where people are at risk from lack of food. Risk of malnutrition Describe what the map shows about malnutrition in (i) developed countries in the rich world; … … (ii) developing countries in the poor world. … … … …[4] For Examiner’s Use © UCLES 2006 Countries with populations at risk of inadequate nutrition No Risk Low Risk Medium Risk High Risk
Question paper, page 10
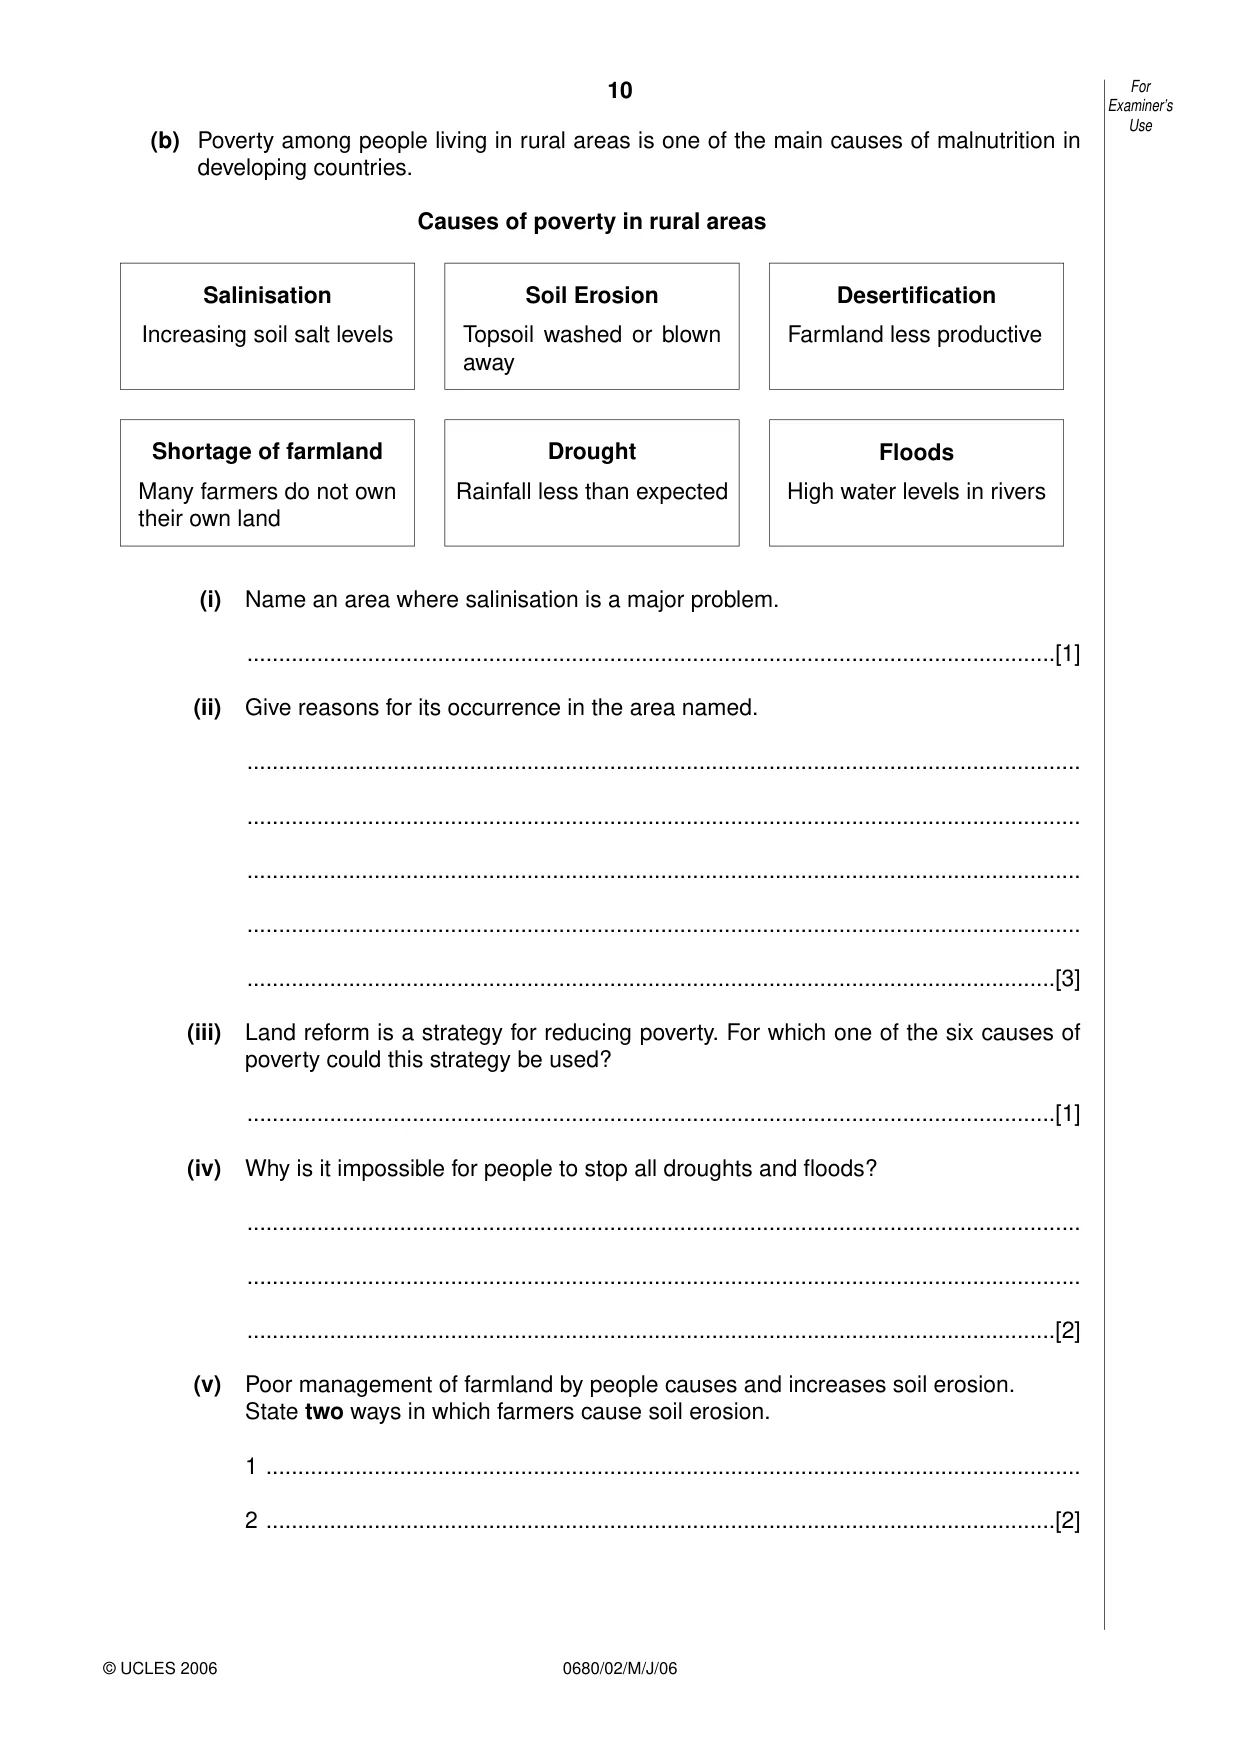
10 0680/02/M/J/06 (b) Poverty among people living in rural areas is one of the main causes of malnutrition in developing countries. Causes of poverty in rural areas (i) Name an area where salinisation is a major problem. …[1] (ii) Give reasons for its occurrence in the area named. … … … … …[3] (iii) Land reform is a strategy for reducing poverty. For which one of the six causes of poverty could this strategy be used? …[1] (iv) Why is it impossible for people to stop all droughts and floods? … … …[2] (v) Poor management of farmland by people causes and increases soil erosion. State two ways in which farmers cause soil erosion. 1 … 2 …[2] Floods High water levels in rivers Drought Rainfall less than expected Shortage of farmland Many farmers do not own their own land Desertification Farmland less productive Soil Erosion Topsoil washed or blown away Salinisation Increasing soil salt levels For Examiner’s Use © UCLES 2006
Question paper, page 11
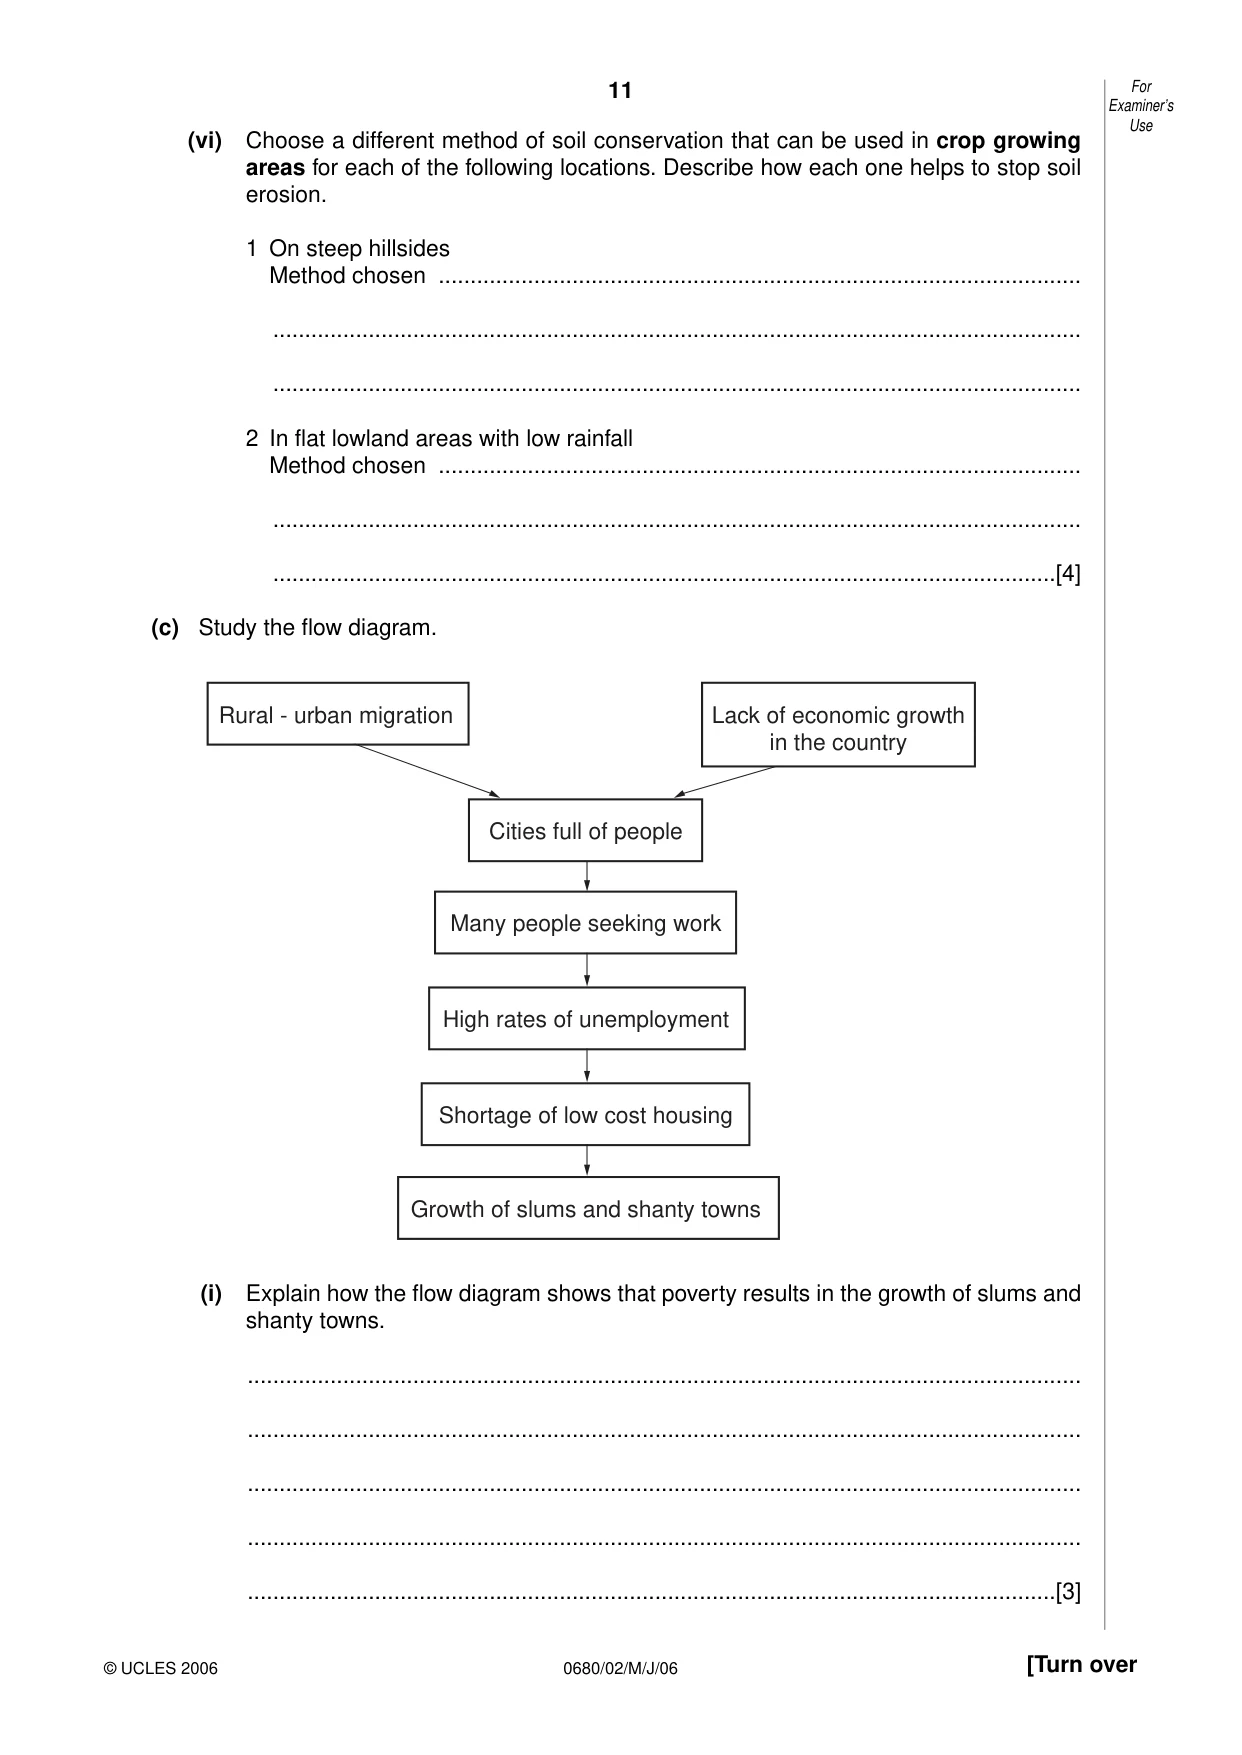
11 0680/02/M/J/06 [Turn over (vi) Choose a different method of soil conservation that can be used in crop growing areas for each of the following locations. Describe how each one helps to stop soil erosion. 1 On steep hillsides Method chosen … … … 2 In flat lowland areas with low rainfall Method chosen … … …[4] (c) Study the flow diagram. (i) Explain how the flow diagram shows that poverty results in the growth of slums and shanty towns. … … … … …[3] Cities full of people Rural - urban migration Lack of economic growth in the country Many people seeking work High rates of unemployment Shortage of low cost housing Growth of slums and shanty towns For Examiner’s Use © UCLES 2006
Question paper, page 12
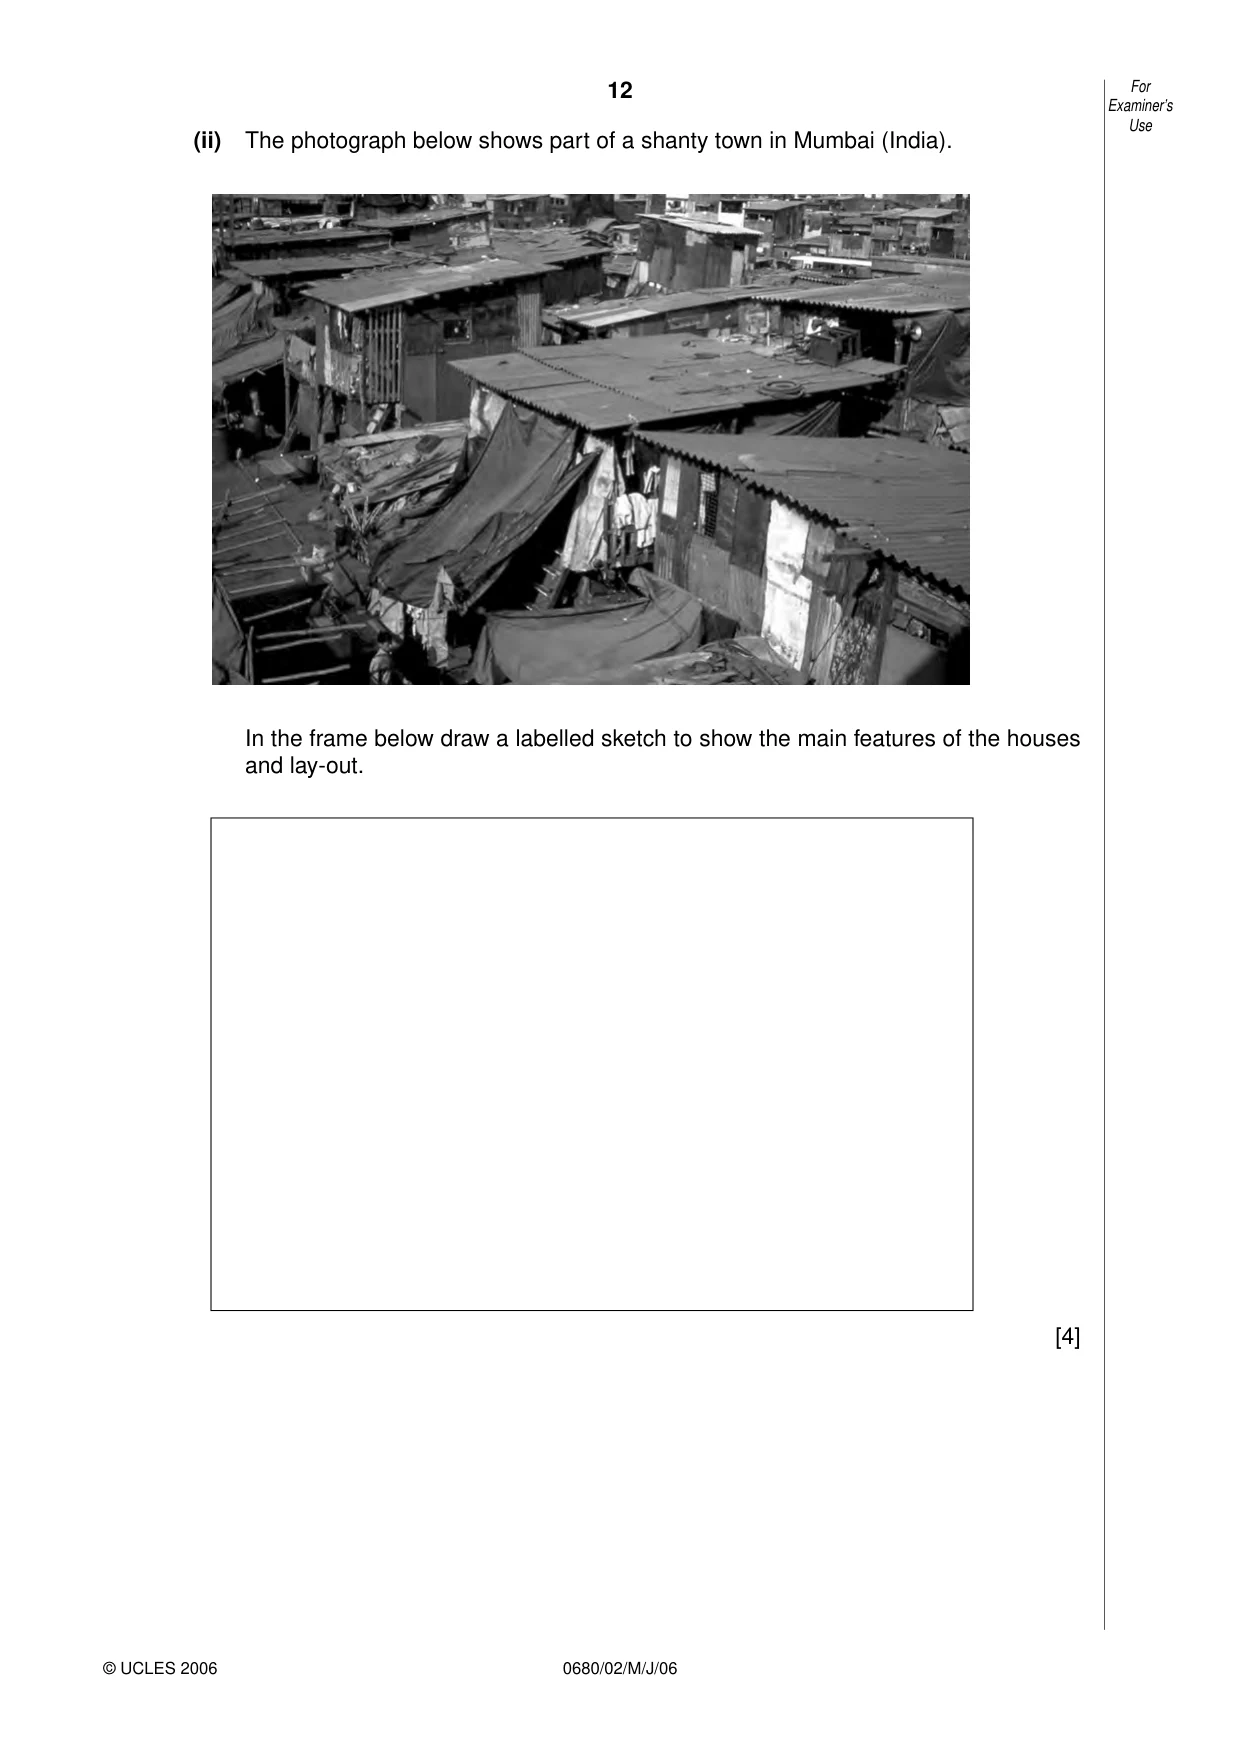
12 0680/02/M/J/06 (ii) The photograph below shows part of a shanty town in Mumbai (India). In the frame below draw a labelled sketch to show the main features of the houses and lay-out. [4] For Examiner’s Use © UCLES 2006
Question paper, page 13
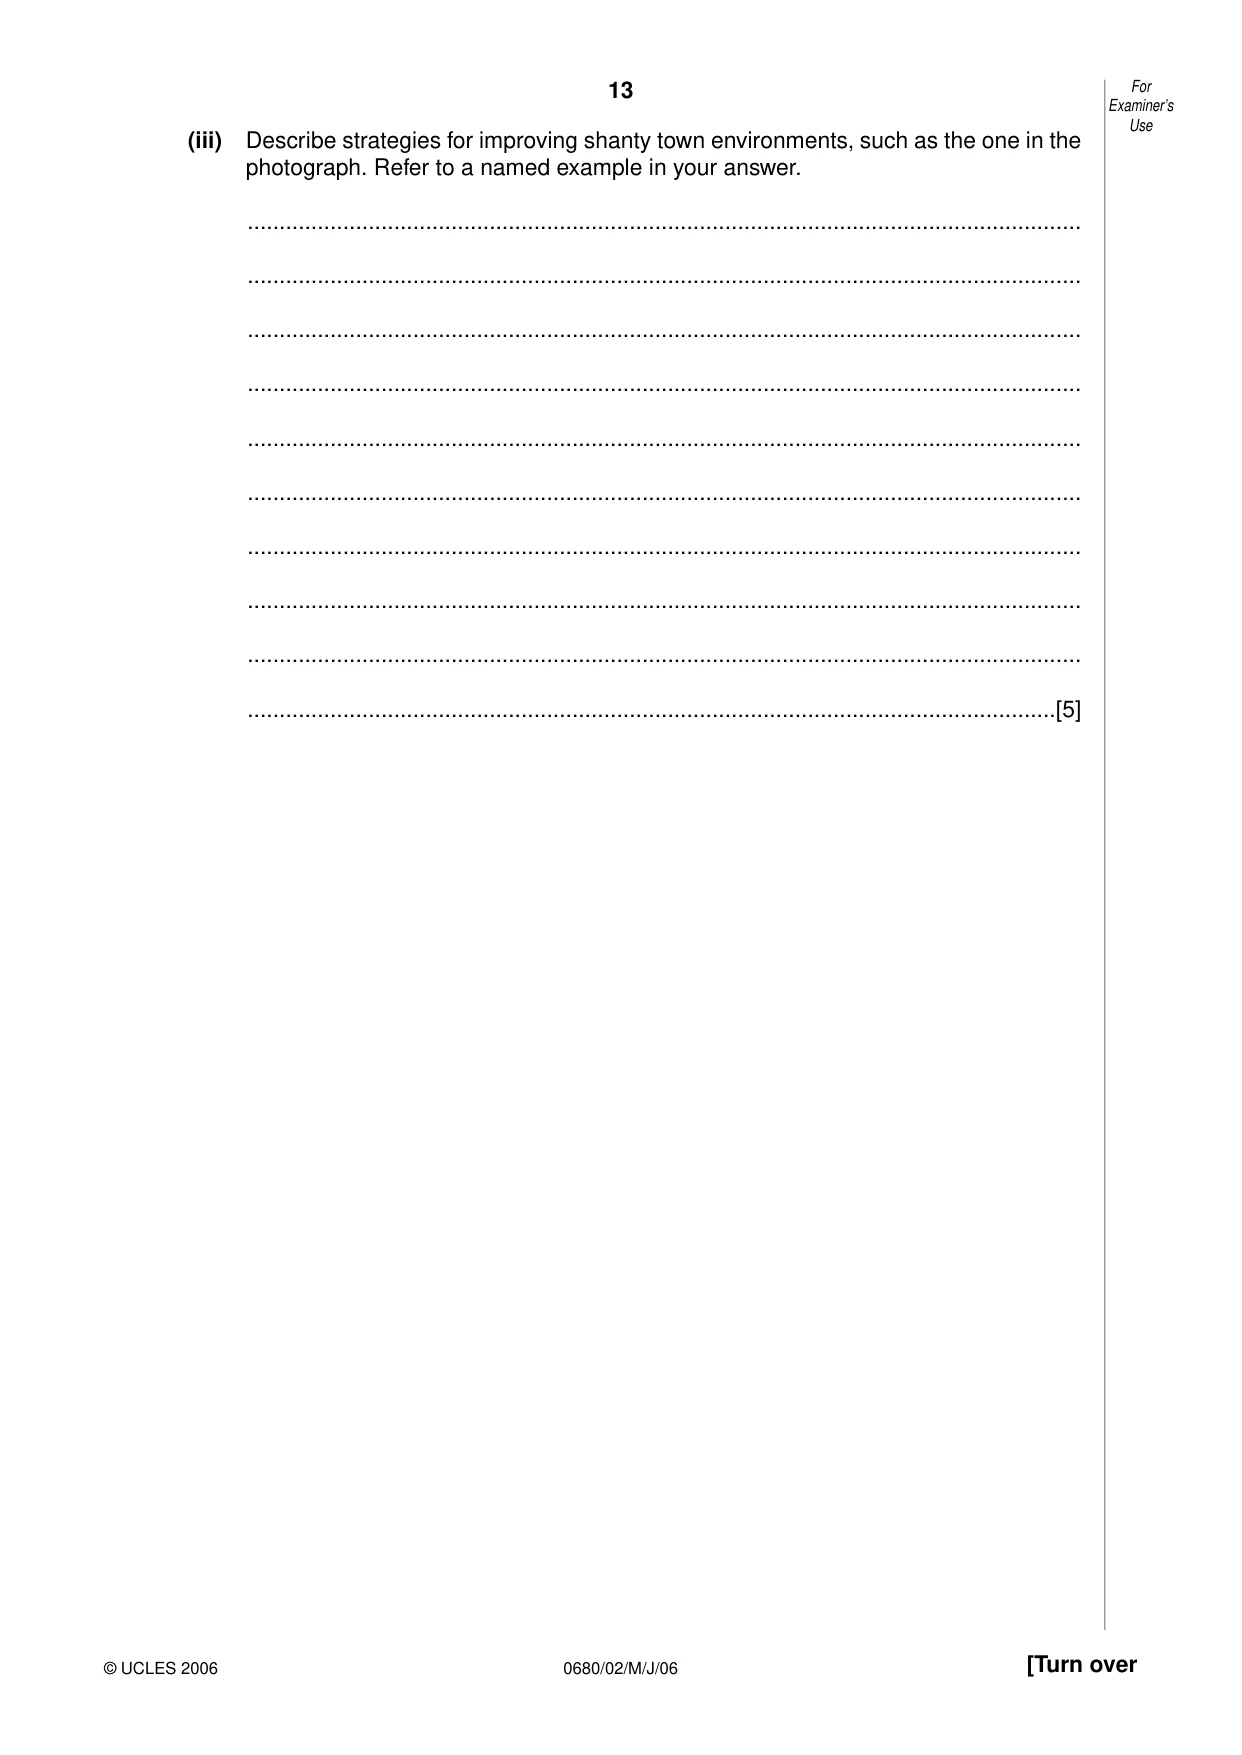
13 0680/02/M/J/06 [Turn over (iii) Describe strategies for improving shanty town environments, such as the one in the photograph. Refer to a named example in your answer. … … … … … … … … … …[5] For Examiner’s Use © UCLES 2006
Question paper, page 14
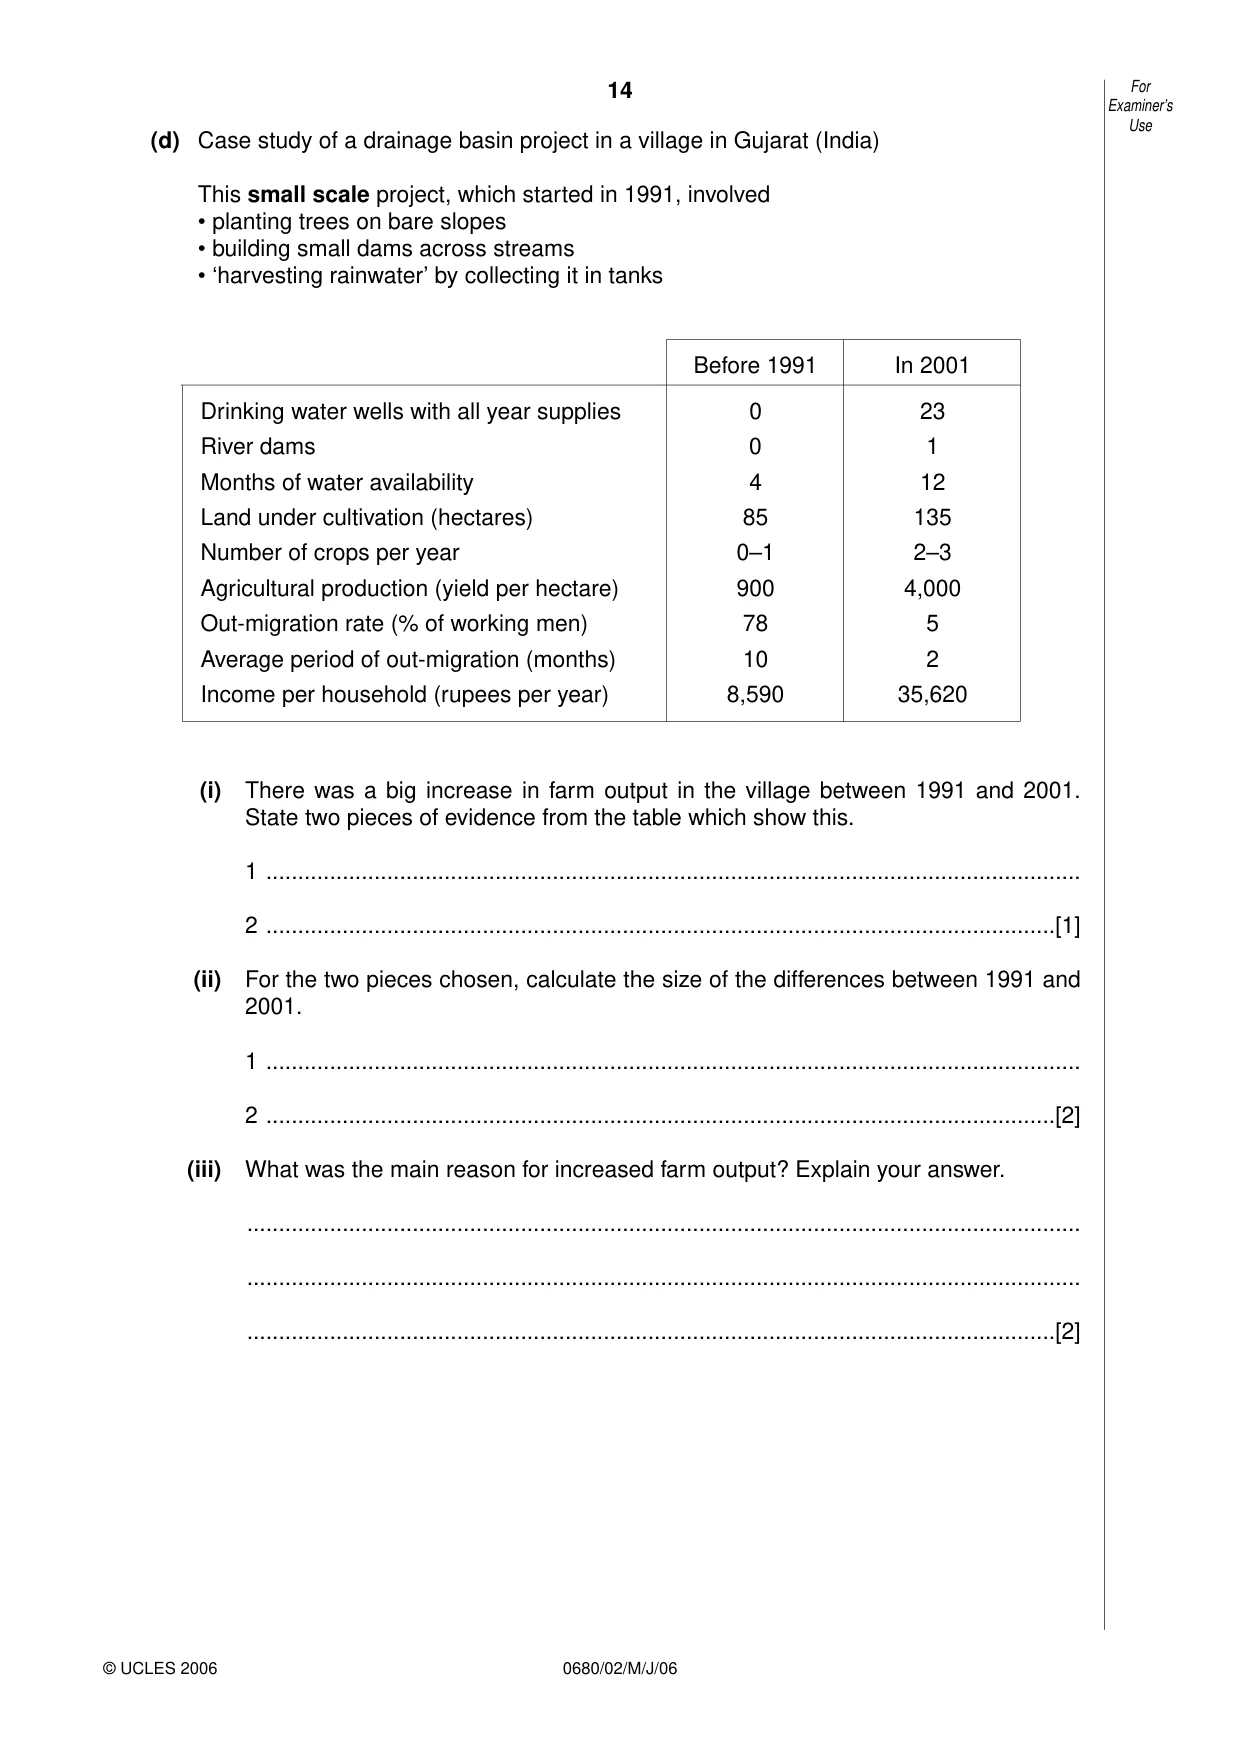
14 0680/02/M/J/06 (d) Case study of a drainage basin project in a village in Gujarat (India) This small scale project, which started in 1991, involved • planting trees on bare slopes • building small dams across streams • ‘harvesting rainwater’ by collecting it in tanks (i) There was a big increase in farm output in the village between 1991 and 2001. State two pieces of evidence from the table which show this. 1 … 2 …[1] (ii) For the two pieces chosen, calculate the size of the differences between 1991 and 2001. 1 … 2 …[2] (iii) What was the main reason for increased farm output? Explain your answer. … … …[2] For Examiner’s Use © UCLES 2006 Before 1991 In 2001 Drinking water wells with all year supplies 0 23 River dams 0 1 Months of water availability 4 12 Land under cultivation (hectares) 85 135 Number of crops per year 0–1 2–3 Agricultural production (yield per hectare) 900 4,000 Out-migration rate (% of working men) 78 5 Average period of out-migration (months) 10 2 Income per household (rupees per year) 8,590 35,620
Question paper, page 15
15 0680/02/M/J/06 (iv) There was a big decrease in out-migration from the village. Explain why, using values from the table to support your answer. … … … … …[3] (v) Does this suggest that improvement in rural areas is a good strategy for reducing problems in big cities? State and explain your views on this. … … … … … …[3] [Total: 40] [Total for paper: 80] For Examiner’s Use
Question paper, page 16
16 0680/02/M/J/06 BLANK PAGE Permission to reproduce items where third-party owned material protected by copyright is included has been sought and cleared where possible. Every reasonable effort has been made by the publisher (UCLES) to trace copyright holders, but if any items requiring clearance have unwittingly been included, the publisher will be pleased to make amends at the earliest possible opportunity. University of Cambridge International Examinations is part of the University of Cambridge Local Examinations Syndicate (UCLES), which is itself a department of the University of Cambridge.
Mark scheme, page 1
UNIVERSITY OF CAMBRIDGE INTERNATIONAL EXAMINATIONS International General Certificate of Secondary Education MARK SCHEME for the May/June 2006 question paper 0680 ENVIRONMENTAL MANAGEMENT 0680/02 Paper 2, maximum raw mark 80 These mark schemes are published as an aid to teachers and students, to indicate the requirements of the examination. They show the basis on which Examiners were initially instructed to award marks. They do not indicate the details of the discussions that took place at an Examiners’ meeting before marking began. Any substantial changes to the mark scheme that arose from these discussions will be recorded in the published Report on the Examination. All Examiners are instructed that alternative correct answers and unexpected approaches in candidates’ scripts must be given marks that fairly reflect the relevant knowledge and skills demonstrated. Mark schemes must be read in conjunction with the question papers and the Report on the Examination. The minimum marks in these components needed for various grades were previously published with these mark schemes, but are now instead included in the Report on the Examination for this session. • CIE will not enter into discussion or correspondence in connection with these mark schemes. CIE is publishing the mark schemes for the May/June 2006 question papers for most IGCSE and GCE Advanced Level and Advanced Subsidiary Level syllabuses and some Ordinary Level syllabuses. www.XtremePapers.com
Mark scheme, page 2
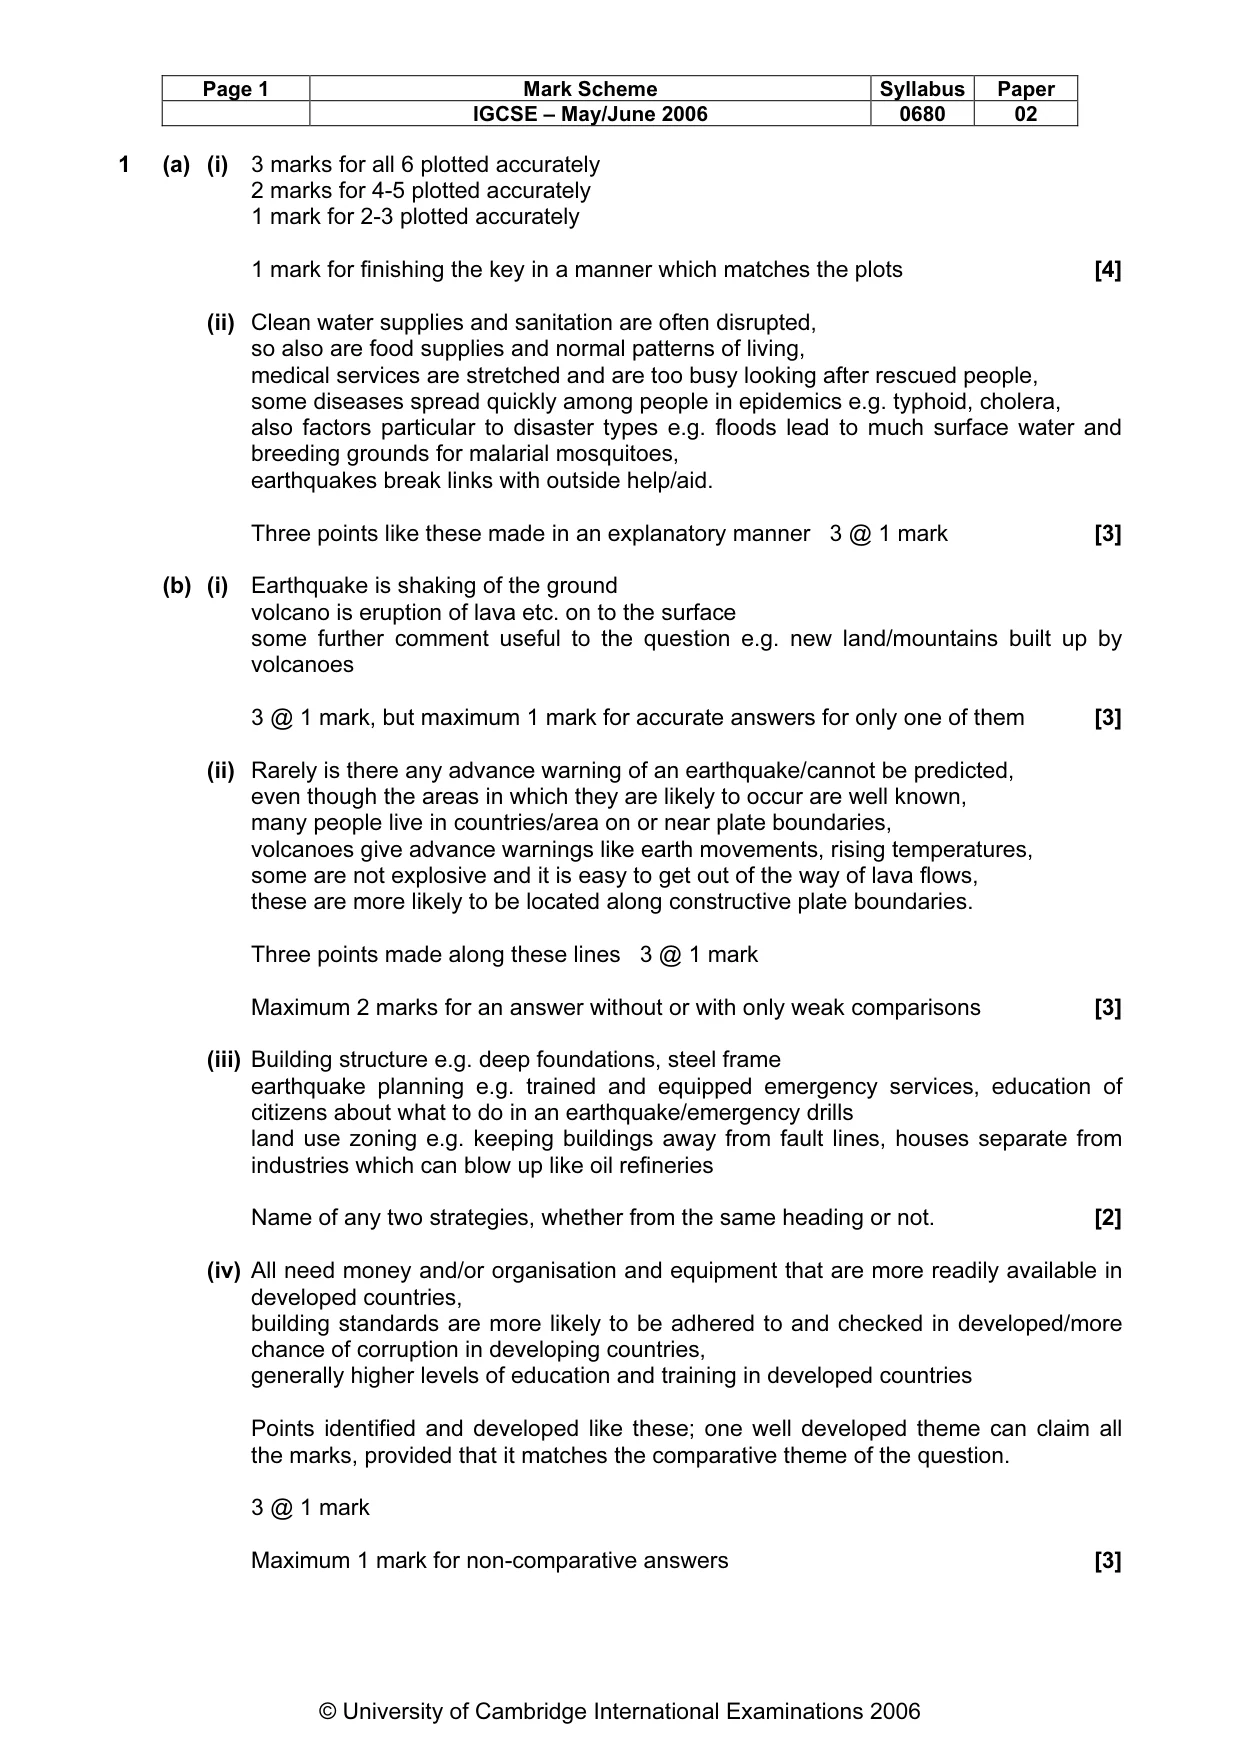
Page 1 Mark Scheme Syllabus Paper IGCSE – May/June 2006 0680 02 © University of Cambridge International Examinations 2006 1 (a) (i) 3 marks for all 6 plotted accurately 2 marks for 4-5 plotted accurately 1 mark for 2-3 plotted accurately 1 mark for finishing the key in a manner which matches the plots [4] (ii) Clean water supplies and sanitation are often disrupted, so also are food supplies and normal patterns of living, medical services are stretched and are too busy looking after rescued people, some diseases spread quickly among people in epidemics e.g. typhoid, cholera, also factors particular to disaster types e.g. floods lead to much surface water and breeding grounds for malarial mosquitoes, earthquakes break links with outside help/aid. Three points like these made in an explanatory manner 3 @ 1 mark [3] (b) (i) Earthquake is shaking of the ground volcano is eruption of lava etc. on to the surface some further comment useful to the question e.g. new land/mountains built up by volcanoes 3 @ 1 mark, but maximum 1 mark for accurate answers for only one of them [3] (ii) Rarely is there any advance warning of an earthquake/cannot be predicted, even though the areas in which they are likely to occur are well known, many people live in countries/area on or near plate boundaries, volcanoes give advance warnings like earth movements, rising temperatures, some are not explosive and it is easy to get out of the way of lava flows, these are more likely to be located along constructive plate boundaries. Three points made along these lines 3 @ 1 mark Maximum 2 marks for an answer without or with only weak comparisons [3] (iii) Building structure e.g. deep foundations, steel frame earthquake planning e.g. trained and equipped emergency services, education of citizens about what to do in an earthquake/emergency drills land use zoning e.g. keeping buildings away from fault lines, houses separate from industries which can blow up like oil refineries Name of any two strategies, whether from the same heading or not. [2] (iv) All need money and/or organisation and equipment that are more readily available in developed countries, building standards are more likely to be adhered to and checked in developed/more chance of corruption in developing countries, generally higher levels of education and training in developed countries Points identified and developed like these; one well developed theme can claim all the marks, provided that it matches the comparative theme of the question. 3 @ 1 mark Maximum 1 mark for non-comparative answers [3]
Mark scheme, page 3
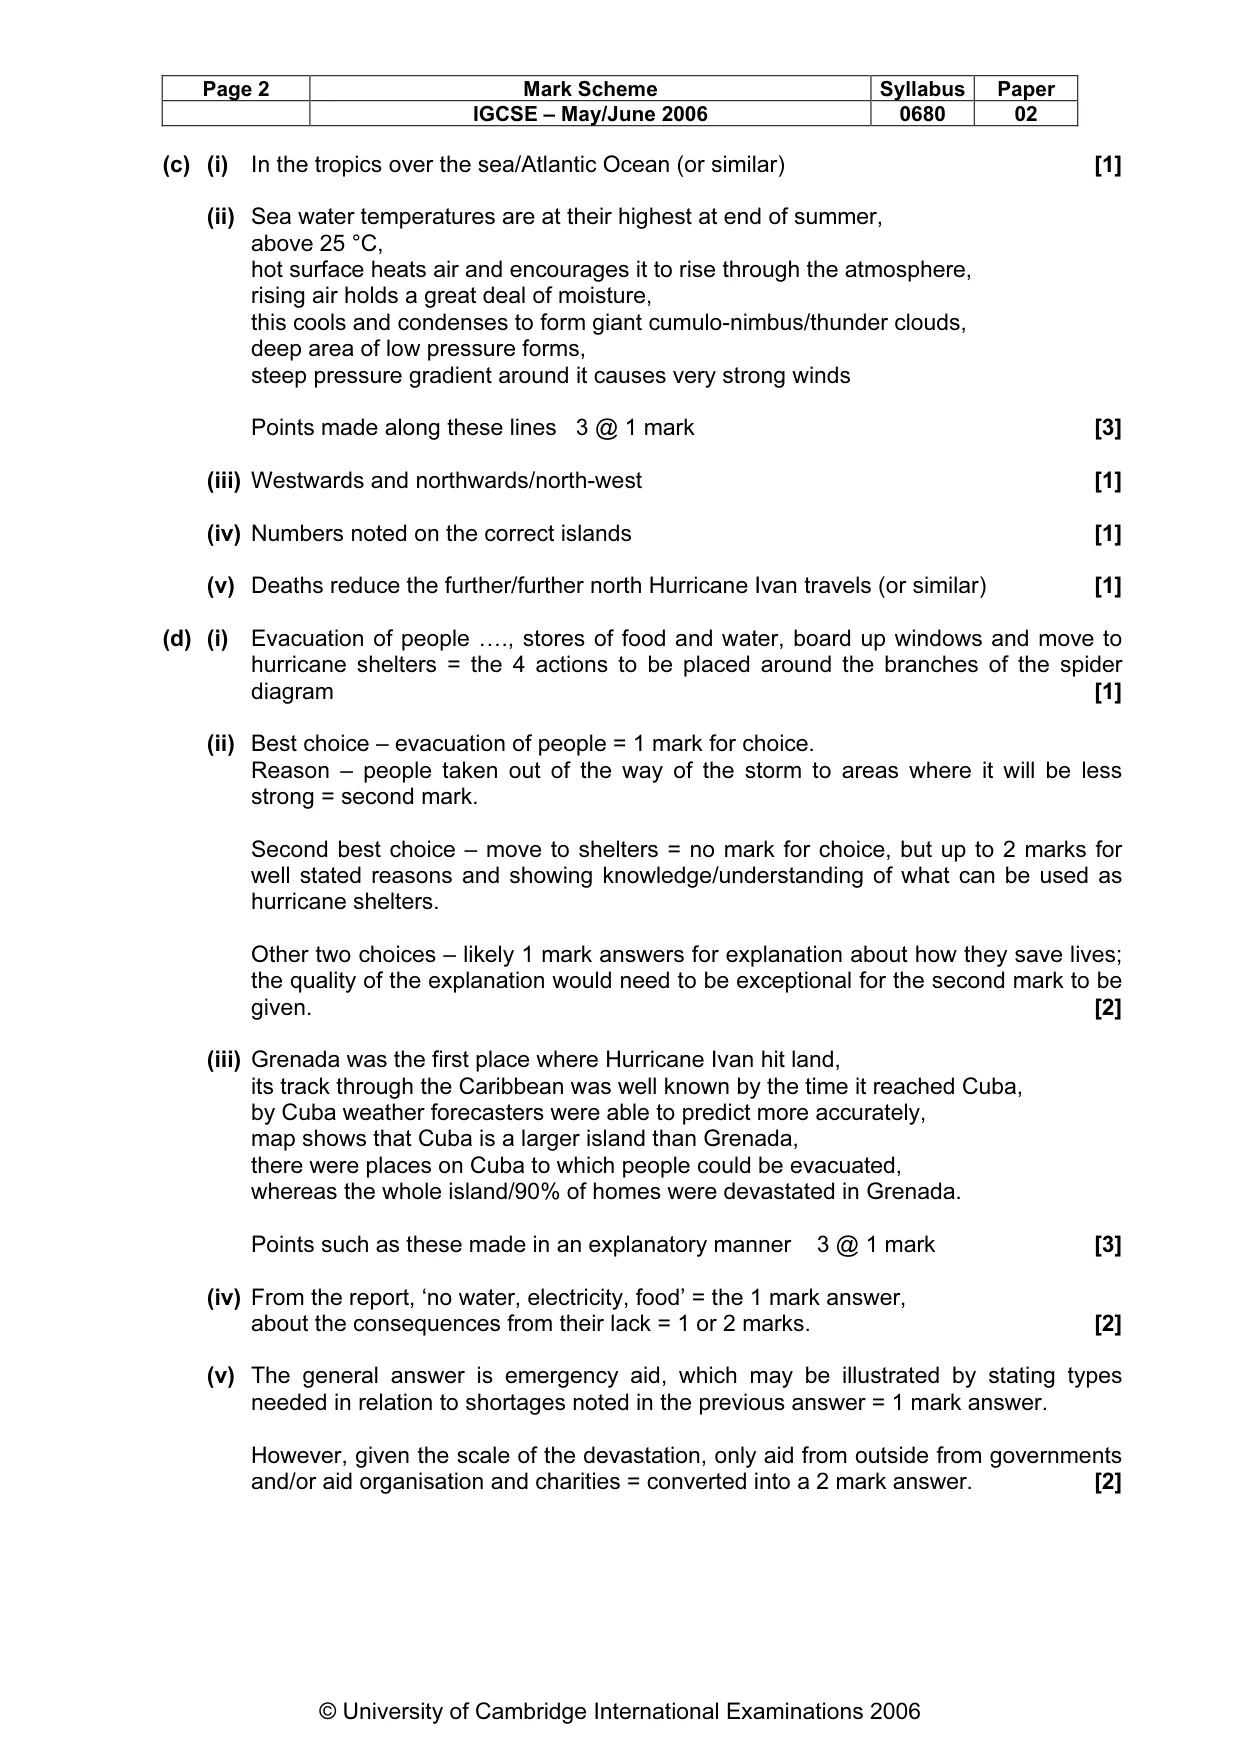
Page 2 Mark Scheme Syllabus Paper IGCSE – May/June 2006 0680 02 © University of Cambridge International Examinations 2006 (c) (i) In the tropics over the sea/Atlantic Ocean (or similar) [1] (ii) Sea water temperatures are at their highest at end of summer, above 25 °C, hot surface heats air and encourages it to rise through the atmosphere, rising air holds a great deal of moisture, this cools and condenses to form giant cumulo-nimbus/thunder clouds, deep area of low pressure forms, steep pressure gradient around it causes very strong winds Points made along these lines 3 @ 1 mark [3] (iii) Westwards and northwards/north-west [1] (iv) Numbers noted on the correct islands [1] (v) Deaths reduce the further/further north Hurricane Ivan travels (or similar) [1] (d) (i) Evacuation of people …., stores of food and water, board up windows and move to hurricane shelters = the 4 actions to be placed around the branches of the spider diagram [1] (ii) Best choice – evacuation of people = 1 mark for choice. Reason – people taken out of the way of the storm to areas where it will be less strong = second mark. Second best choice – move to shelters = no mark for choice, but up to 2 marks for well stated reasons and showing knowledge/understanding of what can be used as hurricane shelters. Other two choices – likely 1 mark answers for explanation about how they save lives; the quality of the explanation would need to be exceptional for the second mark to be given. [2] (iii) Grenada was the first place where Hurricane Ivan hit land, its track through the Caribbean was well known by the time it reached Cuba, by Cuba weather forecasters were able to predict more accurately, map shows that Cuba is a larger island than Grenada, there were places on Cuba to which people could be evacuated, whereas the whole island/90% of homes were devastated in Grenada. Points such as these made in an explanatory manner 3 @ 1 mark [3] (iv) From the report, ‘no water, electricity, food’ = the 1 mark answer, about the consequences from their lack = 1 or 2 marks. [2] (v) The general answer is emergency aid, which may be illustrated by stating types needed in relation to shortages noted in the previous answer = 1 mark answer. However, given the scale of the devastation, only aid from outside from governments and/or aid organisation and charities = converted into a 2 mark answer. [2]
Mark scheme, page 4
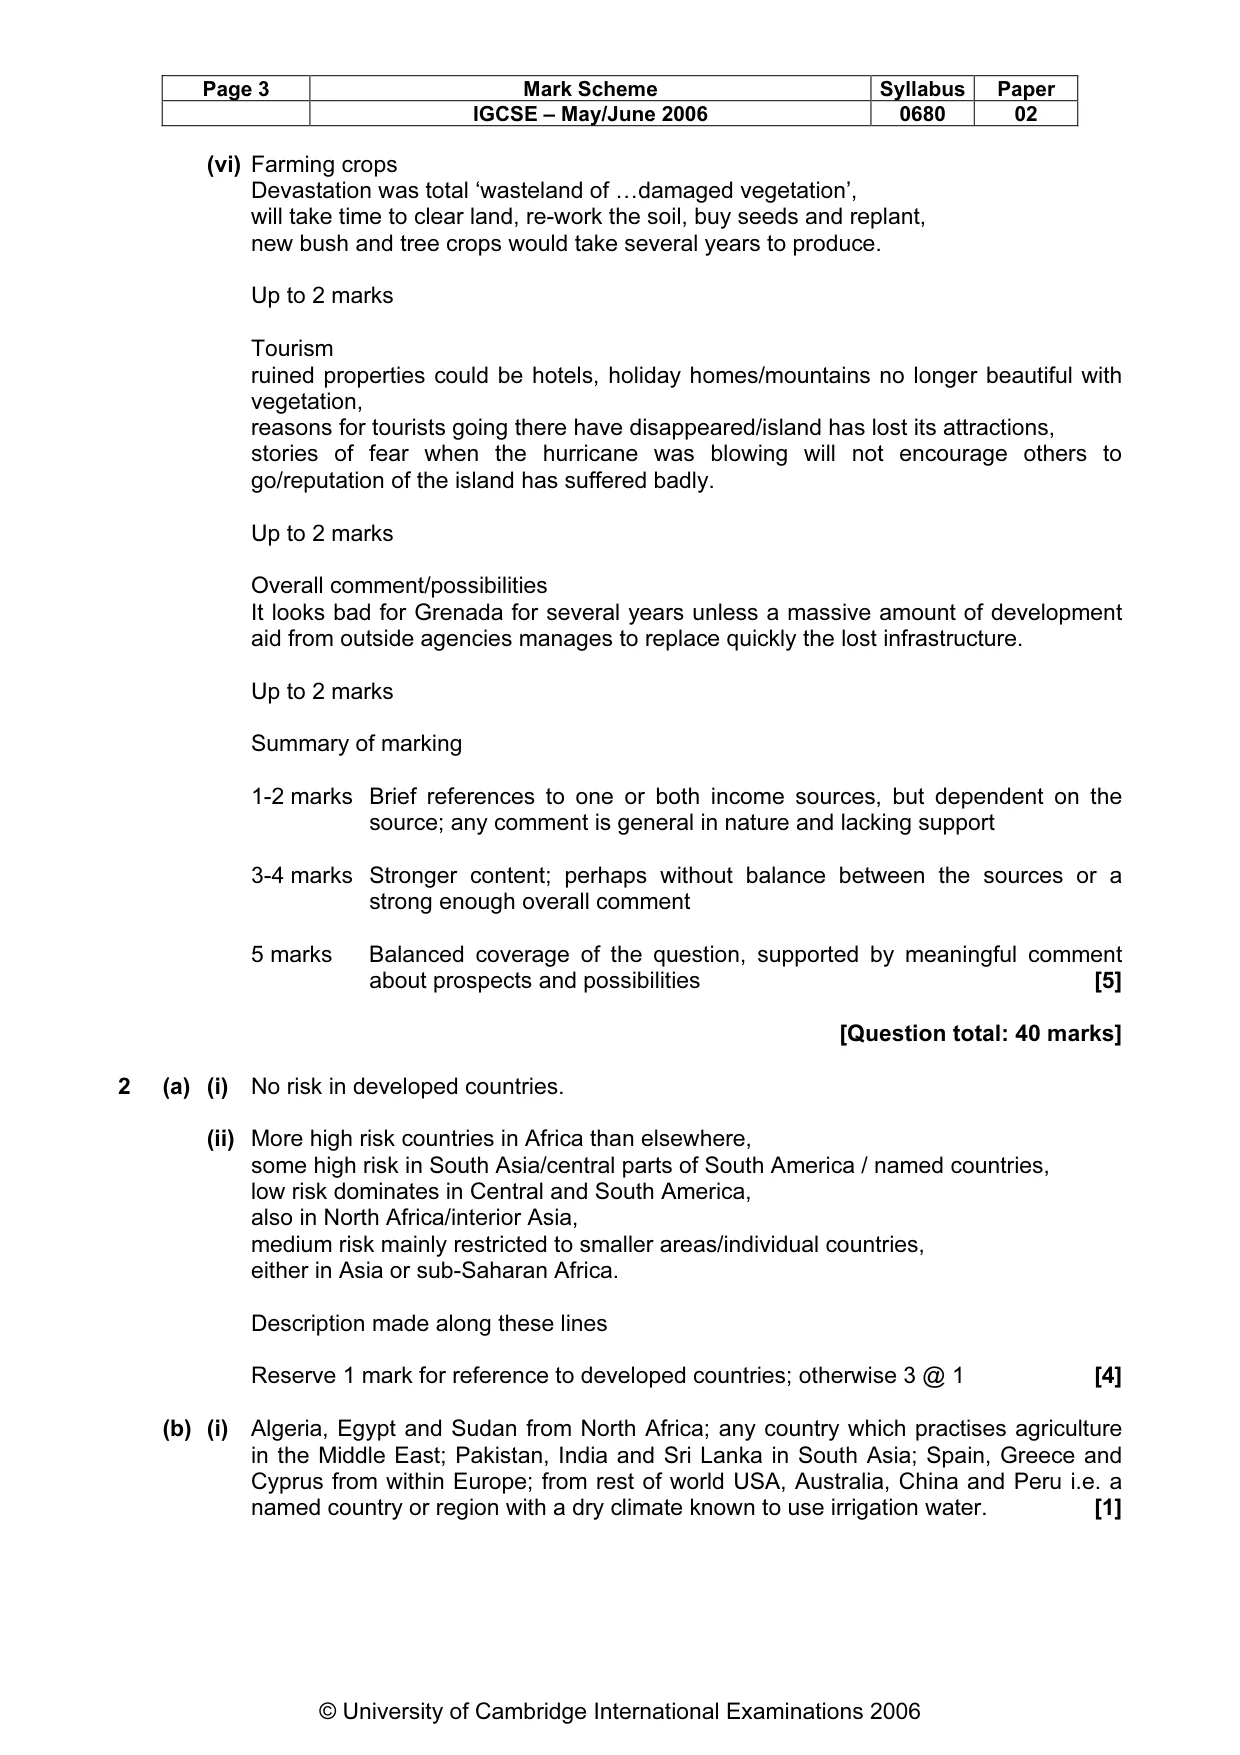
Page 3 Mark Scheme Syllabus Paper IGCSE – May/June 2006 0680 02 © University of Cambridge International Examinations 2006 (vi) Farming crops Devastation was total ‘wasteland of …damaged vegetation’, will take time to clear land, re-work the soil, buy seeds and replant, new bush and tree crops would take several years to produce. Up to 2 marks Tourism ruined properties could be hotels, holiday homes/mountains no longer beautiful with vegetation, reasons for tourists going there have disappeared/island has lost its attractions, stories of fear when the hurricane was blowing will not encourage others to go/reputation of the island has suffered badly. Up to 2 marks Overall comment/possibilities It looks bad for Grenada for several years unless a massive amount of development aid from outside agencies manages to replace quickly the lost infrastructure. Up to 2 marks Summary of marking 1-2 marks Brief references to one or both income sources, but dependent on the source; any comment is general in nature and lacking support 3-4 marks Stronger content; perhaps without balance between the sources or a strong enough overall comment 5 marks Balanced coverage of the question, supported by meaningful comment about prospects and possibilities [5] [Question total: 40 marks] 2 (a) (i) No risk in developed countries. (ii) More high risk countries in Africa than elsewhere, some high risk in South Asia/central parts of South America / named countries, low risk dominates in Central and South America, also in North Africa/interior Asia, medium risk mainly restricted to smaller areas/individual countries, either in Asia or sub-Saharan Africa. Description made along these lines Reserve 1 mark for reference to developed countries; otherwise 3 @ 1 [4] (b) (i) Algeria, Egypt and Sudan from North Africa; any country which practises agriculture in the Middle East; Pakistan, India and Sri Lanka in South Asia; Spain, Greece and Cyprus from within Europe; from rest of world USA, Australia, China and Peru i.e. a named country or region with a dry climate known to use irrigation water. [1]
Mark scheme, page 5
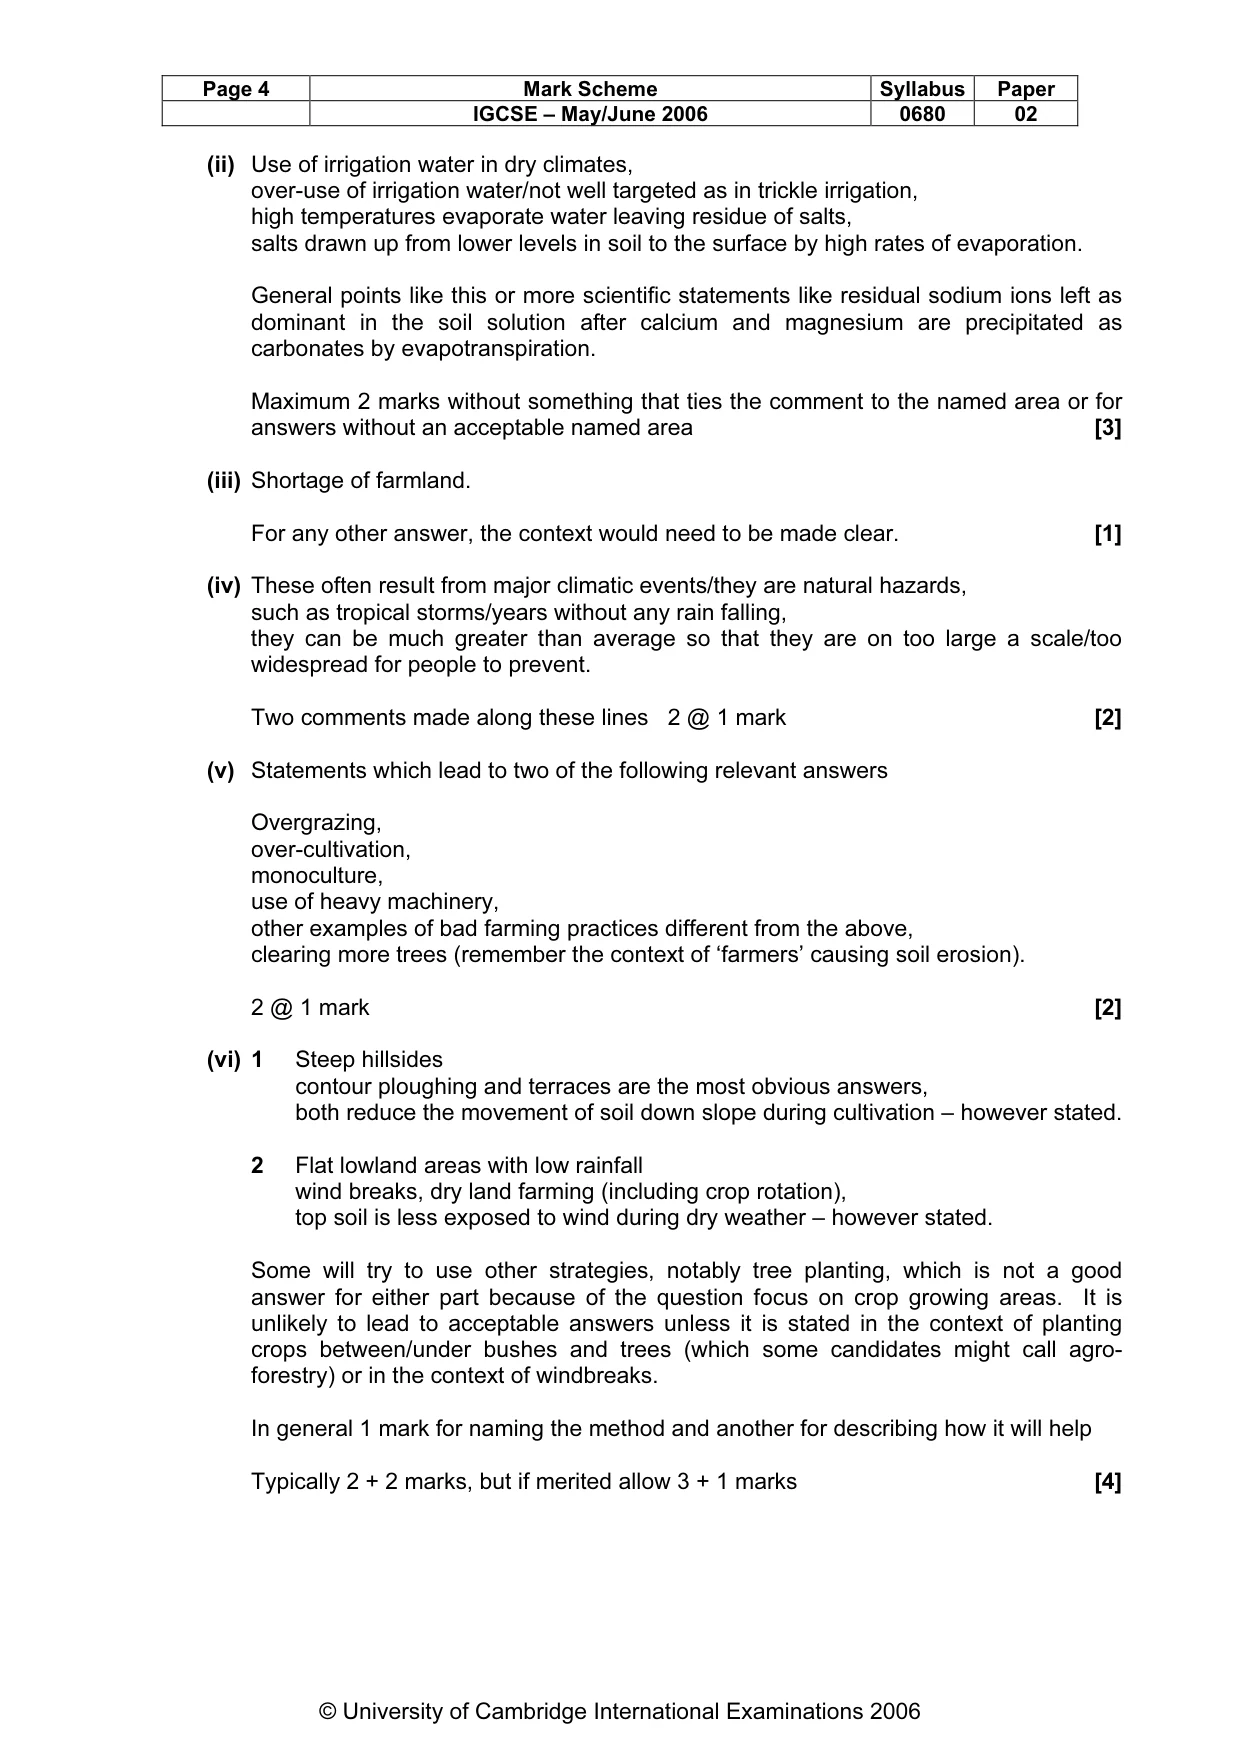
Page 4 Mark Scheme Syllabus Paper IGCSE – May/June 2006 0680 02 © University of Cambridge International Examinations 2006 (ii) Use of irrigation water in dry climates, over-use of irrigation water/not well targeted as in trickle irrigation, high temperatures evaporate water leaving residue of salts, salts drawn up from lower levels in soil to the surface by high rates of evaporation. General points like this or more scientific statements like residual sodium ions left as dominant in the soil solution after calcium and magnesium are precipitated as carbonates by evapotranspiration. Maximum 2 marks without something that ties the comment to the named area or for answers without an acceptable named area [3] (iii) Shortage of farmland. For any other answer, the context would need to be made clear. [1] (iv) These often result from major climatic events/they are natural hazards, such as tropical storms/years without any rain falling, they can be much greater than average so that they are on too large a scale/too widespread for people to prevent. Two comments made along these lines 2 @ 1 mark [2] (v) Statements which lead to two of the following relevant answers Overgrazing, over-cultivation, monoculture, use of heavy machinery, other examples of bad farming practices different from the above, clearing more trees (remember the context of ‘farmers’ causing soil erosion). 2 @ 1 mark [2] (vi) 1 Steep hillsides contour ploughing and terraces are the most obvious answers, both reduce the movement of soil down slope during cultivation – however stated. 2 Flat lowland areas with low rainfall wind breaks, dry land farming (including crop rotation), top soil is less exposed to wind during dry weather – however stated. Some will try to use other strategies, notably tree planting, which is not a good answer for either part because of the question focus on crop growing areas. It is unlikely to lead to acceptable answers unless it is stated in the context of planting crops between/under bushes and trees (which some candidates might call agro- forestry) or in the context of windbreaks. In general 1 mark for naming the method and another for describing how it will help Typically 2 + 2 marks, but if merited allow 3 + 1 marks [4]
Mark scheme, page 6
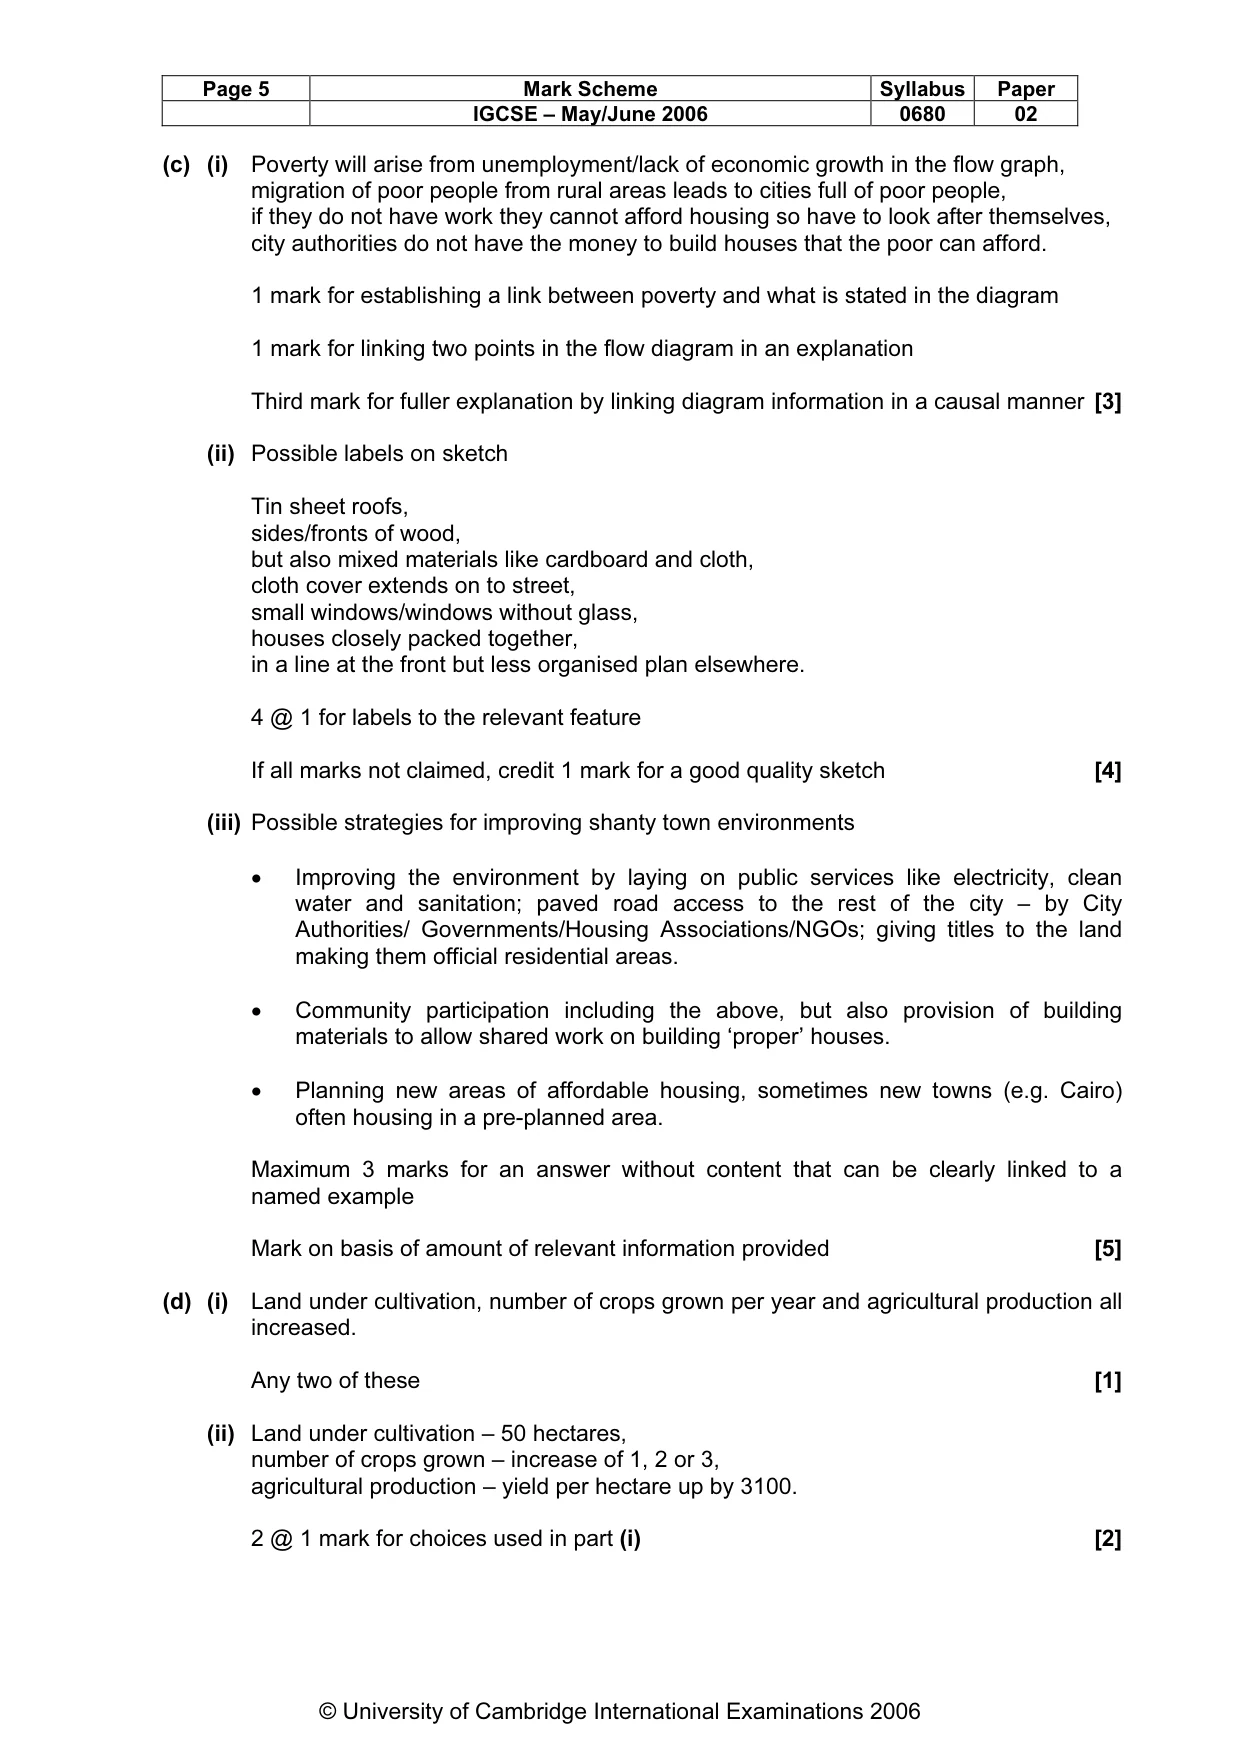
Page 5 Mark Scheme Syllabus Paper IGCSE – May/June 2006 0680 02 © University of Cambridge International Examinations 2006 (c) (i) Poverty will arise from unemployment/lack of economic growth in the flow graph, migration of poor people from rural areas leads to cities full of poor people, if they do not have work they cannot afford housing so have to look after themselves, city authorities do not have the money to build houses that the poor can afford. 1 mark for establishing a link between poverty and what is stated in the diagram 1 mark for linking two points in the flow diagram in an explanation Third mark for fuller explanation by linking diagram information in a causal manner [3] (ii) Possible labels on sketch Tin sheet roofs, sides/fronts of wood, but also mixed materials like cardboard and cloth, cloth cover extends on to street, small windows/windows without glass, houses closely packed together, in a line at the front but less organised plan elsewhere. 4 @ 1 for labels to the relevant feature If all marks not claimed, credit 1 mark for a good quality sketch [4] (iii) Possible strategies for improving shanty town environments • Improving the environment by laying on public services like electricity, clean water and sanitation; paved road access to the rest of the city – by City Authorities/ Governments/Housing Associations/NGOs; giving titles to the land making them official residential areas. • Community participation including the above, but also provision of building materials to allow shared work on building ‘proper’ houses. • Planning new areas of affordable housing, sometimes new towns (e.g. Cairo) often housing in a pre-planned area. Maximum 3 marks for an answer without content that can be clearly linked to a named example Mark on basis of amount of relevant information provided [5] (d) (i) Land under cultivation, number of crops grown per year and agricultural production all increased. Any two of these [1] (ii) Land under cultivation – 50 hectares, number of crops grown – increase of 1, 2 or 3, agricultural production – yield per hectare up by 3100. 2 @ 1 mark for choices used in part (i) [2]
Mark scheme, page 7
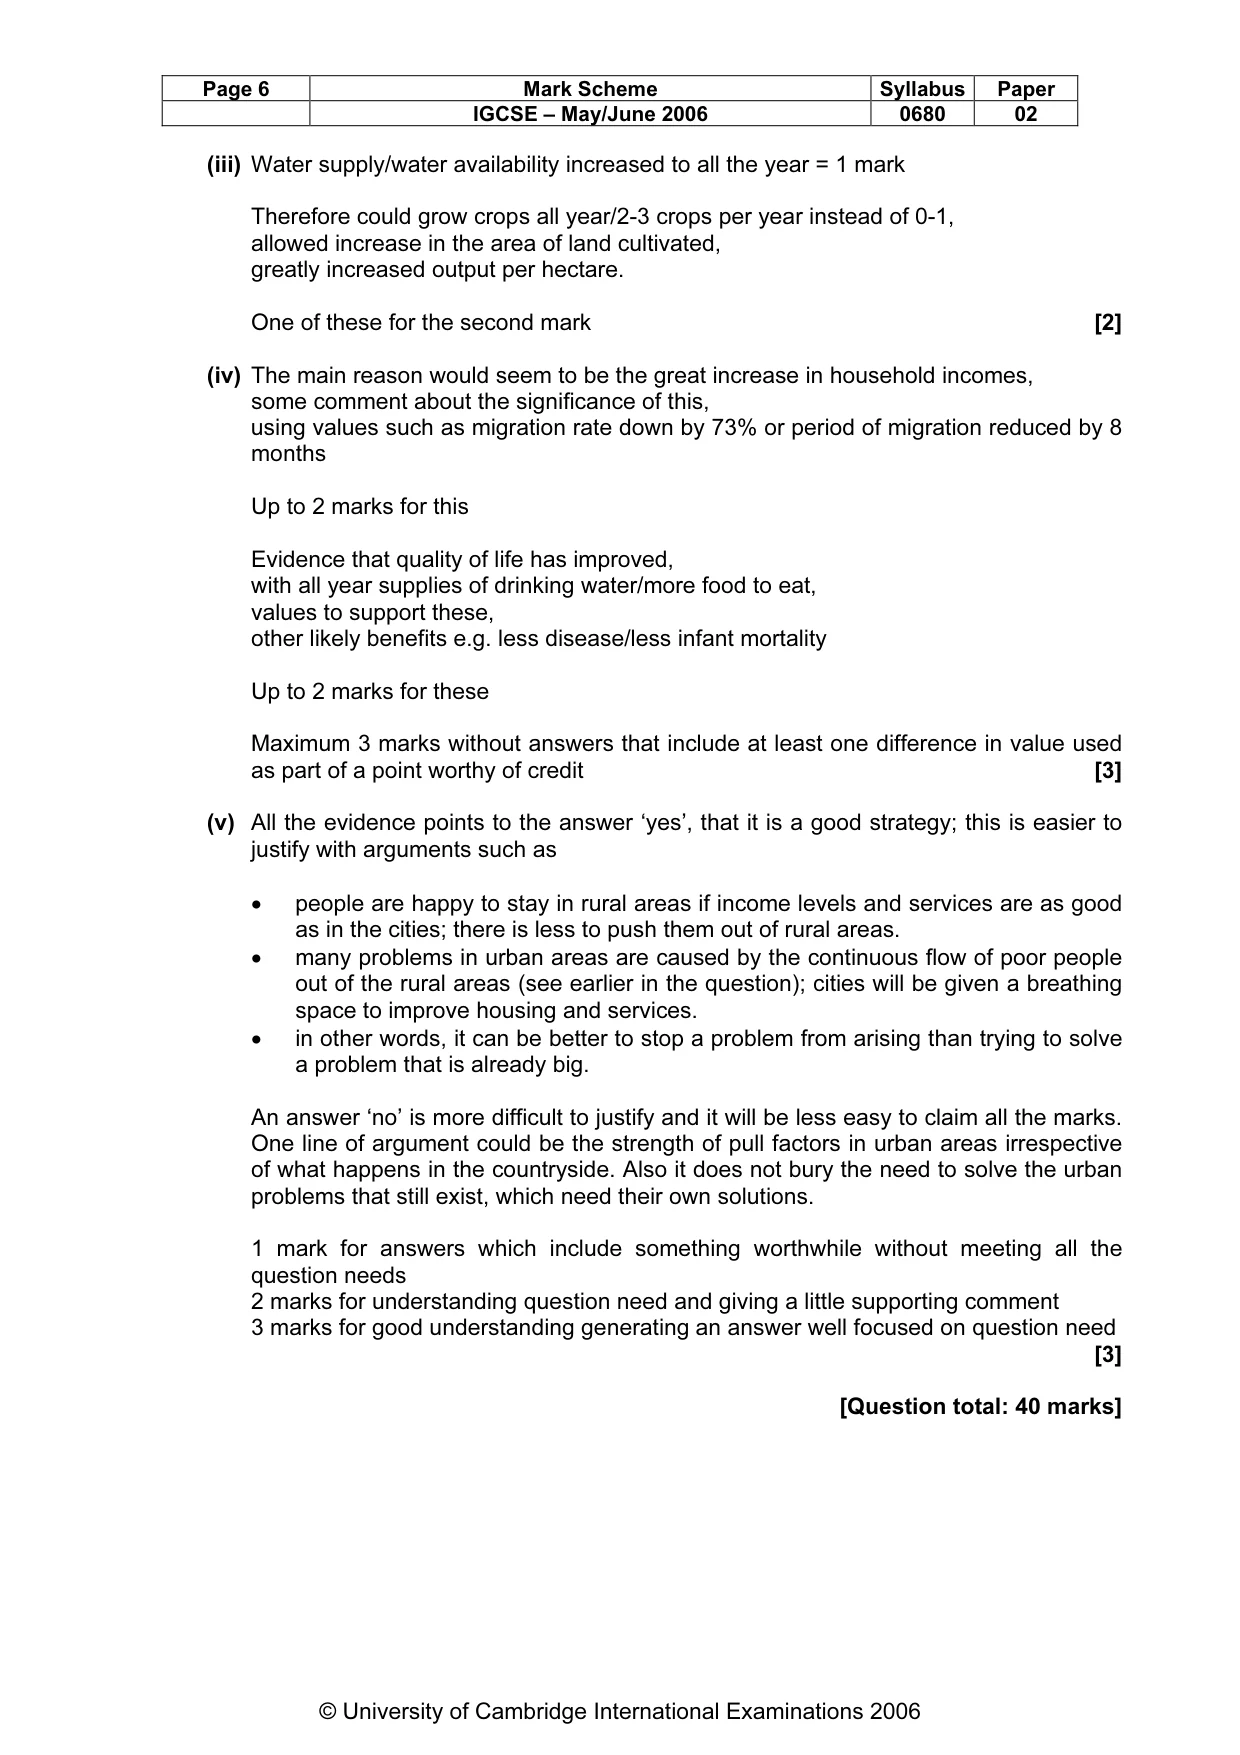
Page 6 Mark Scheme Syllabus Paper IGCSE – May/June 2006 0680 02 © University of Cambridge International Examinations 2006 (iii) Water supply/water availability increased to all the year = 1 mark Therefore could grow crops all year/2-3 crops per year instead of 0-1, allowed increase in the area of land cultivated, greatly increased output per hectare. One of these for the second mark [2] (iv) The main reason would seem to be the great increase in household incomes, some comment about the significance of this, using values such as migration rate down by 73% or period of migration reduced by 8 months Up to 2 marks for this Evidence that quality of life has improved, with all year supplies of drinking water/more food to eat, values to support these, other likely benefits e.g. less disease/less infant mortality Up to 2 marks for these Maximum 3 marks without answers that include at least one difference in value used as part of a point worthy of credit [3] (v) All the evidence points to the answer ‘yes’, that it is a good strategy; this is easier to justify with arguments such as • people are happy to stay in rural areas if income levels and services are as good as in the cities; there is less to push them out of rural areas. • many problems in urban areas are caused by the continuous flow of poor people out of the rural areas (see earlier in the question); cities will be given a breathing space to improve housing and services. • in other words, it can be better to stop a problem from arising than trying to solve a problem that is already big. An answer ‘no’ is more difficult to justify and it will be less easy to claim all the marks. One line of argument could be the strength of pull factors in urban areas irrespective of what happens in the countryside. Also it does not bury the need to solve the urban problems that still exist, which need their own solutions. 1 mark for answers which include something worthwhile without meeting all the question needs 2 marks for understanding question need and giving a little supporting comment 3 marks for good understanding generating an answer well focused on question need [3] [Question total: 40 marks]
What you needed in this session
Cambridge’s own grade thresholds for 2006 May/June, Paper 2 · Variant 1. A higher threshold means an easier paper — the bar moves with how the cohort did.