Cambridge IGCSE Environmental Management 0680 — 2005 Oct/Nov Paper 2 · Variant 1
0680/21/O/N/05
The question paper and its mark scheme, free to read here and free to download. This is Cambridge’s own paper, exactly as it was sat.
Question paper16 pages







Mark scheme7 pages
Answers below. Sit the paper first if you are practising.

Paper as text
Question paper, page 1
This document consists of 16 printed pages. SPA (DR) T02628/2 © UCLES 2005 [Turn over UNIVERSITY OF CAMBRIDGE INTERNATIONAL EXAMINATIONS International General Certificate of Secondary Education ENVIRONMENTAL MANAGEMENT Paper 2 0680/02 October/November 2005 1 hour 45 minutes Candidates answer on the Question Paper. Additional Materials: Rule (cm/mm) READ THESE INSTRUCTIONS FIRST Write your Centre number, candidate number and name on all the work you hand in. Write in dark blue or black pen in the spaces provided on the Question Paper. You may use a soft pencil for any diagrams, graphs or rough working. Do not use staples, paper clips, highlighters, glue or correction fluid. Answer both questions. The number of marks is given in brackets [ ] at the end of each question or part question. DO NOT WRITE IN THE BARCODE. DO NOT WRITE IN THE GREY AREAS BETWEEN THE PAGES. If you have been given a label, look at the details. If any details are incorrect or missing, please fill in your correct details in the space given at the top of this page. Stick your personal label here, if provided. FOR EXAMINER’S USE 1 2 TOTAL www.XtremePapers.com
Question paper, page 2
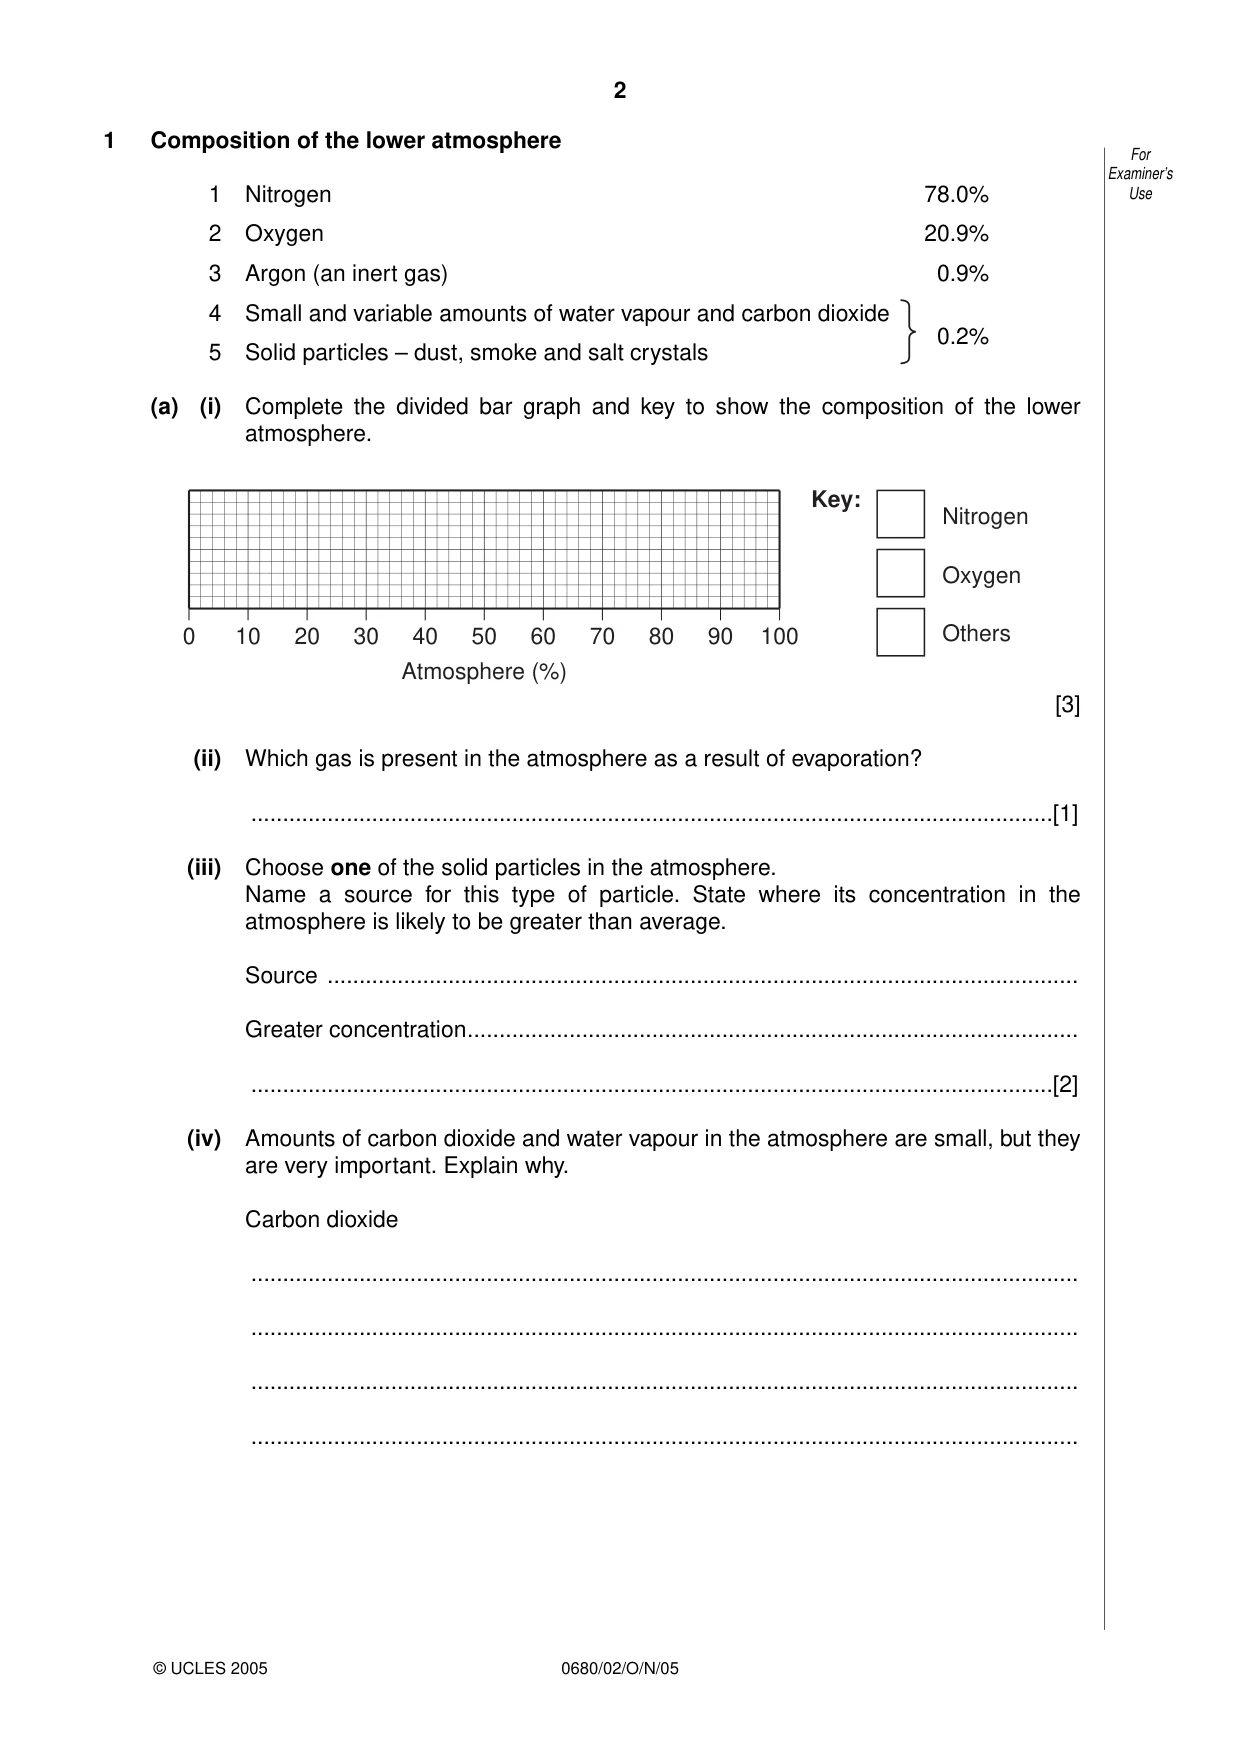
2 1 Composition of the lower atmosphere 1 Nitrogen 78.0% 2 Oxygen 20.9% 3 Argon (an inert gas) 0.9% 4 Small and variable amounts of water vapour and carbon dioxide 5 Solid particles – dust, smoke and salt crystals 0.2% (a) (i) Complete the divided bar graph and key to show the composition of the lower atmosphere. [3] (ii) Which gas is present in the atmosphere as a result of evaporation? …[1] (iii) Choose one of the solid particles in the atmosphere. Name a source for this type of particle. State where its concentration in the atmosphere is likely to be greater than average. Source … Greater concentration… …[2] (iv) Amounts of carbon dioxide and water vapour in the atmosphere are small, but they are very important. Explain why. Carbon dioxide … … … … 0 10 20 30 40 50 60 70 80 90 100 Atmosphere (%) Nitrogen Oxygen Others Key: For Examiner’s Use 0680/02/O/N/05 © UCLES 2005
Question paper, page 3
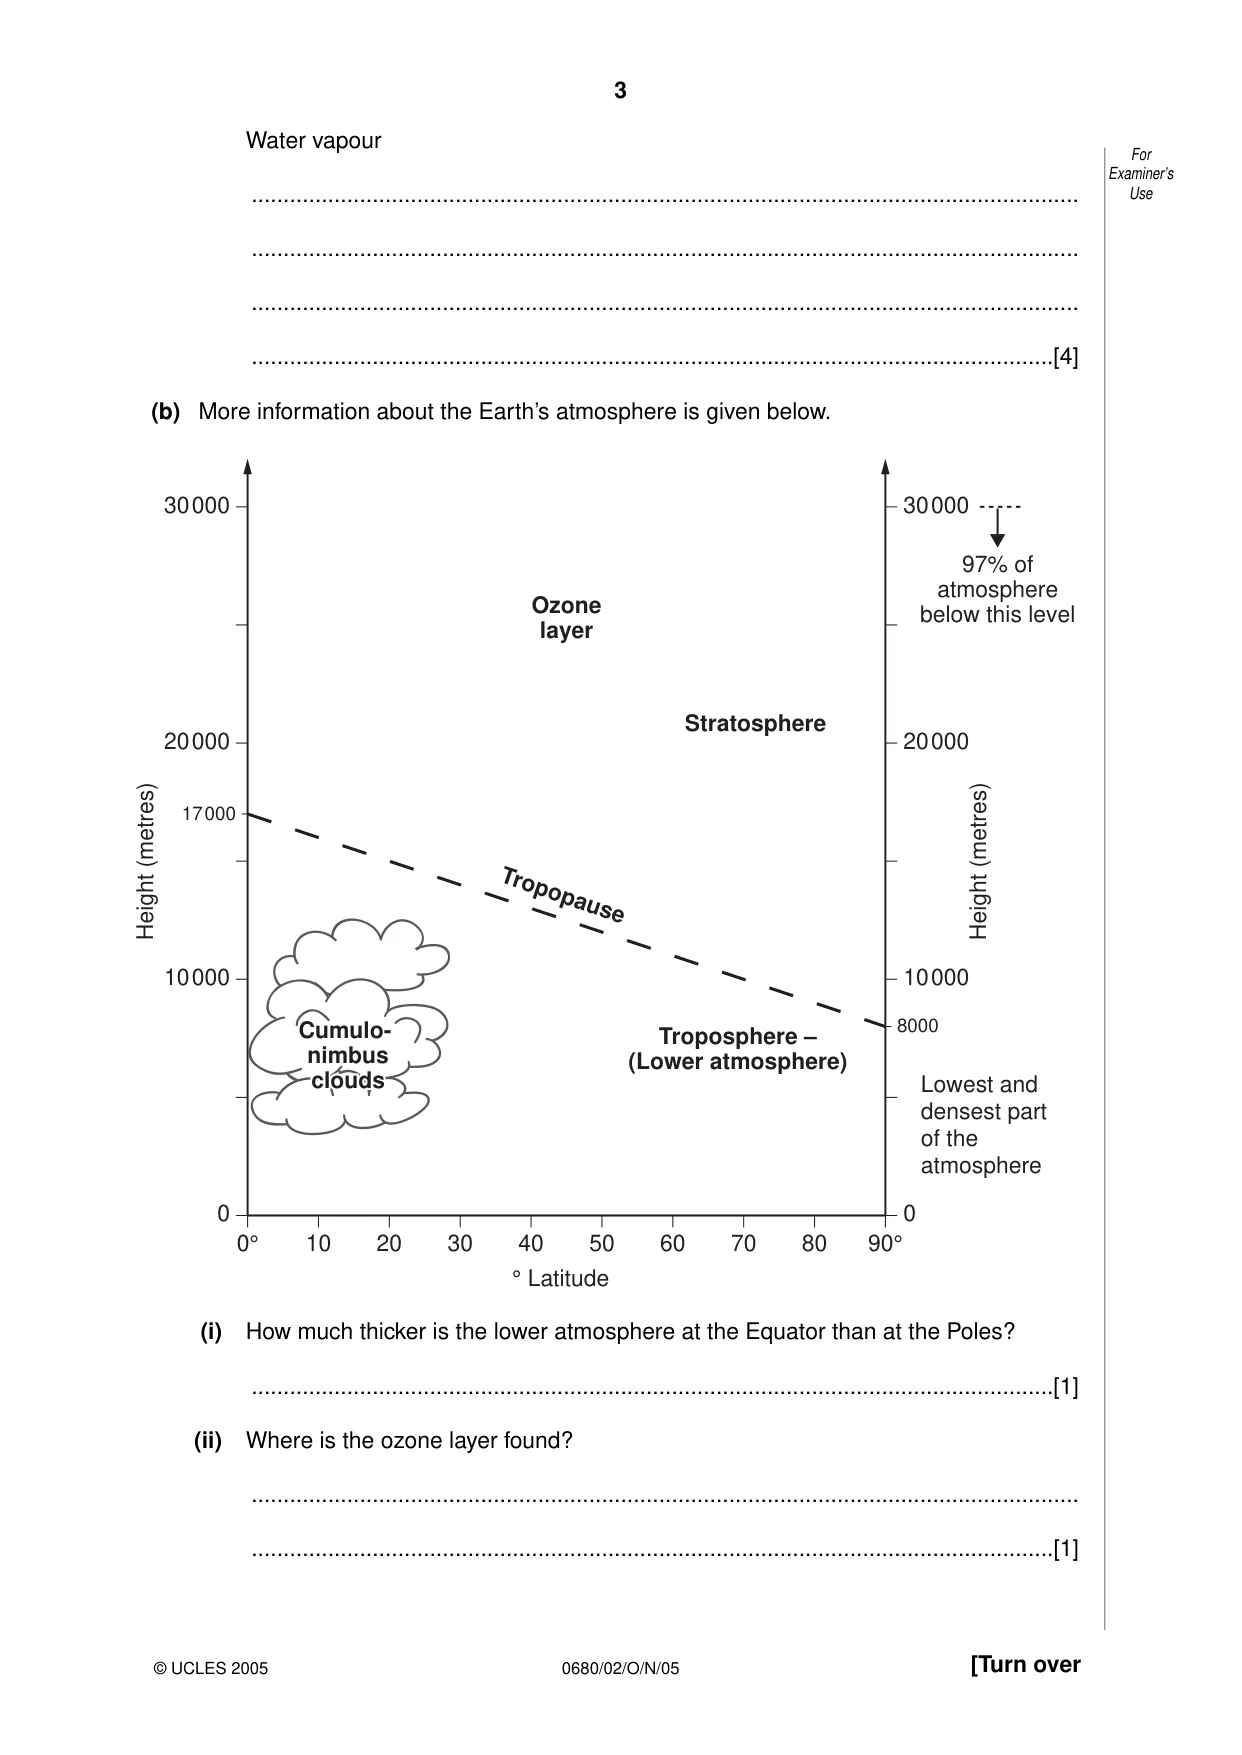
3 [Turn over Water vapour … … … …[4] (b) More information about the Earth’s atmosphere is given below. (i) How much thicker is the lower atmosphere at the Equator than at the Poles? …[1] (ii) Where is the ozone layer found? … …[1] 0 0° 10 20 30 40 50 60 70 80 90° 10000 20000 17000 30000 0 10000 20000 30000 ° Latitude Height (metres) Height (metres) Ozone layer Stratosphere Tropopause Troposphere – (Lower atmosphere) Lowest and densest part of the atmosphere Cumulus Cumulus nimbus nimbus clouds clouds Cumulo- nimbus clouds 97% of atmosphere below this level 8000 For Examiner’s Use 0680/02/O/N/05 © UCLES 2005
Question paper, page 4
4 (iii) Explain why the ozone layer is important to life on Earth. … … …[2] (c) (i) What is meant by the ‘ozone hole’? … … (ii) Why are international strategies needed to reduce the pollution that has caused the hole in the ozone layer? … … … … … …[4] For Examiner’s Use 0680/02/O/N/05 © UCLES 2005
Question paper, page 5
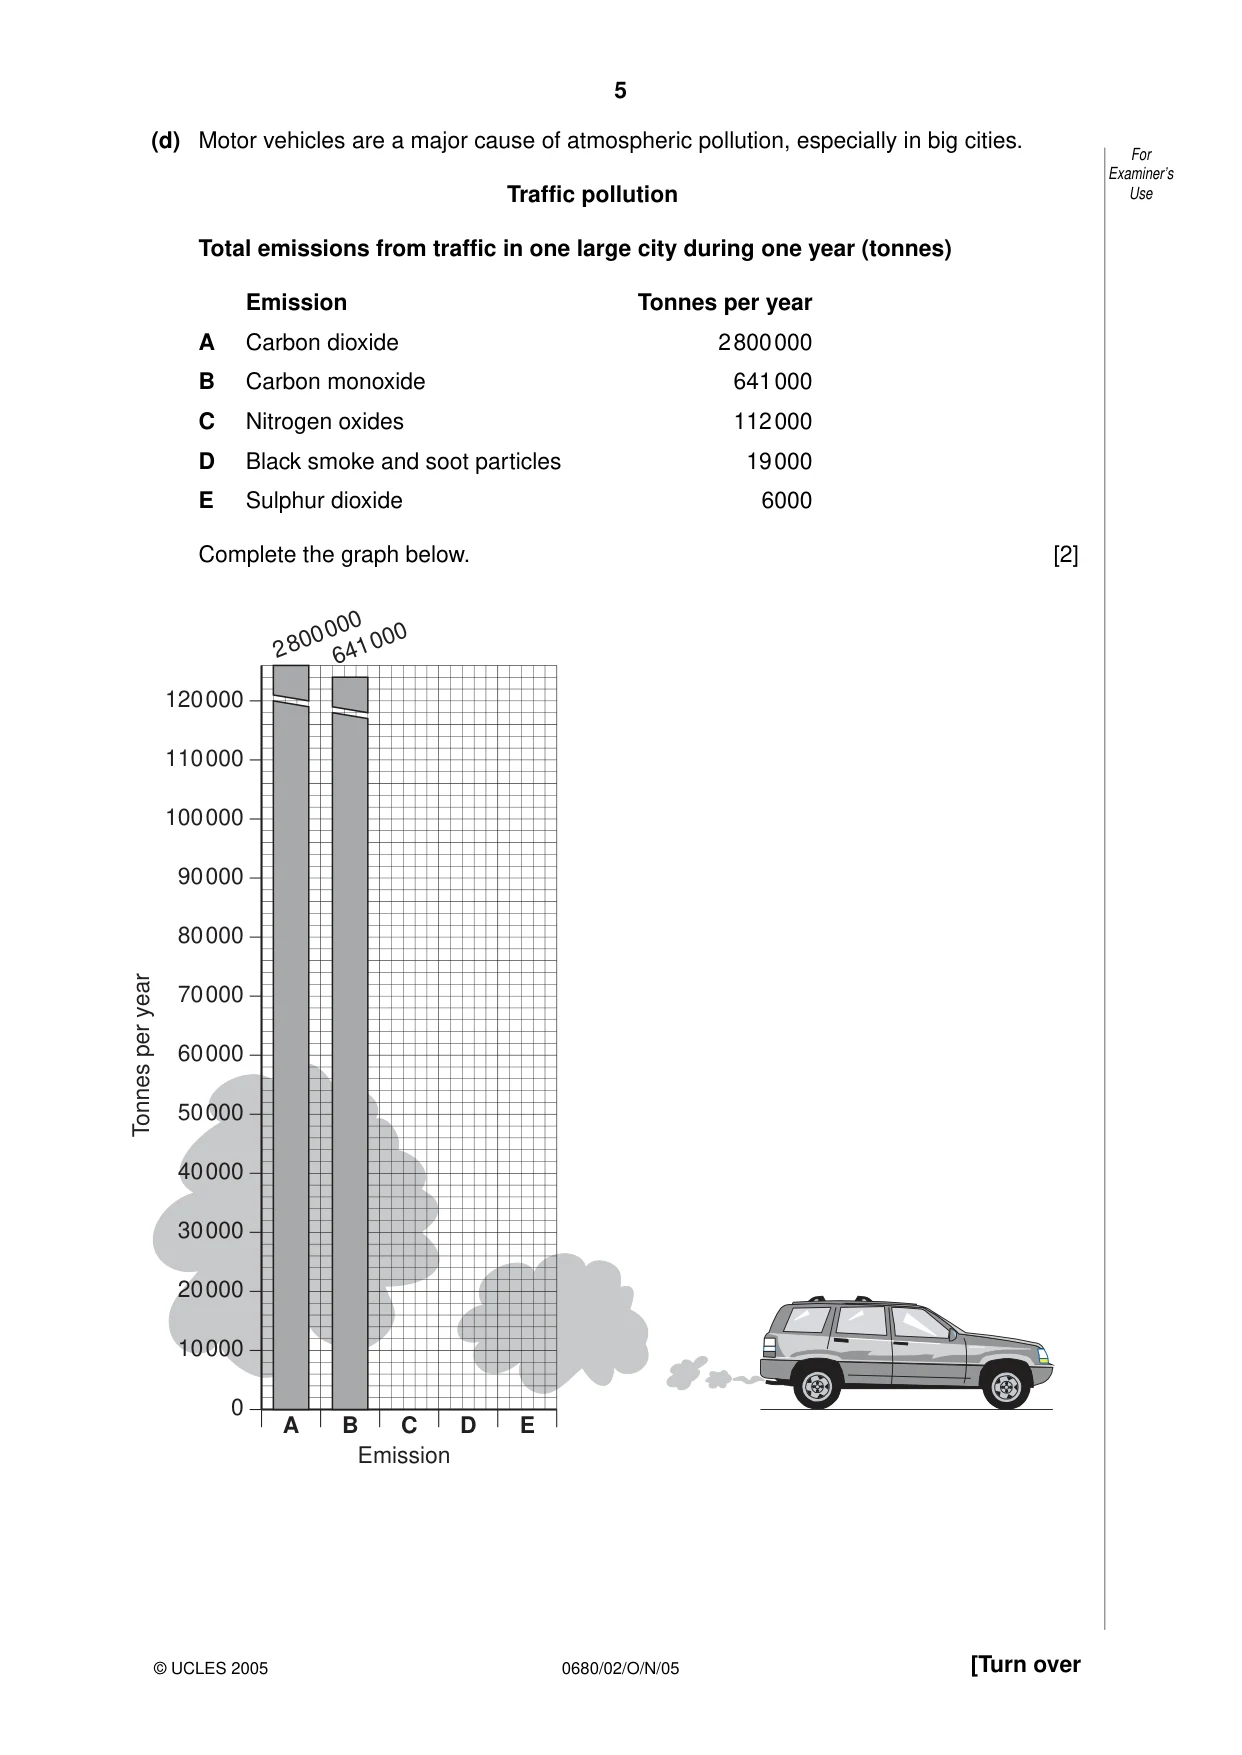
5 [Turn over (d) Motor vehicles are a major cause of atmospheric pollution, especially in big cities. Traffic pollution Total emissions from traffic in one large city during one year (tonnes) Emission Tonnes per year A Carbon dioxide 2800000 B Carbon monoxide 641000 C Nitrogen oxides 112000 D Black smoke and soot particles 19000 E Sulphur dioxide 6000 Complete the graph below. [2] 0 10000 20000 30000 40000 50000 60000 70000 80000 90000 100000 110000 120000 A B C D E Tonnes per year Emission 2800000 641000 For Examiner’s Use 0680/02/O/N/05 © UCLES 2005
Question paper, page 6
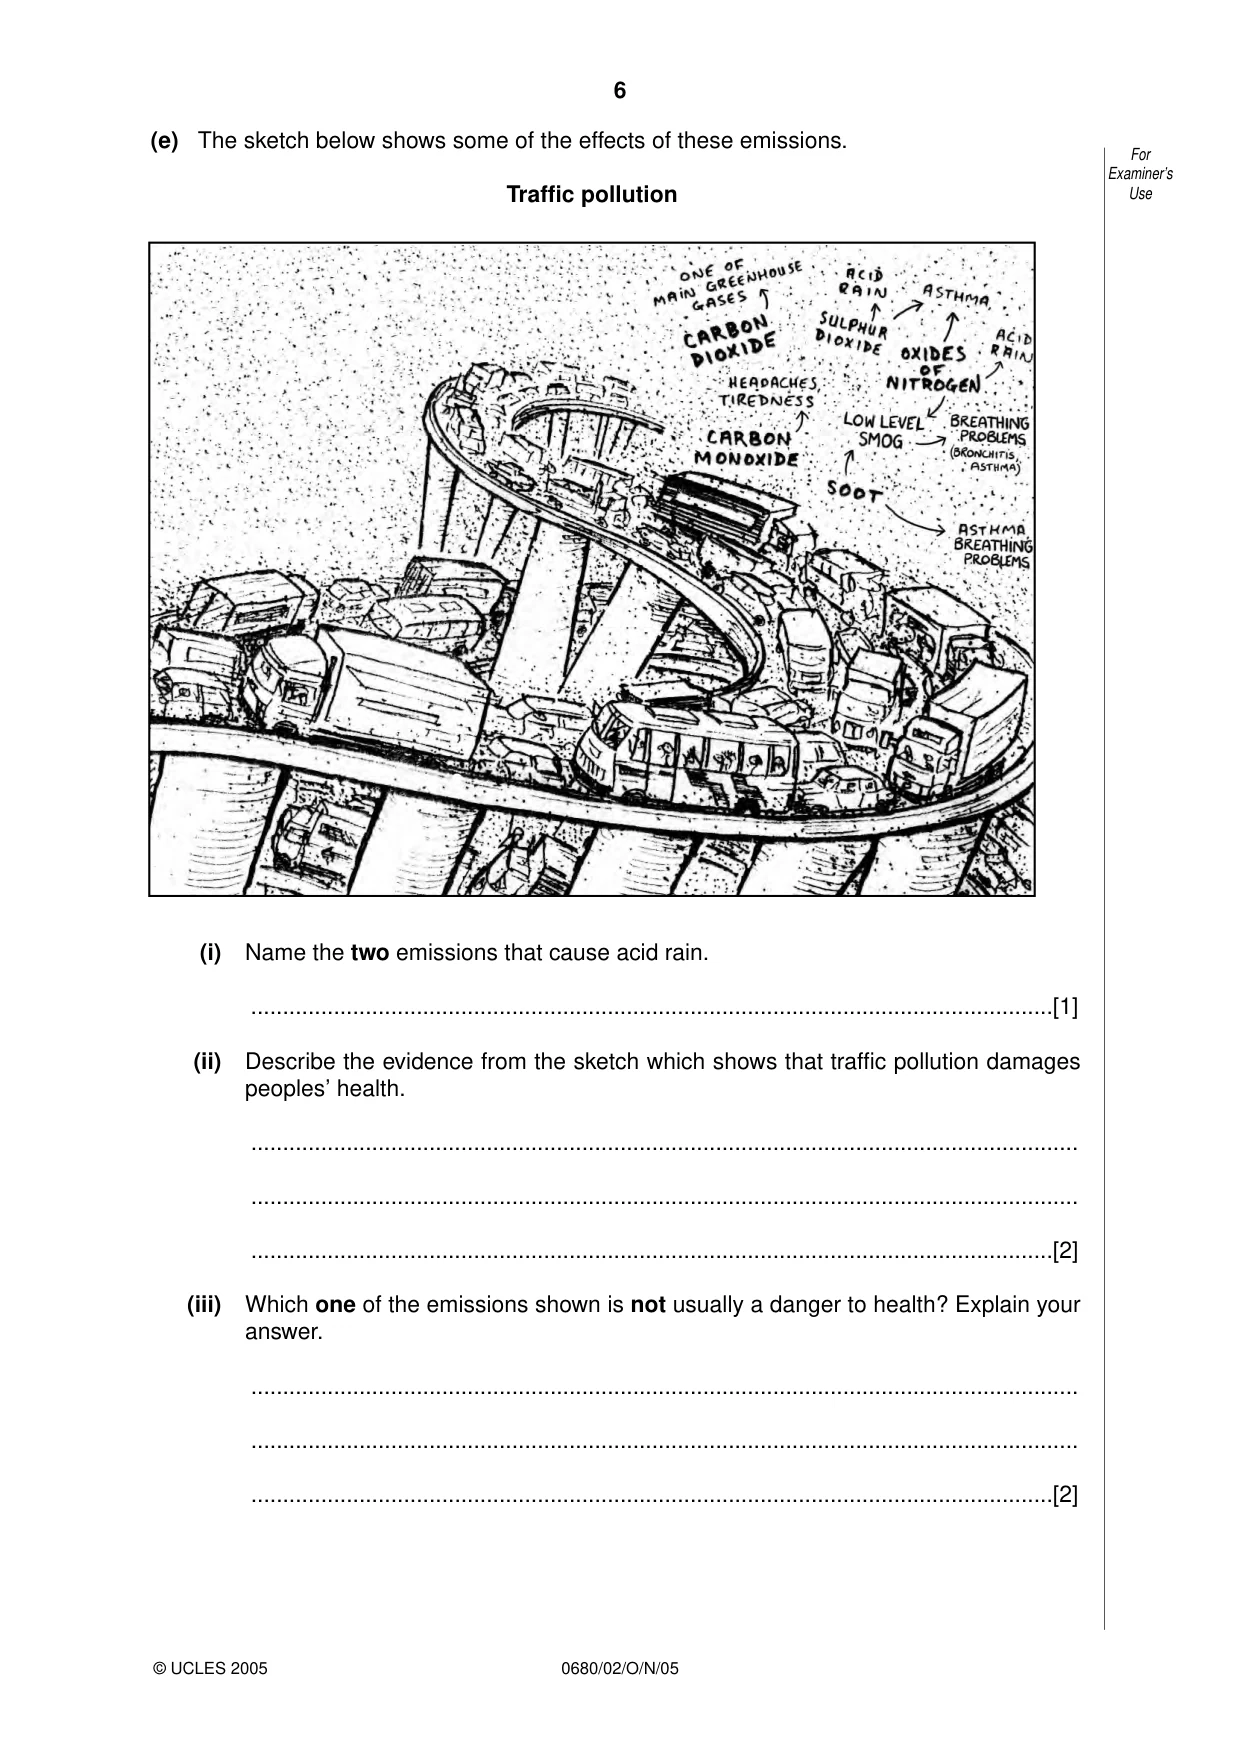
6 (e) The sketch below shows some of the effects of these emissions. Traffic pollution (i) Name the two emissions that cause acid rain. …[1] (ii) Describe the evidence from the sketch which shows that traffic pollution damages peoples’ health. … … …[2] (iii) Which one of the emissions shown is not usually a danger to health? Explain your answer. … … …[2] For Examiner’s Use 0680/02/O/N/05 © UCLES 2005
Question paper, page 7
7 [Turn over (f) Look again at the graph in part (d) and the sketch in part (e). In your view, which one of the five emissions is the worst for (i) people living in large cities emission … (ii) people living elsewhere in the world? emission … [1] (iii) Explain your choices. … … … … … …[3] For Examiner’s Use 0680/02/O/N/05 © UCLES 2005
Question paper, page 8
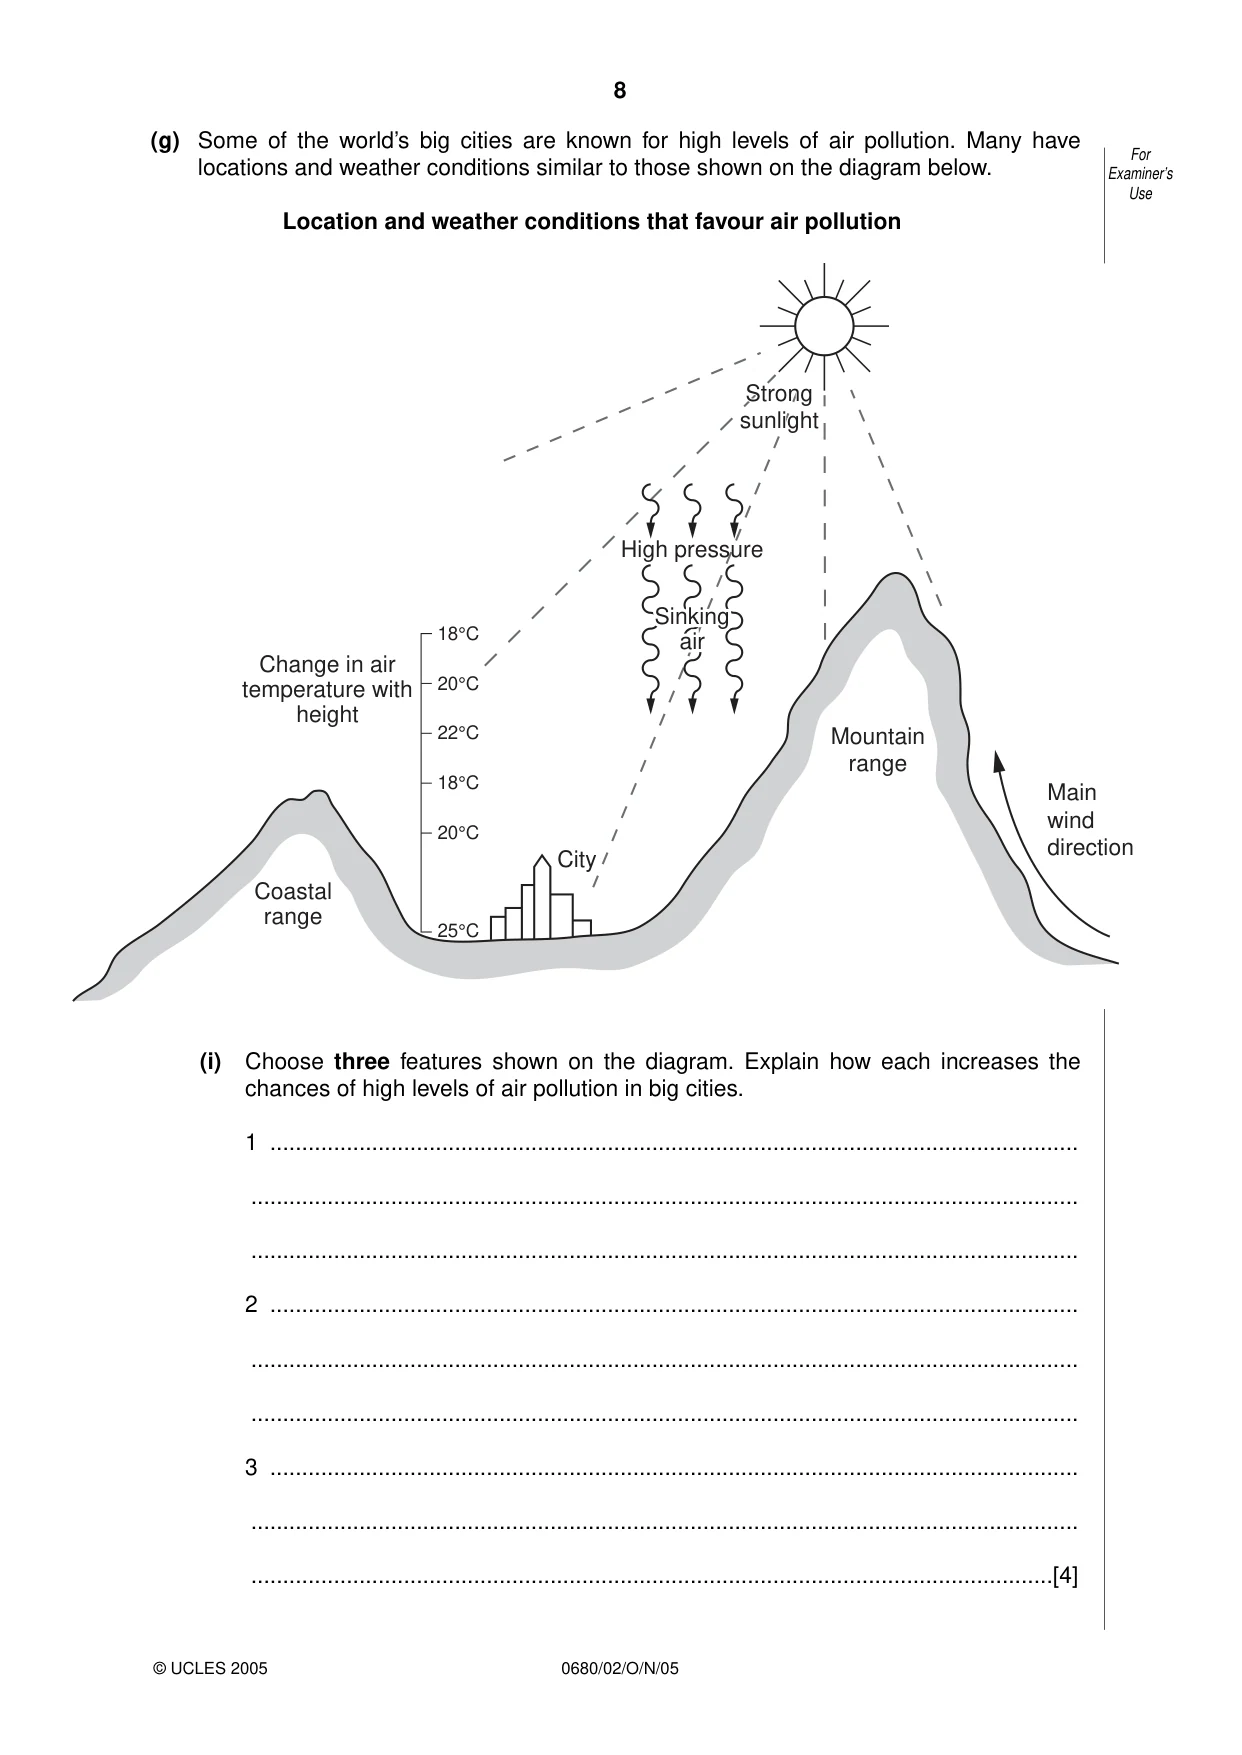
8 (g) Some of the world’s big cities are known for high levels of air pollution. Many have locations and weather conditions similar to those shown on the diagram below. Location and weather conditions that favour air pollution (i) Choose three features shown on the diagram. Explain how each increases the chances of high levels of air pollution in big cities. 1 … … … 2 … … … 3 … … …[4] For Examiner’s Use 0680/02/O/N/05 © UCLES 2005 18°C 20°C 22°C 18°C 20°C 25°C City Change in air temperature with height Coastal range Mountain range Main wind direction High pressure Strong Strong sunlight sunlight Strong sunlight Sinking Sinking air air Sinking air
Question paper, page 9
9 [Turn over (ii) Name two strategies for reducing air pollution in large cities. 1 … 2 …[2] (iii) Why is it difficult to reduce levels of air pollution in large cities? Explain as fully as you can. … … … … … … … … … …[5] [Total: 40] For Examiner’s Use 0680/02/O/N/05 © UCLES 2005
Question paper, page 10
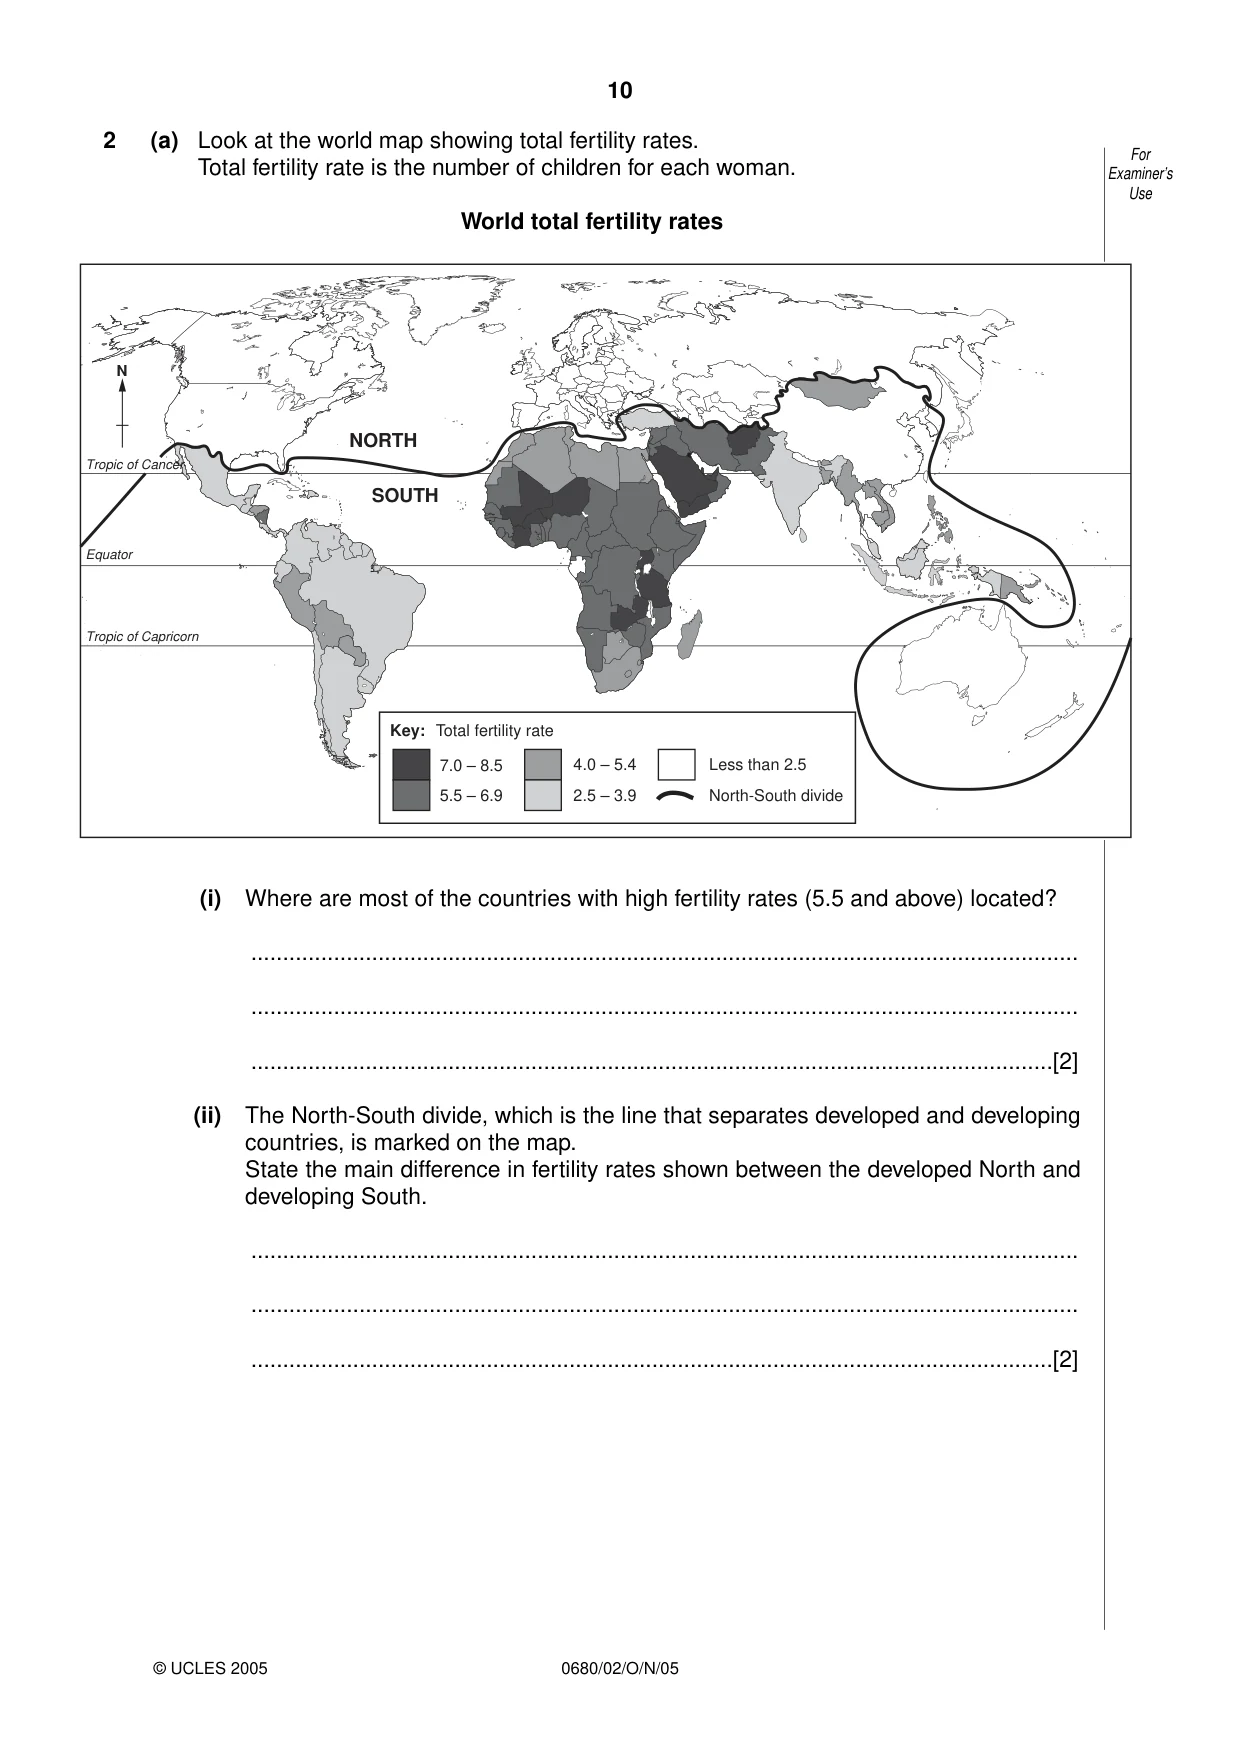
10 2 (a) Look at the world map showing total fertility rates. Total fertility rate is the number of children for each woman. World total fertility rates (i) Where are most of the countries with high fertility rates (5.5 and above) located? … … …[2] (ii) The North-South divide, which is the line that separates developed and developing countries, is marked on the map. State the main difference in fertility rates shown between the developed North and developing South. … … …[2] For Examiner’s Use 0680/02/O/N/05 © UCLES 2005 NORTH SOUTH N Key: 7.0 – 8.5 5.5 – 6.9 4.0 – 5.4 2.5 – 3.9 Less than 2.5 North-South divide Total fertility rate Tropic of Capricorn Equator Tropic of Cancer
Question paper, page 11
11 [Turn over (iii) Explain why fertility rates are very high in some countries and low in others. Refer to named countries in your answer. … … … … … … … … … …[5] For Examiner’s Use 0680/02/O/N/05 © UCLES 2005
Question paper, page 12
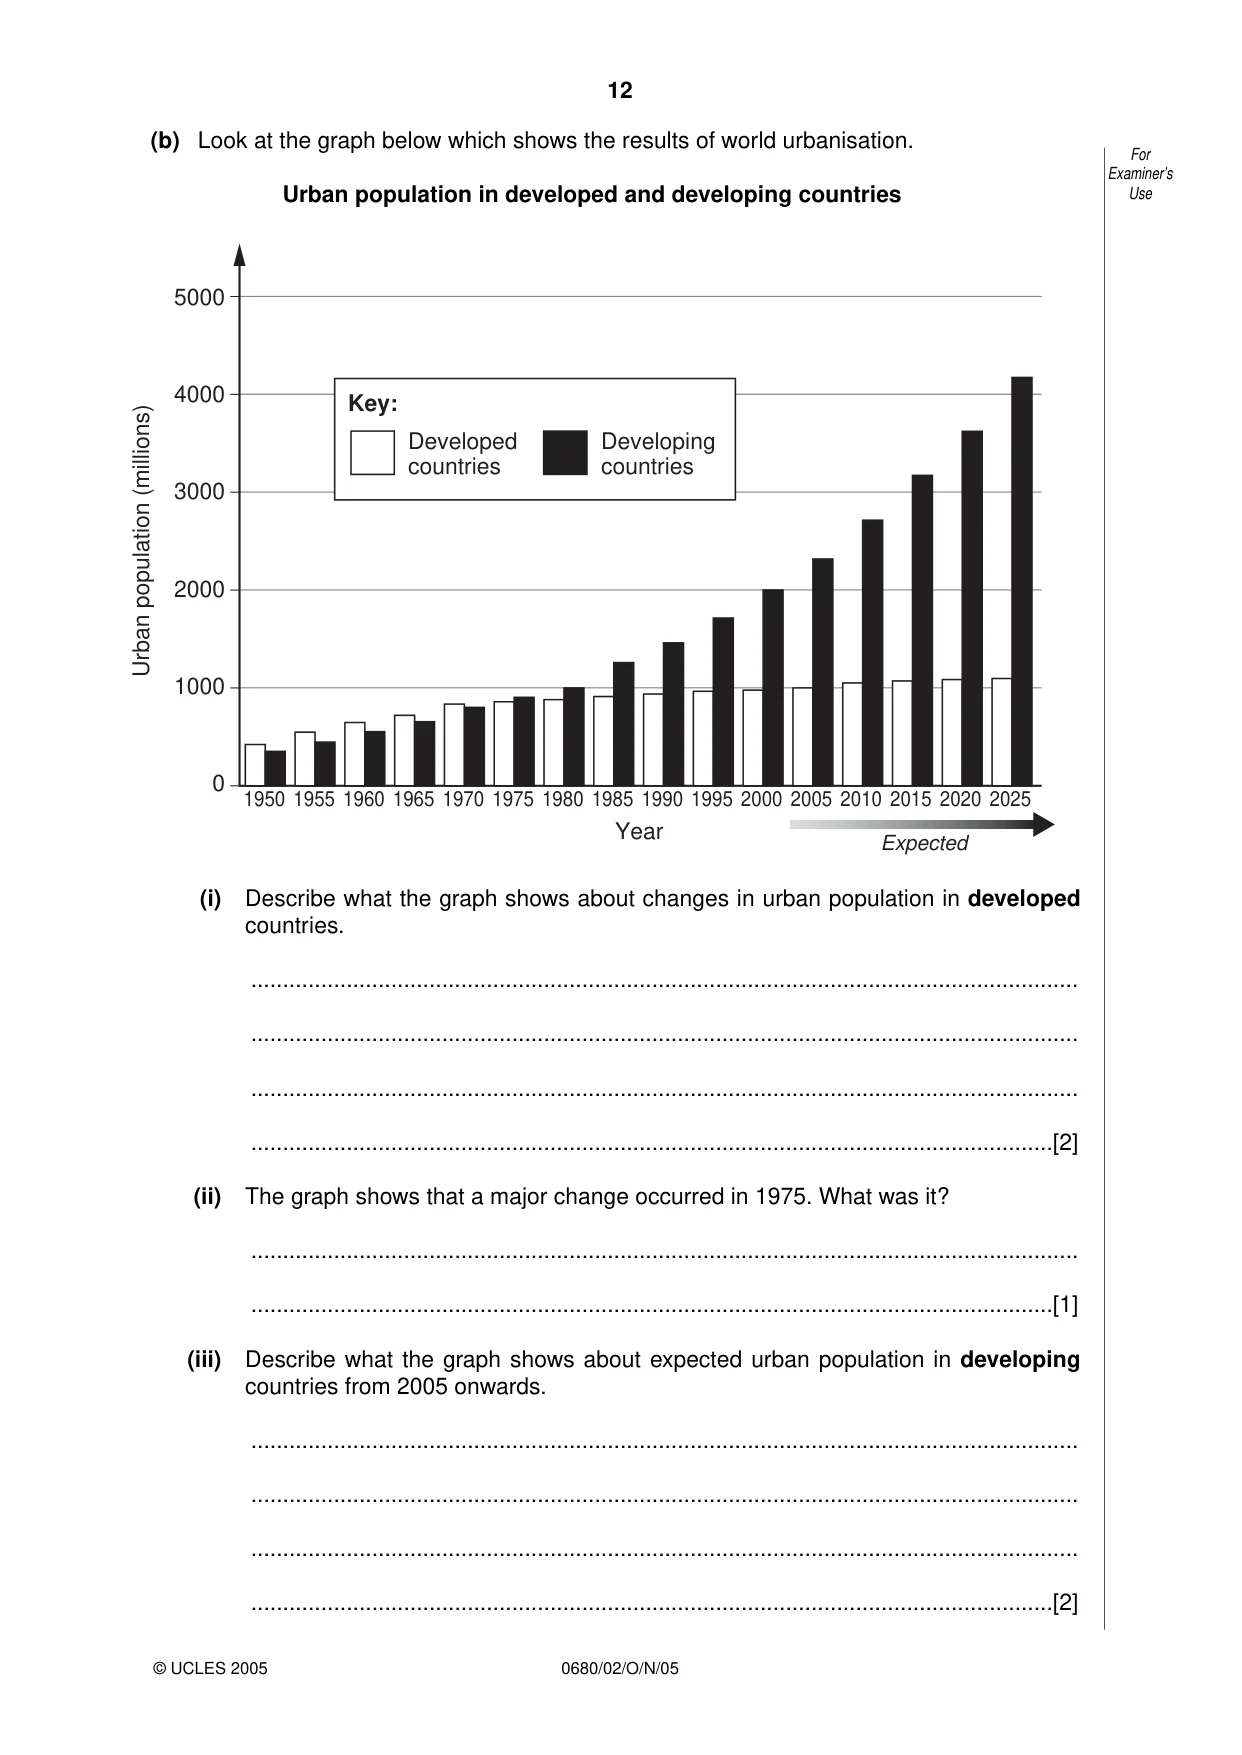
12 (b) Look at the graph below which shows the results of world urbanisation. Urban population in developed and developing countries (i) Describe what the graph shows about changes in urban population in developed countries. … … … …[2] (ii) The graph shows that a major change occurred in 1975. What was it? … …[1] (iii) Describe what the graph shows about expected urban population in developing countries from 2005 onwards. … … … …[2] Year 0 1000 2000 3000 4000 5000 Urban population (millions) 1950 1955 1960 1965 1970 1975 1980 1985 1990 1995 2000 2005 2010 2015 2020 2025 Expected Key: Developed countries Developing countries For Examiner’s Use 0680/02/O/N/05 © UCLES 2005
Question paper, page 13
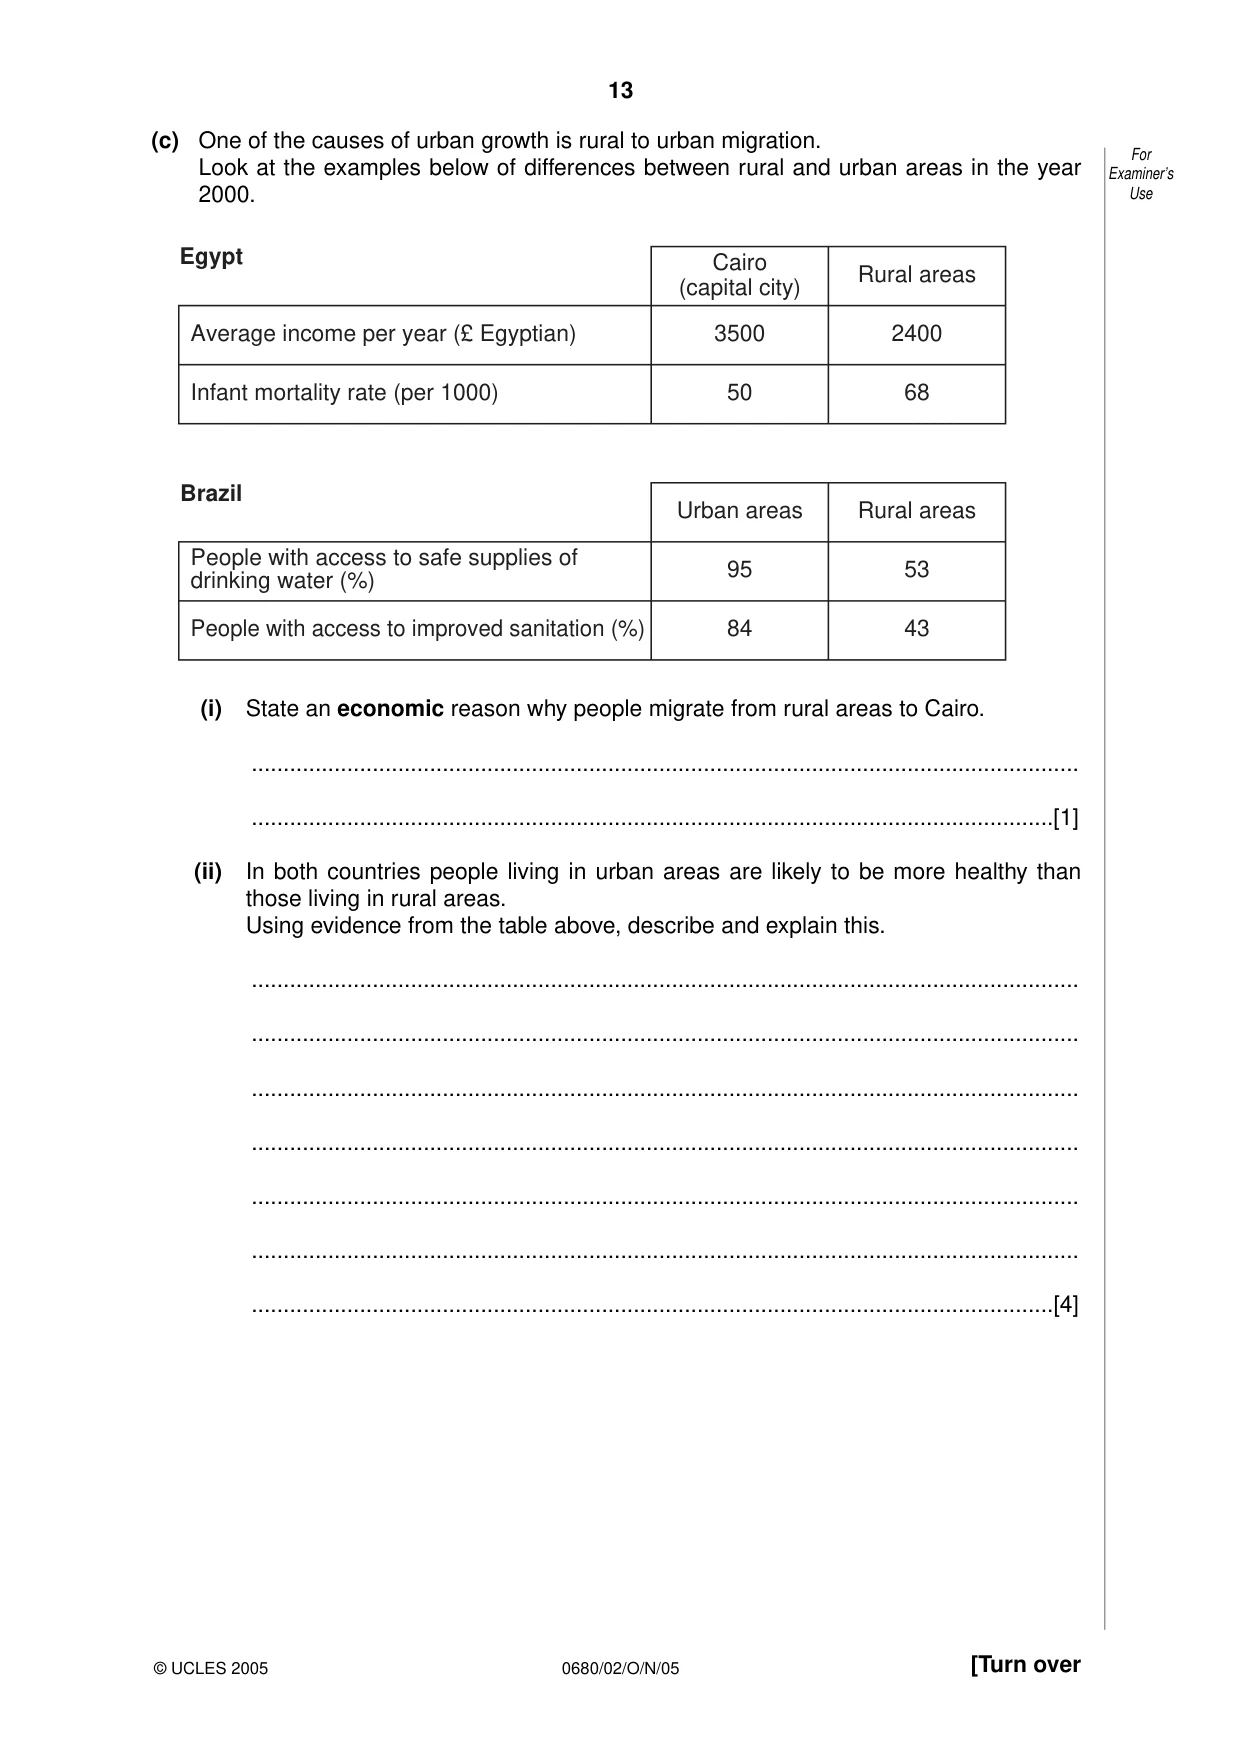
13 [Turn over (c) One of the causes of urban growth is rural to urban migration. Look at the examples below of differences between rural and urban areas in the year 2000. (i) State an economic reason why people migrate from rural areas to Cairo. … …[1] (ii) In both countries people living in urban areas are likely to be more healthy than those living in rural areas. Using evidence from the table above, describe and explain this. … … … … … … …[4] Average income per year (£ Egyptian) Infant mortality rate (per 1000) 3500 50 2400 Cairo (capital city) Rural areas 68 Egypt People with access to safe supplies of drinking water (%) People with access to improved sanitation (%) 95 84 53 Urban areas Rural areas 43 Brazil For Examiner’s Use 0680/02/O/N/05 © UCLES 2005
Question paper, page 14
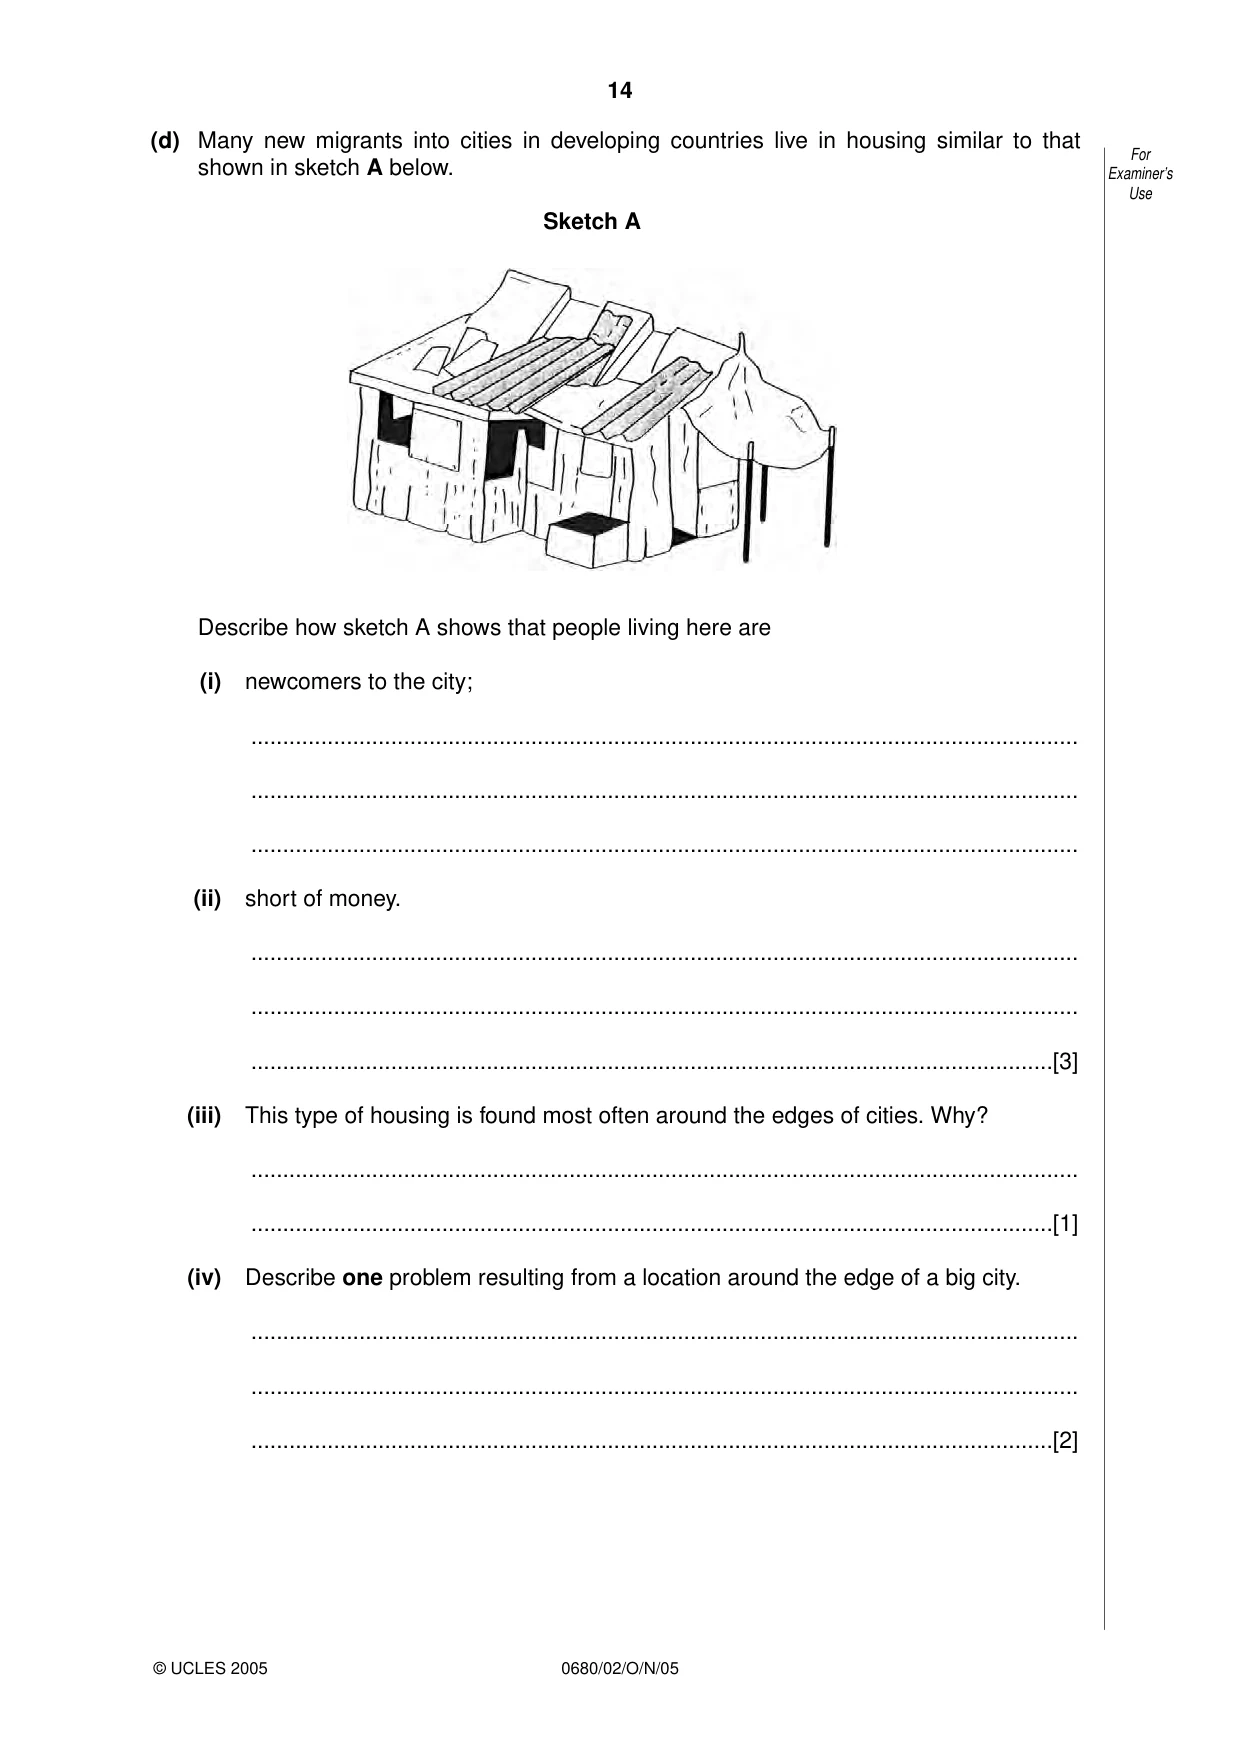
14 (d) Many new migrants into cities in developing countries live in housing similar to that shown in sketch A below. Sketch A Describe how sketch A shows that people living here are (i) newcomers to the city; … … … (ii) short of money. … … …[3] (iii) This type of housing is found most often around the edges of cities. Why? … …[1] (iv) Describe one problem resulting from a location around the edge of a big city. … … …[2] For Examiner’s Use 0680/02/O/N/05 © UCLES 2005
Question paper, page 15
15 [Turn over (e) Sketch B shows housing in an area where people have lived for more than twenty years since migrating from rural areas. Sketch B (i) What improvements can be seen compared with the housing on sketch A? … … … …[2] (ii) State two reasons why improvements like these are made. 1 … … … 2 … … …[4] For Examiner’s Use 0680/02/O/N/05 © UCLES 2005 Permission to reproduce items where third-party owned material protected by copyright is included has been sought and cleared where possible. Every reasonable effort has been made by the publisher (UCLES) to trace copyright holders, but if any items requiring clearance have unwittingly been included, the publisher will be pleased to make amends at the earliest possible opportunity. University of Cambridge International Examinations is part of the University of Cambridge Local Examinations Syndicate (UCLES), which is itself a department of the University of Cambridge.
Question paper, page 16
16 (f) Housing is only one of the many urban problems caused by rural to urban migration. Some people believe that it would be better to improve farming in rural areas and reduce the numbers wanting to migrate to the cities. New agricultural techniques to increase output • A Irrigation • B New seeds (e.g. the Green Revolution) (i) Choose one of these new agricultural techniques and name an area where it is used by farmers. Technique …Area …[1] (ii) Explain how it has increased output in the area named. … … … … … …[3] (iii) Is it ever going to be possible to reduce the numbers of people migrating from rural to urban areas in developing countries? Explain your views about this. … … … … … … … … … …[5] [Total: 40] [Total for paper: 80] For Examiner’s Use 0680/02/O/N/05 © UCLES 2005
Mark scheme, page 1
UNIVERSITY OF CAMBRIDGE INTERNATIONAL EXAMINATIONS International General Certificate of Secondary Education MARK SCHEME for the October/November 2005 question paper 0680 ENVIRONMENTAL MANAGEMENT 0680/02 Paper 2, maximum raw mark 80 This mark scheme is published as an aid to teachers and students, to indicate the requirements of the examination. It shows the basis on which Examiners were initially instructed to award marks. It does not indicate the details of the discussions that took place at an Examiners’ meeting before marking began. Any substantial changes to the mark scheme that arose from these discussions will be recorded in the published Report on the Examination. All Examiners are instructed that alternative correct answers and unexpected approaches in candidates’ scripts must be given marks that fairly reflect the relevant knowledge and skills demonstrated. Mark schemes must be read in conjunction with the question papers and the Report on the Examination. The minimum marks in these components needed for various grades were previously published with these mark schemes, but are now instead included in the Report on the Examination for this session. • CIE will not enter into discussion or correspondence in connection with these mark schemes. CIE is publishing the mark schemes for the October/November 2005 question papers for most IGCSE and GCE Advanced Level and Advanced Subsidiary Level syllabuses and some Ordinary Level syllabuses. www.XtremePapers.com
Mark scheme, page 2
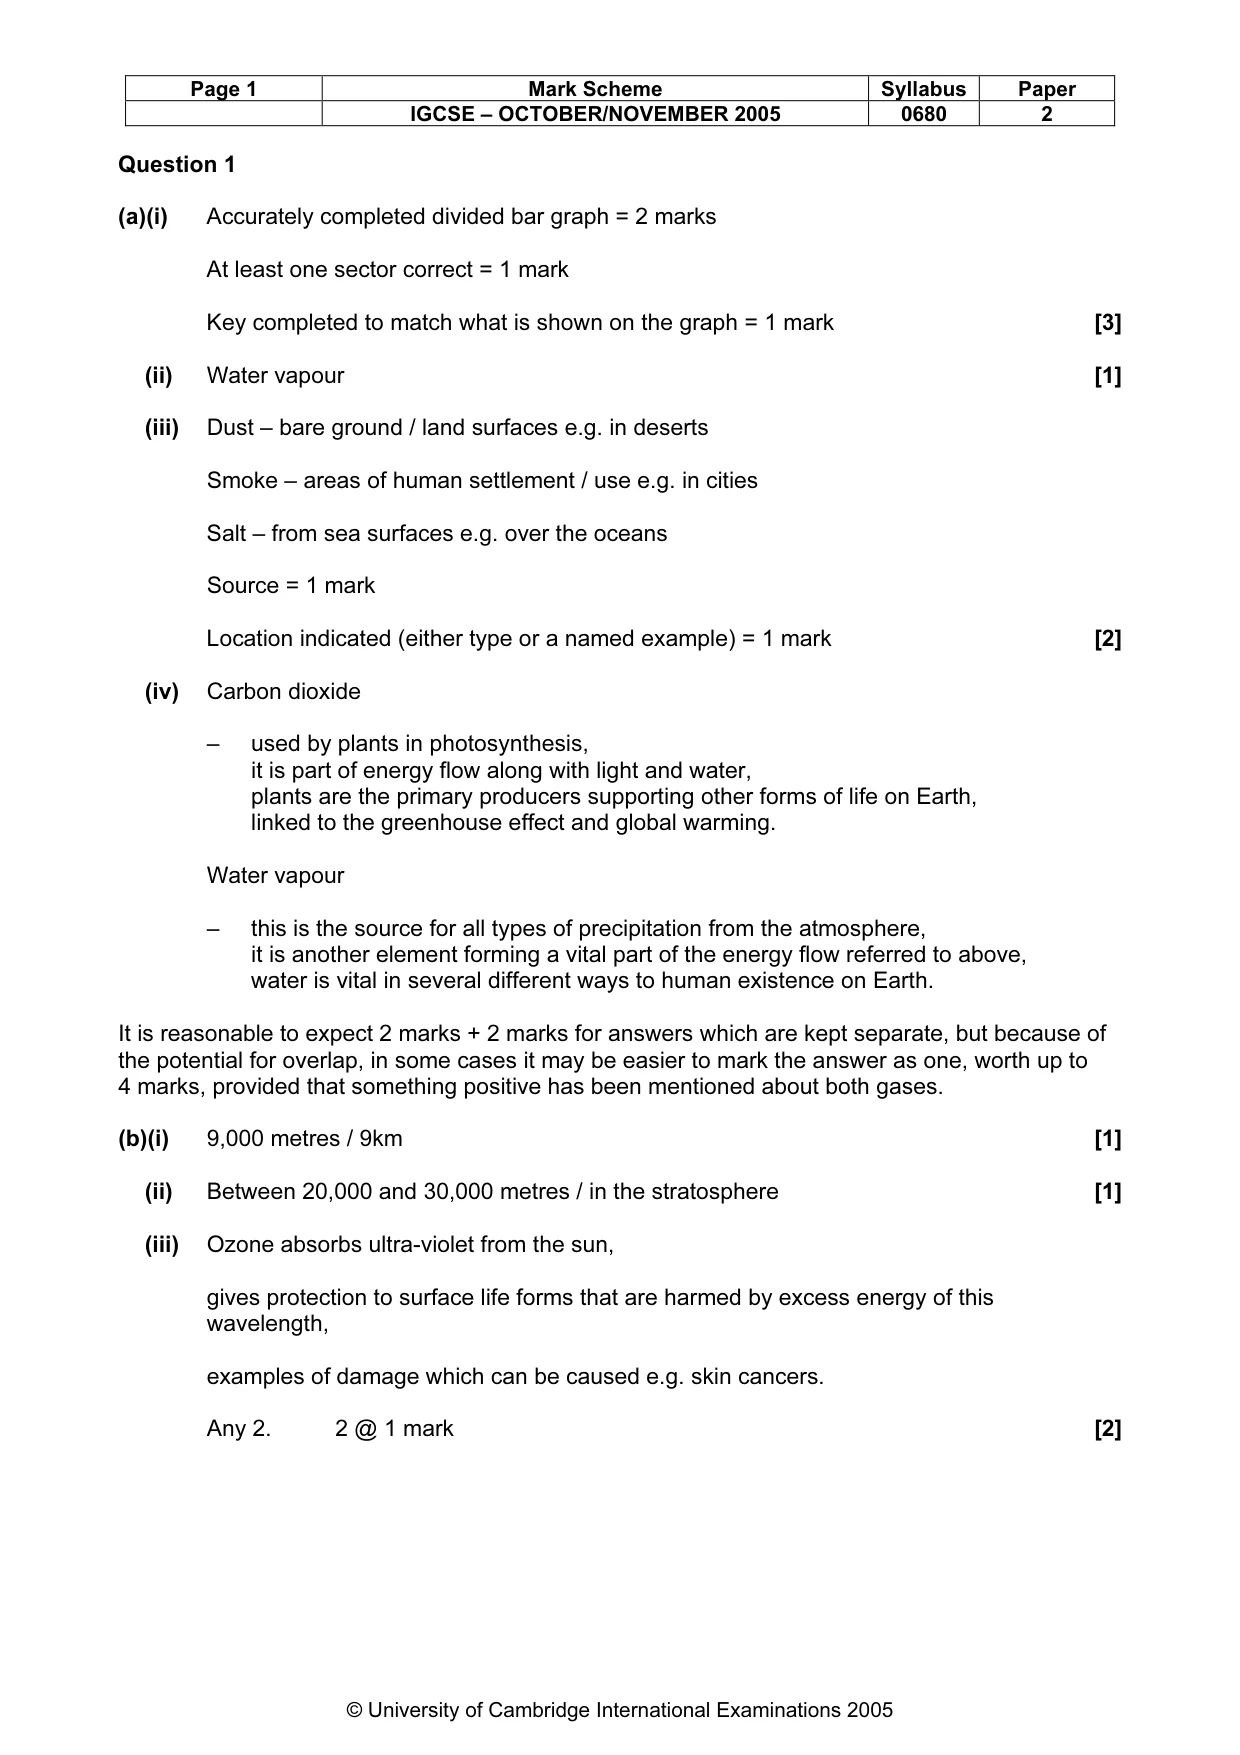
Page 1 Mark Scheme Syllabus Paper IGCSE – OCTOBER/NOVEMBER 2005 0680 2 © University of Cambridge International Examinations 2005 Question 1 (a)(i) Accurately completed divided bar graph = 2 marks At least one sector correct = 1 mark Key completed to match what is shown on the graph = 1 mark [3] (ii) Water vapour [1] (iii) Dust – bare ground / land surfaces e.g. in deserts Smoke – areas of human settlement / use e.g. in cities Salt – from sea surfaces e.g. over the oceans Source = 1 mark Location indicated (either type or a named example) = 1 mark [2] (iv) Carbon dioxide – used by plants in photosynthesis, it is part of energy flow along with light and water, plants are the primary producers supporting other forms of life on Earth, linked to the greenhouse effect and global warming. Water vapour – this is the source for all types of precipitation from the atmosphere, it is another element forming a vital part of the energy flow referred to above, water is vital in several different ways to human existence on Earth. It is reasonable to expect 2 marks + 2 marks for answers which are kept separate, but because of the potential for overlap, in some cases it may be easier to mark the answer as one, worth up to 4 marks, provided that something positive has been mentioned about both gases. (b)(i) 9,000 metres / 9km [1] (ii) Between 20,000 and 30,000 metres / in the stratosphere [1] (iii) Ozone absorbs ultra-violet from the sun, gives protection to surface life forms that are harmed by excess energy of this wavelength, examples of damage which can be caused e.g. skin cancers. Any 2. 2 @ 1 mark [2]
Mark scheme, page 3
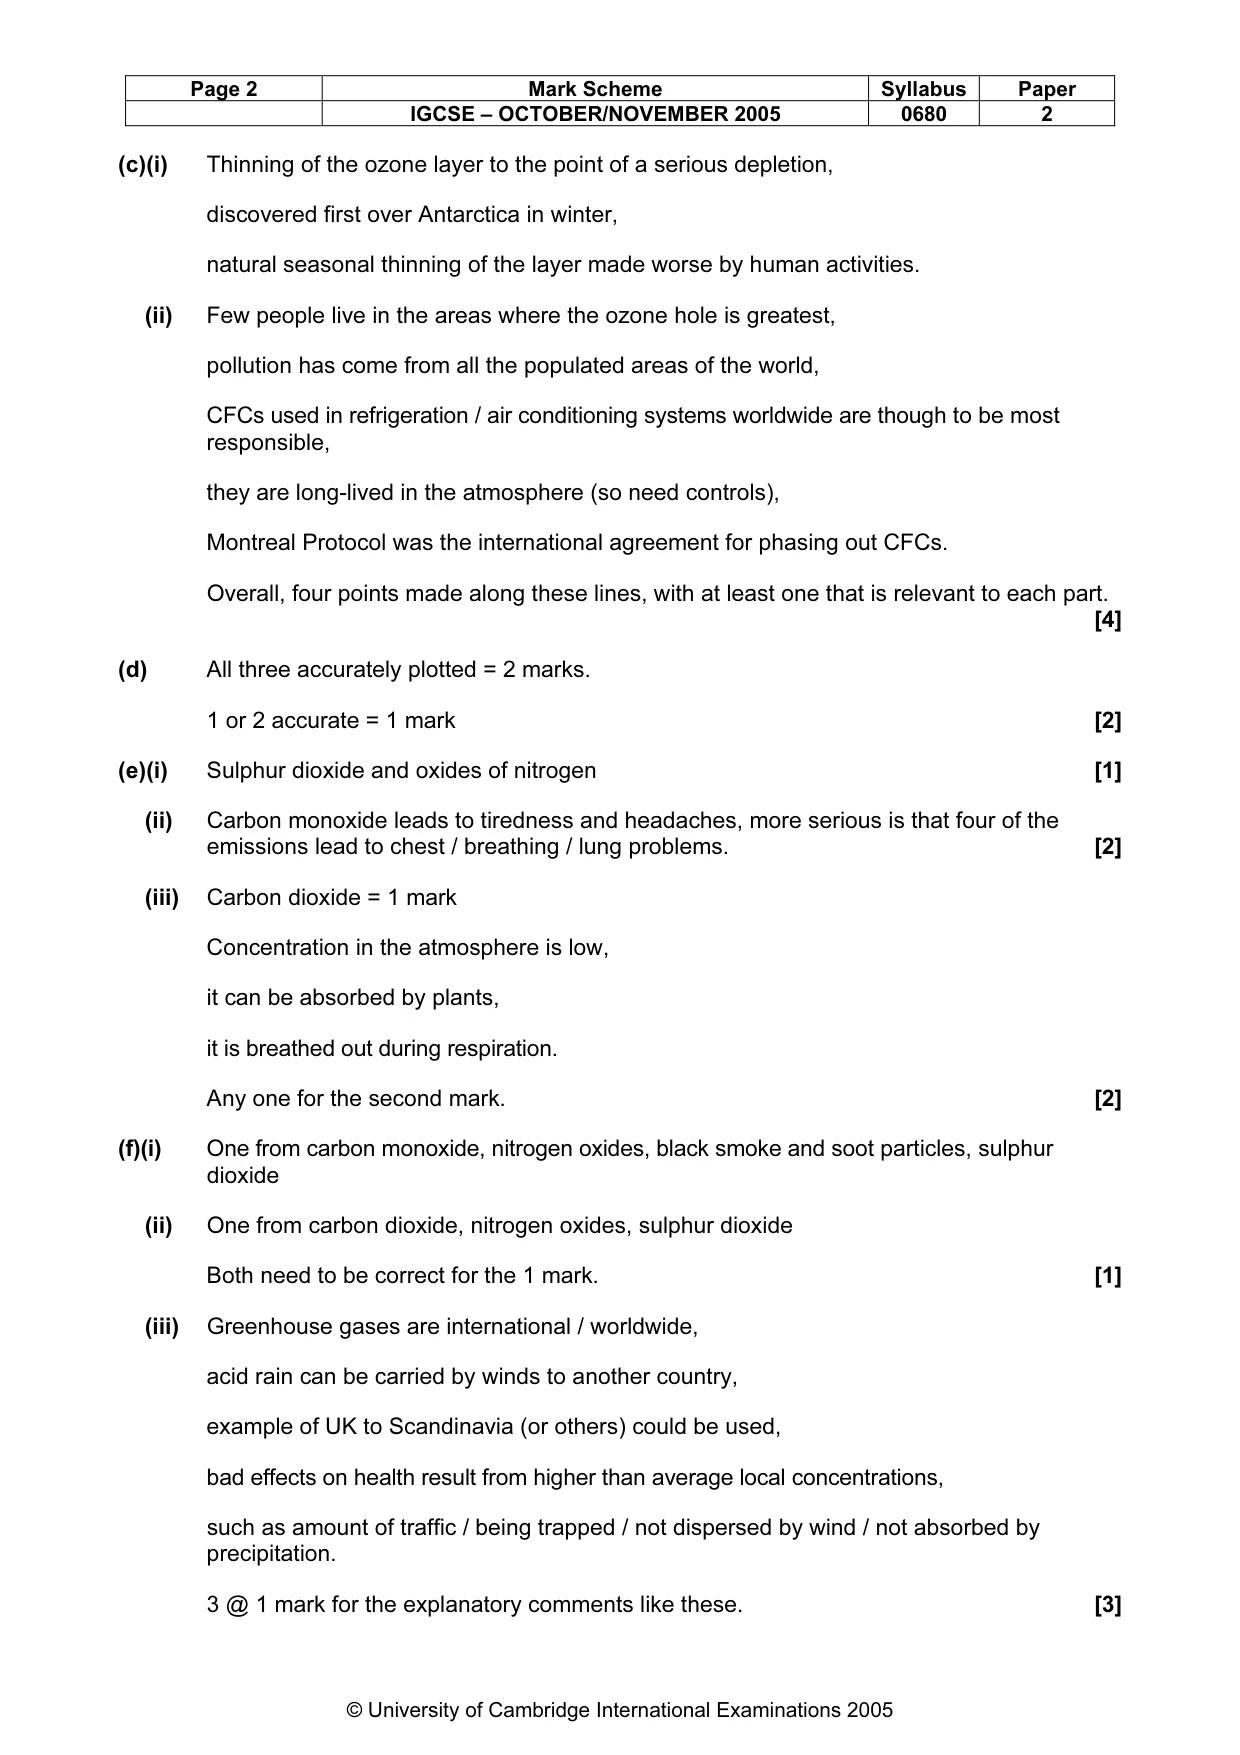
Page 2 Mark Scheme Syllabus Paper IGCSE – OCTOBER/NOVEMBER 2005 0680 2 © University of Cambridge International Examinations 2005 (c)(i) Thinning of the ozone layer to the point of a serious depletion, discovered first over Antarctica in winter, natural seasonal thinning of the layer made worse by human activities. (ii) Few people live in the areas where the ozone hole is greatest, pollution has come from all the populated areas of the world, CFCs used in refrigeration / air conditioning systems worldwide are though to be most responsible, they are long-lived in the atmosphere (so need controls), Montreal Protocol was the international agreement for phasing out CFCs. Overall, four points made along these lines, with at least one that is relevant to each part. [4] (d) All three accurately plotted = 2 marks. 1 or 2 accurate = 1 mark [2] (e)(i) Sulphur dioxide and oxides of nitrogen [1] (ii) Carbon monoxide leads to tiredness and headaches, more serious is that four of the emissions lead to chest / breathing / lung problems. [2] (iii) Carbon dioxide = 1 mark Concentration in the atmosphere is low, it can be absorbed by plants, it is breathed out during respiration. Any one for the second mark. [2] (f)(i) One from carbon monoxide, nitrogen oxides, black smoke and soot particles, sulphur dioxide (ii) One from carbon dioxide, nitrogen oxides, sulphur dioxide Both need to be correct for the 1 mark. [1] (iii) Greenhouse gases are international / worldwide, acid rain can be carried by winds to another country, example of UK to Scandinavia (or others) could be used, bad effects on health result from higher than average local concentrations, such as amount of traffic / being trapped / not dispersed by wind / not absorbed by precipitation. 3 @ 1 mark for the explanatory comments like these. [3]
Mark scheme, page 4
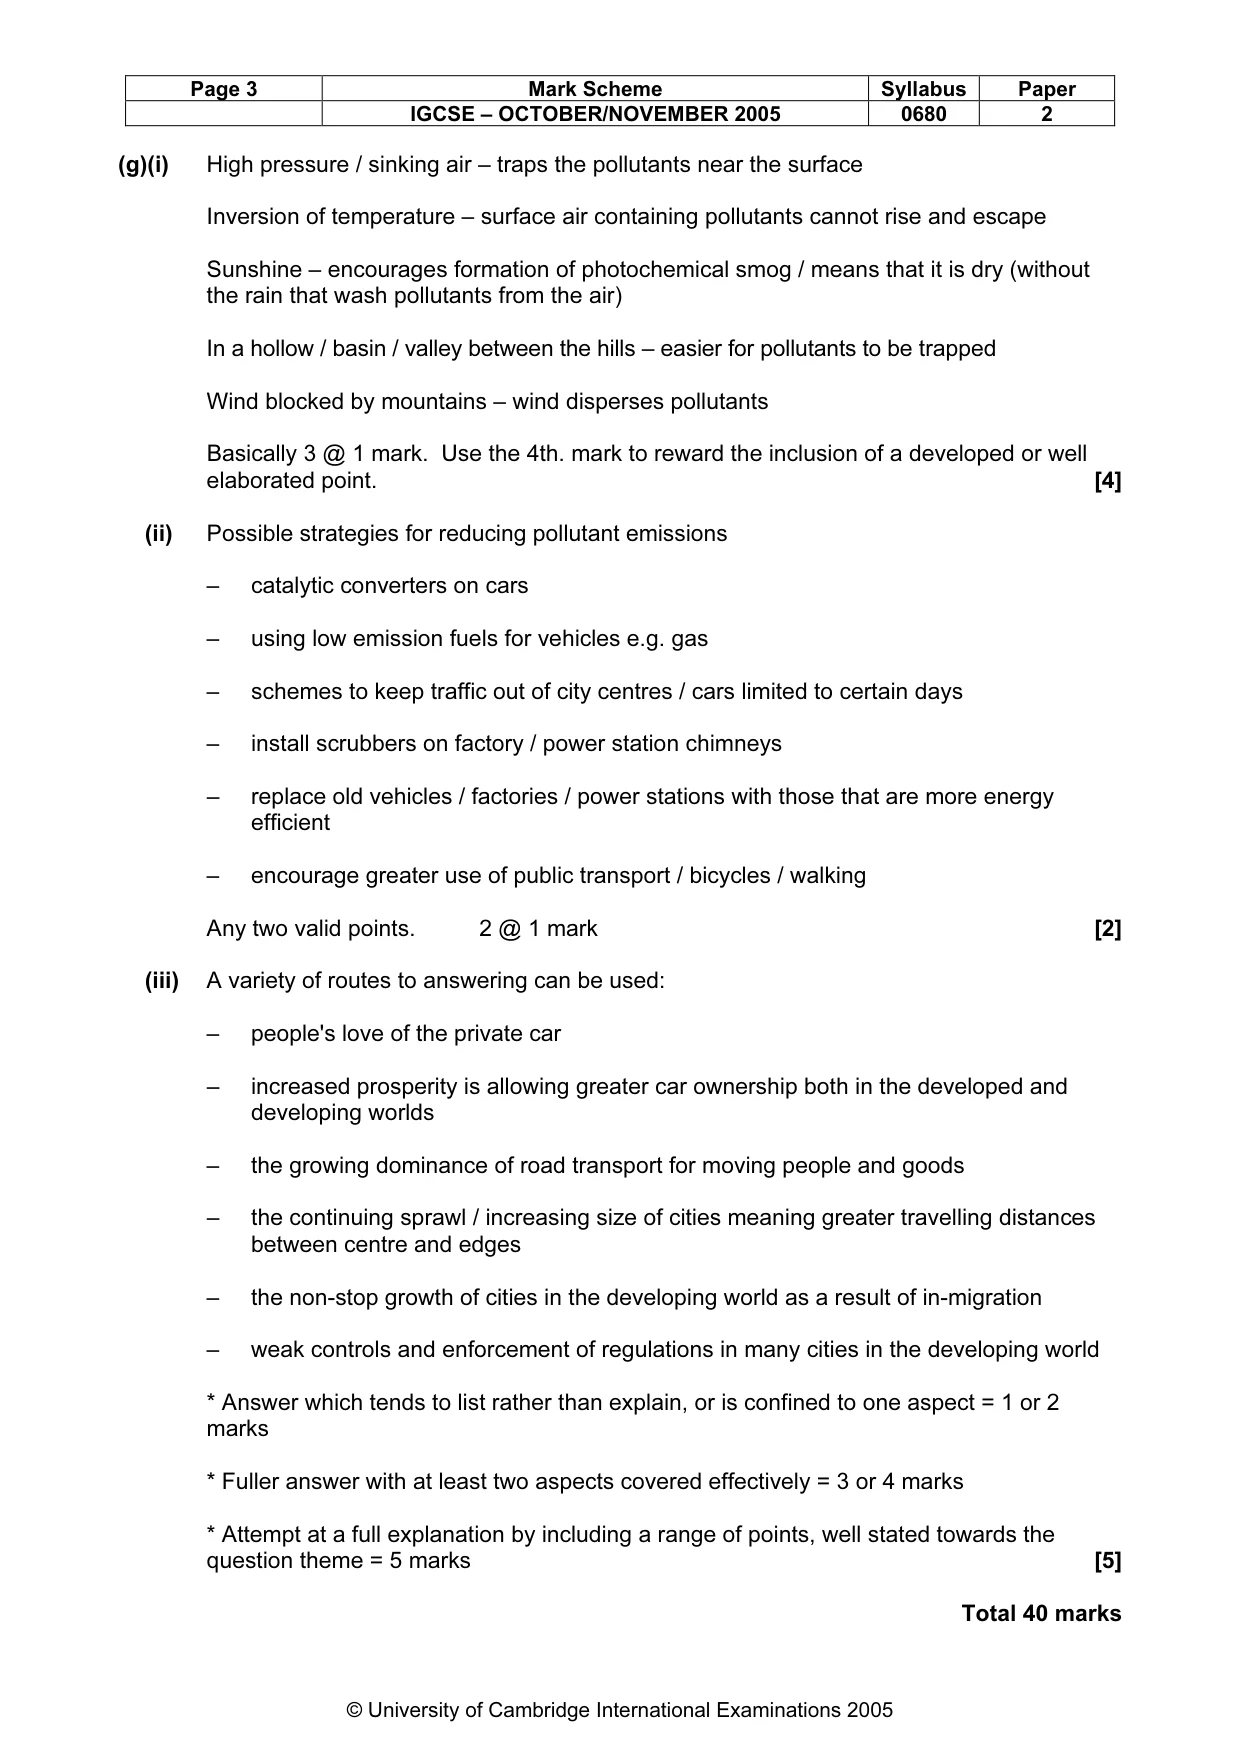
Page 3 Mark Scheme Syllabus Paper IGCSE – OCTOBER/NOVEMBER 2005 0680 2 © University of Cambridge International Examinations 2005 (g)(i) High pressure / sinking air – traps the pollutants near the surface Inversion of temperature – surface air containing pollutants cannot rise and escape Sunshine – encourages formation of photochemical smog / means that it is dry (without the rain that wash pollutants from the air) In a hollow / basin / valley between the hills – easier for pollutants to be trapped Wind blocked by mountains – wind disperses pollutants Basically 3 @ 1 mark. Use the 4th. mark to reward the inclusion of a developed or well elaborated point. [4] (ii) Possible strategies for reducing pollutant emissions – catalytic converters on cars – using low emission fuels for vehicles e.g. gas – schemes to keep traffic out of city centres / cars limited to certain days – install scrubbers on factory / power station chimneys – replace old vehicles / factories / power stations with those that are more energy efficient – encourage greater use of public transport / bicycles / walking Any two valid points. 2 @ 1 mark [2] (iii) A variety of routes to answering can be used: – people's love of the private car – increased prosperity is allowing greater car ownership both in the developed and developing worlds – the growing dominance of road transport for moving people and goods – the continuing sprawl / increasing size of cities meaning greater travelling distances between centre and edges – the non-stop growth of cities in the developing world as a result of in-migration – weak controls and enforcement of regulations in many cities in the developing world * Answer which tends to list rather than explain, or is confined to one aspect = 1 or 2 marks * Fuller answer with at least two aspects covered effectively = 3 or 4 marks * Attempt at a full explanation by including a range of points, well stated towards the question theme = 5 marks [5] Total 40 marks
Mark scheme, page 5
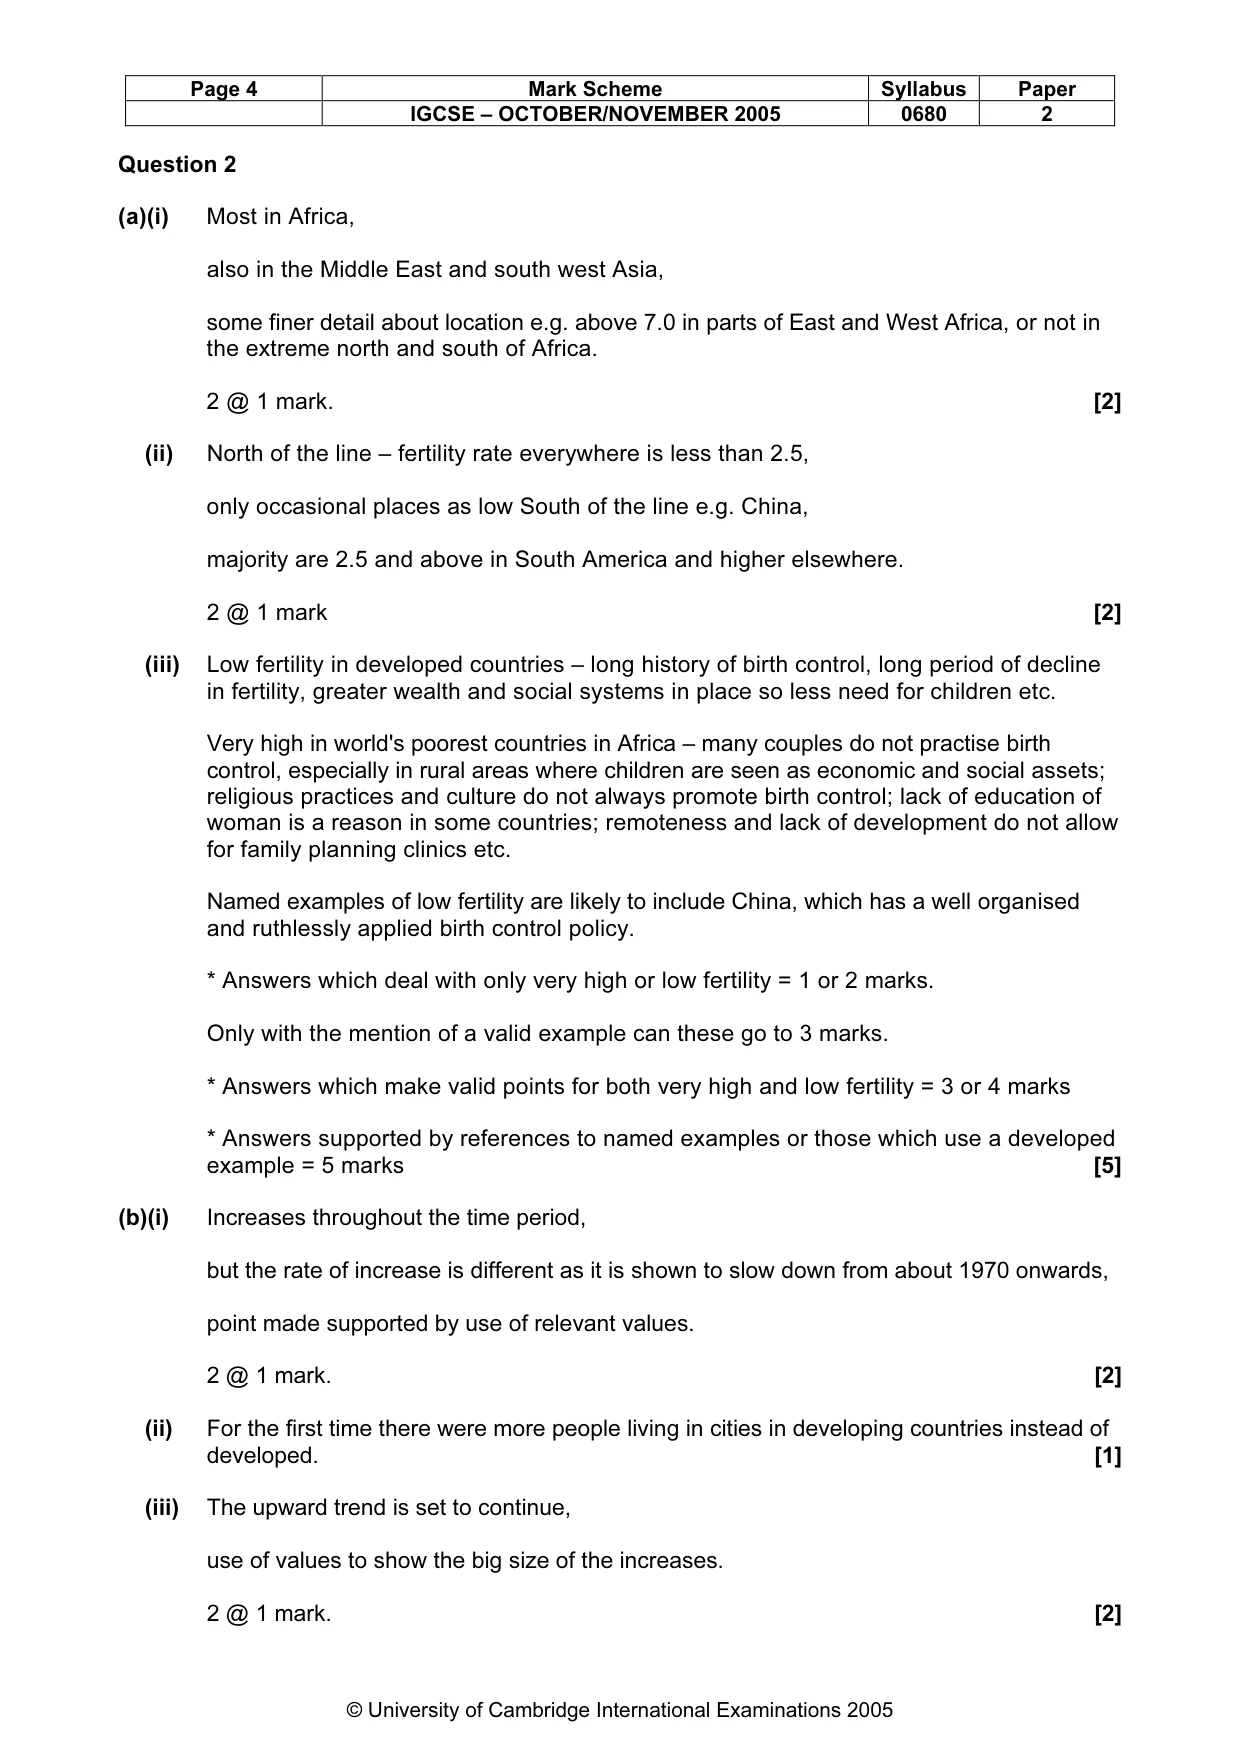
Page 4 Mark Scheme Syllabus Paper IGCSE – OCTOBER/NOVEMBER 2005 0680 2 © University of Cambridge International Examinations 2005 Question 2 (a)(i) Most in Africa, also in the Middle East and south west Asia, some finer detail about location e.g. above 7.0 in parts of East and West Africa, or not in the extreme north and south of Africa. 2 @ 1 mark. [2] (ii) North of the line – fertility rate everywhere is less than 2.5, only occasional places as low South of the line e.g. China, majority are 2.5 and above in South America and higher elsewhere. 2 @ 1 mark [2] (iii) Low fertility in developed countries – long history of birth control, long period of decline in fertility, greater wealth and social systems in place so less need for children etc. Very high in world's poorest countries in Africa – many couples do not practise birth control, especially in rural areas where children are seen as economic and social assets; religious practices and culture do not always promote birth control; lack of education of woman is a reason in some countries; remoteness and lack of development do not allow for family planning clinics etc. Named examples of low fertility are likely to include China, which has a well organised and ruthlessly applied birth control policy. * Answers which deal with only very high or low fertility = 1 or 2 marks. Only with the mention of a valid example can these go to 3 marks. * Answers which make valid points for both very high and low fertility = 3 or 4 marks * Answers supported by references to named examples or those which use a developed example = 5 marks [5] (b)(i) Increases throughout the time period, but the rate of increase is different as it is shown to slow down from about 1970 onwards, point made supported by use of relevant values. 2 @ 1 mark. [2] (ii) For the first time there were more people living in cities in developing countries instead of developed. [1] (iii) The upward trend is set to continue, use of values to show the big size of the increases. 2 @ 1 mark. [2]
Mark scheme, page 6
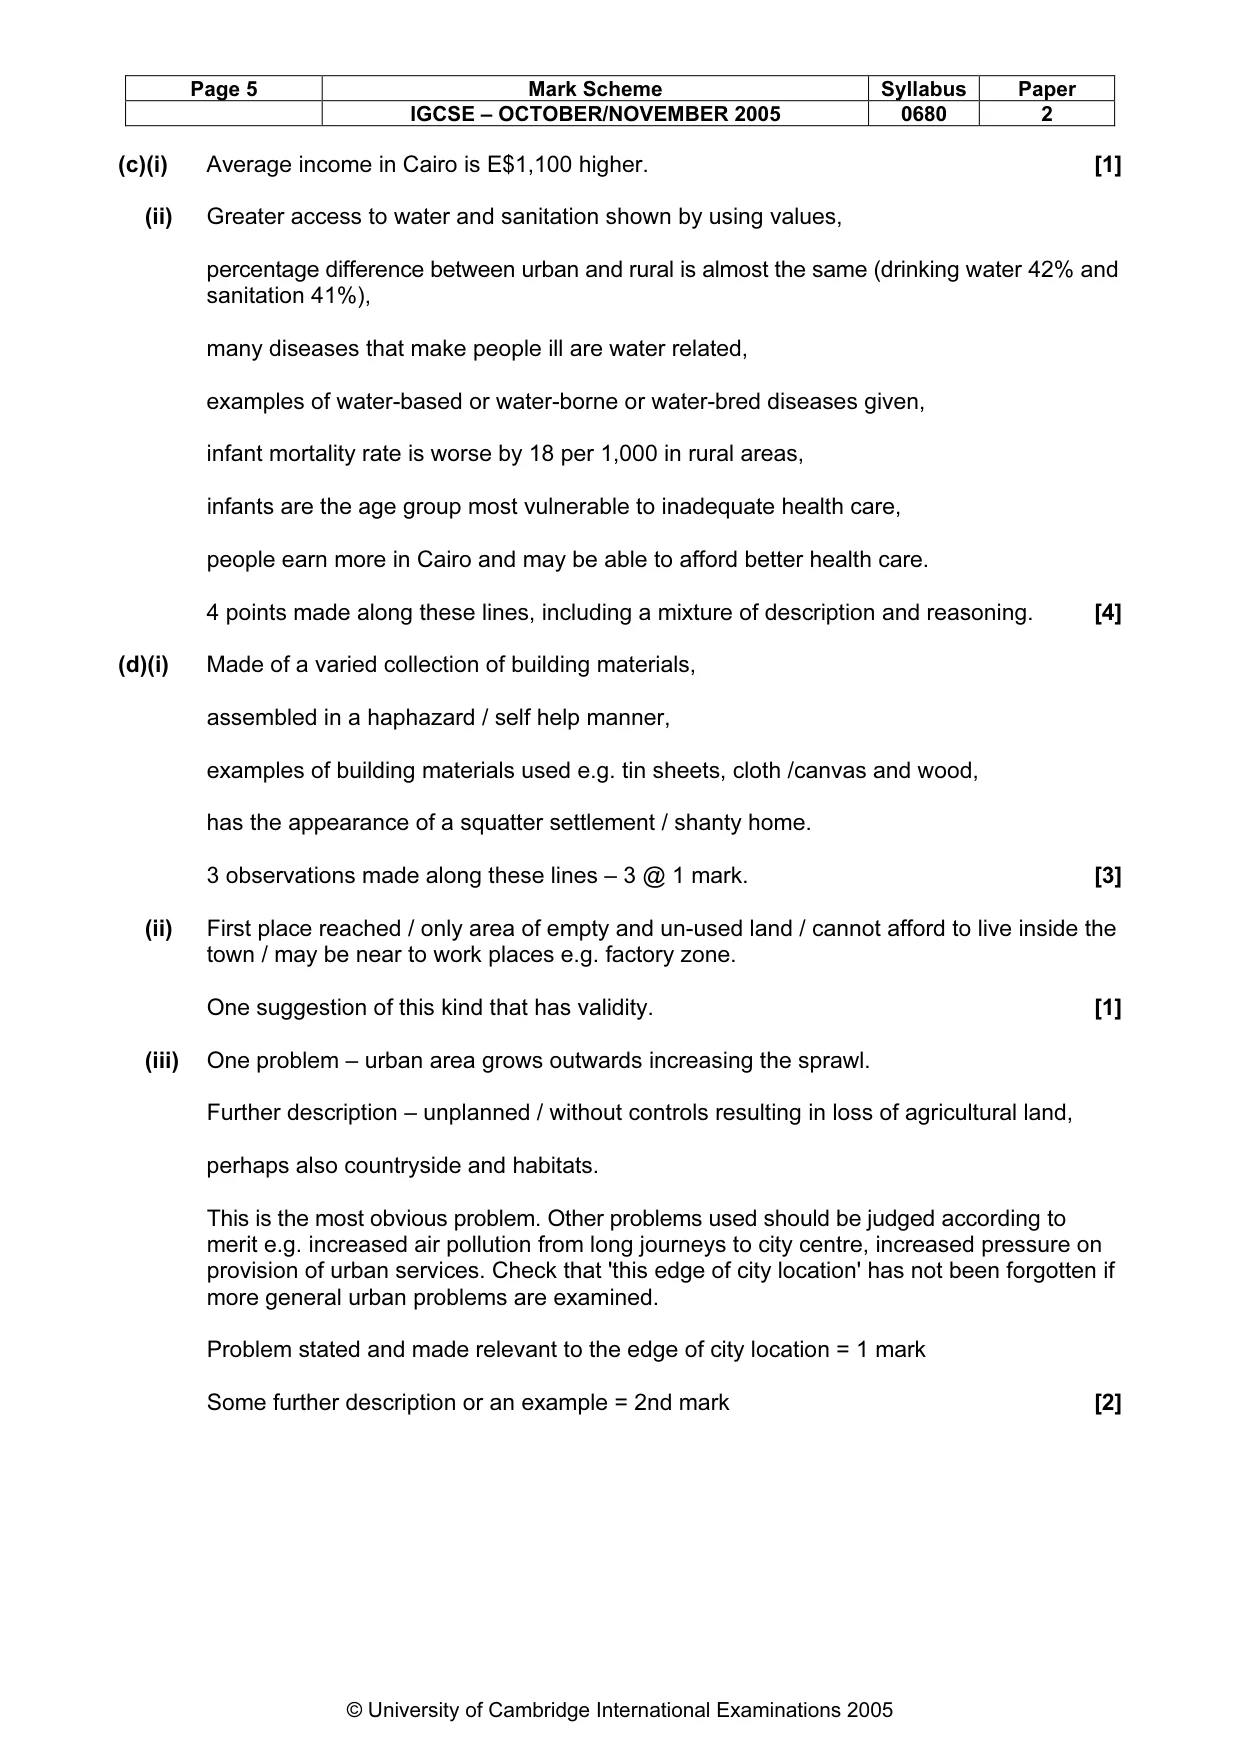
Page 5 Mark Scheme Syllabus Paper IGCSE – OCTOBER/NOVEMBER 2005 0680 2 © University of Cambridge International Examinations 2005 (c)(i) Average income in Cairo is E$1,100 higher. [1] (ii) Greater access to water and sanitation shown by using values, percentage difference between urban and rural is almost the same (drinking water 42% and sanitation 41%), many diseases that make people ill are water related, examples of water-based or water-borne or water-bred diseases given, infant mortality rate is worse by 18 per 1,000 in rural areas, infants are the age group most vulnerable to inadequate health care, people earn more in Cairo and may be able to afford better health care. 4 points made along these lines, including a mixture of description and reasoning. [4] (d)(i) Made of a varied collection of building materials, assembled in a haphazard / self help manner, examples of building materials used e.g. tin sheets, cloth /canvas and wood, has the appearance of a squatter settlement / shanty home. 3 observations made along these lines – 3 @ 1 mark. [3] (ii) First place reached / only area of empty and un-used land / cannot afford to live inside the town / may be near to work places e.g. factory zone. One suggestion of this kind that has validity. [1] (iii) One problem – urban area grows outwards increasing the sprawl. Further description – unplanned / without controls resulting in loss of agricultural land, perhaps also countryside and habitats. This is the most obvious problem. Other problems used should be judged according to merit e.g. increased air pollution from long journeys to city centre, increased pressure on provision of urban services. Check that 'this edge of city location' has not been forgotten if more general urban problems are examined. Problem stated and made relevant to the edge of city location = 1 mark Some further description or an example = 2nd mark [2]
Mark scheme, page 7
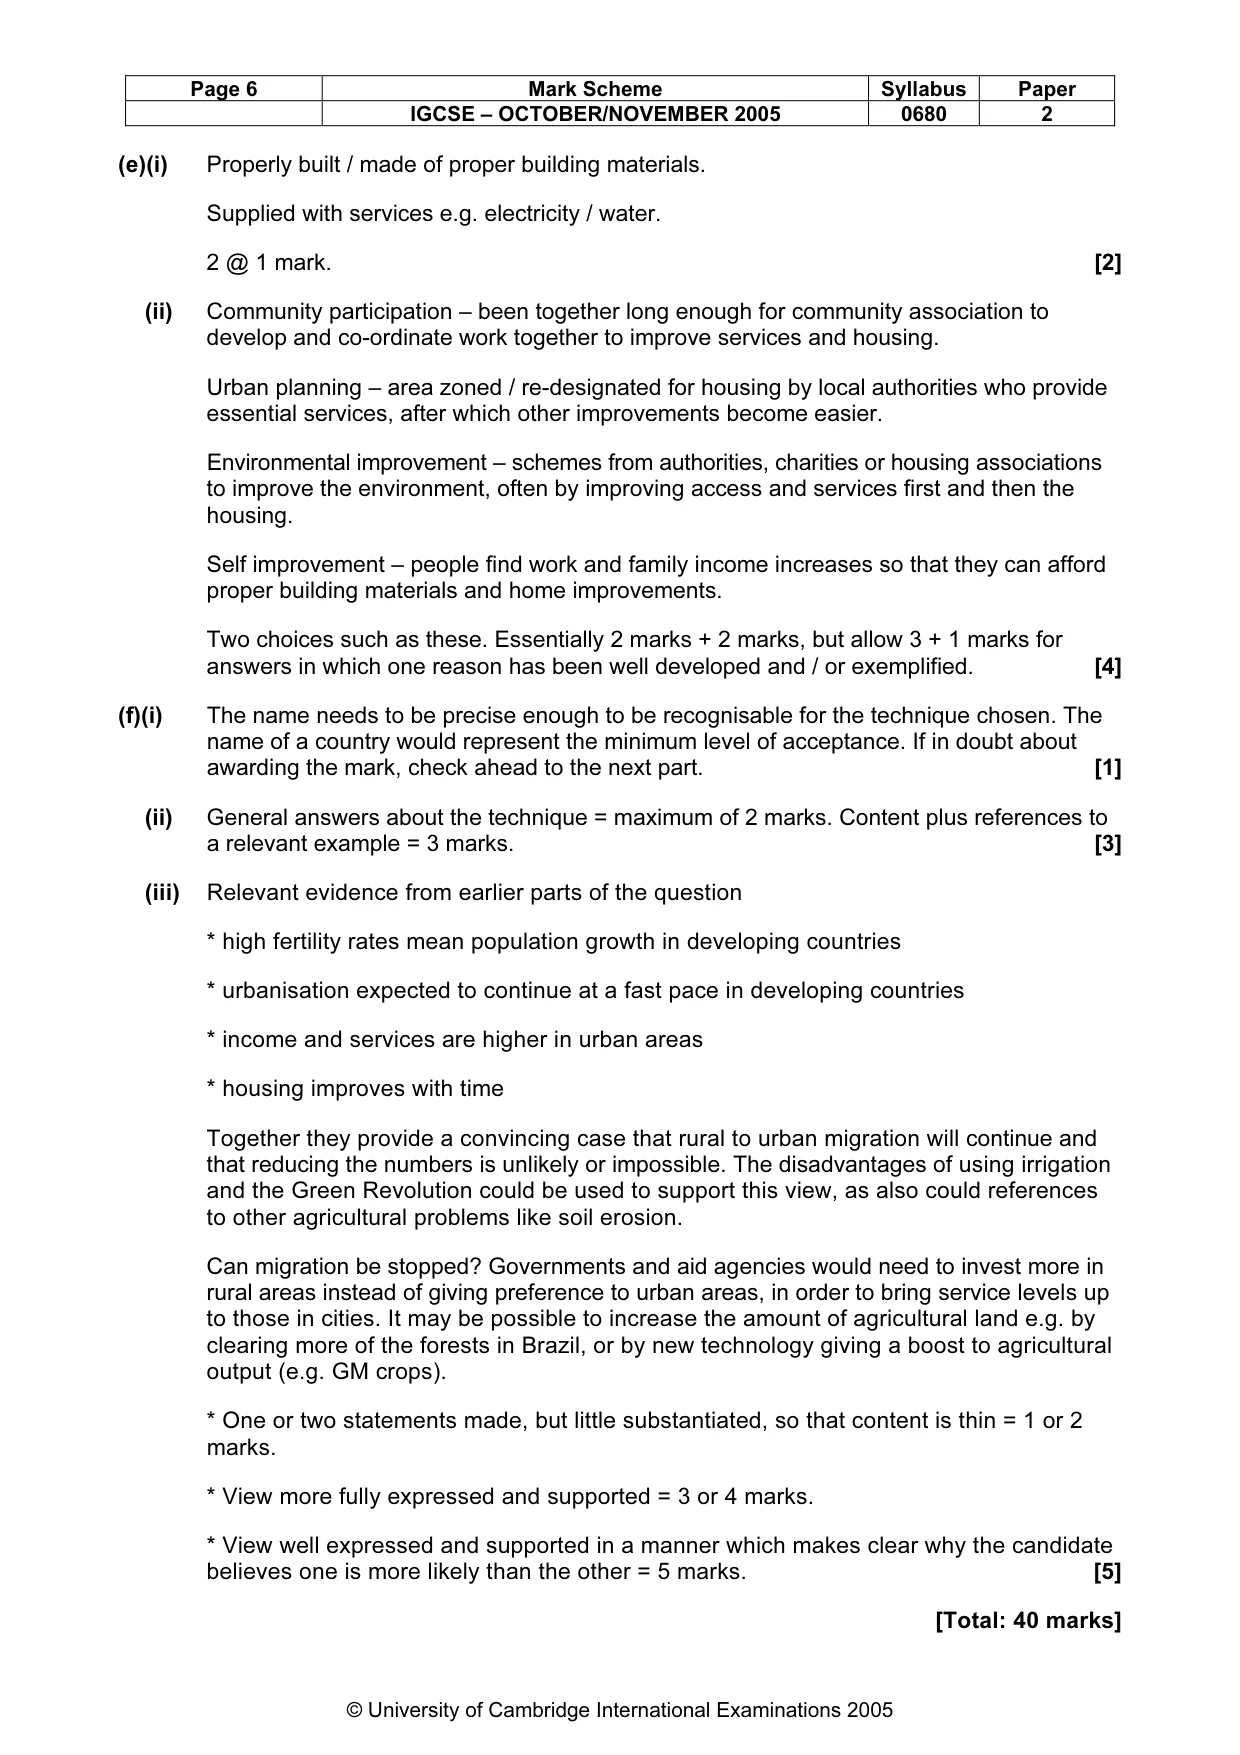
Page 6 Mark Scheme Syllabus Paper IGCSE – OCTOBER/NOVEMBER 2005 0680 2 © University of Cambridge International Examinations 2005 (e)(i) Properly built / made of proper building materials. Supplied with services e.g. electricity / water. 2 @ 1 mark. [2] (ii) Community participation – been together long enough for community association to develop and co-ordinate work together to improve services and housing. Urban planning – area zoned / re-designated for housing by local authorities who provide essential services, after which other improvements become easier. Environmental improvement – schemes from authorities, charities or housing associations to improve the environment, often by improving access and services first and then the housing. Self improvement – people find work and family income increases so that they can afford proper building materials and home improvements. Two choices such as these. Essentially 2 marks + 2 marks, but allow 3 + 1 marks for answers in which one reason has been well developed and / or exemplified. [4] (f)(i) The name needs to be precise enough to be recognisable for the technique chosen. The name of a country would represent the minimum level of acceptance. If in doubt about awarding the mark, check ahead to the next part. [1] (ii) General answers about the technique = maximum of 2 marks. Content plus references to a relevant example = 3 marks. [3] (iii) Relevant evidence from earlier parts of the question * high fertility rates mean population growth in developing countries * urbanisation expected to continue at a fast pace in developing countries * income and services are higher in urban areas * housing improves with time Together they provide a convincing case that rural to urban migration will continue and that reducing the numbers is unlikely or impossible. The disadvantages of using irrigation and the Green Revolution could be used to support this view, as also could references to other agricultural problems like soil erosion. Can migration be stopped? Governments and aid agencies would need to invest more in rural areas instead of giving preference to urban areas, in order to bring service levels up to those in cities. It may be possible to increase the amount of agricultural land e.g. by clearing more of the forests in Brazil, or by new technology giving a boost to agricultural output (e.g. GM crops). * One or two statements made, but little substantiated, so that content is thin = 1 or 2 marks. * View more fully expressed and supported = 3 or 4 marks. * View well expressed and supported in a manner which makes clear why the candidate believes one is more likely than the other = 5 marks. [5] [Total: 40 marks]