Cambridge IGCSE Environmental Management 0680 — 2005 May/June Paper 2 · Variant 1
0680/21/M/J/05
The question paper and its mark scheme, free to read here and free to download. This is Cambridge’s own paper, exactly as it was sat.
Question paper16 pages
Mark scheme8 pages
Answers below. Sit the paper first if you are practising.
Paper as text
Question paper, page 1
This document consists of 16 printed pages. SPA (DR) S92059/3.1 © UCLES 2005 [Turn over UNIVERSITY OF CAMBRIDGE INTERNATIONAL EXAMINATIONS International General Certificate of Secondary Education ENVIRONMENTAL MANAGEMENT Paper 2 0680/02 May/June 2005 1 hour 45 minutes Candidates answer on the Question Paper. Additional Materials: Ruler (cm/mm) READ THESE INSTRUCTIONS FIRST Write your Centre number, candidate number and name on all the work you hand in. Write in dark blue or black pen in the spaces provided on the Question Paper. You may use a soft pencil for any diagrams, graphs or rough working. Do not use staples, paper clips, highlighters, glue or correction fluid. Answer both questions. The number of marks is given in brackets [ ] at the end of each question or part question. DO NOT WRITE IN THE BARCODE. DO NOT WRITE IN THE GREY AREAS BETWEEN THE PAGES. FOR EXAMINER’S USE 1 2 TOTAL Candidate Name Centre Number Candidate Number www.XtremePapers.com
Question paper, page 2
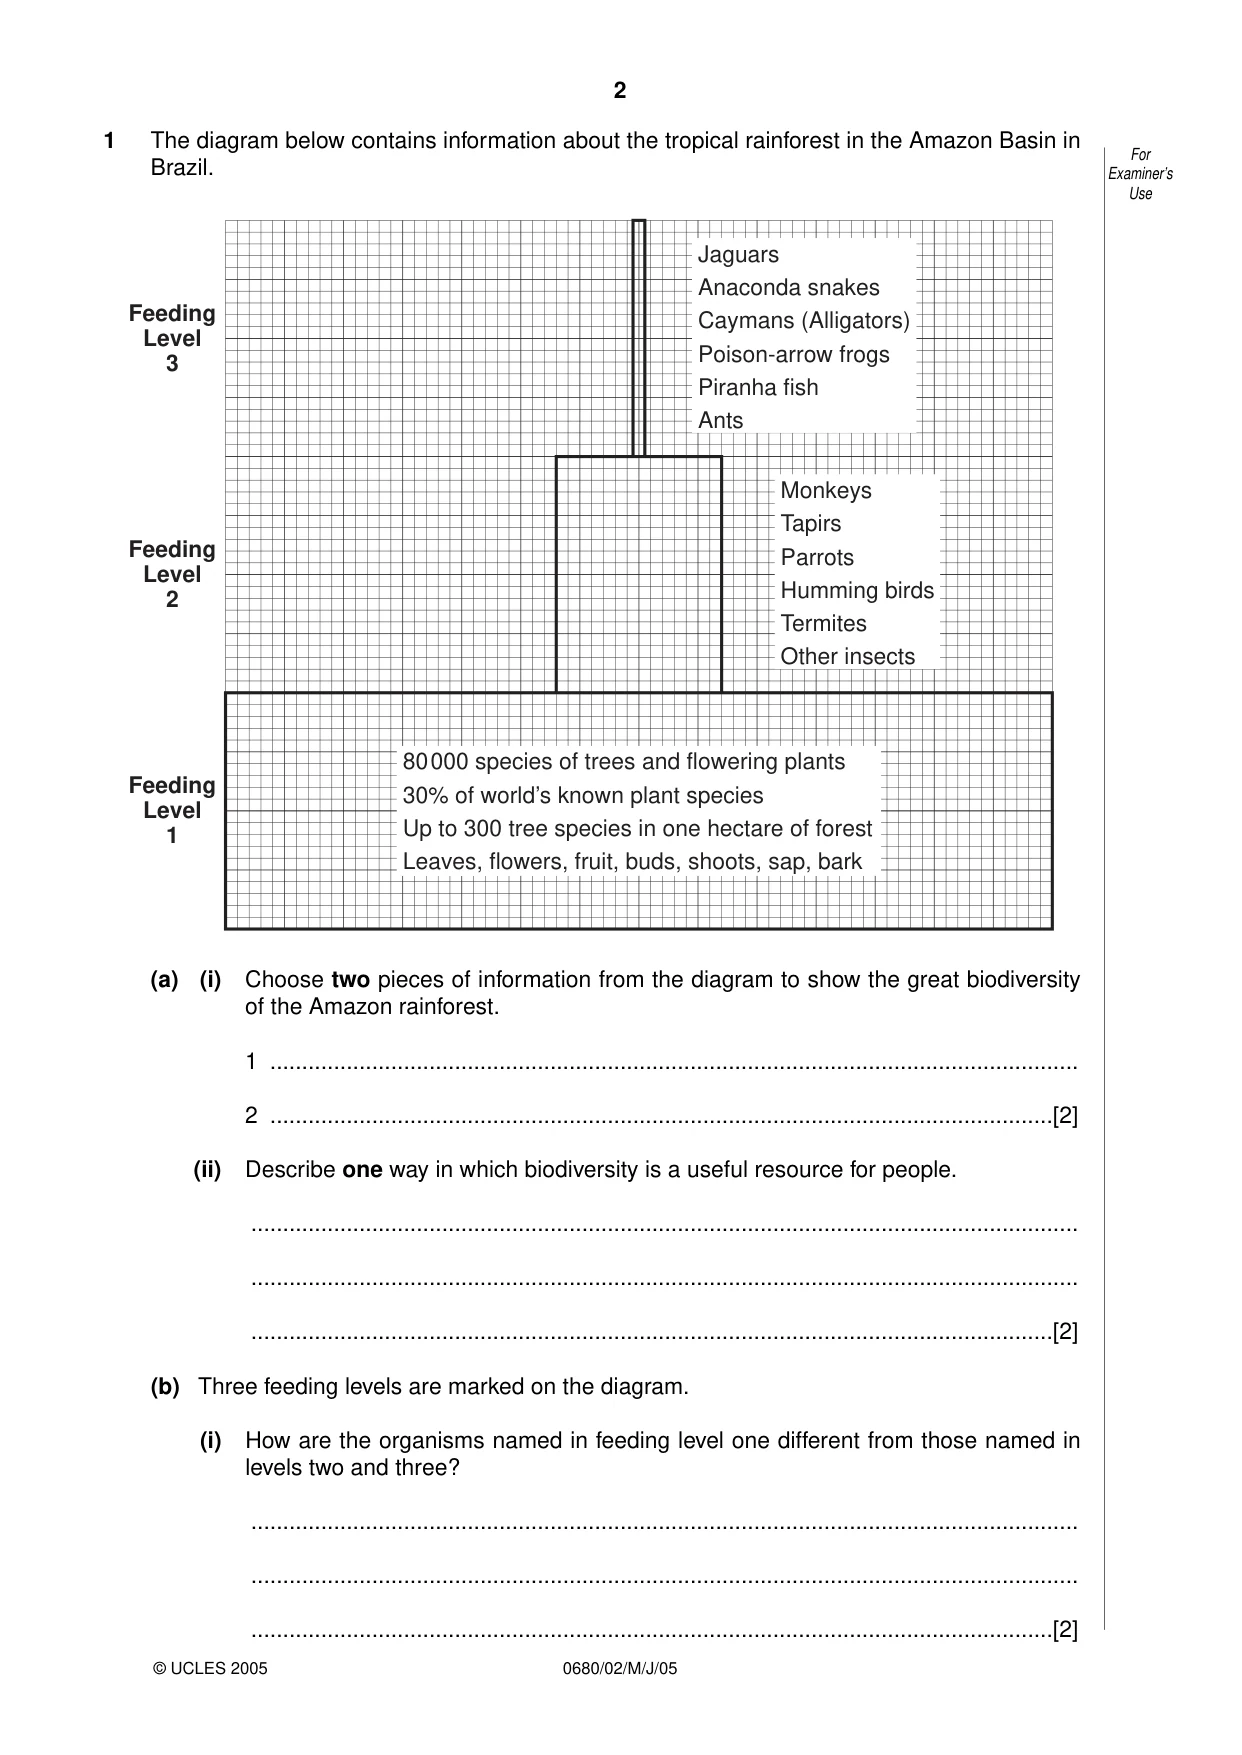
2 0680/02/M/J/05 1 The diagram below contains information about the tropical rainforest in the Amazon Basin in Brazil. (a) (i) Choose two pieces of information from the diagram to show the great biodiversity of the Amazon rainforest. 1 … 2 …[2] (ii) Describe one way in which biodiversity is a useful resource for people. … … …[2] (b) Three feeding levels are marked on the diagram. (i) How are the organisms named in feeding level one different from those named in levels two and three? … … …[2] Feeding Level 3 Feeding Level 2 Feeding Level 1 Jaguars Anaconda snakes Caymans (Alligators) Poison-arrow frogs Piranha fish Ants Monkeys Tapirs Parrots Humming birds Termites Other insects 80000 species of trees and flowering plants 30% of world’s known plant species Up to 300 tree species in one hectare of forest Leaves, flowers, fruit, buds, shoots, sap, bark For Examiner’s Use © UCLES 2005
Question paper, page 3
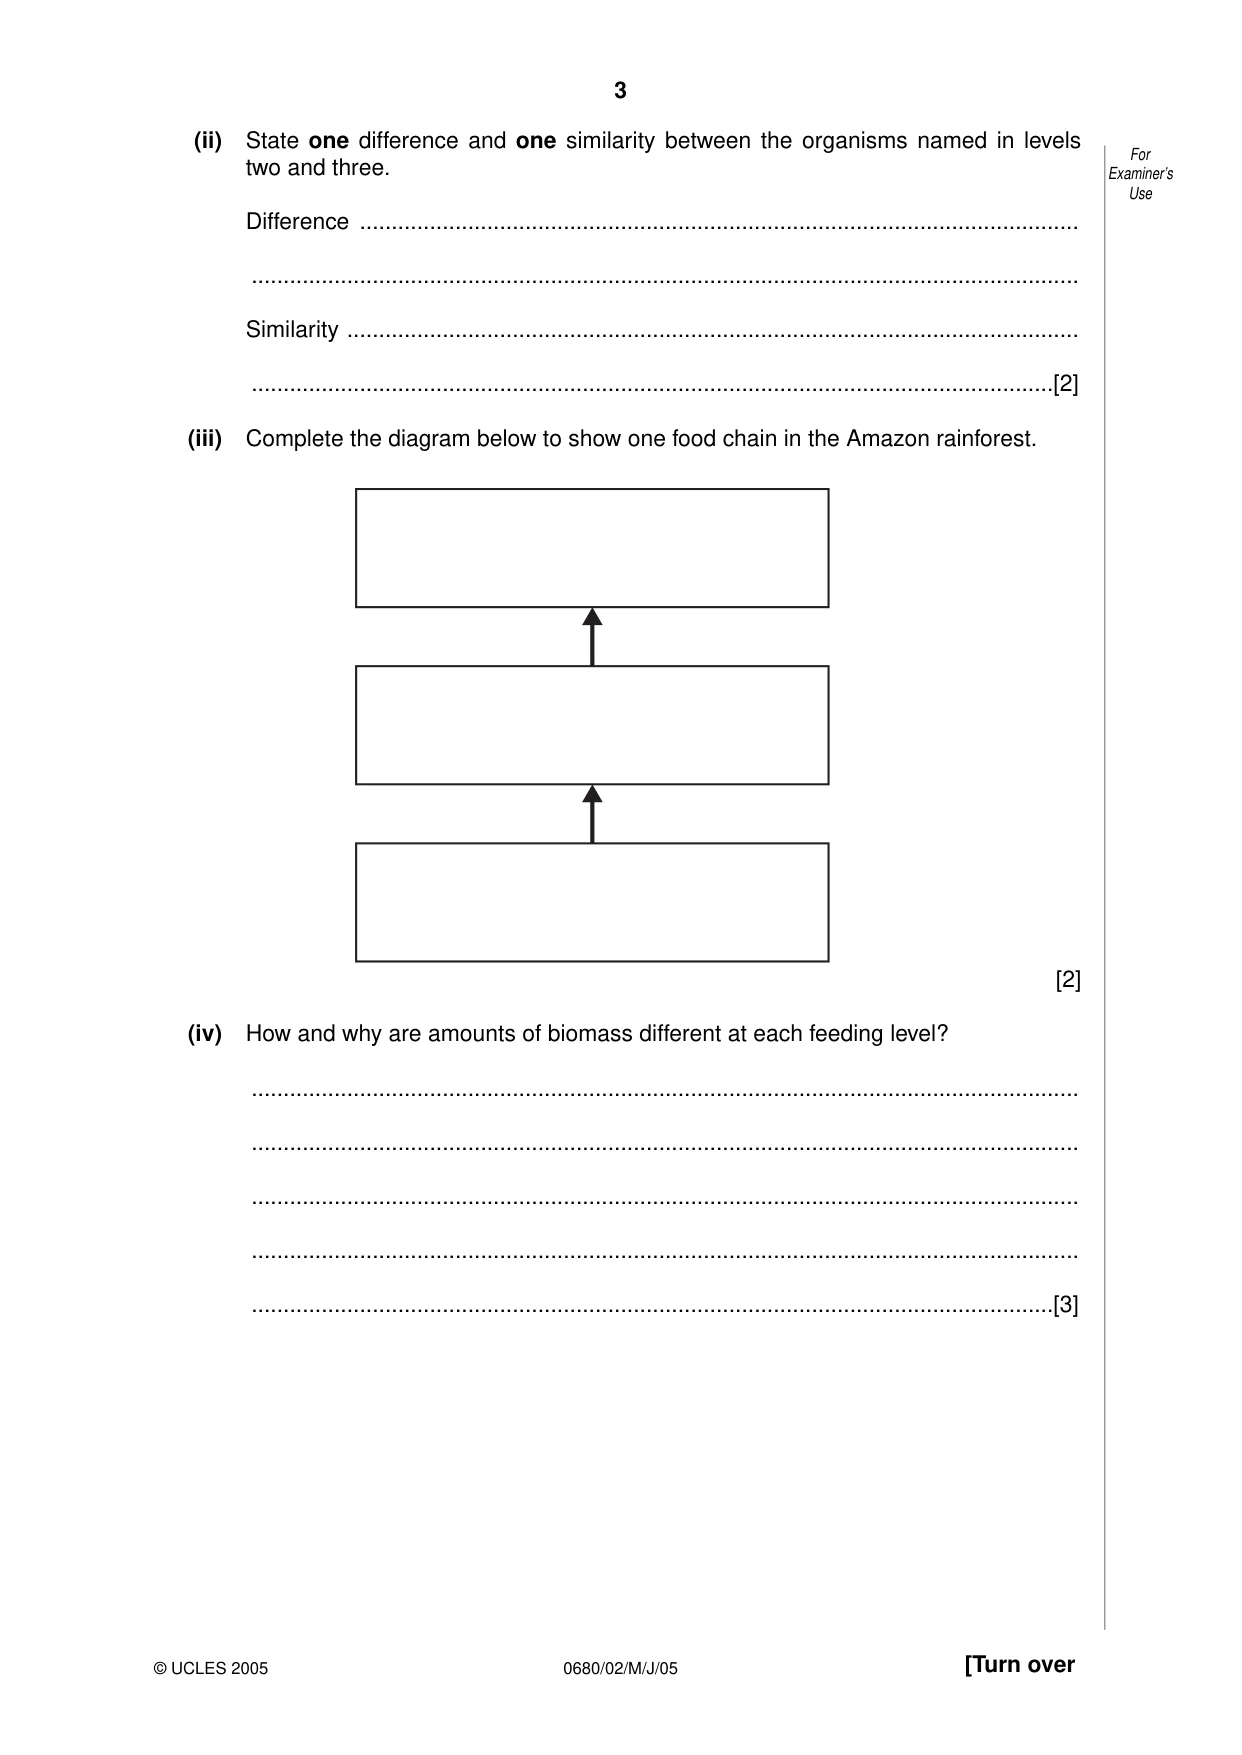
3 0680/02/M/J/05 [Turn over (ii) State one difference and one similarity between the organisms named in levels two and three. Difference … … Similarity … …[2] (iii) Complete the diagram below to show one food chain in the Amazon rainforest. [2] (iv) How and why are amounts of biomass different at each feeding level? … … … … …[3] For Examiner’s Use © UCLES 2005
Question paper, page 4
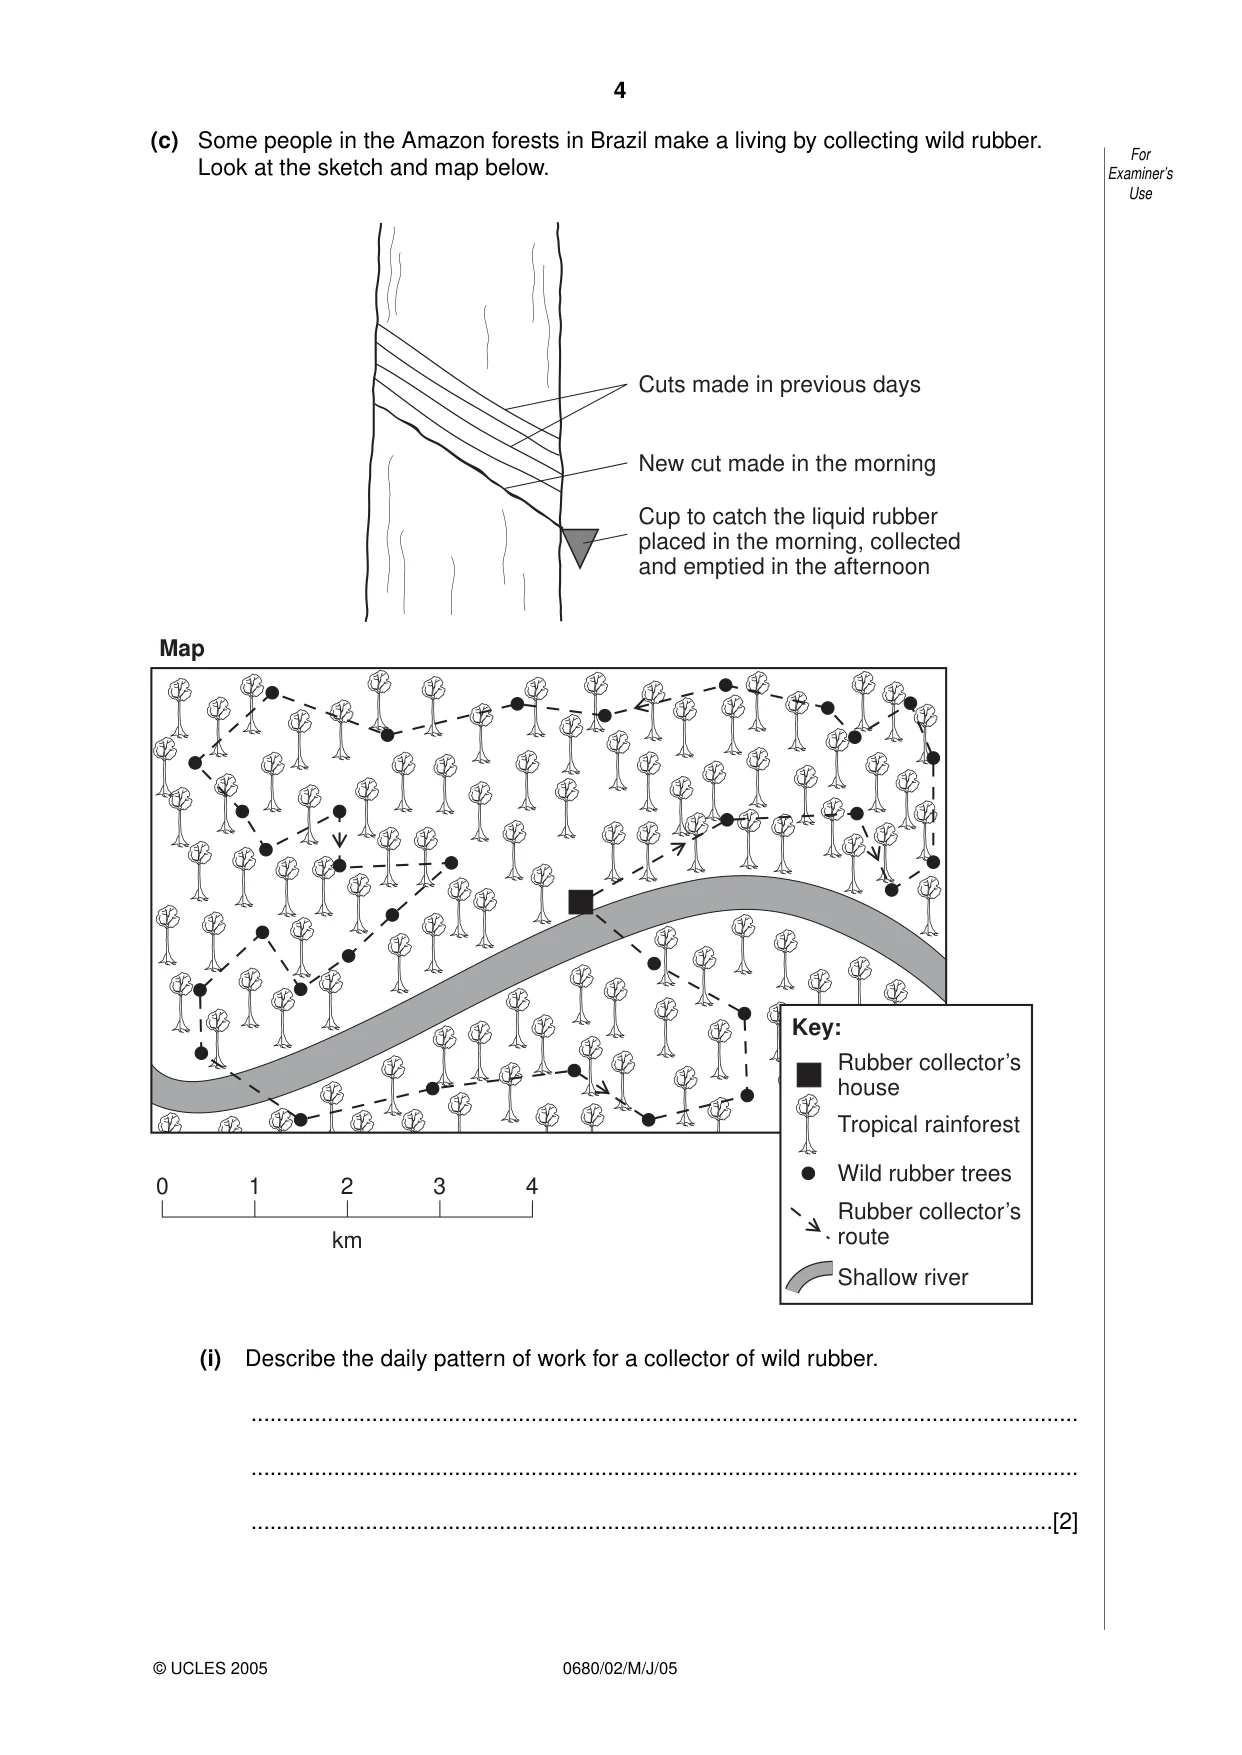
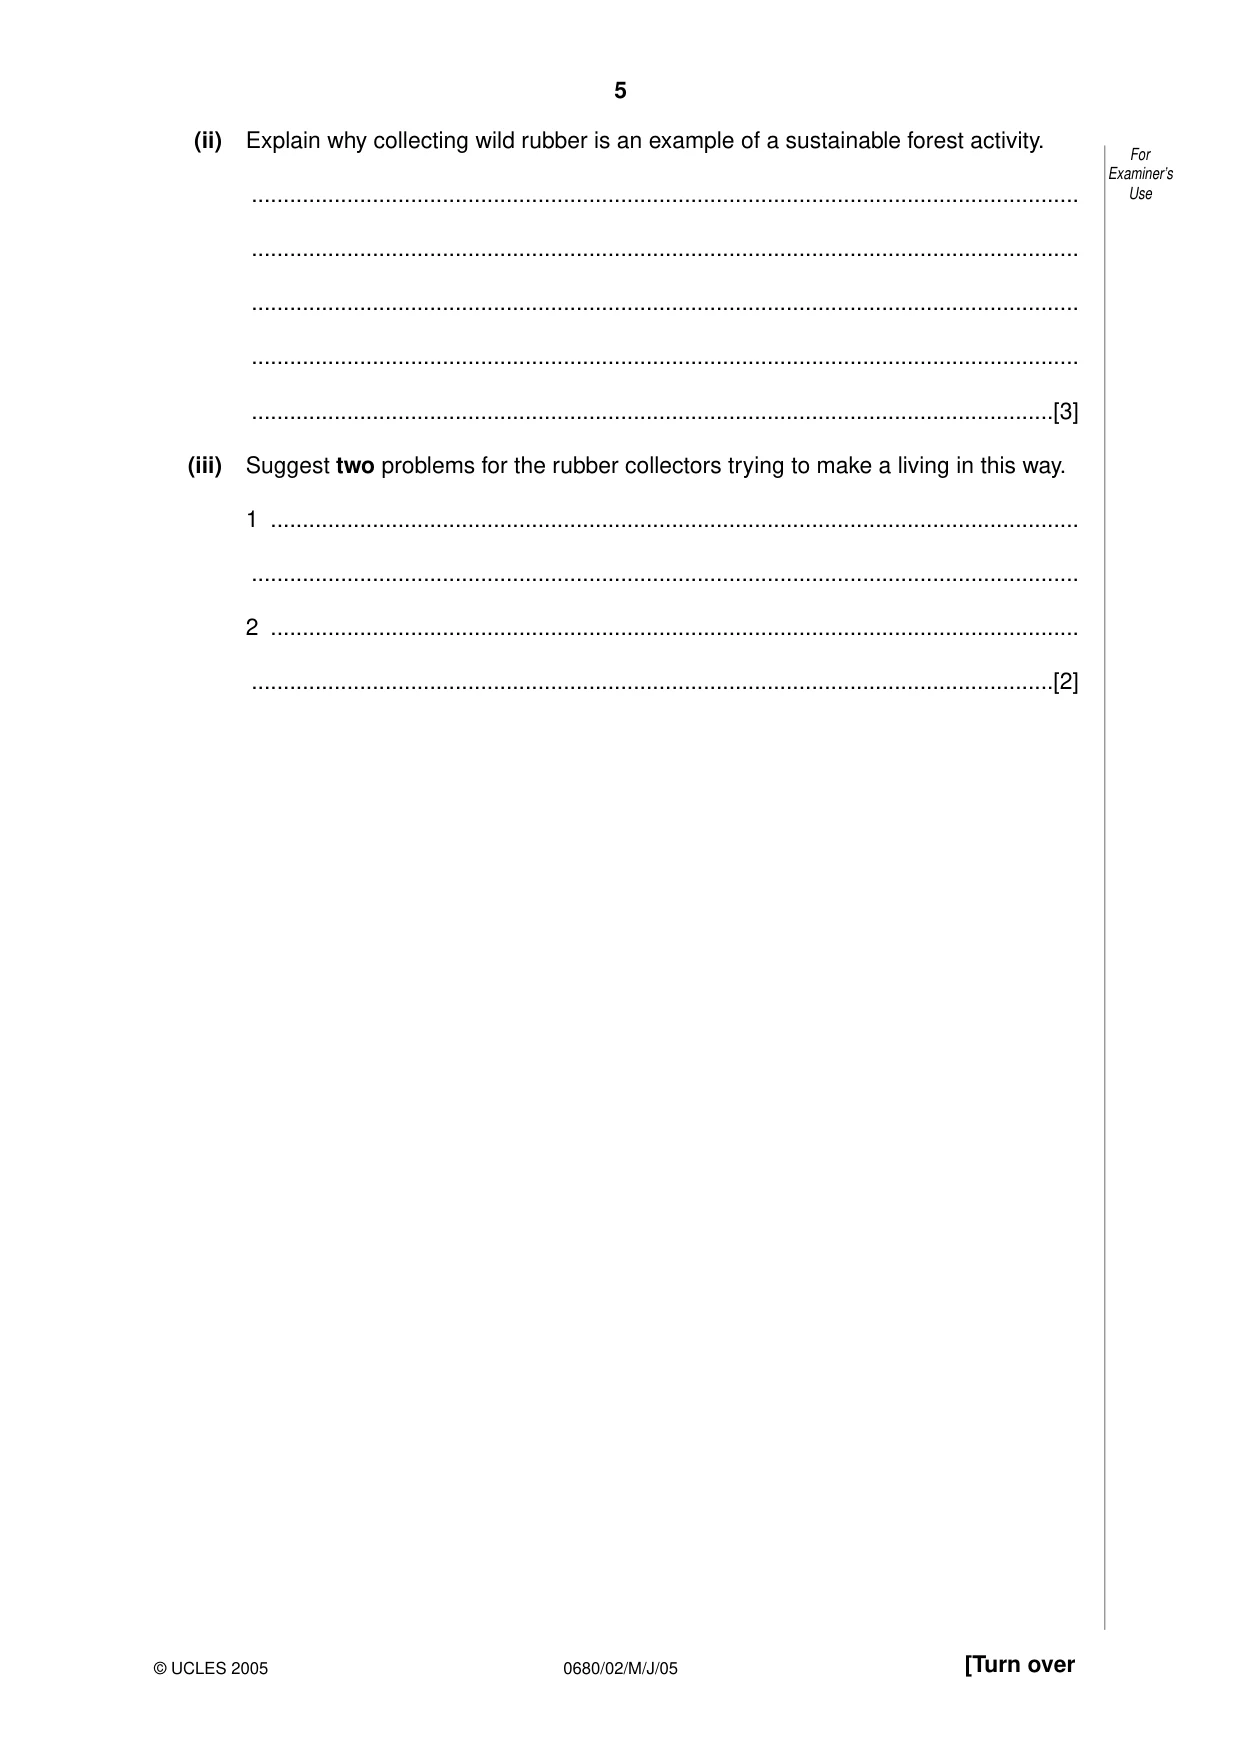
4 0680/02/M/J/05 (c) Some people in the Amazon forests in Brazil make a living by collecting wild rubber. Look at the sketch and map below. (i) Describe the daily pattern of work for a collector of wild rubber. … … …[2] Key: Rubber collector’s house Tropical rainforest Wild rubber trees Shallow river Rubber collector’s route 0 1 2 km 3 4 Cuts made in previous days New cut made in the morning Cup to catch the liquid rubber placed in the morning, collected and emptied in the afternoon Map For Examiner’s Use © UCLES 2005
Question paper, page 5
5 0680/02/M/J/05 [Turn over (ii) Explain why collecting wild rubber is an example of a sustainable forest activity. … … … … …[3] (iii) Suggest two problems for the rubber collectors trying to make a living in this way. 1 … … 2 … …[2] For Examiner’s Use © UCLES 2005
Question paper, page 6
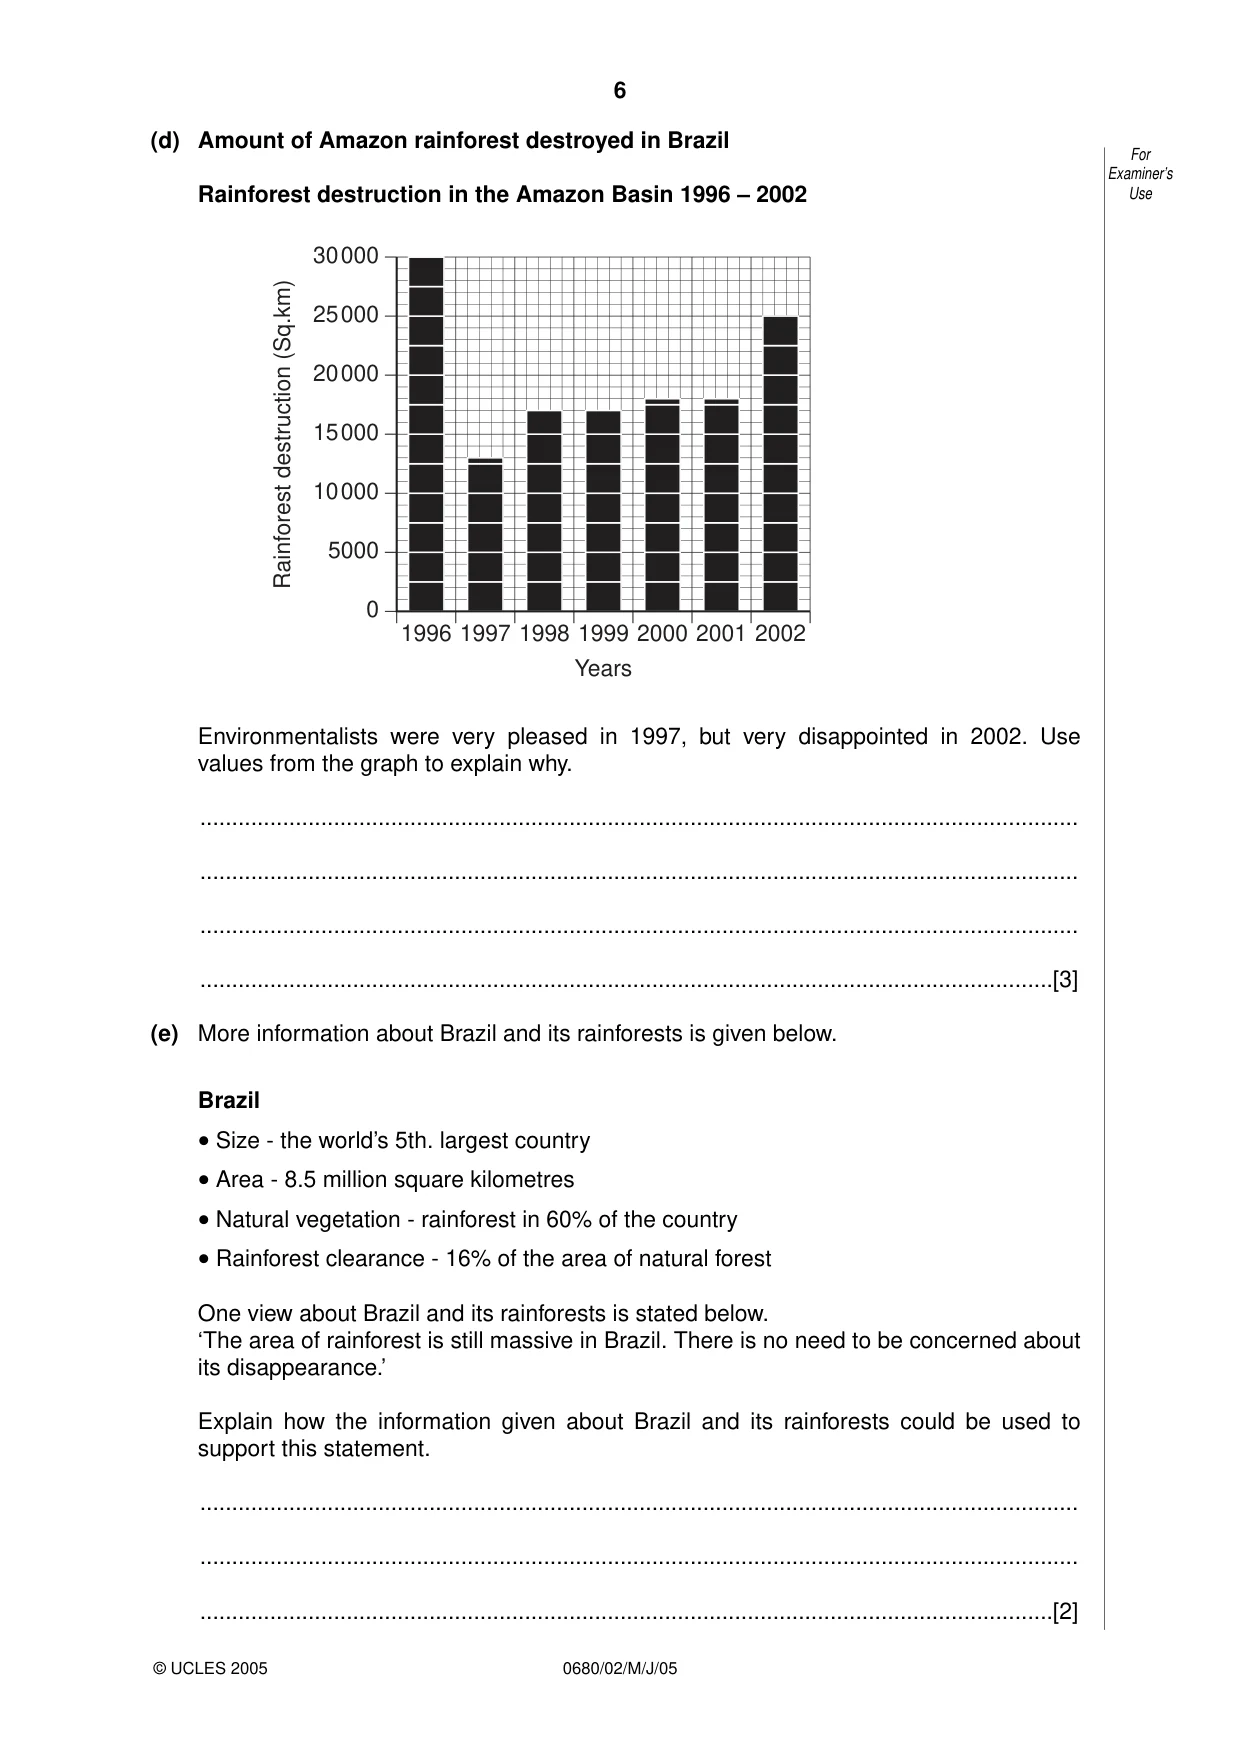
6 0680/02/M/J/05 (d) Amount of Amazon rainforest destroyed in Brazil Rainforest destruction in the Amazon Basin 1996 – 2002 Environmentalists were very pleased in 1997, but very disappointed in 2002. Use values from the graph to explain why. … … … …[3] (e) More information about Brazil and its rainforests is given below. Brazil • Size - the world’s 5th. largest country • Area - 8.5 million square kilometres • Natural vegetation - rainforest in 60% of the country • Rainforest clearance - 16% of the area of natural forest One view about Brazil and its rainforests is stated below. ‘The area of rainforest is still massive in Brazil. There is no need to be concerned about its disappearance.’ Explain how the information given about Brazil and its rainforests could be used to support this statement. … … …[2] 1996 1997 1998 1999 2000 2001 2002 Rainforest destruction (Sq.km) Years 0 5000 10000 15000 20000 25000 30000 For Examiner’s Use © UCLES 2005
Question paper, page 7
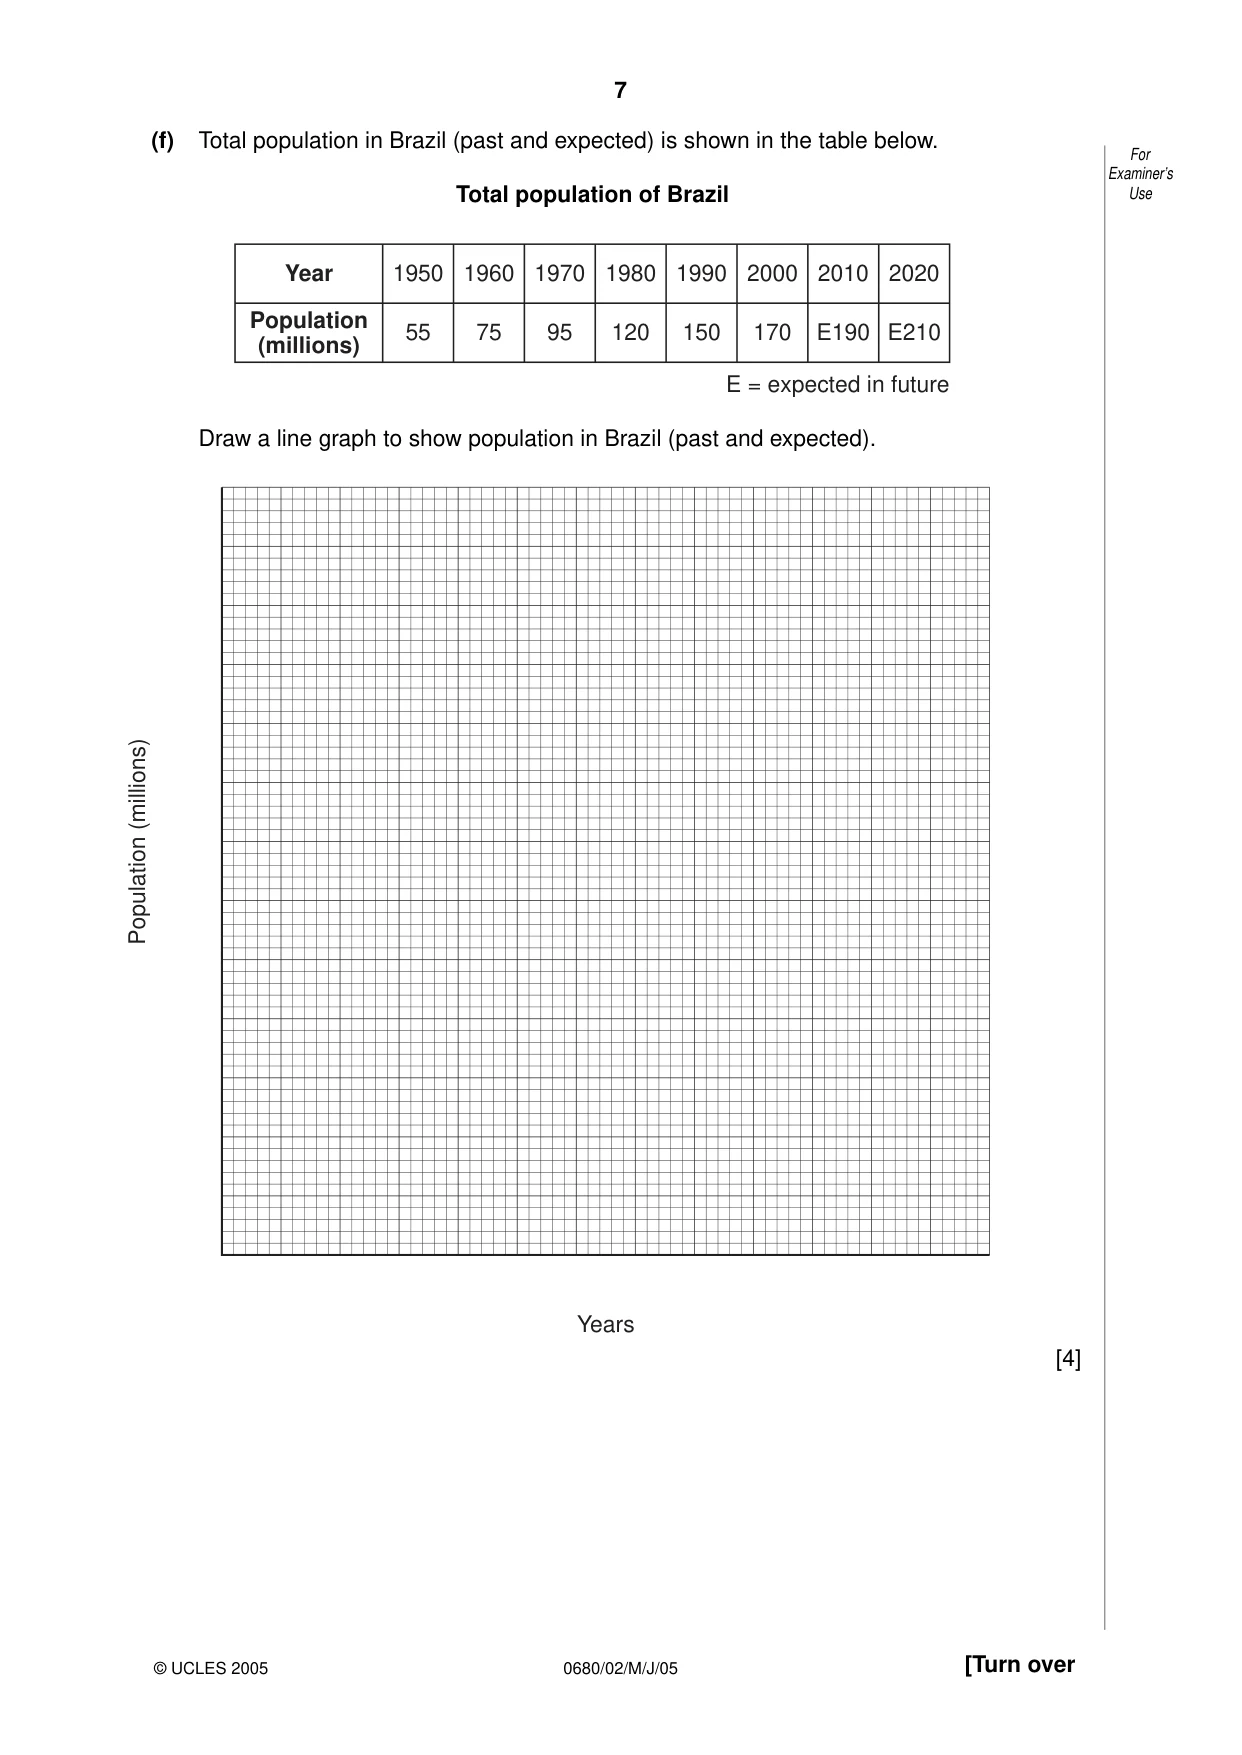
7 0680/02/M/J/05 [Turn over (f) Total population in Brazil (past and expected) is shown in the table below. Total population of Brazil Draw a line graph to show population in Brazil (past and expected). [4] Population (millions) Years Year 1950 1960 1970 1980 1990 2000 2010 2020 55 75 95 120 150 170 E190 E210 Population (millions) E = expected in future For Examiner’s Use © UCLES 2005
Question paper, page 8
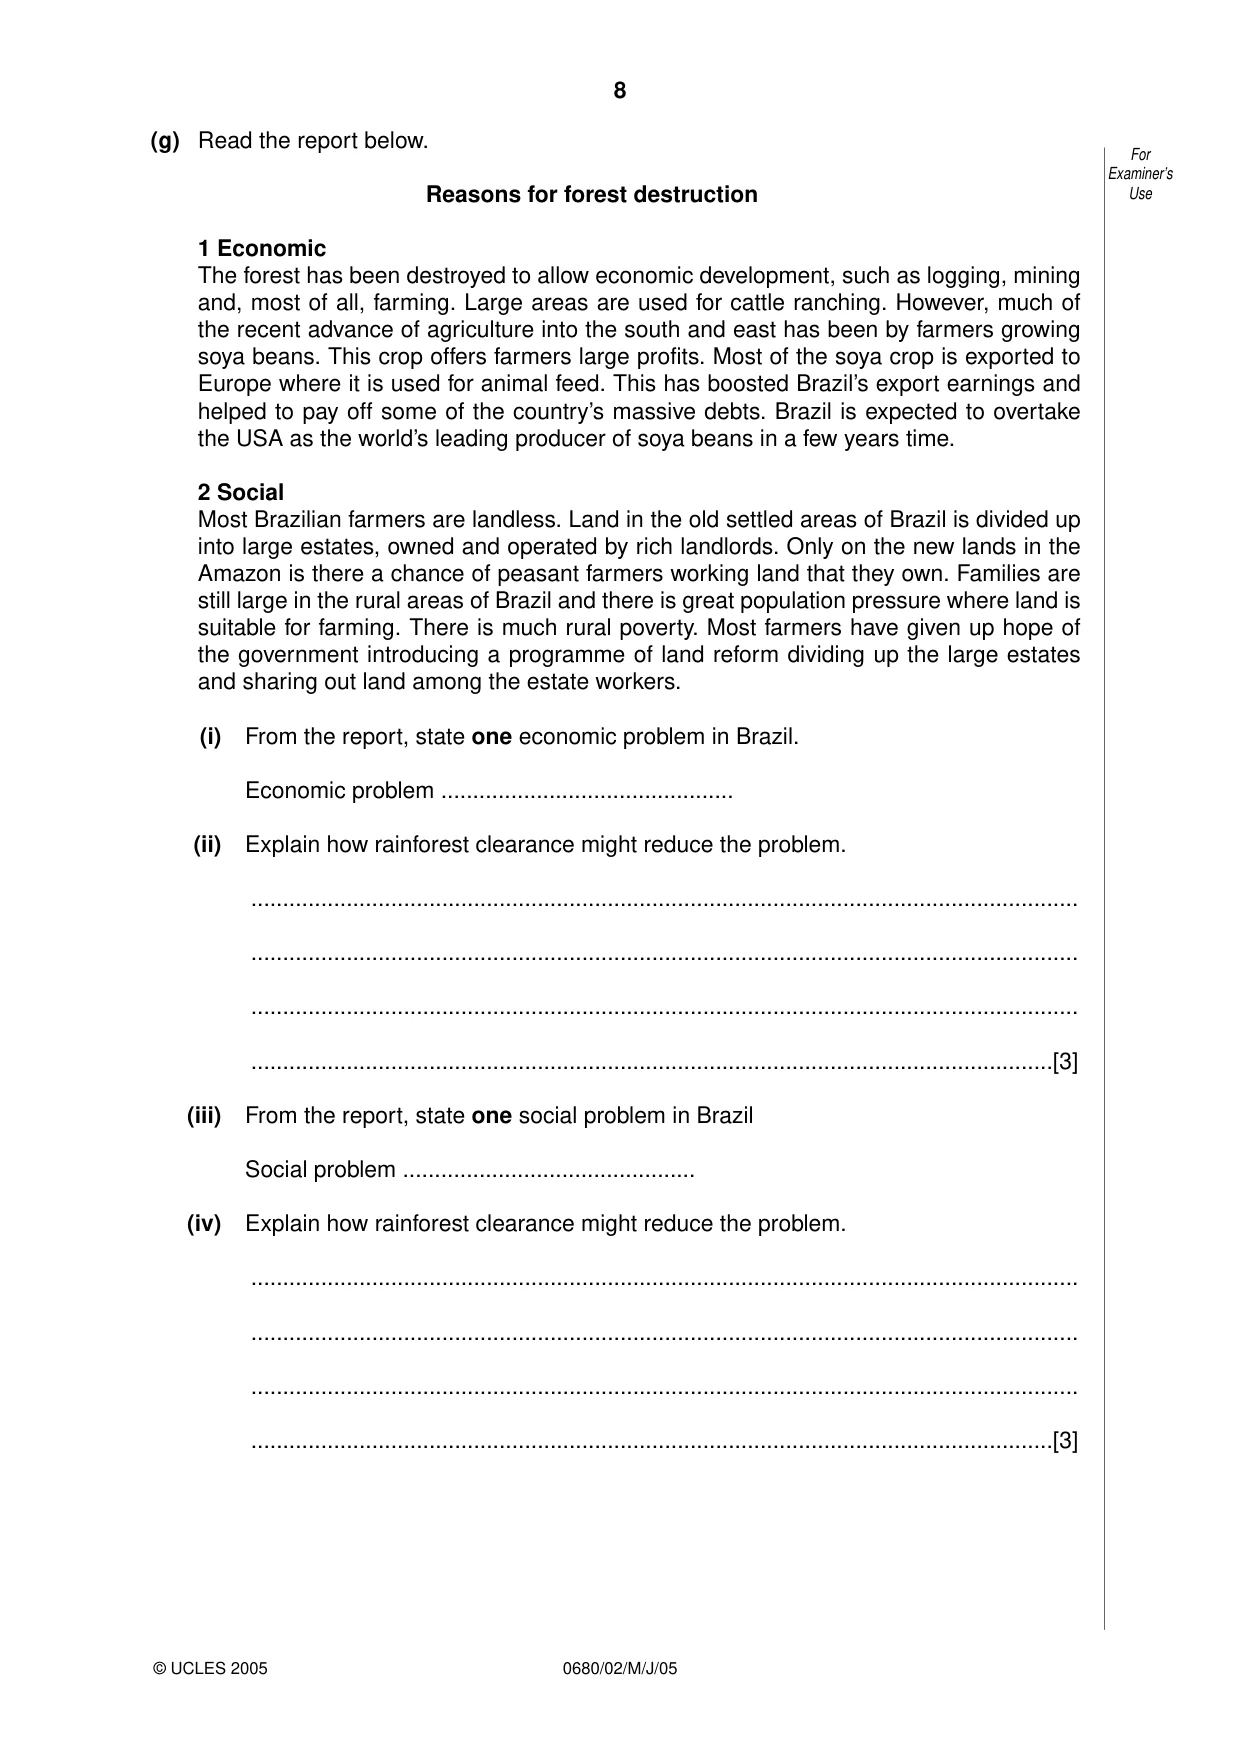
8 0680/02/M/J/05 (g) Read the report below. Reasons for forest destruction 1 Economic The forest has been destroyed to allow economic development, such as logging, mining and, most of all, farming. Large areas are used for cattle ranching. However, much of the recent advance of agriculture into the south and east has been by farmers growing soya beans. This crop offers farmers large profits. Most of the soya crop is exported to Europe where it is used for animal feed. This has boosted Brazil’s export earnings and helped to pay off some of the country’s massive debts. Brazil is expected to overtake the USA as the world’s leading producer of soya beans in a few years time. 2 Social Most Brazilian farmers are landless. Land in the old settled areas of Brazil is divided up into large estates, owned and operated by rich landlords. Only on the new lands in the Amazon is there a chance of peasant farmers working land that they own. Families are still large in the rural areas of Brazil and there is great population pressure where land is suitable for farming. There is much rural poverty. Most farmers have given up hope of the government introducing a programme of land reform dividing up the large estates and sharing out land among the estate workers. (i) From the report, state one economic problem in Brazil. Economic problem … (ii) Explain how rainforest clearance might reduce the problem. … … … …[3] (iii) From the report, state one social problem in Brazil Social problem … (iv) Explain how rainforest clearance might reduce the problem. … … … …[3] For Examiner’s Use © UCLES 2005
Question paper, page 9
9 0680/02/M/J/05 [Turn over (v) Two views about clearing the Amazon rainforest in Brazil are given below. ‘Brazil’s population continues to grow. Clearing rainforest is the only way of solving Brazil’s great economic and social problems.’ ‘We are in danger of losing the most species-rich environment on Earth. The Amazon is the great green lung of the world.’ Decide which view is better in your opinion and explain why. … … … … … … … … …[5] [Total: 40] For Examiner’s Use © UCLES 2005
Question paper, page 10
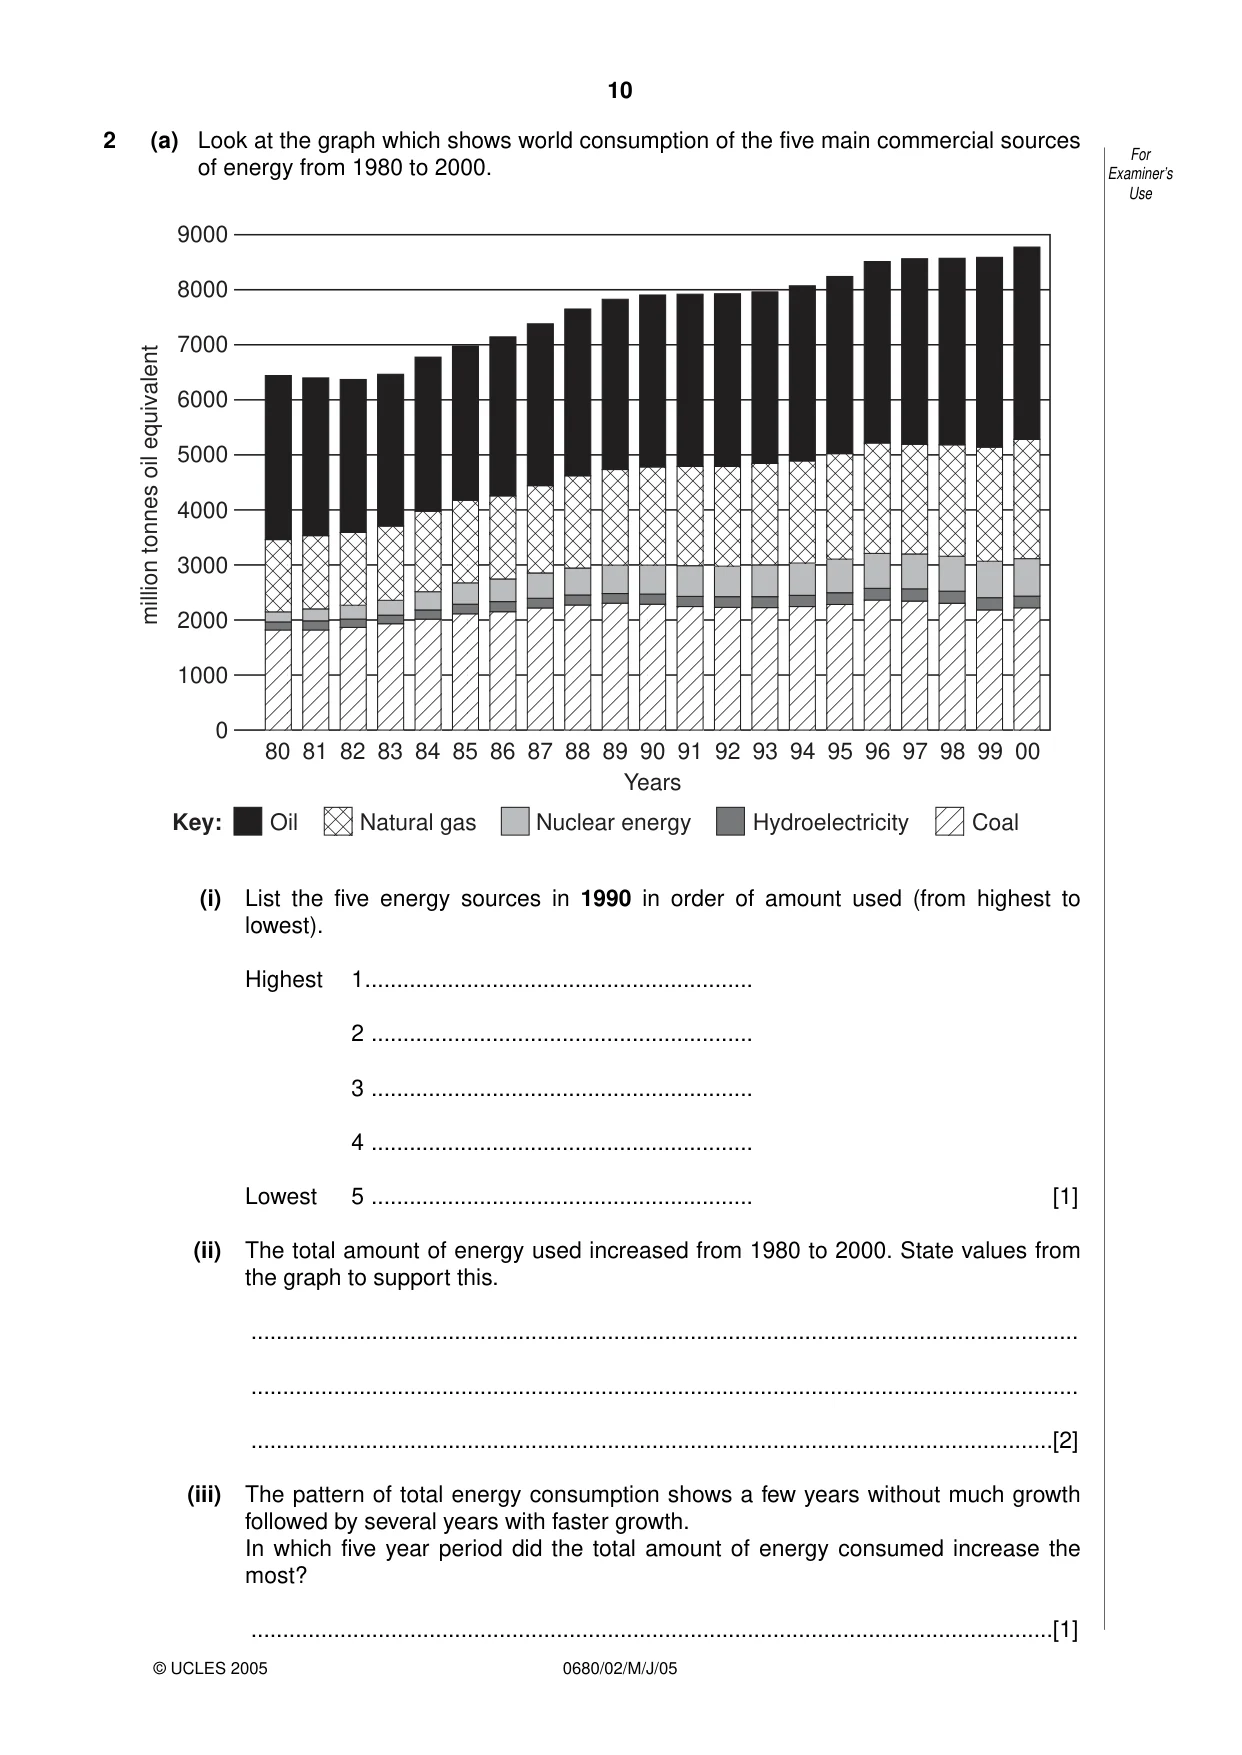
10 0680/02/M/J/05 2 (a) Look at the graph which shows world consumption of the five main commercial sources of energy from 1980 to 2000. (i) List the five energy sources in 1990 in order of amount used (from highest to lowest). Highest 1… 2 … 3 … 4 … Lowest 5 … [1] (ii) The total amount of energy used increased from 1980 to 2000. State values from the graph to support this. … … …[2] (iii) The pattern of total energy consumption shows a few years without much growth followed by several years with faster growth. In which five year period did the total amount of energy consumed increase the most? …[1] 9000 8000 7000 6000 5000 4000 3000 2000 1000 0 million tonnes oil equivalent 80 81 82 83 84 85 86 87 88 89 90 91 92 93 94 95 96 97 98 99 00 Years Key: Oil Natural gas Nuclear energy Hydroelectricity Coal For Examiner’s Use © UCLES 2005
Question paper, page 11
11 0680/02/M/J/05 [Turn over (iv) State three reasons for increased energy consumption from 1980 to 2000. 1 … … 2 … … 3 … …[3] (v) Describe how the graph shows the world’s great dependence upon fossil fuels. … … … … … …[3] For Examiner’s Use © UCLES 2005
Question paper, page 12
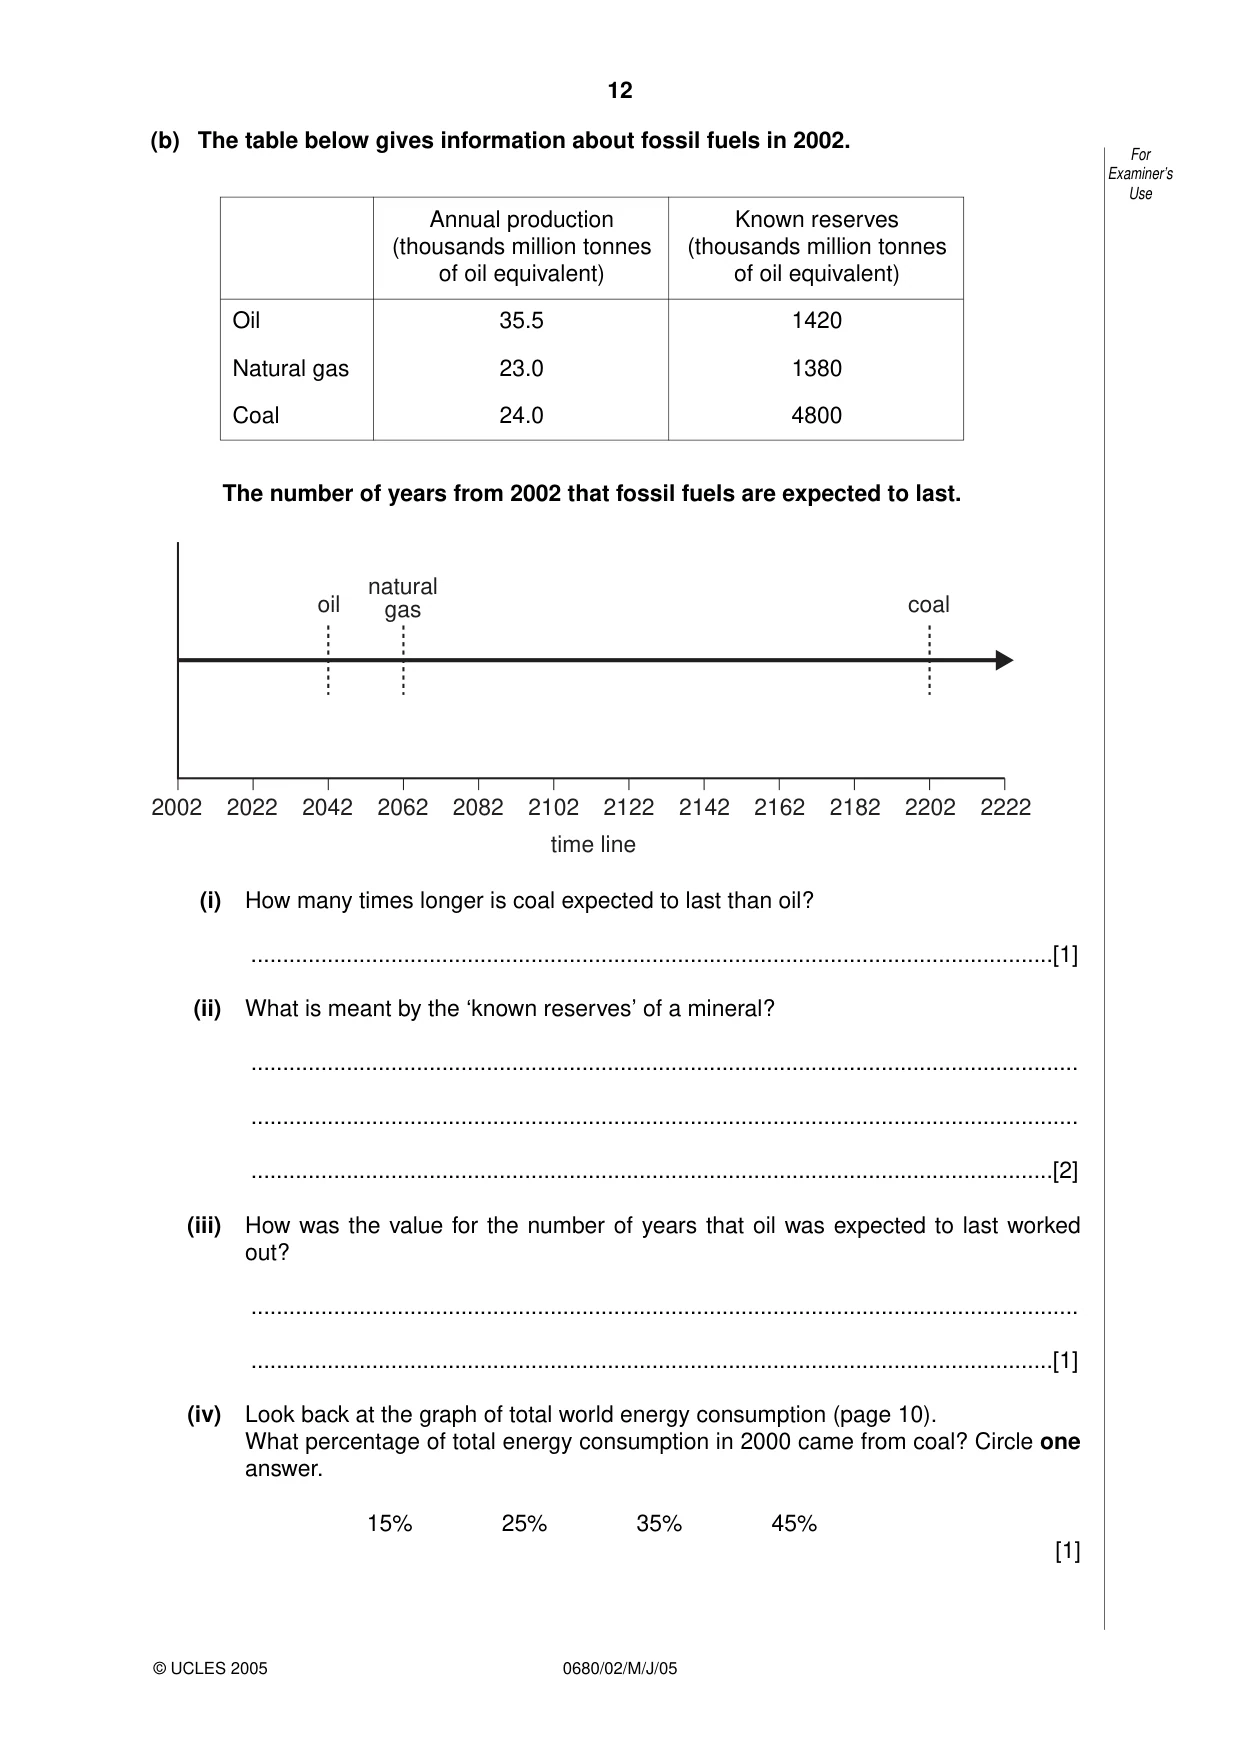
12 0680/02/M/J/05 (b) The table below gives information about fossil fuels in 2002. The number of years from 2002 that fossil fuels are expected to last. (i) How many times longer is coal expected to last than oil? …[1] (ii) What is meant by the ‘known reserves’ of a mineral? … … …[2] (iii) How was the value for the number of years that oil was expected to last worked out? … …[1] (iv) Look back at the graph of total world energy consumption (page 10). What percentage of total energy consumption in 2000 came from coal? Circle one answer. 15% 25% 35% 45% [1] oil coal natural gas 2002 2022 2042 2062 2082 2102 2122 2142 2162 2182 2202 2222 time line For Examiner’s Use © UCLES 2005 Annual production Known reserves (thousands million tonnes (thousands million tonnes of oil equivalent) of oil equivalent) Oil 35.5 1420 Natural gas 23.0 1380 Coal 24.0 4800
Question paper, page 13
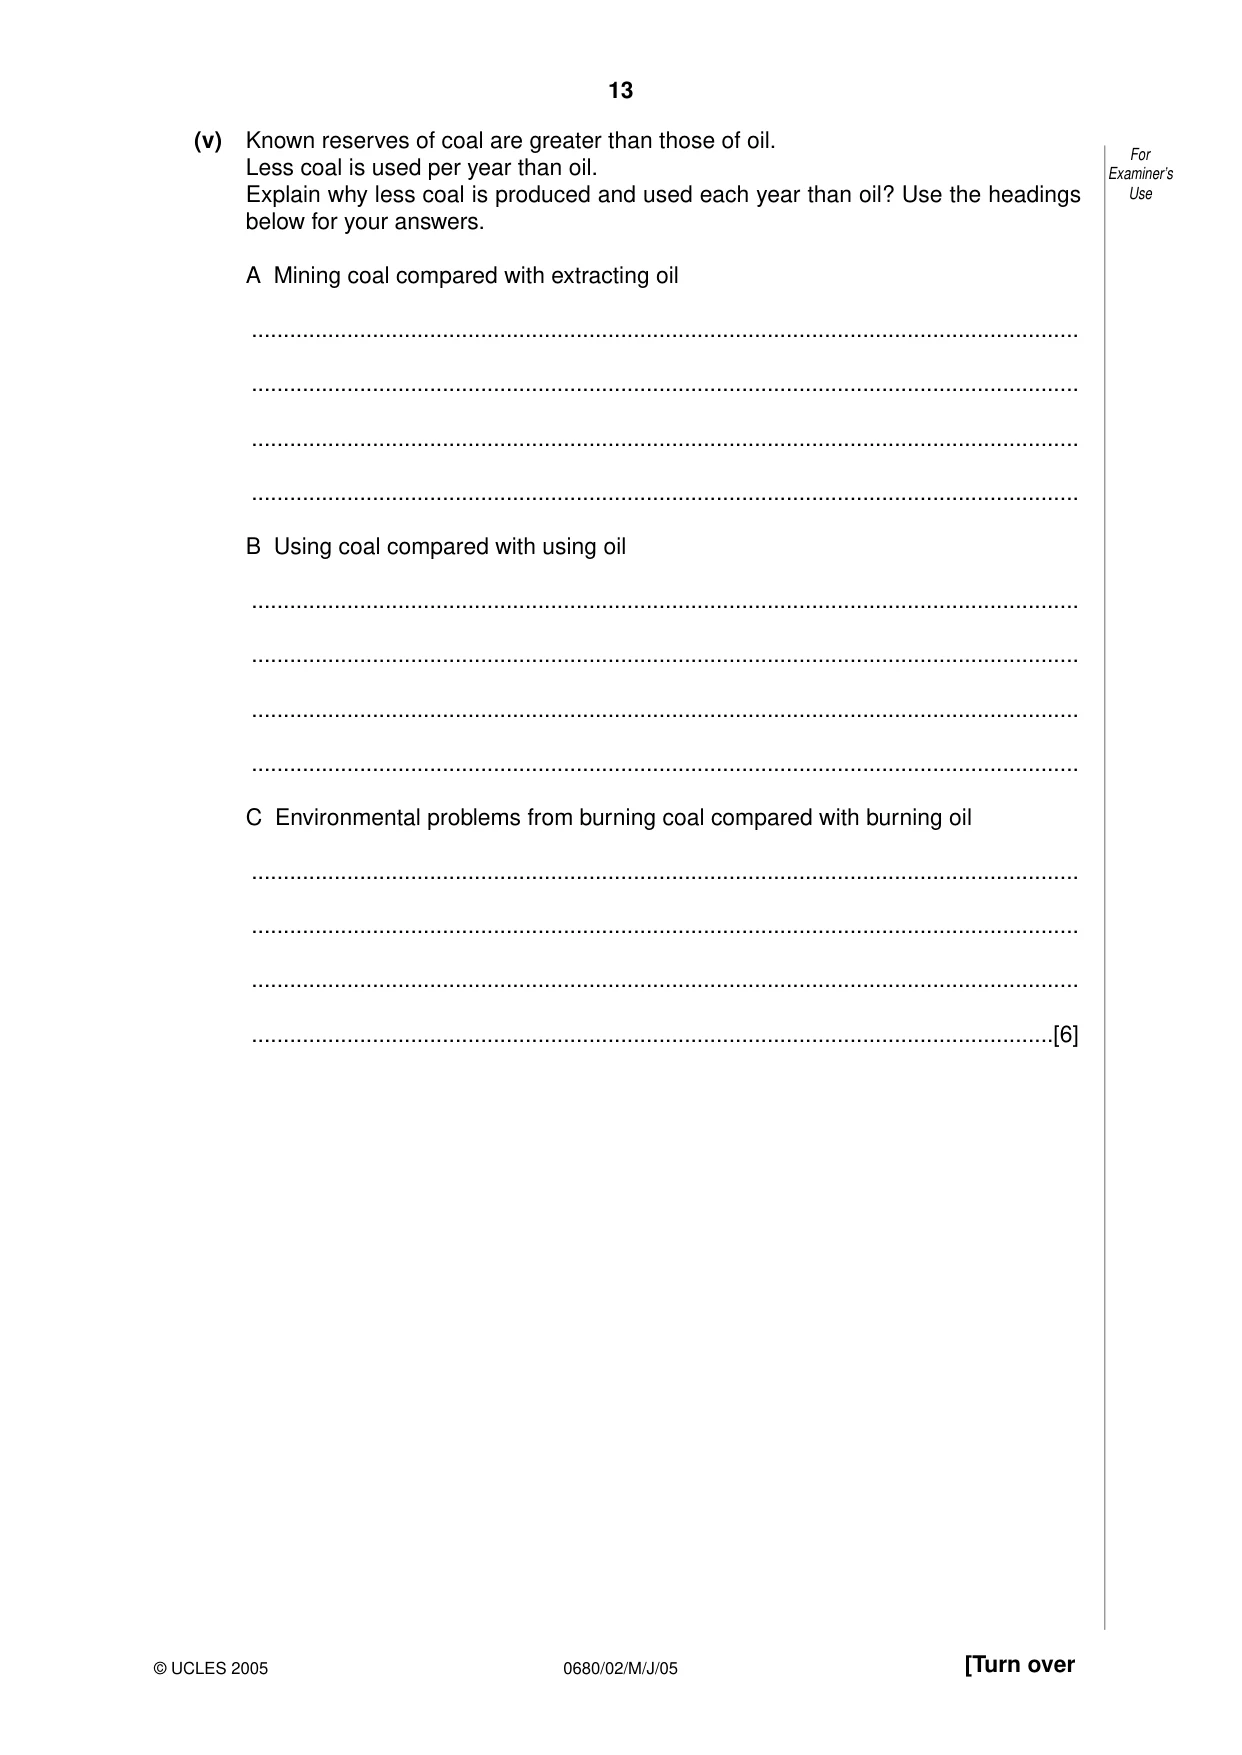
13 0680/02/M/J/05 [Turn over (v) Known reserves of coal are greater than those of oil. Less coal is used per year than oil. Explain why less coal is produced and used each year than oil? Use the headings below for your answers. A Mining coal compared with extracting oil … … … … B Using coal compared with using oil … … … … C Environmental problems from burning coal compared with burning oil … … … …[6] For Examiner’s Use © UCLES 2005
Question paper, page 14
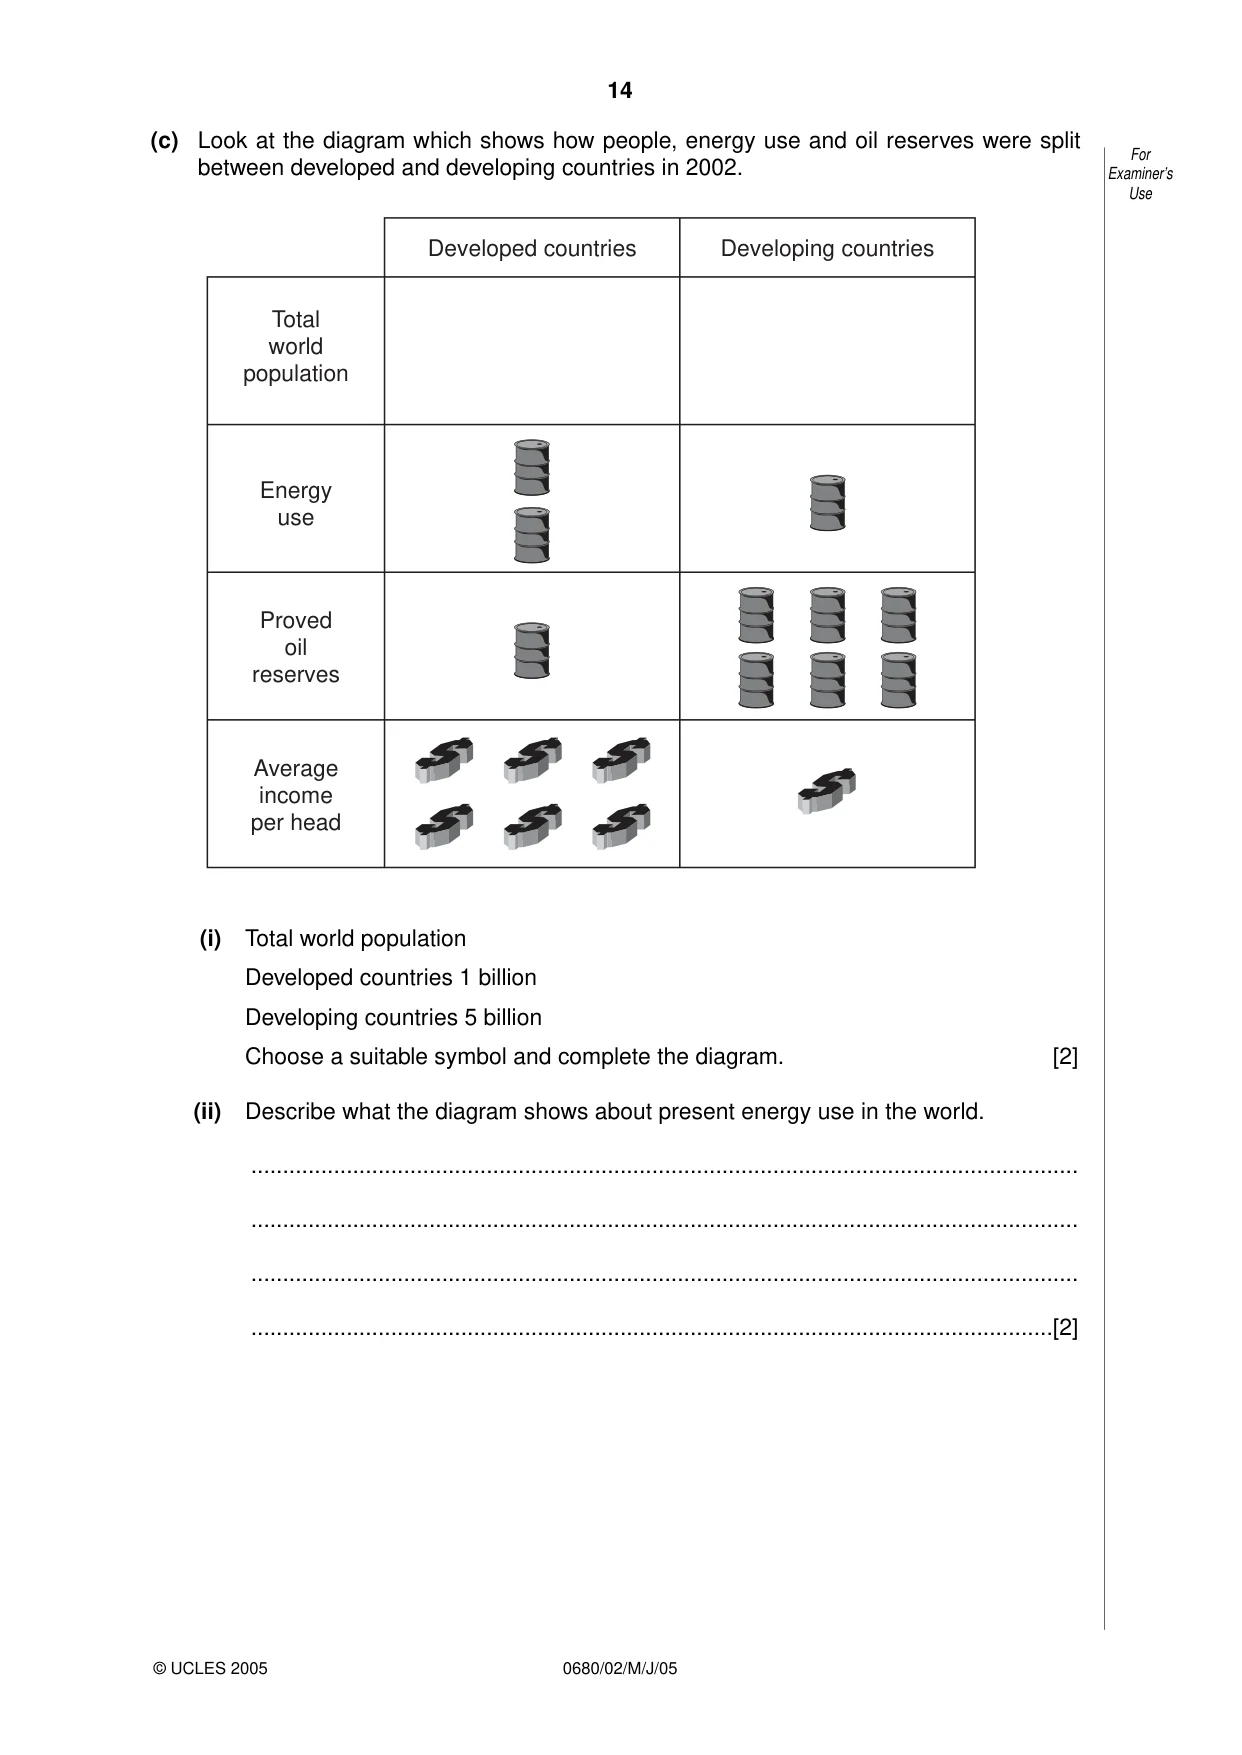
14 0680/02/M/J/05 (c) Look at the diagram which shows how people, energy use and oil reserves were split between developed and developing countries in 2002. (i) Total world population Developed countries 1 billion Developing countries 5 billion Choose a suitable symbol and complete the diagram. [2] (ii) Describe what the diagram shows about present energy use in the world. … … … …[2] Developed countries Developing countries Total world population Energy use Proved oil reserves Average income per head For Examiner’s Use © UCLES 2005
Question paper, page 15
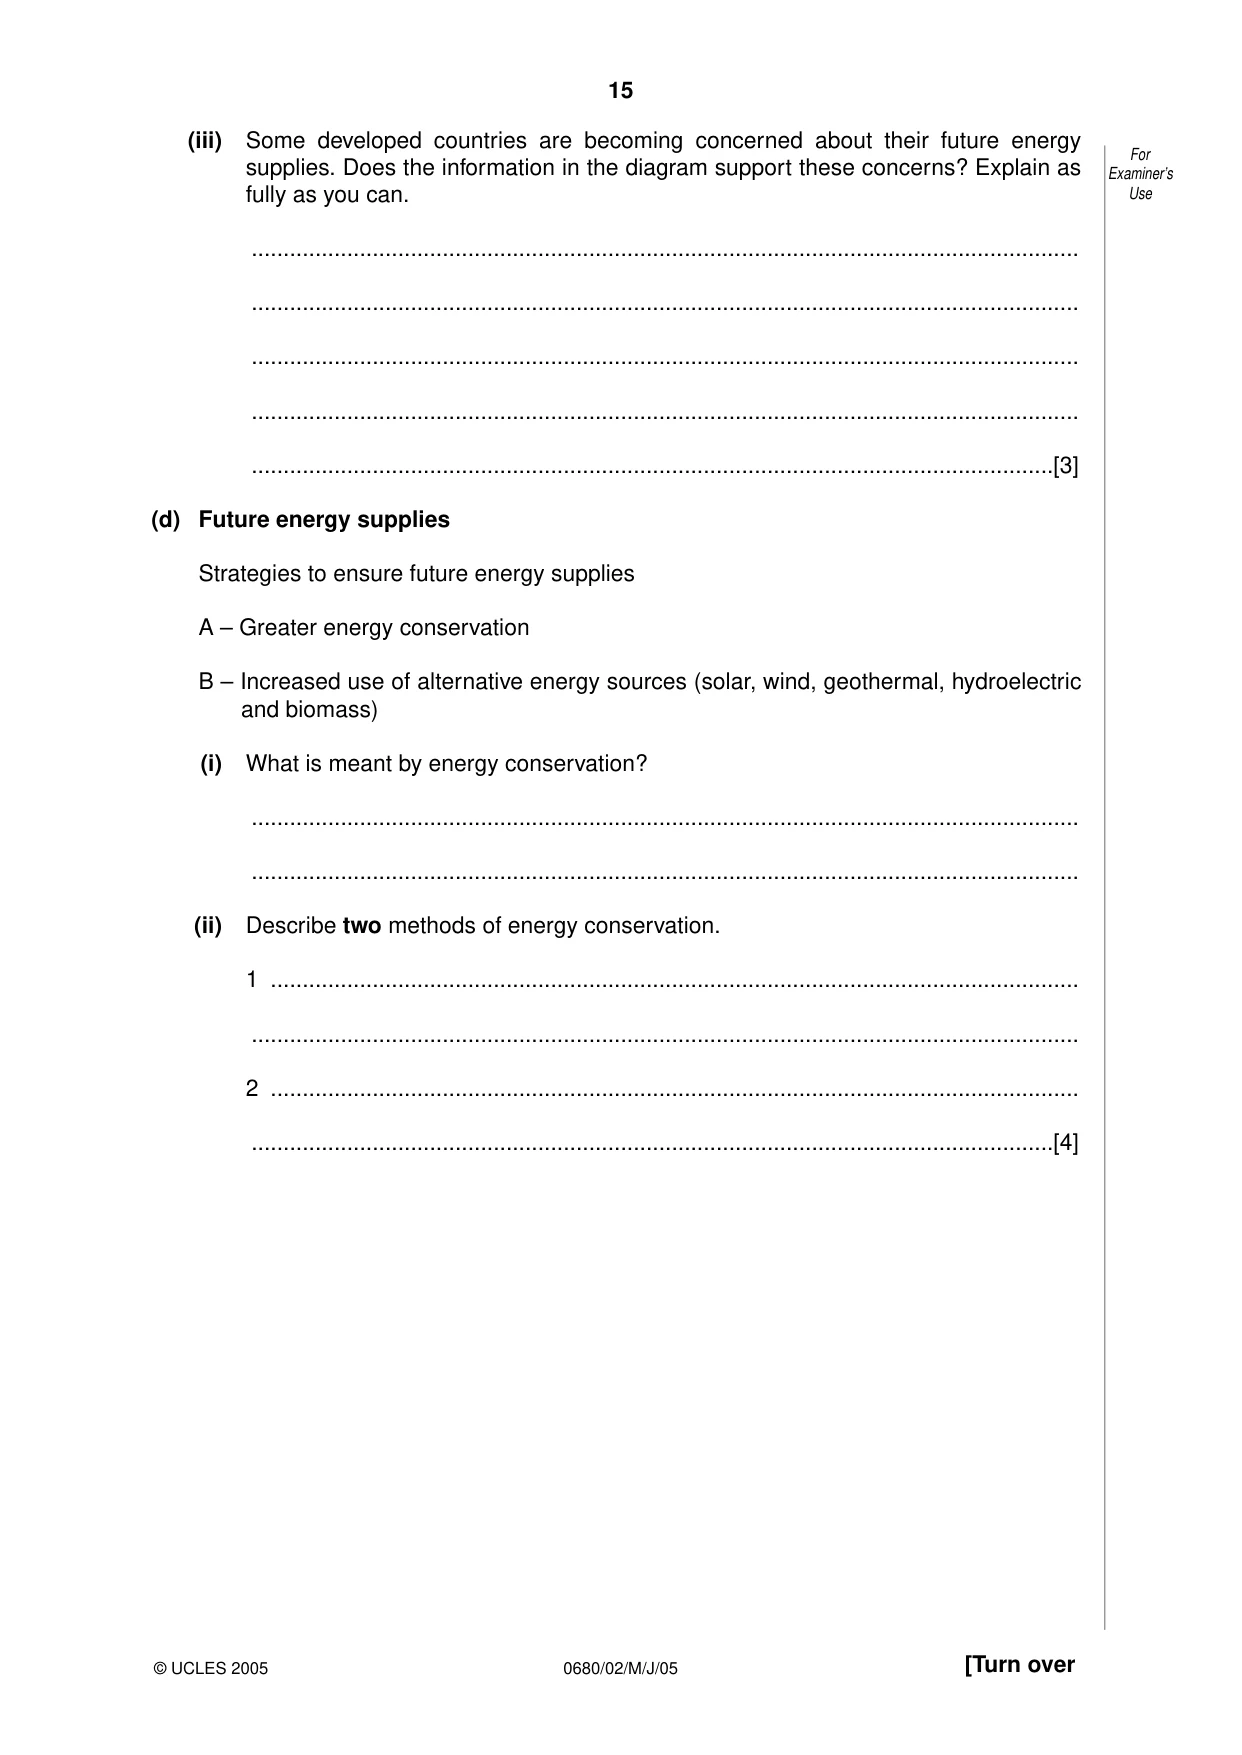
15 0680/02/M/J/05 [Turn over (iii) Some developed countries are becoming concerned about their future energy supplies. Does the information in the diagram support these concerns? Explain as fully as you can. … … … … …[3] (d) Future energy supplies Strategies to ensure future energy supplies A – Greater energy conservation B – Increased use of alternative energy sources (solar, wind, geothermal, hydroelectric and biomass) (i) What is meant by energy conservation? … … (ii) Describe two methods of energy conservation. 1 … … 2 … …[4] For Examiner’s Use © UCLES 2005
Question paper, page 16
16 0680/02/M/J/05 (iii) Write about some of the disadvantages of alternative energy sources for future energy supplies. … … … … … … … … … …[5] (iv) In your view, for which one of the named alternative energy sources is there the best chance of increased output in the future? Explain your choice. … … … … …[3] [Total: 40] [Total for paper: 80] For Examiner’s Use © UCLES 2005 Copyright Acknowledgements: Question 2 (a) © BP Statistical Review of World Energy 2001. Permission to reproduce items where third-party owned material protected by copyright is included has been sought and cleared where possible. Every reasonable effort has been made by the publisher (UCLES) to trace copyright holders, but if any items requiring clearance have unwittingly been included, the publisher will be pleased to make amends at the earliest possible opportunity. University of Cambridge International Examinations is part of the University of Cambridge Local Examinations Syndicate (UCLES), which is itself a department of the University of Cambridge.
Mark scheme, page 1
UNIVERSITY OF CAMBRIDGE INTERNATIONAL EXAMINATIONS International General Certificate of Secondary Education MARK SCHEME for the June 2005 question paper 0680 ENVIRONMENTAL MANAGEMENT 0680/02 Paper 2, maximum raw mark 80 This mark scheme is published as an aid to teachers and students, to indicate the requirements of the examination. It shows the basis on which Examiners were initially instructed to award marks. It does not indicate the details of the discussions that took place at an Examiners’ meeting before marking began. Any substantial changes to the mark scheme that arose from these discussions will be recorded in the published Report on the Examination. All Examiners are instructed that alternative correct answers and unexpected approaches in candidates’ scripts must be given marks that fairly reflect the relevant knowledge and skills demonstrated. Mark schemes must be read in conjunction with the question papers and the Report on the Examination. • CIE will not enter into discussion or correspondence in connection with these mark schemes. CIE is publishing the mark schemes for the June 2005 question papers for most IGCSE and GCE Advanced Level and Advanced Subsidiary Level syllabuses and some Ordinary Level syllabuses. www.XtremePapers.com
Mark scheme, page 2
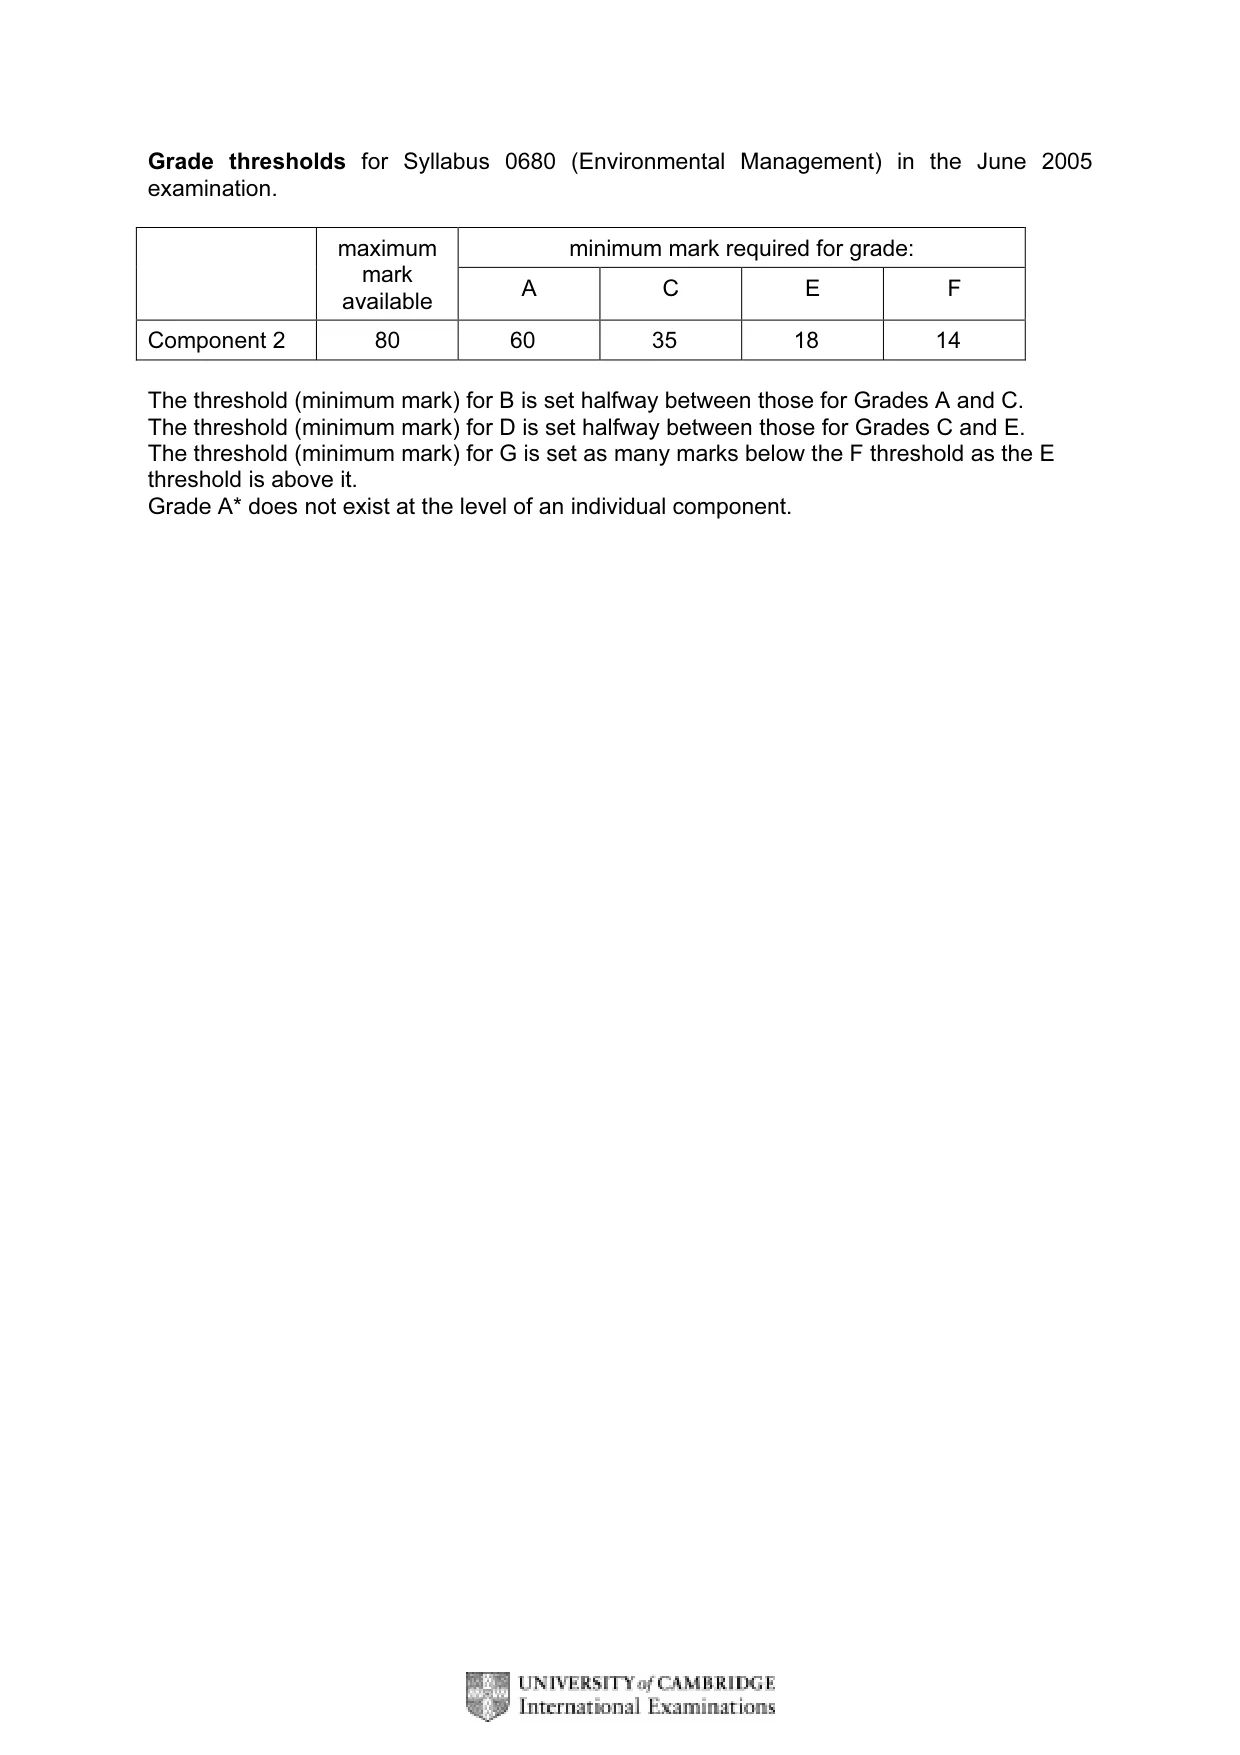
Grade thresholds for Syllabus 0680 (Environmental Management) in the June 2005 examination. minimum mark required for grade: maximum mark available A C E F Component 2 80 60 35 18 14 The threshold (minimum mark) for B is set halfway between those for Grades A and C. The threshold (minimum mark) for D is set halfway between those for Grades C and E. The threshold (minimum mark) for G is set as many marks below the F threshold as the E threshold is above it. Grade A* does not exist at the level of an individual component.
Mark scheme, page 3
June 2005 IGCSE MARK SCHEME MAXIMUM MARK: 80 SYLLABUS/COMPONENT: 0680/02 ENVIRONMENTAL MANAGEMENT Paper 2
Mark scheme, page 4
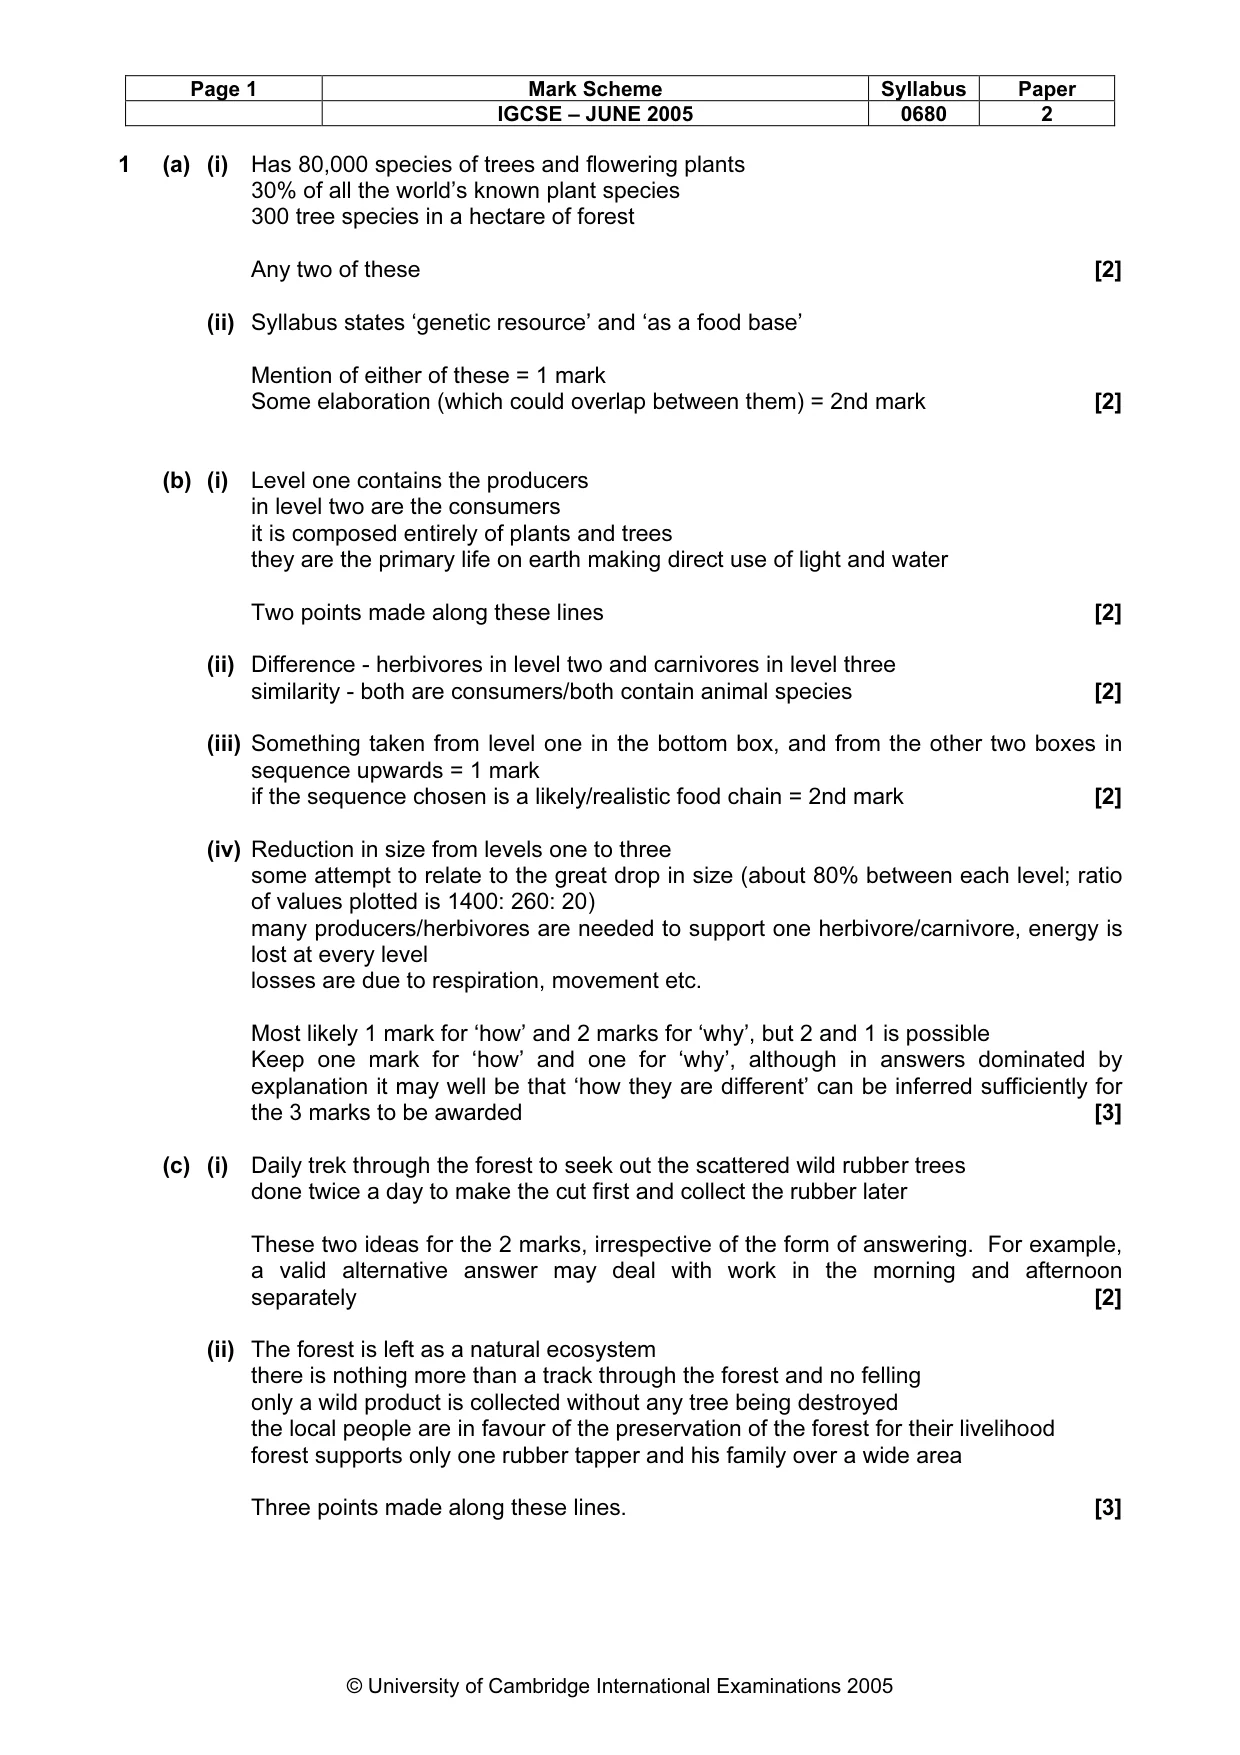
Page 1 Mark Scheme Syllabus Paper IGCSE – JUNE 2005 0680 2 © University of Cambridge International Examinations 2005 1 (a) (i) Has 80,000 species of trees and flowering plants 30% of all the world’s known plant species 300 tree species in a hectare of forest Any two of these [2] (ii) Syllabus states ‘genetic resource’ and ‘as a food base’ Mention of either of these = 1 mark Some elaboration (which could overlap between them) = 2nd mark [2] (b) (i) Level one contains the producers in level two are the consumers it is composed entirely of plants and trees they are the primary life on earth making direct use of light and water Two points made along these lines [2] (ii) Difference - herbivores in level two and carnivores in level three similarity - both are consumers/both contain animal species [2] (iii) Something taken from level one in the bottom box, and from the other two boxes in sequence upwards = 1 mark if the sequence chosen is a likely/realistic food chain = 2nd mark [2] (iv) Reduction in size from levels one to three some attempt to relate to the great drop in size (about 80% between each level; ratio of values plotted is 1400: 260: 20) many producers/herbivores are needed to support one herbivore/carnivore, energy is lost at every level losses are due to respiration, movement etc. Most likely 1 mark for ‘how’ and 2 marks for ‘why’, but 2 and 1 is possible Keep one mark for ‘how’ and one for ‘why’, although in answers dominated by explanation it may well be that ‘how they are different’ can be inferred sufficiently for the 3 marks to be awarded [3] (c) (i) Daily trek through the forest to seek out the scattered wild rubber trees done twice a day to make the cut first and collect the rubber later These two ideas for the 2 marks, irrespective of the form of answering. For example, a valid alternative answer may deal with work in the morning and afternoon separately [2] (ii) The forest is left as a natural ecosystem there is nothing more than a track through the forest and no felling only a wild product is collected without any tree being destroyed the local people are in favour of the preservation of the forest for their livelihood forest supports only one rubber tapper and his family over a wide area Three points made along these lines. [3]
Mark scheme, page 5
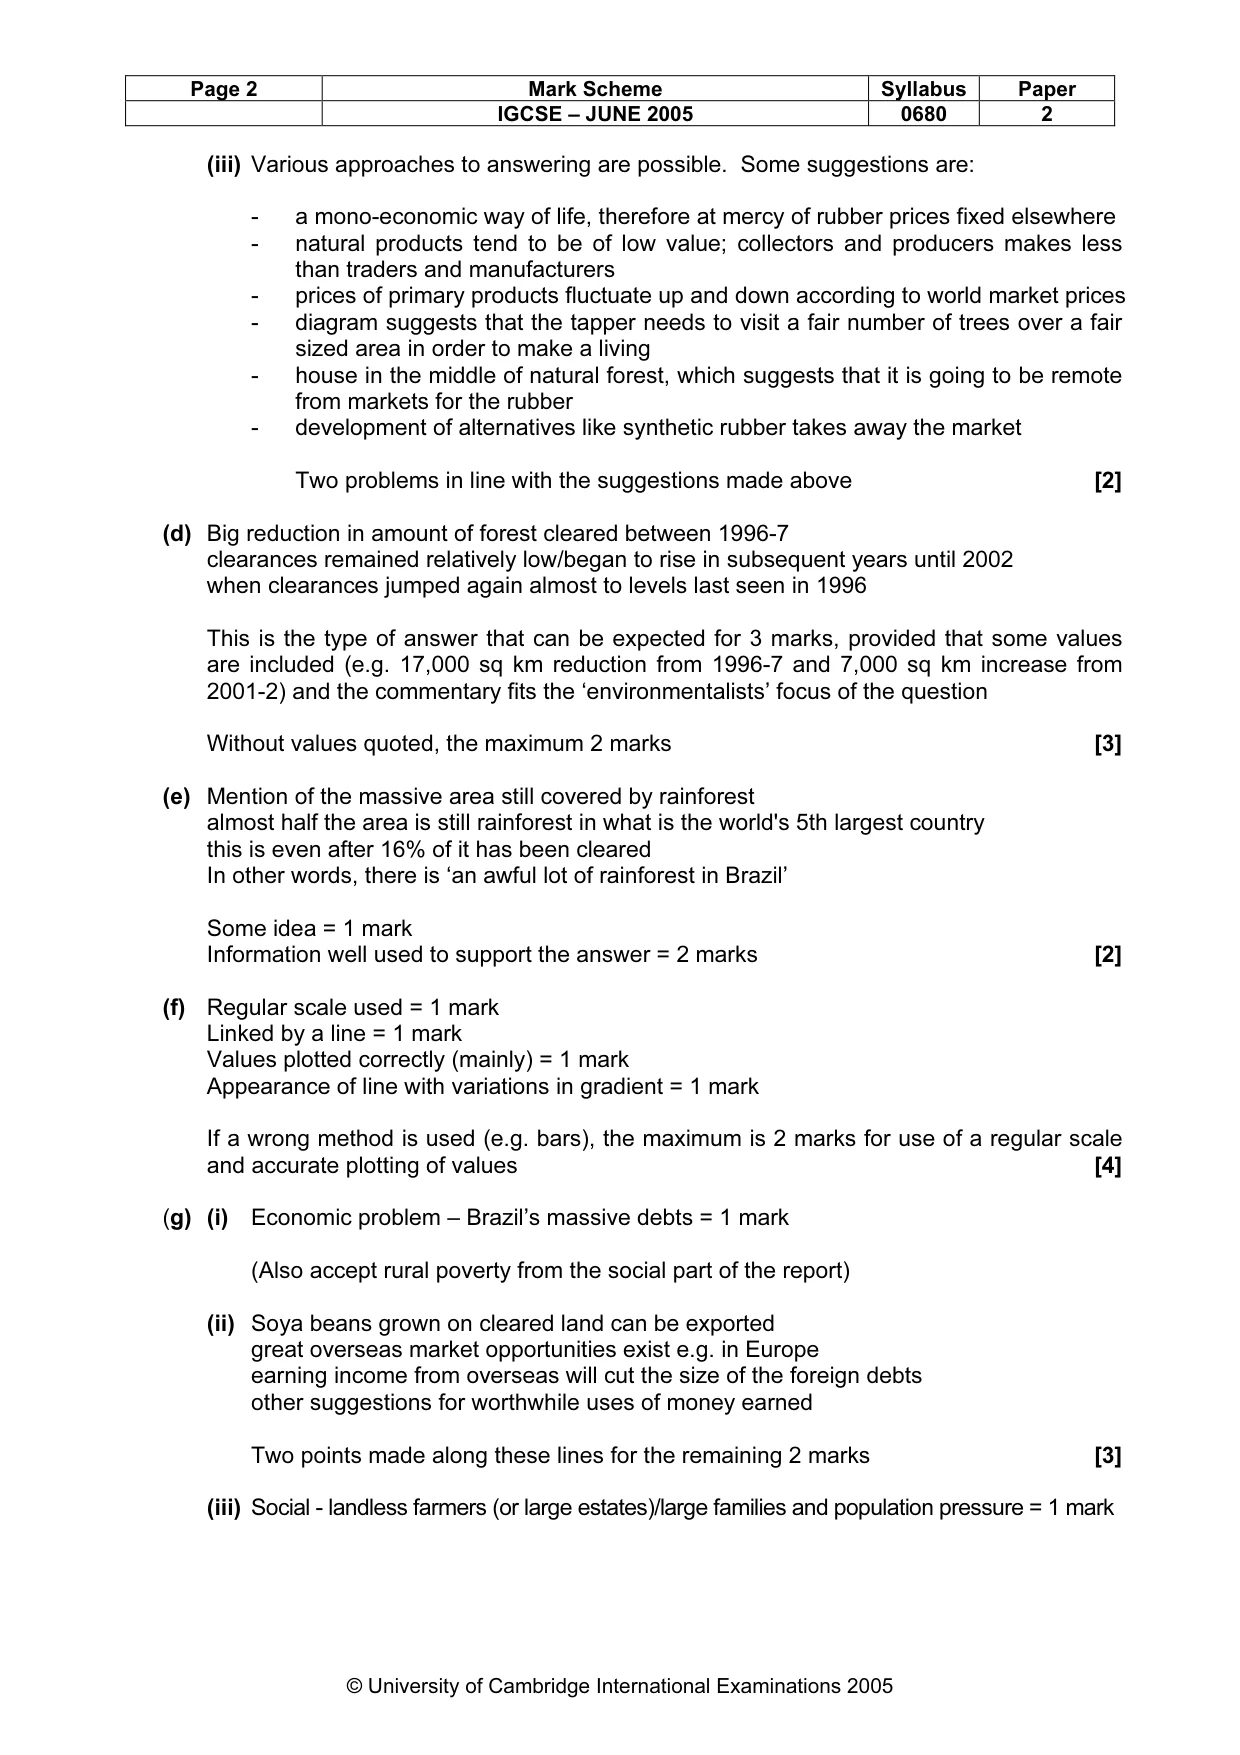
Page 2 Mark Scheme Syllabus Paper IGCSE – JUNE 2005 0680 2 © University of Cambridge International Examinations 2005 (iii) Various approaches to answering are possible. Some suggestions are: - a mono-economic way of life, therefore at mercy of rubber prices fixed elsewhere - natural products tend to be of low value; collectors and producers makes less than traders and manufacturers - prices of primary products fluctuate up and down according to world market prices - diagram suggests that the tapper needs to visit a fair number of trees over a fair sized area in order to make a living - house in the middle of natural forest, which suggests that it is going to be remote from markets for the rubber - development of alternatives like synthetic rubber takes away the market Two problems in line with the suggestions made above [2] (d) Big reduction in amount of forest cleared between 1996-7 clearances remained relatively low/began to rise in subsequent years until 2002 when clearances jumped again almost to levels last seen in 1996 This is the type of answer that can be expected for 3 marks, provided that some values are included (e.g. 17,000 sq km reduction from 1996-7 and 7,000 sq km increase from 2001-2) and the commentary fits the ‘environmentalists’ focus of the question Without values quoted, the maximum 2 marks [3] (e) Mention of the massive area still covered by rainforest almost half the area is still rainforest in what is the world's 5th largest country this is even after 16% of it has been cleared In other words, there is ‘an awful lot of rainforest in Brazil’ Some idea = 1 mark Information well used to support the answer = 2 marks [2] (f) Regular scale used = 1 mark Linked by a line = 1 mark Values plotted correctly (mainly) = 1 mark Appearance of line with variations in gradient = 1 mark If a wrong method is used (e.g. bars), the maximum is 2 marks for use of a regular scale and accurate plotting of values [4] (g) (i) Economic problem – Brazil’s massive debts = 1 mark (Also accept rural poverty from the social part of the report) (ii) Soya beans grown on cleared land can be exported great overseas market opportunities exist e.g. in Europe earning income from overseas will cut the size of the foreign debts other suggestions for worthwhile uses of money earned Two points made along these lines for the remaining 2 marks [3] (iii) Social - landless farmers (or large estates)/large families and population pressure = 1 mark
Mark scheme, page 6
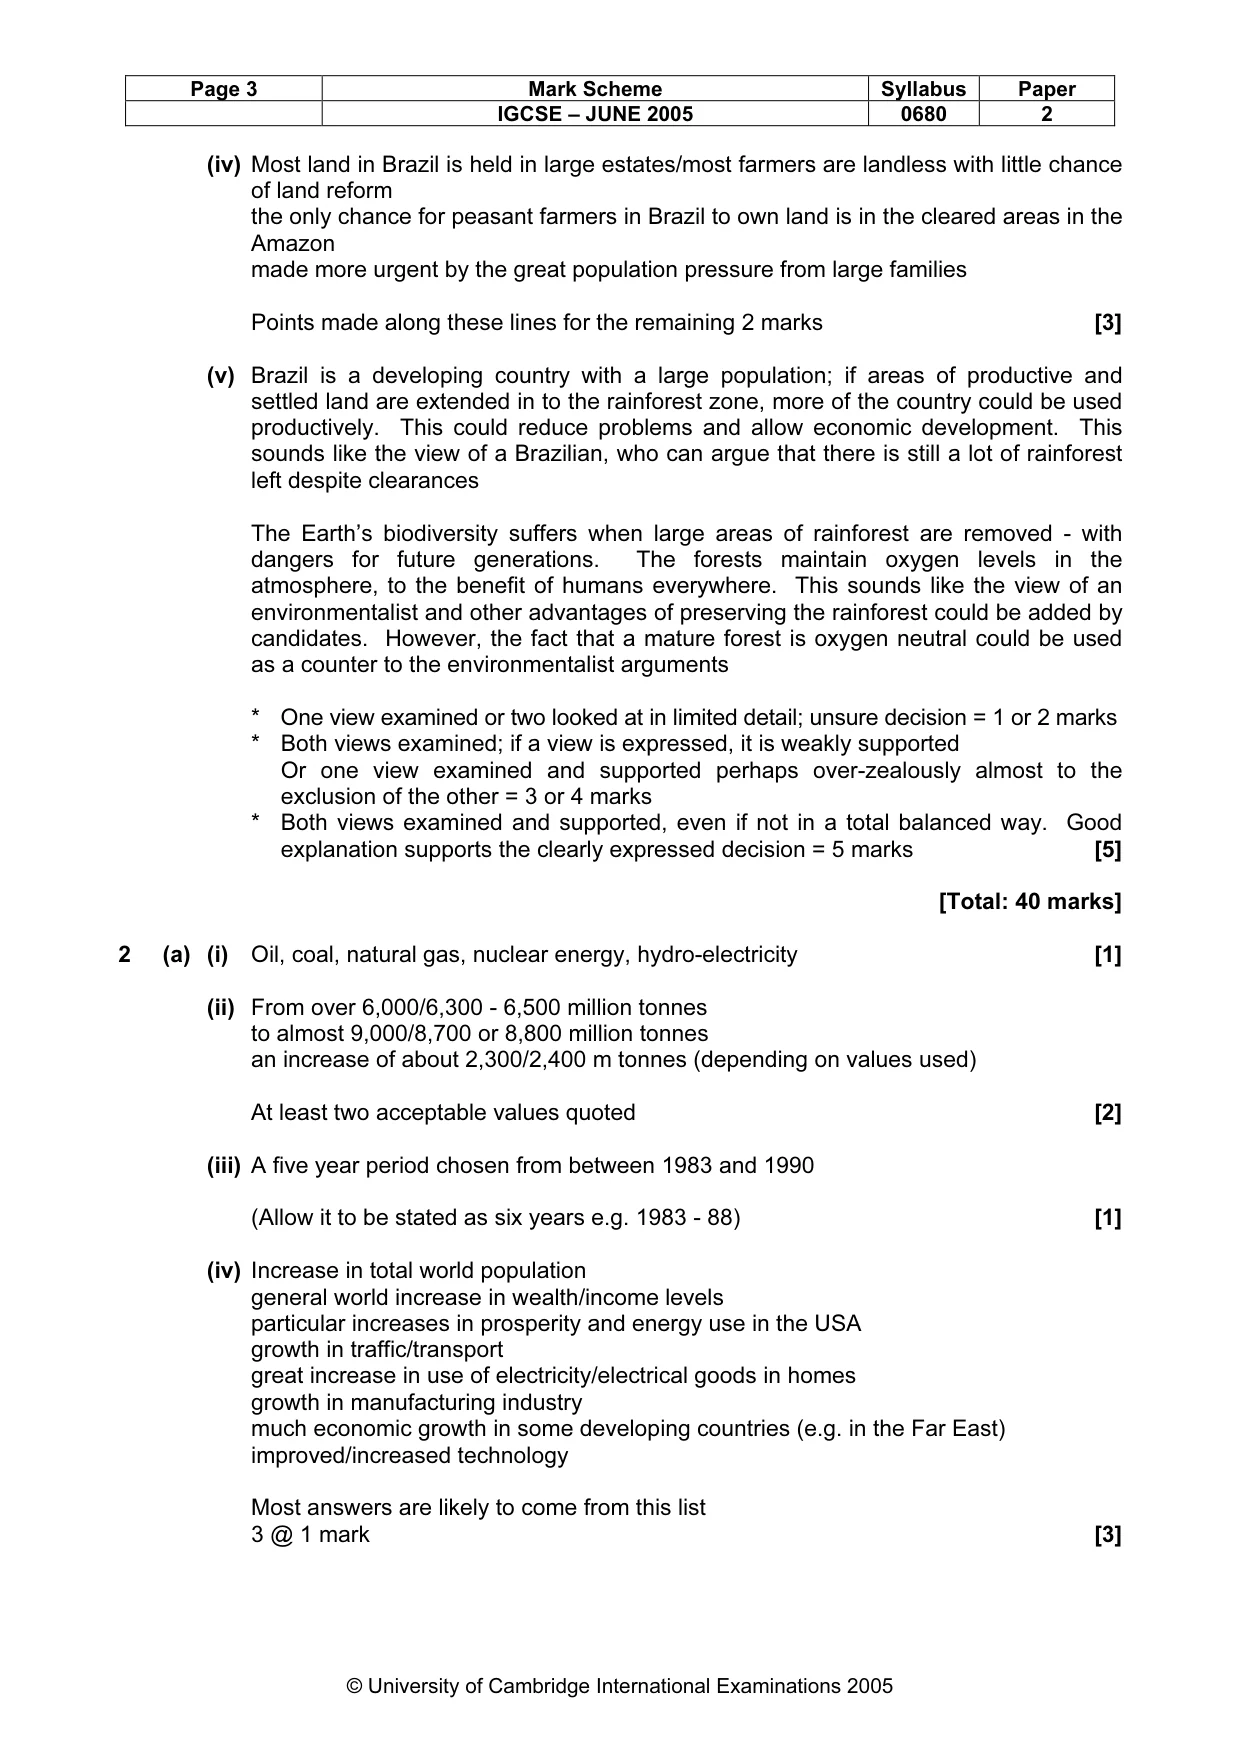
Page 3 Mark Scheme Syllabus Paper IGCSE – JUNE 2005 0680 2 © University of Cambridge International Examinations 2005 (iv) Most land in Brazil is held in large estates/most farmers are landless with little chance of land reform the only chance for peasant farmers in Brazil to own land is in the cleared areas in the Amazon made more urgent by the great population pressure from large families Points made along these lines for the remaining 2 marks [3] (v) Brazil is a developing country with a large population; if areas of productive and settled land are extended in to the rainforest zone, more of the country could be used productively. This could reduce problems and allow economic development. This sounds like the view of a Brazilian, who can argue that there is still a lot of rainforest left despite clearances The Earth’s biodiversity suffers when large areas of rainforest are removed - with dangers for future generations. The forests maintain oxygen levels in the atmosphere, to the benefit of humans everywhere. This sounds like the view of an environmentalist and other advantages of preserving the rainforest could be added by candidates. However, the fact that a mature forest is oxygen neutral could be used as a counter to the environmentalist arguments * One view examined or two looked at in limited detail; unsure decision = 1 or 2 marks * Both views examined; if a view is expressed, it is weakly supported Or one view examined and supported perhaps over-zealously almost to the exclusion of the other = 3 or 4 marks * Both views examined and supported, even if not in a total balanced way. Good explanation supports the clearly expressed decision = 5 marks [5] [Total: 40 marks] 2 (a) (i) Oil, coal, natural gas, nuclear energy, hydro-electricity [1] (ii) From over 6,000/6,300 - 6,500 million tonnes to almost 9,000/8,700 or 8,800 million tonnes an increase of about 2,300/2,400 m tonnes (depending on values used) At least two acceptable values quoted [2] (iii) A five year period chosen from between 1983 and 1990 (Allow it to be stated as six years e.g. 1983 - 88) [1] (iv) Increase in total world population general world increase in wealth/income levels particular increases in prosperity and energy use in the USA growth in traffic/transport great increase in use of electricity/electrical goods in homes growth in manufacturing industry much economic growth in some developing countries (e.g. in the Far East) improved/increased technology Most answers are likely to come from this list 3 @ 1 mark [3]
Mark scheme, page 7
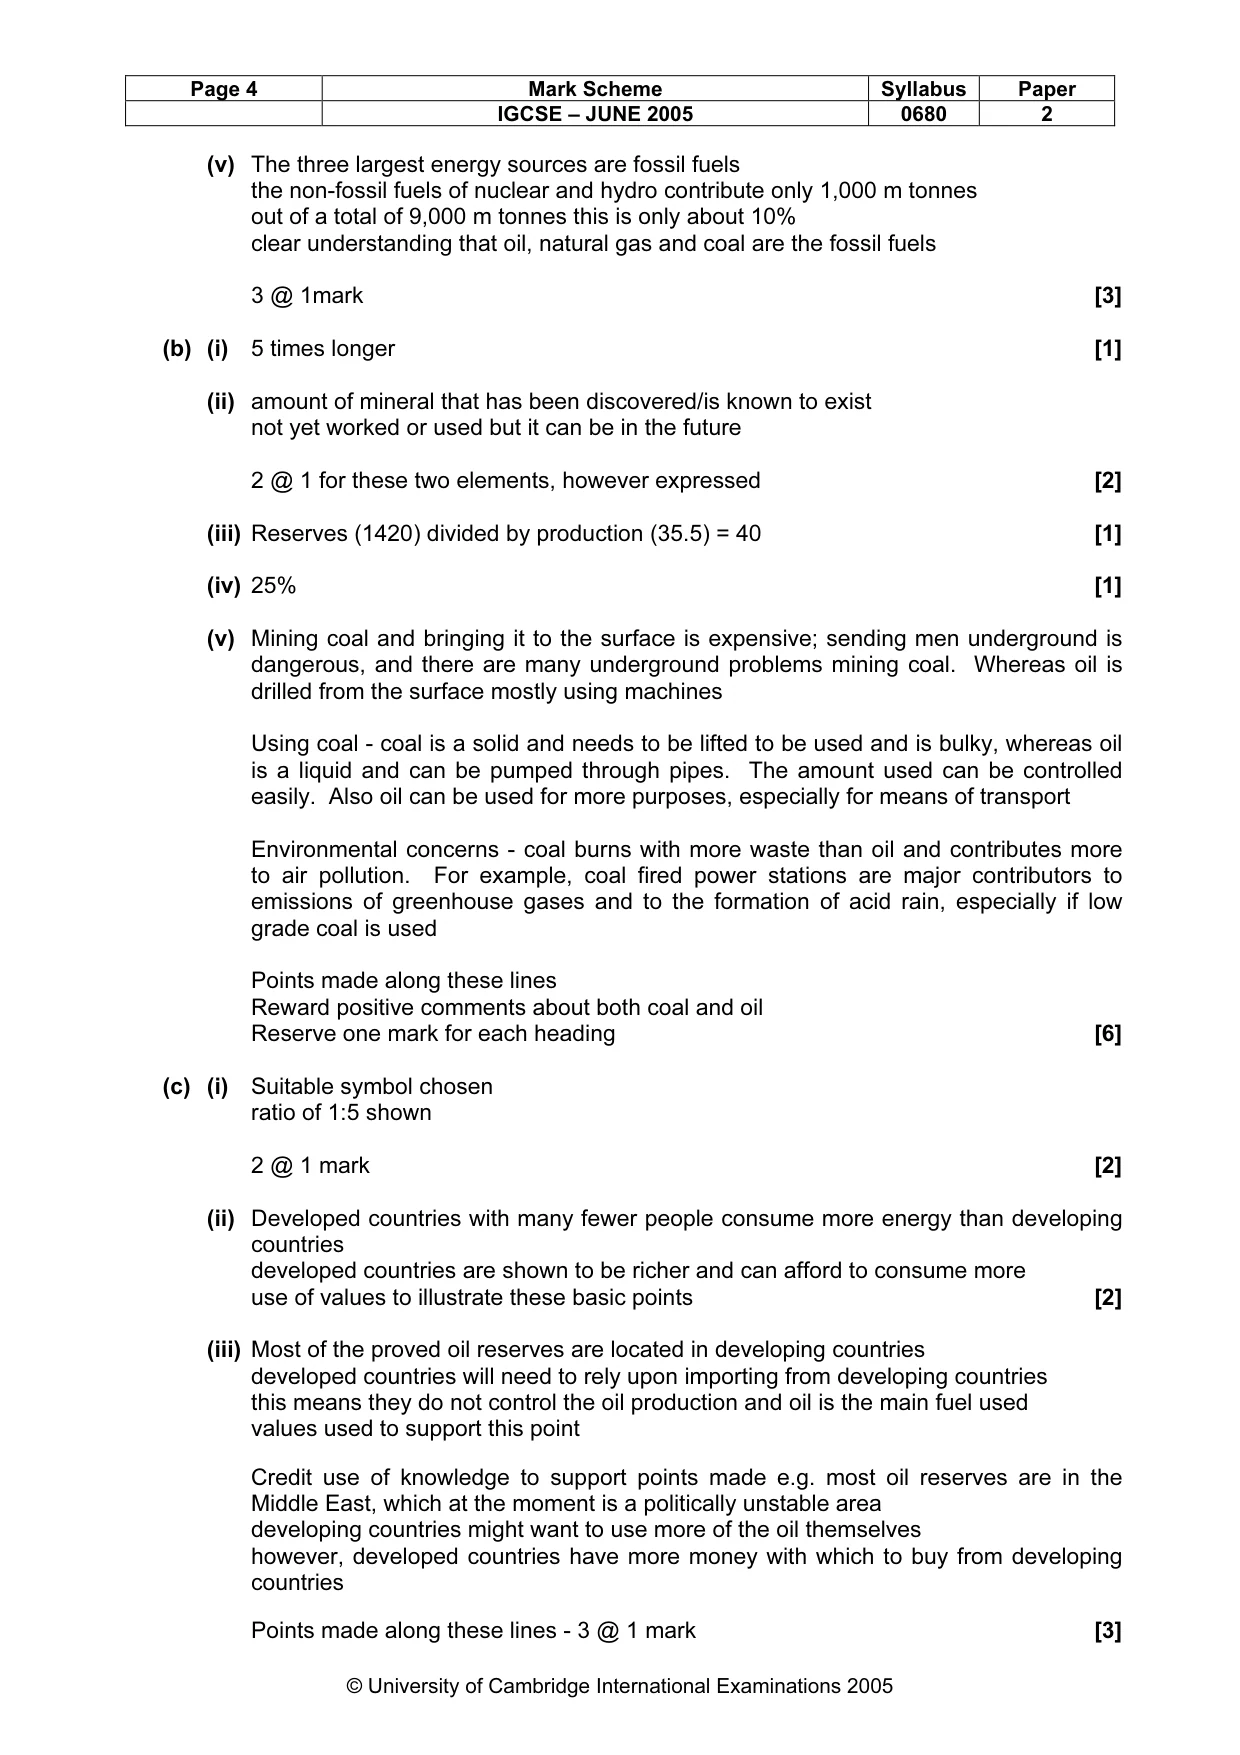
Page 4 Mark Scheme Syllabus Paper IGCSE – JUNE 2005 0680 2 © University of Cambridge International Examinations 2005 (v) The three largest energy sources are fossil fuels the non-fossil fuels of nuclear and hydro contribute only 1,000 m tonnes out of a total of 9,000 m tonnes this is only about 10% clear understanding that oil, natural gas and coal are the fossil fuels 3 @ 1mark [3] (b) (i) 5 times longer [1] (ii) amount of mineral that has been discovered/is known to exist not yet worked or used but it can be in the future 2 @ 1 for these two elements, however expressed [2] (iii) Reserves (1420) divided by production (35.5) = 40 [1] (iv) 25% [1] (v) Mining coal and bringing it to the surface is expensive; sending men underground is dangerous, and there are many underground problems mining coal. Whereas oil is drilled from the surface mostly using machines Using coal - coal is a solid and needs to be lifted to be used and is bulky, whereas oil is a liquid and can be pumped through pipes. The amount used can be controlled easily. Also oil can be used for more purposes, especially for means of transport Environmental concerns - coal burns with more waste than oil and contributes more to air pollution. For example, coal fired power stations are major contributors to emissions of greenhouse gases and to the formation of acid rain, especially if low grade coal is used Points made along these lines Reward positive comments about both coal and oil Reserve one mark for each heading [6] (c) (i) Suitable symbol chosen ratio of 1:5 shown 2 @ 1 mark [2] (ii) Developed countries with many fewer people consume more energy than developing countries developed countries are shown to be richer and can afford to consume more use of values to illustrate these basic points [2] (iii) Most of the proved oil reserves are located in developing countries developed countries will need to rely upon importing from developing countries this means they do not control the oil production and oil is the main fuel used values used to support this point Credit use of knowledge to support points made e.g. most oil reserves are in the Middle East, which at the moment is a politically unstable area developing countries might want to use more of the oil themselves however, developed countries have more money with which to buy from developing countries Points made along these lines - 3 @ 1 mark [3]
Mark scheme, page 8
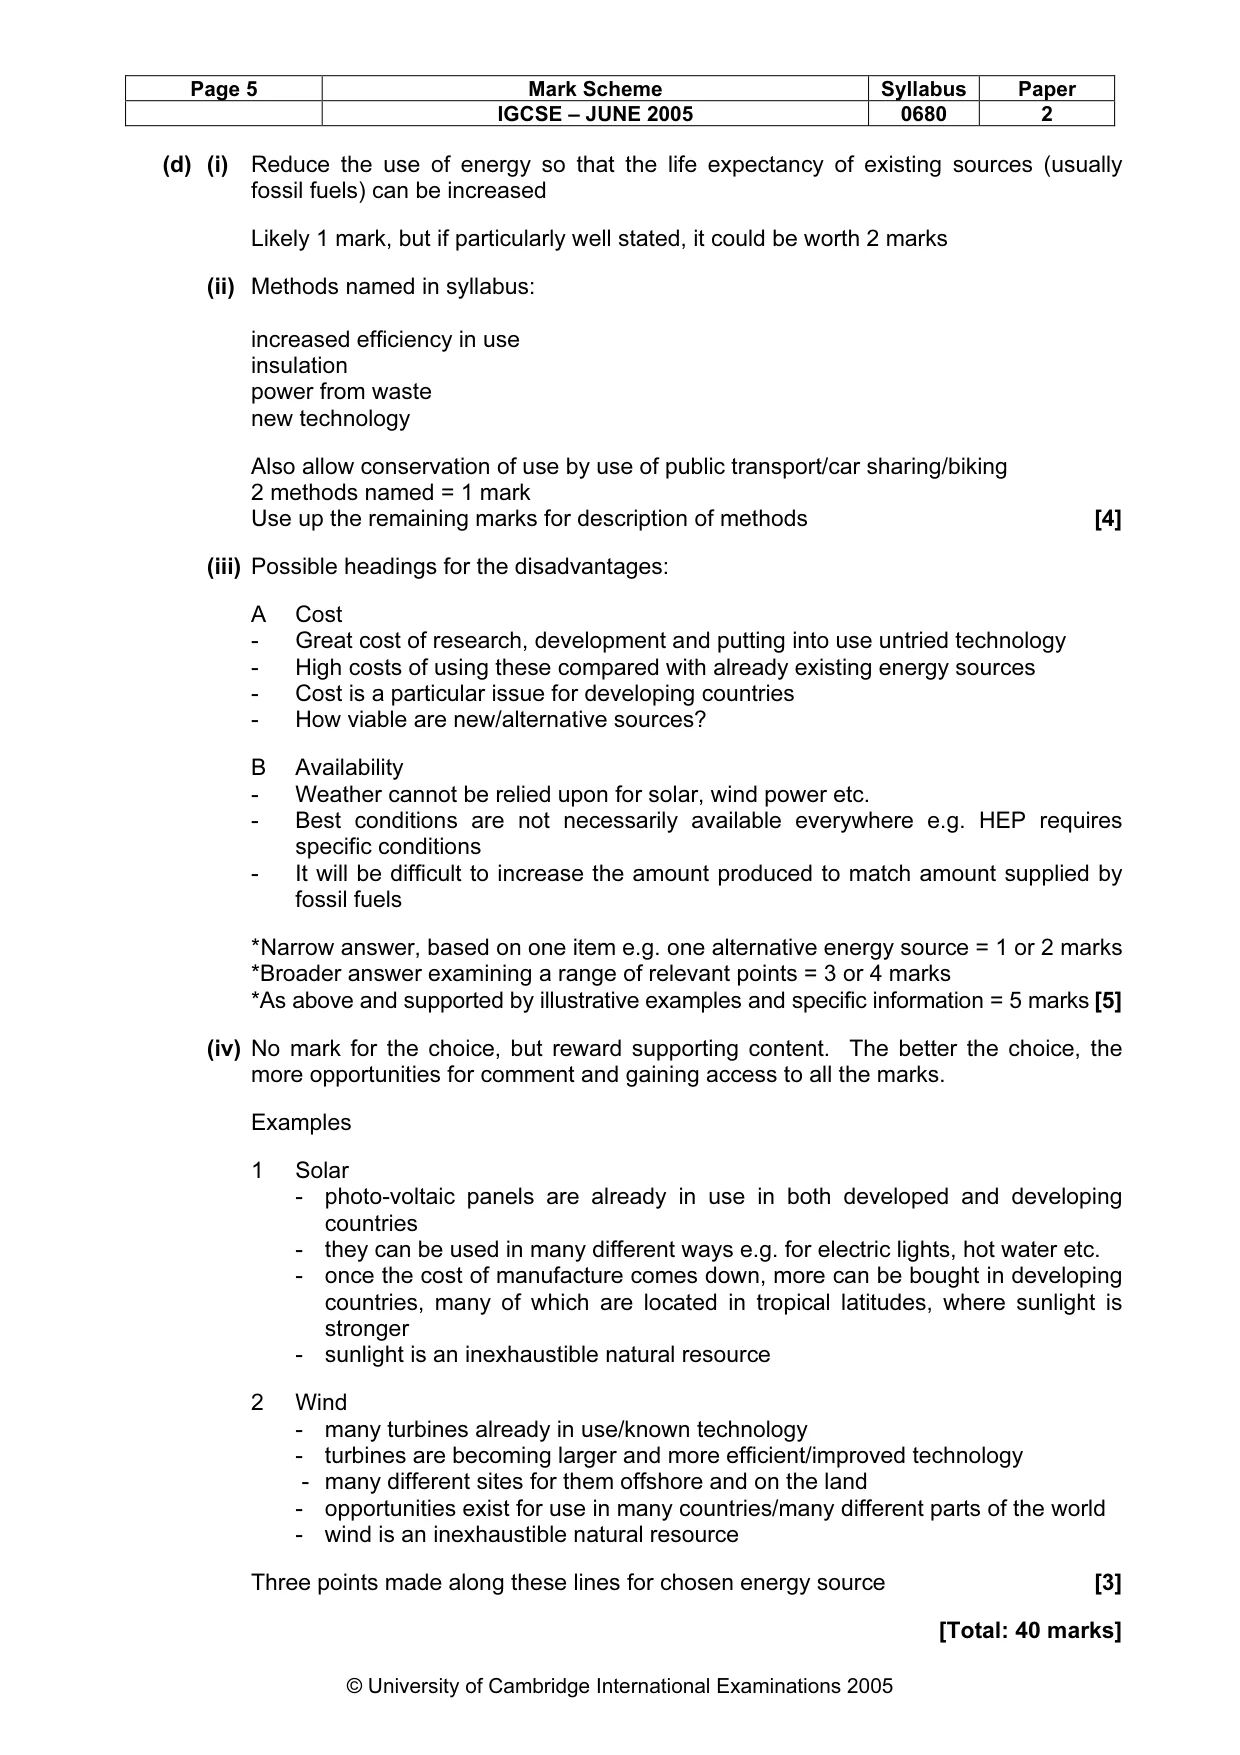
Page 5 Mark Scheme Syllabus Paper IGCSE – JUNE 2005 0680 2 © University of Cambridge International Examinations 2005 (d) (i) Reduce the use of energy so that the life expectancy of existing sources (usually fossil fuels) can be increased Likely 1 mark, but if particularly well stated, it could be worth 2 marks (ii) Methods named in syllabus: increased efficiency in use insulation power from waste new technology Also allow conservation of use by use of public transport/car sharing/biking 2 methods named = 1 mark Use up the remaining marks for description of methods [4] (iii) Possible headings for the disadvantages: A Cost - Great cost of research, development and putting into use untried technology - High costs of using these compared with already existing energy sources - Cost is a particular issue for developing countries - How viable are new/alternative sources? B Availability - Weather cannot be relied upon for solar, wind power etc. - Best conditions are not necessarily available everywhere e.g. HEP requires specific conditions - It will be difficult to increase the amount produced to match amount supplied by fossil fuels * Narrow answer, based on one item e.g. one alternative energy source = 1 or 2 marks *Broader answer examining a range of relevant points = 3 or 4 marks *As above and supported by illustrative examples and specific information = 5 marks [5] (iv) No mark for the choice, but reward supporting content. The better the choice, the more opportunities for comment and gaining access to all the marks. Examples 1 Solar - photo-voltaic panels are already in use in both developed and developing countries - they can be used in many different ways e.g. for electric lights, hot water etc. - once the cost of manufacture comes down, more can be bought in developing countries, many of which are located in tropical latitudes, where sunlight is stronger - sunlight is an inexhaustible natural resource 2 Wind - many turbines already in use/known technology - turbines are becoming larger and more efficient/improved technology - many different sites for them offshore and on the land - opportunities exist for use in many countries/many different parts of the world - wind is an inexhaustible natural resource Three points made along these lines for chosen energy source [3] [Total: 40 marks]