Cambridge IGCSE Environmental Management 0680 — 2004 Oct/Nov Paper 2 · Variant 1
0680/21/O/N/04
The question paper and its mark scheme, free to read here and free to download. This is Cambridge’s own paper, exactly as it was sat.
Question paper16 pages
Mark scheme9 pages
Answers below. Sit the paper first if you are practising.
Paper as text
Question paper, page 1
This document consists of 15 printed pages and 1 blank page. SPA (DR) S61044/4 © UCLES 2004 [Turn over UNIVERSITY OF CAMBRIDGE INTERNATIONAL EXAMINATIONS International General Certificate of Secondary Education ENVIRONMENTAL MANAGEMENT 0680/02 Paper 2 October/November 2004 1 hour 45 minutes Candidates answer on the Question Paper. Additional Materials: Rule (cm/mm) Protractor READ THESE INSTRUCTIONS FIRST Write your Centre number, candidate number and name on all the work you hand in. Write in dark blue or black pen in the spaces provided on the Question Paper. You may use a soft pencil for any diagrams, graphs or rough working. Do not use staples, paper clips, highlighters, glue or correction fluid. Answer all questions. At the end of the examination, fasten all your work securely together. The number of marks is given in brackets [ ] at the end of each question or part question. Centre Number Candidate Number Name If you have been given a label, look at the details. If any details are incorrect or missing, please fill in your correct details in the space given at the top of this page. Stick your personal label here, if provided. FOR EXAMINER’S USE 1 2 TOTAL www.XtremePapers.com
Question paper, page 2
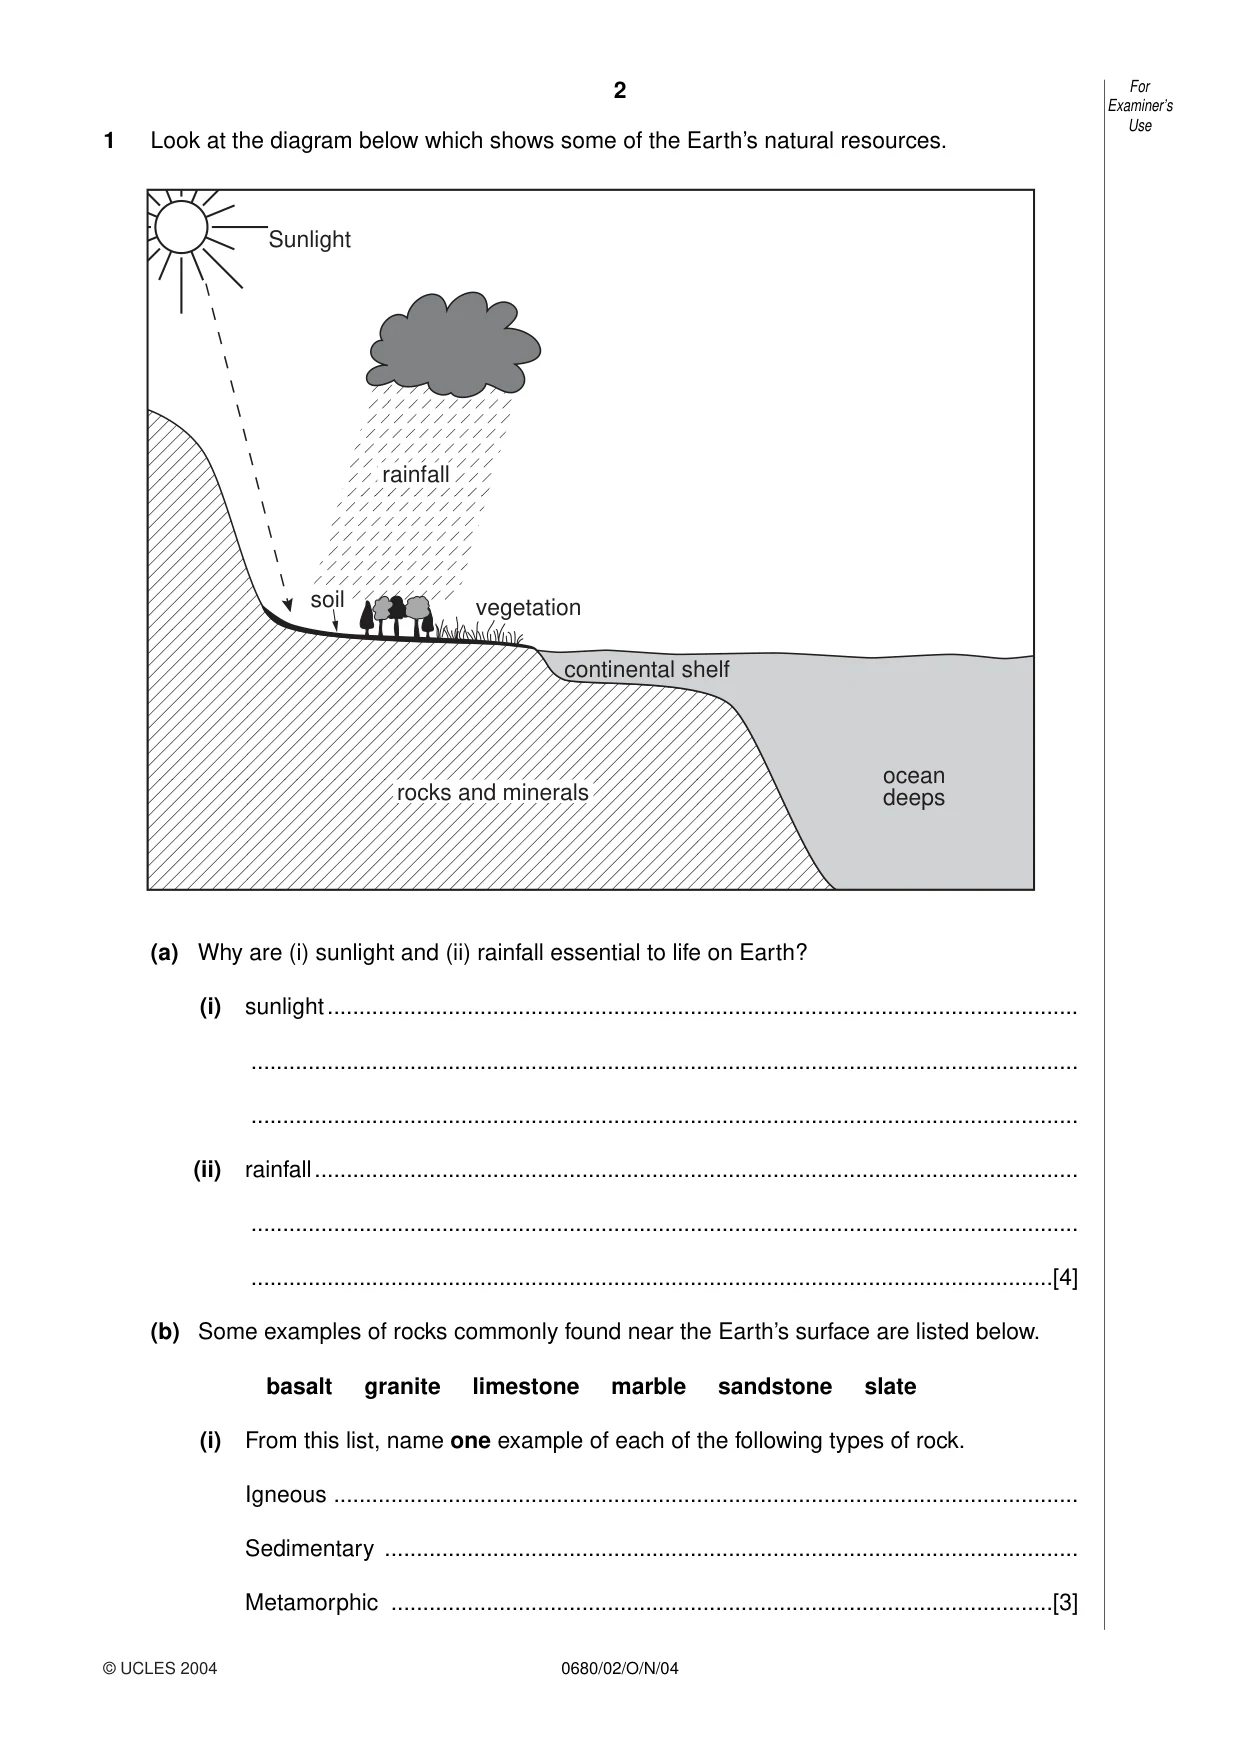
© UCLES 2004 2 0680/02/O/N/04 1 Look at the diagram below which shows some of the Earth’s natural resources. (a) Why are (i) sunlight and (ii) rainfall essential to life on Earth? (i) sunlight… … … (ii) rainfall… … …[4] (b) Some examples of rocks commonly found near the Earth’s surface are listed below. basalt granite limestone marble sandstone slate (i) From this list, name one example of each of the following types of rock. Igneous … Sedimentary … Metamorphic …[3] soil vegetation rainfall Sunlight rocks and minerals continental shelf ocean deeps For Examiner’s Use
Question paper, page 3
3 0680/02/O/N/04 [Turn over (ii) Choose one of the rocks named and describe ways in which it is useful to people. Name of rock, … Uses, … …[2] (iii) How is the formation of metamorphic rock different from igneous rock? … … … …[2] (iv) State one way in which soil is different from rock. … …[1] (c) The continental shelf is marked on the diagram. (i) What is the continental shelf? … …[1] (ii) Name two different types of natural resources obtained by people from continental shelves. 1 … 2 …[2] (iii) Explain why people find it more difficult to exploit the natural resources of seas and oceans than those of the land. … … … … …[3] For Examiner’s Use © UCLES 2004
Question paper, page 4
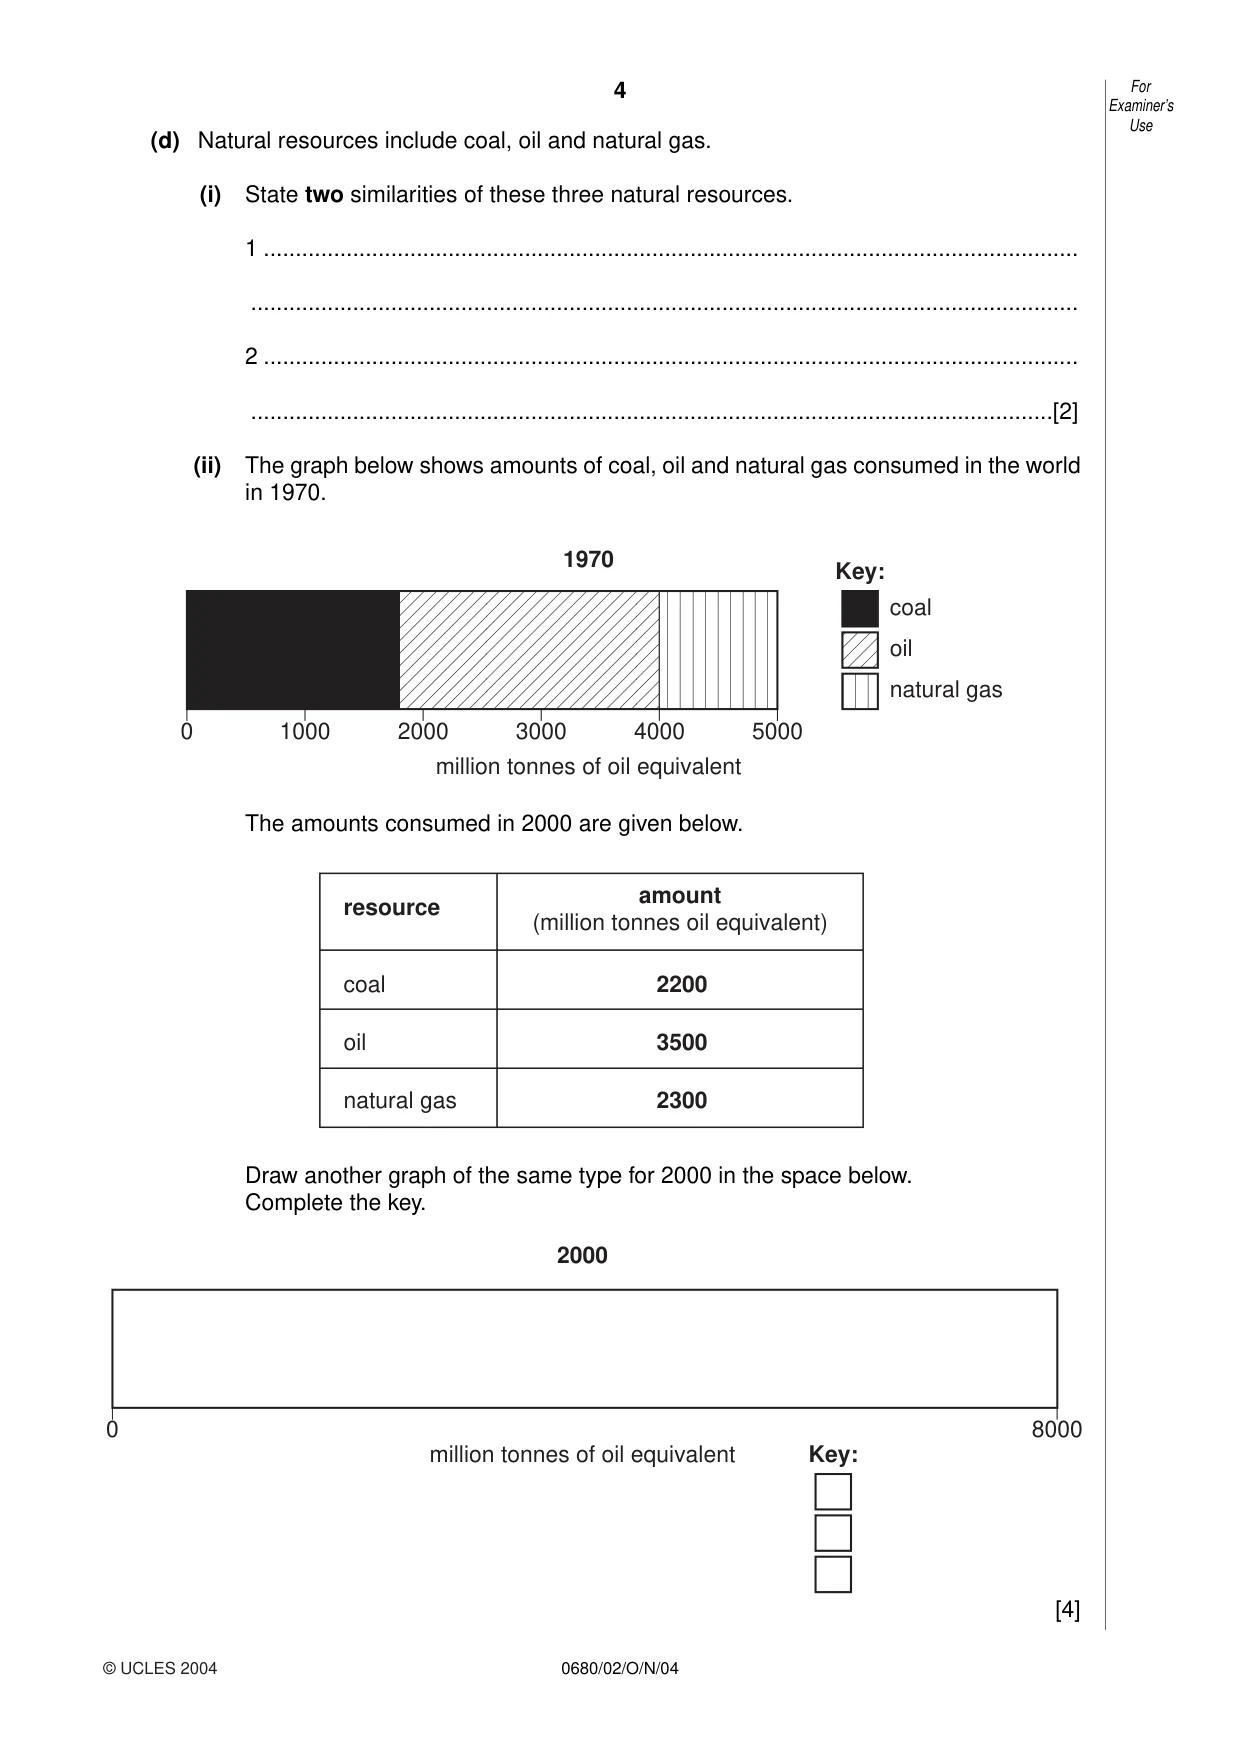
© UCLES 2004 4 0680/02/O/N/04 (d) Natural resources include coal, oil and natural gas. (i) State two similarities of these three natural resources. 1 … … 2 … …[2] (ii) The graph below shows amounts of coal, oil and natural gas consumed in the world in 1970. The amounts consumed in 2000 are given below. Draw another graph of the same type for 2000 in the space below. Complete the key. [4] resource amount (million tonnes oil equivalent) coal oil natural gas 2200 3500 2300 0 1000 2000 3000 4000 5000 Key: coal oil natural gas 1970 million tonnes of oil equivalent For Examiner’s Use 0 8000 Key: 2000 million tonnes of oil equivalent
Question paper, page 5
5 0680/02/O/N/04 [Turn over (iii) State reasons why consumption of all three has increased, but for some more than others. All three have increased, … … … … … Some more than others, … … … … …[5] For Examiner’s Use © UCLES 2004
Question paper, page 6
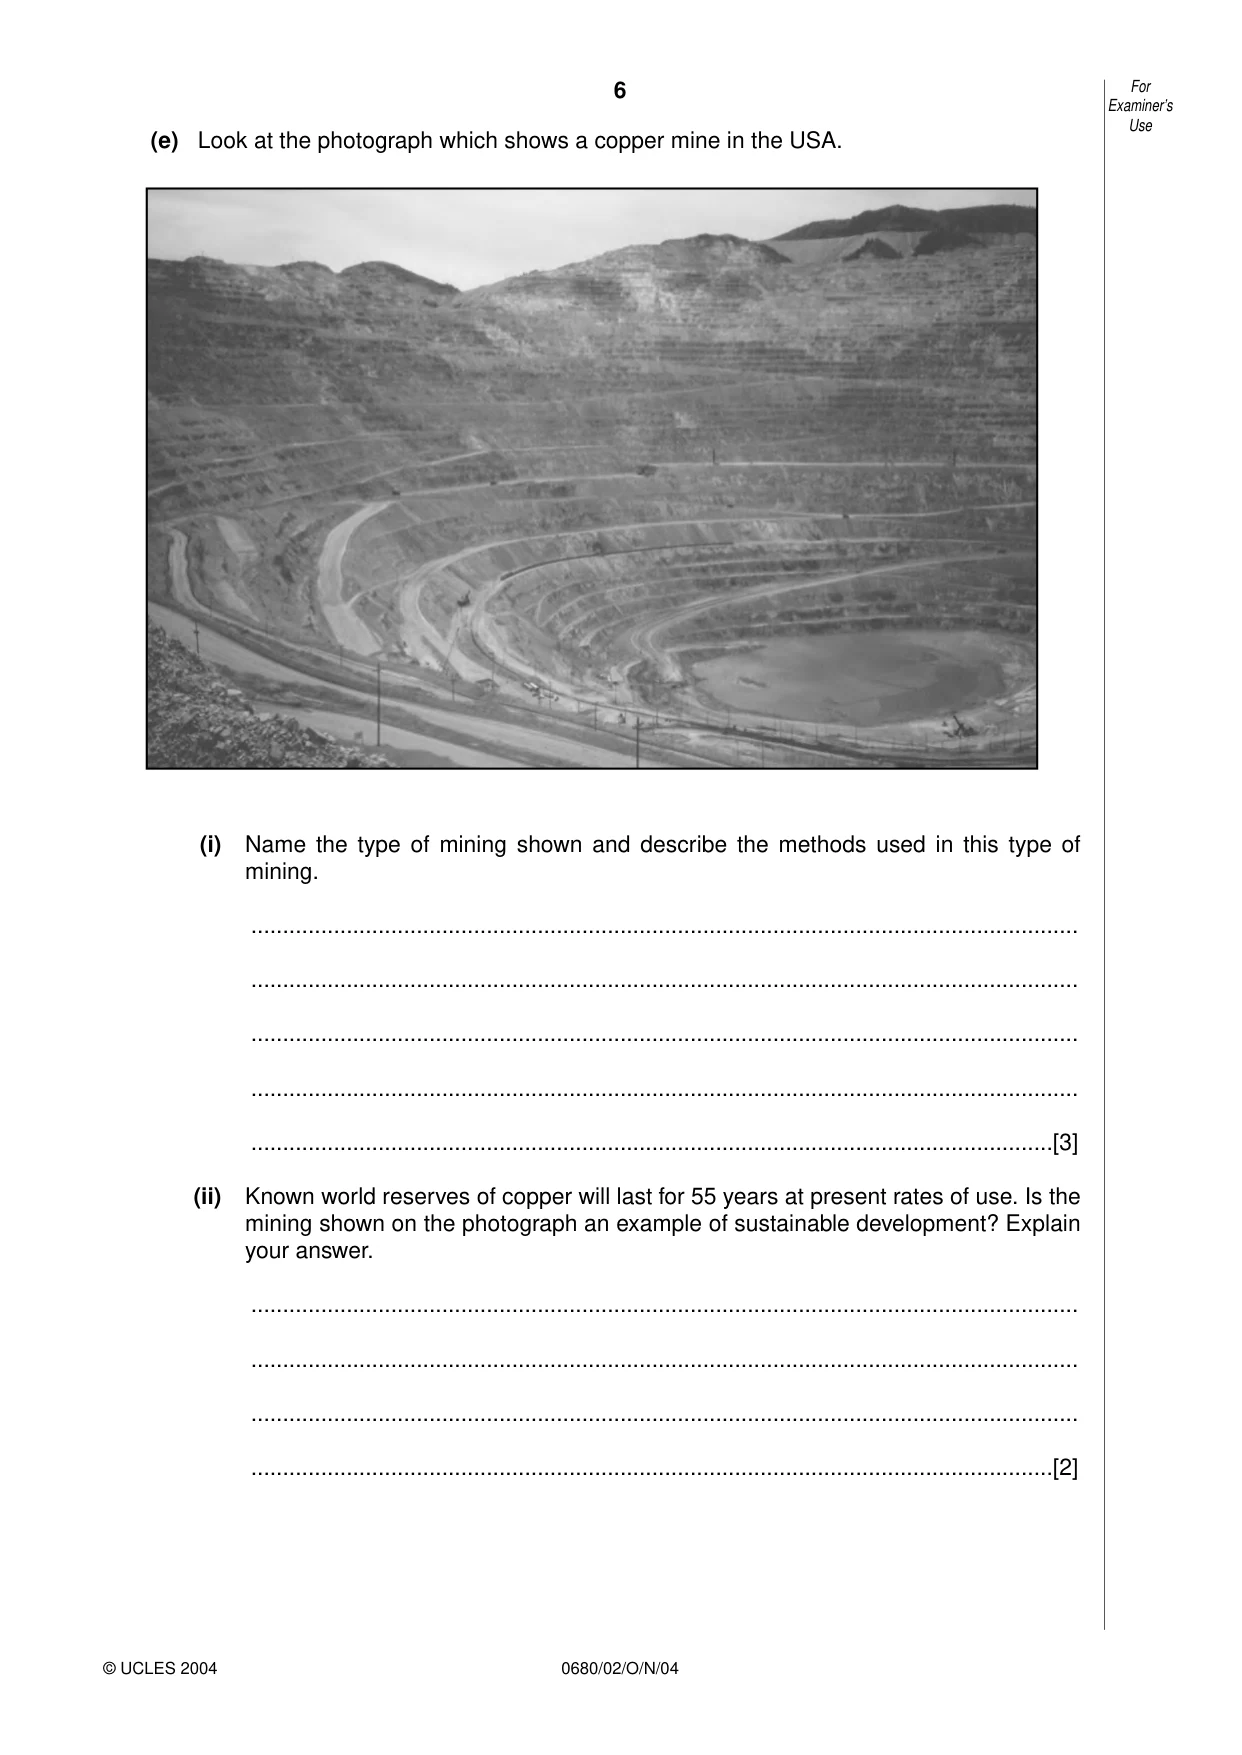
6 0680/02/O/N/04 (e) Look at the photograph which shows a copper mine in the USA. (i) Name the type of mining shown and describe the methods used in this type of mining. … … … … …[3] (ii) Known world reserves of copper will last for 55 years at present rates of use. Is the mining shown on the photograph an example of sustainable development? Explain your answer. … … … …[2] For Examiner’s Use © UCLES 2004
Question paper, page 7
7 0680/02/O/N/04 [Turn over (f) (i) Name some of the strategies for conservation and management of the Earth’s fuel and mineral resources. … … … (ii) Explain some of the problems of putting such strategies into practice successfully. … … … … … … … … …[6] Total [40] For Examiner’s Use © UCLES 2004
Question paper, page 8
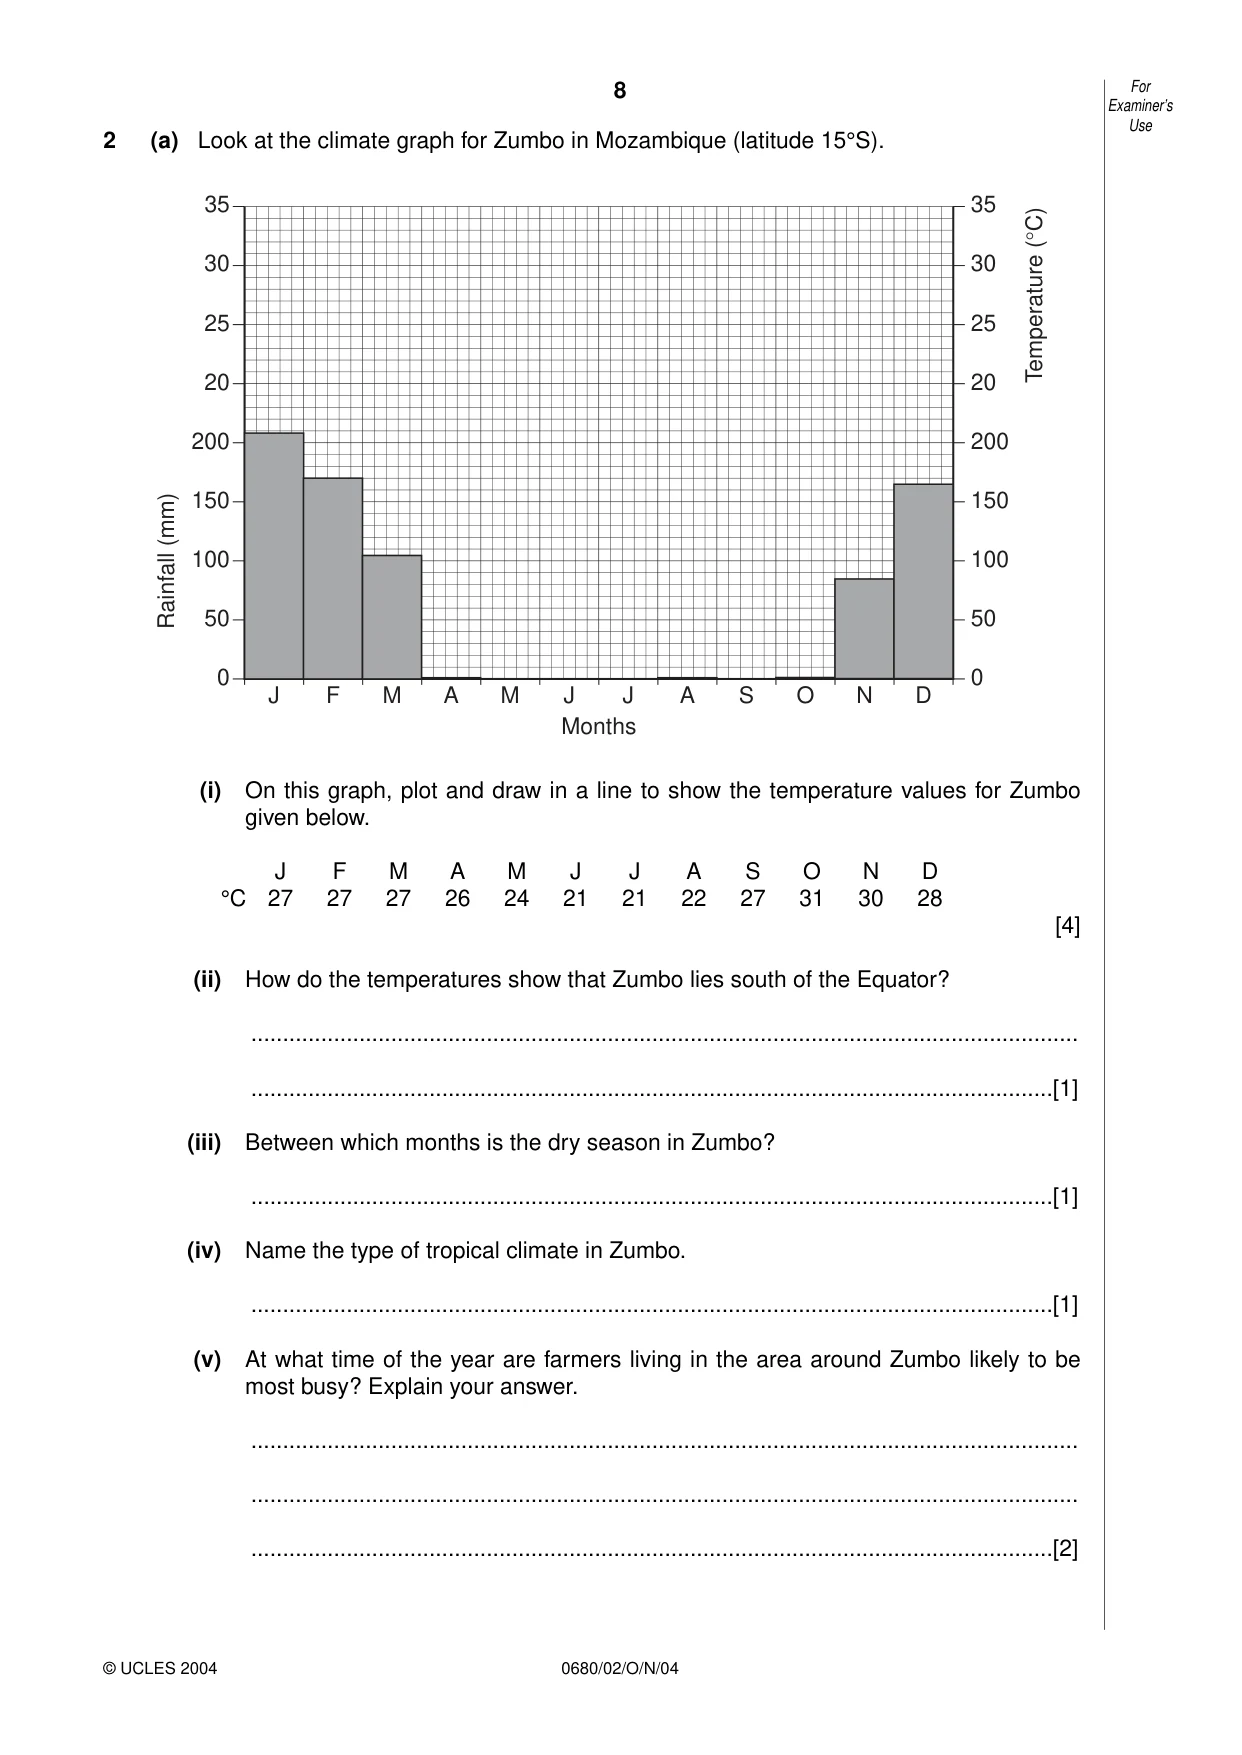
8 0680/02/O/N/04 2 (a) Look at the climate graph for Zumbo in Mozambique (latitude 15°S). (i) On this graph, plot and draw in a line to show the temperature values for Zumbo given below. J F M A M J J A S O N D °C 27 27 27 26 24 21 21 22 27 31 30 28 [4] (ii) How do the temperatures show that Zumbo lies south of the Equator? … …[1] (iii) Between which months is the dry season in Zumbo? …[1] (iv) Name the type of tropical climate in Zumbo. …[1] (v) At what time of the year are farmers living in the area around Zumbo likely to be most busy? Explain your answer. … … …[2] J F M A M J J A S O N D 0 50 100 150 200 20 25 30 0 50 100 150 200 20 25 30 35 35 Rainfall (mm) Temperature (°C) Months For Examiner’s Use © UCLES 2004
Question paper, page 9
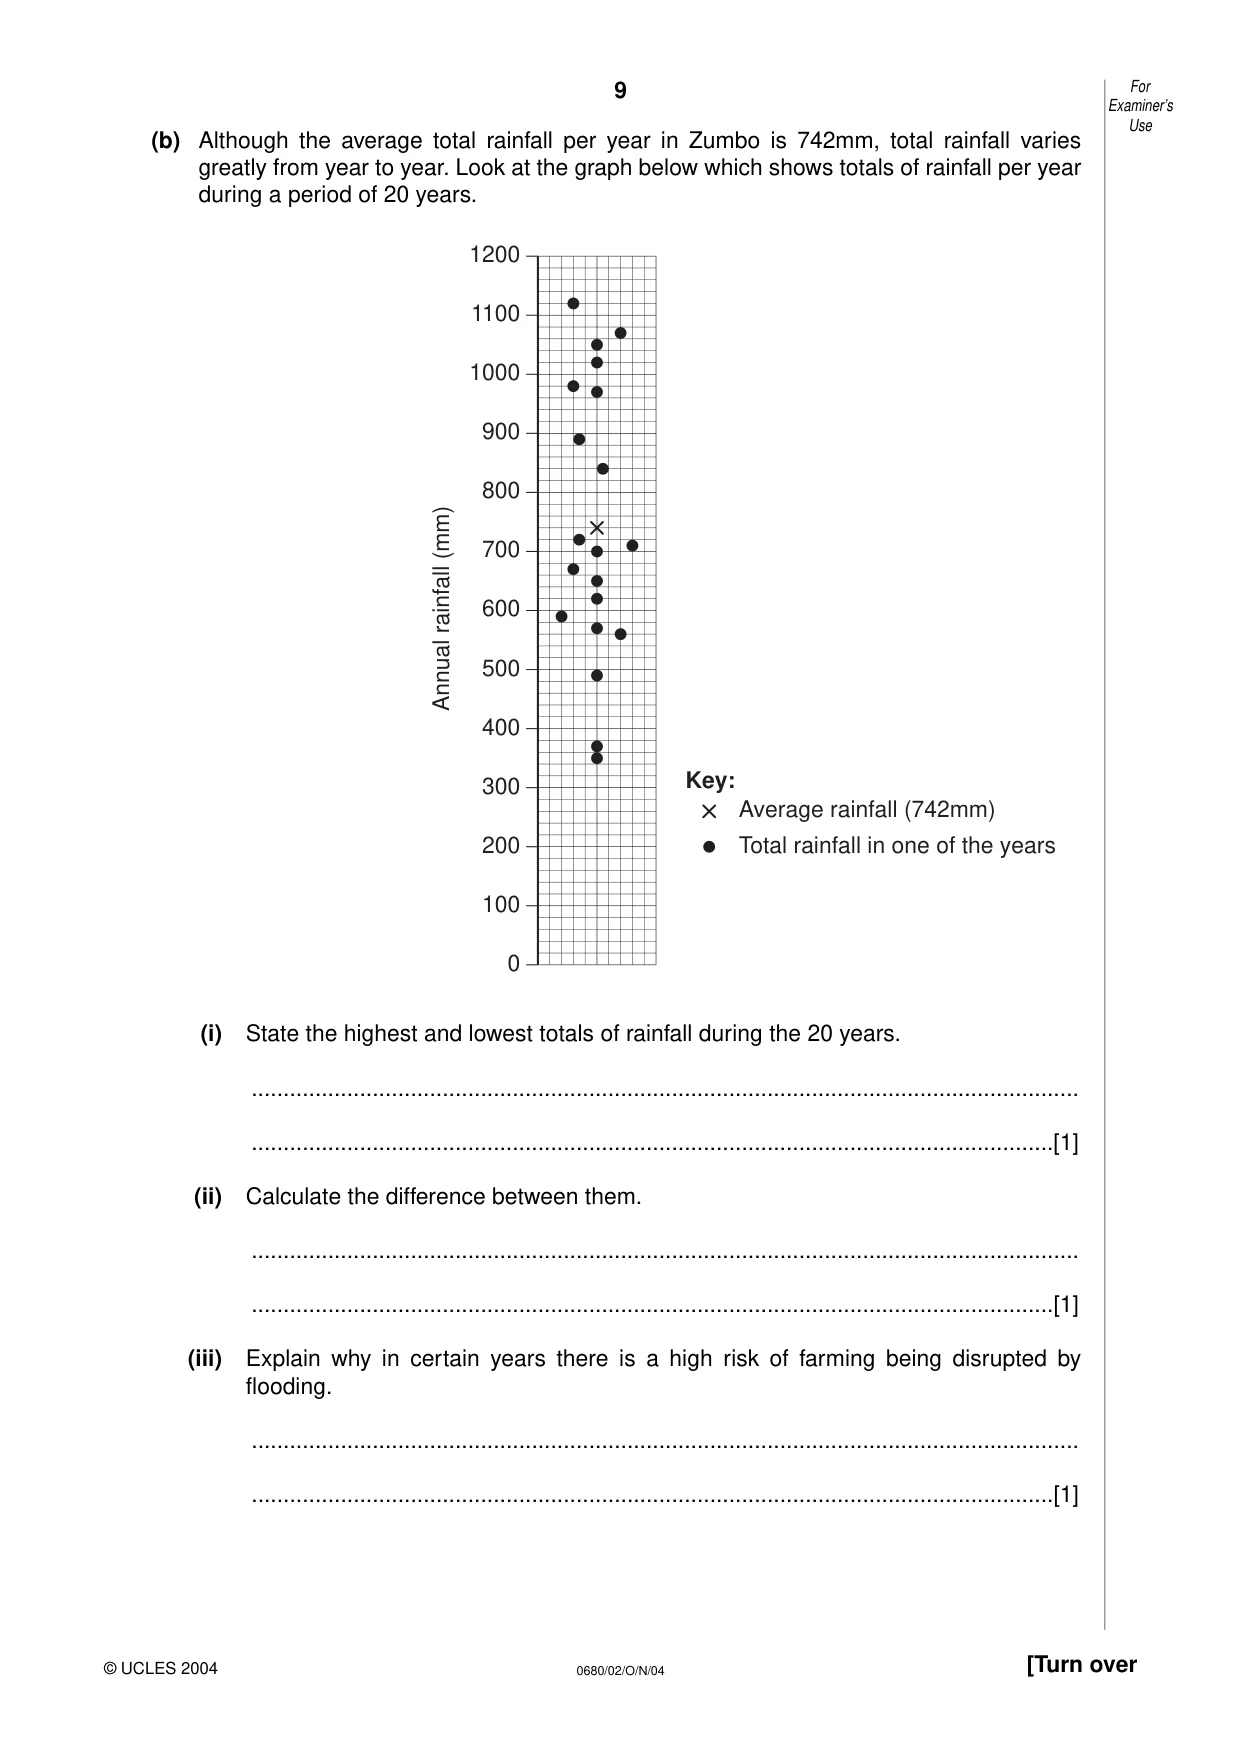
9 0680/02/O/N/04 [Turn over (b) Although the average total rainfall per year in Zumbo is 742mm, total rainfall varies greatly from year to year. Look at the graph below which shows totals of rainfall per year during a period of 20 years. (i) State the highest and lowest totals of rainfall during the 20 years. … …[1] (ii) Calculate the difference between them. … …[1] (iii) Explain why in certain years there is a high risk of farming being disrupted by flooding. … …[1] 0 100 200 300 400 500 600 700 800 900 1000 1100 1200 Key: Average rainfall (742mm) Annual rainfall (mm) Total rainfall in one of the years For Examiner’s Use © UCLES 2004
Question paper, page 10
10 0680/02/O/N/04 (iv) Describe how flooding can affect the health and income of farmers in tropical areas such as this. … … … … …[3] (v) Why is it likely that farmers around Zumbo need to use irrigation water in many years to obtain enough food? Quote values from the graph to support your answer. … … … …[2] (vi) Name one area in the world where farmers use irrigation water to increase food output. Describe how the water is collected and used. Name of area, … … … … … … …[4] (vii) Describe how collecting and using irrigation water can damage the environment. … … … … … …[3] For Examiner’s Use © UCLES 2004
Question paper, page 11
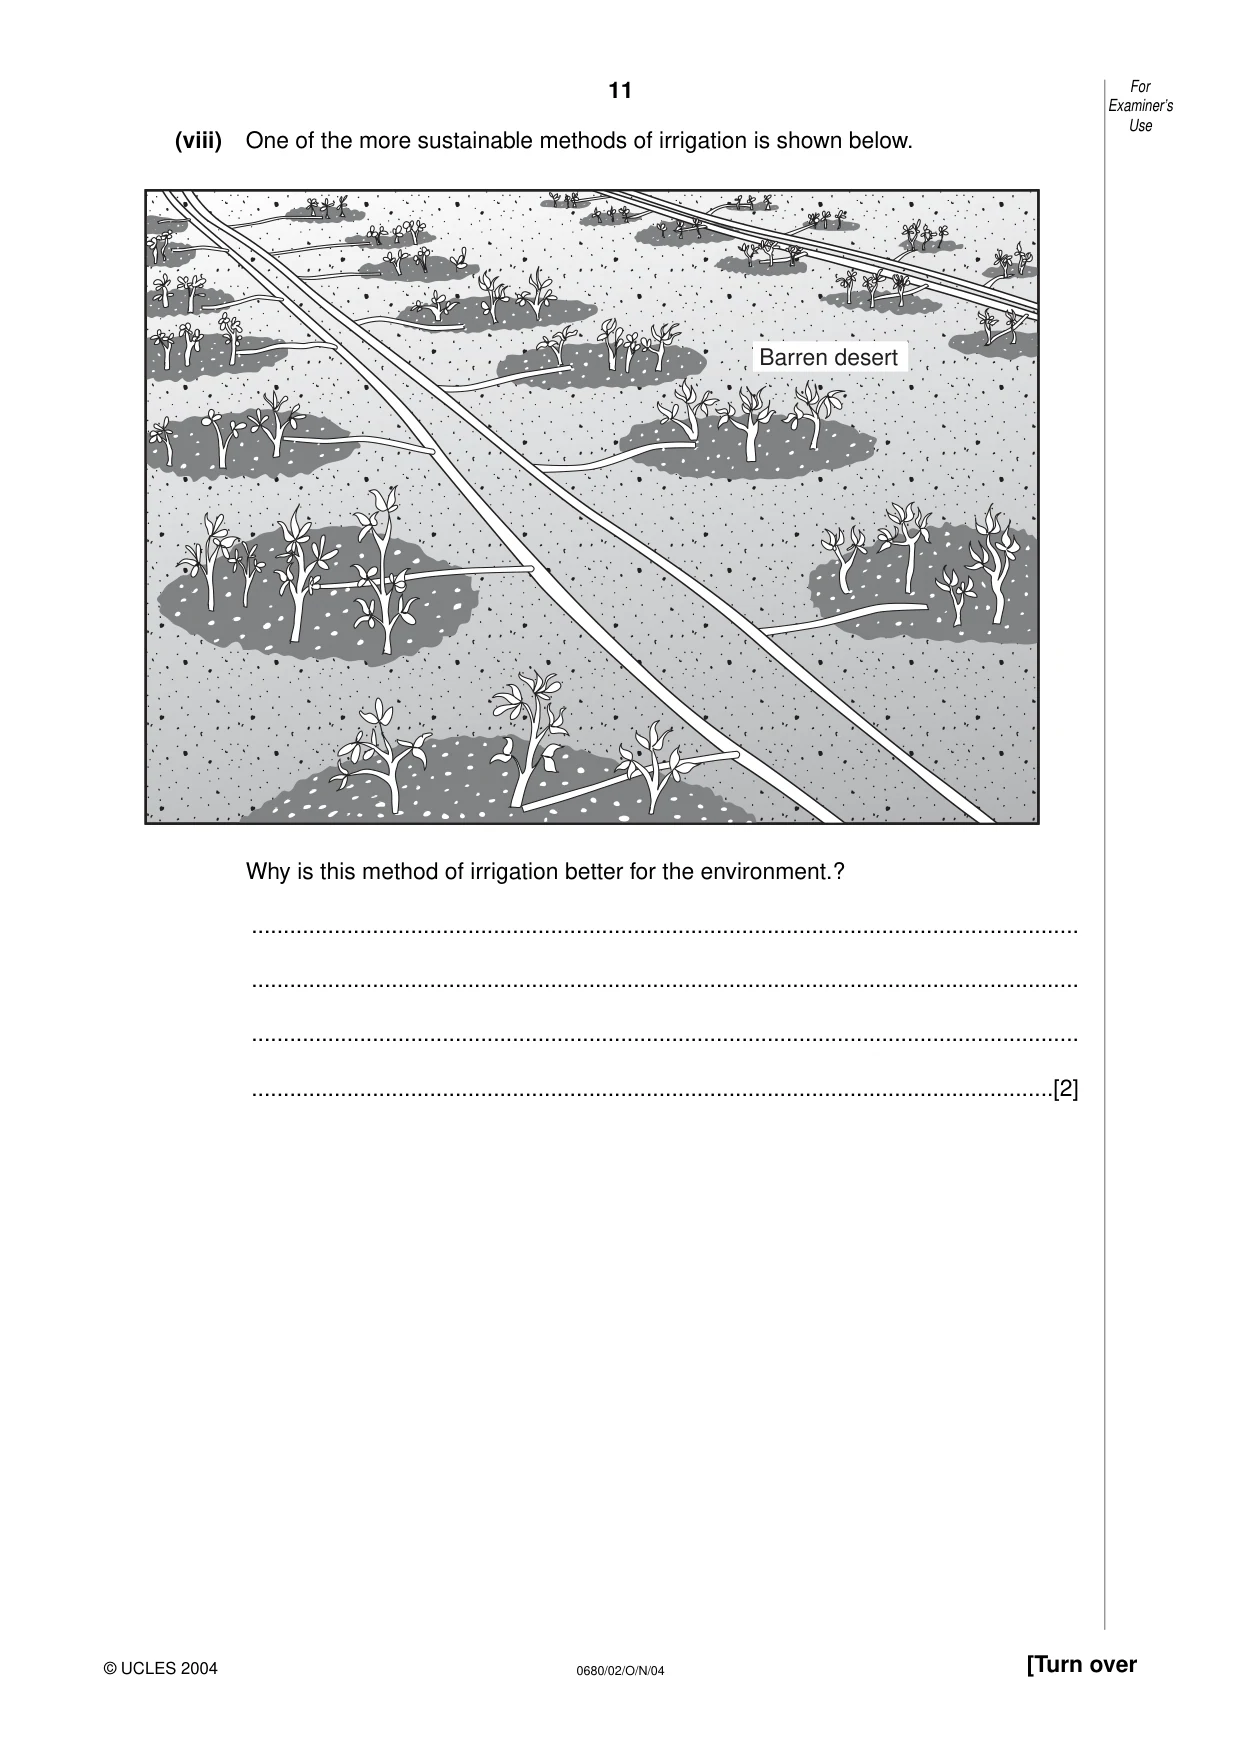
11 0680/02/O/N/04 [Turn over (viii) One of the more sustainable methods of irrigation is shown below. Why is this method of irrigation better for the environment.? … … … …[2] Barren desert For Examiner’s Use © UCLES 2004
Question paper, page 12
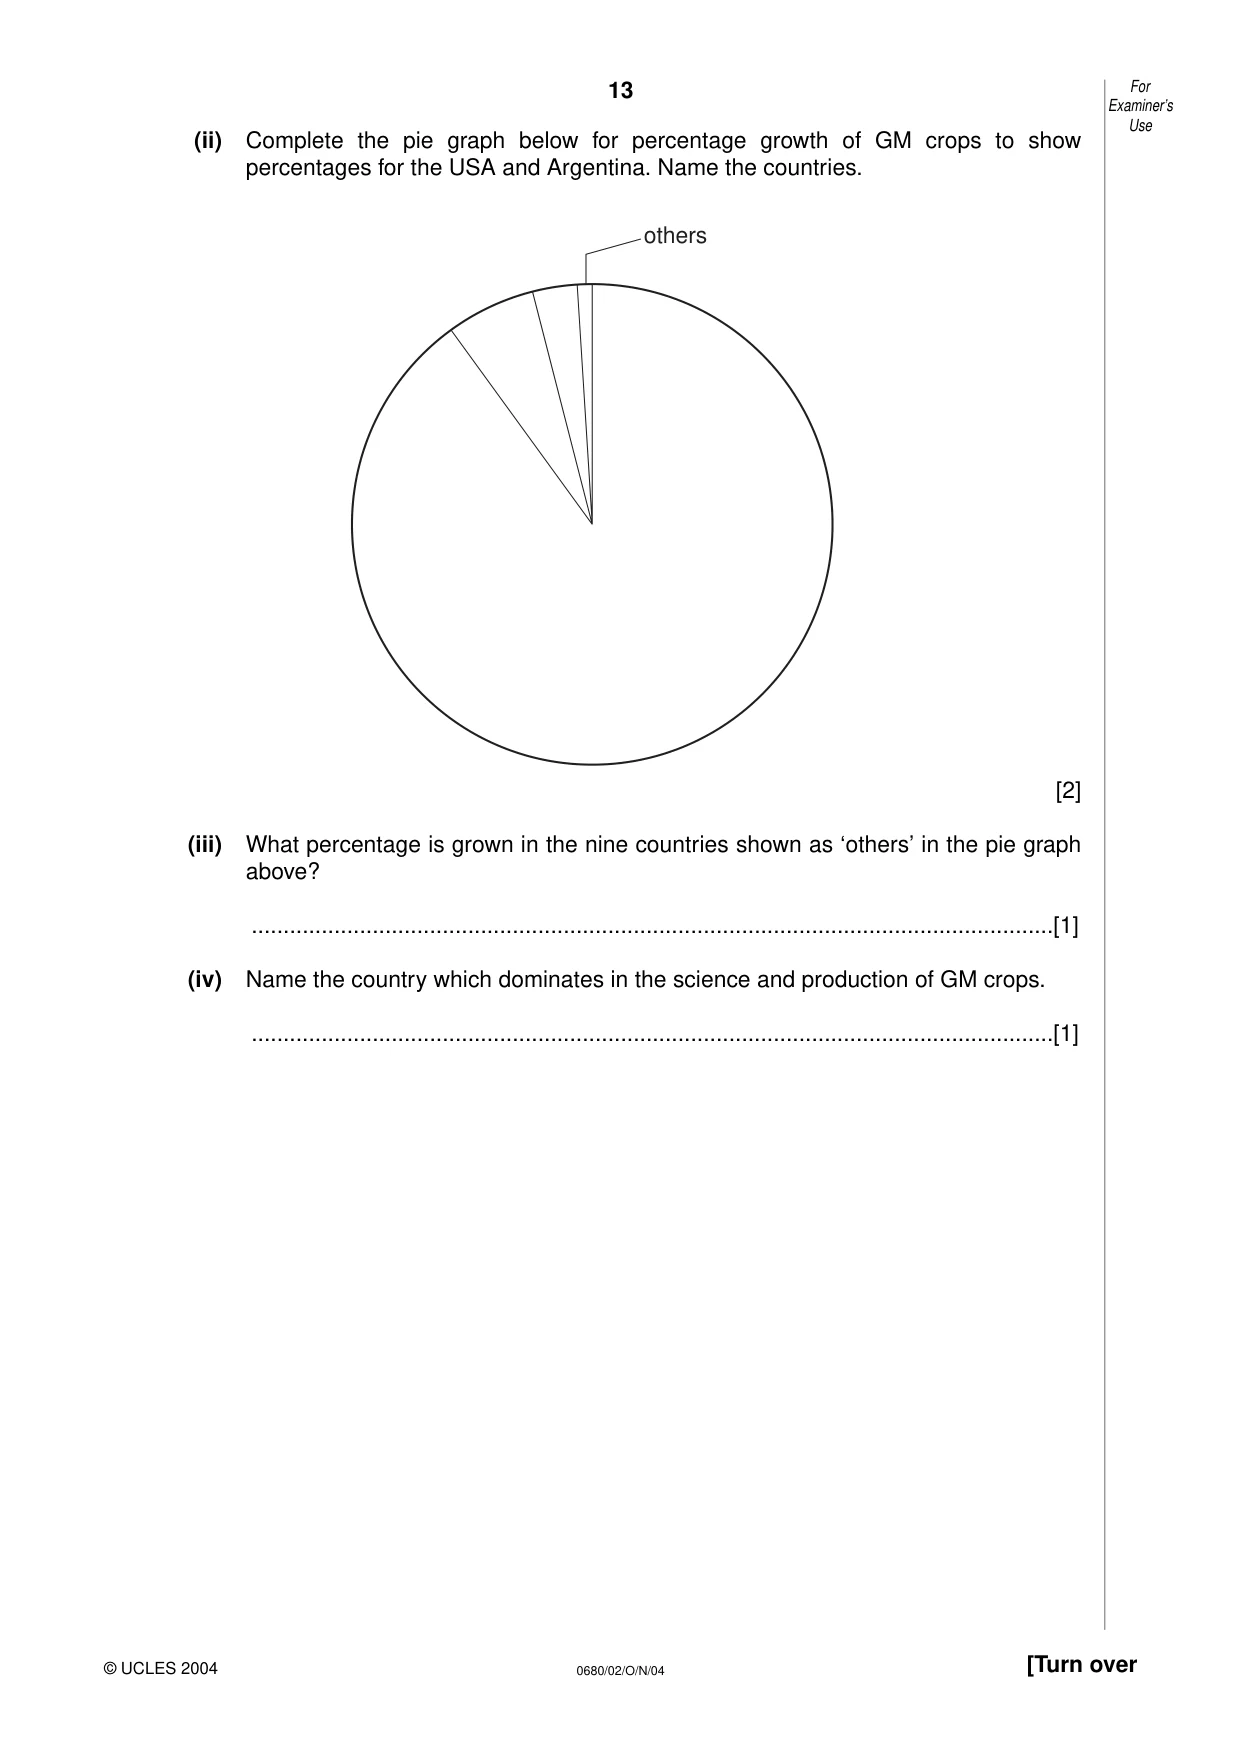
12 0680/02/O/N/04 (c) Another way in which some people believe that food output can be increased is by genetic engineering to grow GM (genetically modified) crops. Some information about this is given below. GM crops What are they? Scientists, mainly working in the USA, have transferred genes from one organism to another to create different plant varieties and new seeds for new varieties of crops. The three main GM crops are corn (maize), cotton and soya beans. Where are they? Over 50 million hectares of GM crops are grown in 13 countries around the world. The highest percentages are grown in • the USA (68%) • Argentina (22%) • Canada (6%) • China (3%) (i) How are seeds used for GM crops different from seeds that have been used by farmers for thousands of years? … … …[2] For Examiner’s Use © UCLES 2004
Question paper, page 13
13 0680/02/O/N/04 [Turn over (ii) Complete the pie graph below for percentage growth of GM crops to show percentages for the USA and Argentina. Name the countries. [2] (iii) What percentage is grown in the nine countries shown as ‘others’ in the pie graph above? …[1] (iv) Name the country which dominates in the science and production of GM crops. …[1] others For Examiner’s Use © UCLES 2004
Question paper, page 14
14 0680/02/O/N/04 (d) People hold different views about GM crops. What do supporters of GM crops say? • Higher food output and foods that can offer higher levels of nutrients and vitamins. • Disease resistant, which means higher output and less pesticide use. (There is less leakage of chemicals into rivers and seas as well). • Herbicide tolerant, which means that farmers can use weed killers and control weeds without damaging their crops. • Hunger in developing countries will be reduced. • More efficient use of existing farm land, so that fewer forests will need to be cleared in the future for new farm land. One scientist says, ‘The world cannot afford to miss the new opportunities created by new scientific discoveries and technologies’. What do people opposed to GM crops say? • It is dangerous to use genetic engineering to create plant and animal varieties that could not have been created in nature. • This may create ‘super weeds’ without controls, replacing existing varieties of plants and animals from the ecosystem and reducing biodiversity. • Use of natural crop varieties will be reduced, also reducing biodiversity. • Greater use of herbicides (weed killers) will result in a higher concentration of chemicals in food and water run off from the land. • Increases in food output have not been as great as supporters have claimed. One environmentalist says, ‘New organisms can never be removed from the environment once they have been created, so that these scientists are gambling with the natural world’. For Examiner’s Use © UCLES 2004
Question paper, page 15
© UCLES 2004 15 0680/02/O/N/04 (i) Explain more fully why the scientist supports GM crops and the environmentalist opposes their use. Scientist - for their use. … … … … Environmentalist - against their use. … … … …[4] (ii) Who do you agree with most? Explain your answer. … … … … … … … … … …[4] Total [40] Total for paper [80] For Examiner’s Use
Question paper, page 16
© UCLES 2004 16 0680/02/O/N/04 BLANK PAGE Copyright Acknowledgements: Question 1e Photograph: John Pallister Every reasonable effort has been made to trace all copyright holders where the publishers (i.e. UCLES) are aware that third-party material has been reproduced. The publishers would be pleased to hear from anyone whose rights they have unwittingly infringed. University of Cambridge International Examinations is part of the University of Cambridge Local Examinations Syndicate (UCLES), which is itself a department of the University of Cambridge.
Mark scheme, page 1
UNIVERSITY OF CAMBRIDGE INTERNATIONAL EXAMINATIONS International General Certificate of Secondary Education MARK SCHEME for the November 2004 question paper 0680 ENVIRONMENTAL MANAGEMENT 0680/02 Paper 2, maximum mark 80 This mark scheme is published as an aid to teachers and students, to indicate the requirements of the examination. It shows the basis on which Examiners were initially instructed to award marks. It does not indicate the details of the discussions that took place at an Examiners’ meeting before marking began. Any substantial changes to the mark scheme that arose from these discussions will be recorded in the published Report on the Examination. All Examiners are instructed that alternative correct answers and unexpected approaches in candidates’ scripts must be given marks that fairly reflect the relevant knowledge and skills demonstrated. Mark schemes must be read in conjunction with the question papers and the Report on the Examination. • CIE will not enter into discussion or correspondence in connection with these mark schemes. CIE is publishing the mark schemes for the November 2004 question papers for most IGCSE and GCE Advanced Level syllabuses. www.XtremePapers.com
Mark scheme, page 2
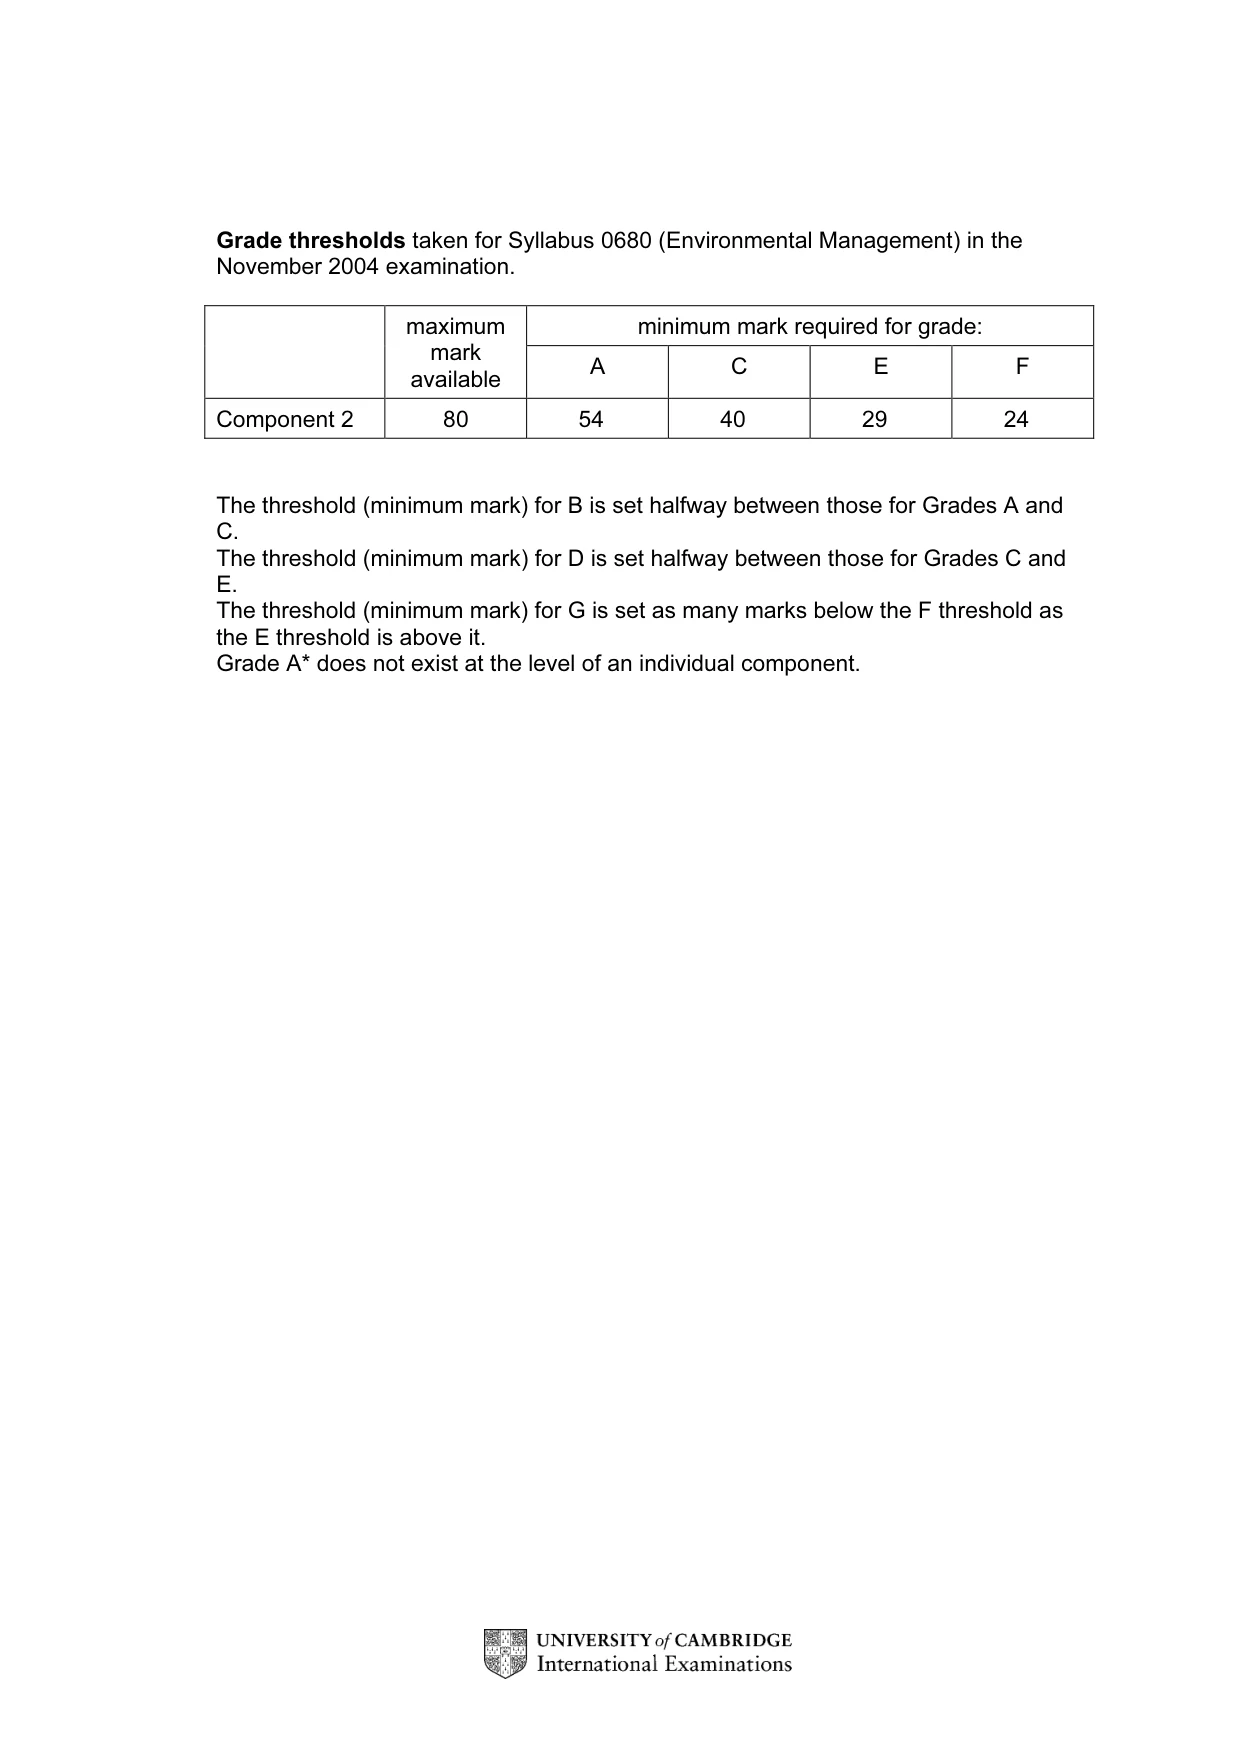
Grade thresholds taken for Syllabus 0680 (Environmental Management) in the November 2004 examination. minimum mark required for grade: maximum mark available A C E F Component 2 80 54 40 29 24 The threshold (minimum mark) for B is set halfway between those for Grades A and C. The threshold (minimum mark) for D is set halfway between those for Grades C and E. The threshold (minimum mark) for G is set as many marks below the F threshold as the E threshold is above it. Grade A* does not exist at the level of an individual component.
Mark scheme, page 3
November 2004 INTERNATIONAL GCSE MARK SCHEME MAXIMUM MARK: 80 SYLLABUS/COMPONENT: 0680/02 ENVIRONMENTAL MANAGEMENT Paper 2
Mark scheme, page 4
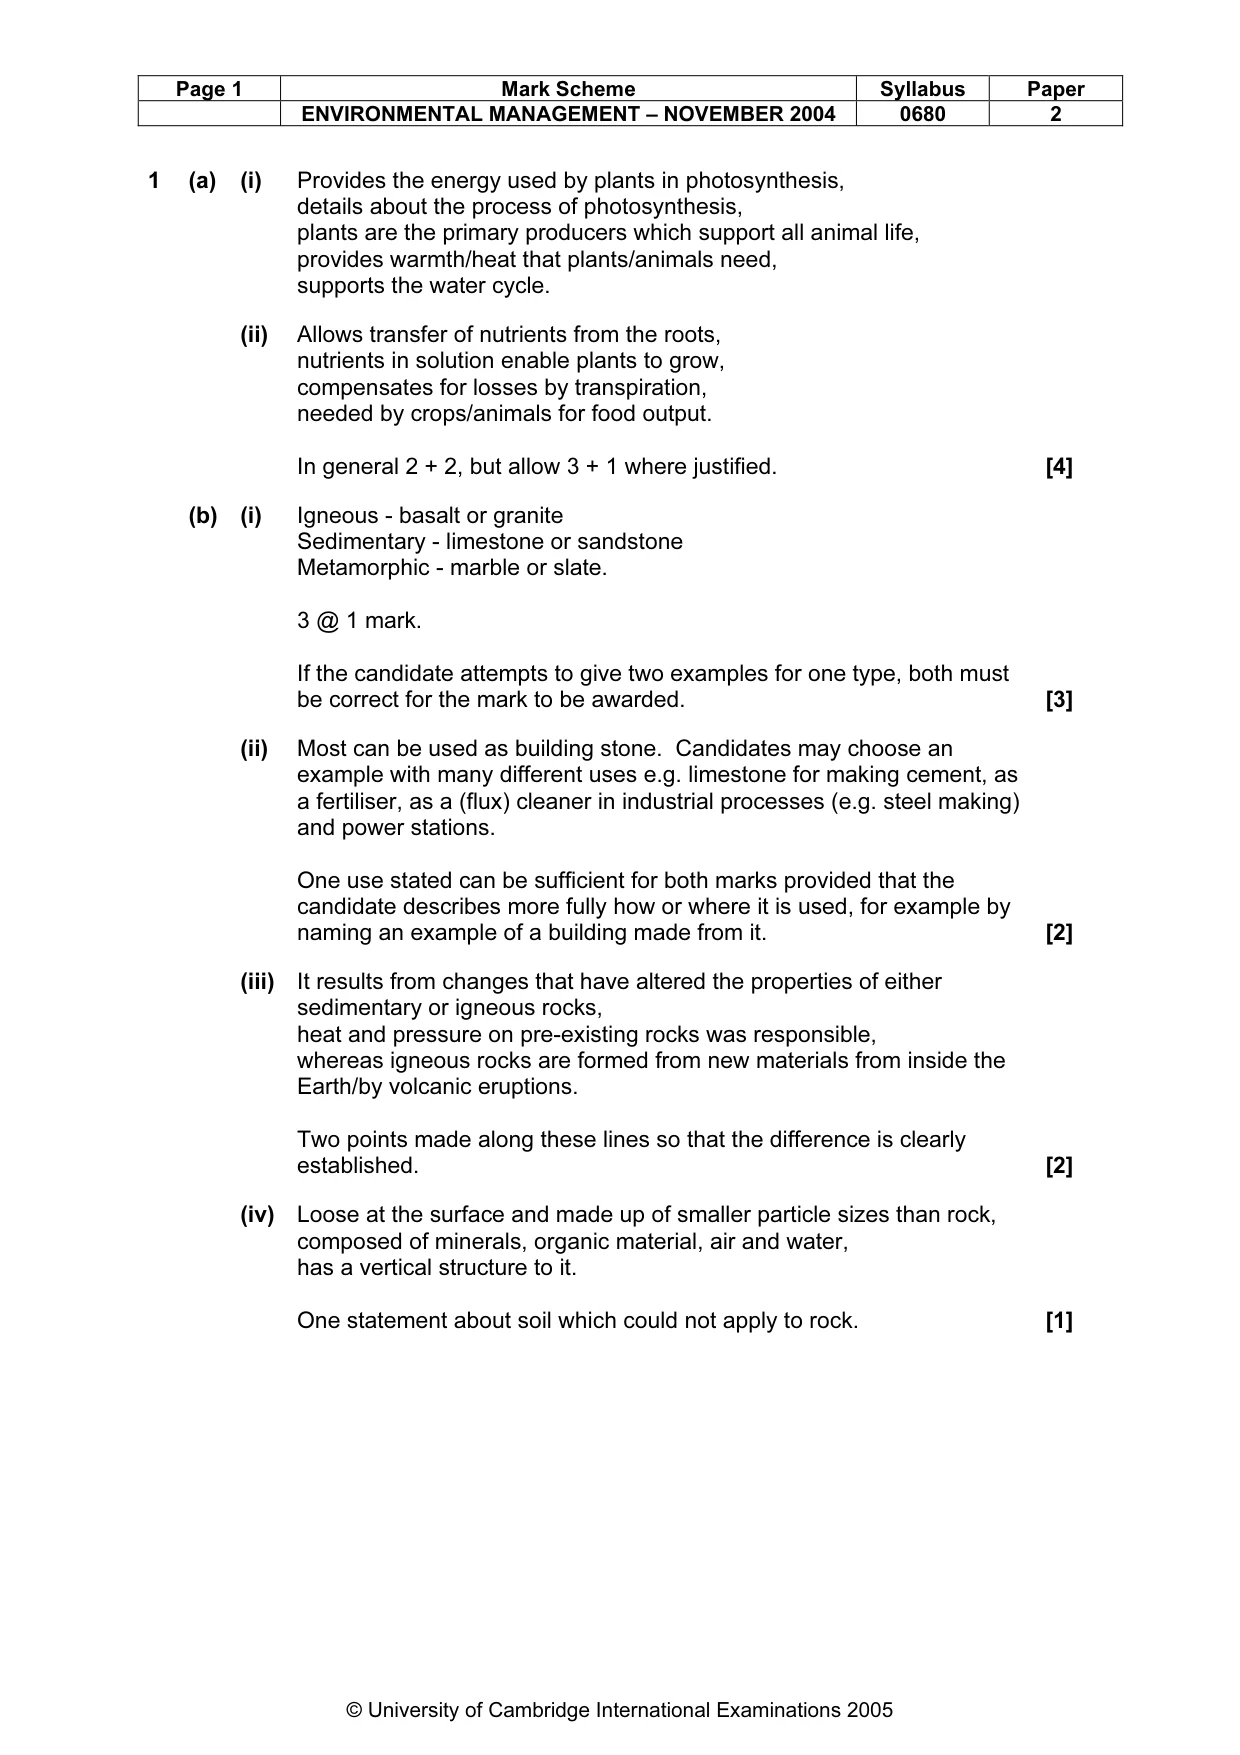
Page 1 Mark Scheme Syllabus Paper ENVIRONMENTAL MANAGEMENT – NOVEMBER 2004 0680 2 © University of Cambridge International Examinations 2005 1 (a) (i) Provides the energy used by plants in photosynthesis, details about the process of photosynthesis, plants are the primary producers which support all animal life, provides warmth/heat that plants/animals need, supports the water cycle. (ii) Allows transfer of nutrients from the roots, nutrients in solution enable plants to grow, compensates for losses by transpiration, needed by crops/animals for food output. In general 2 + 2, but allow 3 + 1 where justified. [4] (b) (i) Igneous - basalt or granite Sedimentary - limestone or sandstone Metamorphic - marble or slate. 3 @ 1 mark. If the candidate attempts to give two examples for one type, both must be correct for the mark to be awarded. [3] (ii) Most can be used as building stone. Candidates may choose an example with many different uses e.g. limestone for making cement, as a fertiliser, as a (flux) cleaner in industrial processes (e.g. steel making) and power stations. One use stated can be sufficient for both marks provided that the candidate describes more fully how or where it is used, for example by naming an example of a building made from it. [2] (iii) It results from changes that have altered the properties of either sedimentary or igneous rocks, heat and pressure on pre-existing rocks was responsible, whereas igneous rocks are formed from new materials from inside the Earth/by volcanic eruptions. Two points made along these lines so that the difference is clearly established. [2] (iv) Loose at the surface and made up of smaller particle sizes than rock, composed of minerals, organic material, air and water, has a vertical structure to it. One statement about soil which could not apply to rock. [1]
Mark scheme, page 5
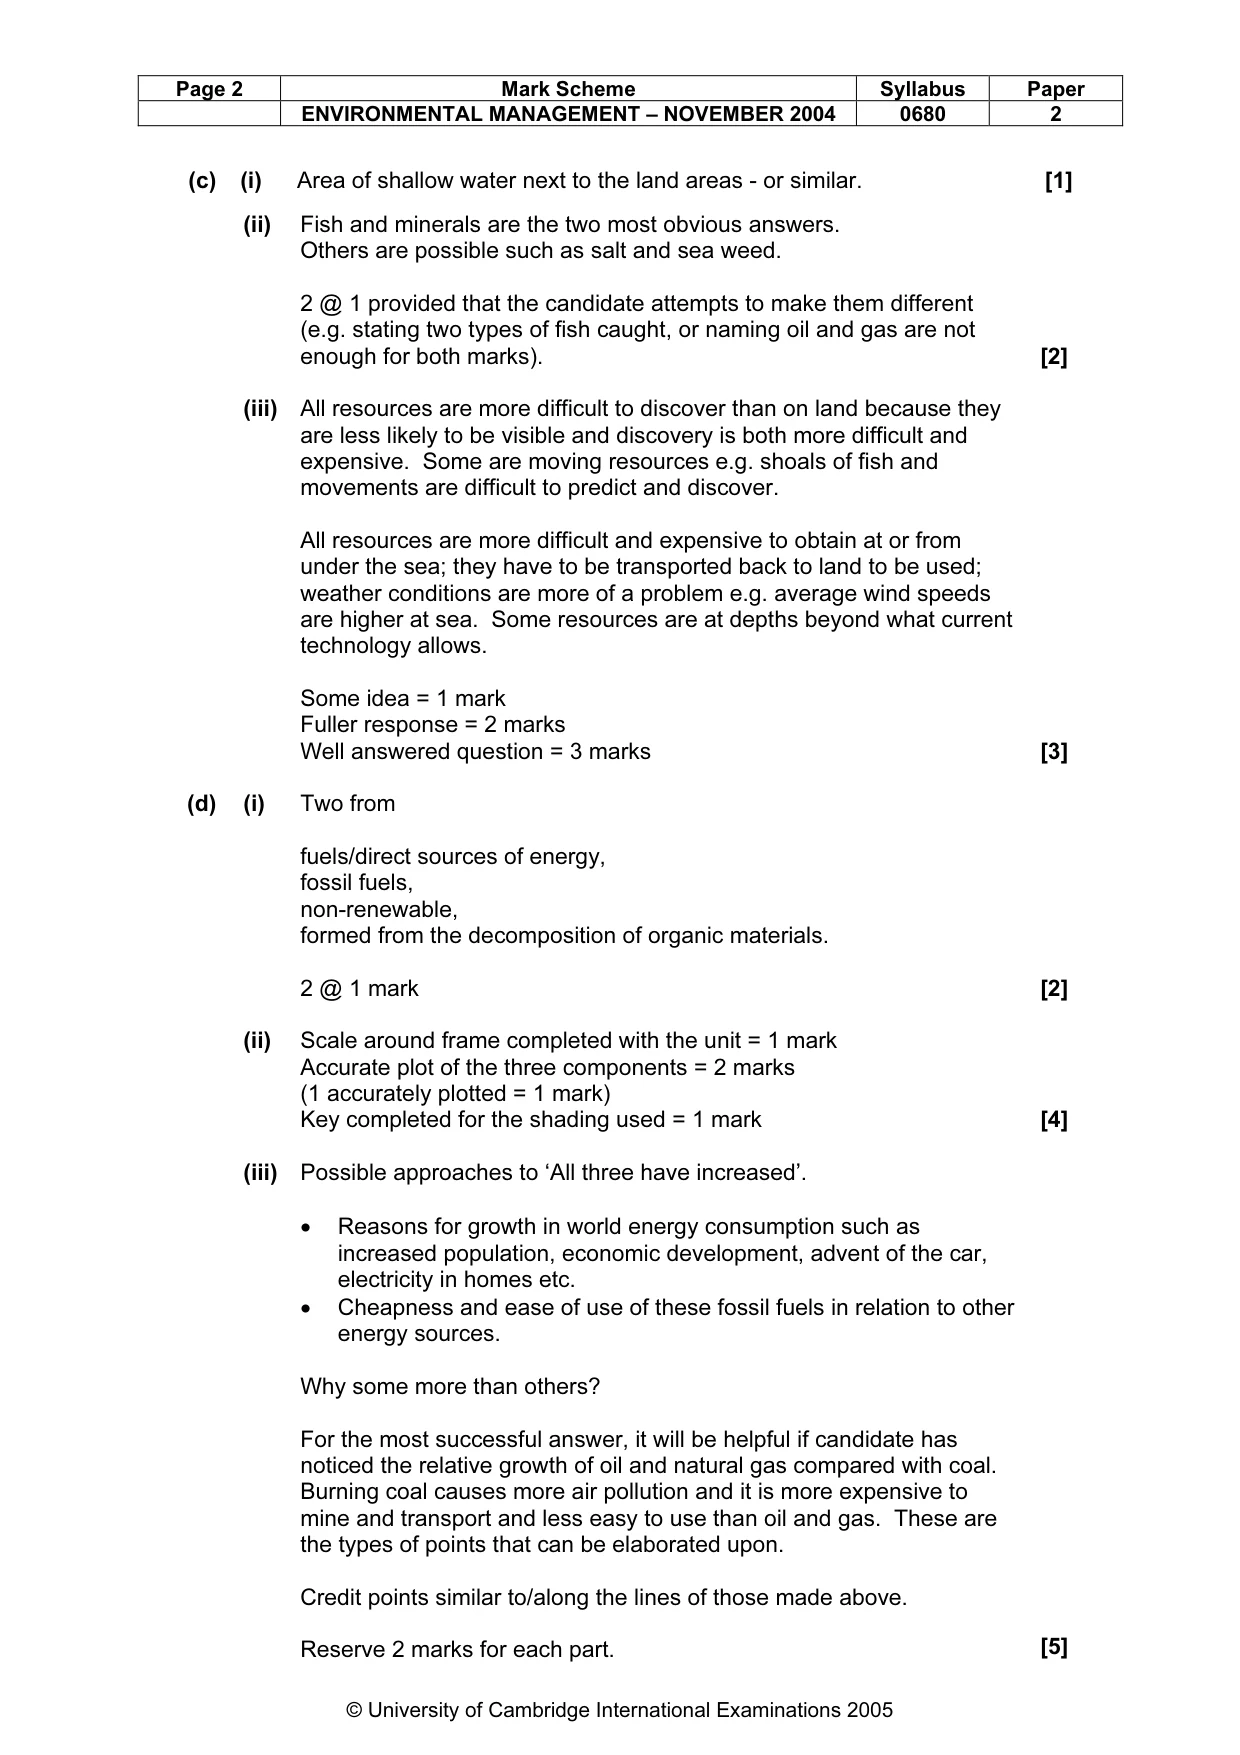
Page 2 Mark Scheme Syllabus Paper ENVIRONMENTAL MANAGEMENT – NOVEMBER 2004 0680 2 © University of Cambridge International Examinations 2005 (c) (i) Area of shallow water next to the land areas - or similar. [1] (ii) Fish and minerals are the two most obvious answers. Others are possible such as salt and sea weed. 2 @ 1 provided that the candidate attempts to make them different (e.g. stating two types of fish caught, or naming oil and gas are not enough for both marks). [2] (iii) All resources are more difficult to discover than on land because they are less likely to be visible and discovery is both more difficult and expensive. Some are moving resources e.g. shoals of fish and movements are difficult to predict and discover. All resources are more difficult and expensive to obtain at or from under the sea; they have to be transported back to land to be used; weather conditions are more of a problem e.g. average wind speeds are higher at sea. Some resources are at depths beyond what current technology allows. Some idea = 1 mark Fuller response = 2 marks Well answered question = 3 marks [3] (d) (i) Two from fuels/direct sources of energy, fossil fuels, non-renewable, formed from the decomposition of organic materials. 2 @ 1 mark [2] (ii) Scale around frame completed with the unit = 1 mark Accurate plot of the three components = 2 marks (1 accurately plotted = 1 mark) Key completed for the shading used = 1 mark [4] (iii) Possible approaches to ‘All three have increased’. • Reasons for growth in world energy consumption such as increased population, economic development, advent of the car, electricity in homes etc. • Cheapness and ease of use of these fossil fuels in relation to other energy sources. Why some more than others? For the most successful answer, it will be helpful if candidate has noticed the relative growth of oil and natural gas compared with coal. Burning coal causes more air pollution and it is more expensive to mine and transport and less easy to use than oil and gas. These are the types of points that can be elaborated upon. Credit points similar to/along the lines of those made above. Reserve 2 marks for each part. [5]
Mark scheme, page 6
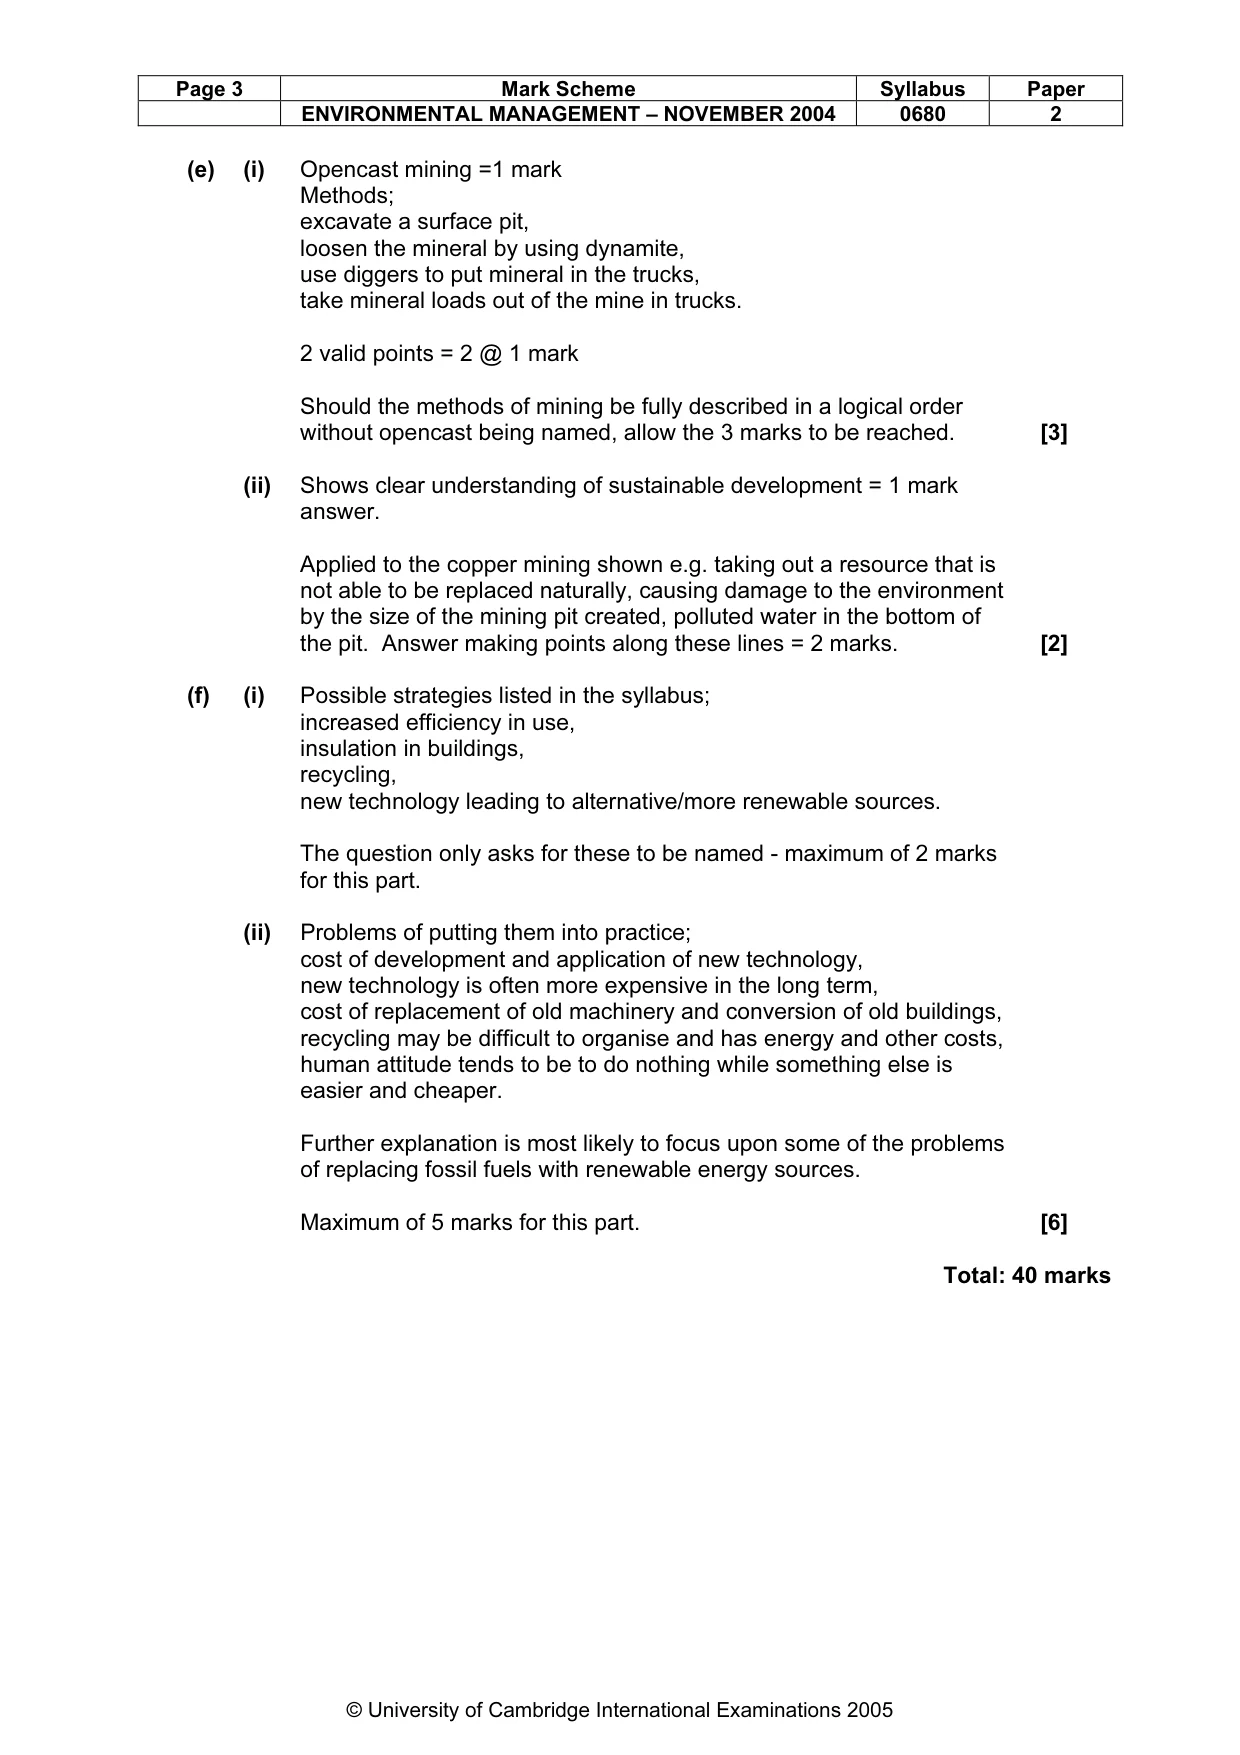
Page 3 Mark Scheme Syllabus Paper ENVIRONMENTAL MANAGEMENT – NOVEMBER 2004 0680 2 © University of Cambridge International Examinations 2005 (e) (i) Opencast mining =1 mark Methods; excavate a surface pit, loosen the mineral by using dynamite, use diggers to put mineral in the trucks, take mineral loads out of the mine in trucks. 2 valid points = 2 @ 1 mark Should the methods of mining be fully described in a logical order without opencast being named, allow the 3 marks to be reached. [3] (ii) Shows clear understanding of sustainable development = 1 mark answer. Applied to the copper mining shown e.g. taking out a resource that is not able to be replaced naturally, causing damage to the environment by the size of the mining pit created, polluted water in the bottom of the pit. Answer making points along these lines = 2 marks. [2] (f) (i) Possible strategies listed in the syllabus; increased efficiency in use, insulation in buildings, recycling, new technology leading to alternative/more renewable sources. The question only asks for these to be named - maximum of 2 marks for this part. (ii) Problems of putting them into practice; cost of development and application of new technology, new technology is often more expensive in the long term, cost of replacement of old machinery and conversion of old buildings, recycling may be difficult to organise and has energy and other costs, human attitude tends to be to do nothing while something else is easier and cheaper. Further explanation is most likely to focus upon some of the problems of replacing fossil fuels with renewable energy sources. Maximum of 5 marks for this part. [6] Total: 40 marks
Mark scheme, page 7
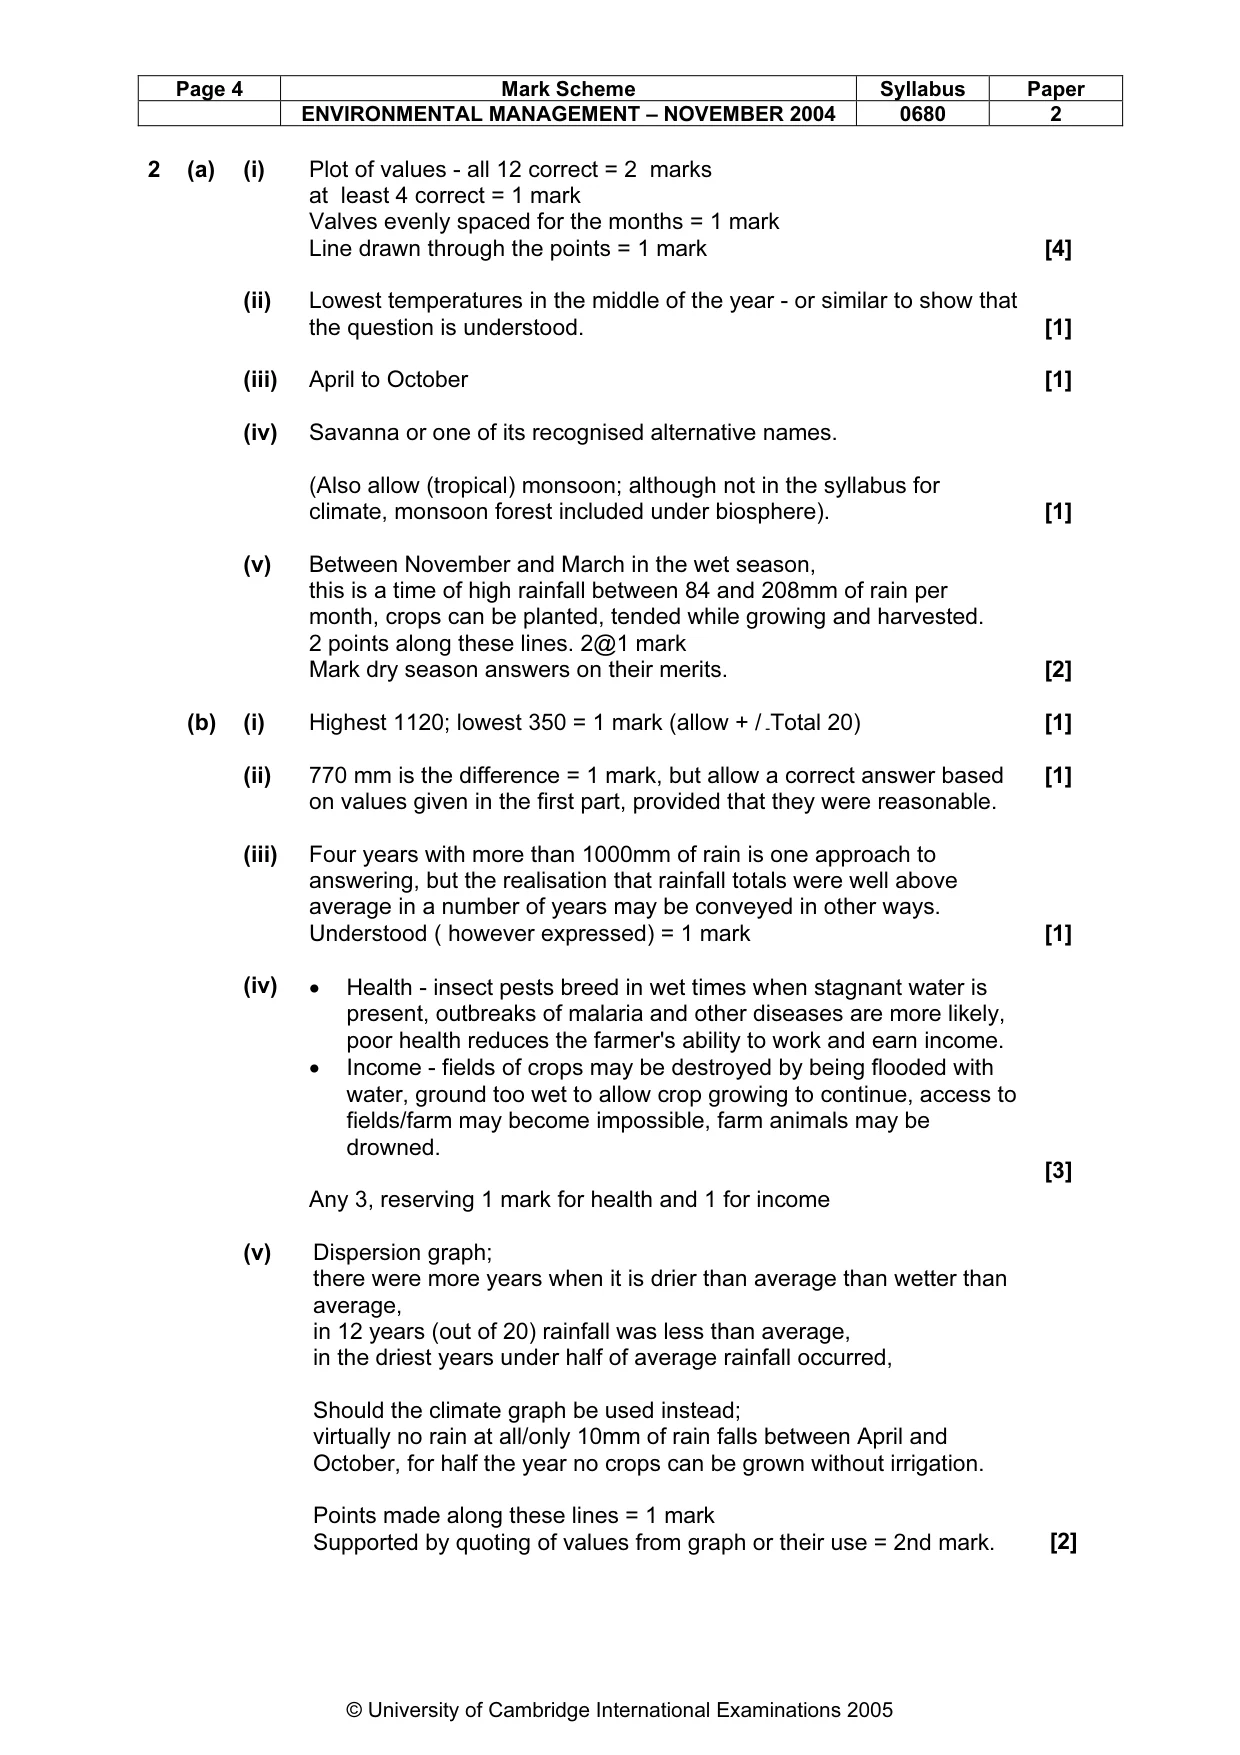
Page 4 Mark Scheme Syllabus Paper ENVIRONMENTAL MANAGEMENT – NOVEMBER 2004 0680 2 © University of Cambridge International Examinations 2005 2 (a) (i) Plot of values - all 12 correct = 2 marks at least 4 correct = 1 mark Valves evenly spaced for the months = 1 mark Line drawn through the points = 1 mark [4] (ii) Lowest temperatures in the middle of the year - or similar to show that the question is understood. [1] (iii) April to October [1] (iv) Savanna or one of its recognised alternative names. (Also allow (tropical) monsoon; although not in the syllabus for climate, monsoon forest included under biosphere). [1] (v) Between November and March in the wet season, this is a time of high rainfall between 84 and 208mm of rain per month, crops can be planted, tended while growing and harvested. 2 points along these lines. 2@1 mark Mark dry season answers on their merits. [2] (b) (i) Highest 1120; lowest 350 = 1 mark (allow + / -Total 20) [1] (ii) 770 mm is the difference = 1 mark, but allow a correct answer based on values given in the first part, provided that they were reasonable. [1] (iii) Four years with more than 1000mm of rain is one approach to answering, but the realisation that rainfall totals were well above average in a number of years may be conveyed in other ways. Understood ( however expressed) = 1 mark [1] (iv) • Health - insect pests breed in wet times when stagnant water is present, outbreaks of malaria and other diseases are more likely, poor health reduces the farmer's ability to work and earn income. • Income - fields of crops may be destroyed by being flooded with water, ground too wet to allow crop growing to continue, access to fields/farm may become impossible, farm animals may be drowned. Any 3, reserving 1 mark for health and 1 for income [3] (v) Dispersion graph; there were more years when it is drier than average than wetter than average, in 12 years (out of 20) rainfall was less than average, in the driest years under half of average rainfall occurred, Should the climate graph be used instead; virtually no rain at all/only 10mm of rain falls between April and October, for half the year no crops can be grown without irrigation. Points made along these lines = 1 mark Supported by quoting of values from graph or their use = 2nd mark. [2]
Mark scheme, page 8
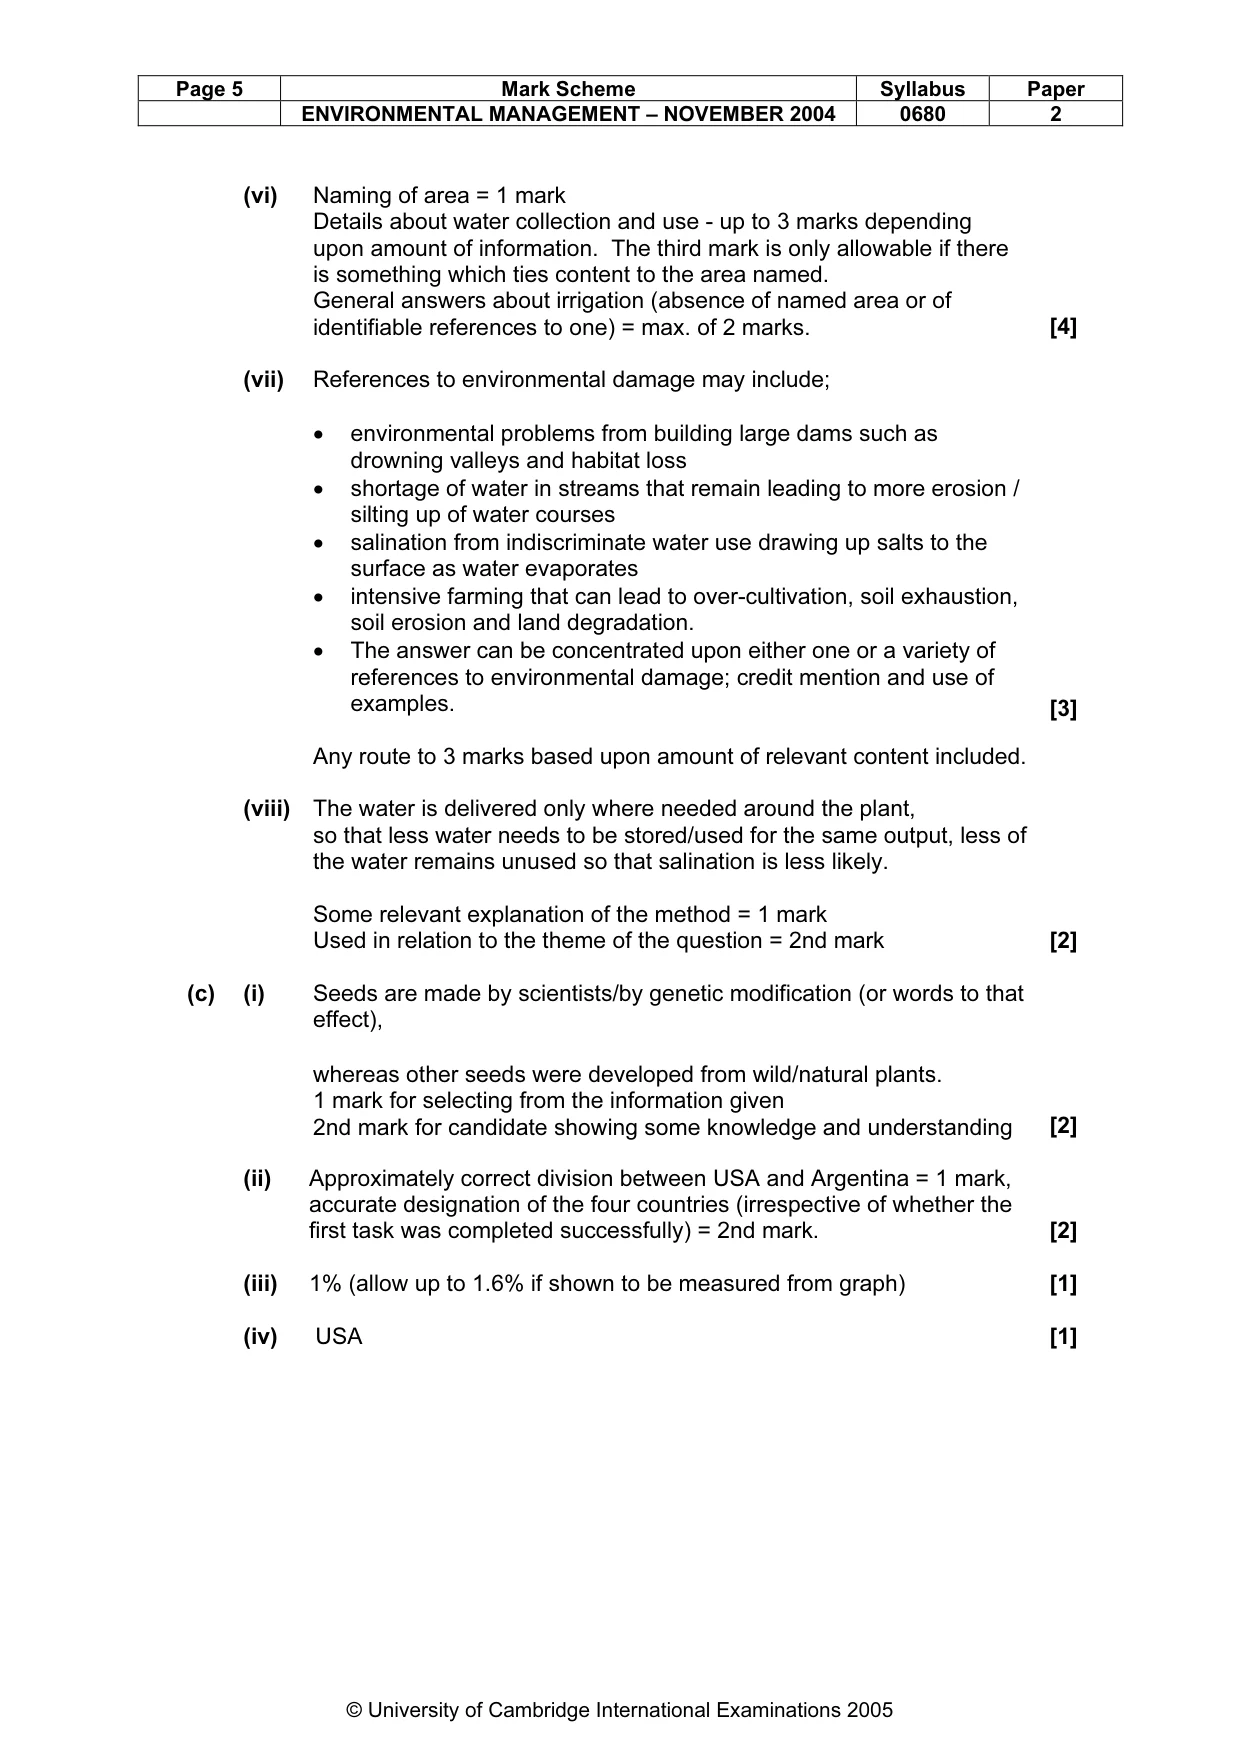
Page 5 Mark Scheme Syllabus Paper ENVIRONMENTAL MANAGEMENT – NOVEMBER 2004 0680 2 © University of Cambridge International Examinations 2005 (vi) Naming of area = 1 mark Details about water collection and use - up to 3 marks depending upon amount of information. The third mark is only allowable if there is something which ties content to the area named. General answers about irrigation (absence of named area or of identifiable references to one) = max. of 2 marks. [4] (vii) References to environmental damage may include; • environmental problems from building large dams such as drowning valleys and habitat loss • shortage of water in streams that remain leading to more erosion / silting up of water courses • salination from indiscriminate water use drawing up salts to the surface as water evaporates • intensive farming that can lead to over-cultivation, soil exhaustion, soil erosion and land degradation. • The answer can be concentrated upon either one or a variety of references to environmental damage; credit mention and use of examples. Any route to 3 marks based upon amount of relevant content included. [3] (viii) The water is delivered only where needed around the plant, so that less water needs to be stored/used for the same output, less of the water remains unused so that salination is less likely. Some relevant explanation of the method = 1 mark Used in relation to the theme of the question = 2nd mark [2] (c) (i) Seeds are made by scientists/by genetic modification (or words to that effect), whereas other seeds were developed from wild/natural plants. 1 mark for selecting from the information given 2nd mark for candidate showing some knowledge and understanding [2] (ii) Approximately correct division between USA and Argentina = 1 mark, accurate designation of the four countries (irrespective of whether the first task was completed successfully) = 2nd mark. [2] (iii) 1% (allow up to 1.6% if shown to be measured from graph) [1] (iv) USA [1]
Mark scheme, page 9
Page 6 Mark Scheme Syllabus Paper ENVIRONMENTAL MANAGEMENT – NOVEMBER 2004 0680 2 © University of Cambridge International Examinations 2005 (d) (i) Scientist supporting use - examples of views which can be taken from the information given in the question. • Advantages for food output and nutrition. • Less need for new farm land to be cleared. • Less pollution from chemical pesticides. A summary might be that GM crops allow more people to be fed on less land with less damage to the environment. Environmentalist opposing their use – • Using plants which are not naturally created. • This is dangerous because bio-diversity is likely to be reduced. • Some of the claims made by those in favour such as less environmental damage and more food output have not been met. A summary might be that GM crops are dangerous because farmers are going into unchartered areas with unproven results. Heavy reliance on use of information as provided = 1 or 2 marks. Based on the information but explained more fully by stronger arrangement and understanding = 3 or 4 marks. [4] (ii) There is no mark for particular view expressed; all the marks are for explanation by supporting one and/or rejecting the other. Views are expressed, but are explained by sticking close to information provided = 1 or 2 marks. The views expressed are supported by well ordered arguments = 3 or 4 marks. [4] Total 40 marks