Cambridge IGCSE Environmental Management 0680 — 2004 May/June Paper 2 · Variant 1
0680/21/M/J/04
The question paper and its mark scheme, free to read here and free to download. This is Cambridge’s own paper, exactly as it was sat.
Question paper20 pages


Mark scheme
No mark scheme is in the library for this paper.
Paper as text
Question paper, page 1
This document consists of 17 printed pages and 3 blank page. (KN) S58430/3 © UCLES 2004 [Turn over UNIVERSITY OF CAMBRIDGE INTERNATIONAL EXAMINATIONS International General Certificate of Secondary Education ENVIRONMENTAL MANAGEMENT 0680/02 Paper 2 May/June 2004 1 hour 45 minutes Candidates answer on the Question Paper. Additional Materials: Ruler (cm/mm) READ THESE INSTRUCTIONS FIRST Write your Centre number, candidate number and name on all the work you hand in. Write in dark blue or black pen in the spaces provided on the Question Paper. You may use a soft pencil for any diagrams, graphs or rough working. Do not use staples, paper clips, highlighters, glue or correction fluid. Answer both questions. The number of marks is given in brackets [ ] at the end of each question or part question. Centre Number Candidate Number Name If you have been given a label, look at the details. If any details are incorrect or missing, please fill in your correct details in the space given at the top of this page. Stick your personal label here, if provided. For Examiner’s Use 1 2 TOTAL www.XtremePapers.com
Question paper, page 2
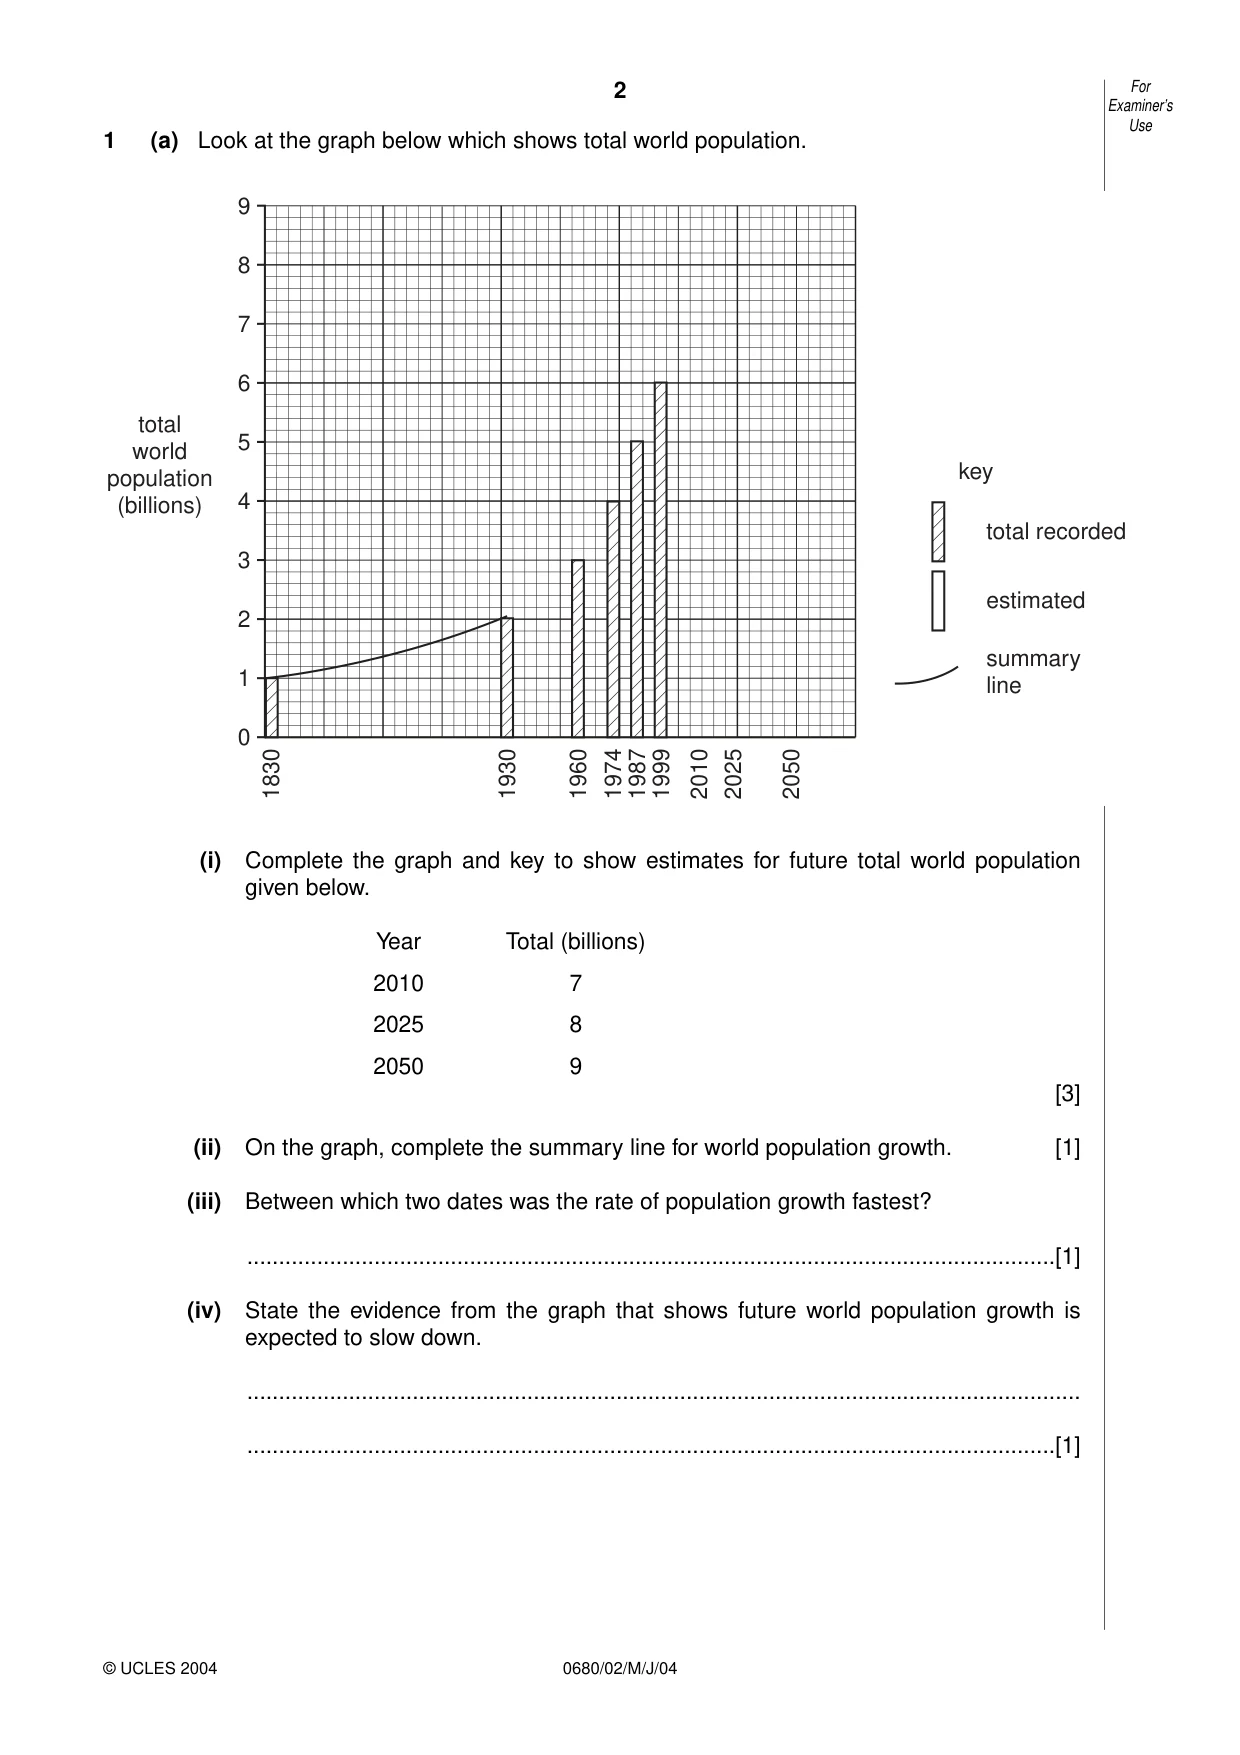
2 0680/02/M/J/04 1 (a) Look at the graph below which shows total world population. (i) Complete the graph and key to show estimates for future total world population given below. Year Total (billions) 2010 7 2025 8 2050 9 [3] (ii) On the graph, complete the summary line for world population growth. [1] (iii) Between which two dates was the rate of population growth fastest? …[1] (iv) State the evidence from the graph that shows future world population growth is expected to slow down. … …[1] For Examiner’s Use © UCLES 2004 0 1 2 3 4 5 6 7 8 9 total world population (billions) 1830 1930 1960 1974 1987 1999 2010 2025 2050 total recorded key estimated summary line
Question paper, page 3
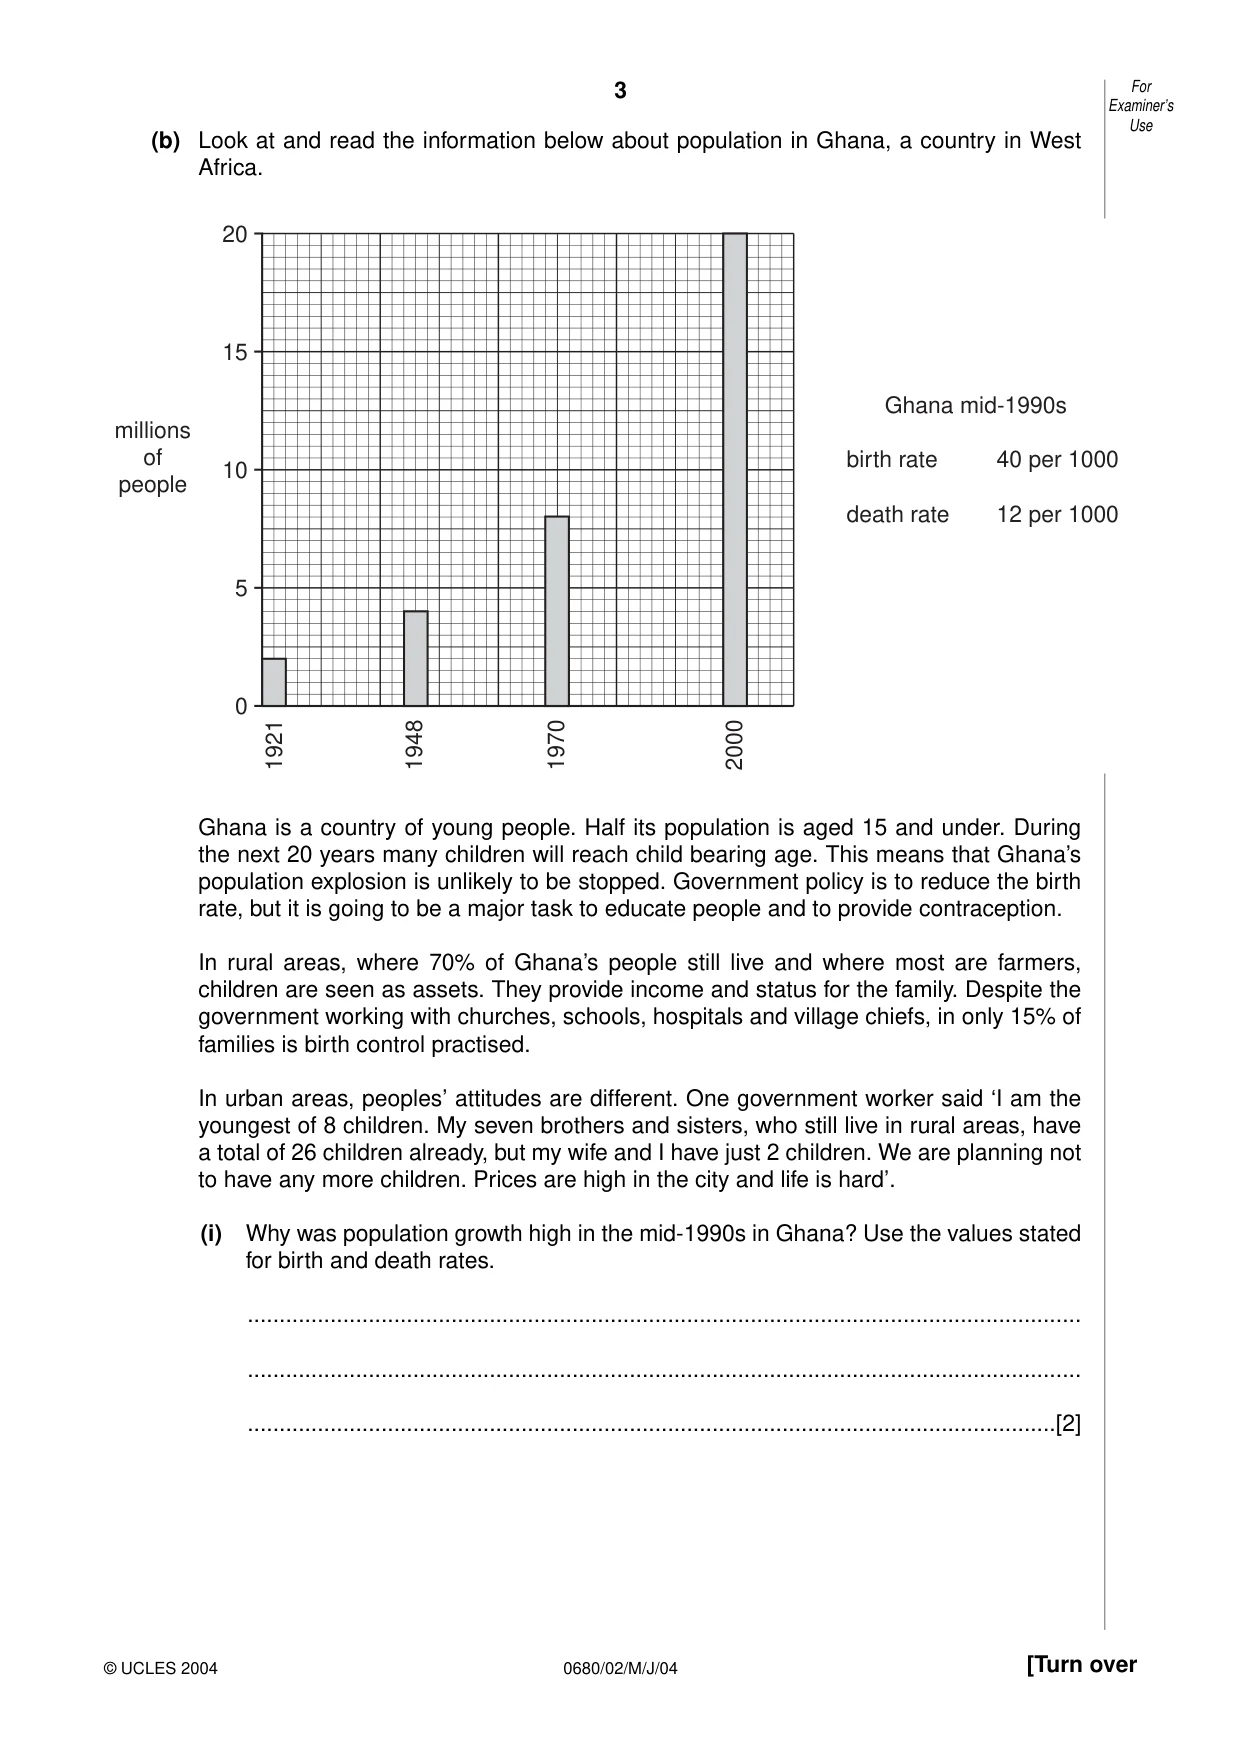
3 0680/02/M/J/04 [Turn over (b) Look at and read the information below about population in Ghana, a country in West Africa. Ghana is a country of young people. Half its population is aged 15 and under. During the next 20 years many children will reach child bearing age. This means that Ghana’s population explosion is unlikely to be stopped. Government policy is to reduce the birth rate, but it is going to be a major task to educate people and to provide contraception. In rural areas, where 70% of Ghana’s people still live and where most are farmers, children are seen as assets. They provide income and status for the family. Despite the government working with churches, schools, hospitals and village chiefs, in only 15% of families is birth control practised. In urban areas, peoples’ attitudes are different. One government worker said ‘I am the youngest of 8 children. My seven brothers and sisters, who still live in rural areas, have a total of 26 children already, but my wife and I have just 2 children. We are planning not to have any more children. Prices are high in the city and life is hard’. (i) Why was population growth high in the mid-1990s in Ghana? Use the values stated for birth and death rates. … … …[2] For Examiner’s Use © UCLES 2004 0 5 10 15 20 millions of people 1921 1948 1970 2000 Ghana mid-1990s birth rate 40 per 1000 death rate 12 per 1000
Question paper, page 4
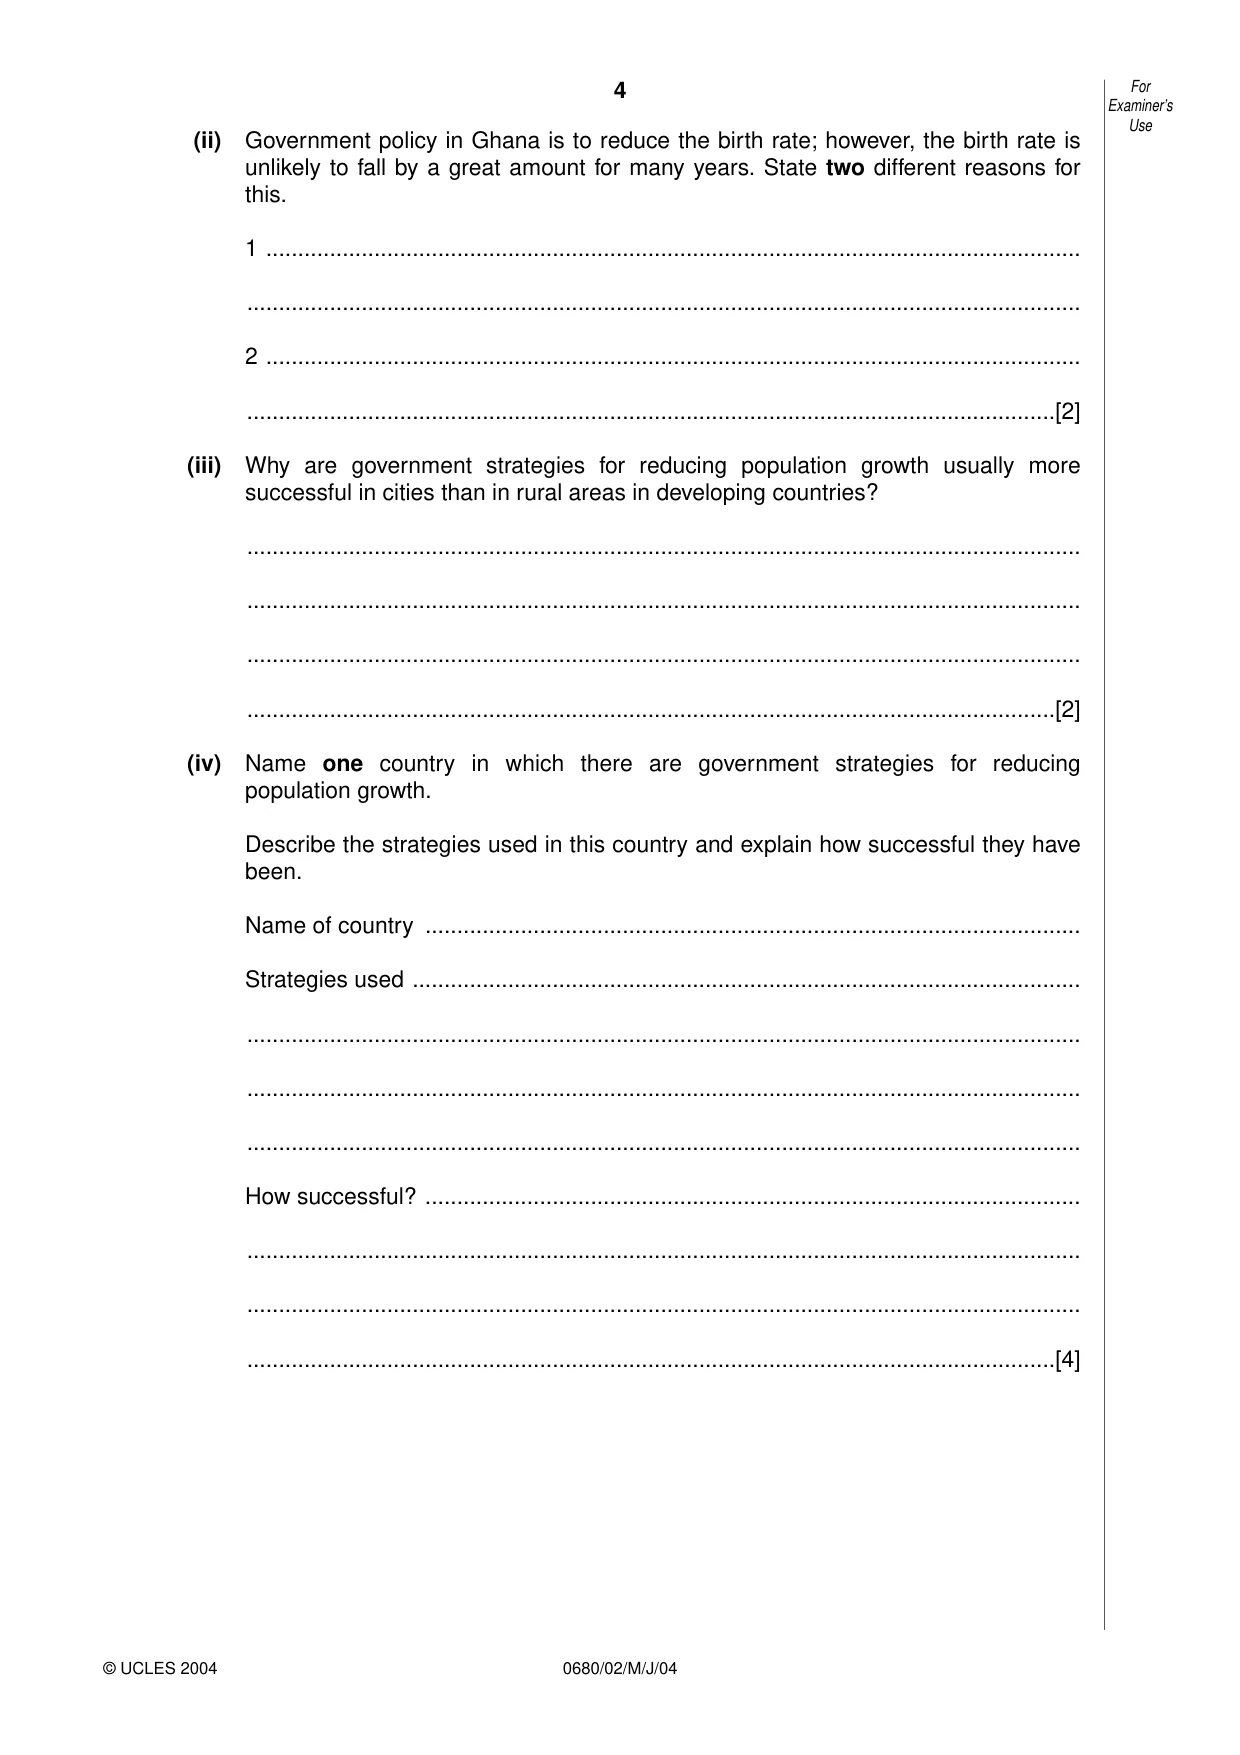
4 0680/02/M/J/04 (ii) Government policy in Ghana is to reduce the birth rate; however, the birth rate is unlikely to fall by a great amount for many years. State two different reasons for this. 1 … … 2 … …[2] (iii) Why are government strategies for reducing population growth usually more successful in cities than in rural areas in developing countries? … … … …[2] (iv) Name one country in which there are government strategies for reducing population growth. Describe the strategies used in this country and explain how successful they have been. Name of country … Strategies used … … … … How successful? … … … …[4] For Examiner’s Use © UCLES 2004
Question paper, page 5
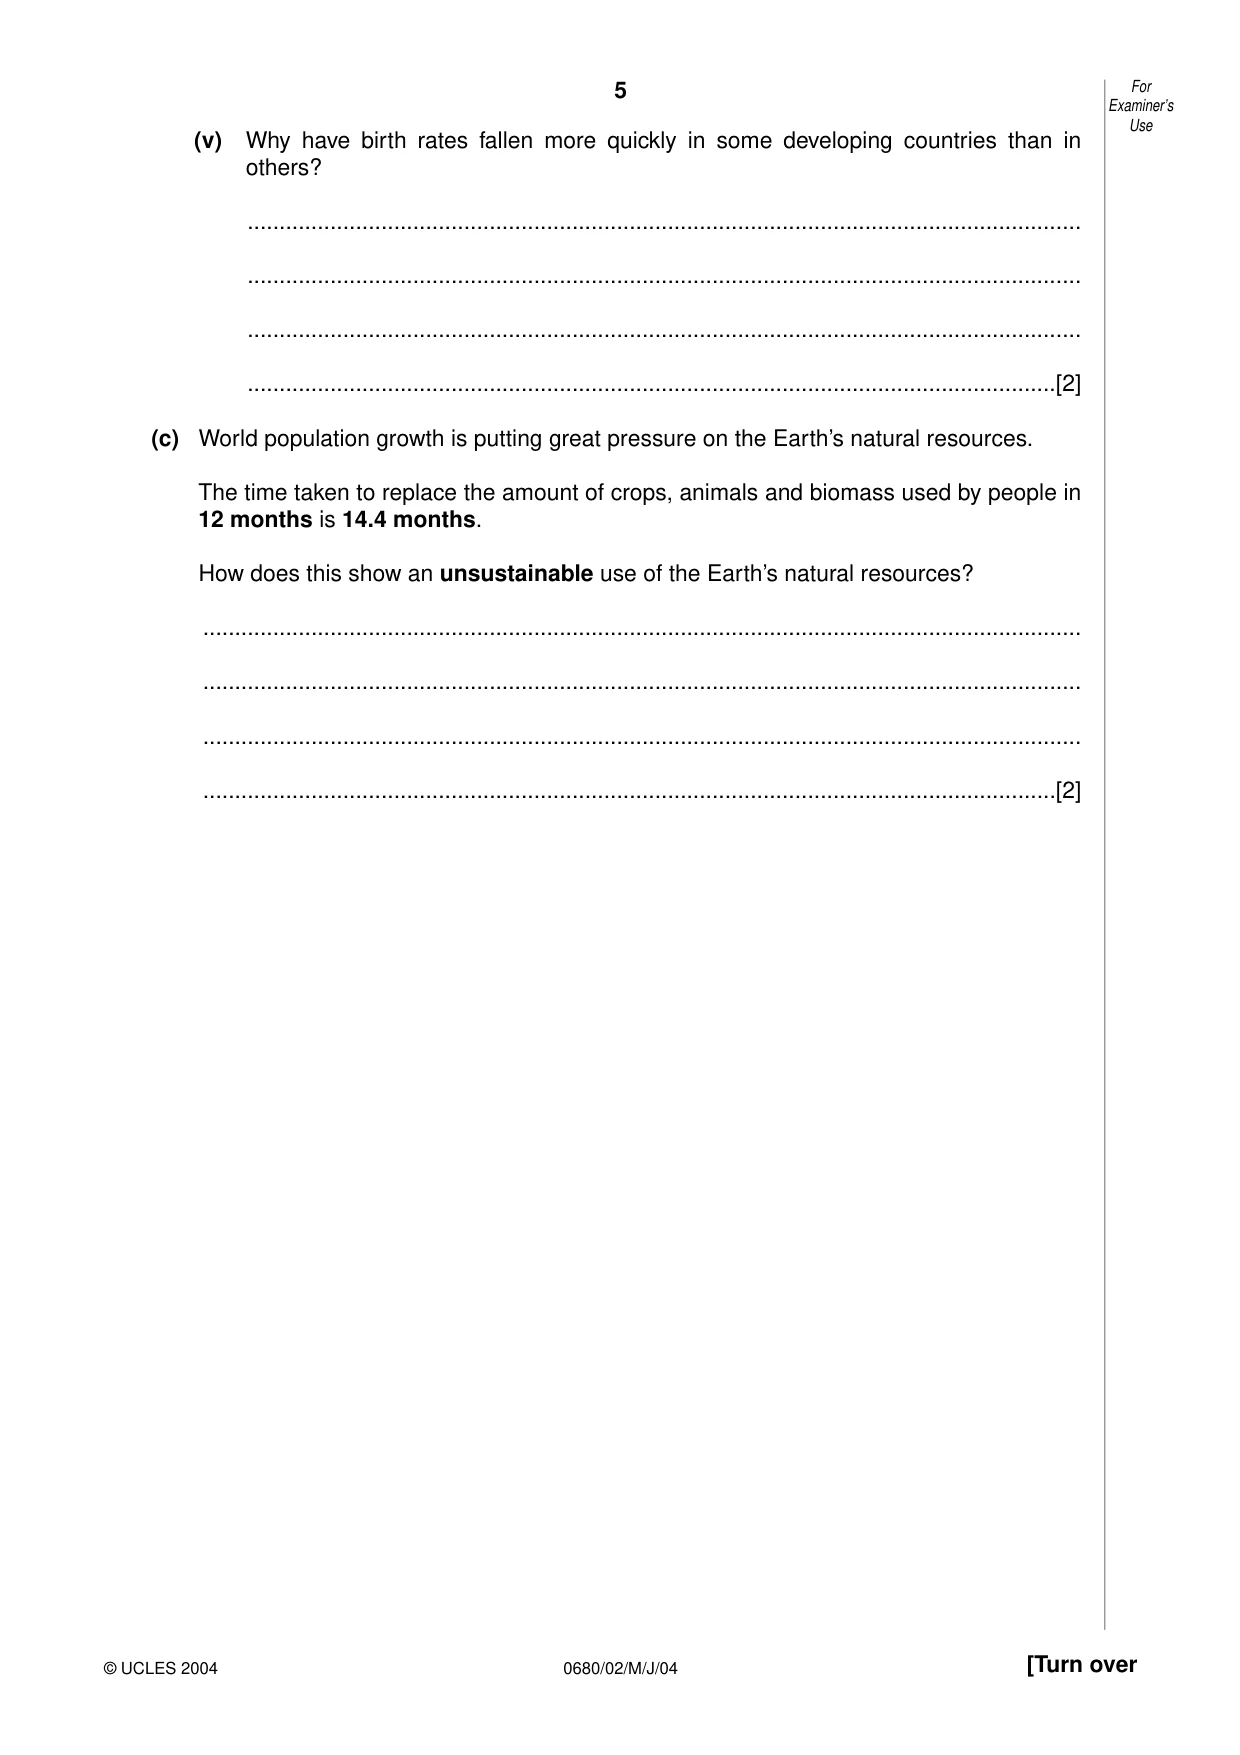
5 0680/02/M/J/04 [Turn over (v) Why have birth rates fallen more quickly in some developing countries than in others? … … … …[2] (c) World population growth is putting great pressure on the Earth’s natural resources. The time taken to replace the amount of crops, animals and biomass used by people in 12 months is 14.4 months. How does this show an unsustainable use of the Earth’s natural resources? … … … …[2] For Examiner’s Use © UCLES 2004
Question paper, page 6
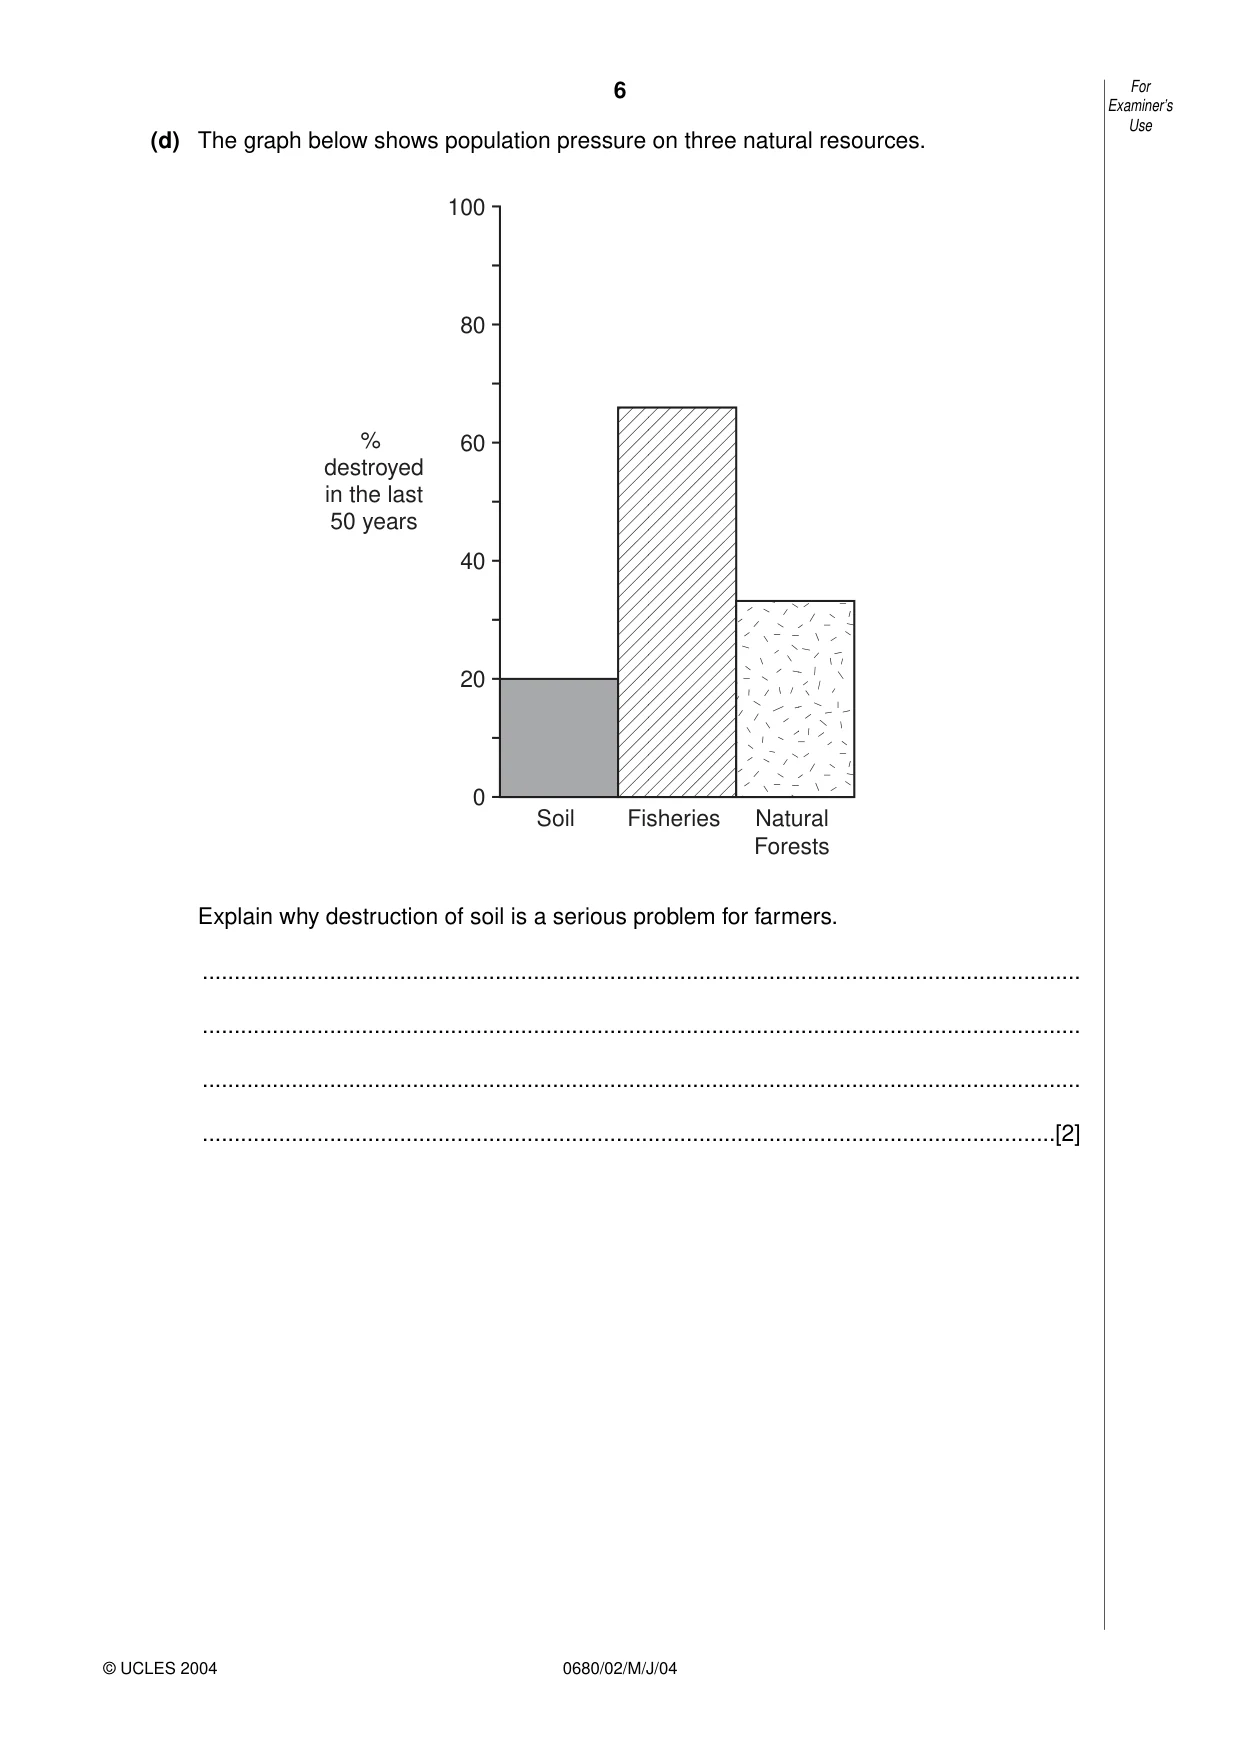
6 0680/02/M/J/04 (d) The graph below shows population pressure on three natural resources. Explain why destruction of soil is a serious problem for farmers. … … … …[2] 0 20 40 60 80 100 % destroyed in the last 50 years Soil Fisheries Natural Forests For Examiner’s Use © UCLES 2004
Question paper, page 7
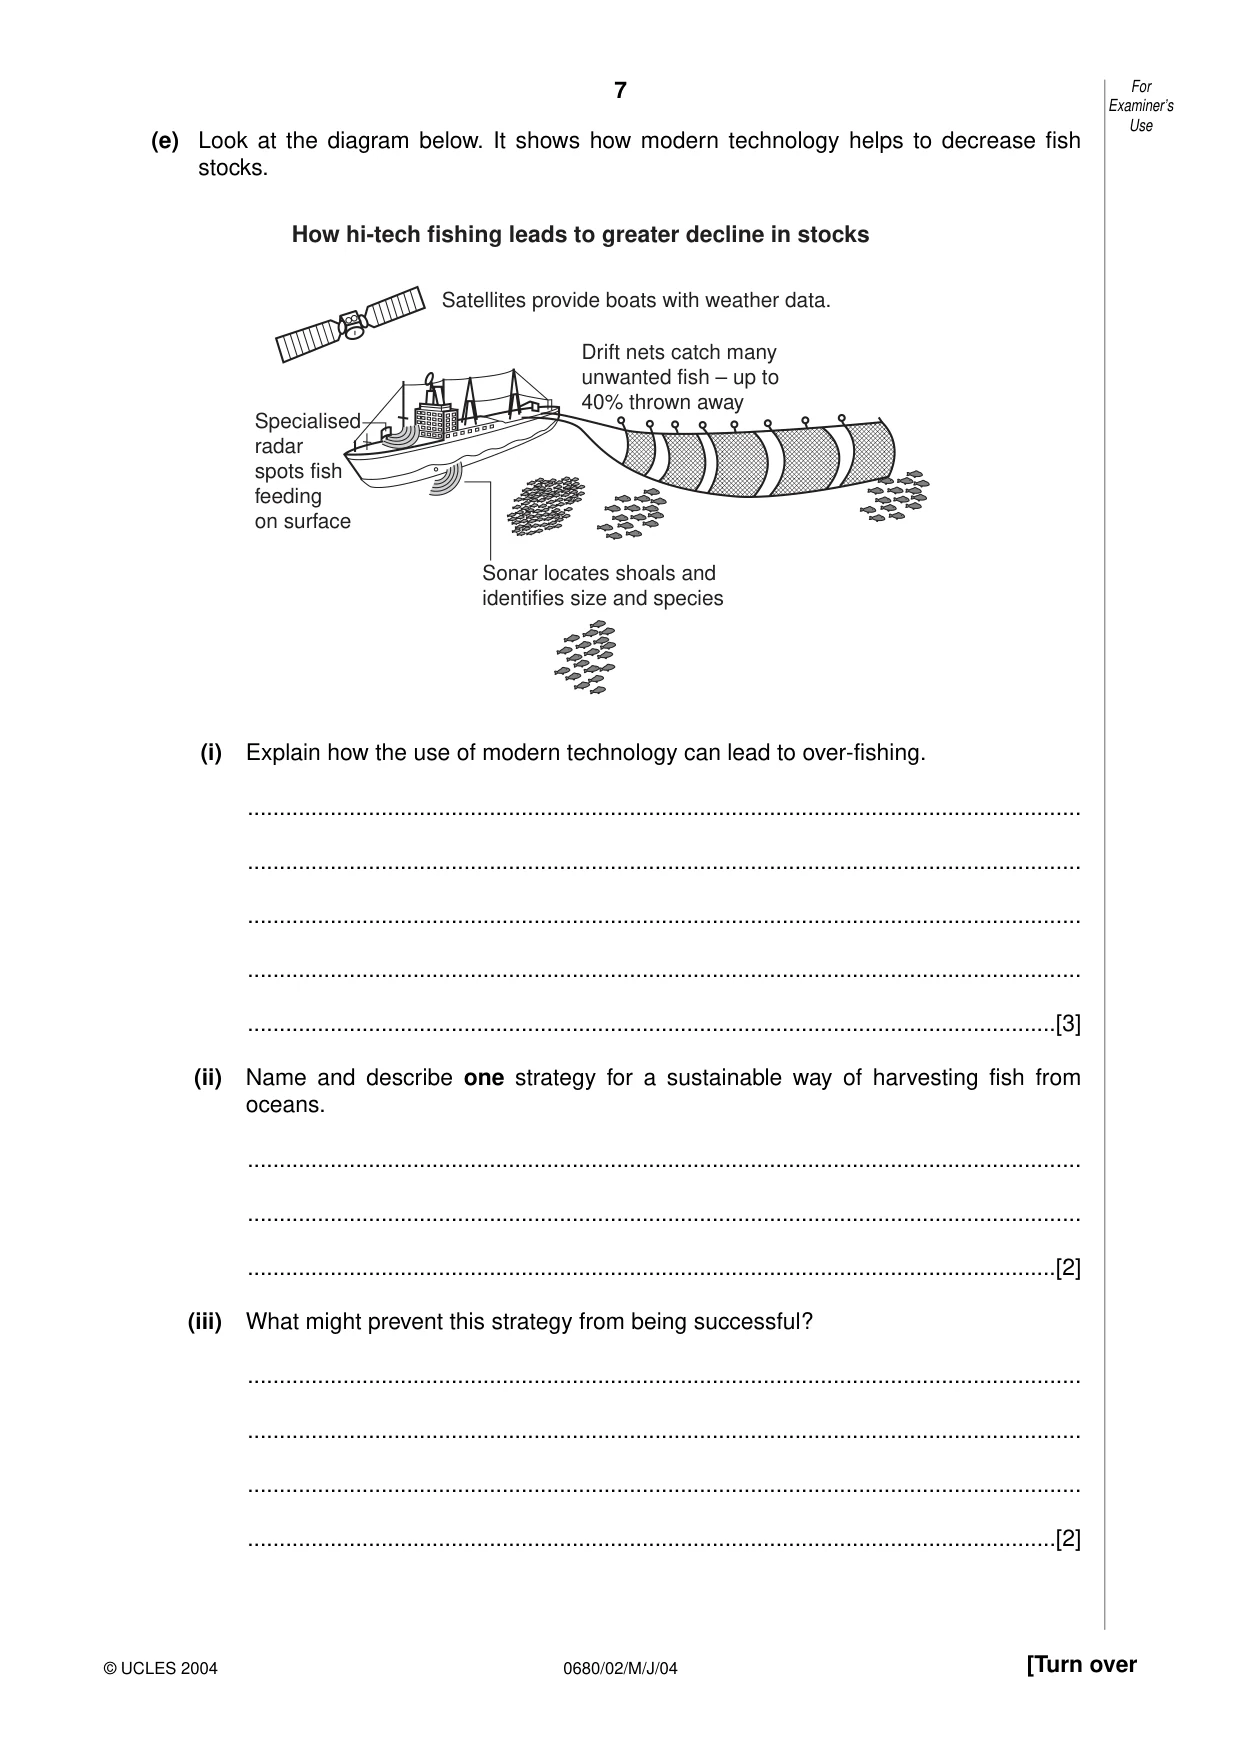
7 0680/02/M/J/04 [Turn over (e) Look at the diagram below. It shows how modern technology helps to decrease fish stocks. (i) Explain how the use of modern technology can lead to over-fishing. … … … … …[3] (ii) Name and describe one strategy for a sustainable way of harvesting fish from oceans. … … …[2] (iii) What might prevent this strategy from being successful? … … … …[2] Satellites provide boats with weather data. Drift nets catch many unwanted fish – up to 40% thrown away Specialised radar spots fish feeding on surface Sonar locates shoals and identifies size and species How hi-tech fishing leads to greater decline in stocks For Examiner’s Use © UCLES 2004
Question paper, page 8
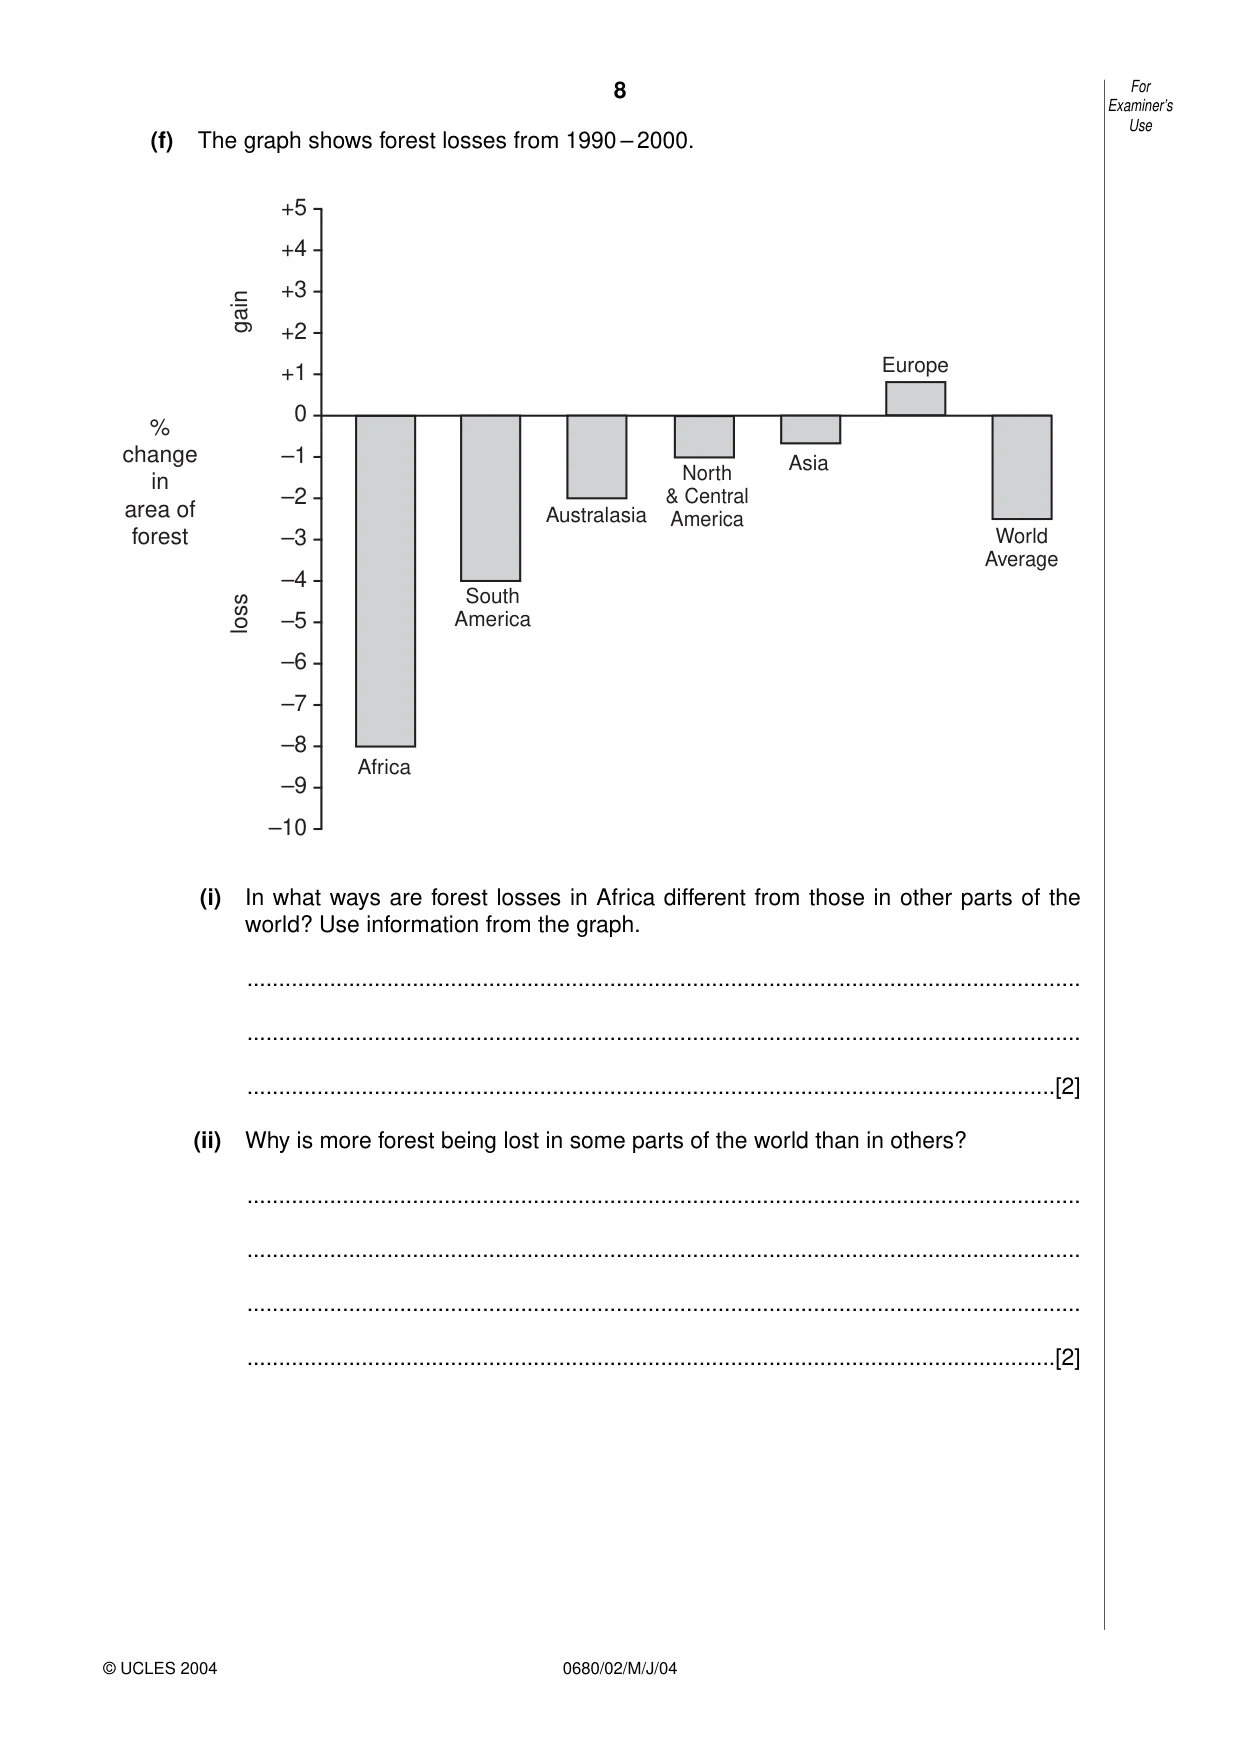
8 0680/02/M/J/04 (f) The graph shows forest losses from 1990 – 2000. (i) In what ways are forest losses in Africa different from those in other parts of the world? Use information from the graph. … … …[2] (ii) Why is more forest being lost in some parts of the world than in others? … … … …[2] 0 –1 –2 –3 –4 –5 –6 –7 –8 –9 –10 +1 +2 +3 +4 +5 % change in area of forest gain loss Africa South America Australasia North & Central America Asia Europe World Average For Examiner’s Use © UCLES 2004
Question paper, page 9
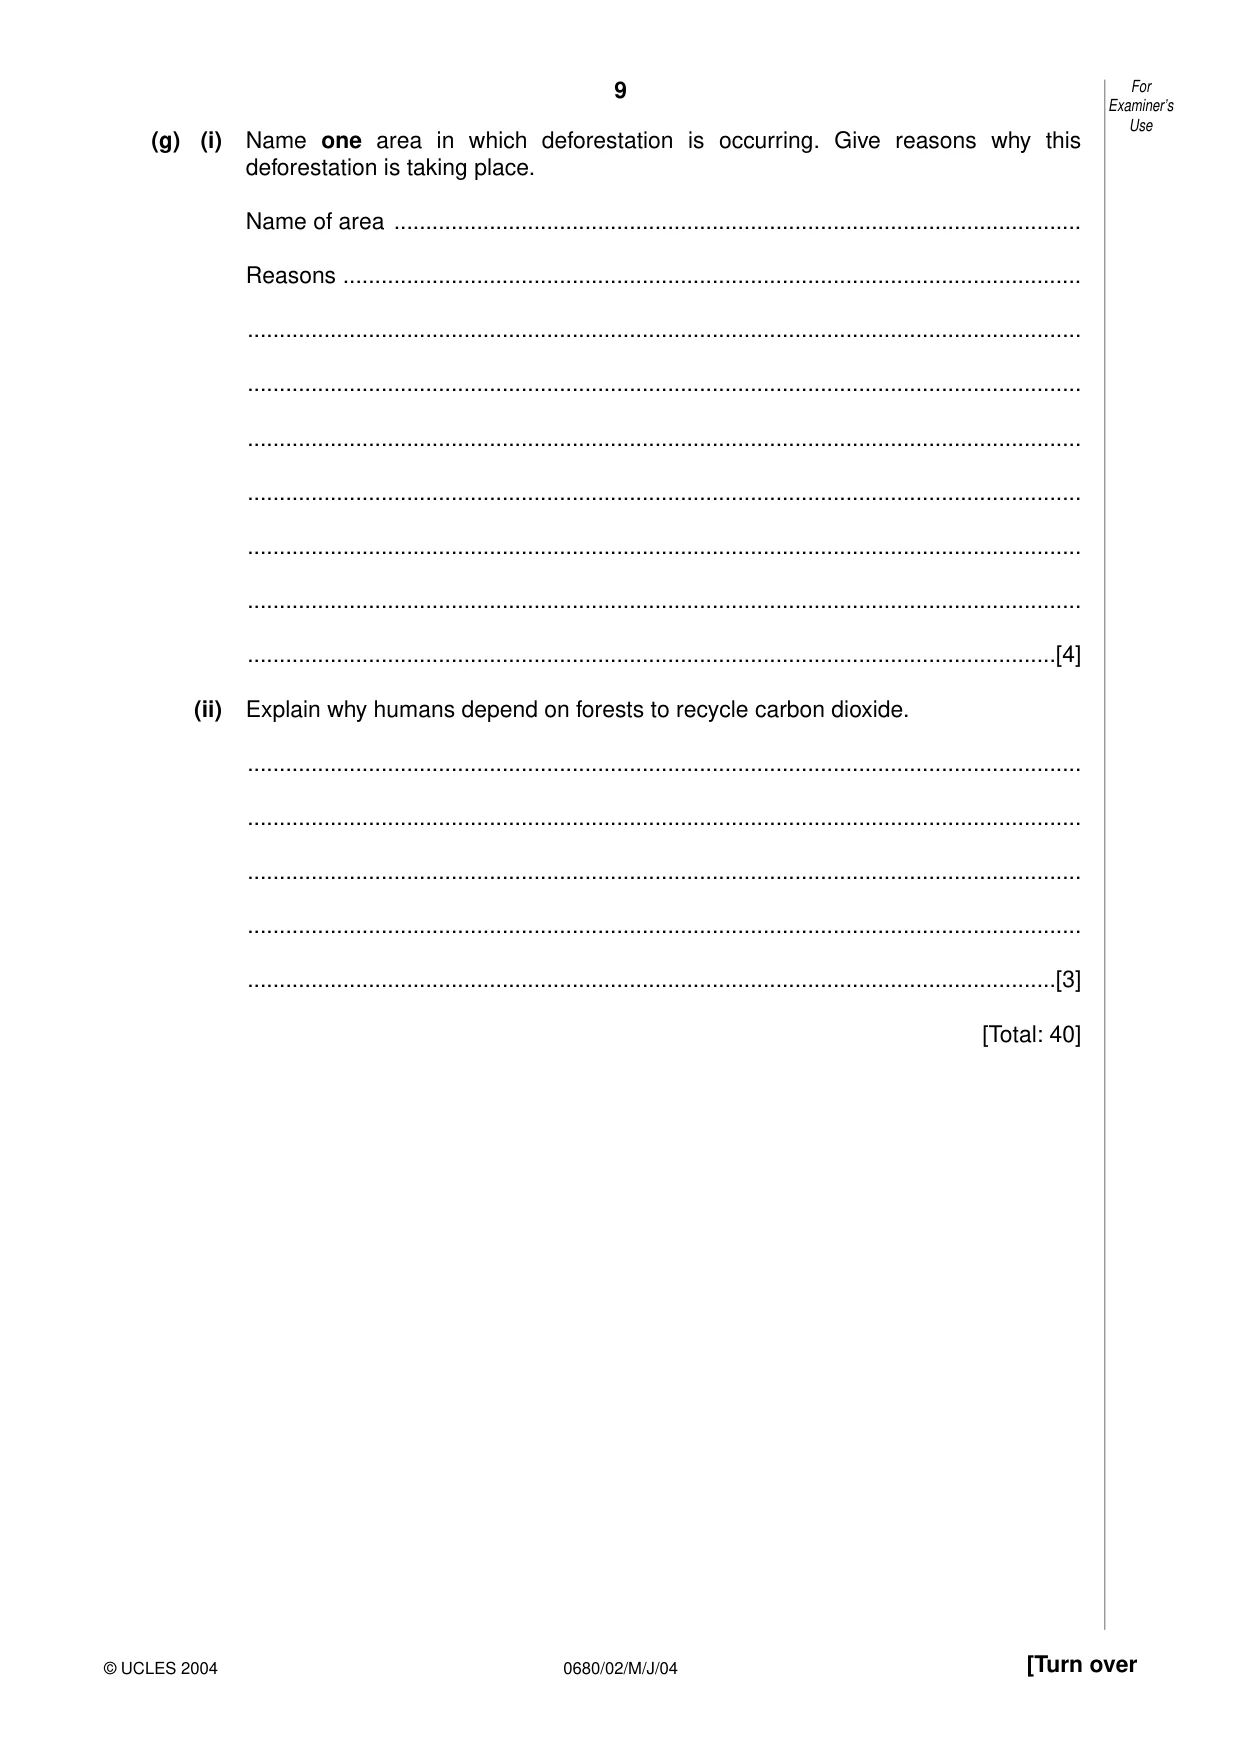
9 0680/02/M/J/04 [Turn over (g) (i) Name one area in which deforestation is occurring. Give reasons why this deforestation is taking place. Name of area … Reasons … … … … … … … …[4] (ii) Explain why humans depend on forests to recycle carbon dioxide. … … … … …[3] [Total: 40] For Examiner’s Use © UCLES 2004
Question paper, page 10
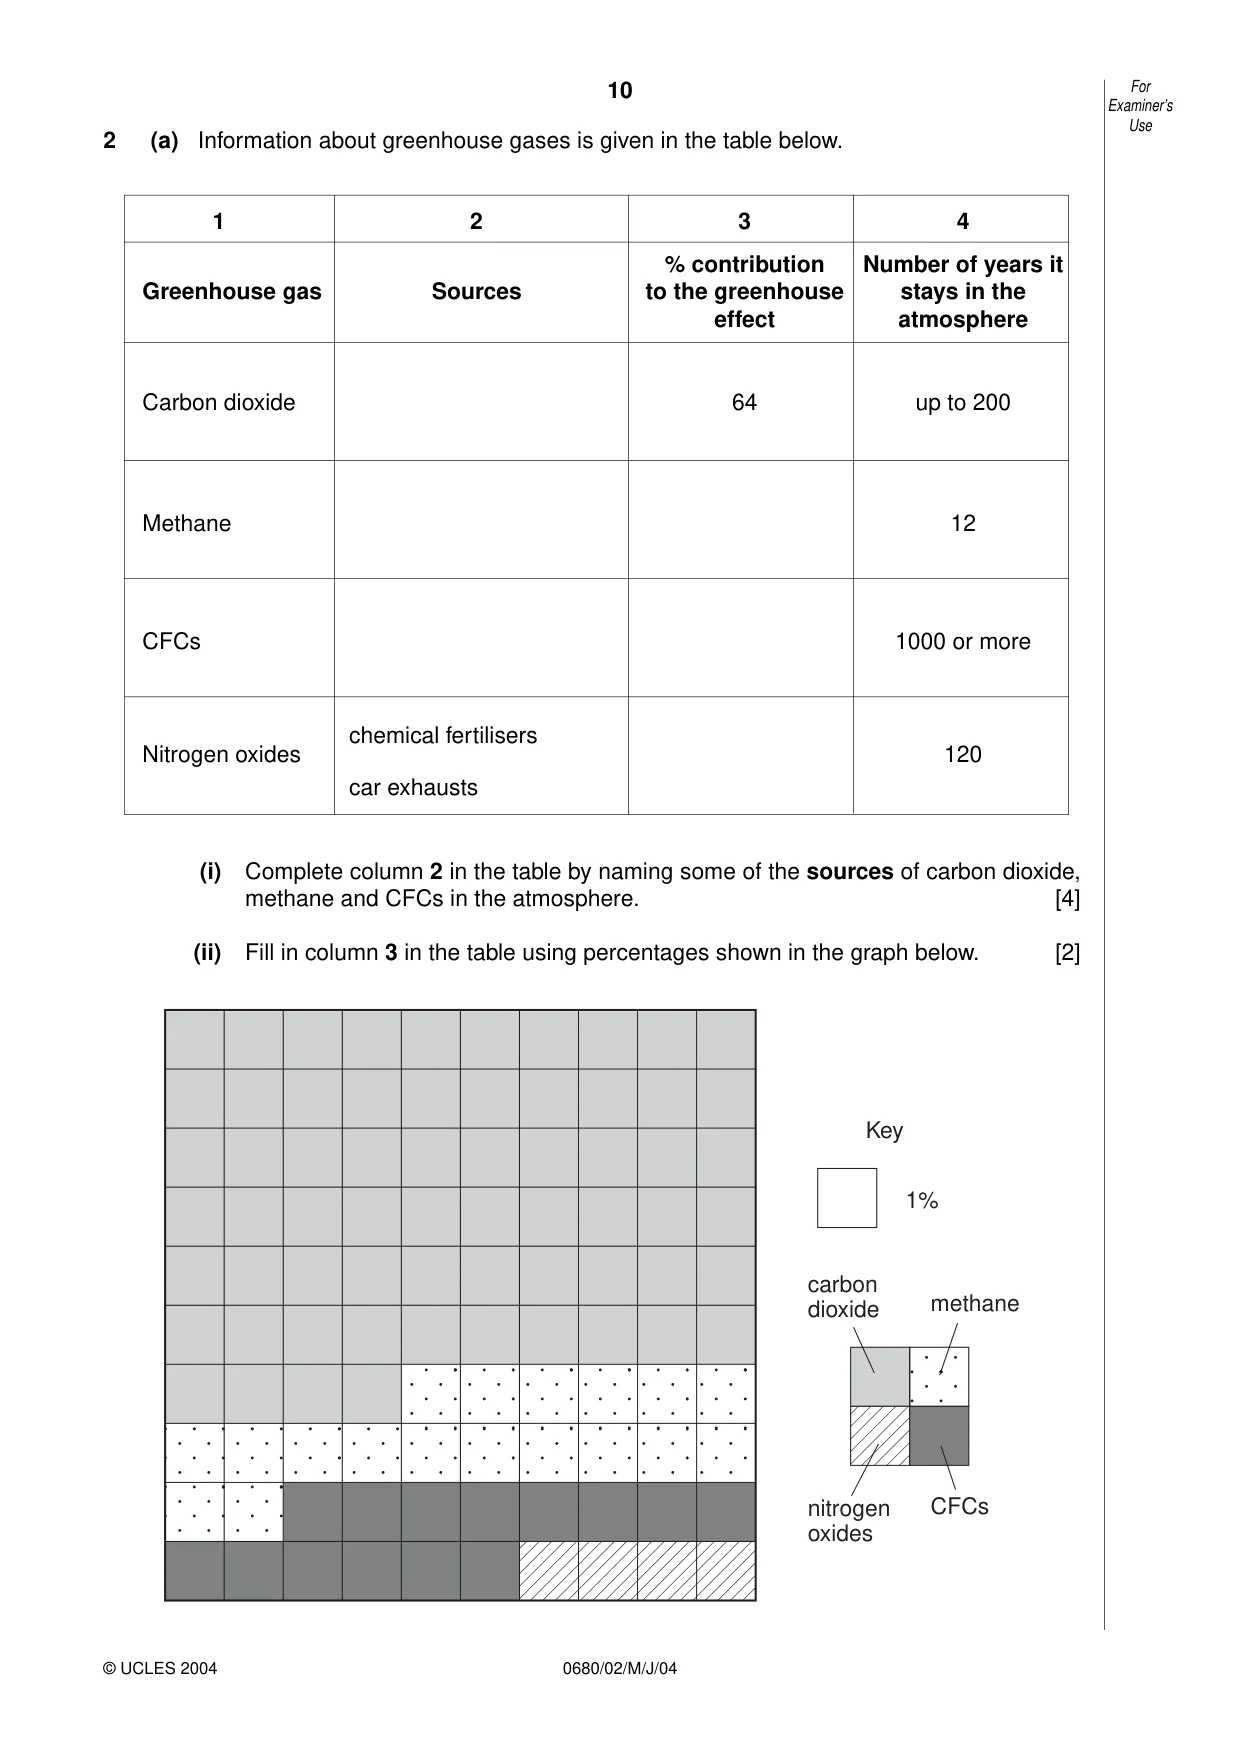
10 0680/02/M/J/04 2 (a) Information about greenhouse gases is given in the table below. (i) Complete column 2 in the table by naming some of the sources of carbon dioxide, methane and CFCs in the atmosphere. [4] (ii) Fill in column 3 in the table using percentages shown in the graph below. [2] Key 1% carbon dioxide methane nitrogen oxides CFCs For Examiner’s Use © UCLES 2004 1 2 3 4 % contribution Number of years it Greenhouse gas Sources to the greenhouse stays in the effect atmosphere Carbon dioxide 64 up to 200 Methane 12 CFCs 1000 or more Nitrogen oxides chemical fertilisers 120 car exhausts
Question paper, page 11
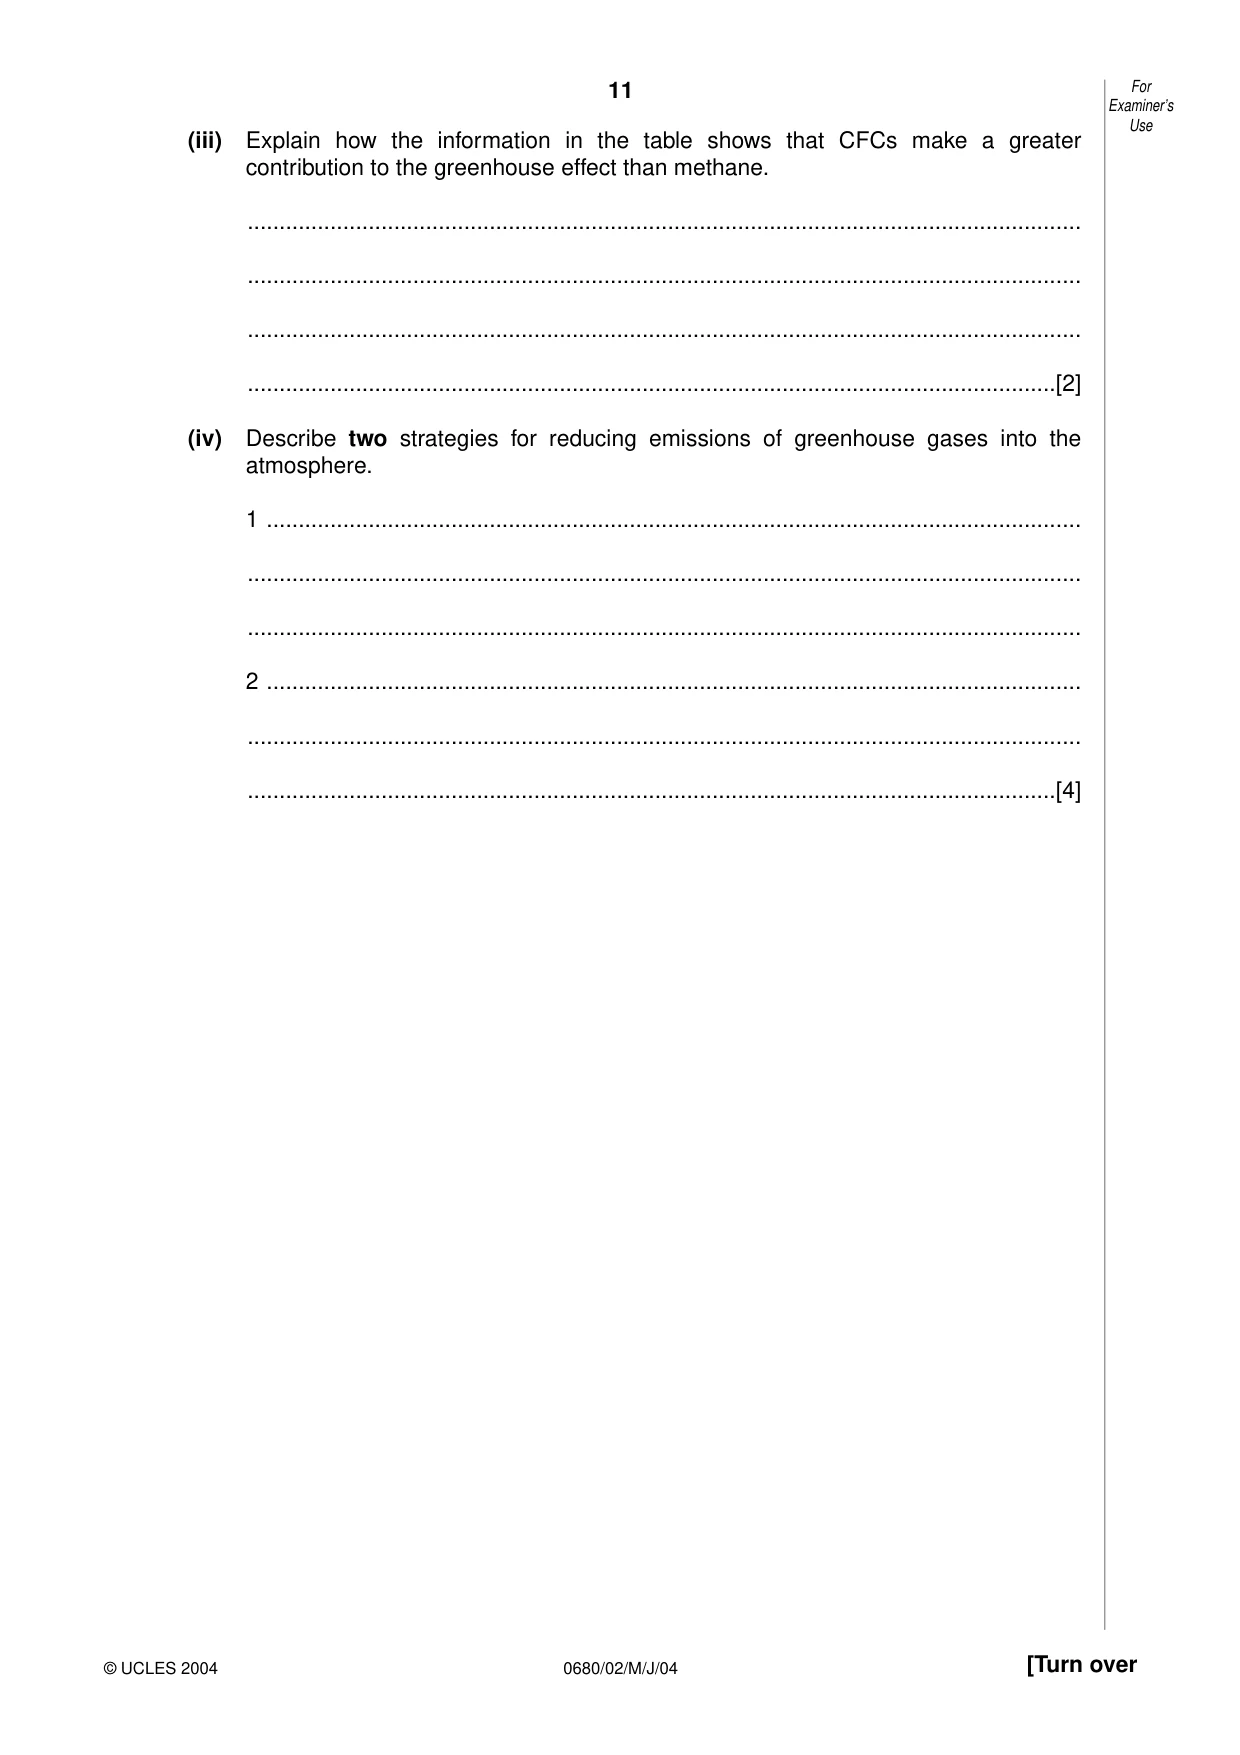
11 0680/02/M/J/04 [Turn over (iii) Explain how the information in the table shows that CFCs make a greater contribution to the greenhouse effect than methane. … … … …[2] (iv) Describe two strategies for reducing emissions of greenhouse gases into the atmosphere. 1 … … … 2 … … …[4] For Examiner’s Use © UCLES 2004
Question paper, page 12
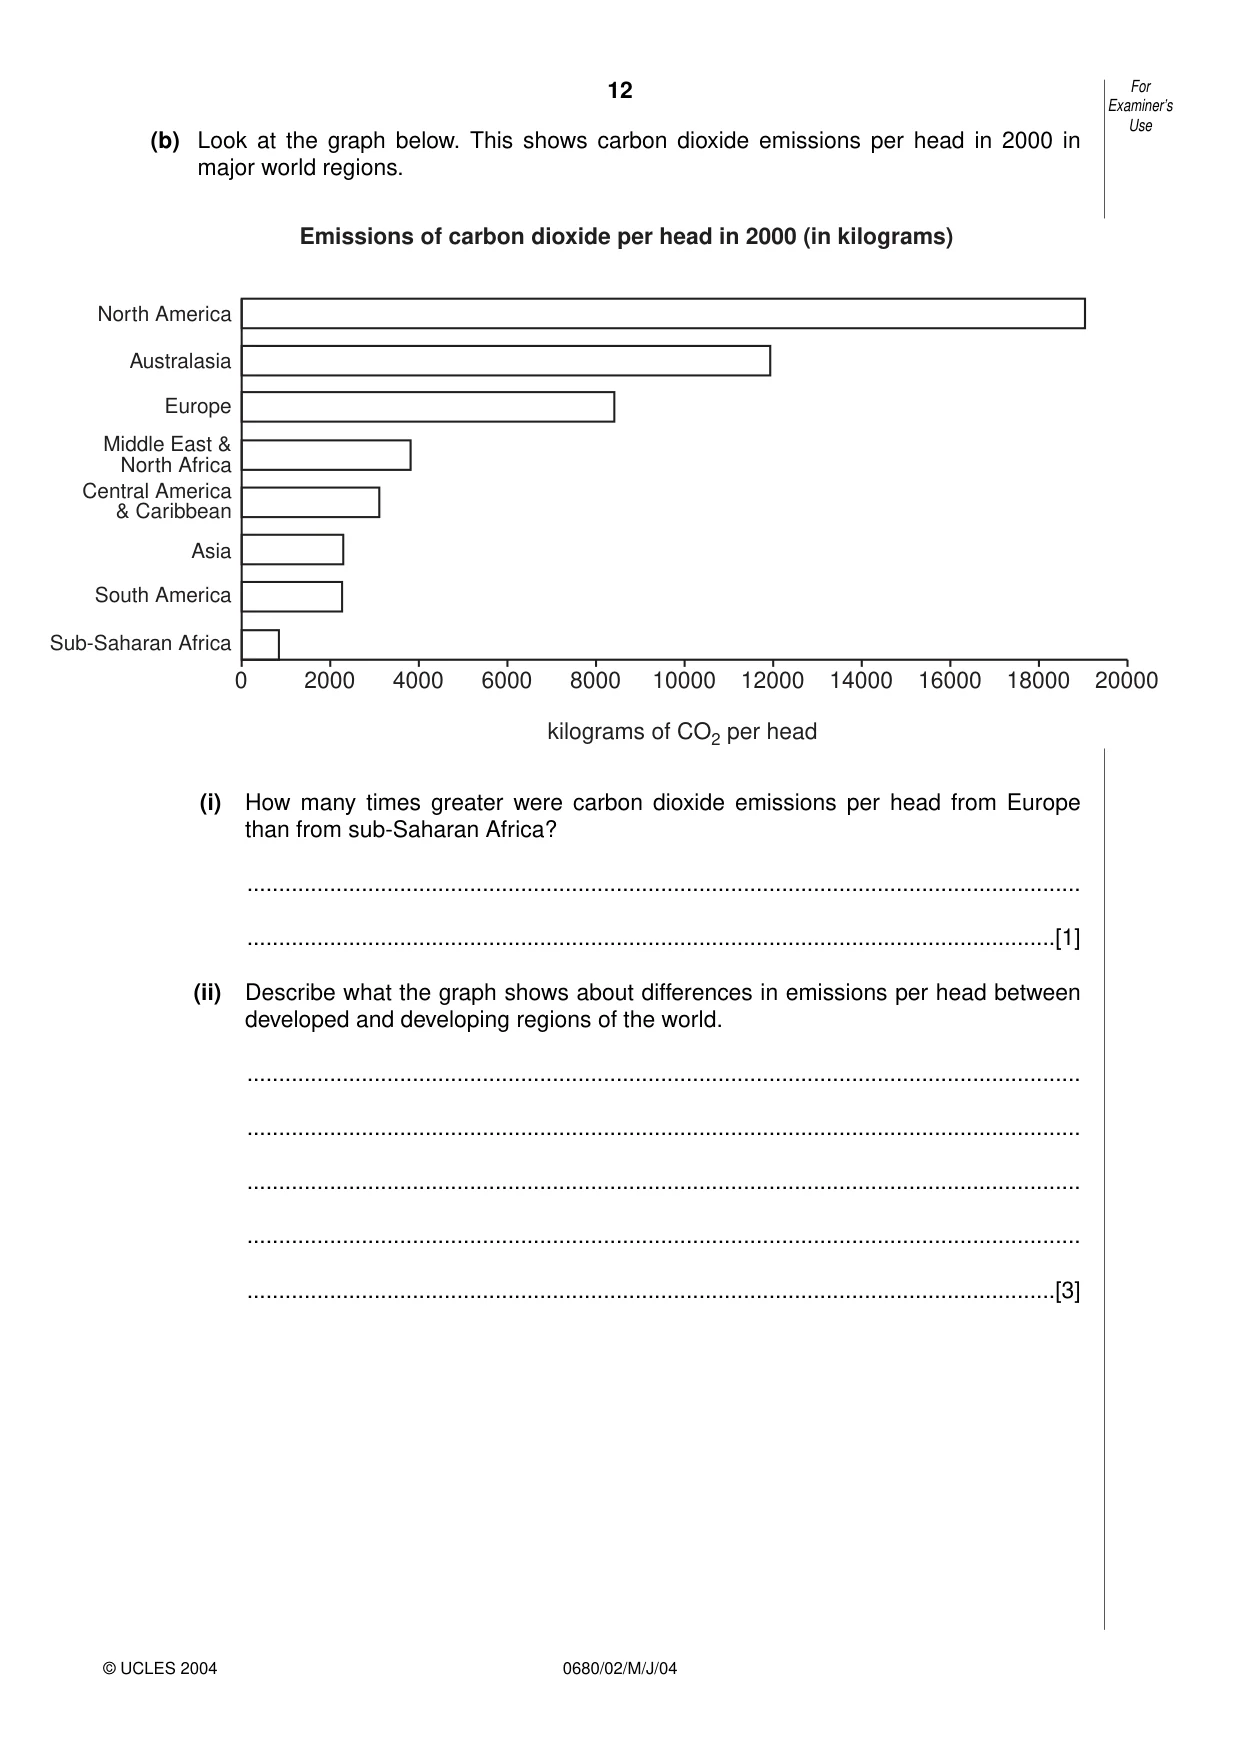
12 0680/02/M/J/04 (b) Look at the graph below. This shows carbon dioxide emissions per head in 2000 in major world regions. (i) How many times greater were carbon dioxide emissions per head from Europe than from sub-Saharan Africa? … …[1] (ii) Describe what the graph shows about differences in emissions per head between developed and developing regions of the world. … … … … …[3] For Examiner’s Use © UCLES 2004 0 2000 4000 6000 8000 10000 12000 14000 16000 18000 20000 Sub-Saharan Africa South America Asia Europe Australasia North America Central America & Caribbean Middle East & North Africa kilograms of CO2 per head Emissions of carbon dioxide per head in 2000 (in kilograms)
Question paper, page 13
13 0680/02/M/J/04 [Turn over (c) Some attempts have been made to reduce carbon dioxide emissions by international action, but with limited success. (i) Describe the international attempts that have been made to reduce carbon dioxide emissions. … … … … (ii) Why have these international attempts not been totally successful? … … … … … …[5] For Examiner’s Use © UCLES 2004
Question paper, page 14
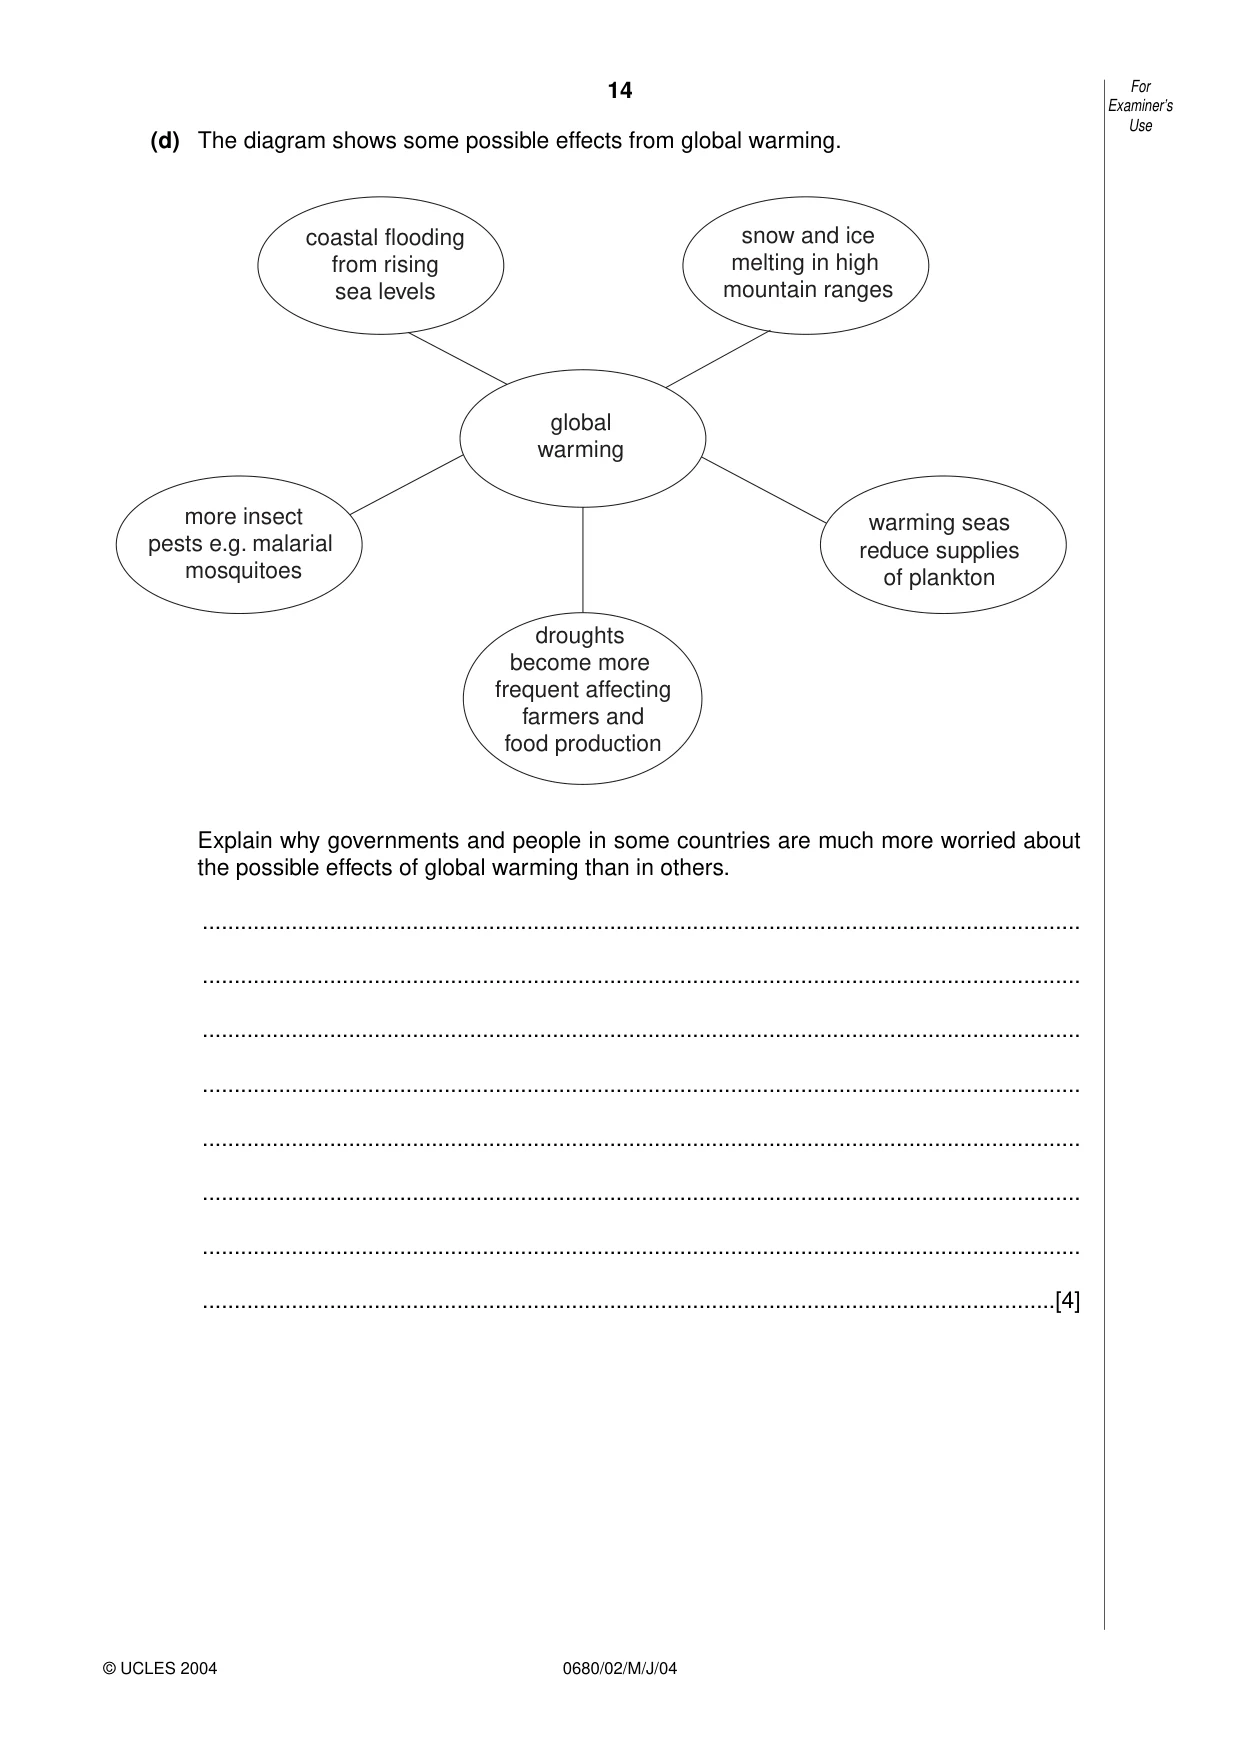
14 0680/02/M/J/04 (d) The diagram shows some possible effects from global warming. Explain why governments and people in some countries are much more worried about the possible effects of global warming than in others. … … … … … … … …[4] global warming coastal flooding from rising sea levels snow and ice melting in high mountain ranges more insect pests e.g. malarial mosquitoes warming seas reduce supplies of plankton droughts become more frequent affecting farmers and food production For Examiner’s Use © UCLES 2004
Question paper, page 15
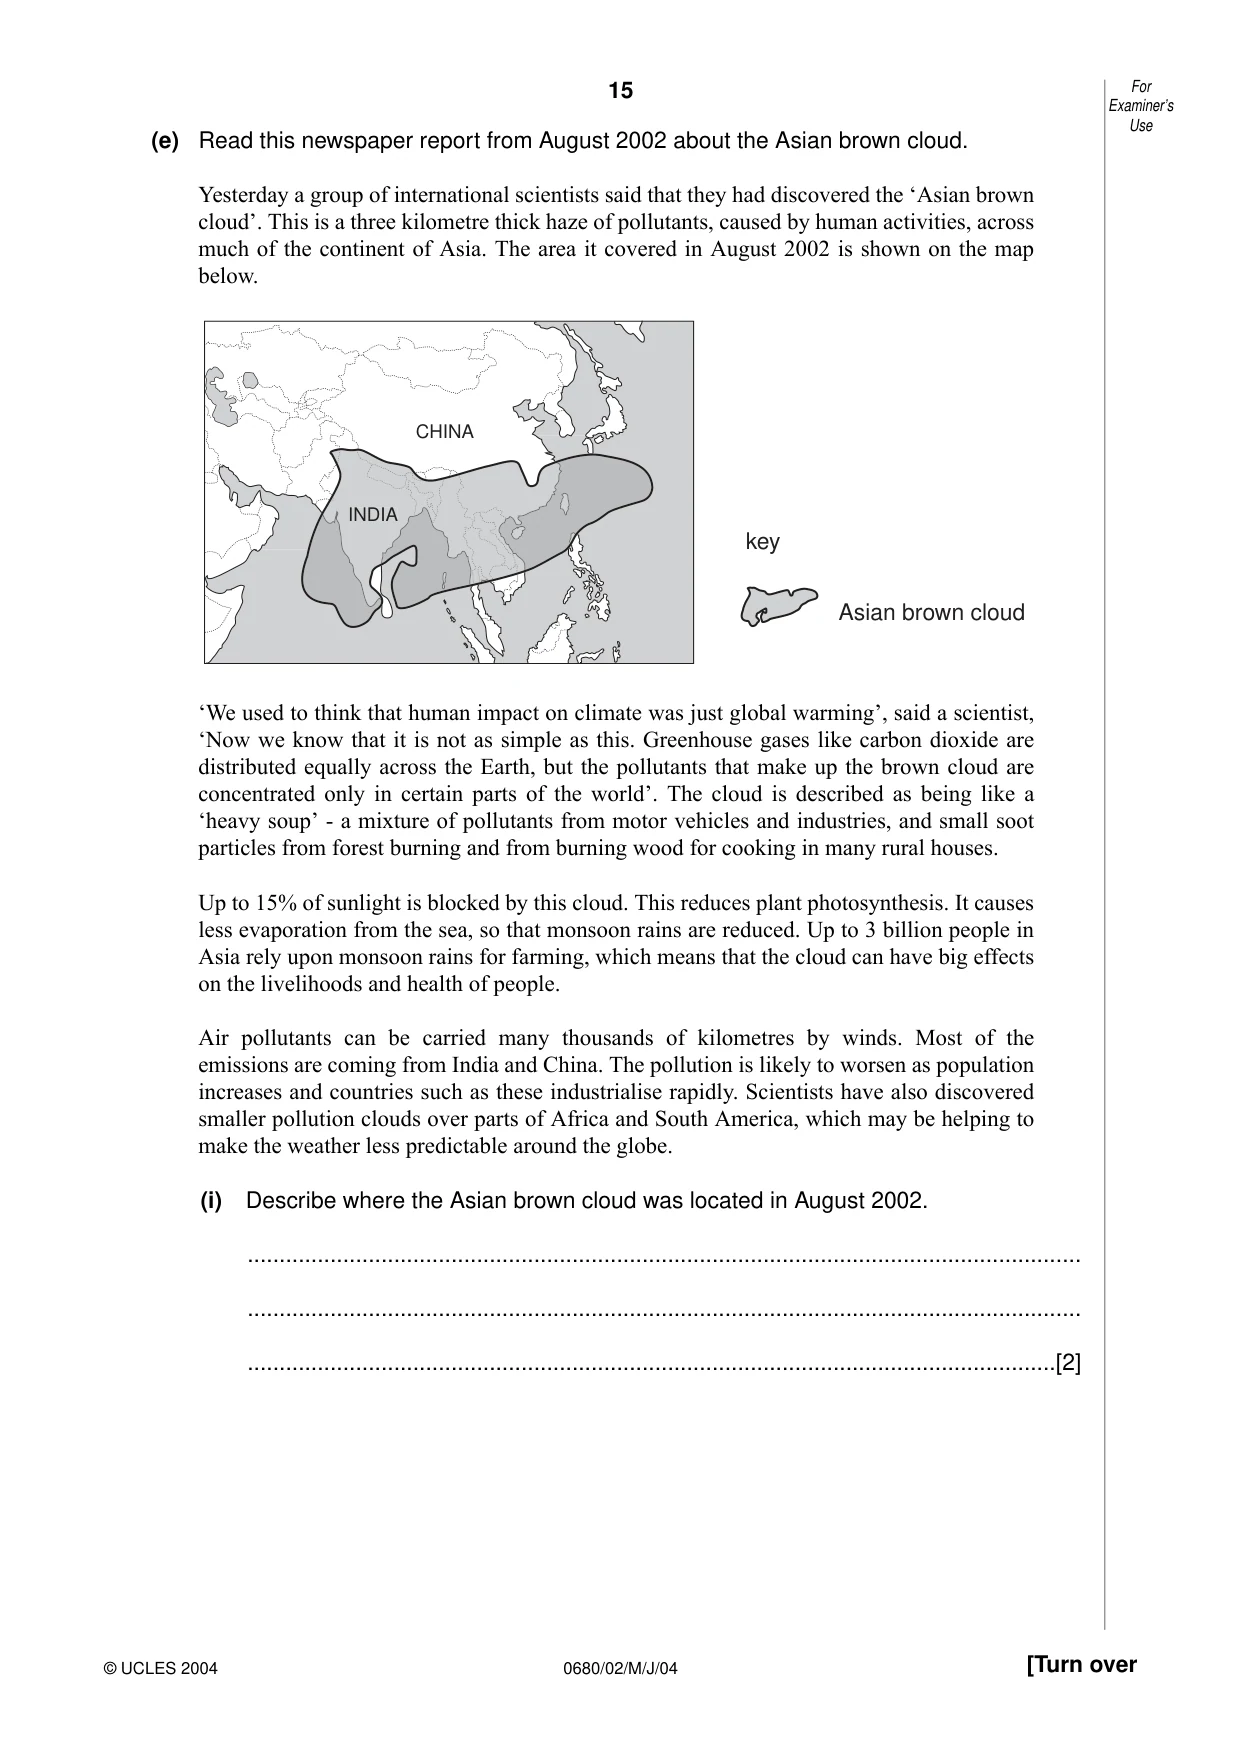
15 0680/02/M/J/04 [Turn over (e) Read this newspaper report from August 2002 about the Asian brown cloud. Yesterday a group of international scientists said that they had discovered the ‘Asian brown cloud’. This is a three kilometre thick haze of pollutants, caused by human activities, across much of the continent of Asia. The area it covered in August 2002 is shown on the map below. ‘We used to think that human impact on climate was just global warming’, said a scientist, ‘Now we know that it is not as simple as this. Greenhouse gases like carbon dioxide are distributed equally across the Earth, but the pollutants that make up the brown cloud are concentrated only in certain parts of the world’. The cloud is described as being like a ‘heavy soup’ - a mixture of pollutants from motor vehicles and industries, and small soot particles from forest burning and from burning wood for cooking in many rural houses. Up to 15% of sunlight is blocked by this cloud. This reduces plant photosynthesis. It causes less evaporation from the sea, so that monsoon rains are reduced. Up to 3 billion people in Asia rely upon monsoon rains for farming, which means that the cloud can have big effects on the livelihoods and health of people. Air pollutants can be carried many thousands of kilometres by winds. Most of the emissions are coming from India and China. The pollution is likely to worsen as population increases and countries such as these industrialise rapidly. Scientists have also discovered smaller pollution clouds over parts of Africa and South America, which may be helping to make the weather less predictable around the globe. (i) Describe where the Asian brown cloud was located in August 2002. … … …[2] CHINA INDIA key Asian brown cloud For Examiner’s Use © UCLES 2004
Question paper, page 16
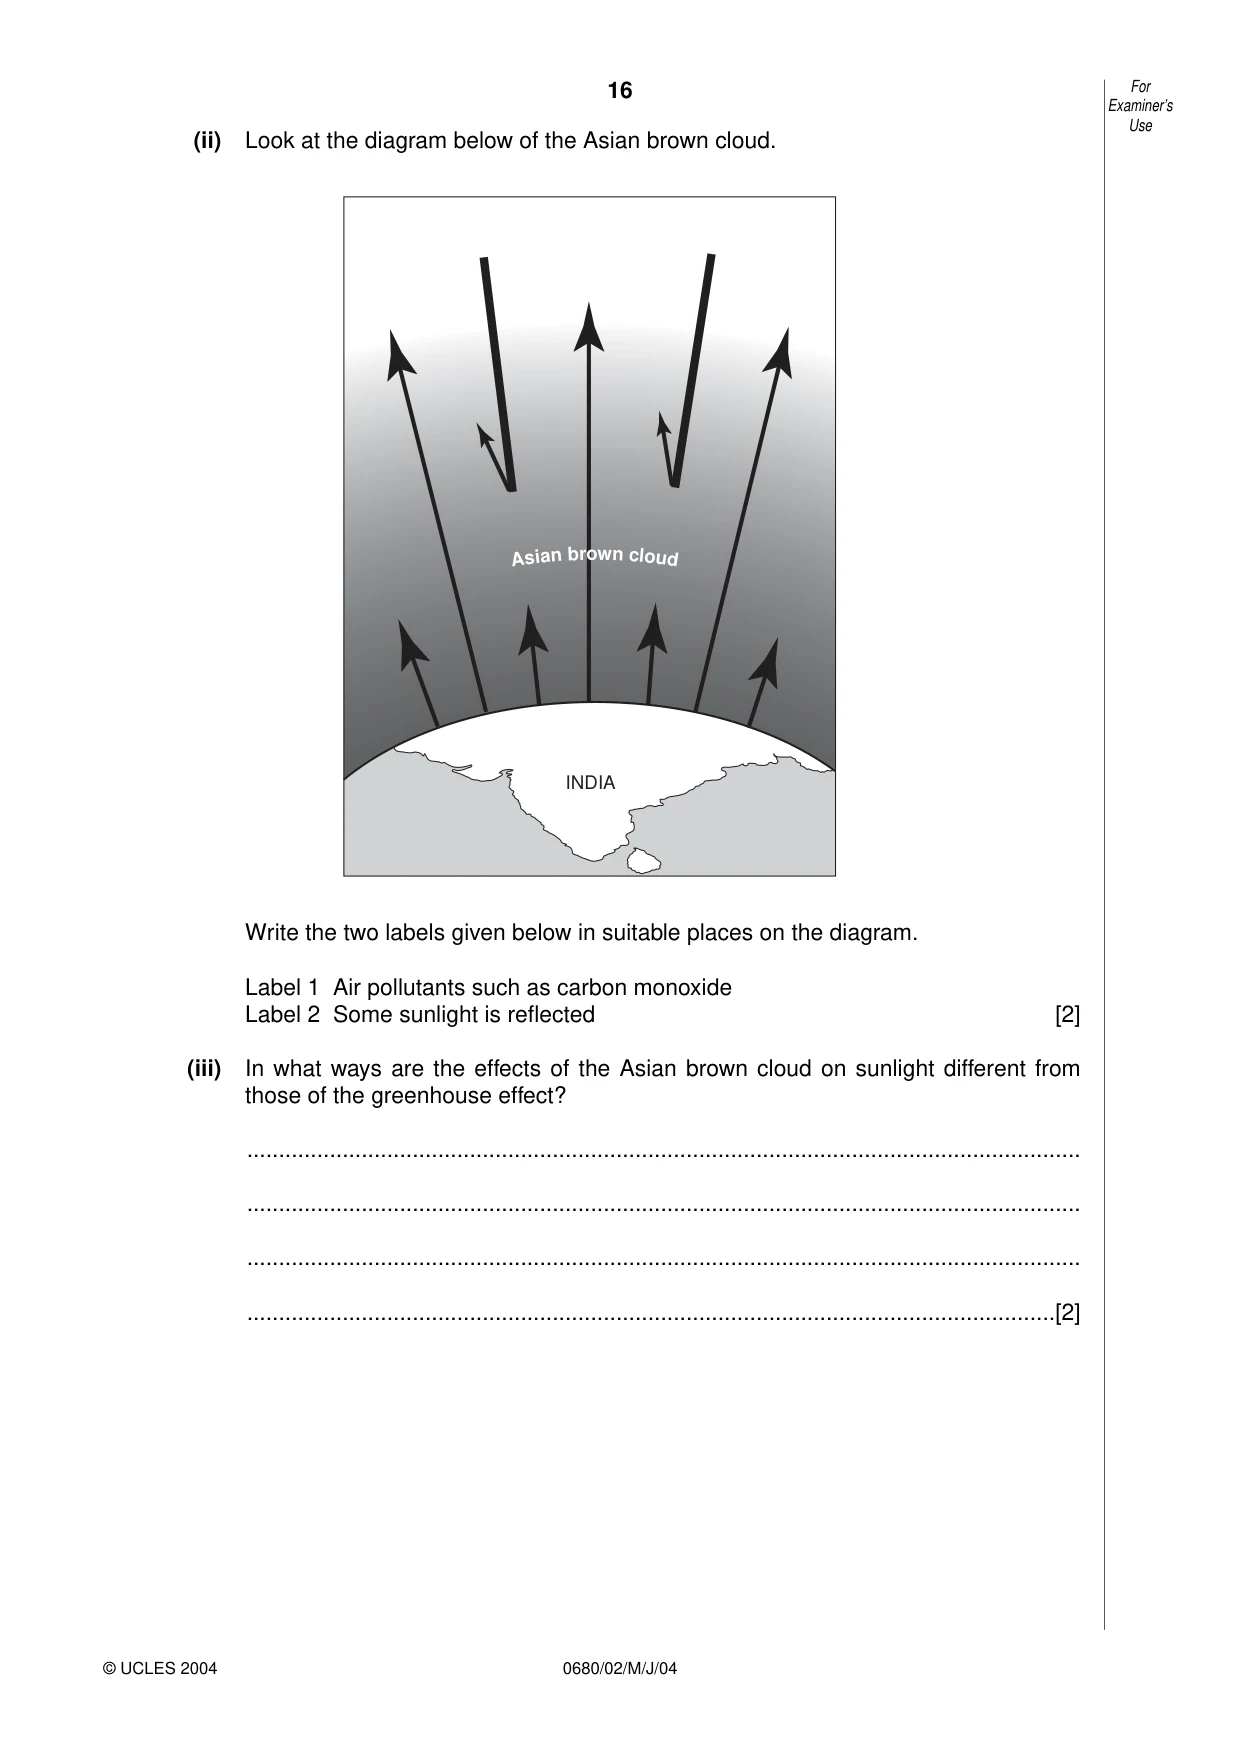
16 0680/02/M/J/04 (ii) Look at the diagram below of the Asian brown cloud. Write the two labels given below in suitable places on the diagram. Label 1 Air pollutants such as carbon monoxide Label 2 Some sunlight is reflected [2] (iii) In what ways are the effects of the Asian brown cloud on sunlight different from those of the greenhouse effect? … … … …[2] INDIA Asi an bro wn clo ud For Examiner’s Use © UCLES 2004
Question paper, page 17
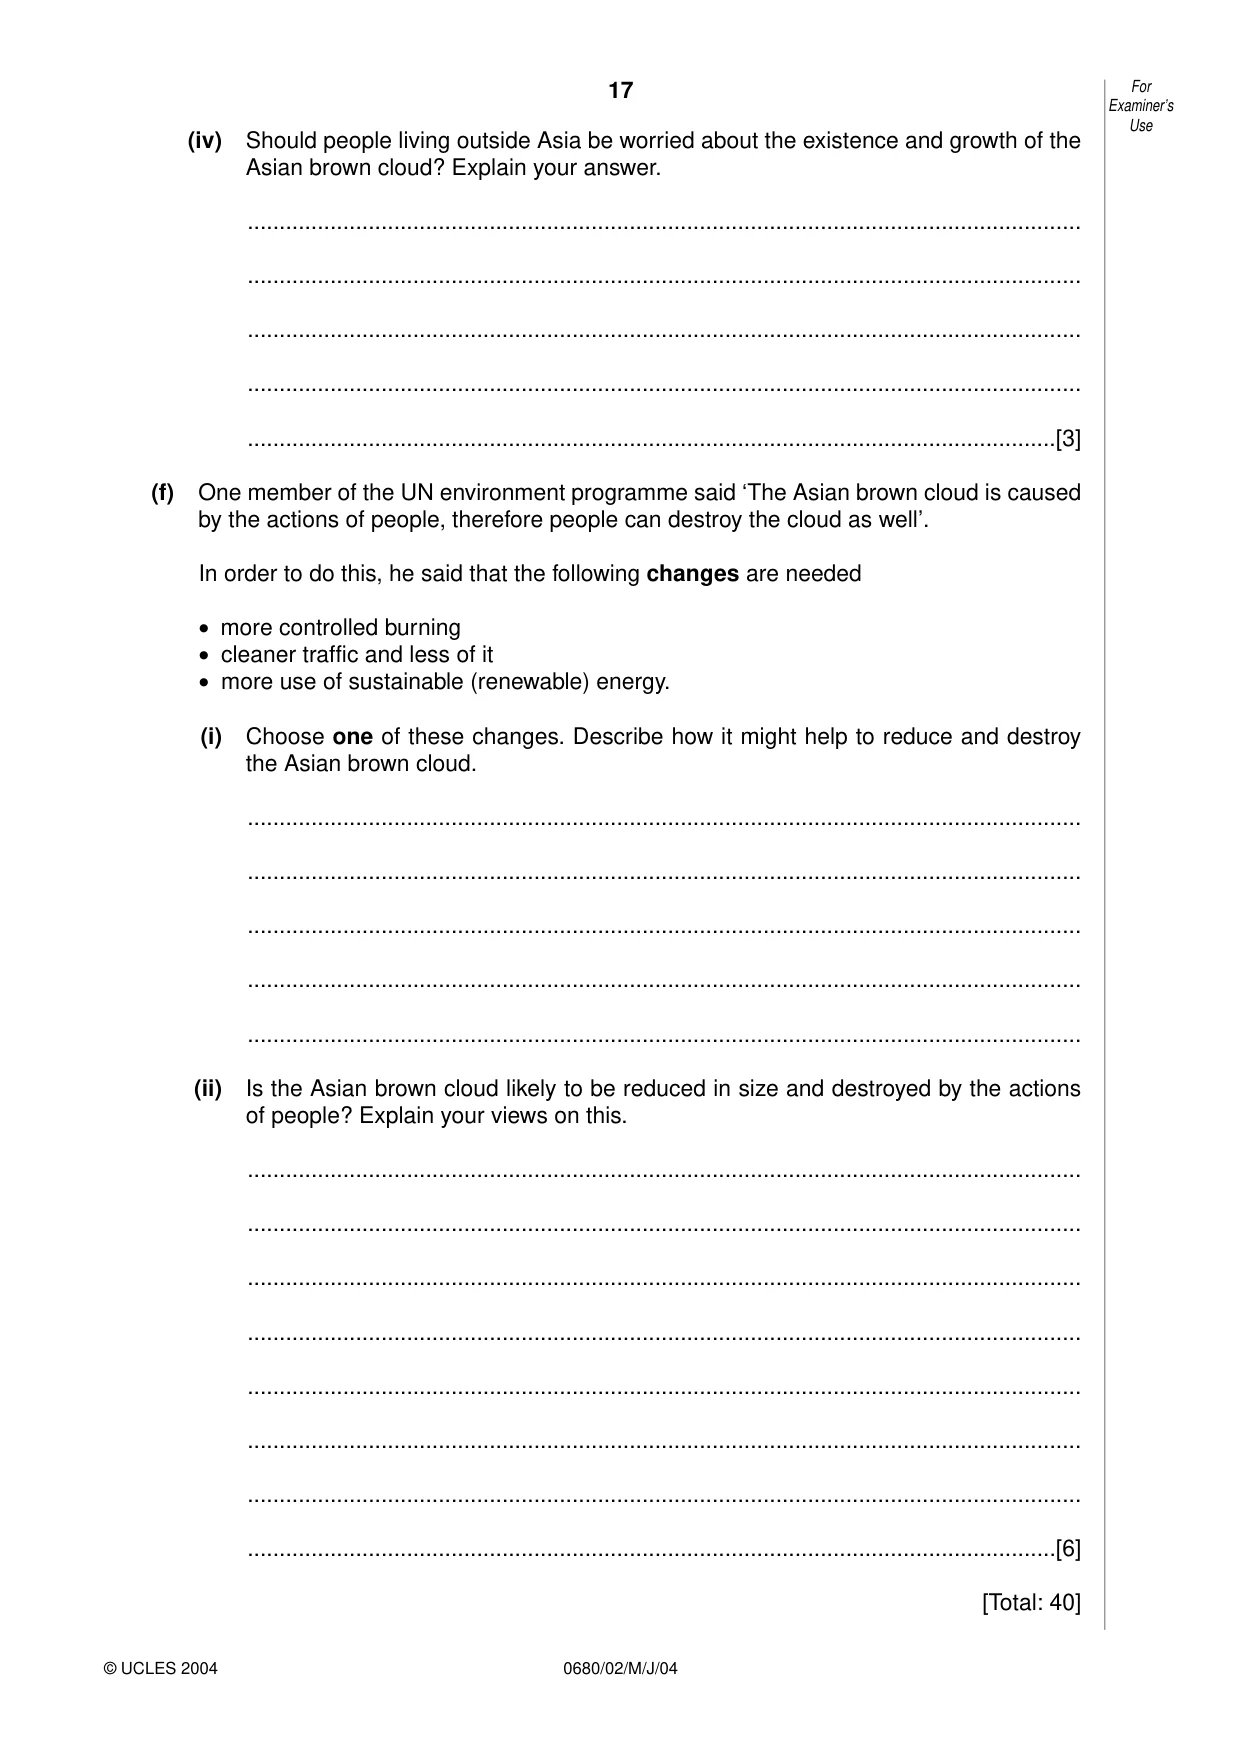
17 0680/02/M/J/04 (iv) Should people living outside Asia be worried about the existence and growth of the Asian brown cloud? Explain your answer. … … … … …[3] (f) One member of the UN environment programme said ‘The Asian brown cloud is caused by the actions of people, therefore people can destroy the cloud as well’. In order to do this, he said that the following changes are needed • more controlled burning • cleaner traffic and less of it • more use of sustainable (renewable) energy. (i) Choose one of these changes. Describe how it might help to reduce and destroy the Asian brown cloud. … … … … … (ii) Is the Asian brown cloud likely to be reduced in size and destroyed by the actions of people? Explain your views on this. … … … … … … … …[6] [Total: 40] For Examiner’s Use © UCLES 2004
Question paper, page 20
20 0680/02/M/J/04 BLANK PAGE Copyright Acknowledgements: Question 1(e) © The Independent. 2nd December 2000 Question 2(b) © The Guardian. 24th November 2001 Question 2(e) © The Guardian. 21st August 2002 The University of Cambridge Local Examinations Syndicate has made every effort to trace copyright holders, but if we have inadvertently overlooked any we will be pleased to make the necessary arrangements at the first opportunity. University of Cambridge International Examinations is part of the University of Cambridge Local Examinations Syndicate (UCLES) which is itself a department of the University of Cambridge.