Cambridge IGCSE Chemistry (9-1) 0971 — 2021 May/June Paper 6 · Variant 1
0971/61/M/J/21 · 4 questions · 40 marks · ≈45 min
The question paper and its mark scheme, free to read here and free to download. This is Cambridge’s own paper, exactly as it was sat.
Question paper12 pages


Mark scheme9 pages
Answers below. Sit the paper first if you are practising.
Questions as text
Q1 · Many indicators are coloured substances obtained from plants
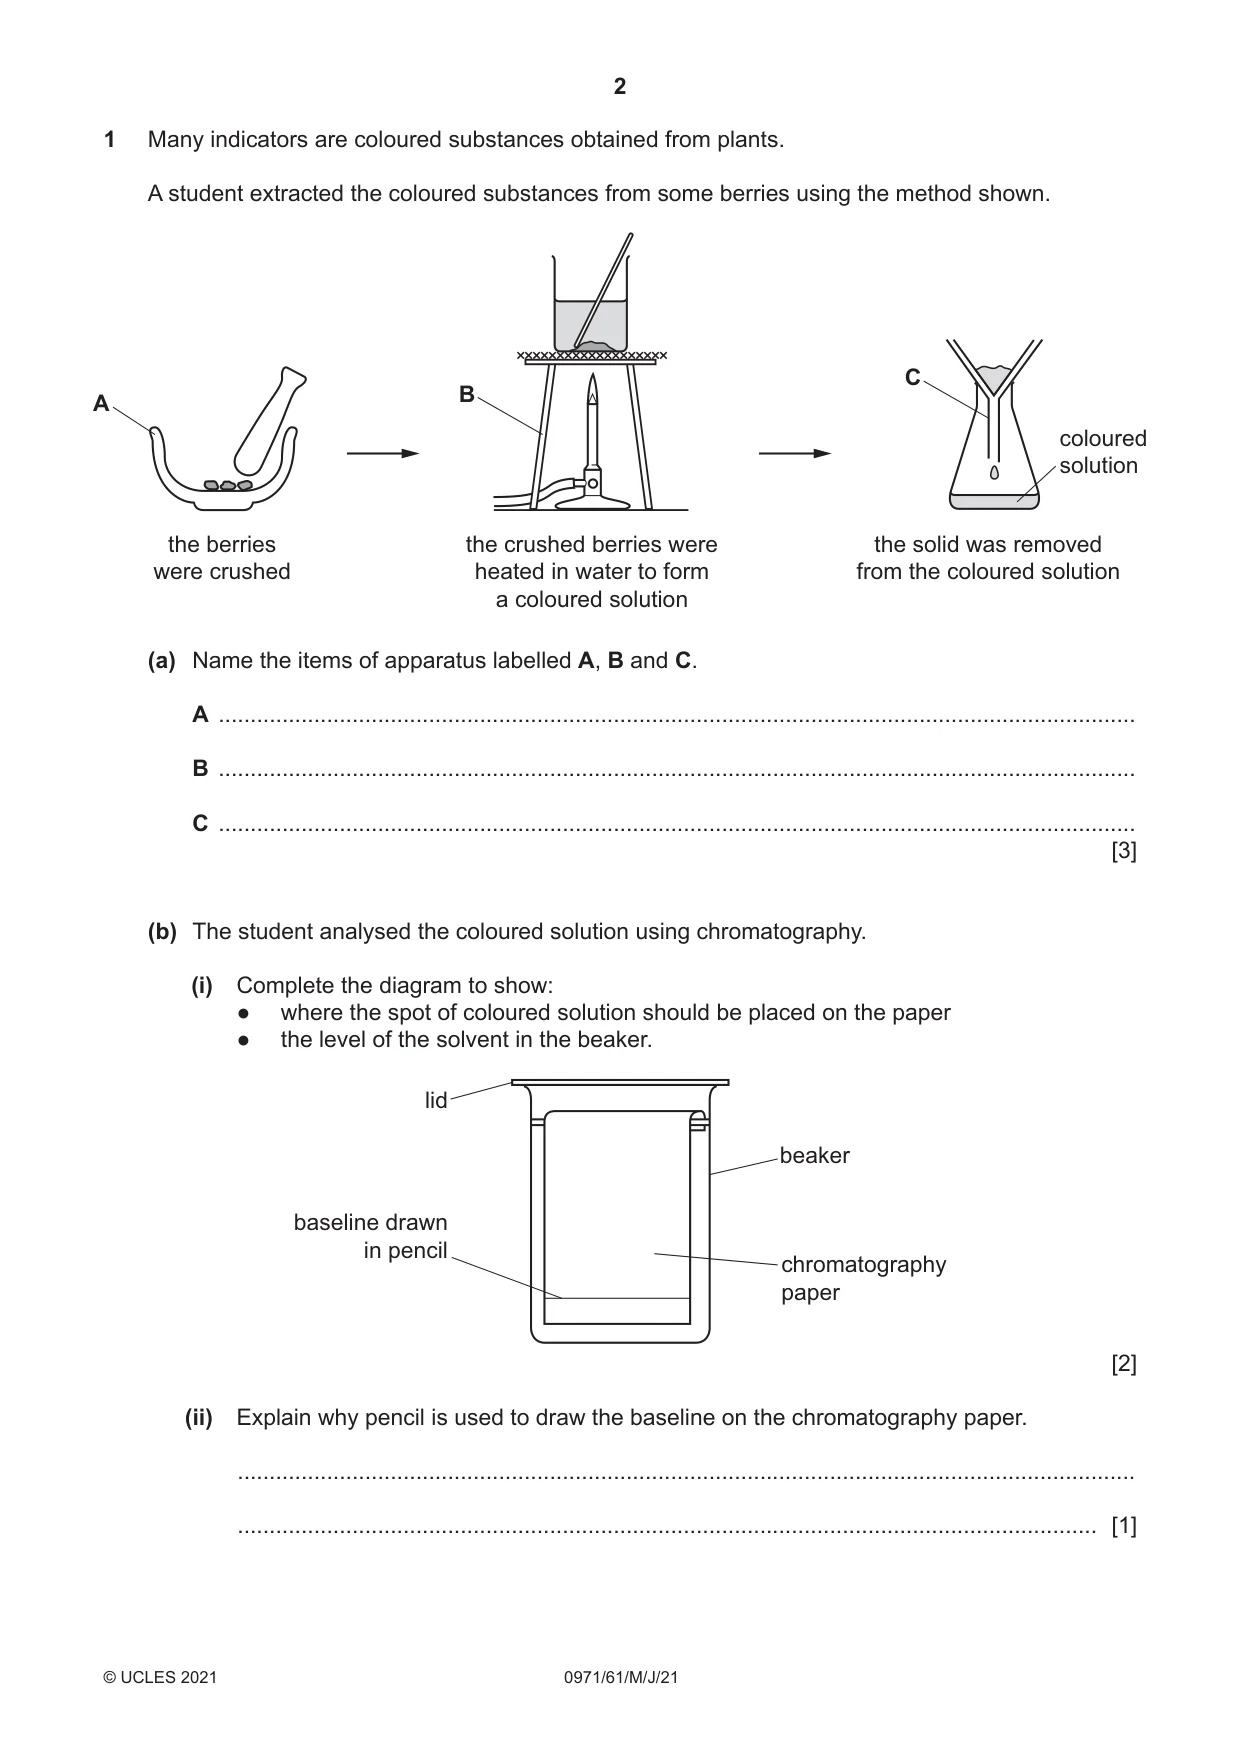
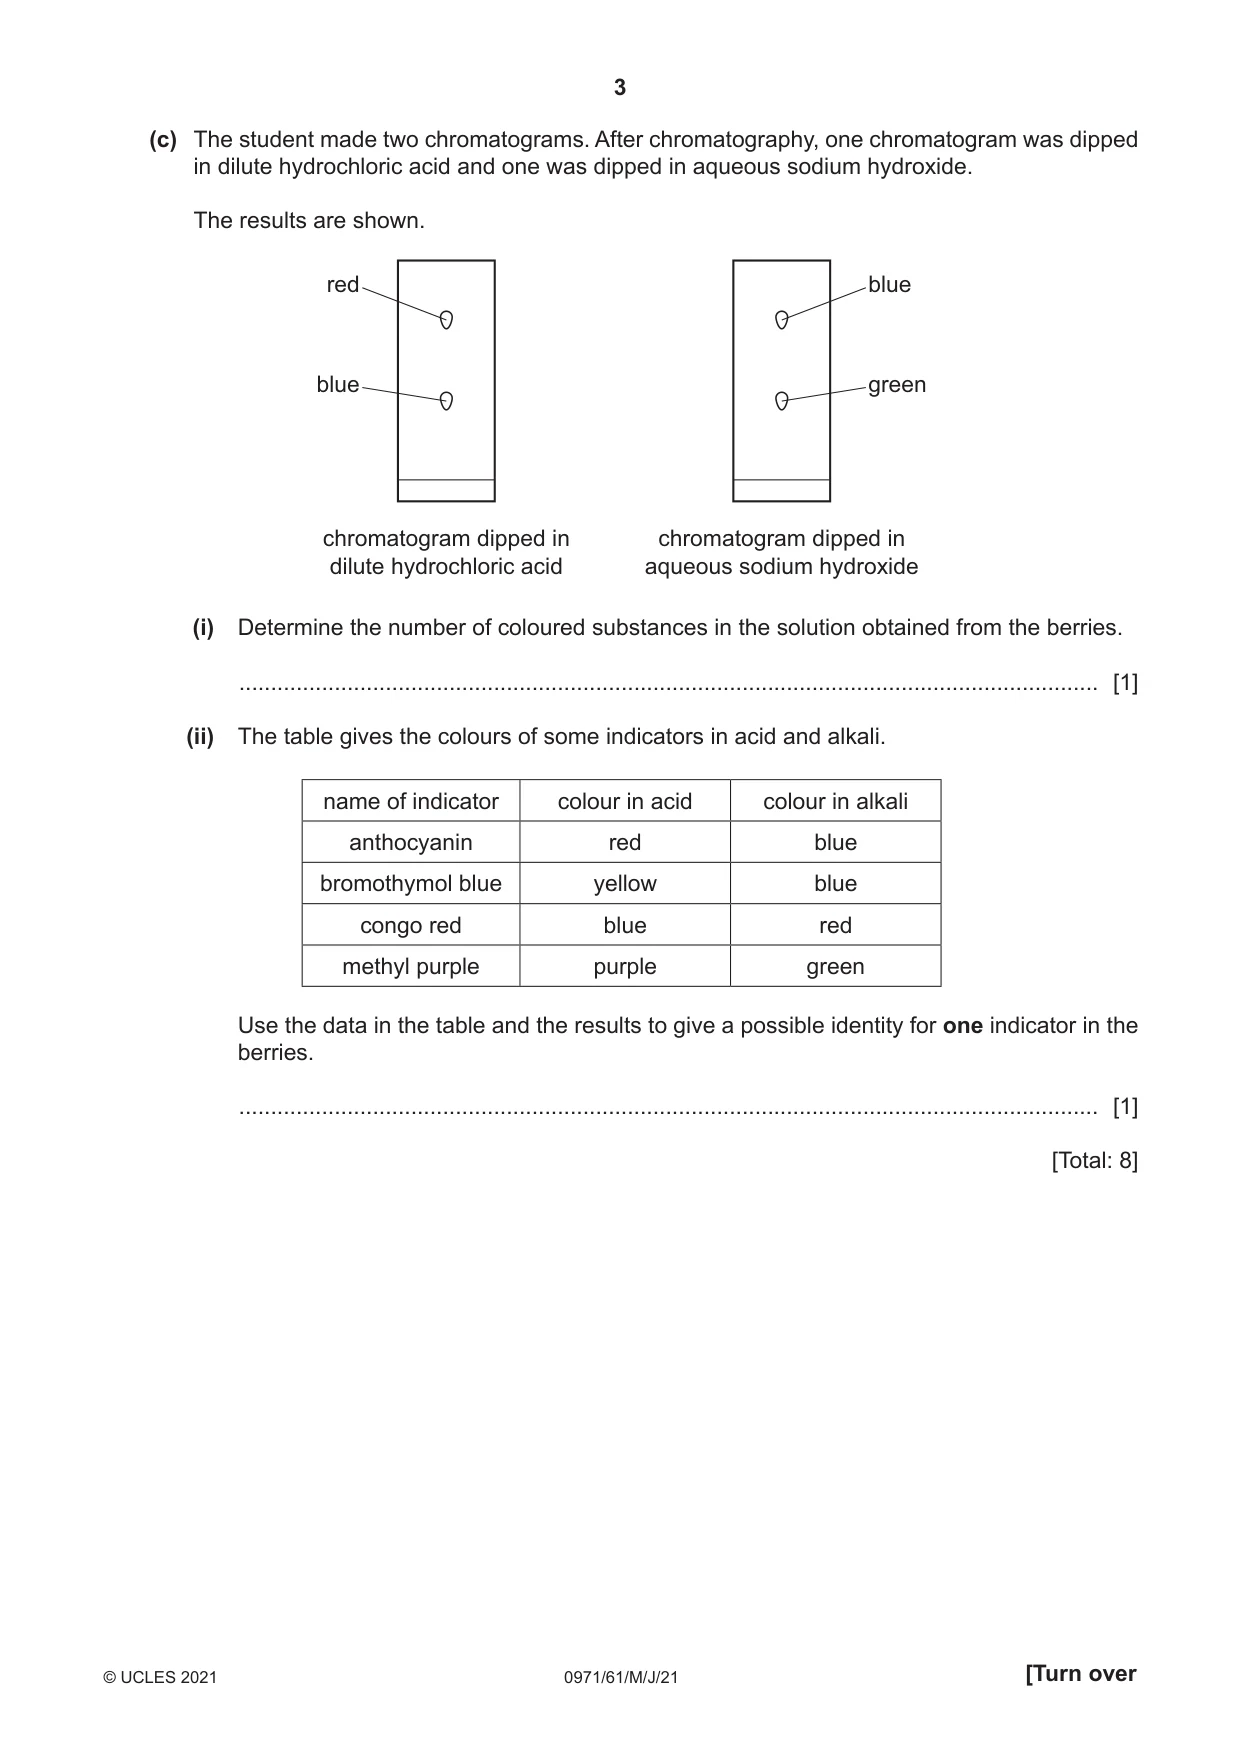
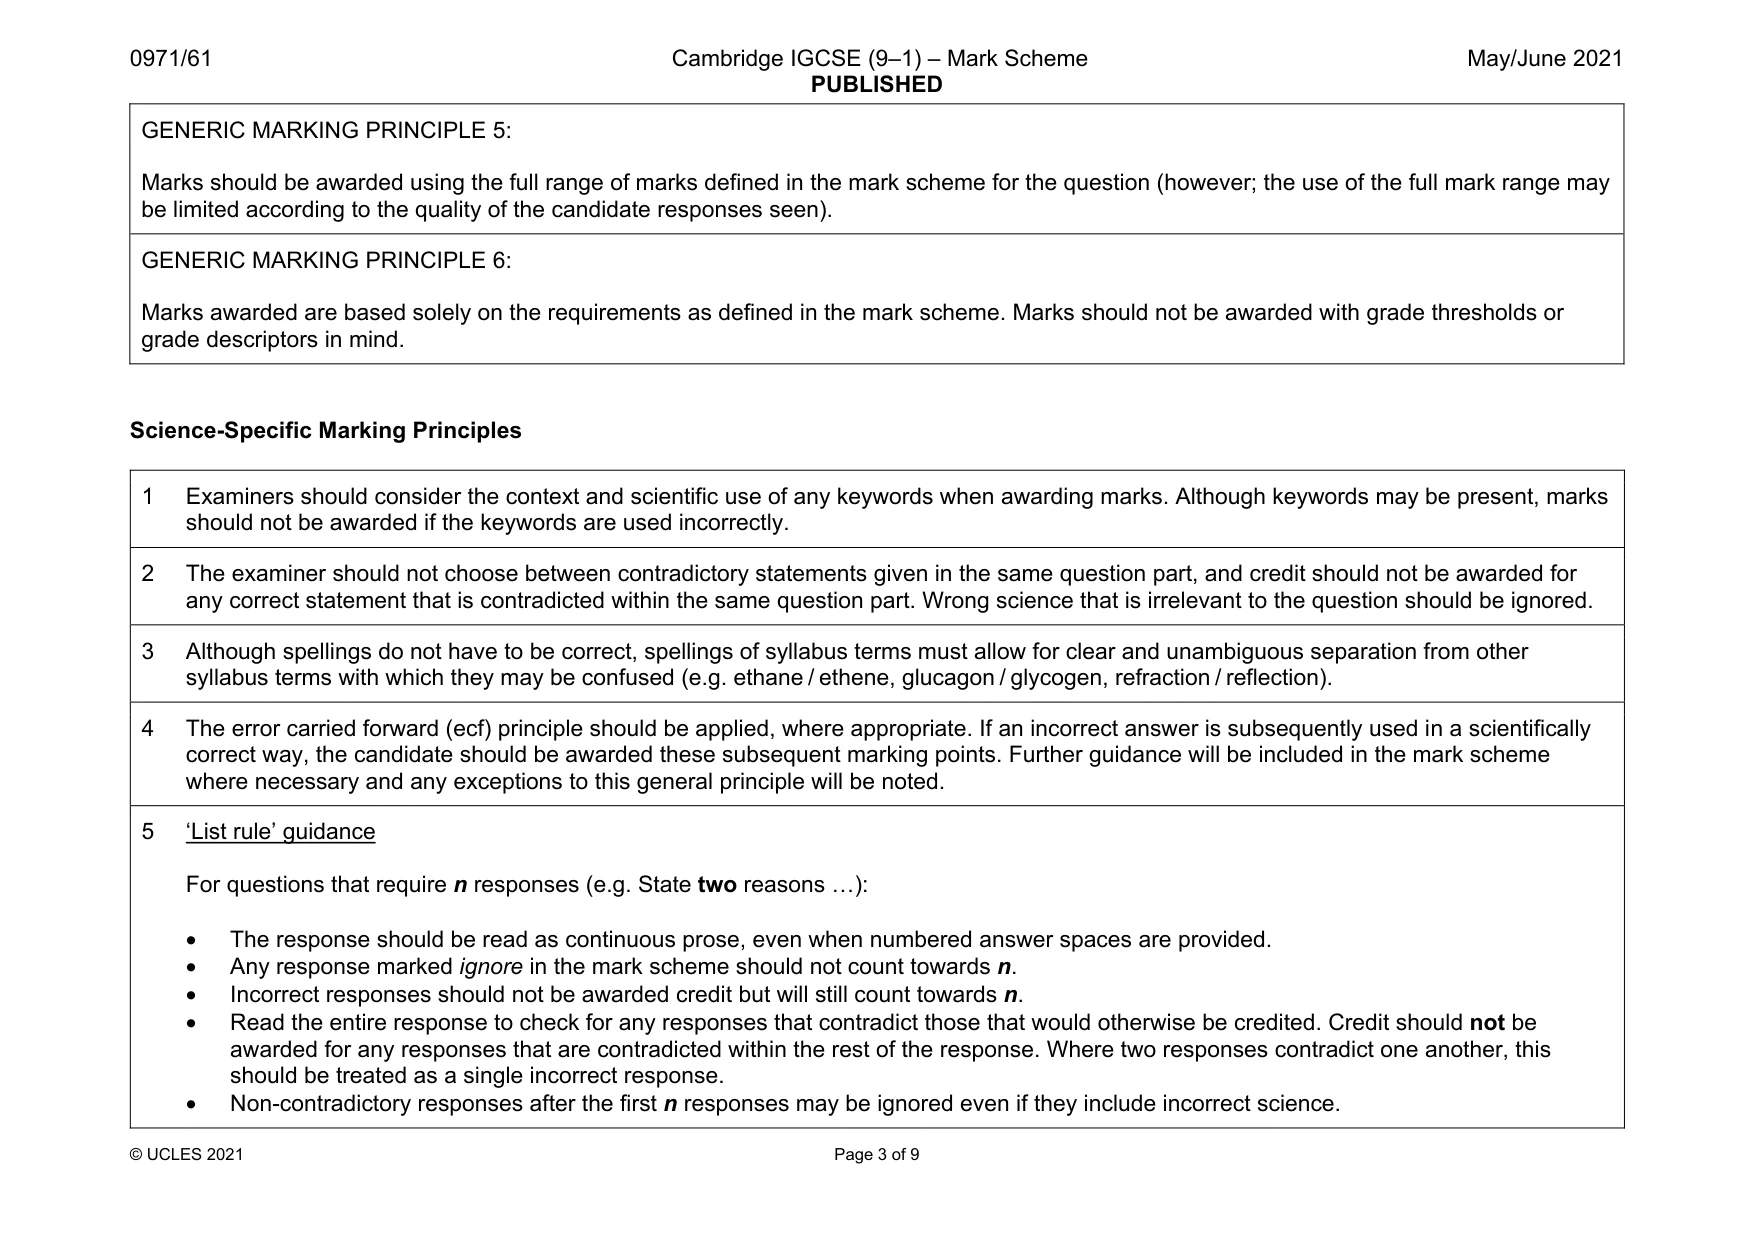
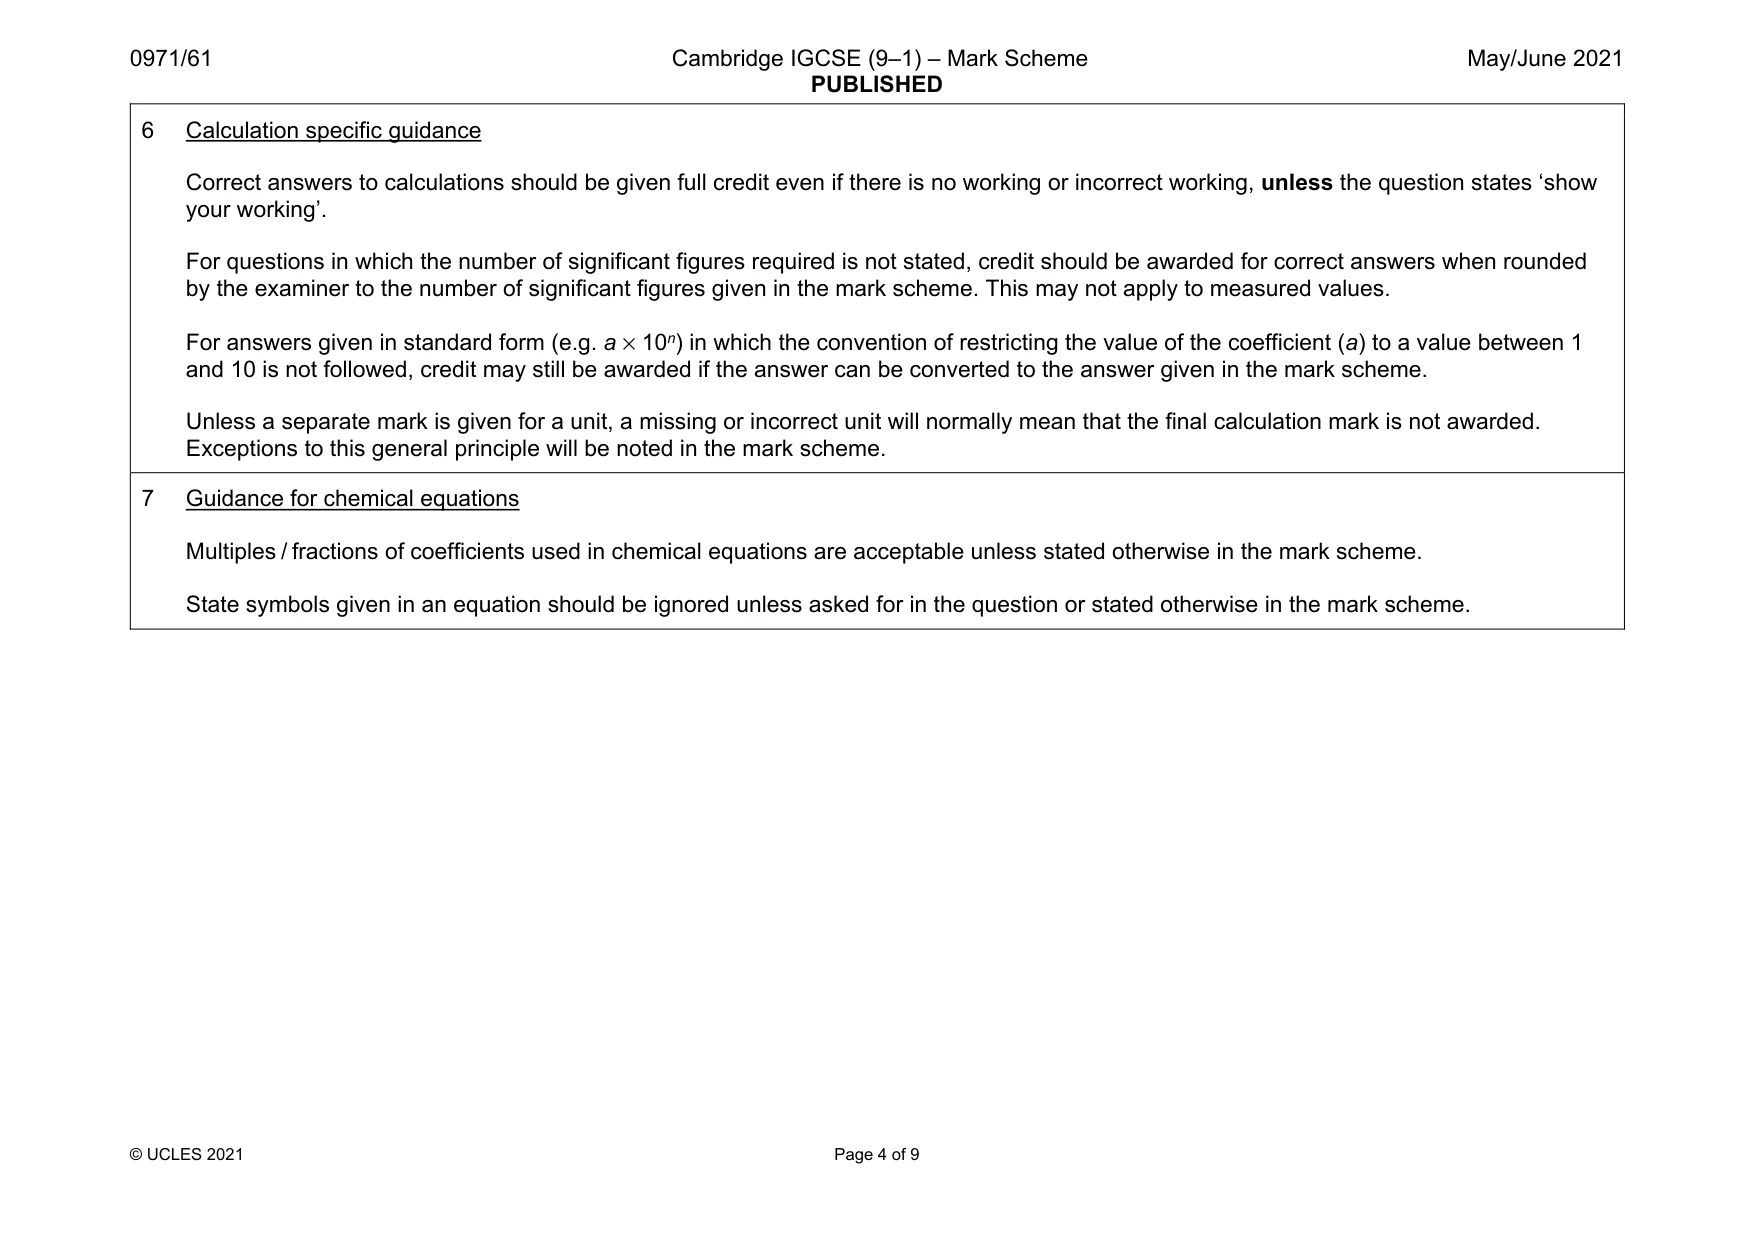
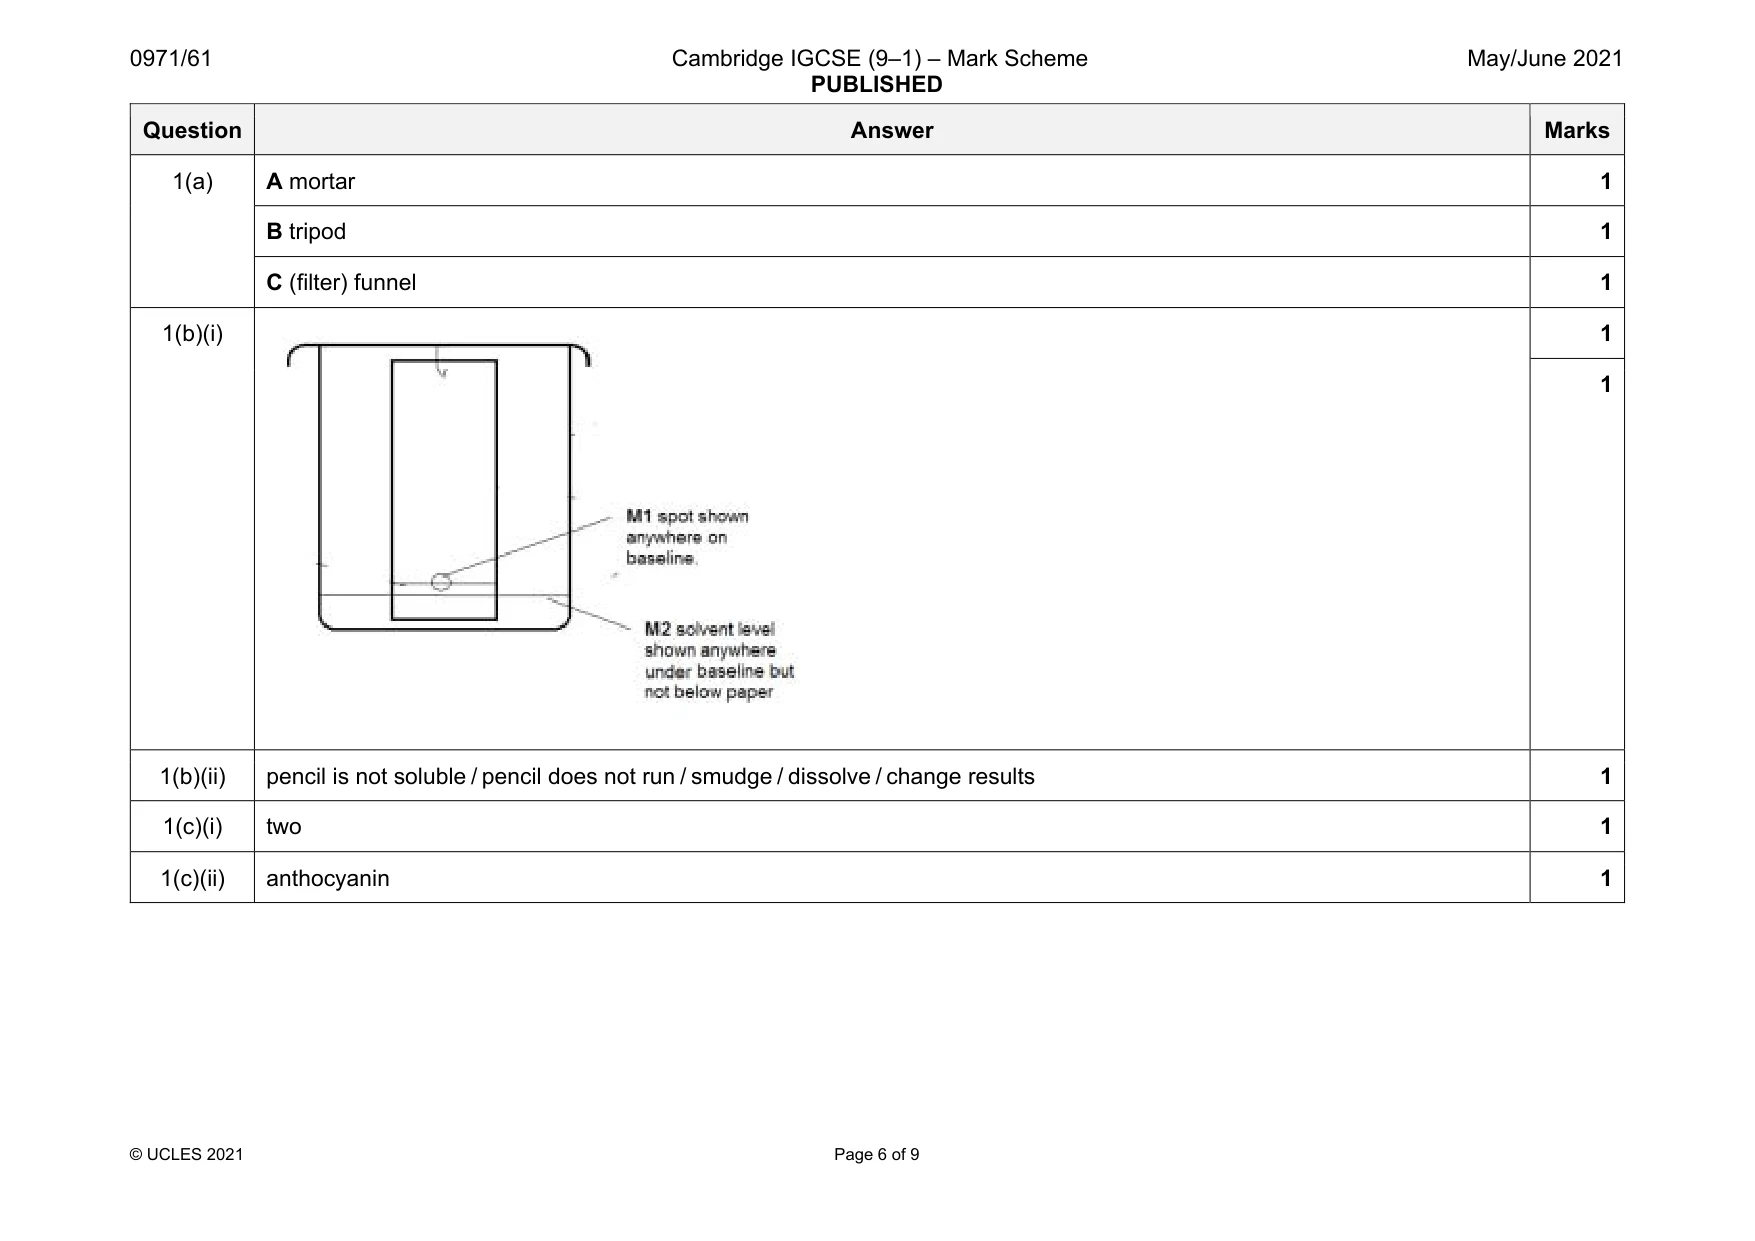
1 Many indicators are coloured substances obtained from plants. A student extracted the coloured substances from some berries using the method shown. C BA coloured solution the berries the crushed berries were the solid was removed were crushed heated in water to form from the coloured solution a coloured solution (a) Name the items of apparatus labelled A, B and C. A ................................................................................................................................................. B ................................................................................................................................................. C ................................................................................................................................................. [3] (b) The student analysed the coloured solution using chromatography. (i) Complete the diagram to show: ● where the spot of coloured solution should be placed on the paper ● the level of the solvent in the beaker. lid beaker baseline drawn in pencil chromatography paper [2] (ii) Explain why pencil is used to draw the baseline on the chromatography paper. ............................................................................................................................................. ....................................................................................................................................... [1] (c) The student made two chromatograms. After chromatography, one chromatogram was dipped in dilute hydrochloric acid and one was dipped in aqueous sodium hydroxide. The results are shown. red blue blue green chromatogram dipped in chromatogram dipped in dilute hydrochloric acid aqueous sodium hydroxide (i) Determine the number of coloured substances in the solution obtained from the berries. ....................................................................................................................................... [1] (ii) The table gives the colours of some indicators in acid and alkali. name of indicator colour in acid colour in alkali anthocyanin red blue bromothymol blue yellow blue congo red blue red methyl purple purple green Use the data in the table and the results to give a possible identity for one indicator in the berries. ....................................................................................................................................... [1] [Total: 8]
Mark scheme: 1(a) A mortar 1 B tripod 1 C (filter) funnel 1 1(b)(i) 1 1 1(b)(ii) pencil is not soluble / pencil does not run / smudge / dissolve / change results 1 1(c)(i) two 1 1(c)(ii) anthocyanin 1
Q2 · A student investigated the temperature decrease when sodium hydrogencarbonate reacts with…
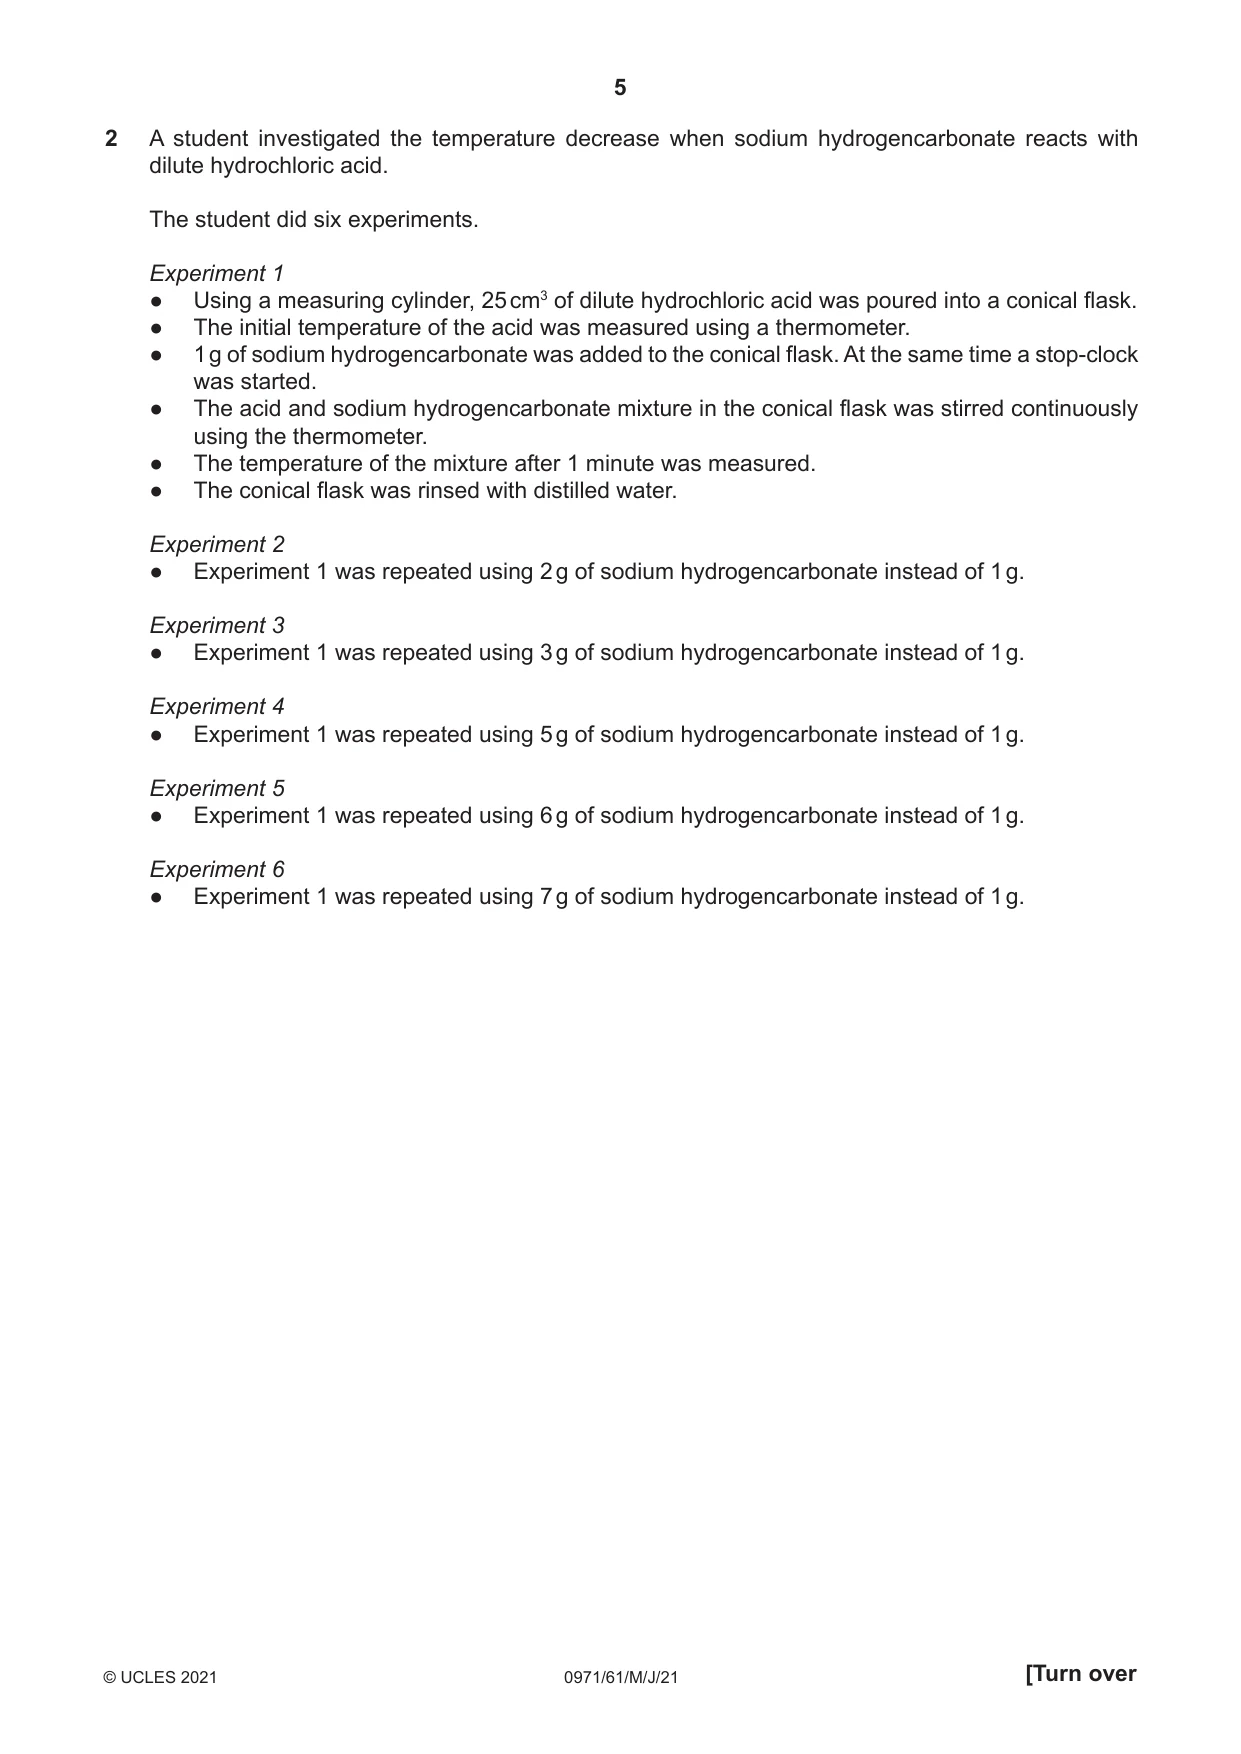
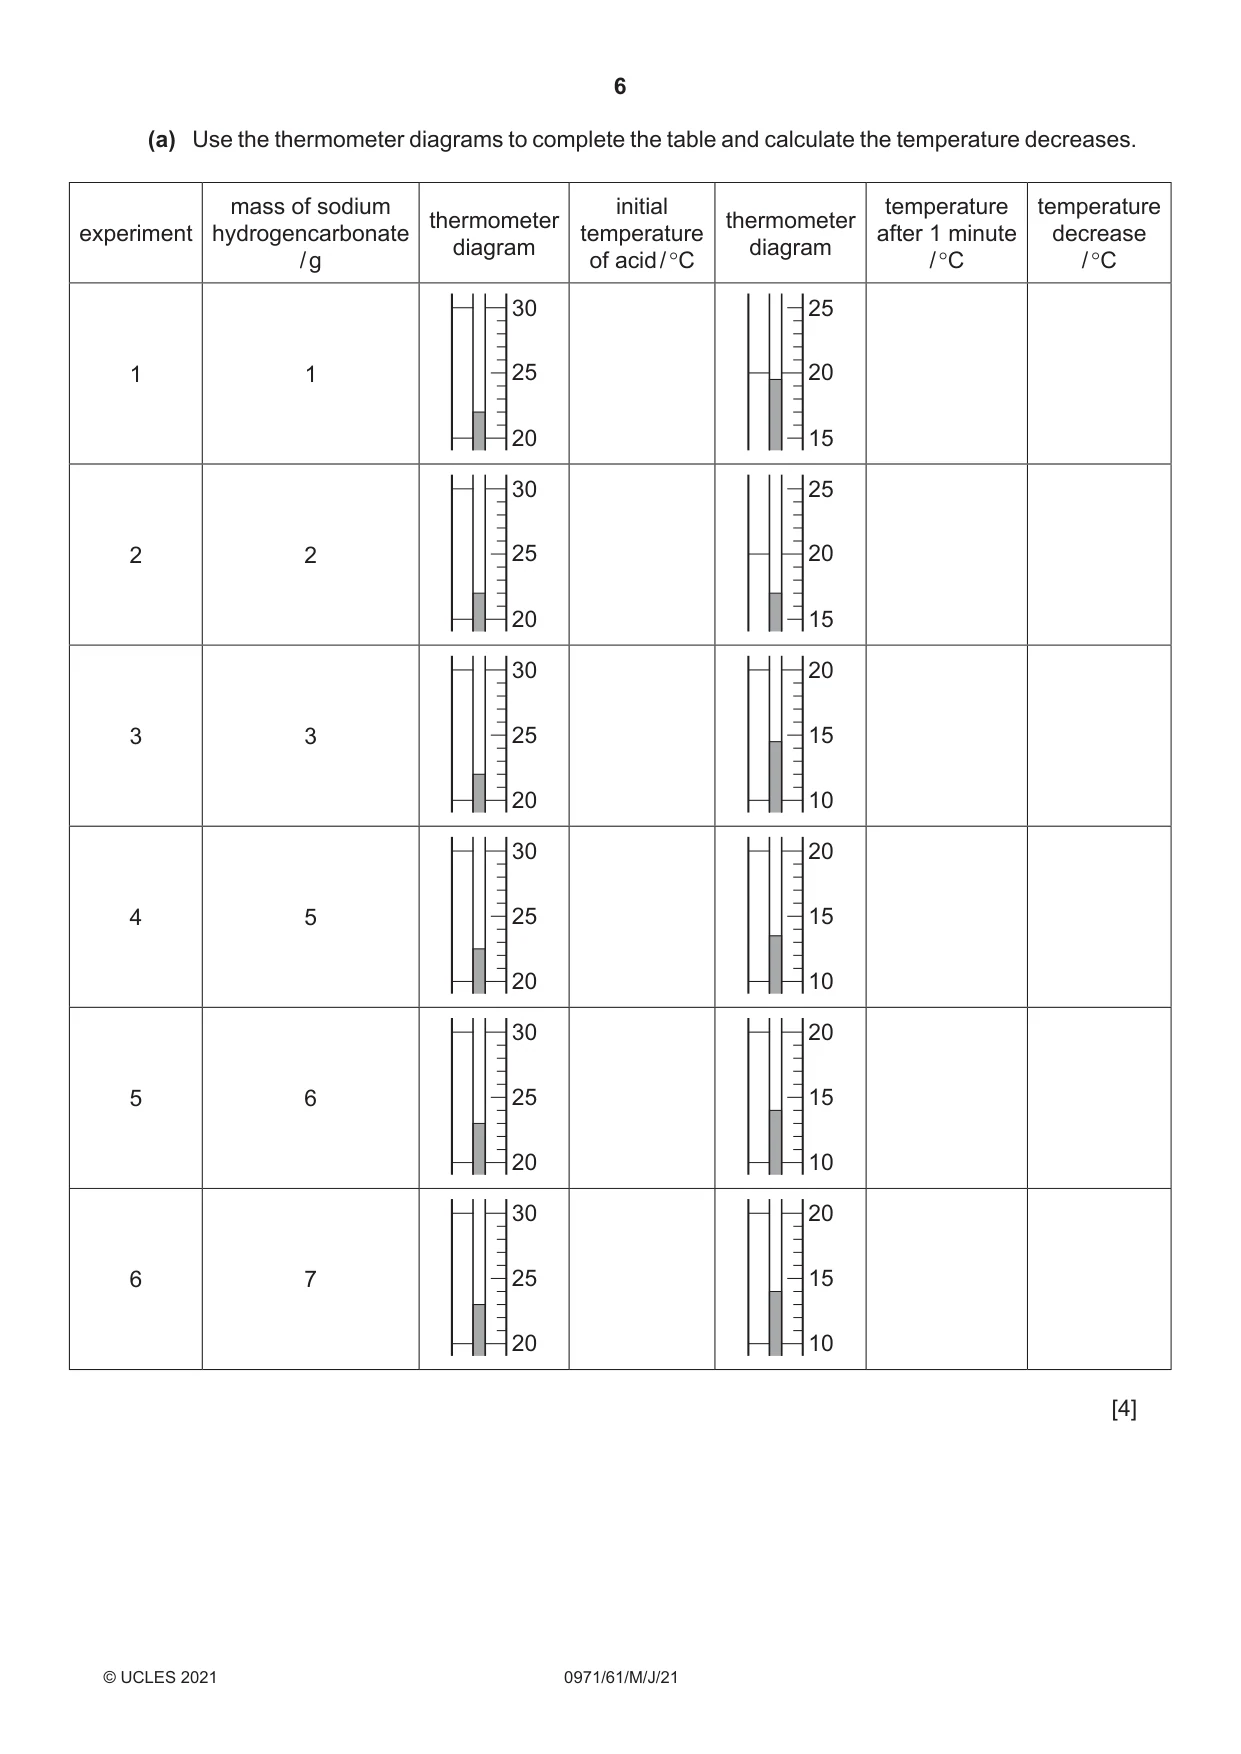
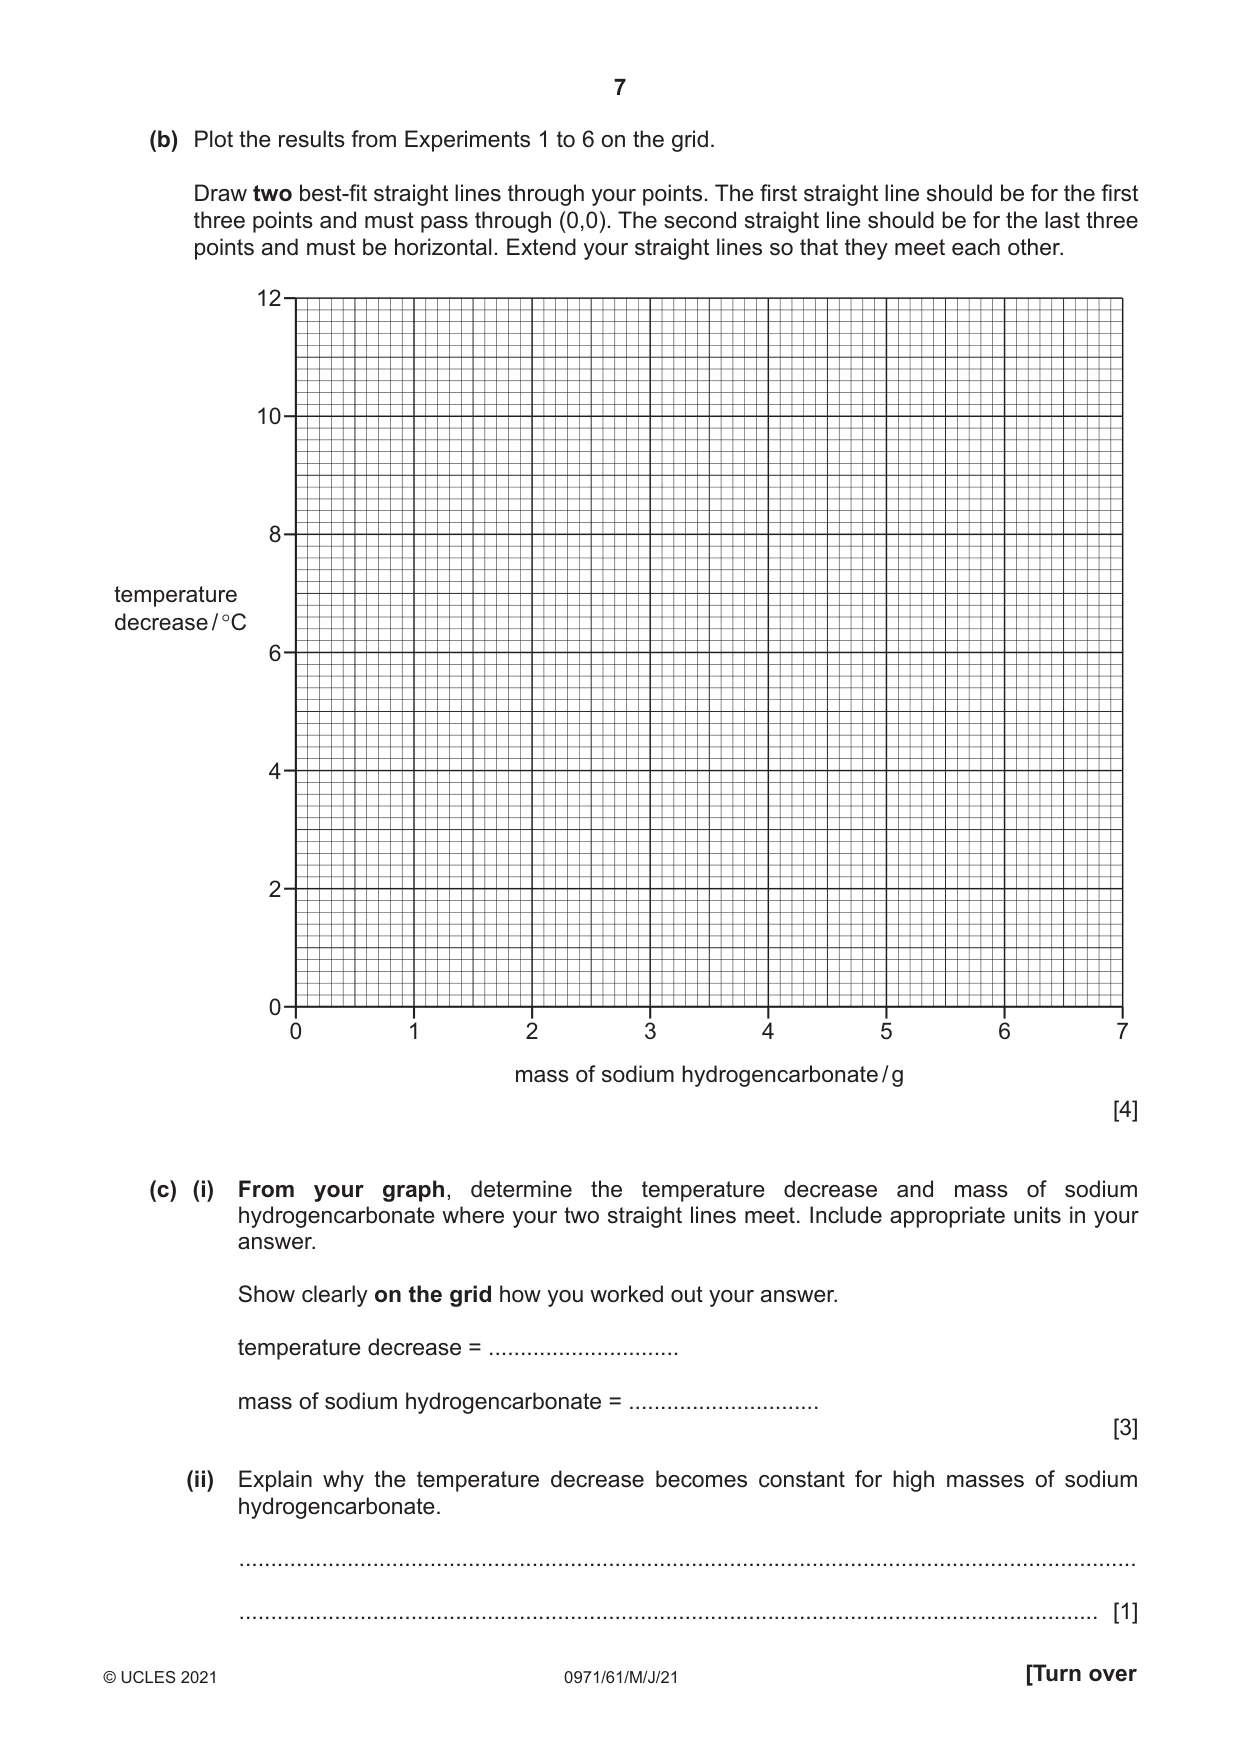
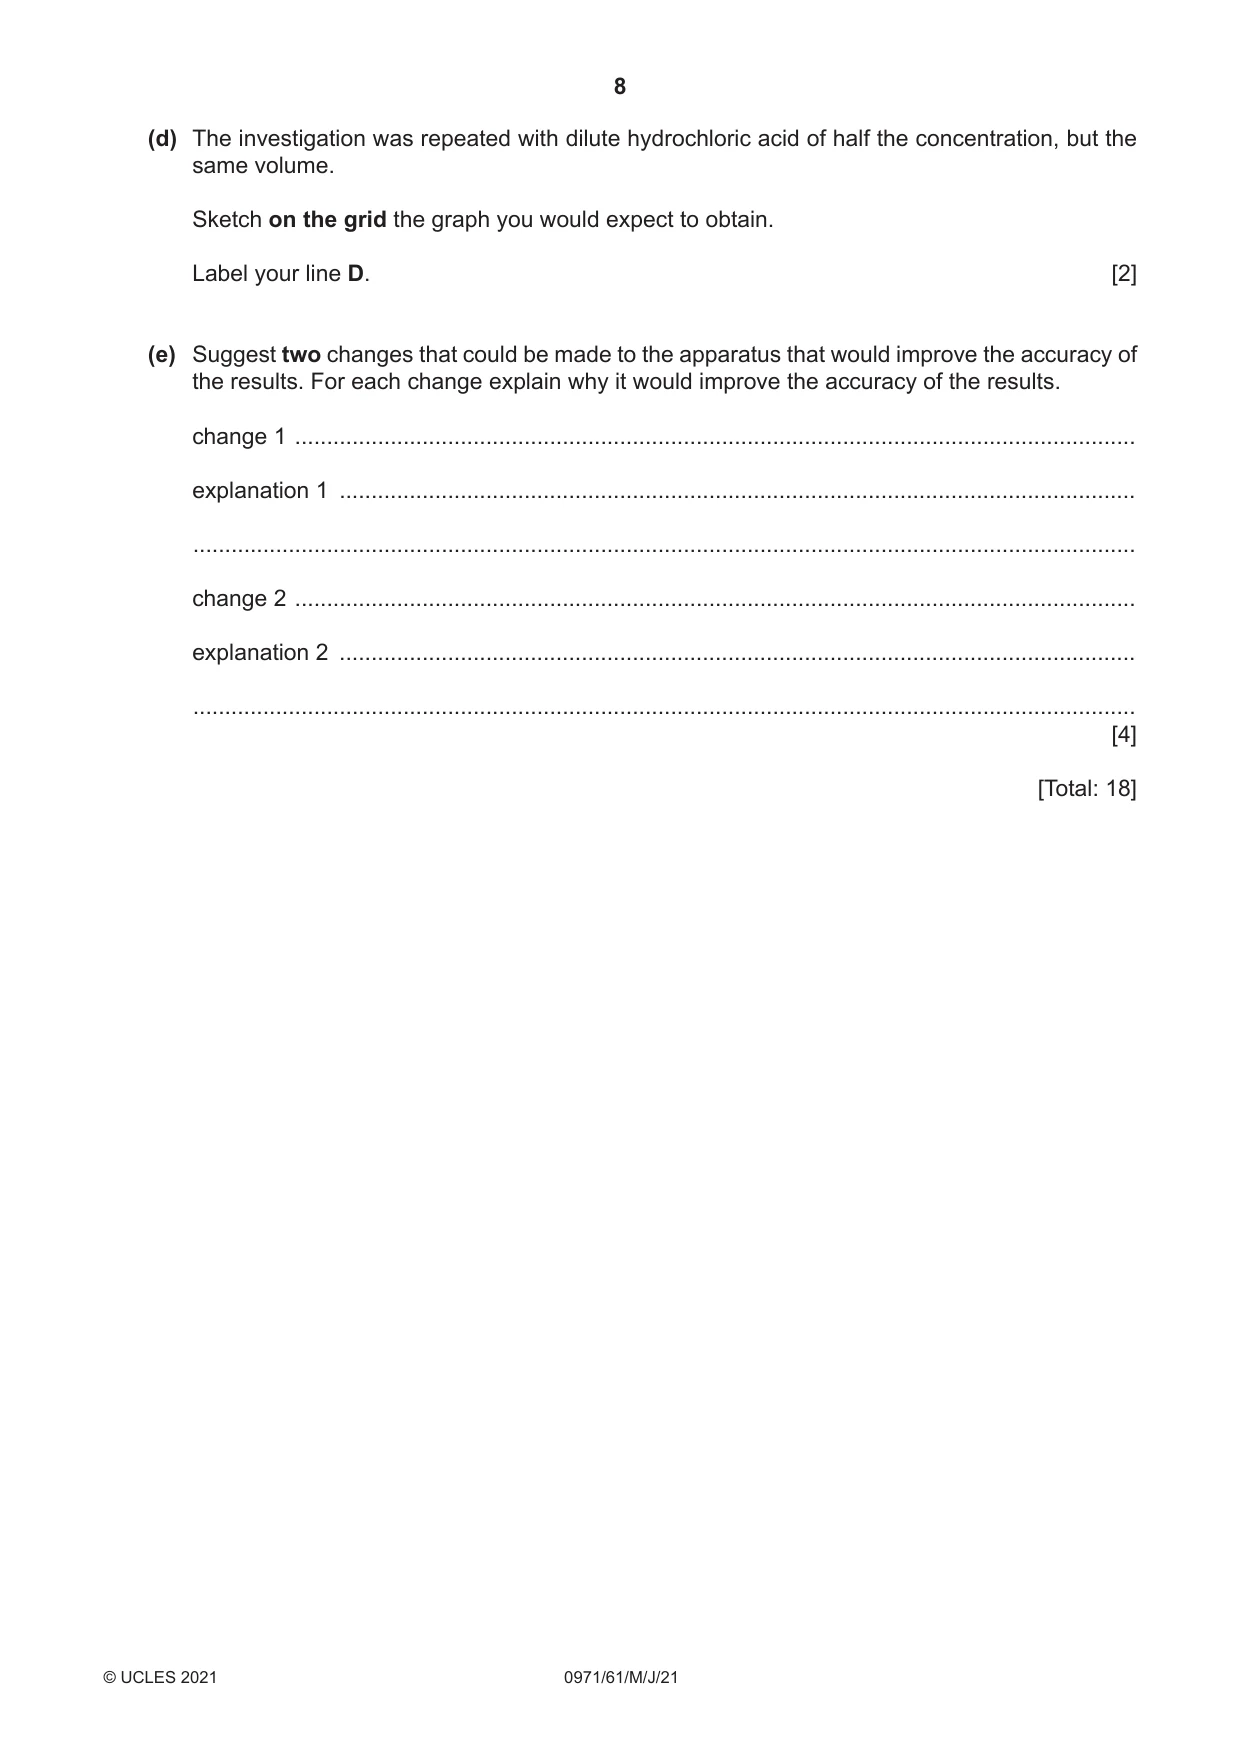
2 A student investigated the temperature decrease when sodium hydrogencarbonate reacts with dilute hydrochloric acid. The student did six experiments. Experiment 1 ● Using a measuring cylinder, 25 cm3 of dilute hydrochloric acid was poured into a conical flask. ● The initial temperature of the acid was measured using a thermometer. ● 1 g of sodium hydrogencarbonate was added to the conical flask. At the same time a stop‑clock was started. ● The acid and sodium hydrogencarbonate mixture in the conical flask was stirred continuously using the thermometer. ● The temperature of the mixture after 1 minute was measured. ● The conical flask was rinsed with distilled water. Experiment 2 ● Experiment 1 was repeated using 2 g of sodium hydrogencarbonate instead of 1 g. Experiment 3 ● Experiment 1 was repeated using 3 g of sodium hydrogencarbonate instead of 1 g. Experiment 4 ● Experiment 1 was repeated using 5 g of sodium hydrogencarbonate instead of 1 g. Experiment 5 ● Experiment 1 was repeated using 6 g of sodium hydrogencarbonate instead of 1 g. Experiment 6 ● Experiment 1 was repeated using 7 g of sodium hydrogencarbonate instead of 1 g. (a) Use the thermometer diagrams to complete the table and calculate the temperature decreases. mass of sodium initial temperature temperature thermometer thermometerexperiment hydrogencarbonate temperature after 1 minute decrease diagram diagram / g of acid / °C / °C / °C 30 25 1 1 25 20 20 15 30 25 2 2 25 20 20 15 30 20 3 3 25 15 20 10 30 20 4 5 25 15 20 10 30 20 5 6 25 15 20 10 30 20 6 7 25 15 20 10 [4] (b) Plot the results from Experiments 1 to 6 on the grid. Draw two best-fit straight lines through your points. The first straight line should be for the first three points and must pass through (0,0). The second straight line should be for the last three points and must be horizontal. Extend your straight lines so that they meet each other. 12 10 8 temperature decrease / °C 6 4 2 0 0 1 2 3 4 5 6 7 mass of sodium hydrogencarbonate / g [4] (c) (i) From your graph, determine the temperature decrease and mass of sodium hydrogencarbonate where your two straight lines meet. Include appropriate units in your answer. Show clearly on the grid how you worked out your answer. temperature decrease = .............................. mass of sodium hydrogencarbonate = .............................. [3] (ii) Explain why the temperature decrease becomes constant for high masses of sodium hydrogencarbonate. ............................................................................................................................................. ....................................................................................................................................... [1] (d) The investigation was repeated with dilute hydrochloric acid of half the concentration, but the same volume. Sketch on the grid the graph you would expect to obtain. Label your line D. [2] (e) Suggest two changes that could be made to the apparatus that would improve the accuracy of the results. For each change explain why it would improve the accuracy of the results. change 1 .................................................................................................................................... explanation 1 .............................................................................................................................. .................................................................................................................................................... change 2 .................................................................................................................................... explanation 2 .............................................................................................................................. .................................................................................................................................................... [4] [Total: 18]
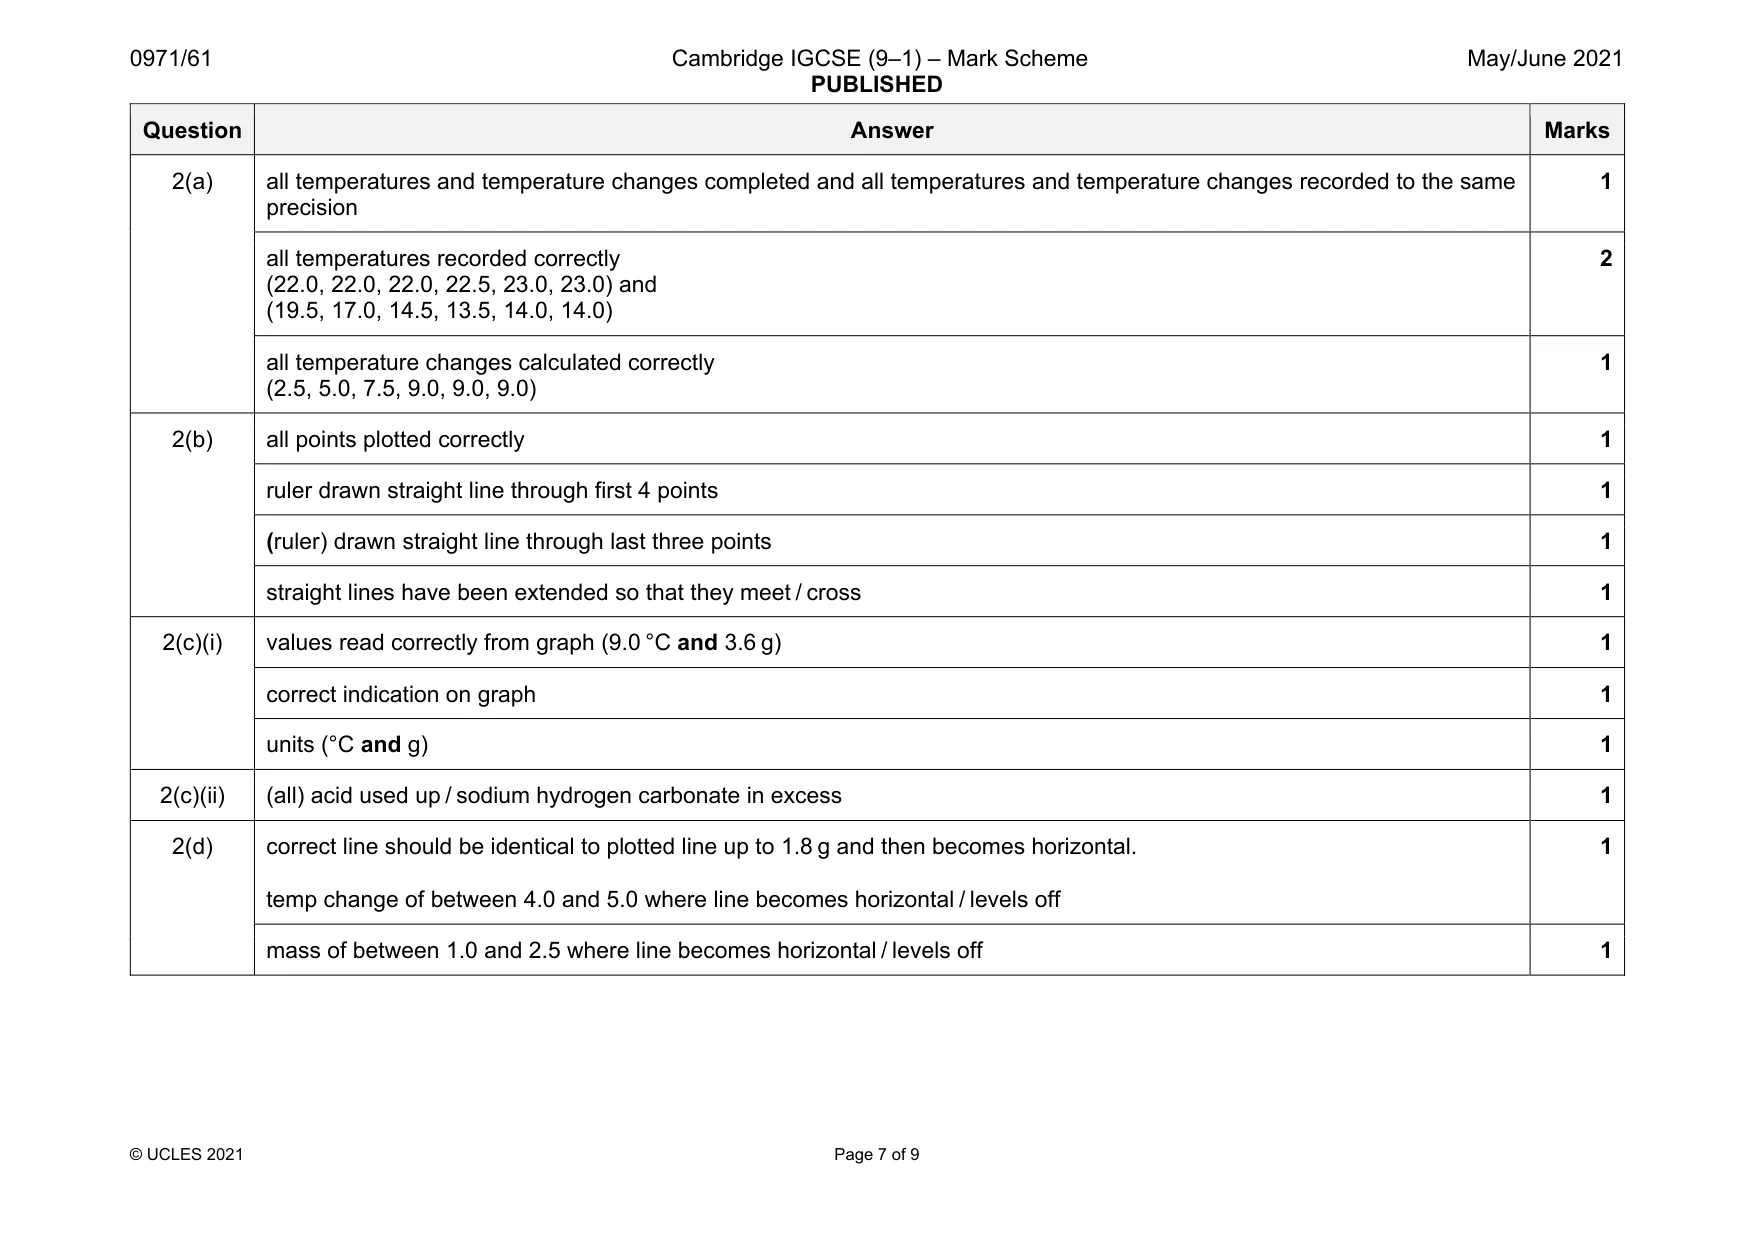
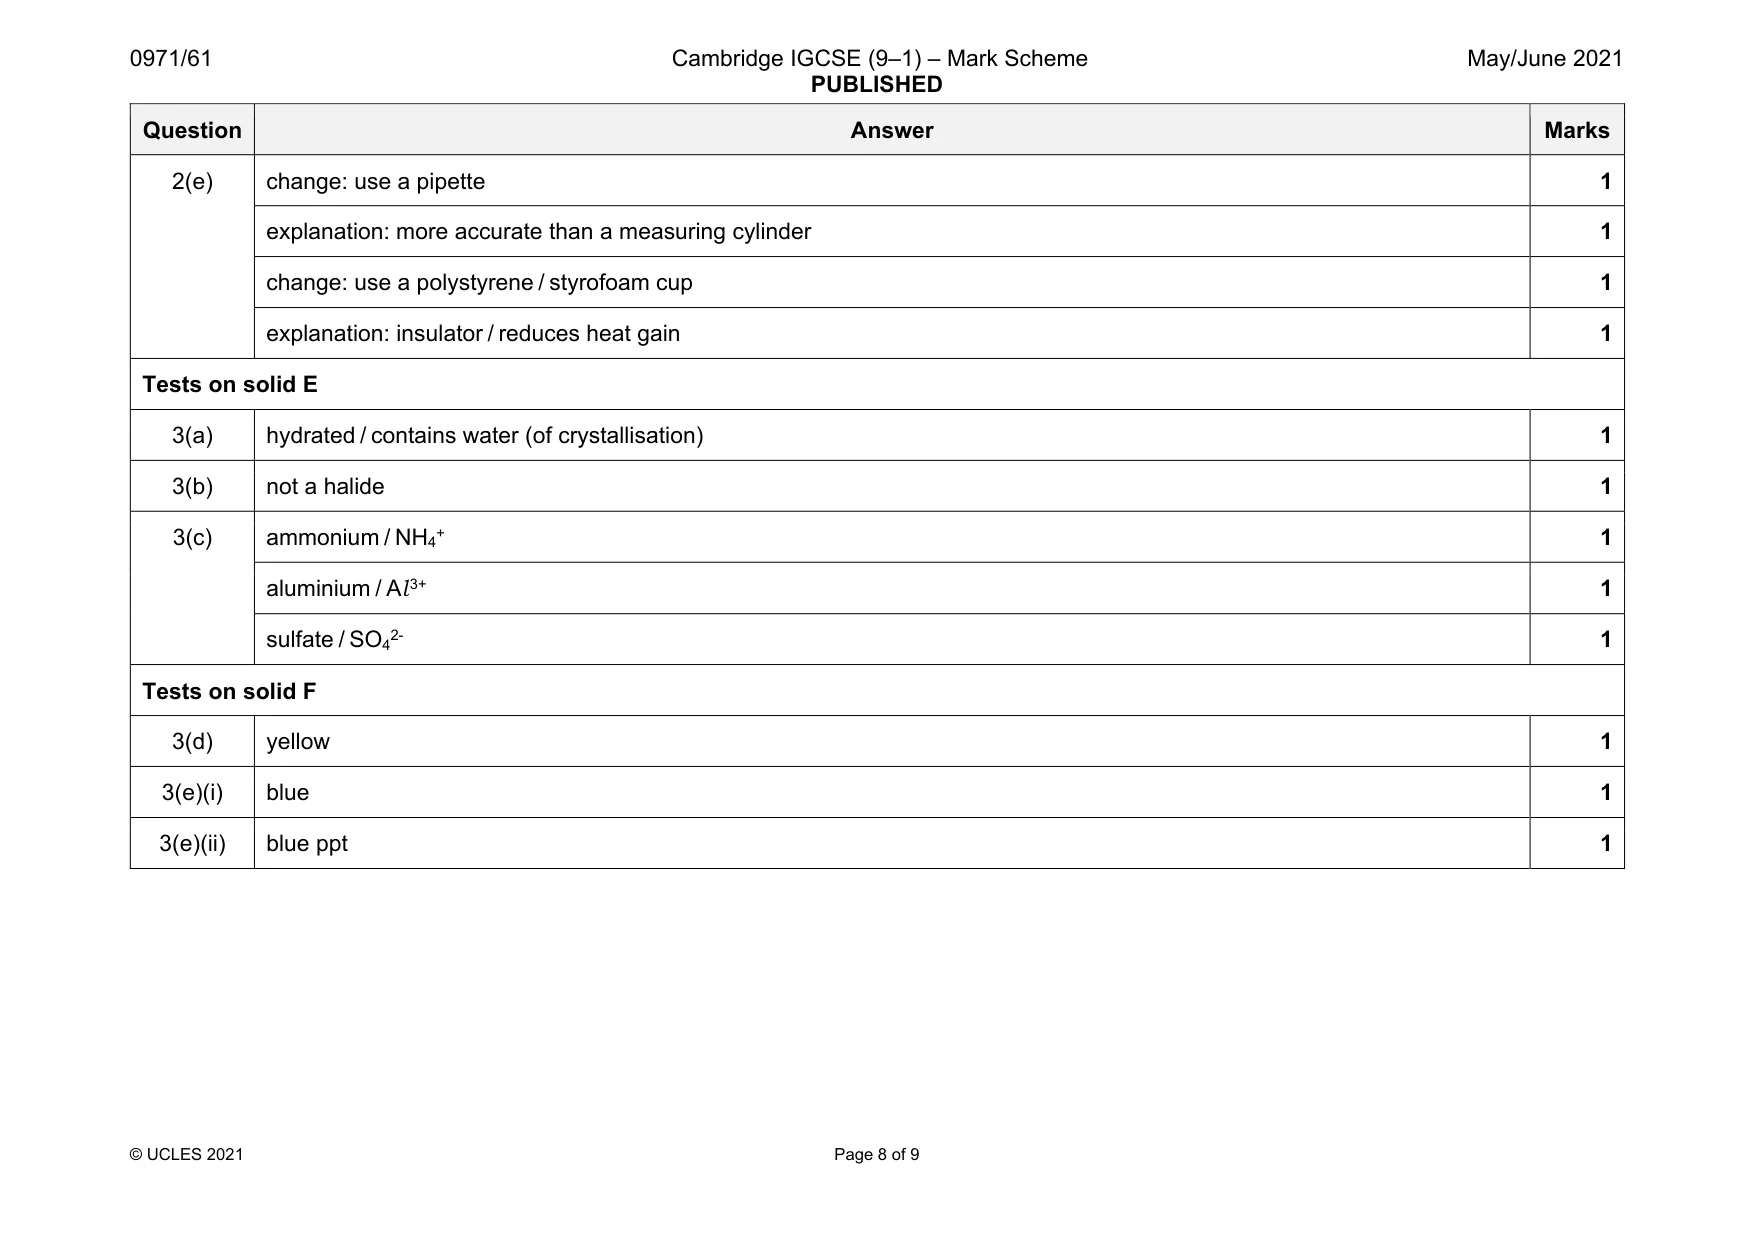
Mark scheme: 2(a) all temperatures and temperature changes completed and all temperatures and temperature changes recorded to the same precision 1 all temperatures recorded correctly (22.0, 22.0, 22.0, 22.5, 23.0, 23.0) and (19.5, 17.0, 14.5, 13.5, 14.0, 14.0) 2 all temperature changes calculated correctly (2.5, 5.0, 7.5, 9.0, 9.0, 9.0) 1 2(b) all points plotted correctly 1 ruler drawn straight line through first 4 points 1 (ruler) drawn straight line through last three points 1 straight lines have been extended so that they meet / cross 1 2(c)(i) values read correctly from graph (9.0 °C and 3.6 g) 1 correct indication on graph 1 units (°C and g) 1 2(c)(ii) (all) acid used up / sodium hydrogen carbonate in excess 1 2(d) correct line should be identical to plotted line up to 1.8 g and then becomes horizontal. temp change of between 4.0 and 5.0 where line becomes horizontal / levels off 1 mass of between 1.0 and 2.5 where line becomes horizontal / levels off 1 Question Answer Marks 2(e) change: use a pipette 1 explanation: more accurate than a measuring cylinder 1 change: use a polystyrene / styrofoam cup 1 explanation: insulator / reduces heat gain 1 Tests on solid E
Q3 · Solid E and solution F were analysed
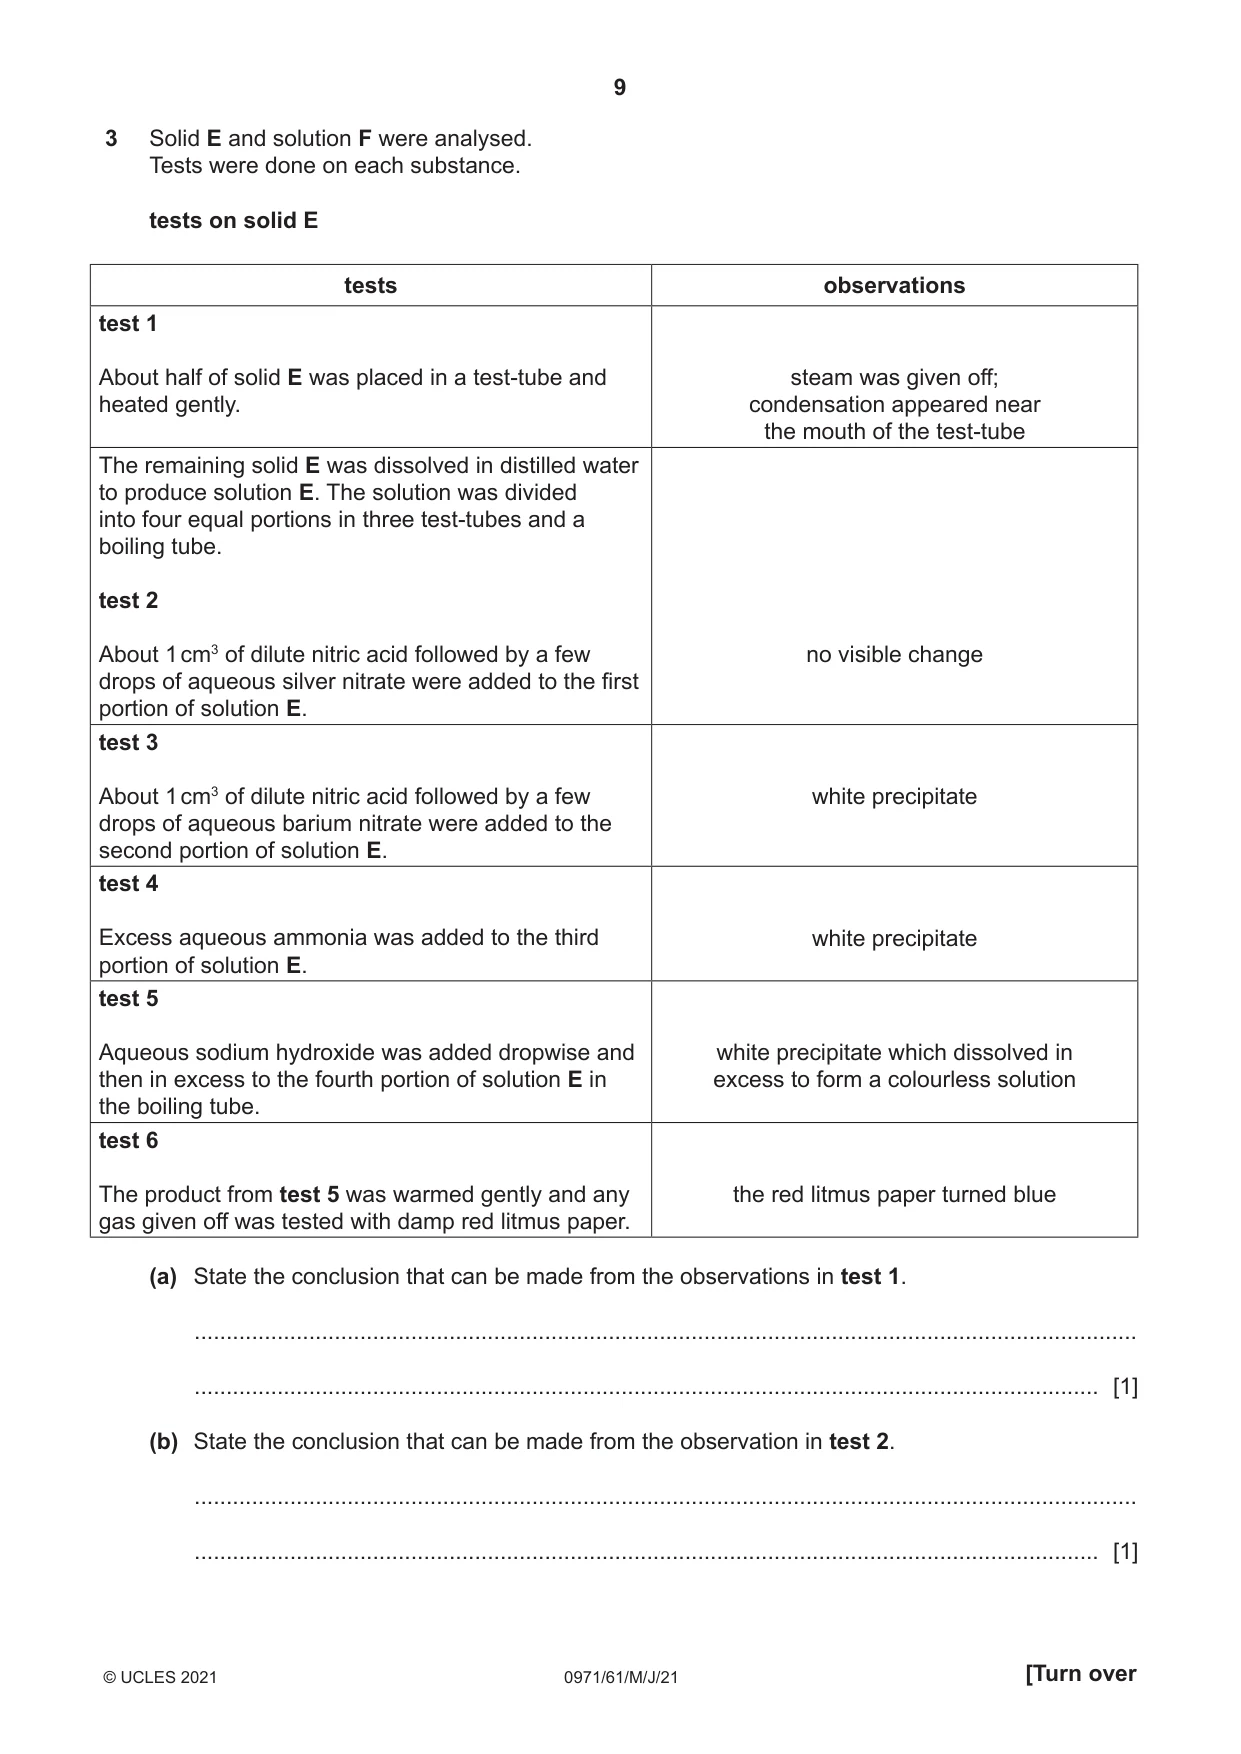
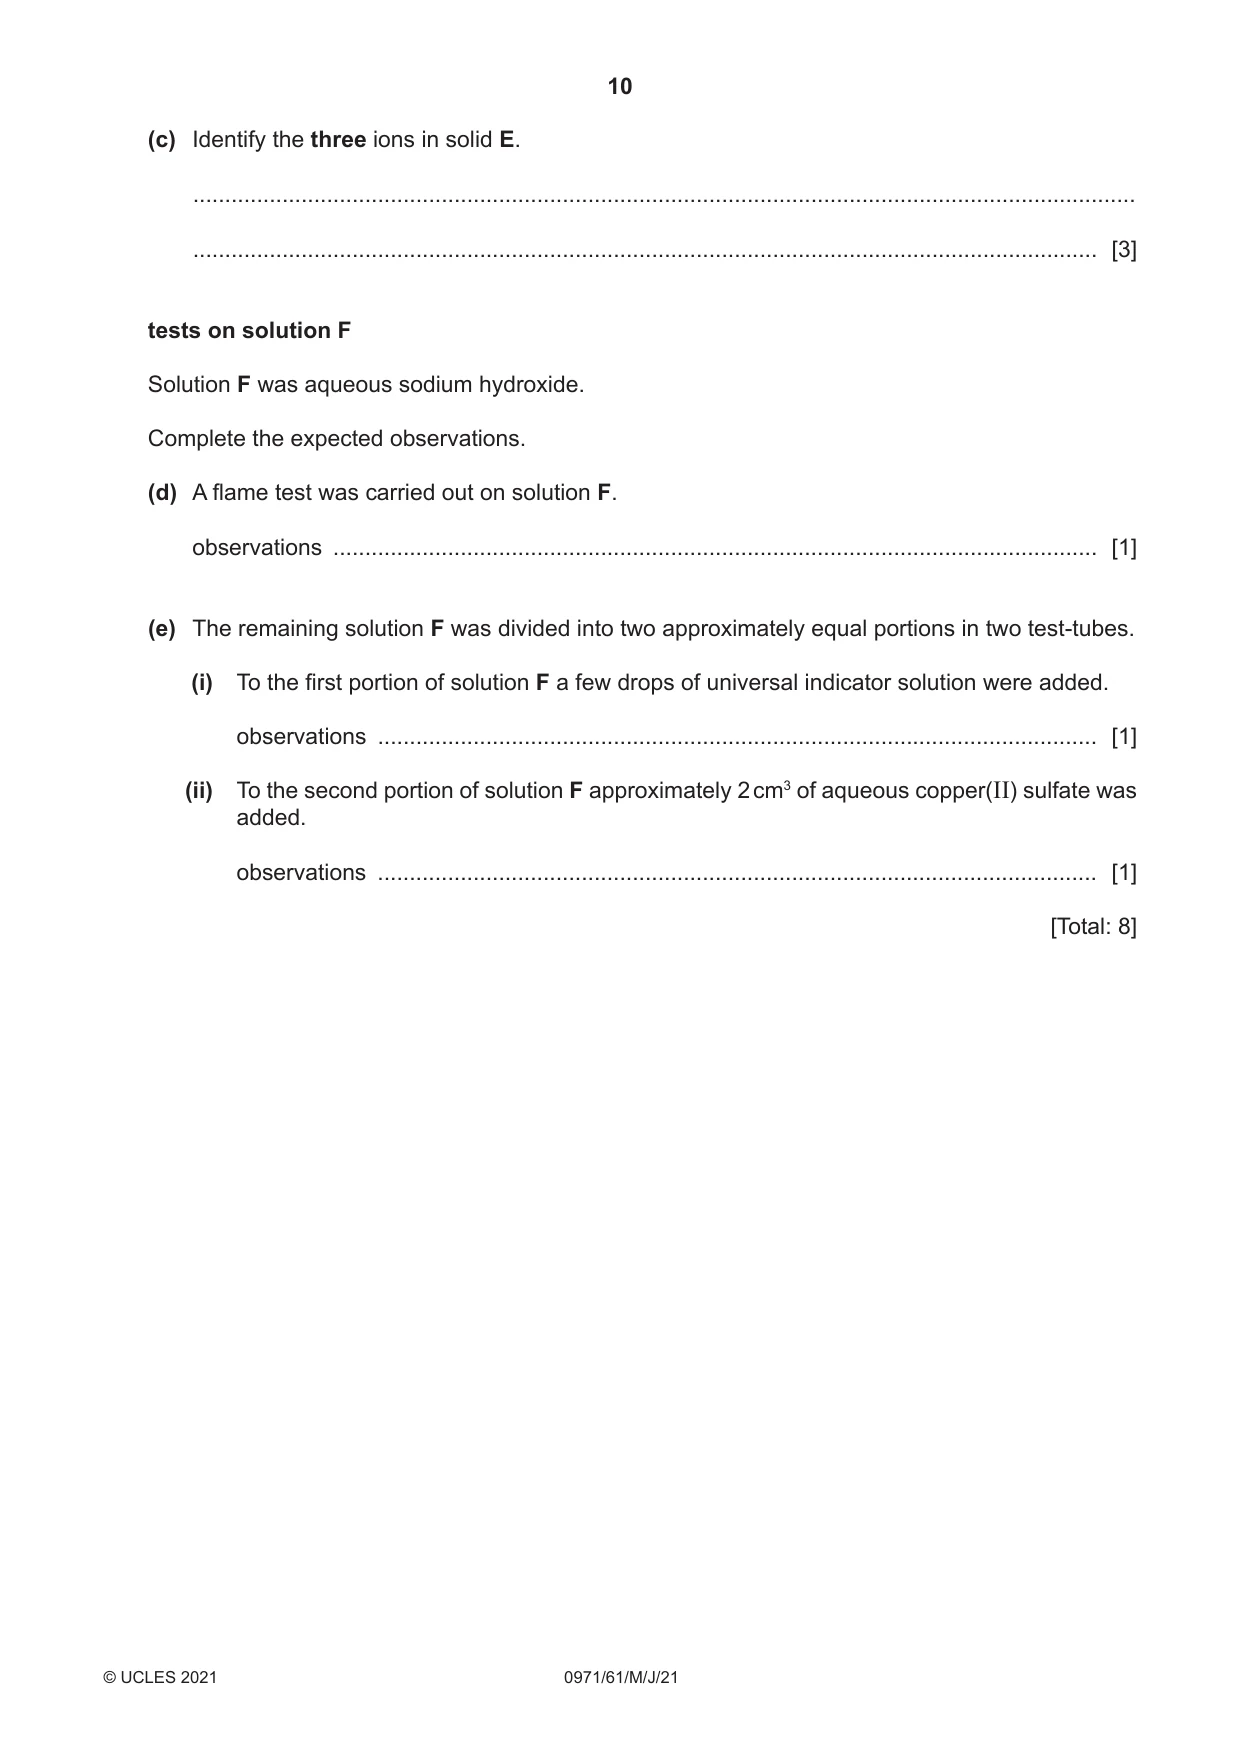
3 Solid E and solution F were analysed. Tests were done on each substance. tests on solid E tests observations test 1 About half of solid E was placed in a test-tube and steam was given off; heated gently. condensation appeared near the mouth of the test-tube The remaining solid E was dissolved in distilled water to produce solution E. The solution was divided into four equal portions in three test‑tubes and a boiling tube. test 2 About 1 cm3 of dilute nitric acid followed by a few no visible change drops of aqueous silver nitrate were added to the first portion of solution E. test 3 About 1 cm3 of dilute nitric acid followed by a few white precipitate drops of aqueous barium nitrate were added to the second portion of solution E. test 4 Excess aqueous ammonia was added to the third white precipitate portion of solution E. test 5 Aqueous sodium hydroxide was added dropwise and white precipitate which dissolved in then in excess to the fourth portion of solution E in excess to form a colourless solution the boiling tube. test 6 The product from test 5 was warmed gently and any the red litmus paper turned blue gas given off was tested with damp red litmus paper. (a) State the conclusion that can be made from the observations in test 1. .................................................................................................................................................... .............................................................................................................................................. [1] (b) State the conclusion that can be made from the observation in test 2. .................................................................................................................................................... .............................................................................................................................................. [1] (c) Identify the three ions in solid E. .................................................................................................................................................... .............................................................................................................................................. [3] tests on solution F Solution F was aqueous sodium hydroxide. Complete the expected observations. (d) A flame test was carried out on solution F. observations ......................................................................................................................... [1] (e) The remaining solution F was divided into two approximately equal portions in two test‑tubes. (i) To the first portion of solution F a few drops of universal indicator solution were added. observations .................................................................................................................. [1] (ii) To the second portion of solution F approximately 2 cm3 of aqueous copper(II) sulfate was added. observations .................................................................................................................. [1] [Total: 8]
Mark scheme: 3(a) hydrated / contains water (of crystallisation) 1 3(b) not a halide 1 3(c) ammonium / NH4+ 1 aluminium / Al 3+ 1 sulfate / SO42- 1 Tests on solid F 3(d) yellow 1 3(e)(i) blue 1 3(e)(ii) blue ppt 1
Q4 · Dilute hydrochloric acid reacts with calcium carbonate to make carbon dioxide gas
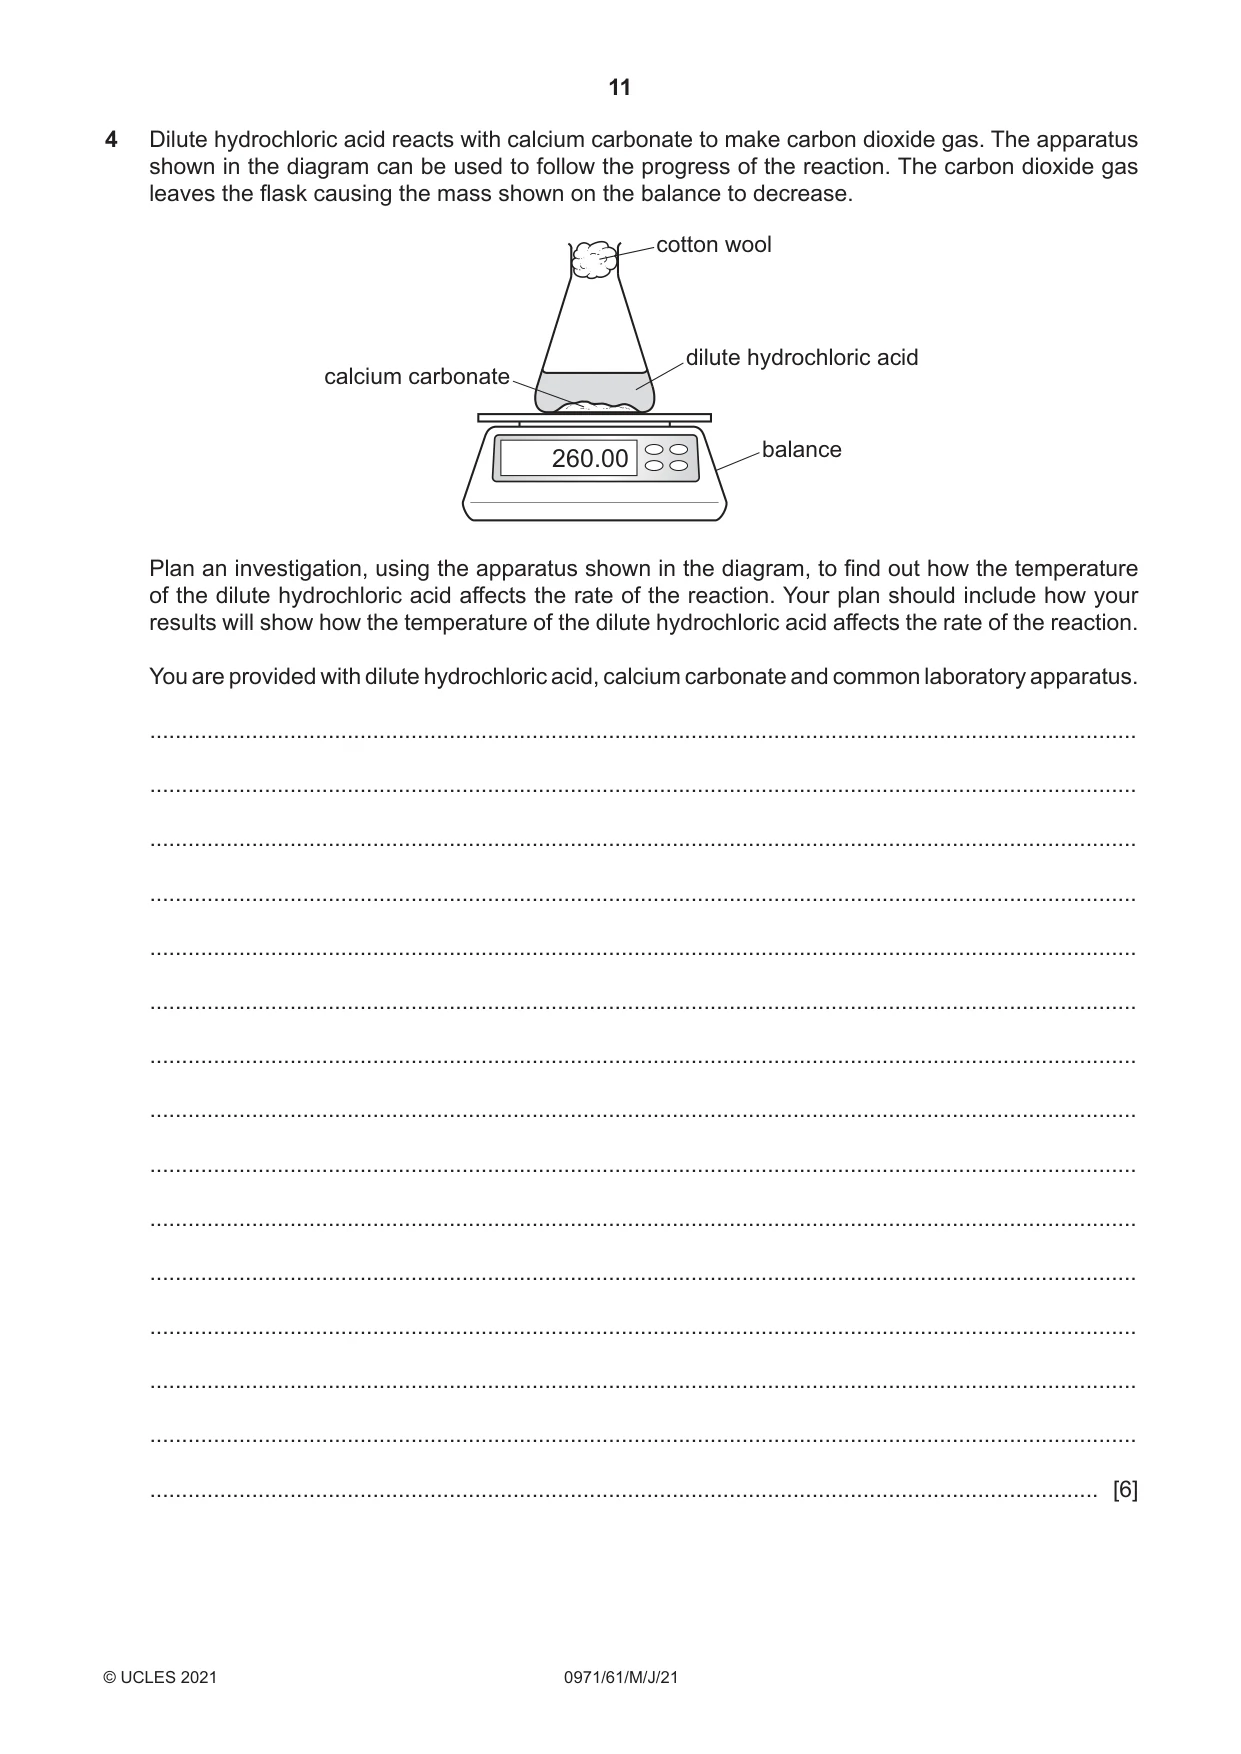
4 Dilute hydrochloric acid reacts with calcium carbonate to make carbon dioxide gas. The apparatus shown in the diagram can be used to follow the progress of the reaction. The carbon dioxide gas leaves the flask causing the mass shown on the balance to decrease. cotton wool dilute hydrochloric acid calcium carbonate balance 260.00 Plan an investigation, using the apparatus shown in the diagram, to find out how the temperature of the dilute hydrochloric acid affects the rate of the reaction. Your plan should include how your results will show how the temperature of the dilute hydrochloric acid affects the rate of the reaction. You are provided with dilute hydrochloric acid, calcium carbonate and common laboratory apparatus. ........................................................................................................................................................... ........................................................................................................................................................... ........................................................................................................................................................... ........................................................................................................................................................... ........................................................................................................................................................... ........................................................................................................................................................... ........................................................................................................................................................... ........................................................................................................................................................... ........................................................................................................................................................... ........................................................................................................................................................... ........................................................................................................................................................... ........................................................................................................................................................... ........................................................................................................................................................... ........................................................................................................................................................... ..................................................................................................................................................... [6]
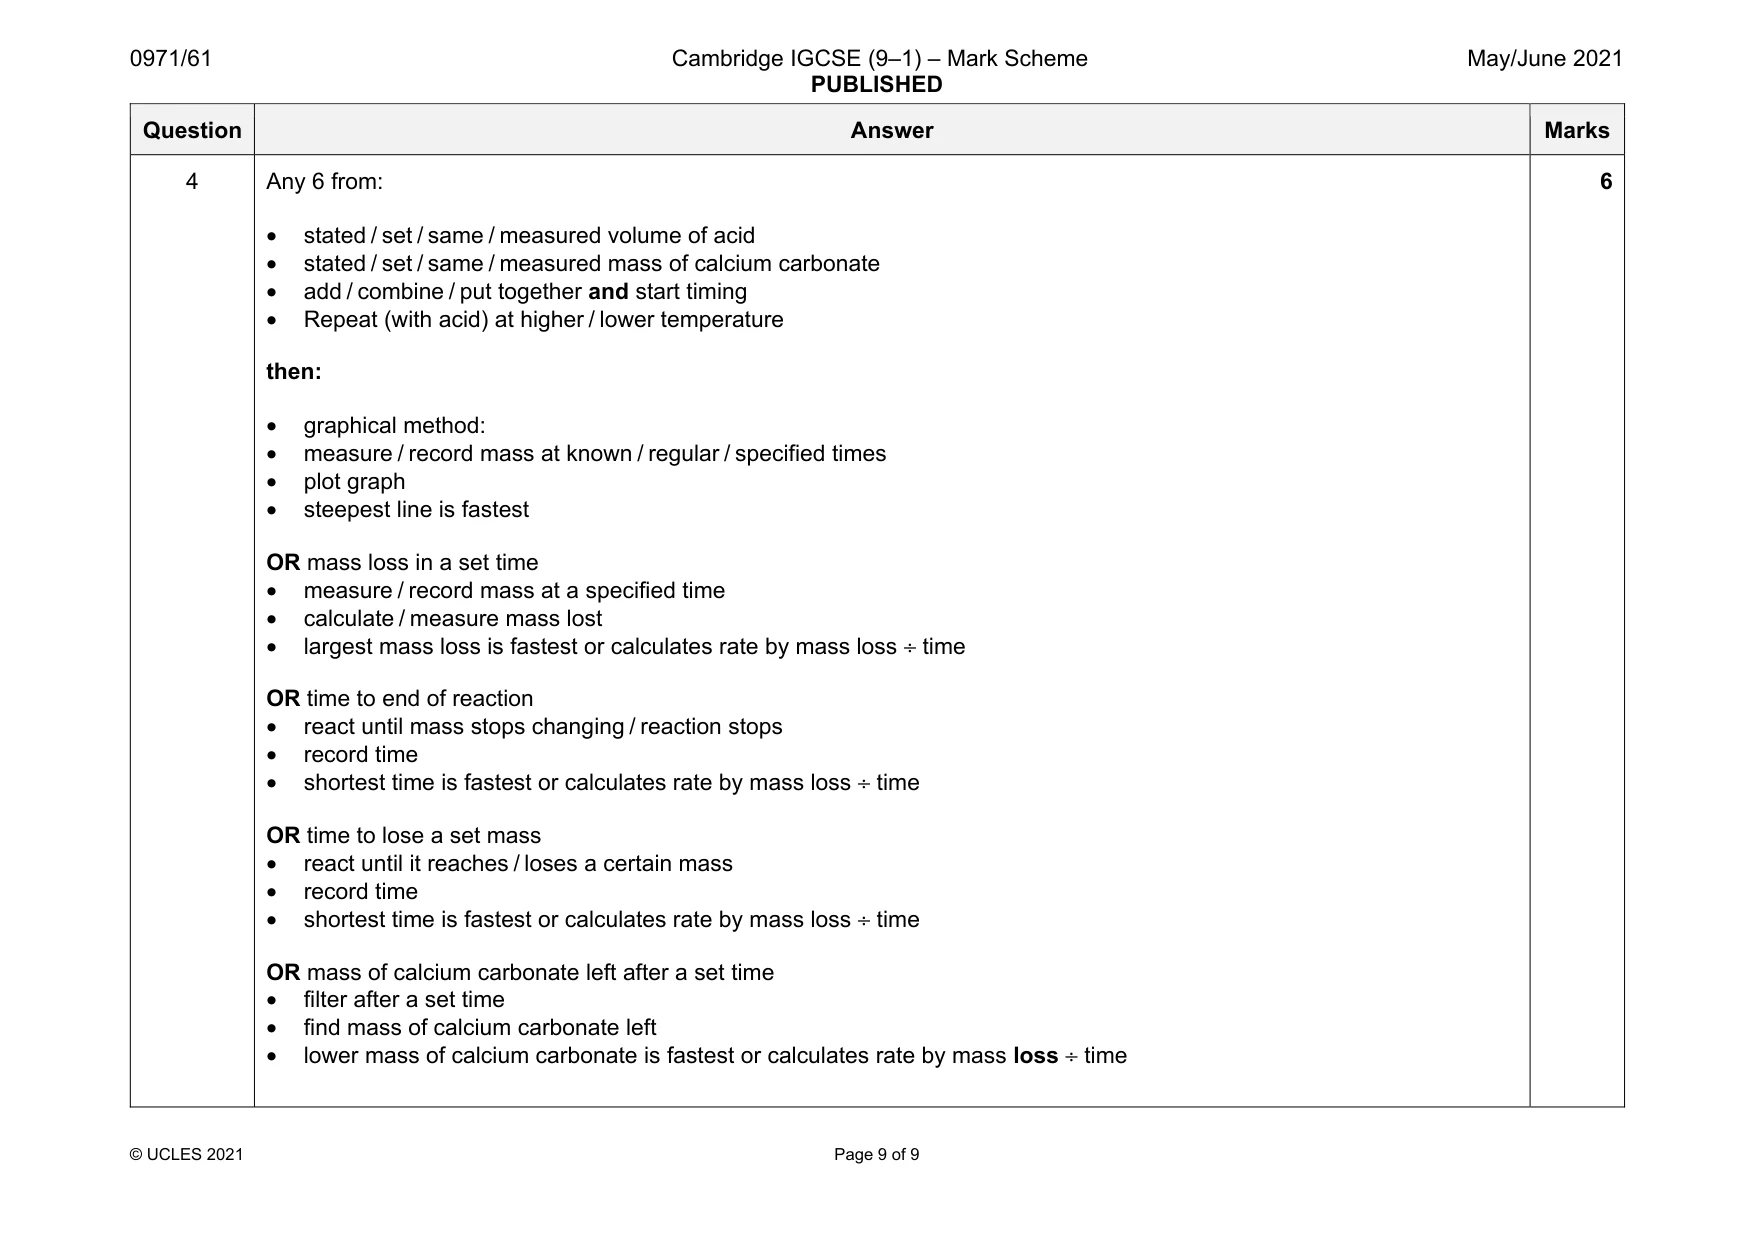
Mark scheme: 4 Any 6 from: • stated / set / same / measured volume of acid • stated / set / same / measured mass of calcium carbonate • add / combine / put together and start timing • Repeat (with acid) at higher / lower temperature then: • graphical method: • measure / record mass at known / regular / specified times • plot graph • steepest line is fastest OR mass loss in a set time • measure / record mass at a specified time • calculate / measure mass lost • largest mass loss is fastest or calculates rate by mass loss ÷ time OR time to end of reaction • react until mass stops changing / reaction stops • record time • shortest time is fastest or calculates rate by mass loss ÷ time OR time to lose a set mass • react until it reaches / loses a certain mass • record time • shortest time is fastest or calculates rate by mass loss ÷ time OR mass of calcium carbonate left after a set time • filter after a set time • find mass of calcium carbonate left • lower mass of calcium carbonate is fastest or calculates rate by mass loss ÷ time 6
What was in this paper
The subtopics covered by these 4 questions, and how many questions each got. Open one in a new tab to see every Cambridge question on it.
What you needed in this session
Cambridge’s own grade thresholds for 2021 May/June, Paper 6 · Variant 1. A higher threshold means an easier paper — the bar moves with how the cohort did.