Cambridge IGCSE Biology (9-1) 0970 — 2025 May/June Paper 6 · Variant 2
0970/62/M/J/25 · 3 questions · 40 marks · ≈45 min
The question paper and its mark scheme, free to read here and free to download. This is Cambridge’s own paper, exactly as it was sat.
Question paper16 pages






Mark scheme12 pages
Answers below. Sit the paper first if you are practising.
Questions as text
Q1 · A student investigated the effect of the concentration of salt solutions on osmosis in…
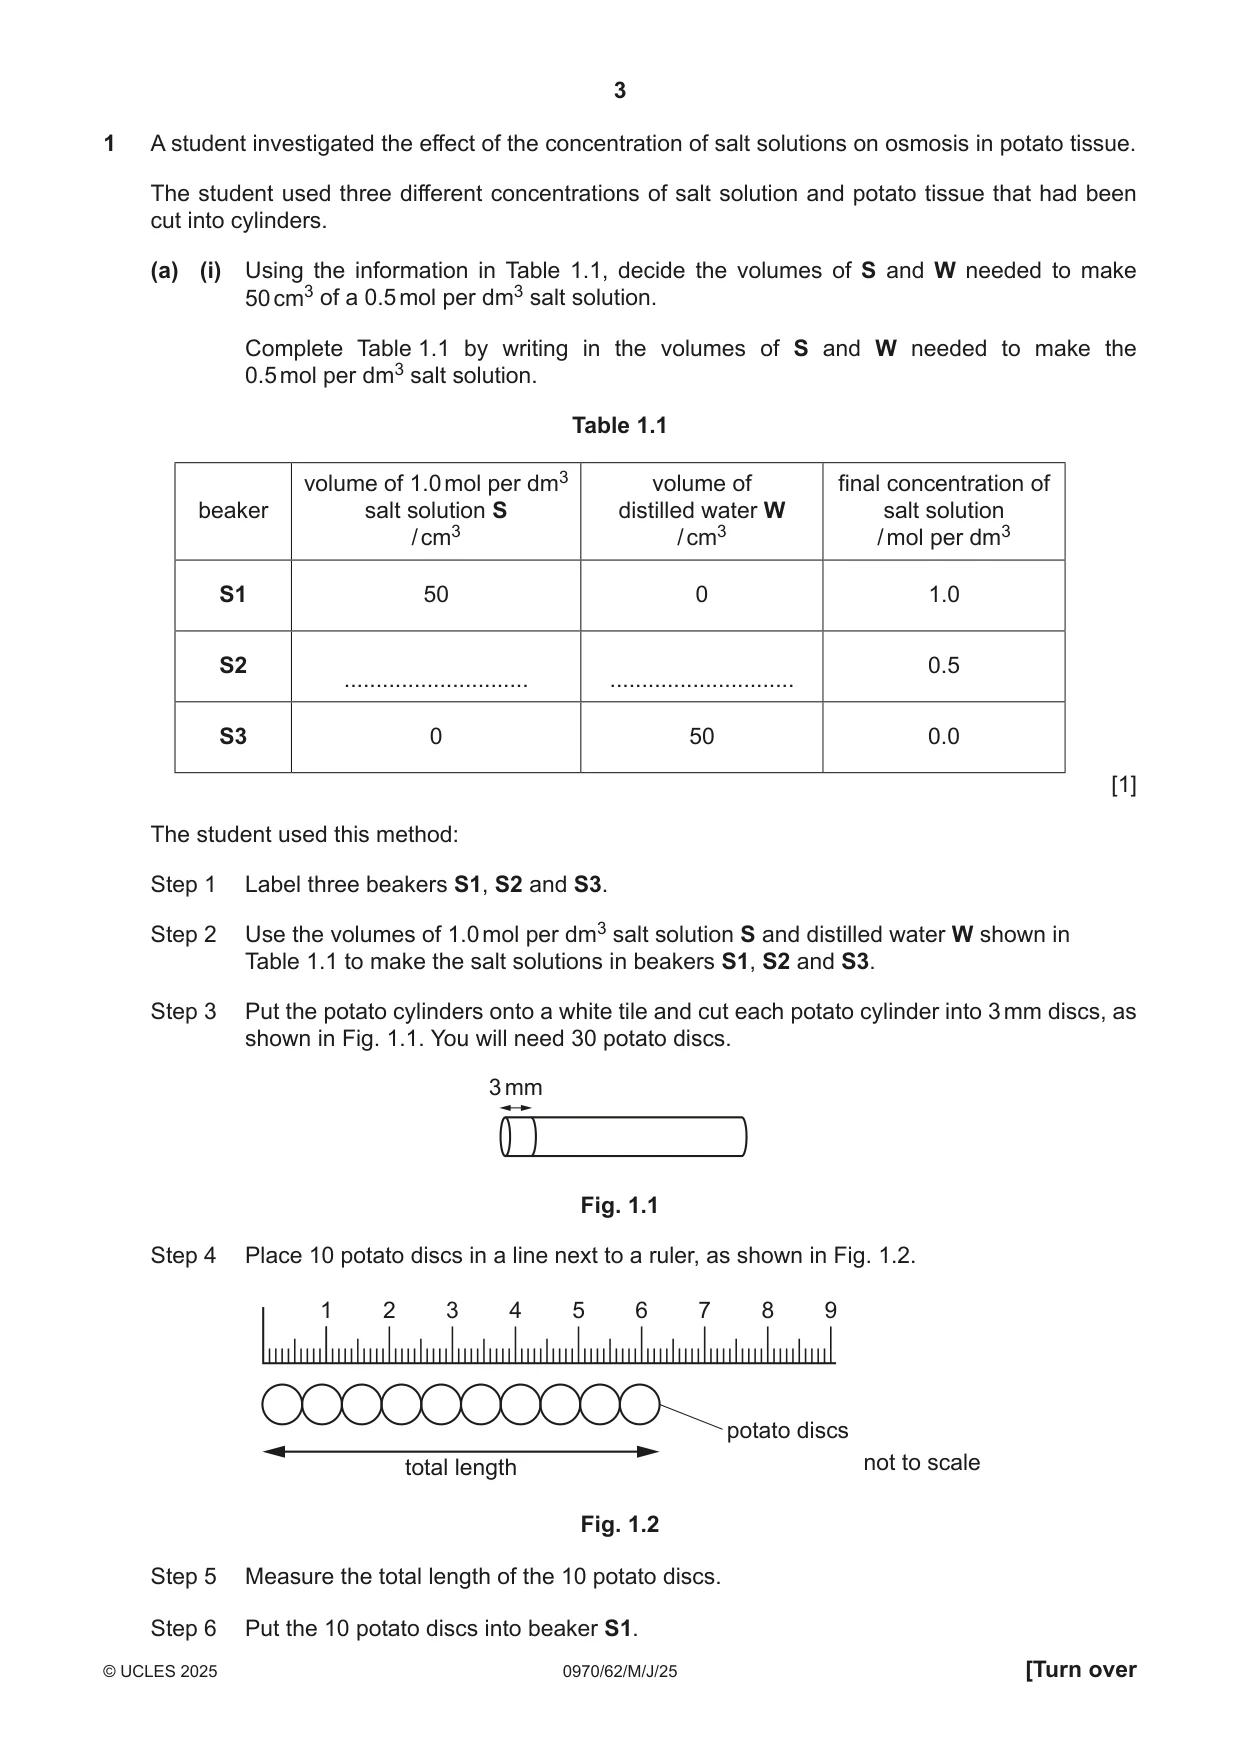
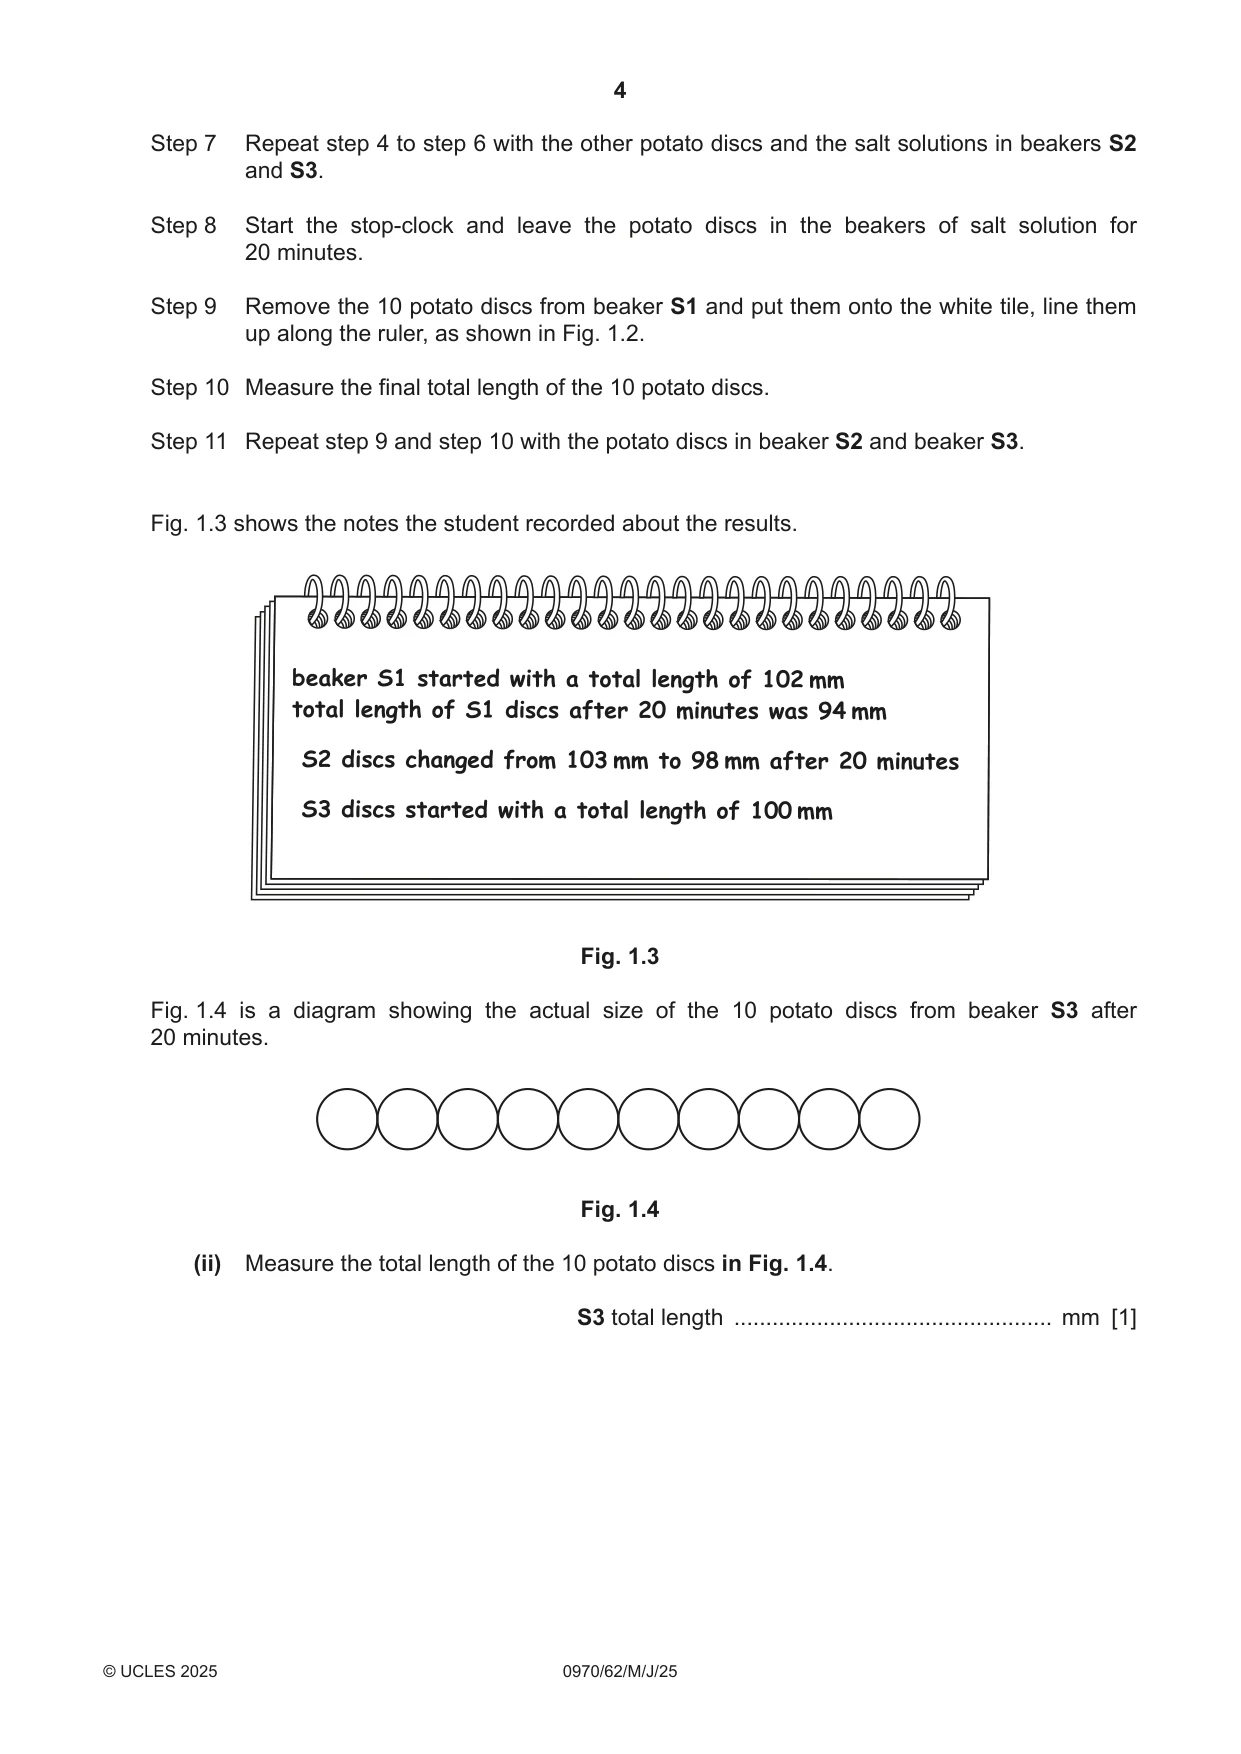
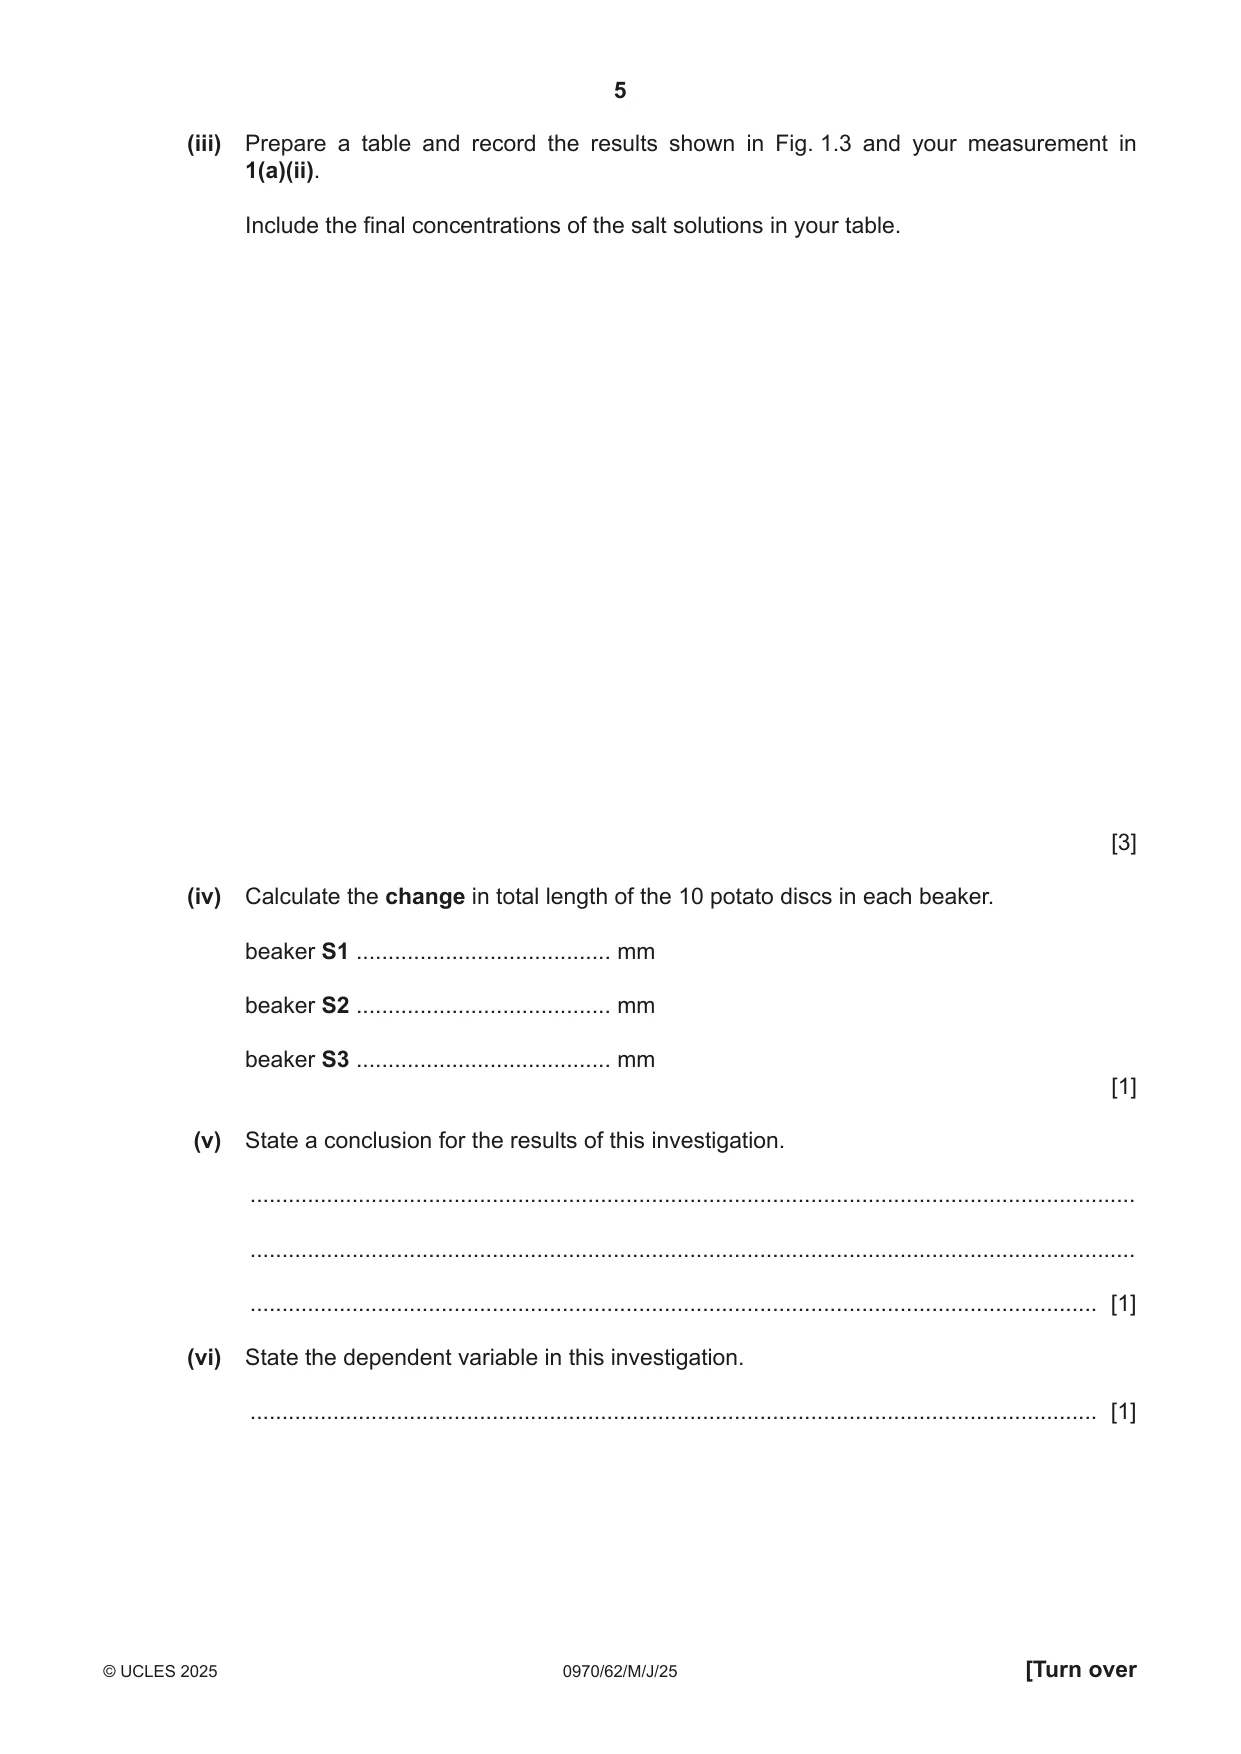
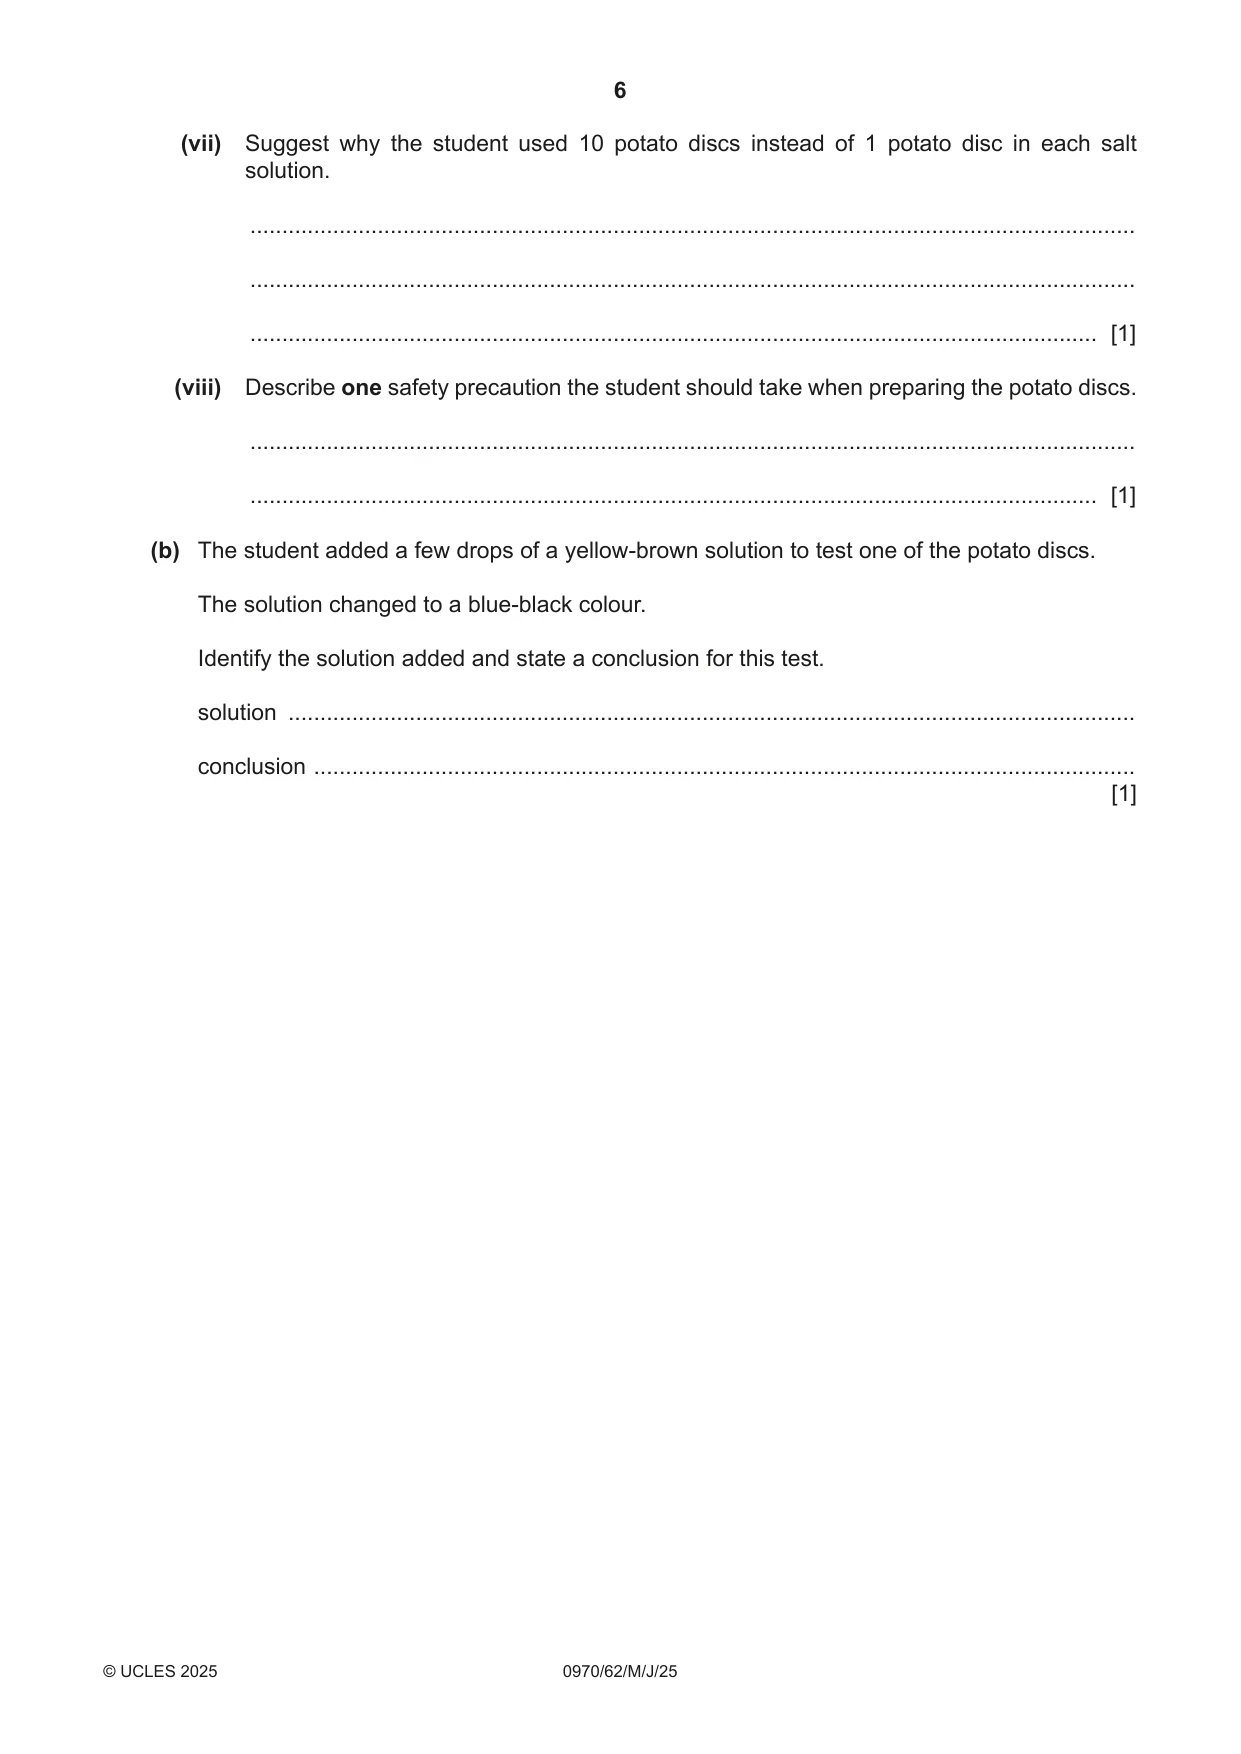
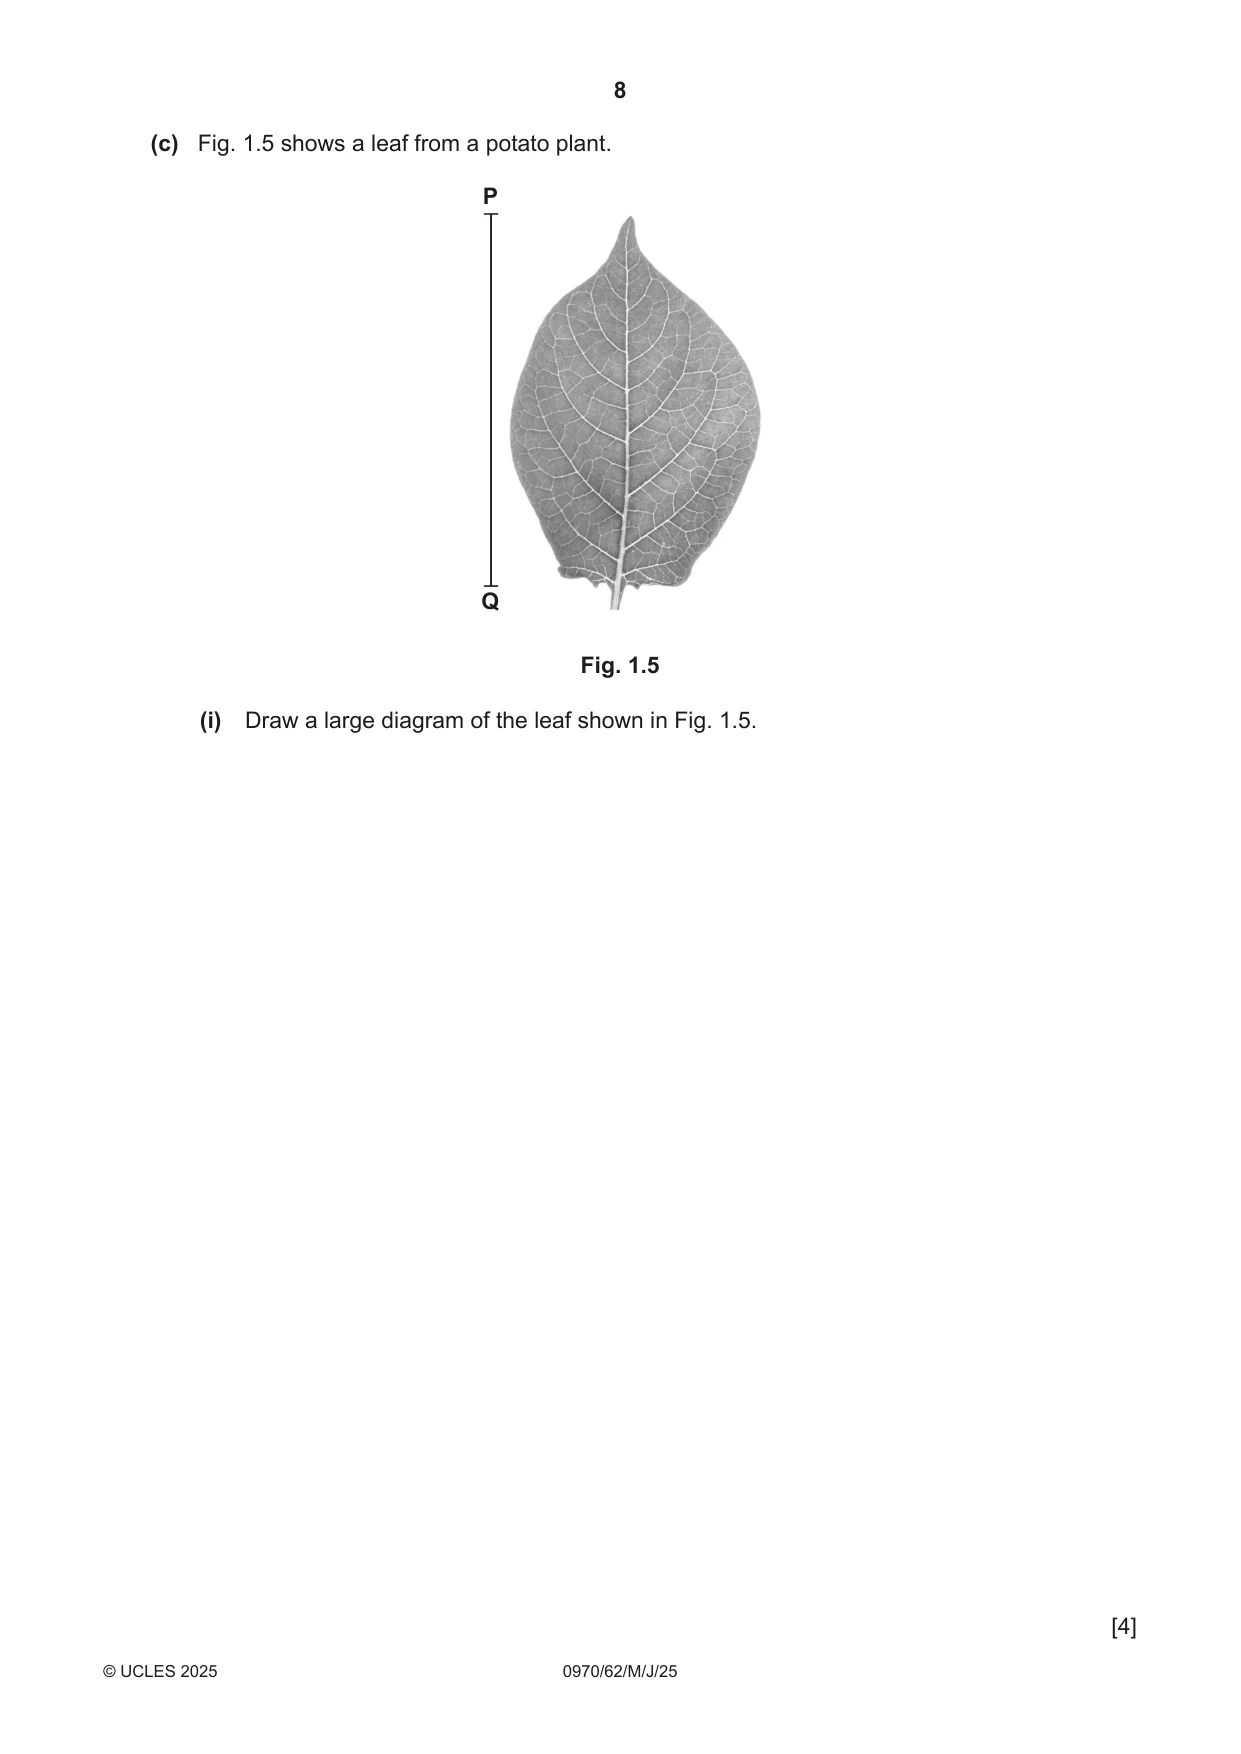
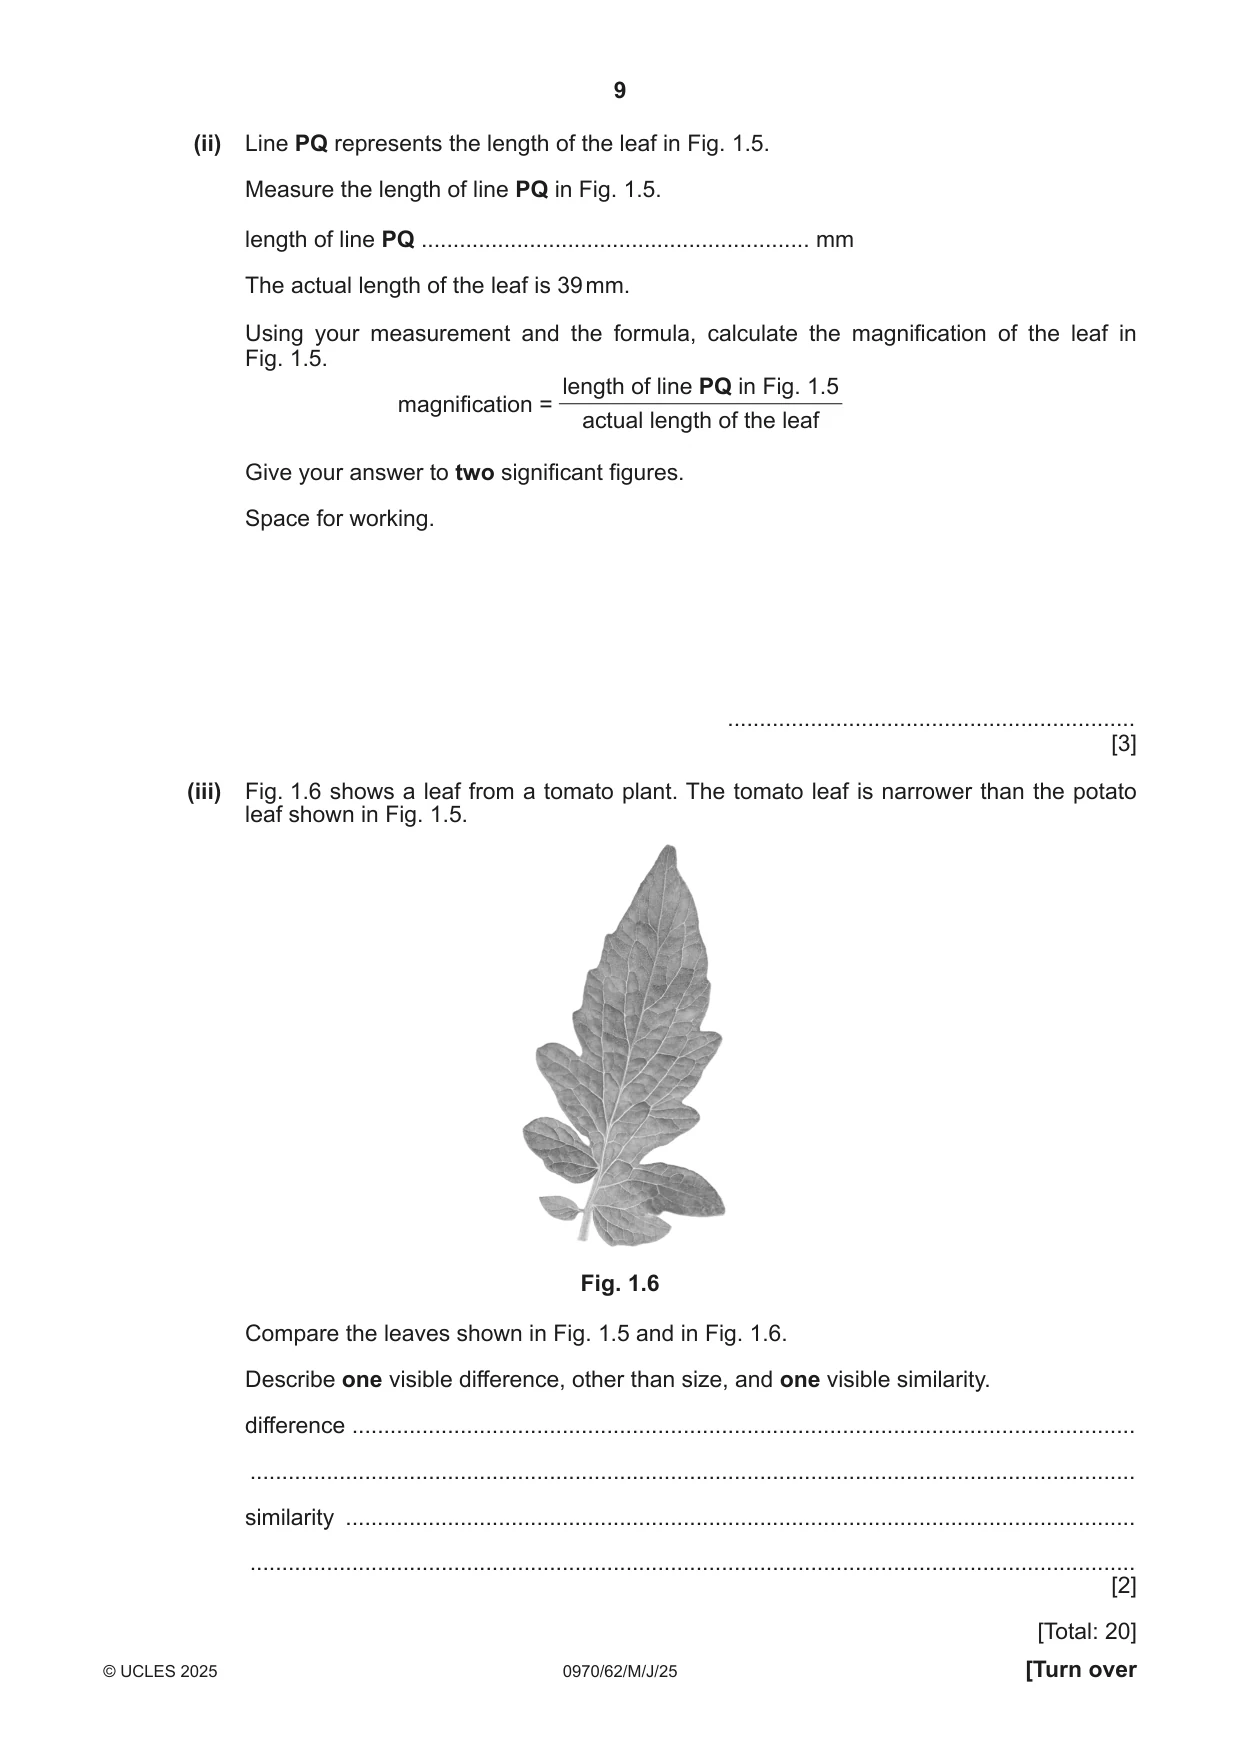
1 A student investigated the effect of the concentration of salt solutions on osmosis in potato tissue. The student used three different concentrations of salt solution and potato tissue that had been cut into cylinders. (a) (i) Using the information in Table 1.1, decide the volumes of S and W needed to make 50 cm3 of a 0.5 mol per dm3 salt solution. Complete Table 1.1 by writing in the volumes of S and W needed to make the 0.5 mol per dm3 salt solution. Table 1.1 volume of 1.0 mol per dm3 volume of final concentration of beaker salt solution S distilled water W salt solution / cm3 / cm3 / mol per dm3 S1 50 0 1.0 S2 0.5 ............................. ............................. S3 0 50 0.0 [1] The student used this method: Step 1 Label three beakers S1, S2 and S3. Step 2 Use the volumes of 1.0 mol per dm3 salt solution S and distilled water W shown in Table 1.1 to make the salt solutions in beakers S1, S2 and S3. Step 3 Put the potato cylinders onto a white tile and cut each potato cylinder into 3 mm discs, as shown in Fig. 1.1. You will need 30 potato discs. 3 mm Fig. 1.1 Step 4 Place 10 potato discs in a line next to a ruler, as shown in Fig. 1.2. 1 2 3 4 5 6 7 8 9 potato discs total length not to scale Fig. 1.2 Step 5 Measure the total length of the 10 potato discs. Step 6 Put the 10 potato discs into beaker S1. Step 7 Repeat step 4 to step 6 with the other potato discs and the salt solutions in beakers S2 and S3. Step 8 Start the stop‑clock and leave the potato discs in the beakers of salt solution for 20 minutes. Step 9 Remove the 10 potato discs from beaker S1 and put them onto the white tile, line them up along the ruler, as shown in Fig. 1.2. Step 10 Measure the final total length of the 10 potato discs. Step 11 Repeat step 9 and step 10 with the potato discs in beaker S2 and beaker S3. Fig. 1.3 shows the notes the student recorded about the results. beaker S1 started with a total length of 102 mm total length of S1 discs after 20 minutes was 94 mm S2 discs changed from 103 mm to 98 mm after 20 minutes S3 discs started with a total length of 100 mm Fig. 1.3 Fig. 1.4 is a diagram showing the actual size of the 10 potato discs from beaker S3 after 20 minutes. Fig. 1.4 (ii) Measure the total length of the 10 potato discs in Fig. 1.4. S3 total length .................................................. mm [1] (iii) Prepare a table and record the results shown in Fig. 1.3 and your measurement in 1(a)(ii). Include the final concentrations of the salt solutions in your table. [3] (iv) Calculate the change in total length of the 10 potato discs in each beaker. beaker S1 ........................................ mm beaker S2 ........................................ mm beaker S3 ........................................ mm [1] (v) State a conclusion for the results of this investigation. ........................................................................................................................................... ........................................................................................................................................... ..................................................................................................................................... [1] (vi) State the dependent variable in this investigation. ..................................................................................................................................... [1] (vii) Suggest why the student used 10 potato discs instead of 1 potato disc in each salt solution. ........................................................................................................................................... ........................................................................................................................................... ..................................................................................................................................... [1] (viii) Describe one safety precaution the student should take when preparing the potato discs. ........................................................................................................................................... ..................................................................................................................................... [1] (b) The student added a few drops of a yellow‑brown solution to test one of the potato discs. The solution changed to a blue‑black colour. Identify the solution added and state a conclusion for this test. solution ..................................................................................................................................... conclusion ................................................................................................................................. [1] (c) Fig. 1.5 shows a leaf from a potato plant. P Q Fig. 1.5 (i) Draw a large diagram of the leaf shown in Fig. 1.5. [4] (ii) Line PQ represents the length of the leaf in Fig. 1.5. Measure the length of line PQ in Fig. 1.5. length of line PQ ............................................................. mm The actual length of the leaf is 39 mm. Using your measurement and the formula, calculate the magnification of the leaf in Fig. 1.5. length of line PQ in Fig. 1.5 magnification = actual length of the leaf Give your answer to two significant figures. Space for working. ................................................................ [3] (iii) Fig. 1.6 shows a leaf from a tomato plant. The tomato leaf is narrower than the potato leaf shown in Fig. 1.5. Fig. 1.6 Compare the leaves shown in Fig. 1.5 and in Fig. 1.6. Describe one visible difference, other than size, and one visible similarity. difference ........................................................................................................................... ........................................................................................................................................... similarity ............................................................................................................................ ........................................................................................................................................... [2] [Total: 20]
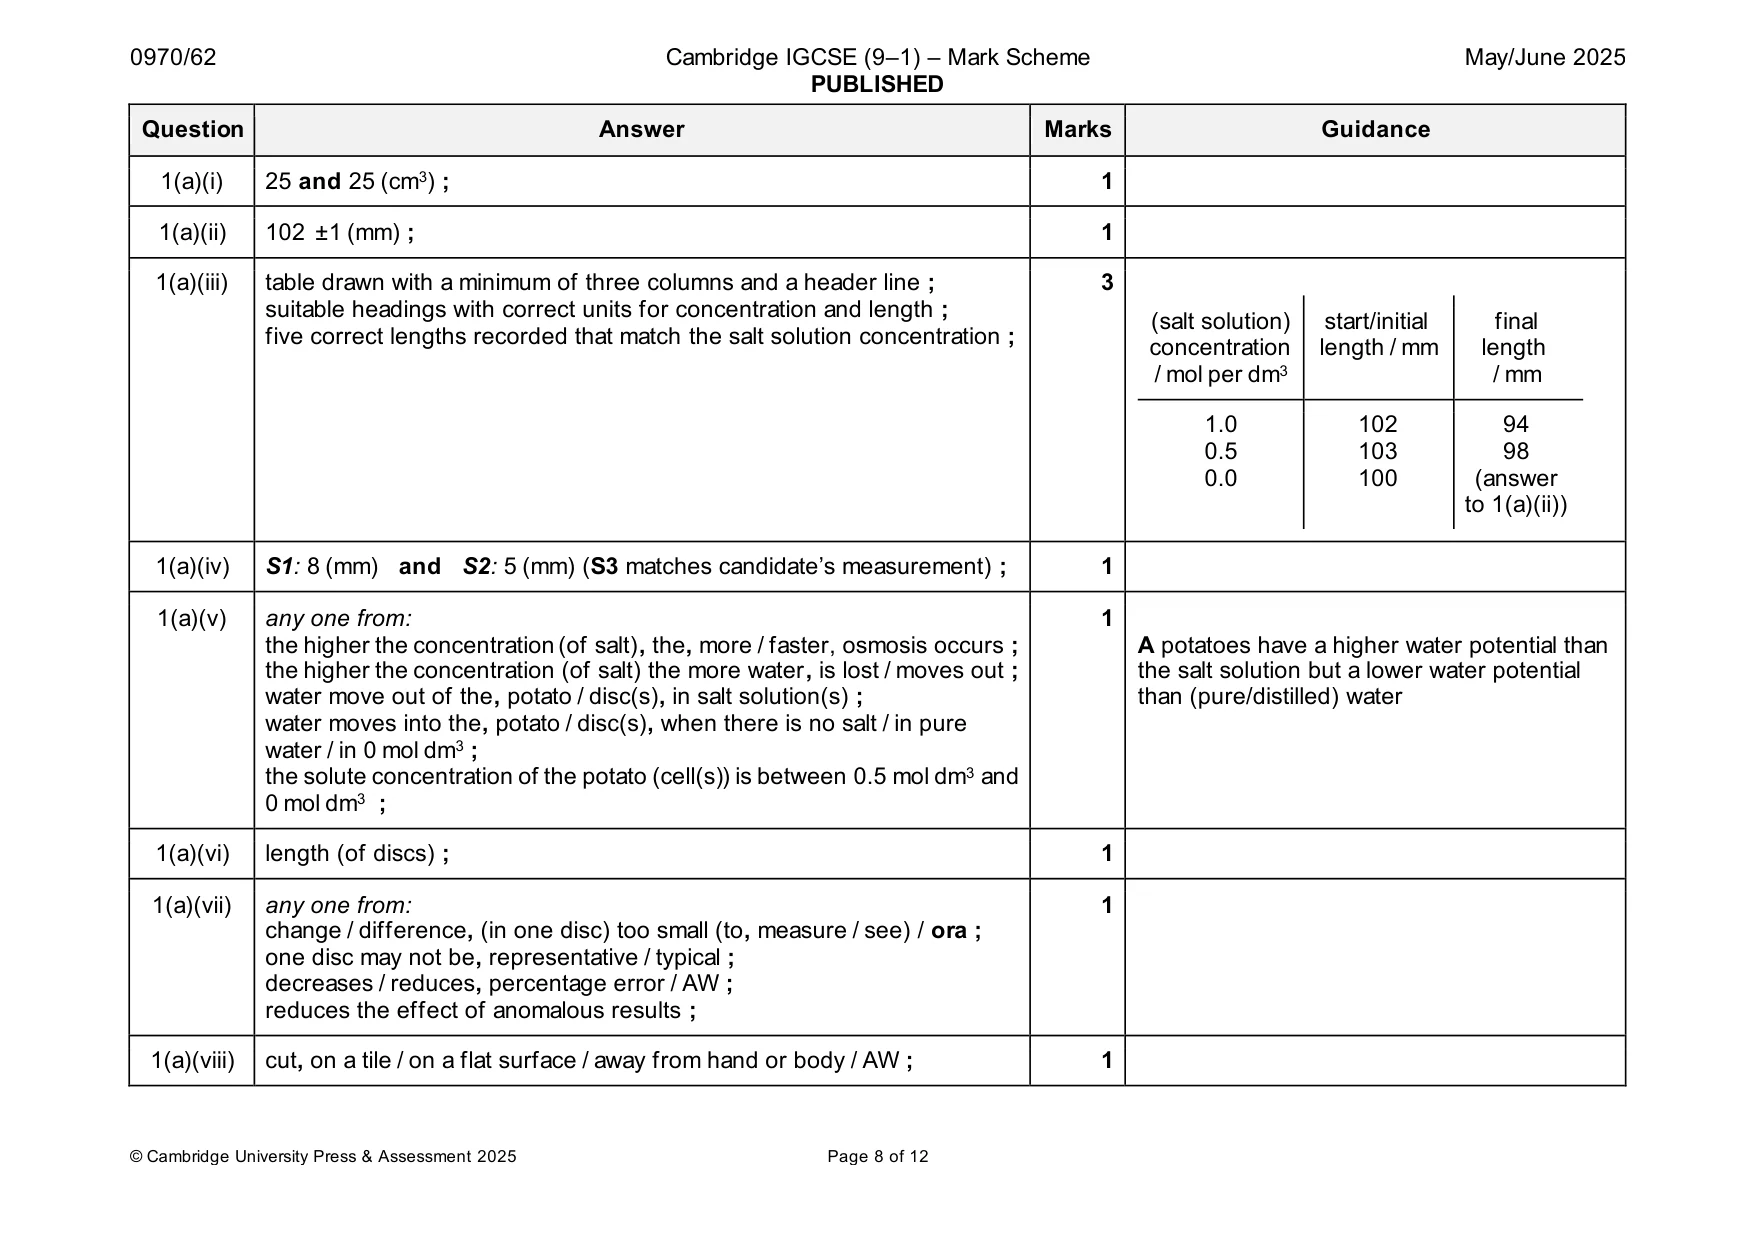
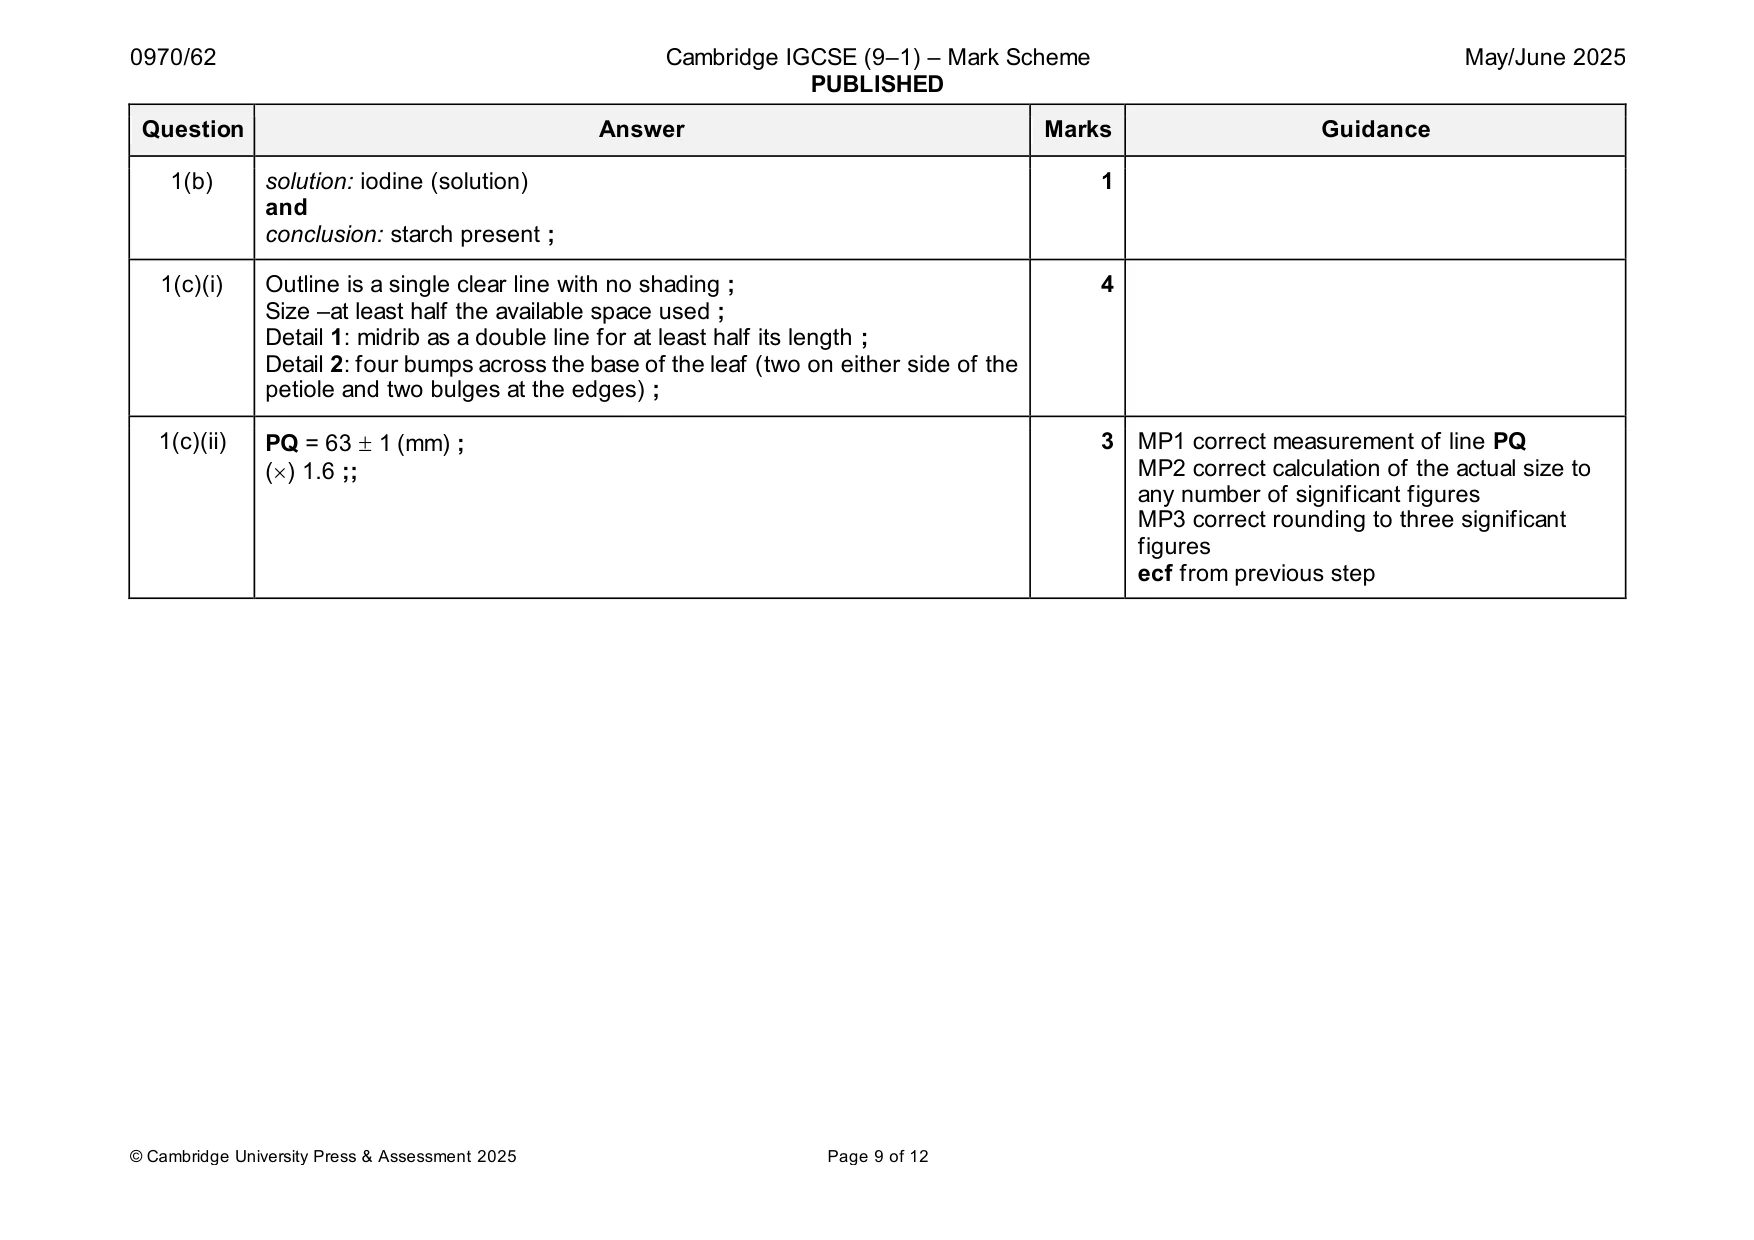
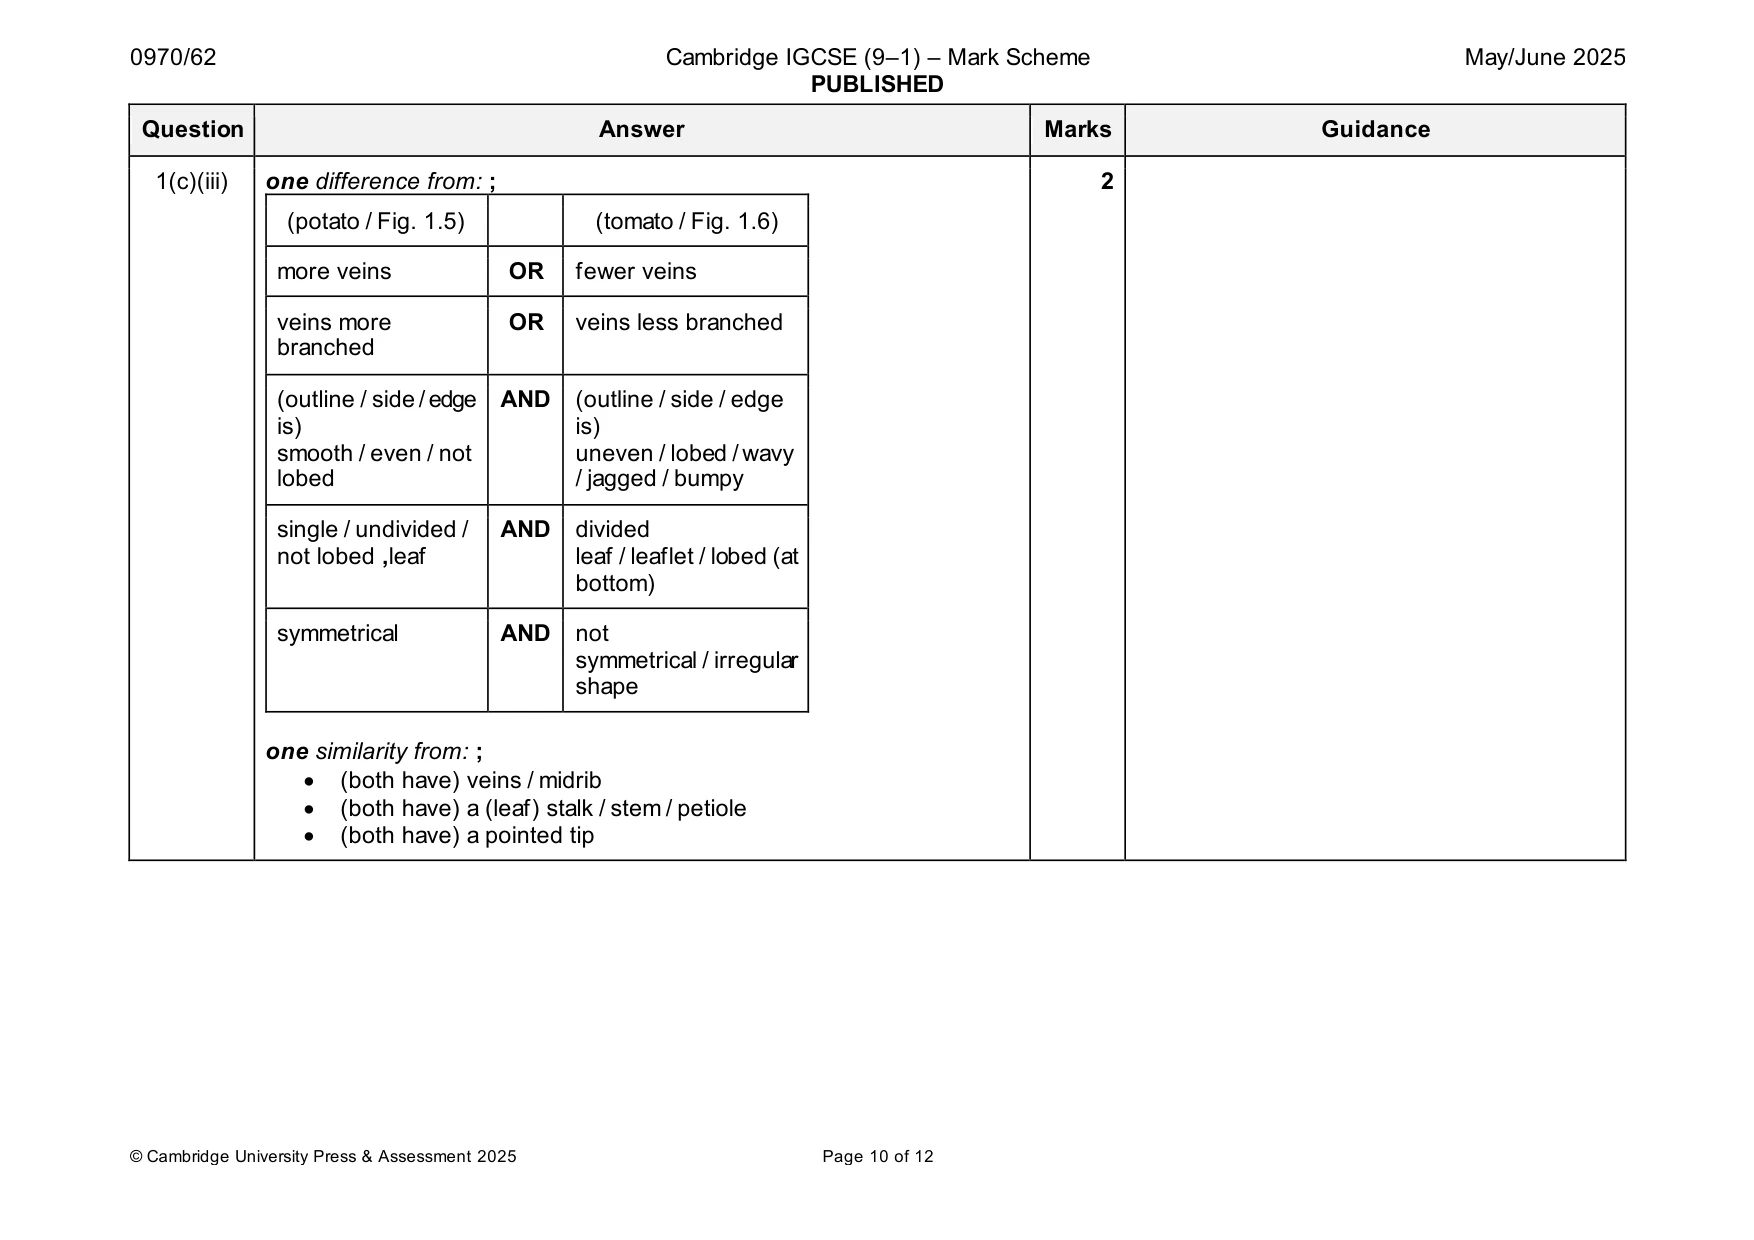
Mark scheme: Question Answer Marks Guidance 1(a)(i) 25 and 25 (cm3) ; 1 1(a)(ii) 102 ±1 (mm) ; 1 1(a)(iii) table drawn with a minimum of three columns and a header line ; 3 suitable headings with correct units for concentration and length ; (salt solution) start/initial final five correct lengths recorded that match the salt solution concentration ; concentration length / mm length / mol per dm3 / mm 1.0 102 94 0.5 103 98 0.0 100 (answer to 1(a)(ii)) 1(a)(iv) S1: 8 (mm) and S2: 5 (mm) (S3 matches candidate’s measurement) ; 1 1(a)(v) any one from: 1 the higher the concentration (of salt), the, more / faster, osmosis occurs ; A potatoes have a higher water potential than the higher the concentration (of salt) the more water, is lost / moves out ; the salt solution but a lower water potential water move out of the, potato / disc(s), in salt solution(s) ; than (pure/distilled) water water moves into the, potato / disc(s), when there is no salt / in pure water / in 0 mol dm3 ; the solute concentration of the potato (cell(s)) is between 0.5 mol dm3 and 0 mol dm3 ; 1(a)(vi) length (of discs) ; 1 1(a)(vii) any one from: 1 change / difference, (in one disc) too small (to, measure / see) / ora ; one disc may not be, representative / typical ; decreases / reduces, percentage error / AW ; reduces the effect of anomalous results ; 1(a)(viii) cut, on a tile / on a flat surface / away from hand or body / AW ; 1 1(b) solution: iodine (solution) 1 and conclusion: starch present ; 1(c)(i) Outline is a single clear line with no shading ; 4 Size –at least half the available space used ; Detail 1: midrib as a double line for at least half its length ; Detail 2: four bumps across the base of the leaf (two on either side of the petiole and two bulges at the edges) ; 1(c)(ii) PQ = 63 1 (mm) ; 3 MP1 correct measurement of line PQ () 1.6 ;; MP2 correct calculation of the actual size to any number of significant figures MP3 correct rounding to three significant figures ecf from previous step 1(c)(iii) one difference from: ; 2 (potato / Fig. 1.5) (tomato / Fig. 1.6) more veins OR fewer veins veins more OR veins less branched branched (outline / side / edge AND (outline / side / edge is) is) smooth / even / not uneven / lobed / wavy lobed / jagged / bumpy single / undivided / AND divided not lobed ,leaf leaf / leaflet / lobed (at bottom) symmetrical AND not symmetrical / irregular shape one similarity from: ; • (both have) veins / midrib • (both have) a (leaf) stalk / stem / petiole • (both have) a pointed tip
Q2 · The enzyme pectinase is used in the production of apple juice
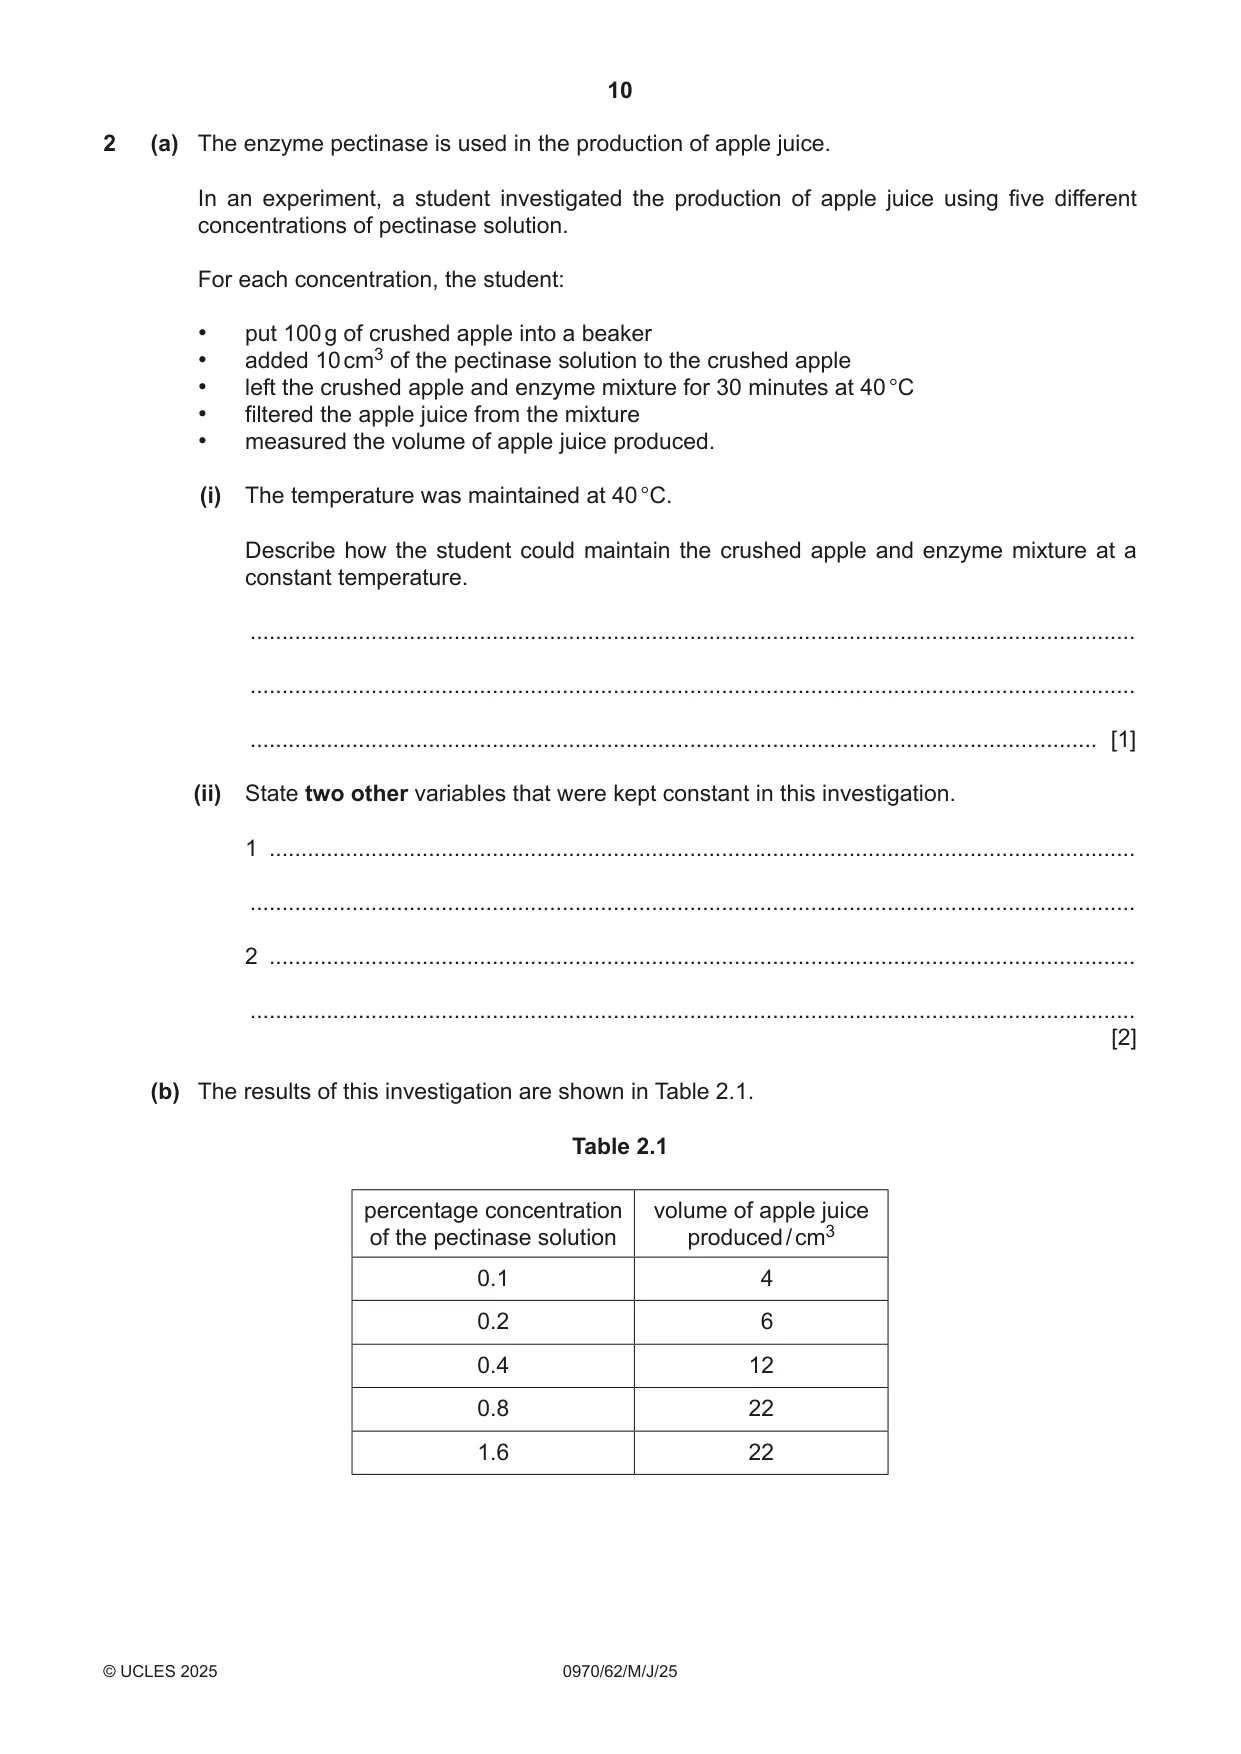
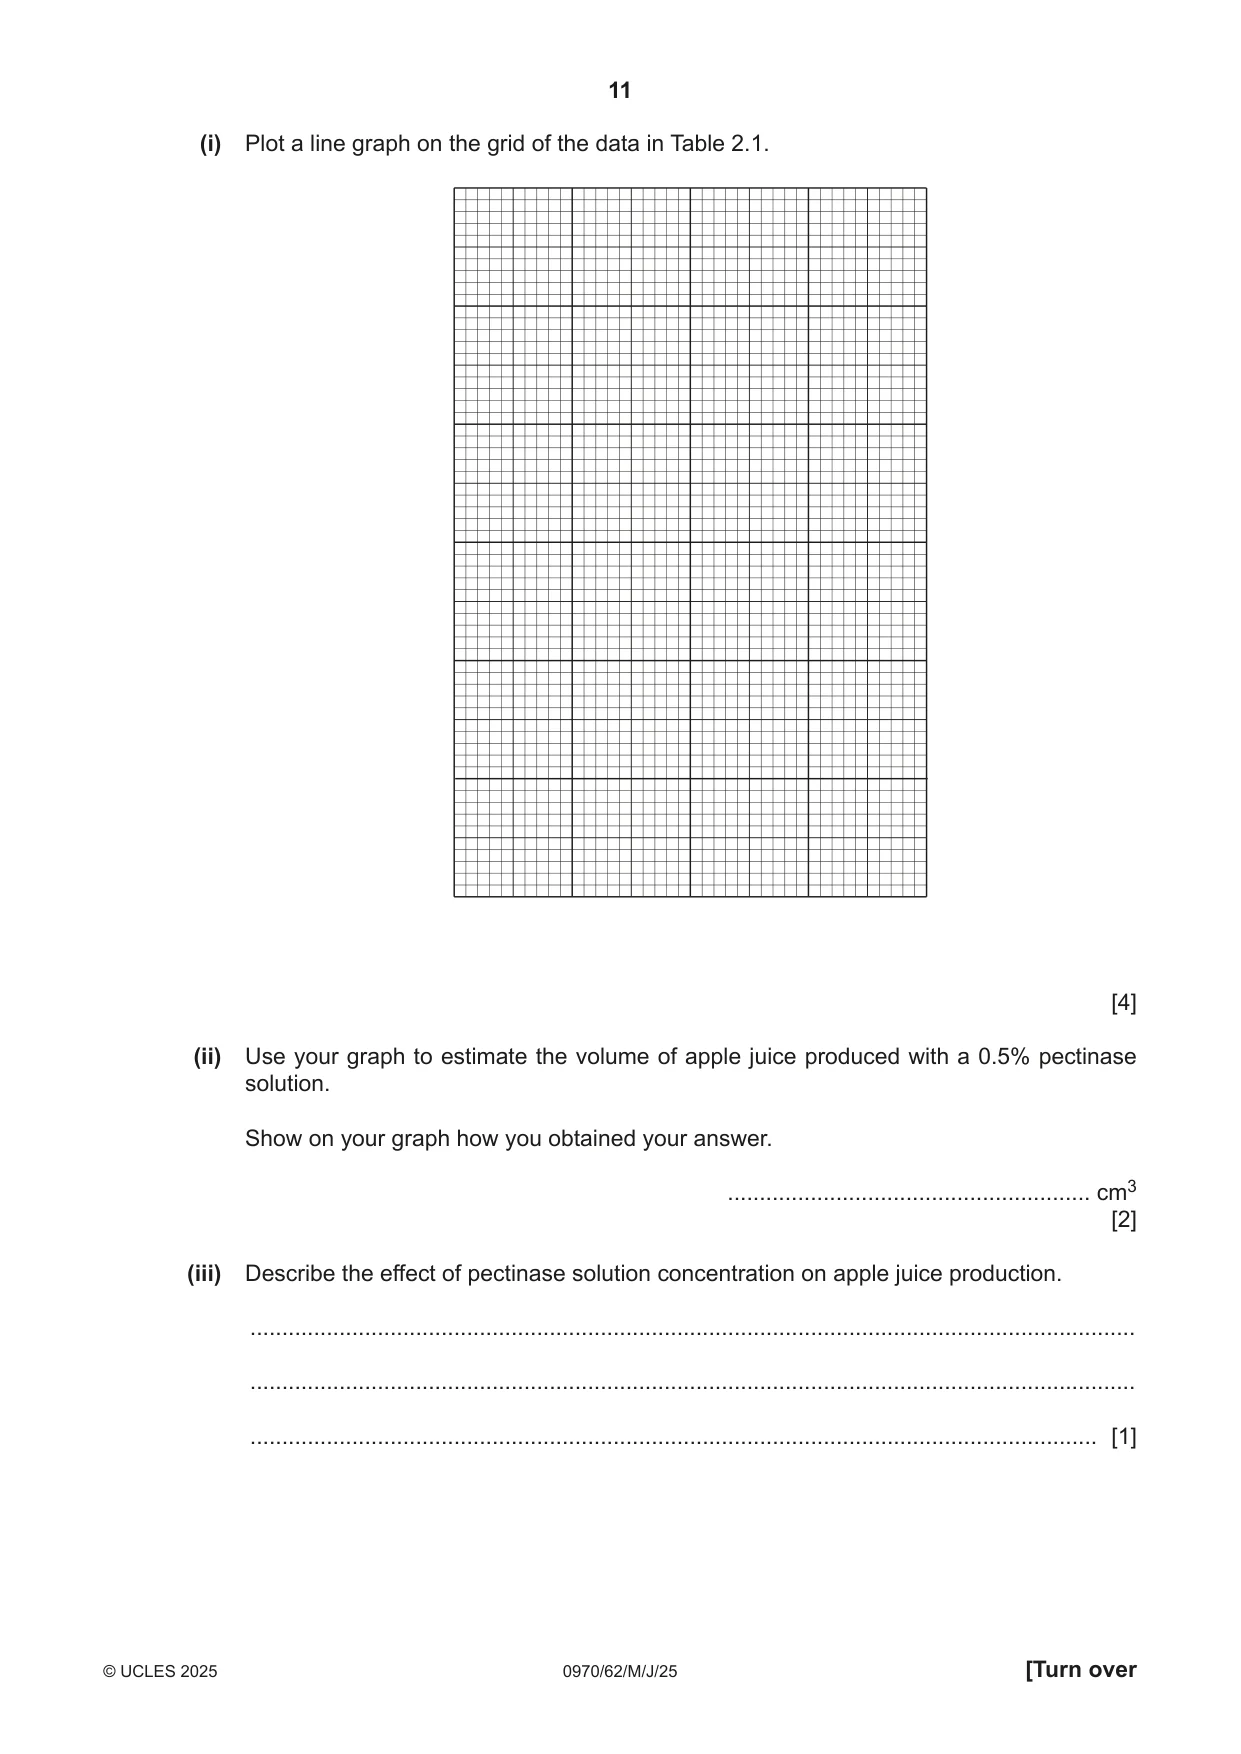
2 (a) The enzyme pectinase is used in the production of apple juice. In an experiment, a student investigated the production of apple juice using five different concentrations of pectinase solution. For each concentration, the student: • put 100 g of crushed apple into a beaker • added 10 cm3 of the pectinase solution to the crushed apple • left the crushed apple and enzyme mixture for 30 minutes at 40 °C • filtered the apple juice from the mixture • measured the volume of apple juice produced. (i) The temperature was maintained at 40 °C. Describe how the student could maintain the crushed apple and enzyme mixture at a constant temperature. ........................................................................................................................................... ........................................................................................................................................... ..................................................................................................................................... [1] (ii) State two other variables that were kept constant in this investigation. 1 ........................................................................................................................................ ........................................................................................................................................... 2 ........................................................................................................................................ ........................................................................................................................................... [2] (b) The results of this investigation are shown in Table 2.1. Table 2.1 percentage concentration volume of apple juice of the pectinase solution produced / cm3 0.1 4 0.2 6 0.4 12 0.8 22 1.6 22 (i) Plot a line graph on the grid of the data in Table 2.1. [4] (ii) Use your graph to estimate the volume of apple juice produced with a 0.5% pectinase solution. Show on your graph how you obtained your answer. ......................................................... cm3 [2] (iii) Describe the effect of pectinase solution concentration on apple juice production. ........................................................................................................................................... ........................................................................................................................................... ..................................................................................................................................... [1] (iv) Pectinase is used to produce apple juice commercially. Suggest what extra data would be required to determine if a 0.8% pectinase solution is the optimum concentration for the production of apple juice. ........................................................................................................................................... ........................................................................................................................................... ..................................................................................................................................... [1] (v) Draw and label the apparatus the student could use to filter and measure the volume of apple juice produced. [3] [Total: 14]
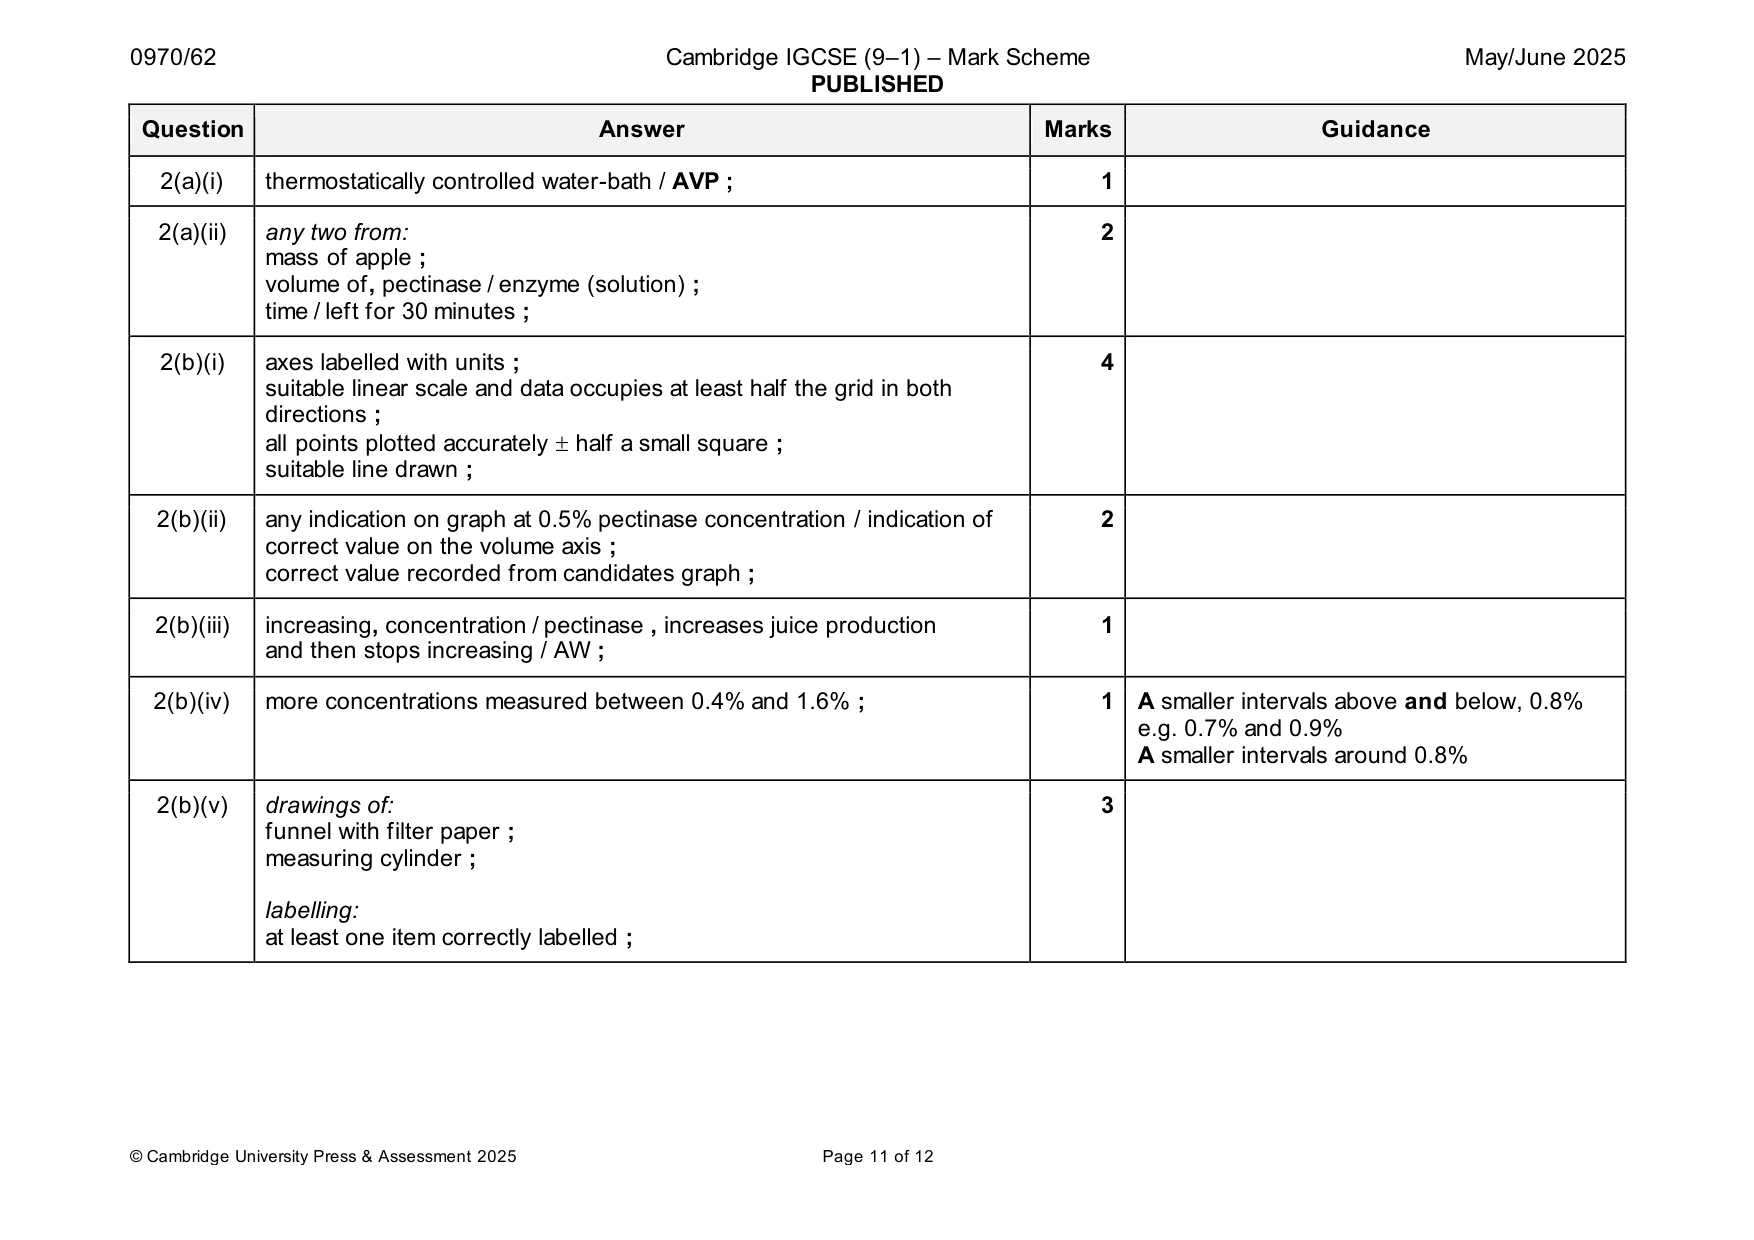
Mark scheme: 2(a)(i) thermostatically controlled water-bath / AVP ; 1 2(a)(ii) any two from: 2 mass of apple ; volume of, pectinase / enzyme (solution) ; time / left for 30 minutes ; 2(b)(i) axes labelled with units ; 4 suitable linear scale and data occupies at least half the grid in both directions ; all points plotted accurately half a small square ; suitable line drawn ; 2(b)(ii) any indication on graph at 0.5% pectinase concentration / indication of 2 correct value on the volume axis ; correct value recorded from candidates graph ; 2(b)(iii) increasing, concentration / pectinase , increases juice production 1 and then stops increasing / AW ; 2(b)(iv) more concentrations measured between 0.4% and 1.6% ; 1 A smaller intervals above and below, 0.8% e.g. 0.7% and 0.9% A smaller intervals around 0.8% 2(b)(v) drawings of: 3 funnel with filter paper ; measuring cylinder ; labelling: at least one item correctly labelled ;
Q3 · Hydrogencarbonate indicator can be used to determine the concentration of carbon dioxide…
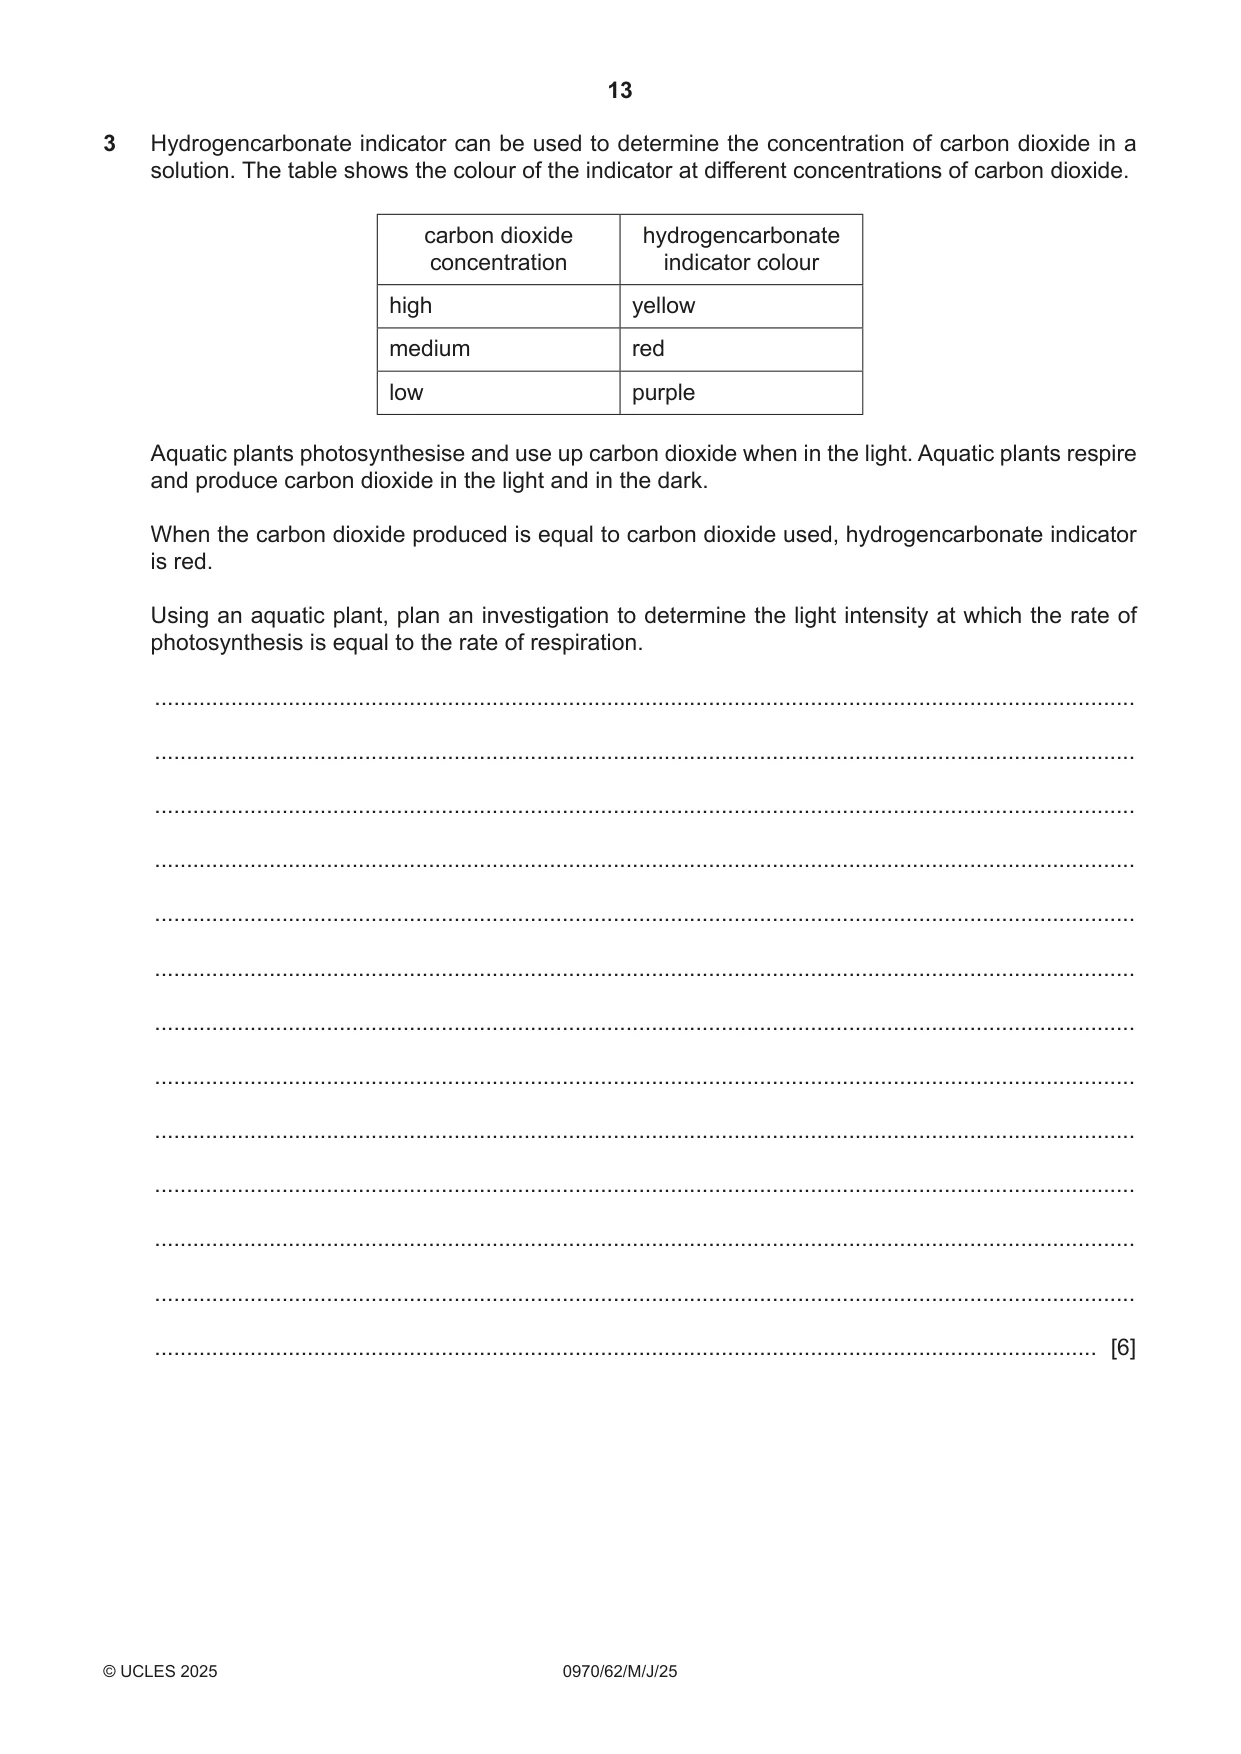
3 Hydrogencarbonate indicator can be used to determine the concentration of carbon dioxide in a solution. The table shows the colour of the indicator at different concentrations of carbon dioxide. carbon dioxide hydrogencarbonate concentration indicator colour high yellow medium red low purple Aquatic plants photosynthesise and use up carbon dioxide when in the light. Aquatic plants respire and produce carbon dioxide in the light and in the dark. When the carbon dioxide produced is equal to carbon dioxide used, hydrogencarbonate indicator is red. Using an aquatic plant, plan an investigation to determine the light intensity at which the rate of photosynthesis is equal to the rate of respiration. .......................................................................................................................................................... .......................................................................................................................................................... .......................................................................................................................................................... .......................................................................................................................................................... .......................................................................................................................................................... .......................................................................................................................................................... .......................................................................................................................................................... .......................................................................................................................................................... .......................................................................................................................................................... .......................................................................................................................................................... .......................................................................................................................................................... .......................................................................................................................................................... .................................................................................................................................................... [6]
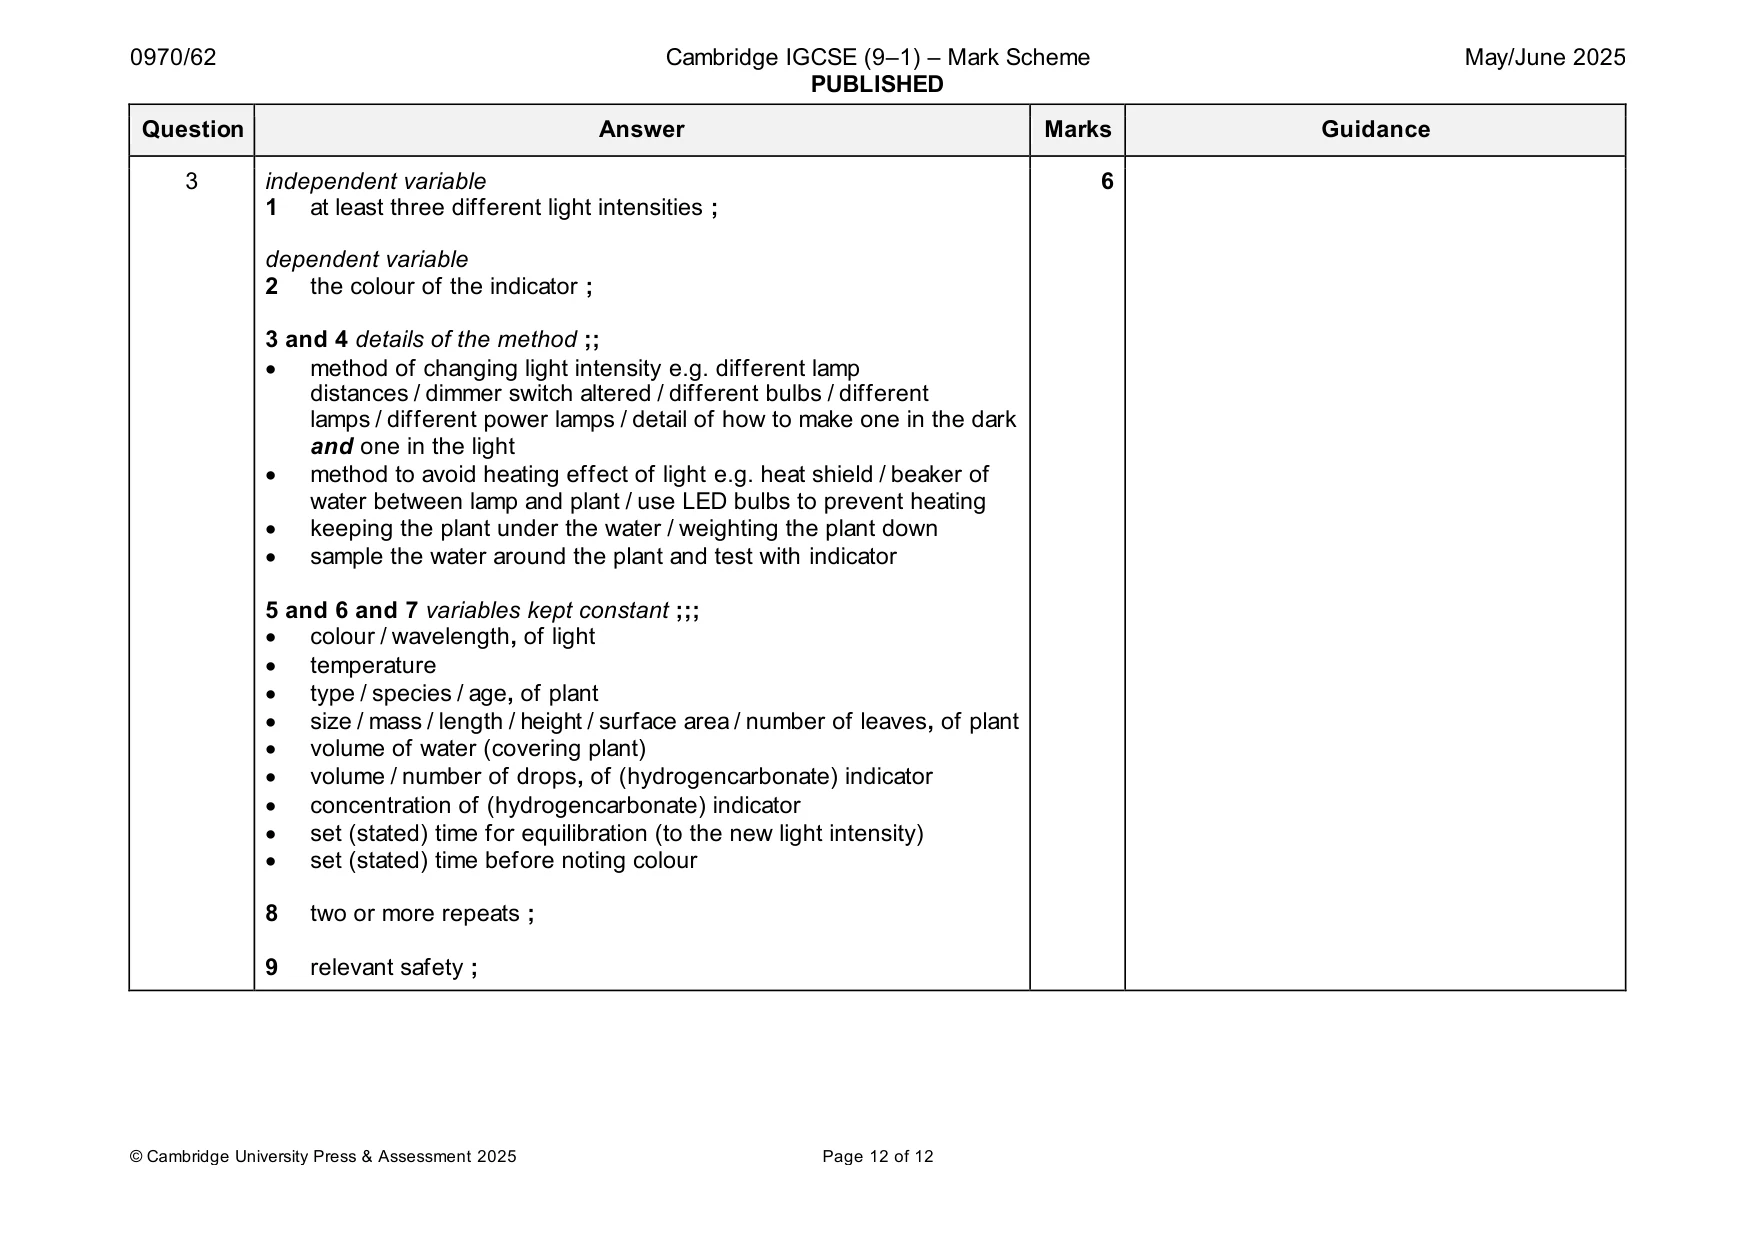
Mark scheme: 3 independent variable 6 1 at least three different light intensities ; dependent variable 2 the colour of the indicator ; 3 and 4 details of the method ;; • method of changing light intensity e.g. different lamp distances / dimmer switch altered / different bulbs / different lamps / different power lamps / detail of how to make one in the dark and one in the light • method to avoid heating effect of light e.g. heat shield / beaker of water between lamp and plant / use LED bulbs to prevent heating • keeping the plant under the water / weighting the plant down • sample the water around the plant and test with indicator 5 and 6 and 7 variables kept constant ;;; • colour / wavelength, of light • temperature • type / species / age, of plant • size / mass / length / height / surface area / number of leaves, of plant • volume of water (covering plant) • volume / number of drops, of (hydrogencarbonate) indicator • concentration of (hydrogencarbonate) indicator • set (stated) time for equilibration (to the new light intensity) • set (stated) time before noting colour 8 two or more repeats ; 9 relevant safety ;
What was in this paper
The subtopics covered by these 3 questions, and how many questions each got. Open one in a new tab to see every Cambridge question on it.
What you needed in this session
Cambridge’s own grade thresholds for 2025 May/June, Paper 6 · Variant 2. A higher threshold means an easier paper — the bar moves with how the cohort did.