Cambridge IGCSE Biology (9-1) 0970 — 2025 Oct/Nov Paper 6 · Variant 2
0970/62/O/N/25 · 3 questions · 40 marks · ≈45 min
The question paper and its mark scheme, free to read here and free to download. This is Cambridge’s own paper, exactly as it was sat.
Question paper16 pages


Mark scheme12 pages
Answers below. Sit the paper first if you are practising.
Questions as text
Q1 · A student investigated the rate of respiration in yeast using different concentrations of…
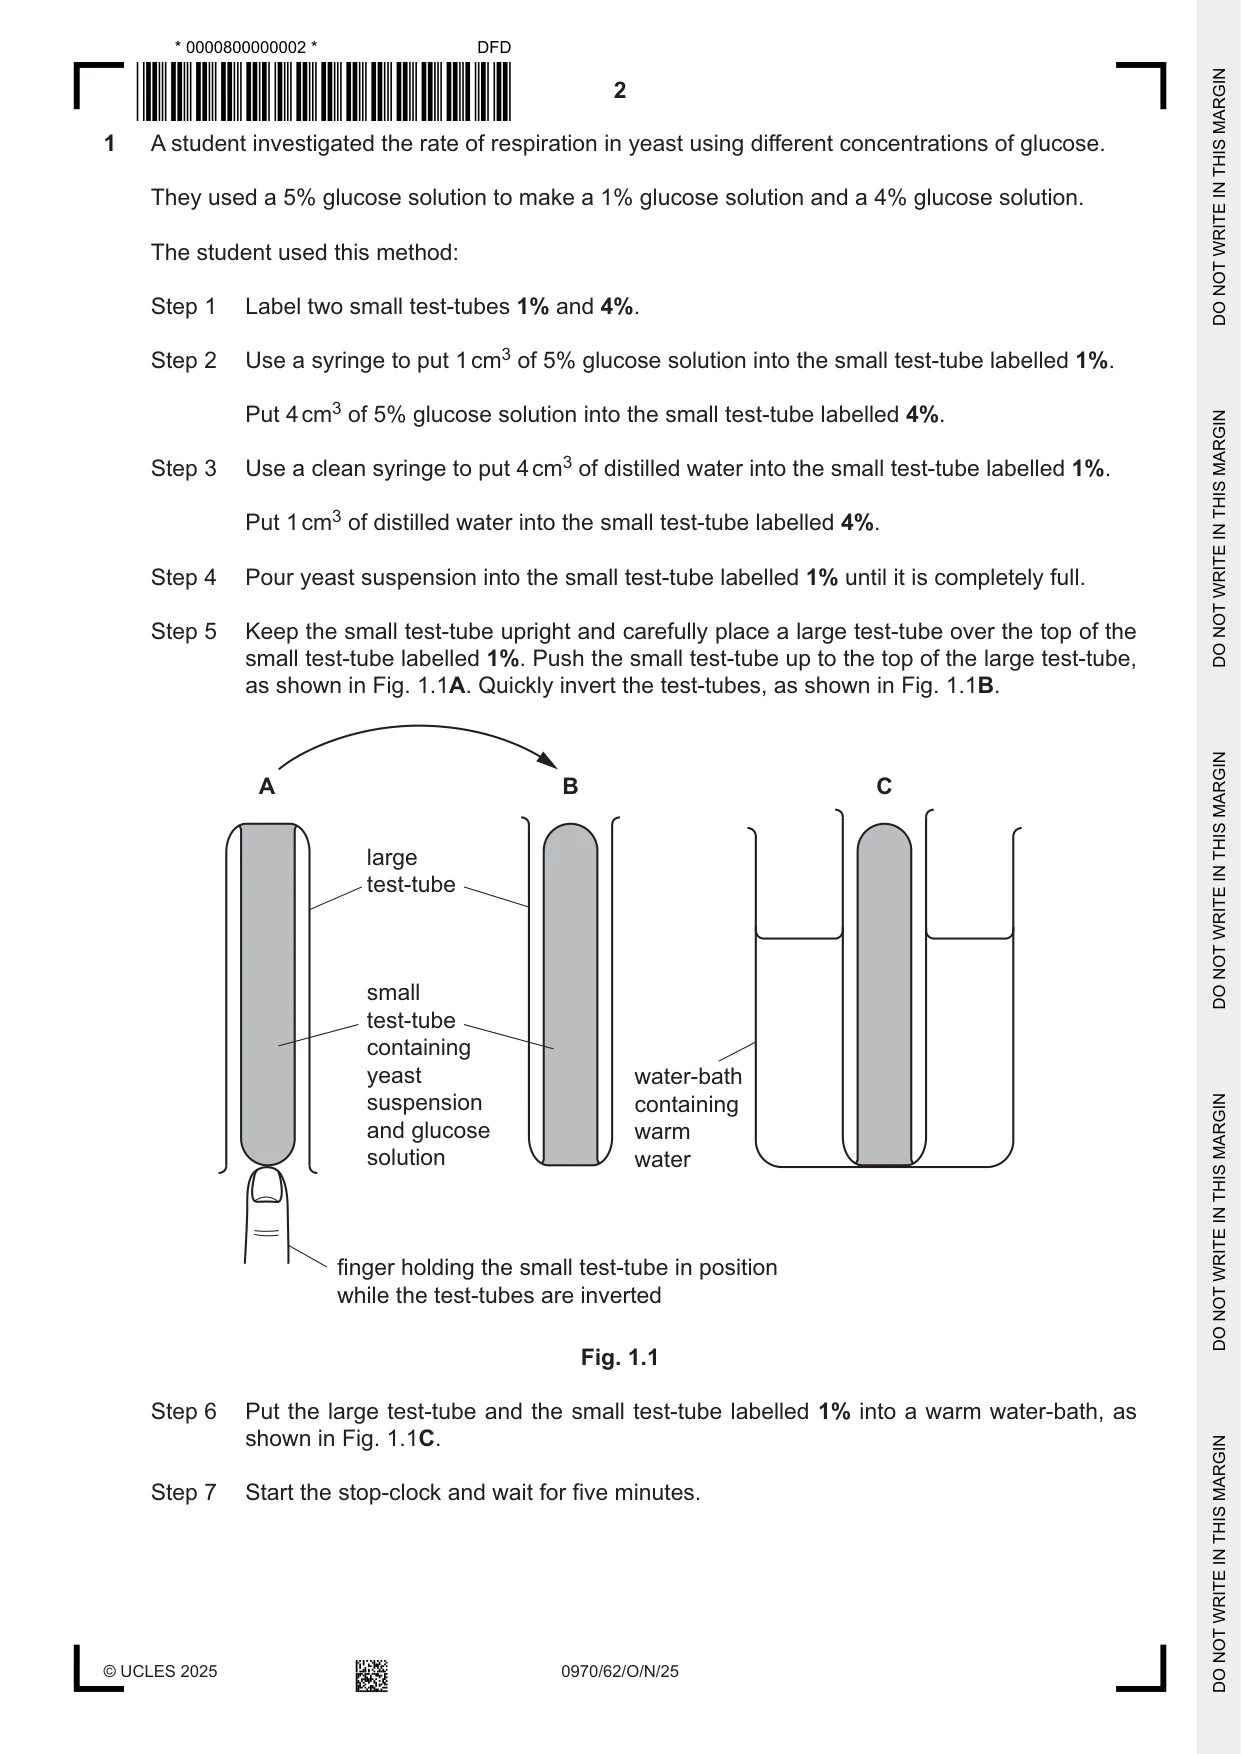
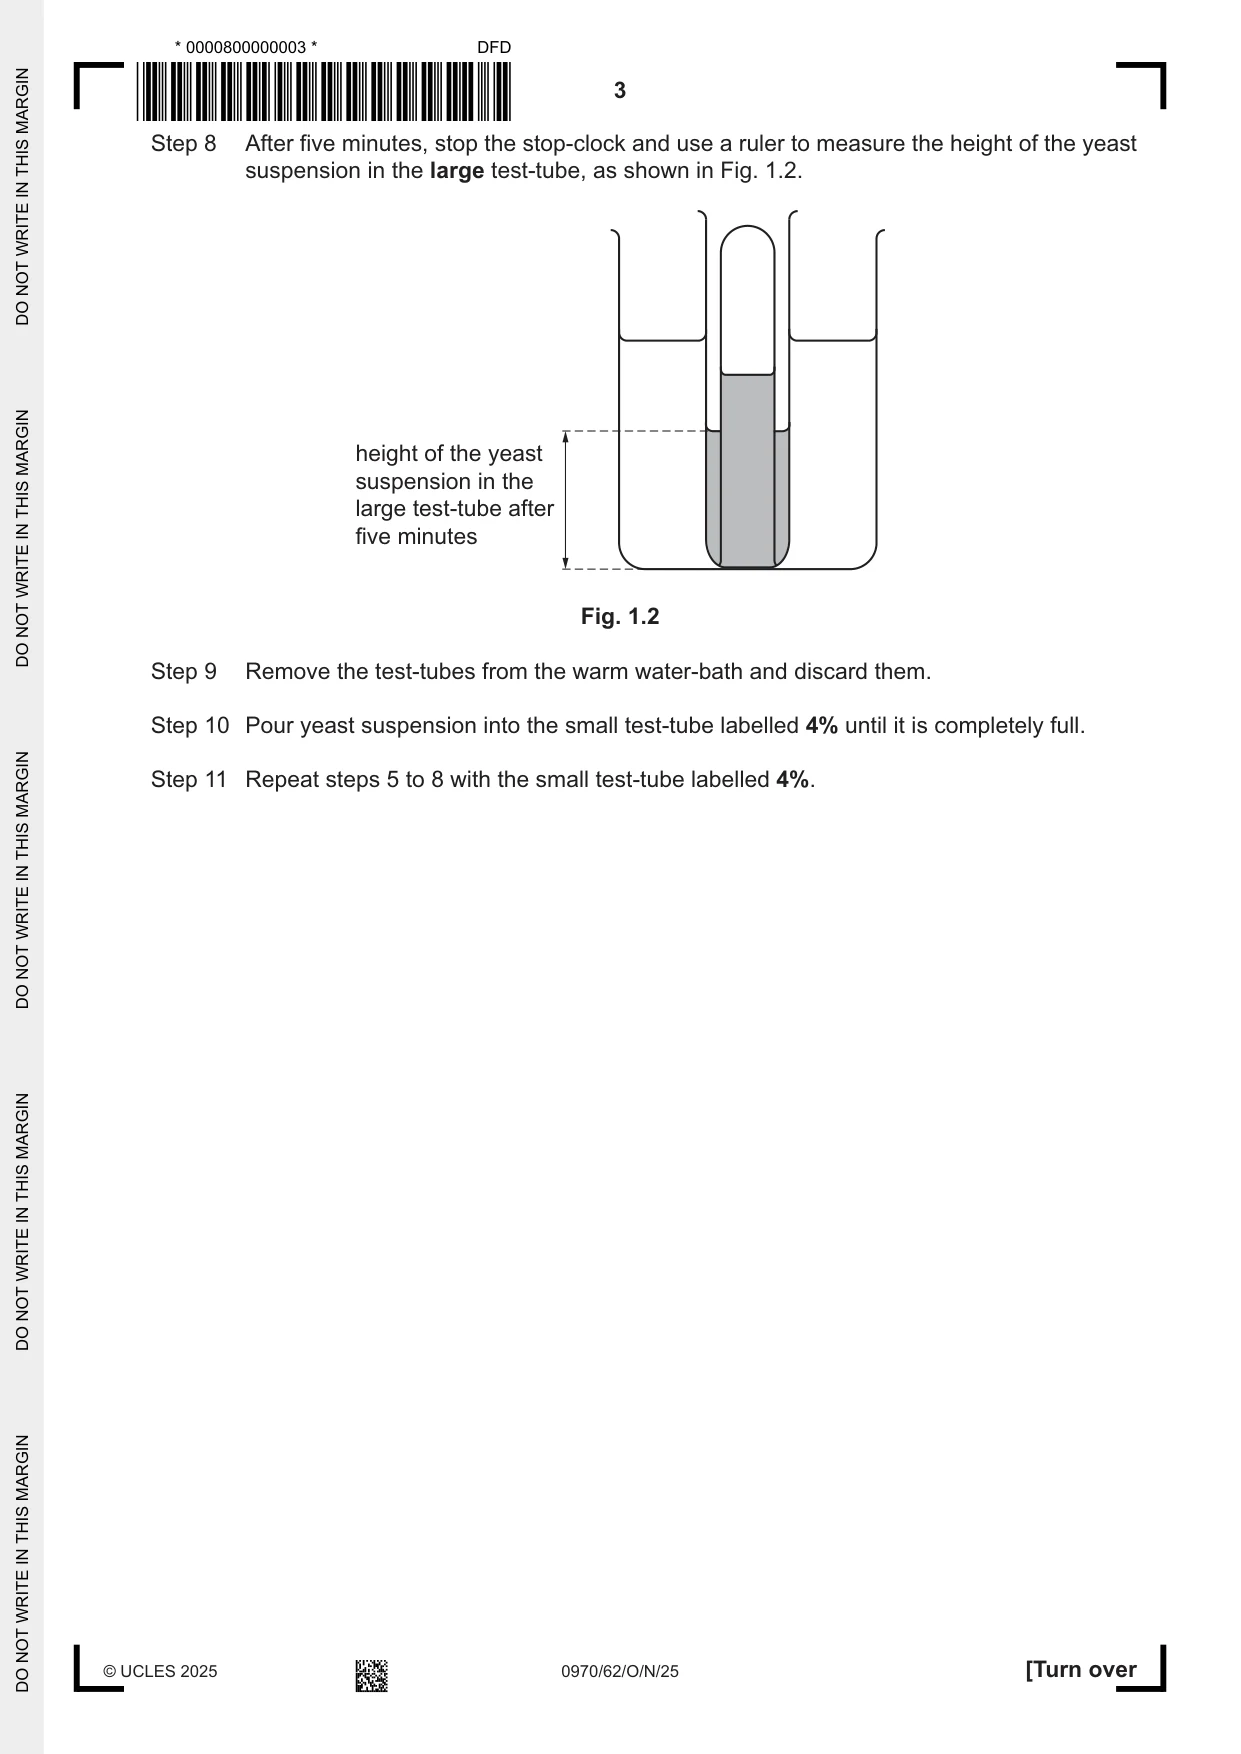
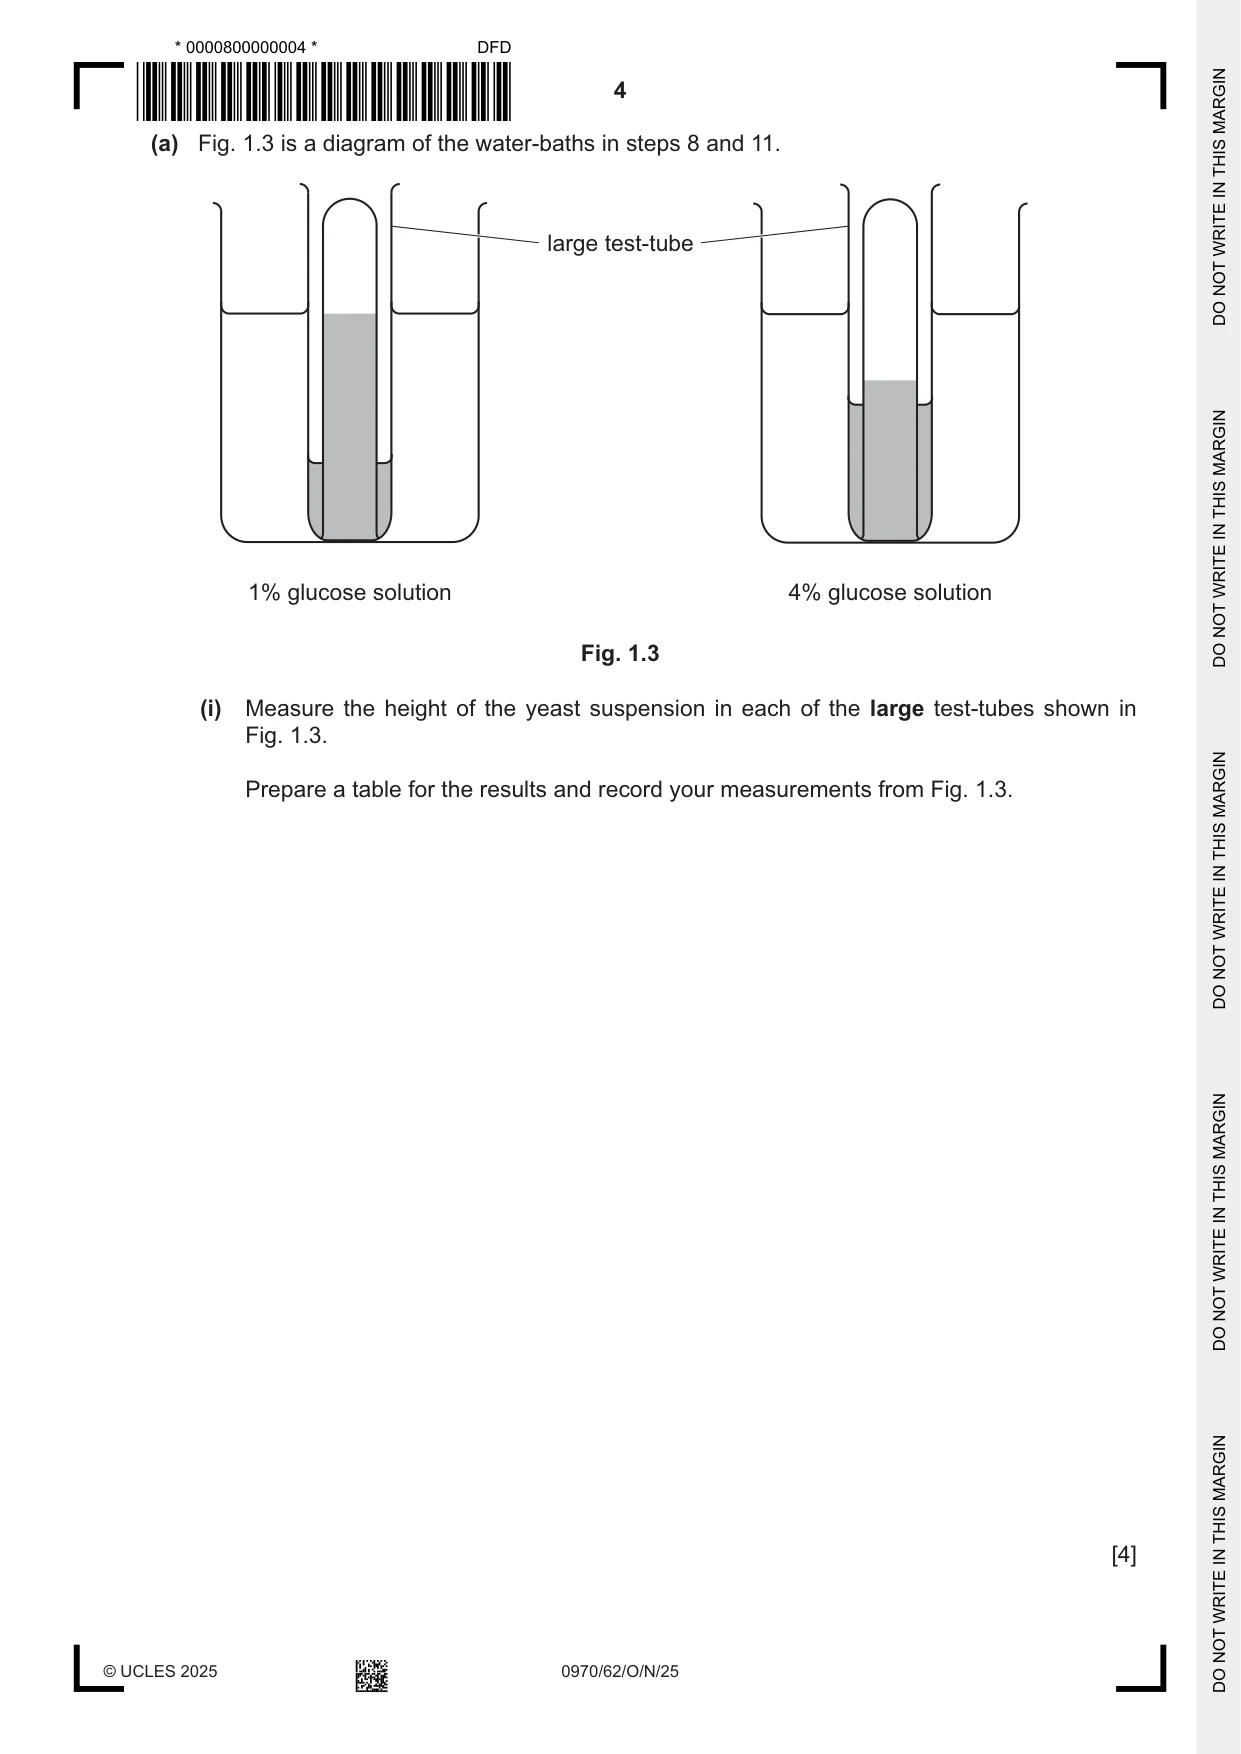
1 A student investigated the rate of respiration in yeast using different concentrations of glucose. They used a 5% glucose solution to make a 1% glucose solution and a 4% glucose solution. The student used this method: Step 1 Label two small test‑tubes 1% and 4%. Step 2 Use a syringe to put 1 cm3 of 5% glucose solution into the small test‑tube labelled 1%. Put 4 cm3 of 5% glucose solution into the small test‑tube labelled 4%. Step 3 Use a clean syringe to put 4 cm3 of distilled water into the small test‑tube labelled 1%. Put 1 cm3 of distilled water into the small test‑tube labelled 4%. Step 4 Pour yeast suspension into the small test‑tube labelled 1% until it is completely full. Step 5 Keep the small test‑tube upright and carefully place a large test‑tube over the top of the small test‑tube labelled 1%. Push the small test‑tube up to the top of the large test‑tube, as shown in Fig. 1.1A. Quickly invert the test‑tubes, as shown in Fig. 1.1B. A B C large test-tube small test-tube containing yeast water-bath suspension containing and glucose warm solution water finger holding the small test-tube in position while the test-tubes are inverted Fig. 1.1 Step 6 Put the large test‑tube and the small test‑tube labelled 1% into a warm water‑bath, as shown in Fig. 1.1C. Step 7 Start the stop‑clock and wait for five minutes. Step 8 After five minutes, stop the stop‑clock and use a ruler to measure the height of the yeast suspension in the large test‑tube, as shown in Fig. 1.2. height of the yeast suspension in the large test-tube after five minutes Fig. 1.2 Step 9 Remove the test‑tubes from the warm water‑bath and discard them. Step 10 Pour yeast suspension into the small test‑tube labelled 4% until it is completely full. Step 11 Repeat steps 5 to 8 with the small test‑tube labelled 4%. (a) Fig. 1.3 is a diagram of the water‑baths in steps 8 and 11. large test-tube 1% glucose solution 4% glucose solution Fig. 1.3 (i) Measure the height of the yeast suspension in each of the large test‑tubes shown in Fig. 1.3. Prepare a table for the results and record your measurements from Fig. 1.3. [4] (ii) State a conclusion for the results of this investigation. ........................................................................................................................................... ........................................................................................................................................... ..................................................................................................................................... [1] (iii) State the independent and dependent variables in this investigation. independent variable ......................................................................................................... ........................................................................................................................................... dependent variable ............................................................................................................ ........................................................................................................................................... [2] (iv) Describe how the temperature of the water‑bath could be maintained. ........................................................................................................................................... ........................................................................................................................................... ..................................................................................................................................... [1] (v) Explain why a clean syringe was used in step 3. ........................................................................................................................................... ........................................................................................................................................... ..................................................................................................................................... [1] (b) A student extended the investigation by using more concentrations of glucose solution. Calculate the volumes of 5% glucose solution and distilled water that are needed to make 5 cm3 of a 3% glucose solution. volume of 5% glucose solution ........................................................ cm3 volume of distilled water ........................................................ cm3 [1] (c) Sports drinks often contain glucose, which is a reducing sugar. State how you could test a sample of a sports drink for reducing sugar. ................................................................................................................................................... ................................................................................................................................................... ................................................................................................................................................... ................................................................................................................................................... ............................................................................................................................................. [2] (d) (i) The ethanol emulsion test can be used to show that a sample of food contains fat. State the result of a positive test. ..................................................................................................................................... [1] (ii) Suggest one safety precaution that should be followed when using ethanol. ........................................................................................................................................... ........................................................................................................................................... ..................................................................................................................................... [1] [Total: 14]
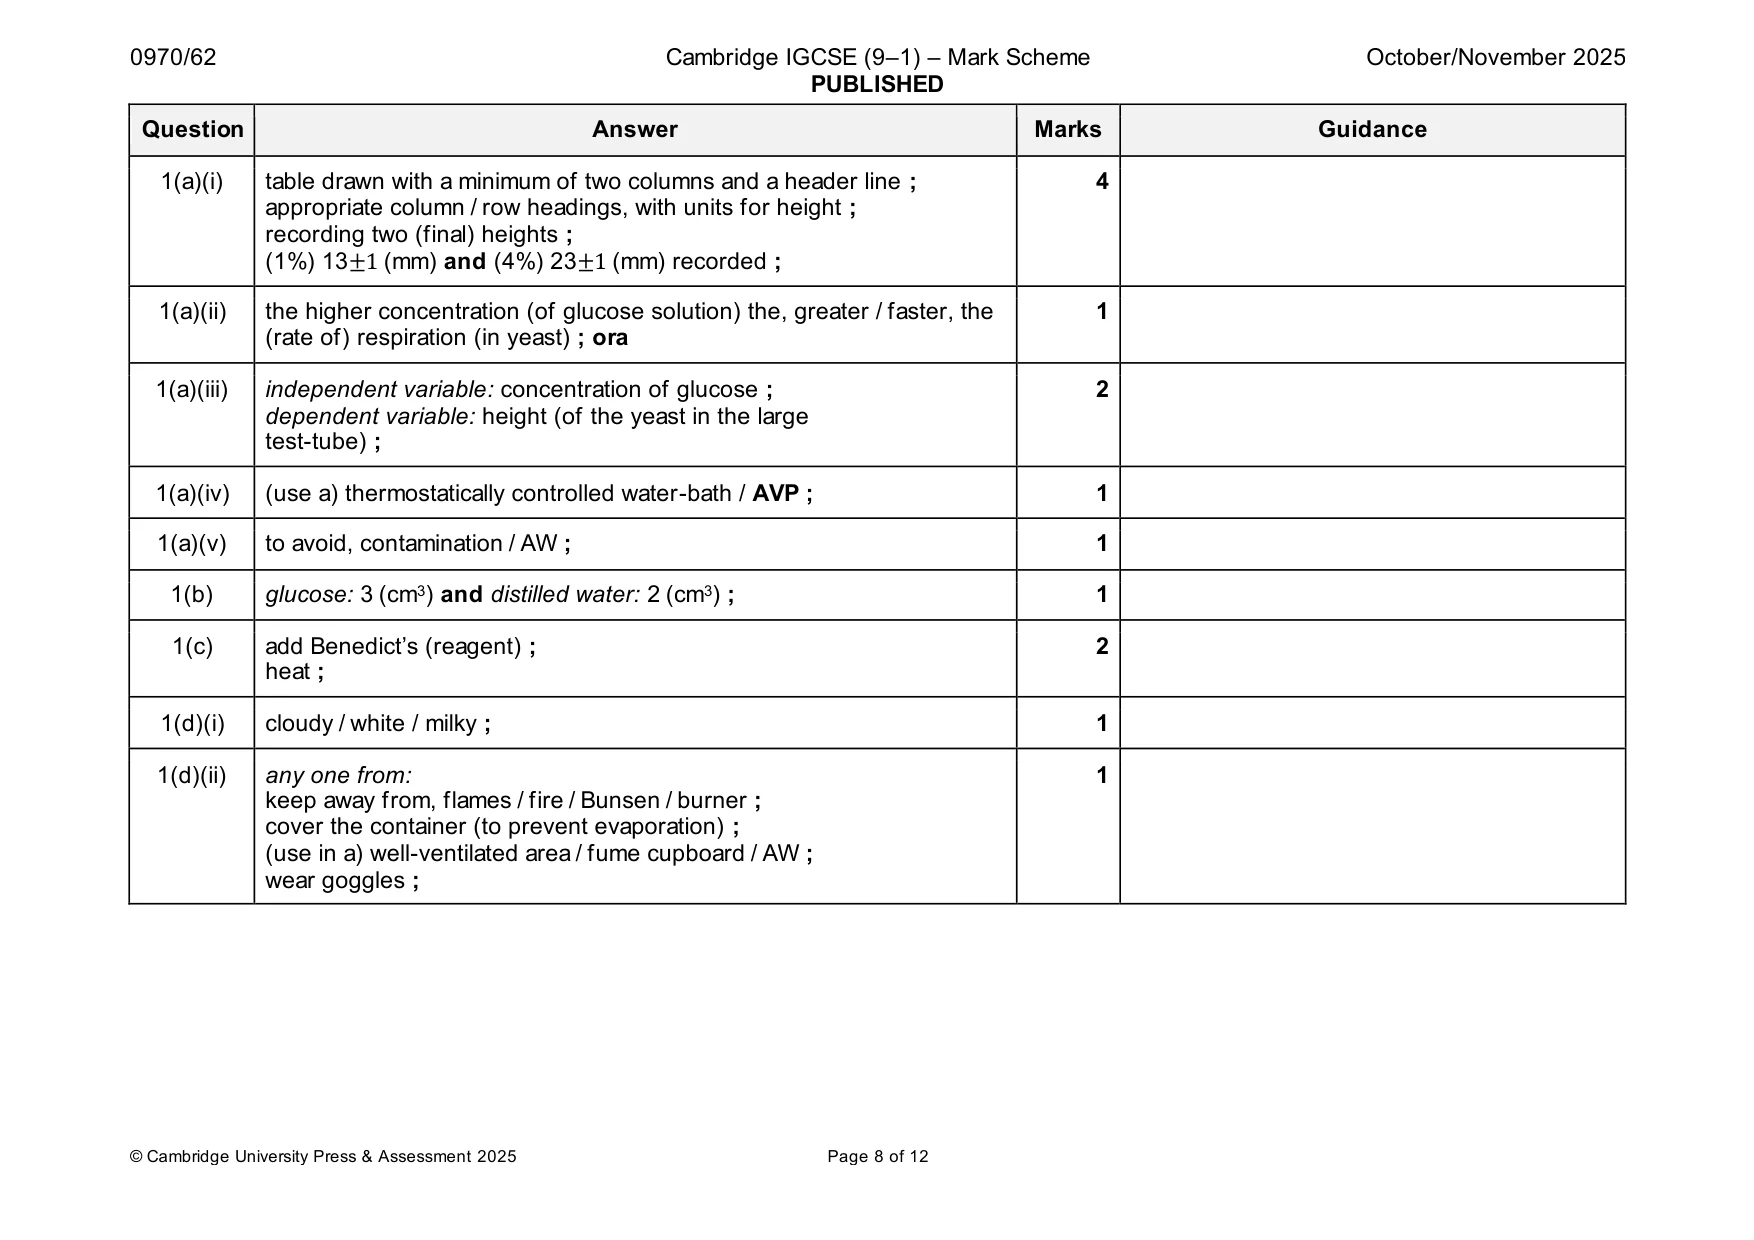
Mark scheme: Question Answer Marks Guidance 1(a)(i) table drawn with a minimum of two columns and a header line ; 4 appropriate column / row headings, with units for height ; recording two (final) heights ; (1%) 13±1 (mm) and (4%) 23±1 (mm) recorded ; 1(a)(ii) the higher concentration (of glucose solution) the, greater / faster, the 1 (rate of) respiration (in yeast) ; ora 1(a)(iii) independent variable: concentration of glucose ; 2 dependent variable: height (of the yeast in the large test-tube) ; 1(a)(iv) (use a) thermostatically controlled water-bath / AVP ; 1 1(a)(v) to avoid, contamination / AW ; 1 1(b) glucose: 3 (cm3) and distilled water: 2 (cm3) ; 1 1(c) add Benedict’s (reagent) ; 2 heat ; 1(d)(i) cloudy / white / milky ; 1 1(d)(ii) any one from: 1 keep away from, flames / fire / Bunsen / burner ; cover the container (to prevent evaporation) ; (use in a) well-ventilated area / fume cupboard / AW ; wear goggles ;
Q2 · Plan an investigation to determine the effect of exercise intensity on heart rate in…
2 Plan an investigation to determine the effect of exercise intensity on heart rate in humans. .......................................................................................................................................................... .......................................................................................................................................................... .......................................................................................................................................................... .......................................................................................................................................................... .......................................................................................................................................................... .......................................................................................................................................................... .......................................................................................................................................................... .......................................................................................................................................................... .......................................................................................................................................................... .......................................................................................................................................................... .......................................................................................................................................................... .......................................................................................................................................................... .................................................................................................................................................... [6]
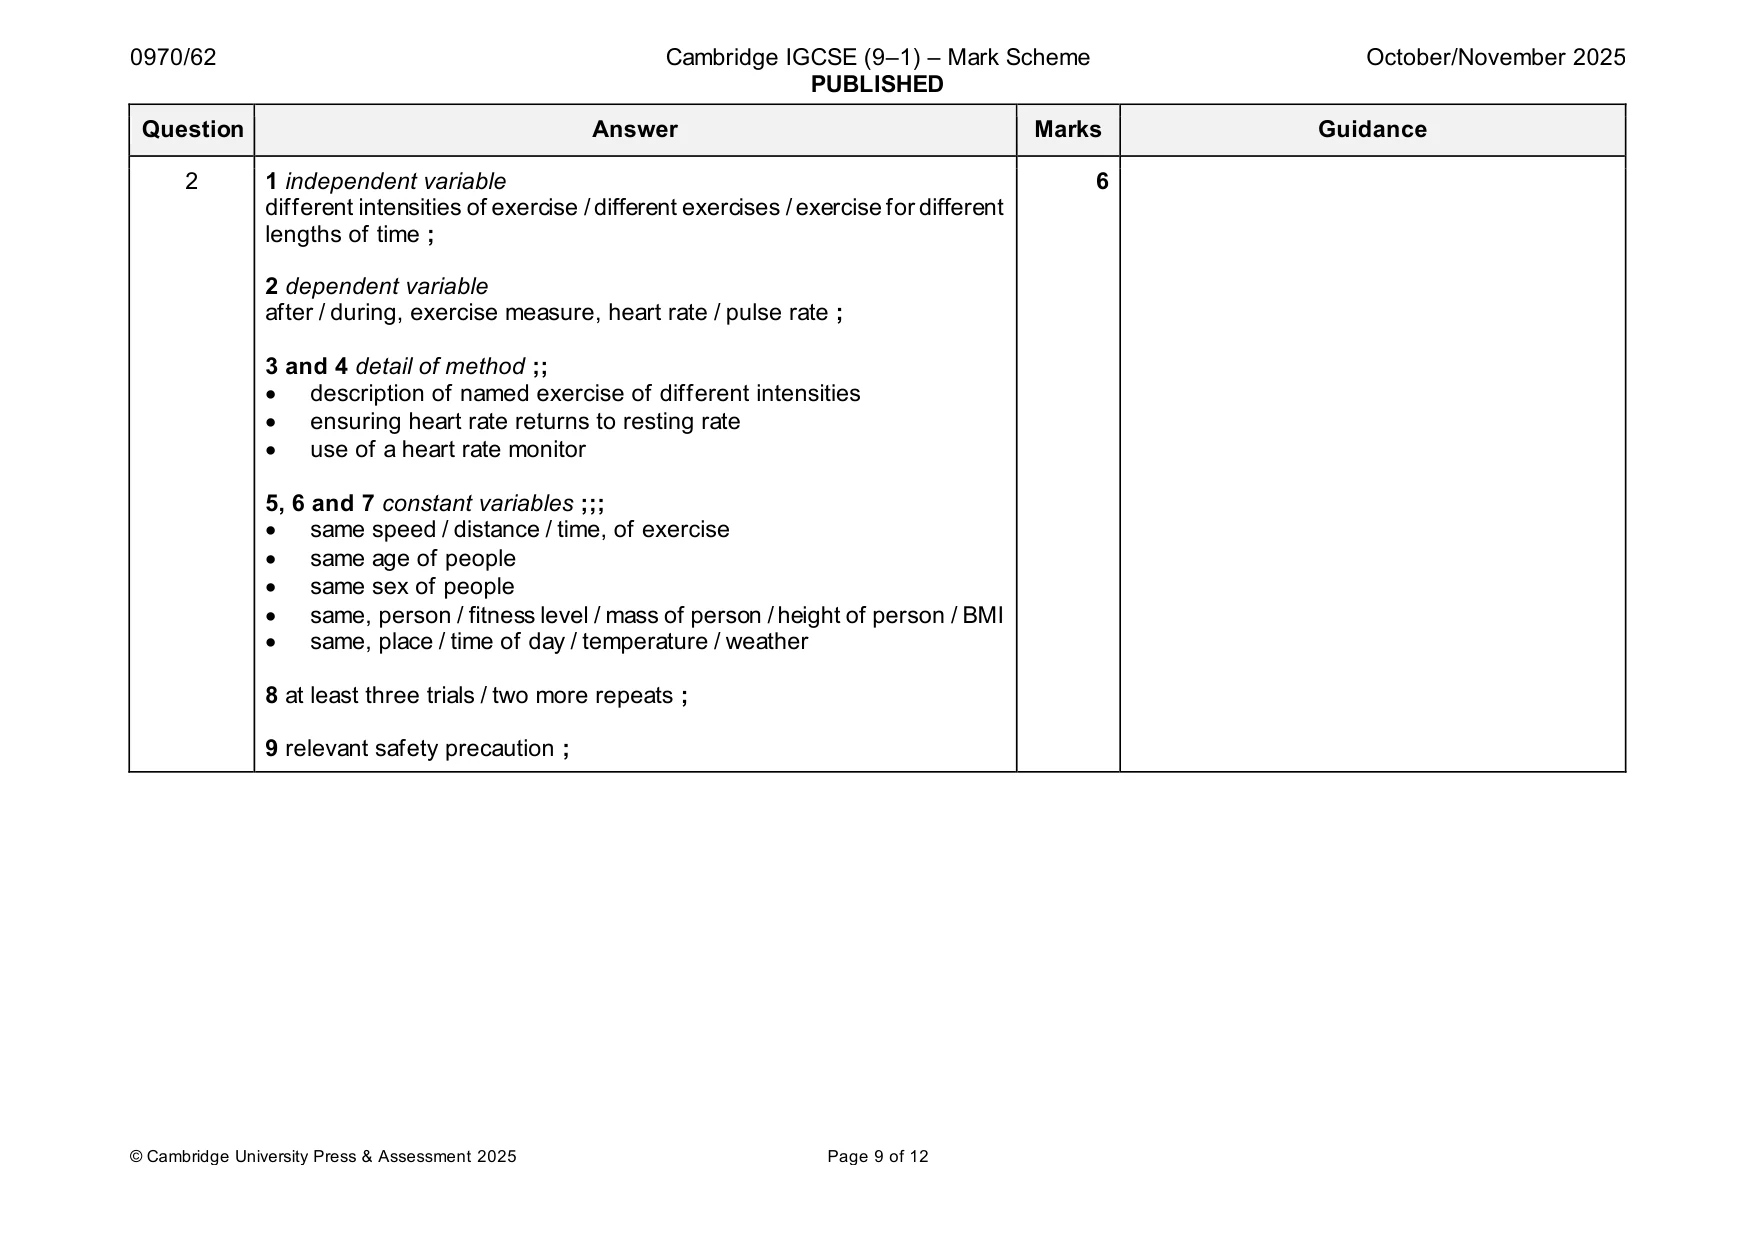
Mark scheme: 2 1 independent variable 6 different intensities of exercise / different exercises / exercise for different lengths of time ; 2 dependent variable after / during, exercise measure, heart rate / pulse rate ; 3 and 4 detail of method ;; • description of named exercise of different intensities • ensuring heart rate returns to resting rate • use of a heart rate monitor 5, 6 and 7 constant variables ;;; • same speed / distance / time, of exercise • same age of people • same sex of people • same, person / fitness level / mass of person / height of person / BMI • same, place / time of day / temperature / weather 8 at least three trials / two more repeats ; 9 relevant safety precaution ;
Q3 · A photograph of a necklace starfish, Fromia monilis
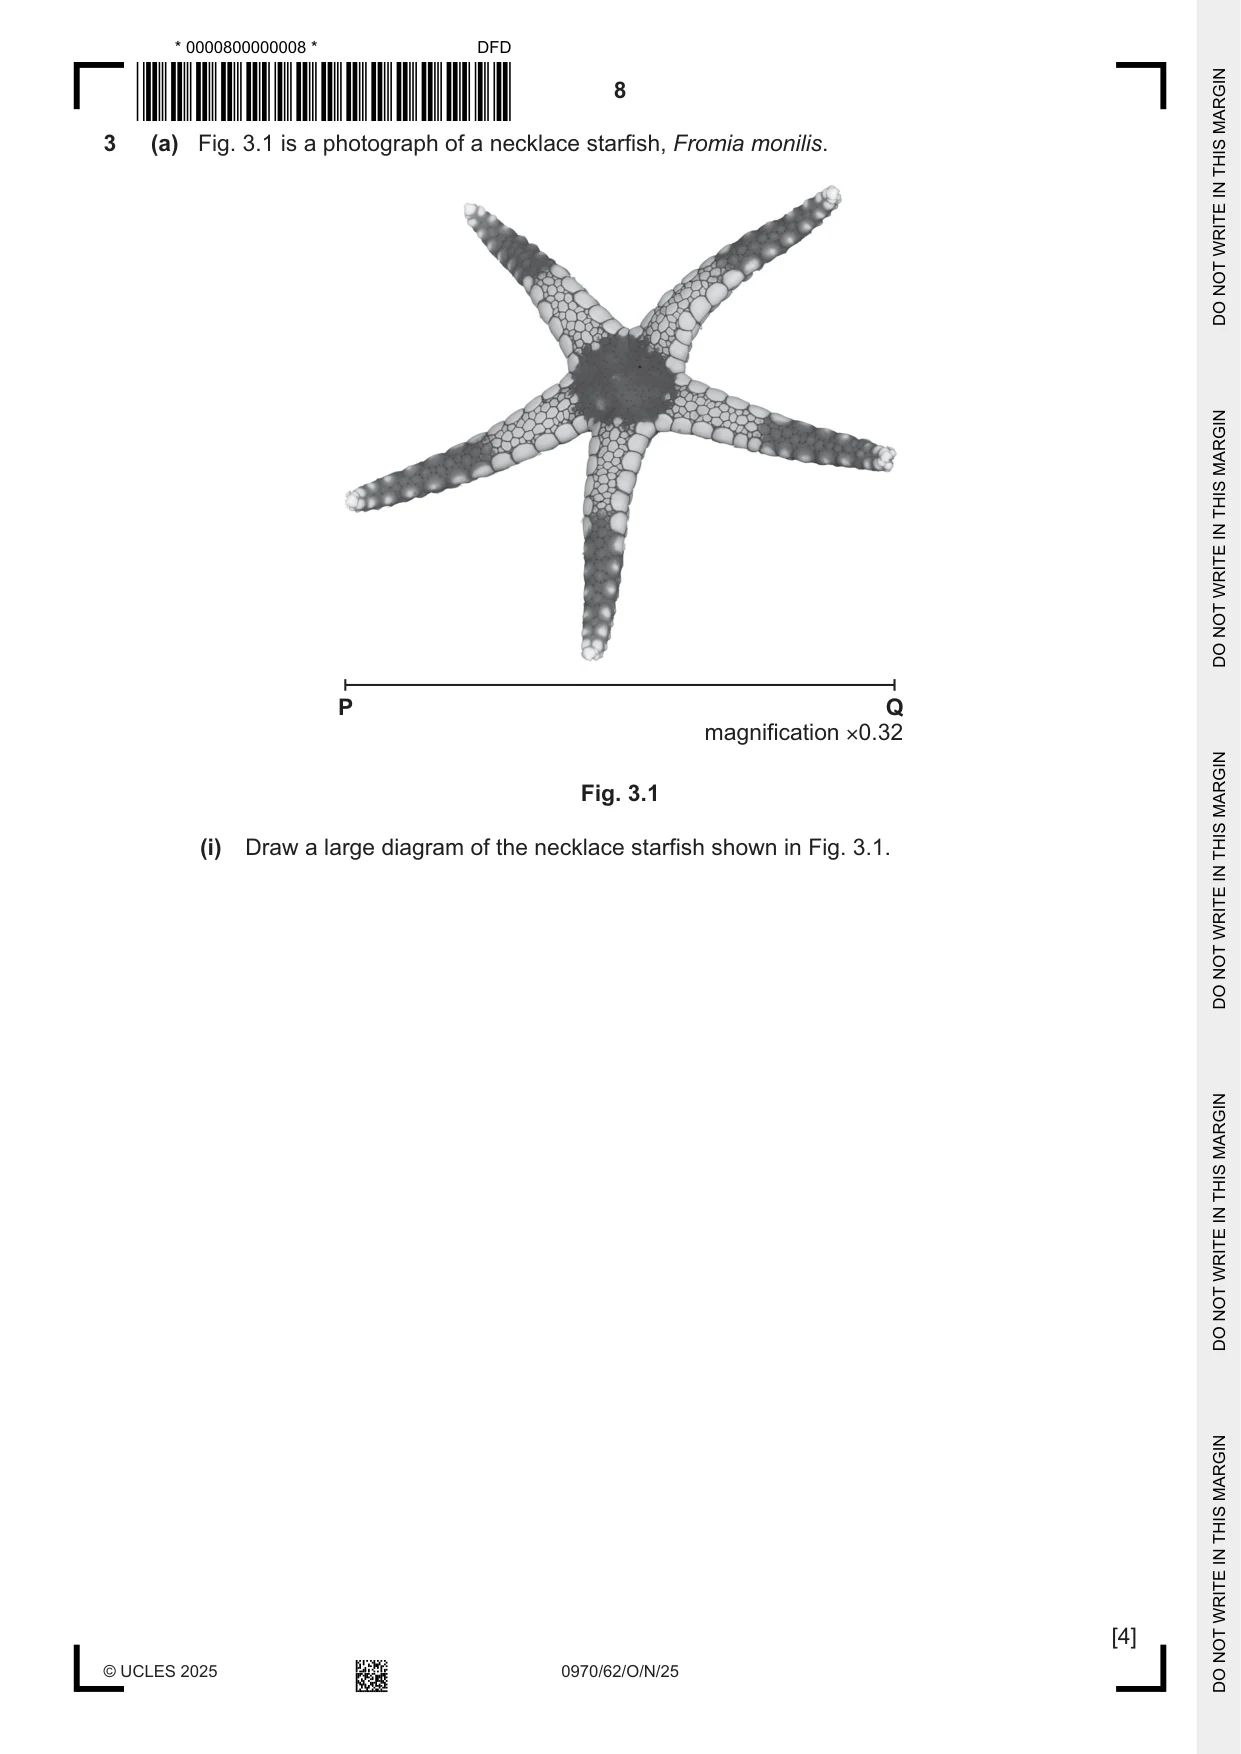
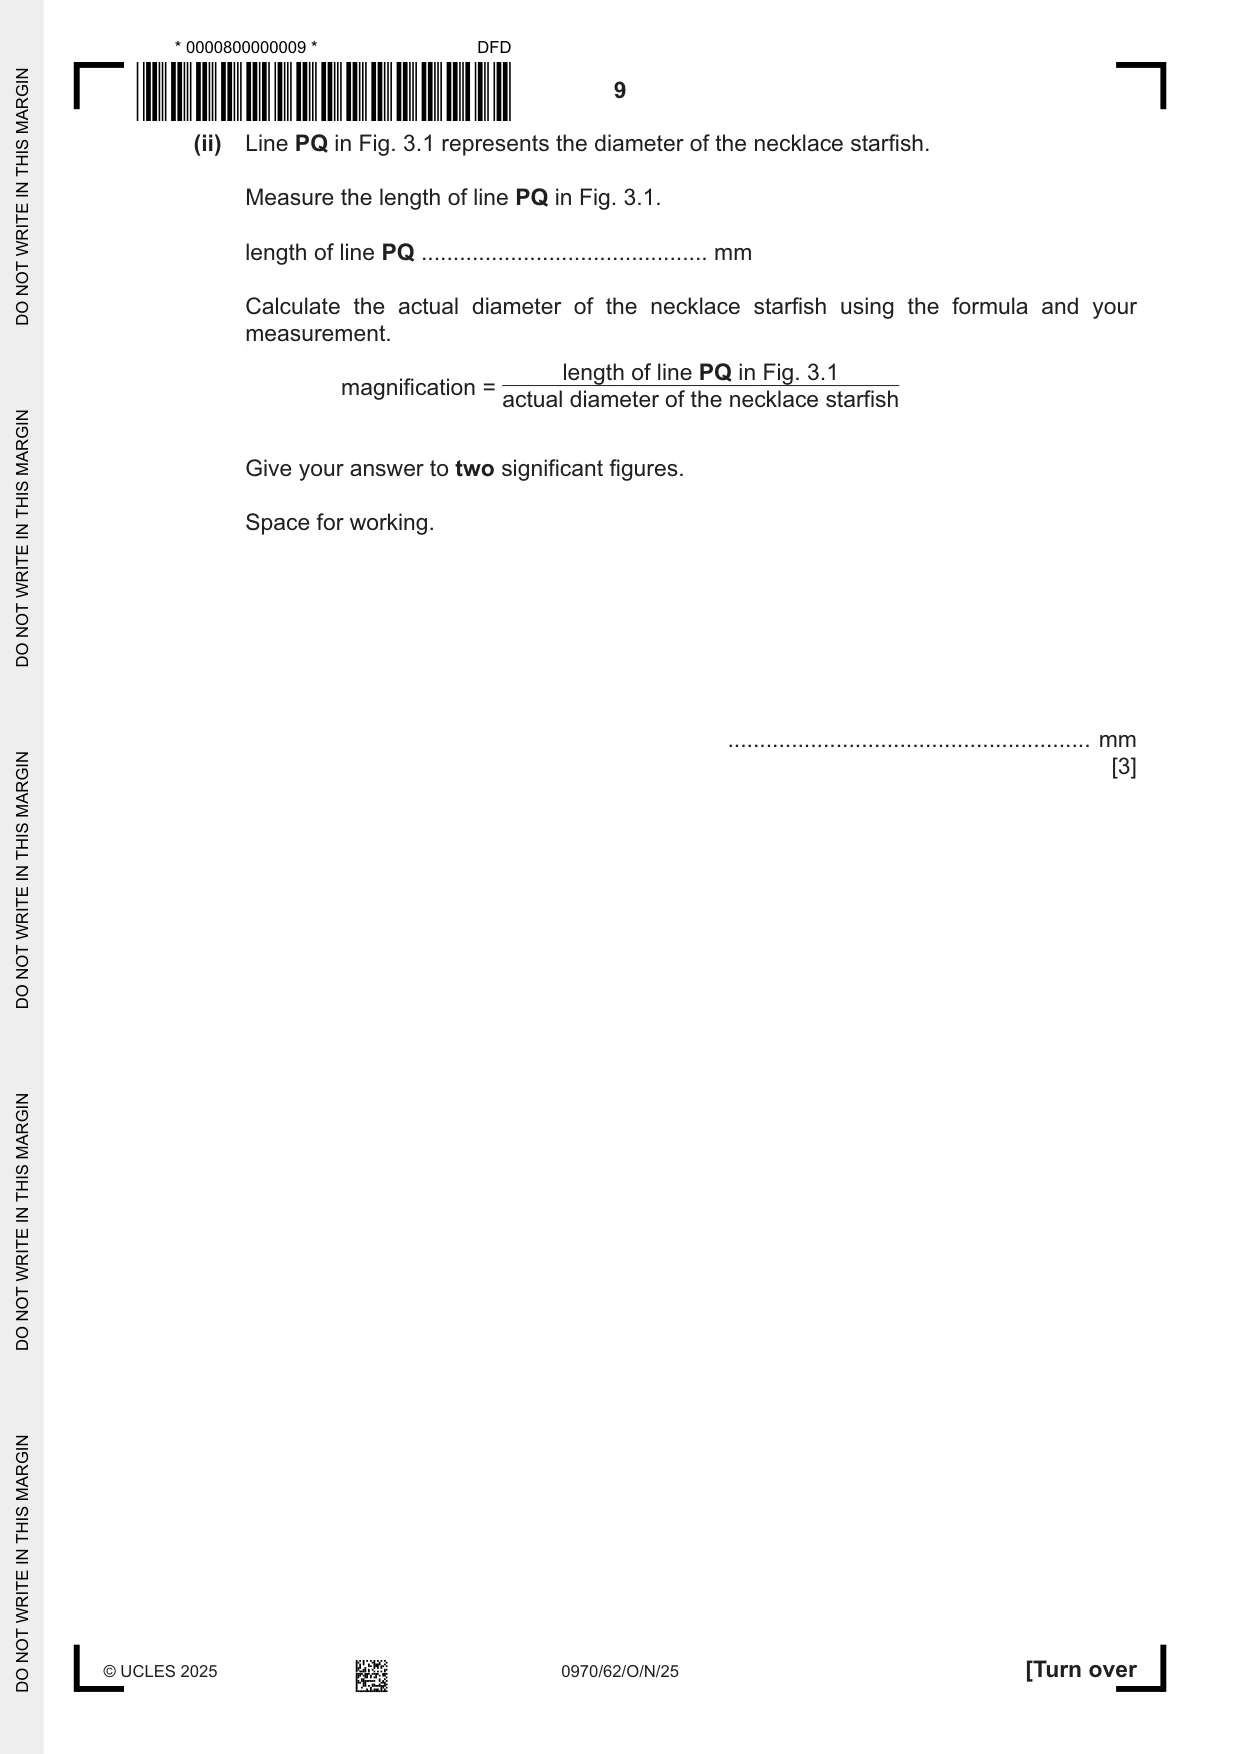
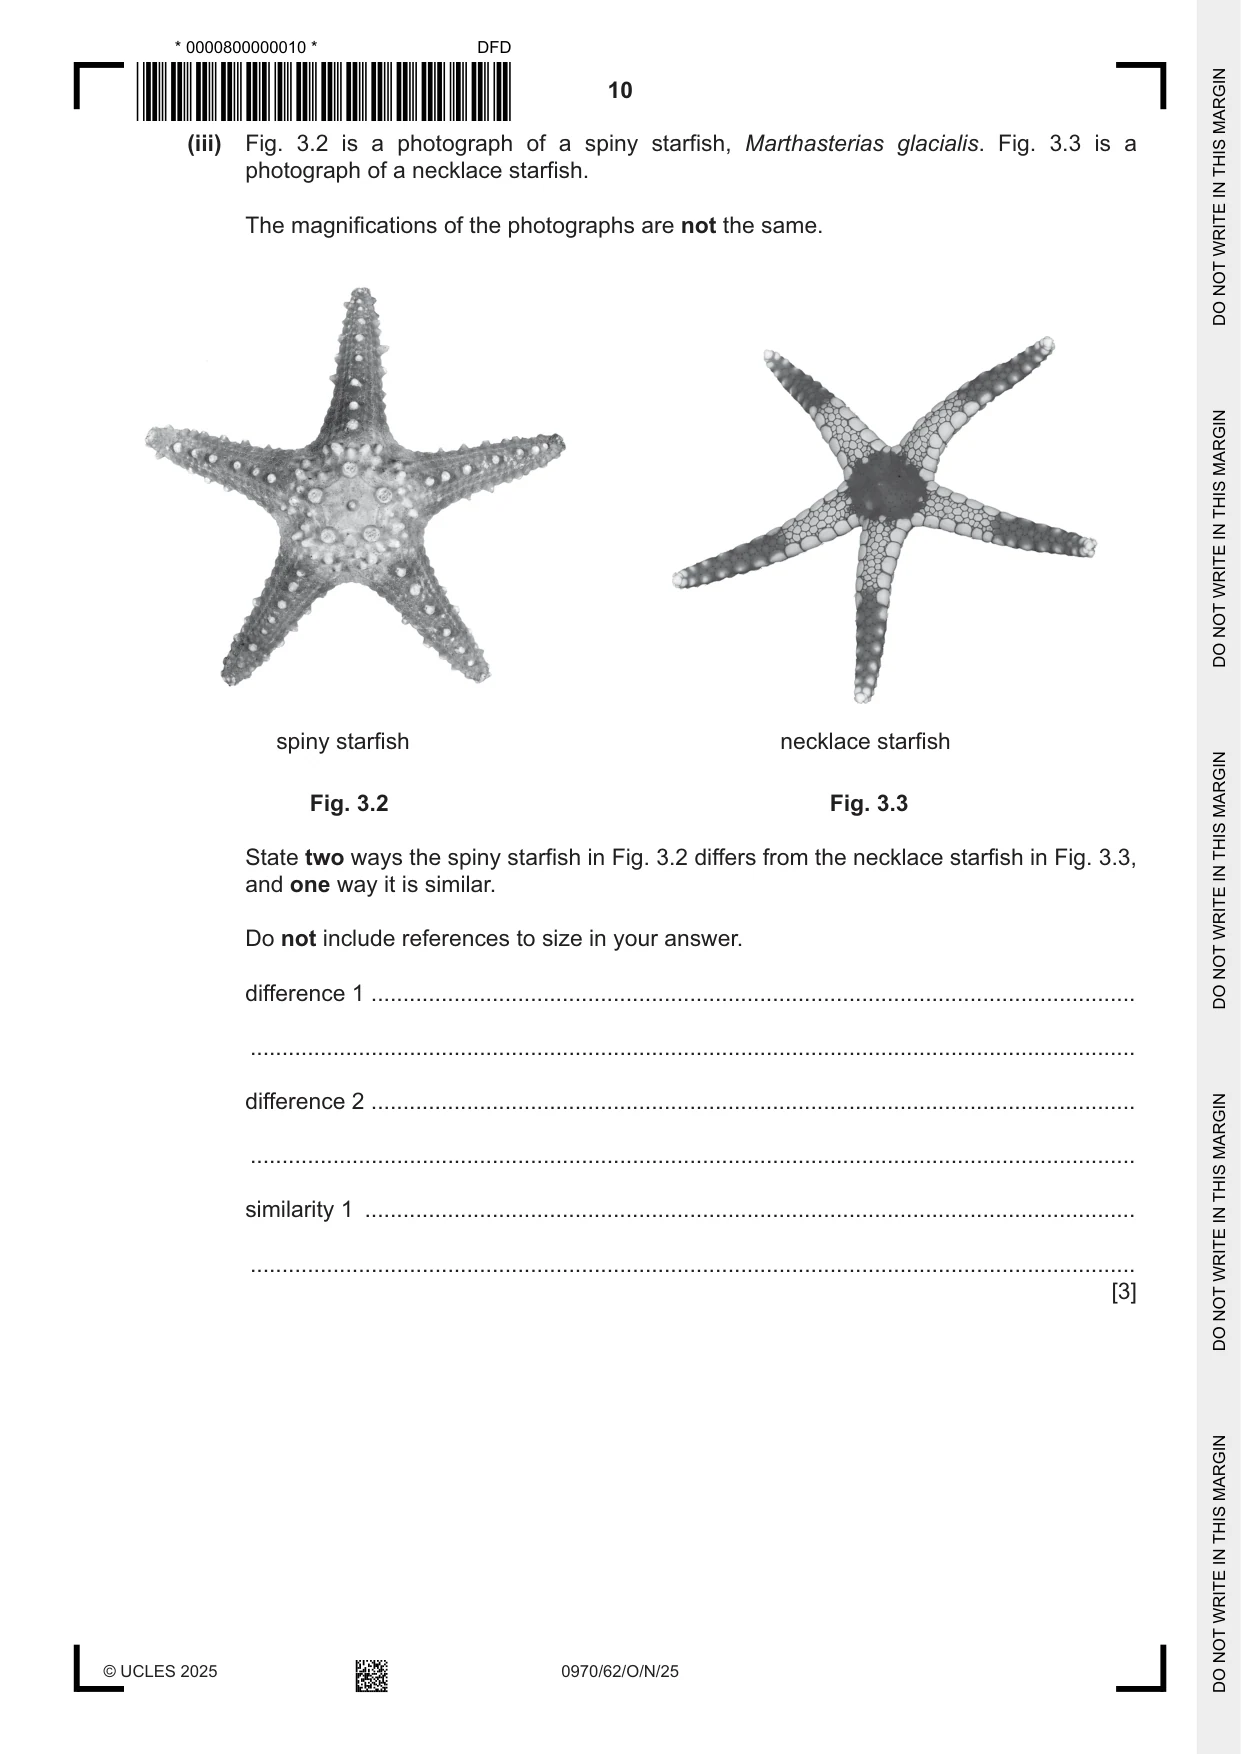
3 (a) Fig. 3.1 is a photograph of a necklace starfish, Fromia monilis. P Q magnification ×0.32 Fig. 3.1 (i) Draw a large diagram of the necklace starfish shown in Fig. 3.1. [4] (ii) Line PQ in Fig. 3.1 represents the diameter of the necklace starfish. Measure the length of line PQ in Fig. 3.1. length of line PQ ............................................. mm Calculate the actual diameter of the necklace starfish using the formula and your measurement. length of line PQ in Fig. 3.1 magnification = actual diameter of the necklace starfish Give your answer to two significant figures. Space for working. ......................................................... mm [3] (iii) Fig. 3.2 is a photograph of a spiny starfish, Marthasterias glacialis. Fig. 3.3 is a photograph of a necklace starfish. The magnifications of the photographs are not the same. spiny starfish necklace starfish Fig. 3.2 Fig. 3.3 State two ways the spiny starfish in Fig. 3.2 differs from the necklace starfish in Fig. 3.3, and one way it is similar. Do not include references to size in your answer. difference 1 ........................................................................................................................ ........................................................................................................................................... difference 2 ........................................................................................................................ ........................................................................................................................................... similarity 1 ......................................................................................................................... ........................................................................................................................................... [3]
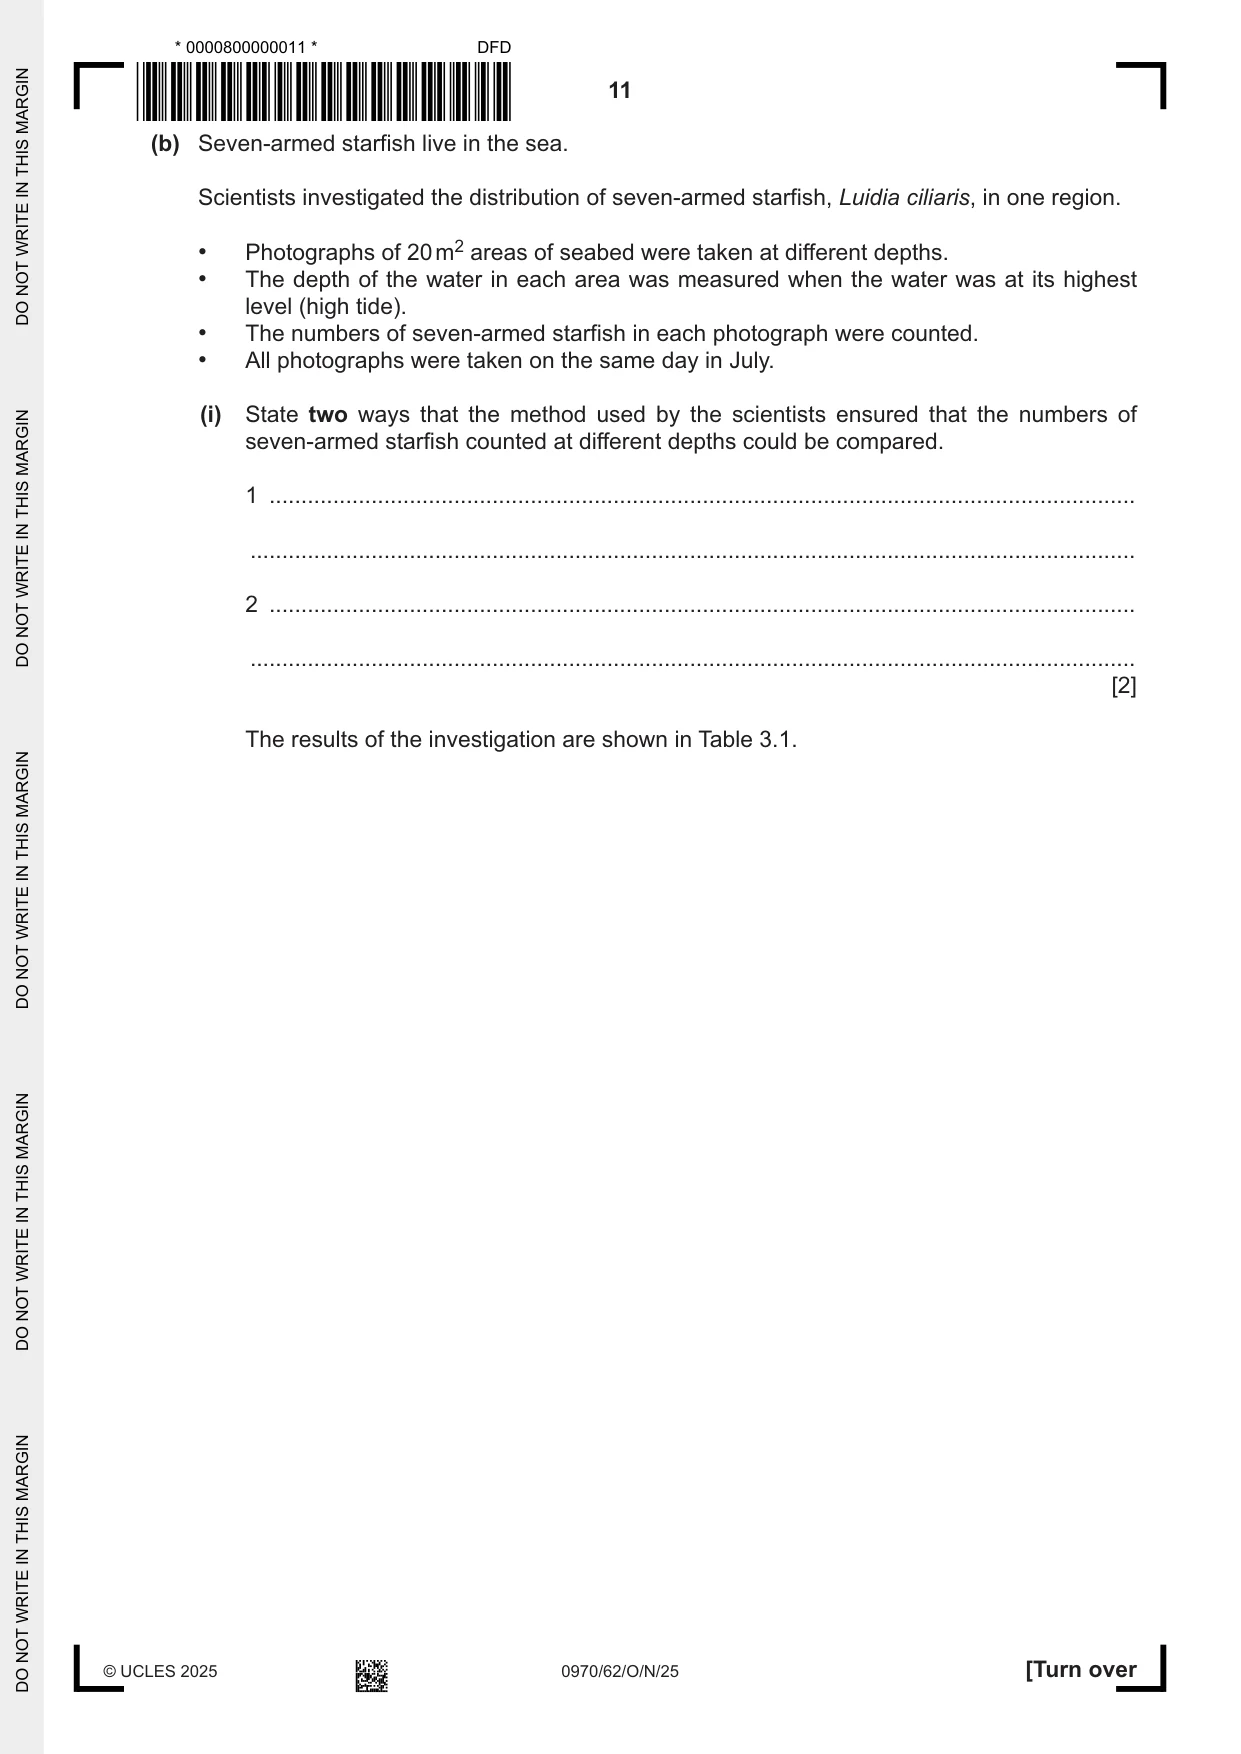
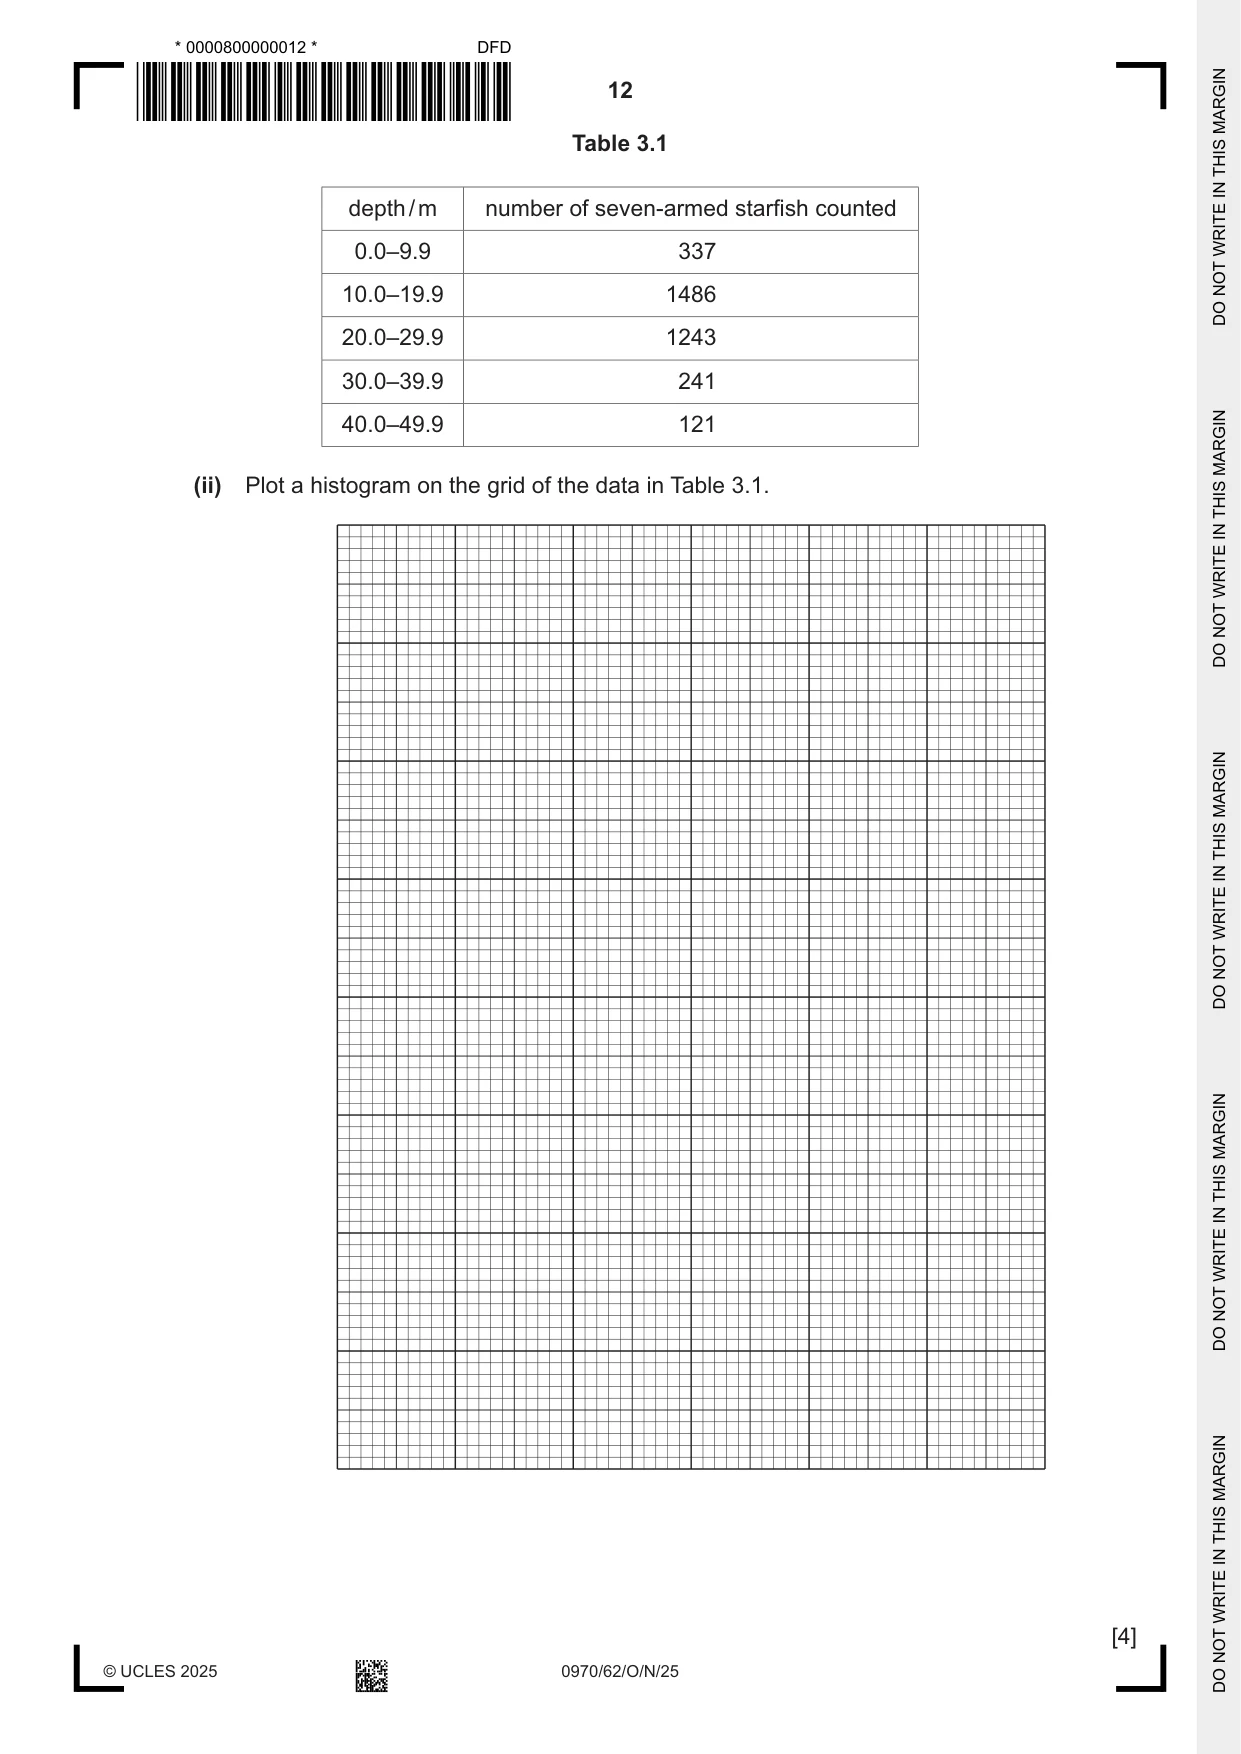
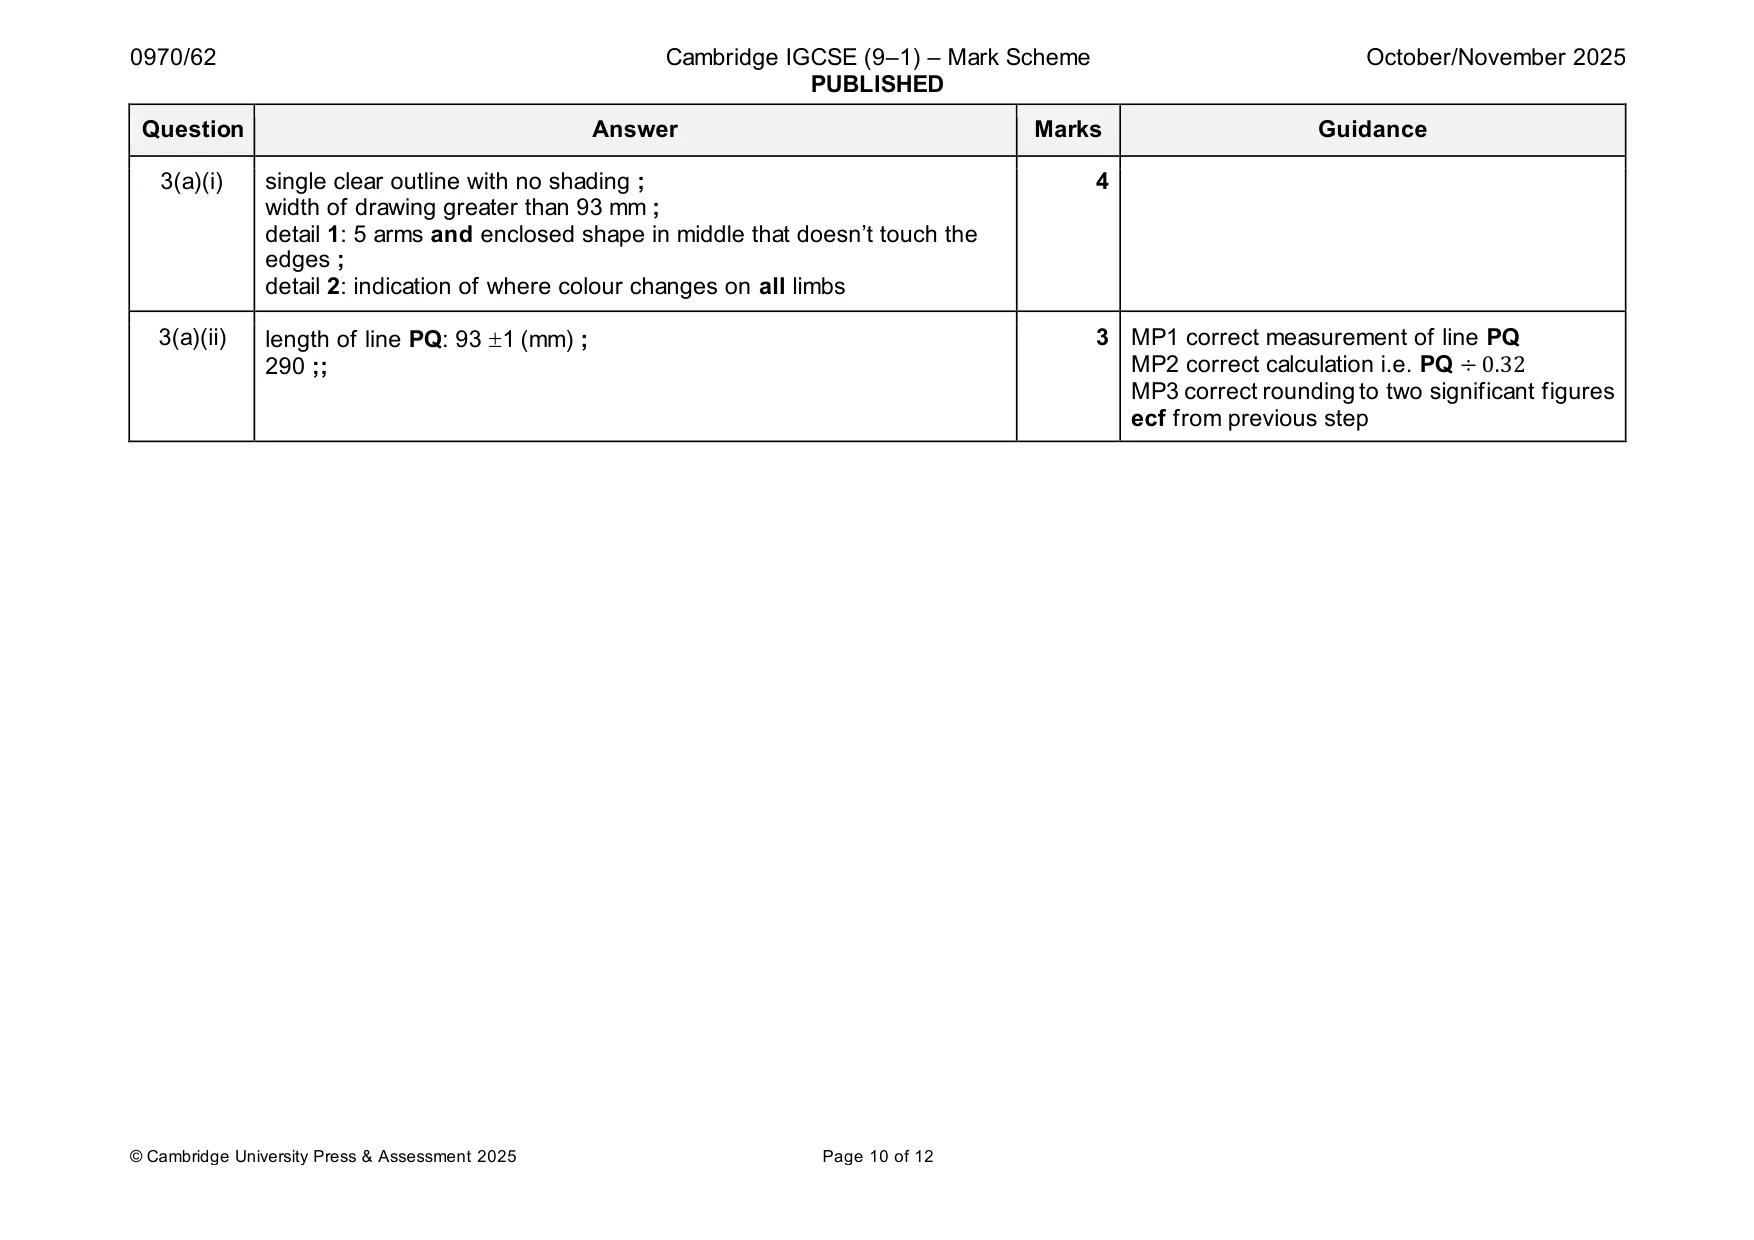
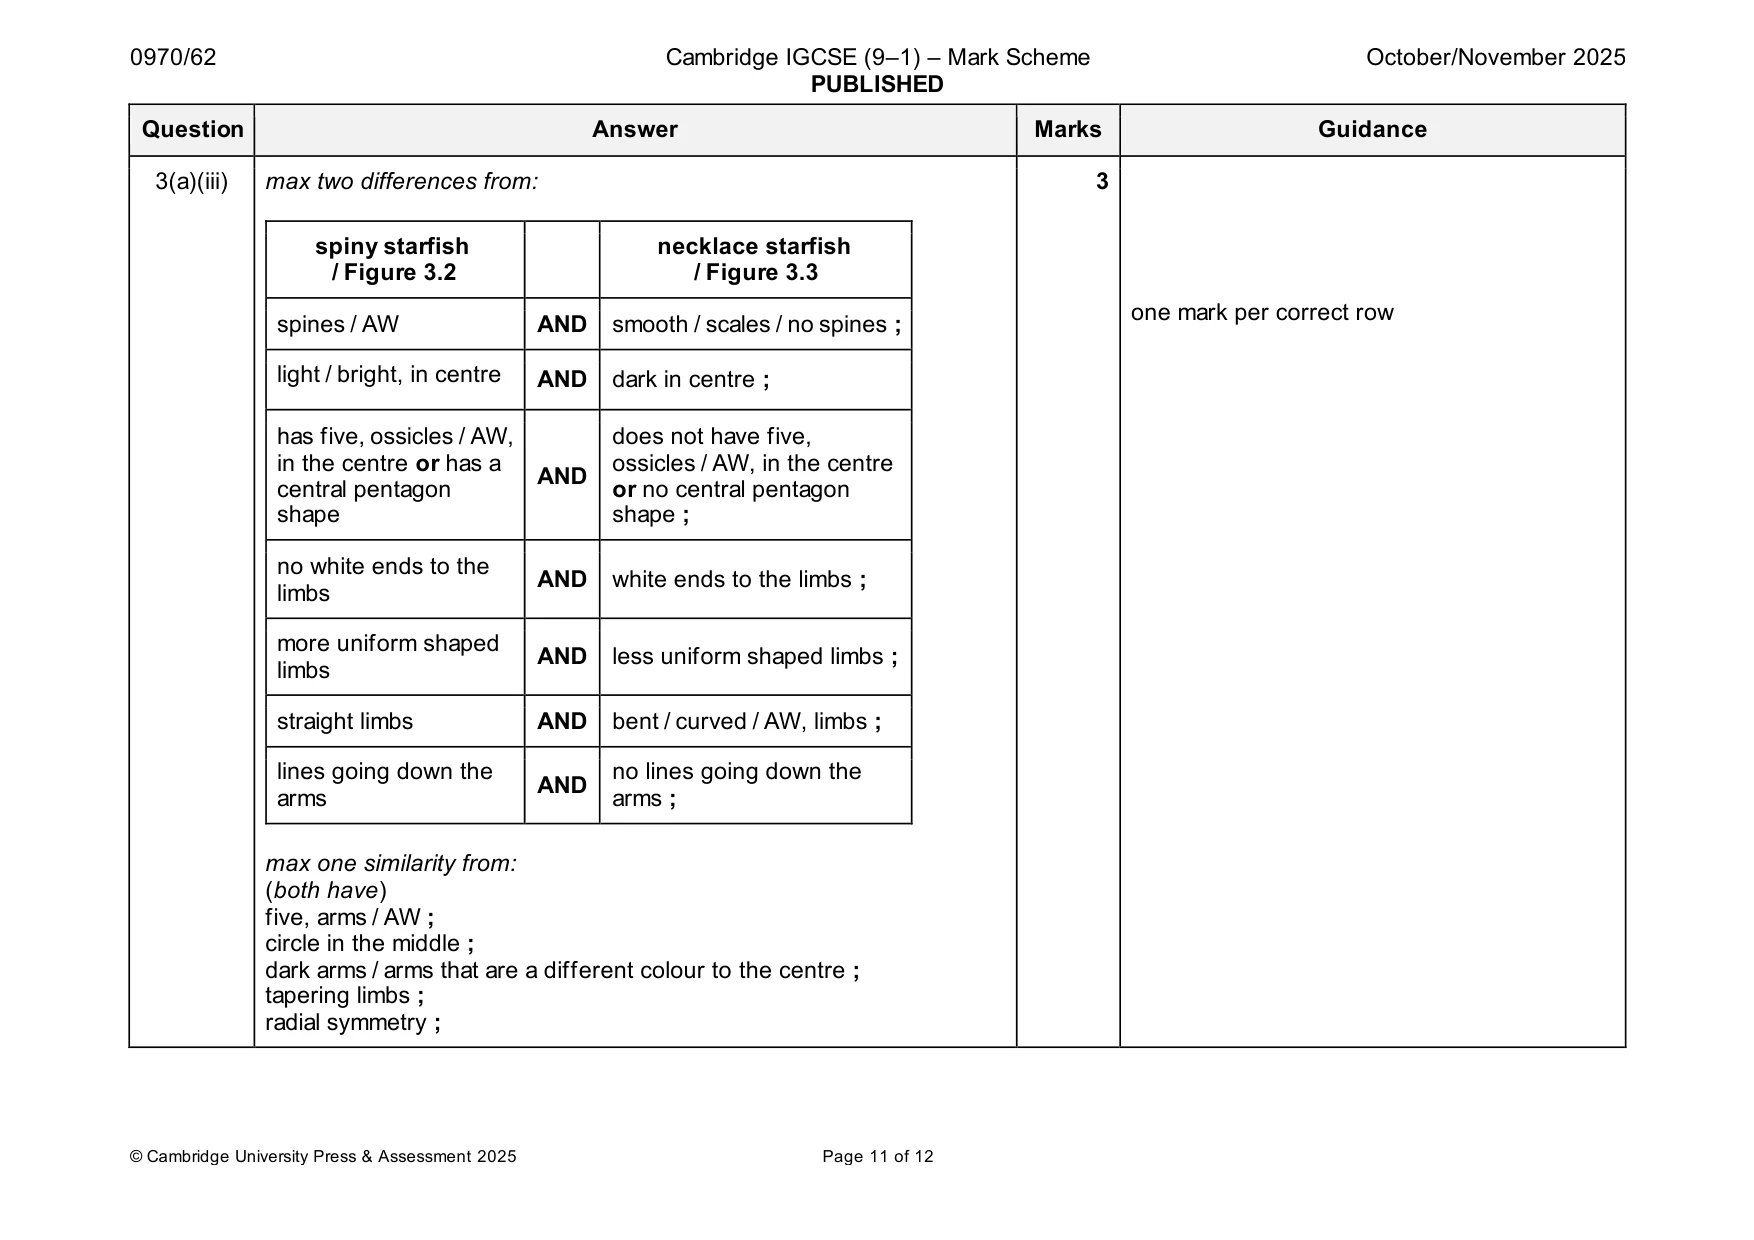
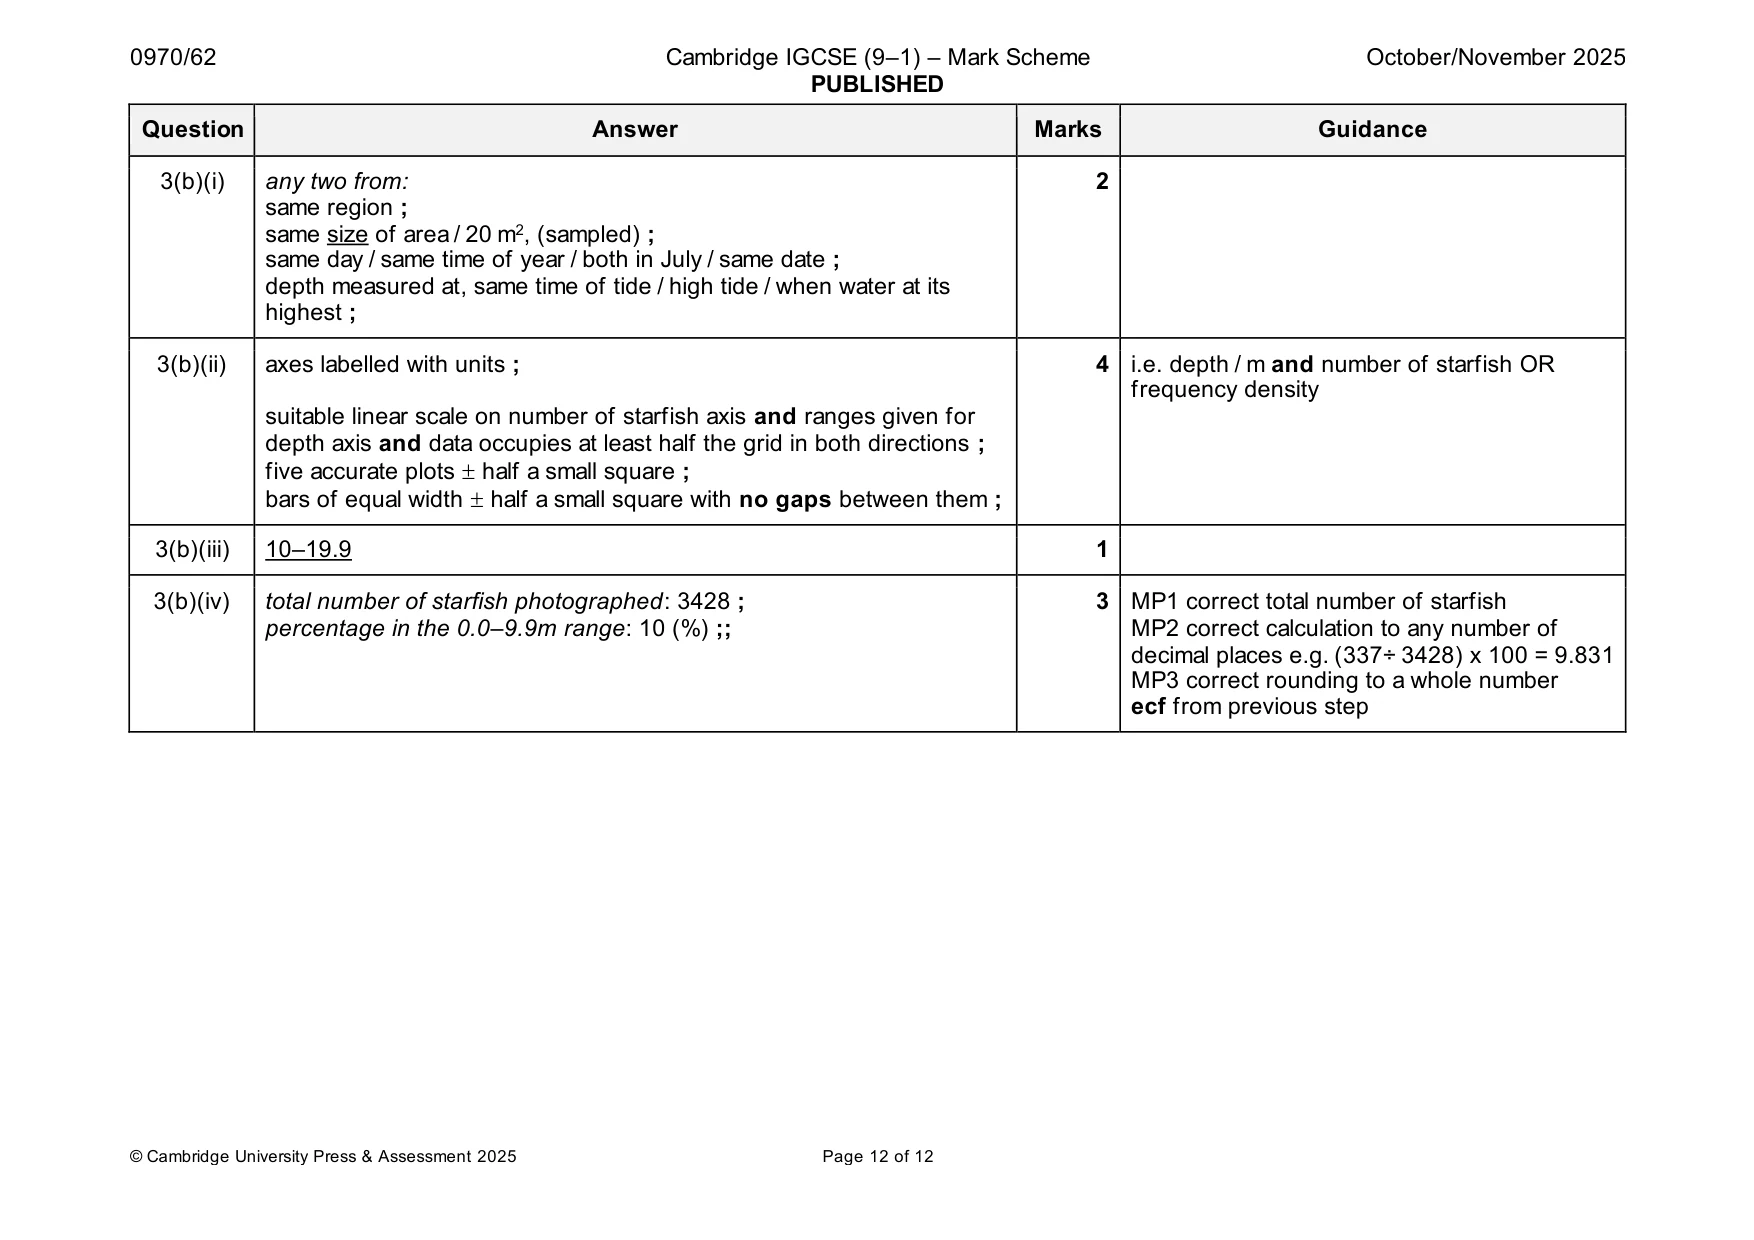
Mark scheme: 3(a)(i) single clear outline with no shading ; 4 width of drawing greater than 93 mm ; detail 1: 5 arms and enclosed shape in middle that doesn’t touch the edges ; detail 2: indication of where colour changes on all limbs 3(a)(ii) length of line PQ: 93 1 (mm) ; 3 MP1 correct measurement of line PQ 290 ;; MP2 correct calculation i.e. PQ ÷ 0.32 MP3 correct rounding to two significant figures ecf from previous step 3(a)(iii) max two differences from: 3 spiny starfish necklace starfish / Figure 3.2 / Figure 3.3 one mark per correct row spines / AW AND smooth / scales / no spines ; light / bright, in centre AND dark in centre ; has five, ossicles / AW, does not have five, in the centre or has a ossicles / AW, in the centre AND central pentagon or no central pentagon shape shape ; no white ends to the AND white ends to the limbs ; limbs more uniform shaped AND less uniform shaped limbs ; limbs straight limbs AND bent / curved / AW, limbs ; lines going down the no lines going down the AND arms arms ; max one similarity from: (both have) five, arms / AW ; circle in the middle ; dark arms / arms that are a different colour to the centre ; tapering limbs ; radial symmetry ; 3(b)(i) any two from: 2 same region ; same size of area / 20 m2, (sampled) ; same day / same time of year / both in July / same date ; depth measured at, same time of tide / high tide / when water at its highest ; 3(b)(ii) axes labelled with units ; 4 i.e. depth / m and number of starfish OR frequency density suitable linear scale on number of starfish axis and ranges given for depth axis and data occupies at least half the grid in both directions ; five accurate plots half a small square ; bars of equal width half a small square with no gaps between them ; 3(b)(iii) 10–19.9 1 3(b)(iv) total number of starfish photographed: 3428 ; 3 MP1 correct total number of starfish percentage in the 0.0–9.9m range: 10 (%) ;; MP2 correct calculation to any number of decimal places e.g. (337÷ 3428) x 100 = 9.831 MP3 correct rounding to a whole number ecf from previous step
What was in this paper
The subtopics covered by these 3 questions, and how many questions each got. Open one in a new tab to see every Cambridge question on it.
What you needed in this session
Cambridge’s own grade thresholds for 2025 Oct/Nov, Paper 6 · Variant 2. A higher threshold means an easier paper — the bar moves with how the cohort did.