Cambridge IGCSE Biology (9-1) 0970 — 2025 May/June Paper 6 · Variant 1
0970/61/M/J/25 · 2 questions · 40 marks · ≈45 min
The question paper and its mark scheme, free to read here and free to download. This is Cambridge’s own paper, exactly as it was sat.
Question paper12 pages
Mark scheme11 pages
Answers below. Sit the paper first if you are practising.
Questions as text
Q1 · A student investigated the effect of concentration on diffusion
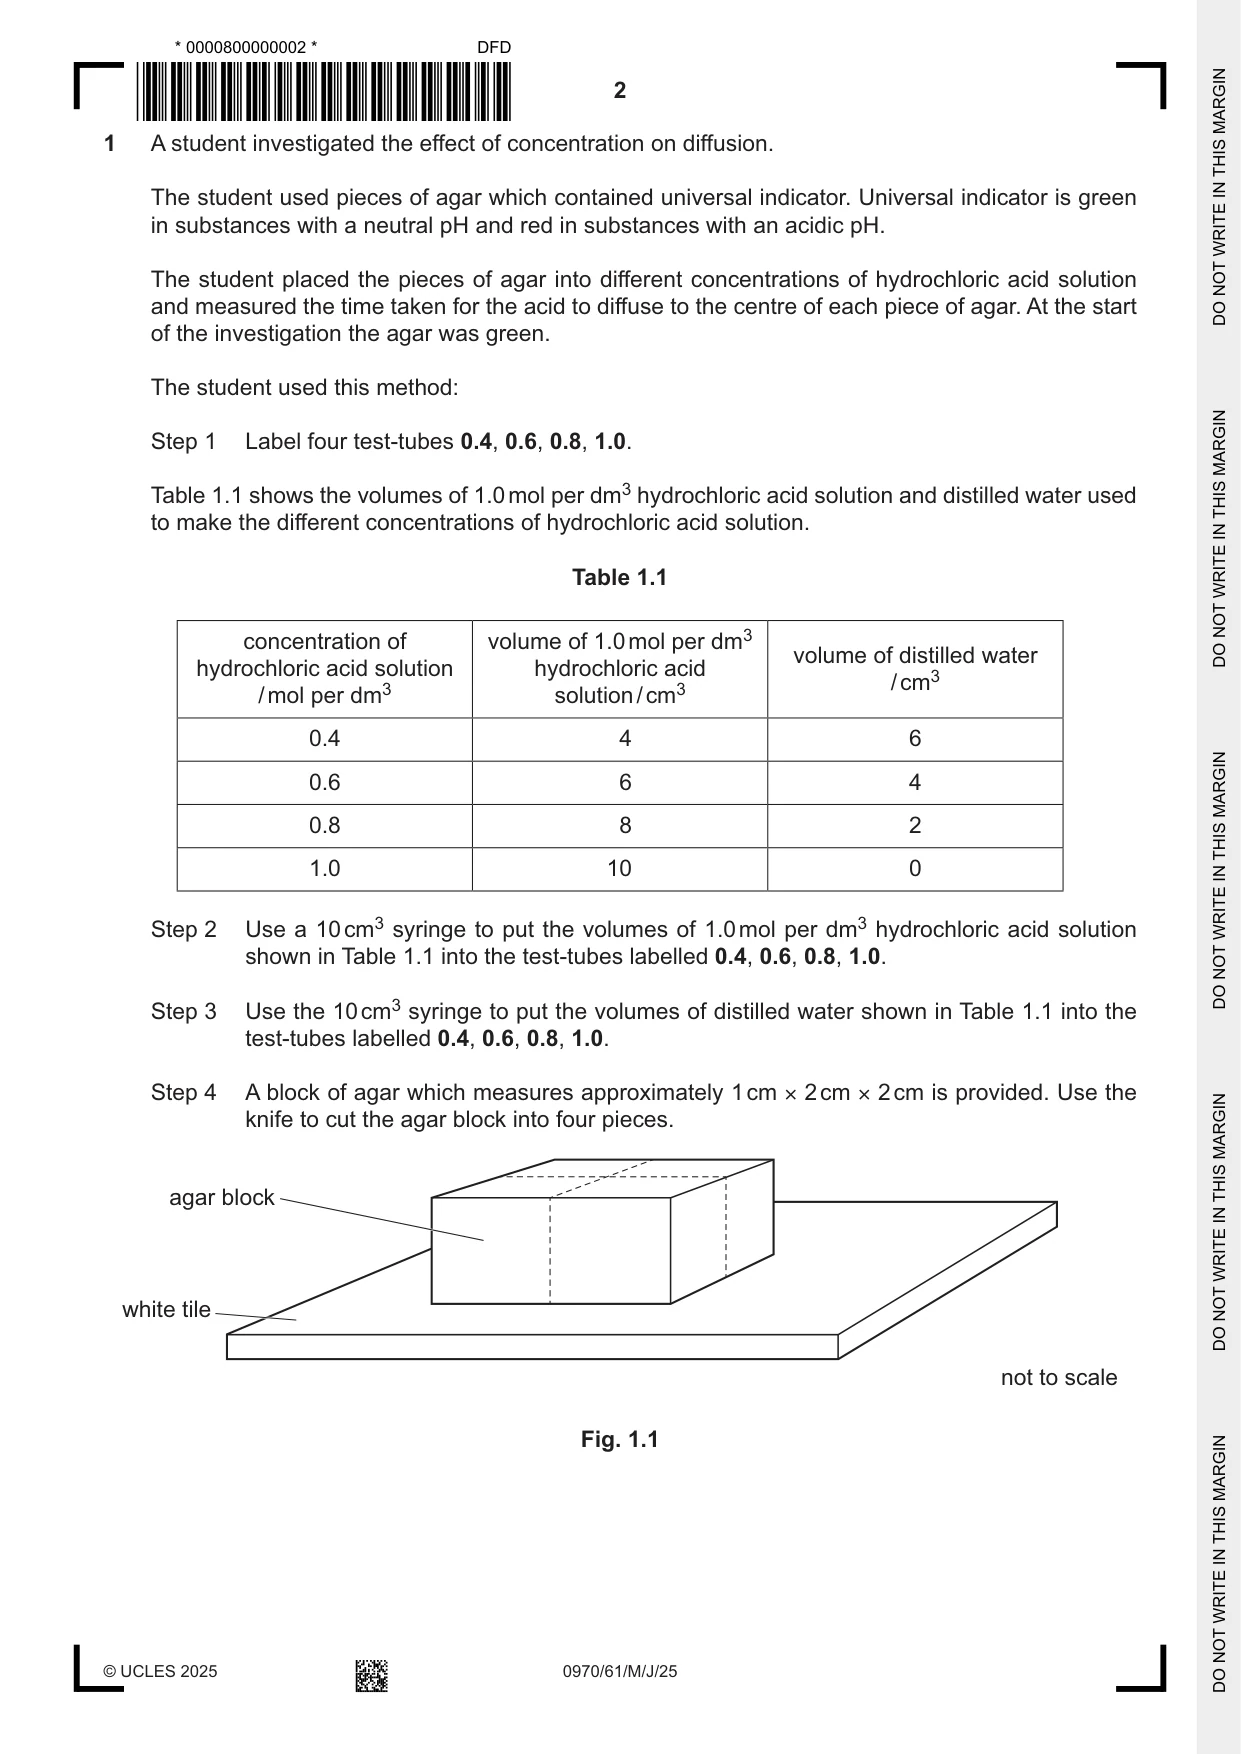
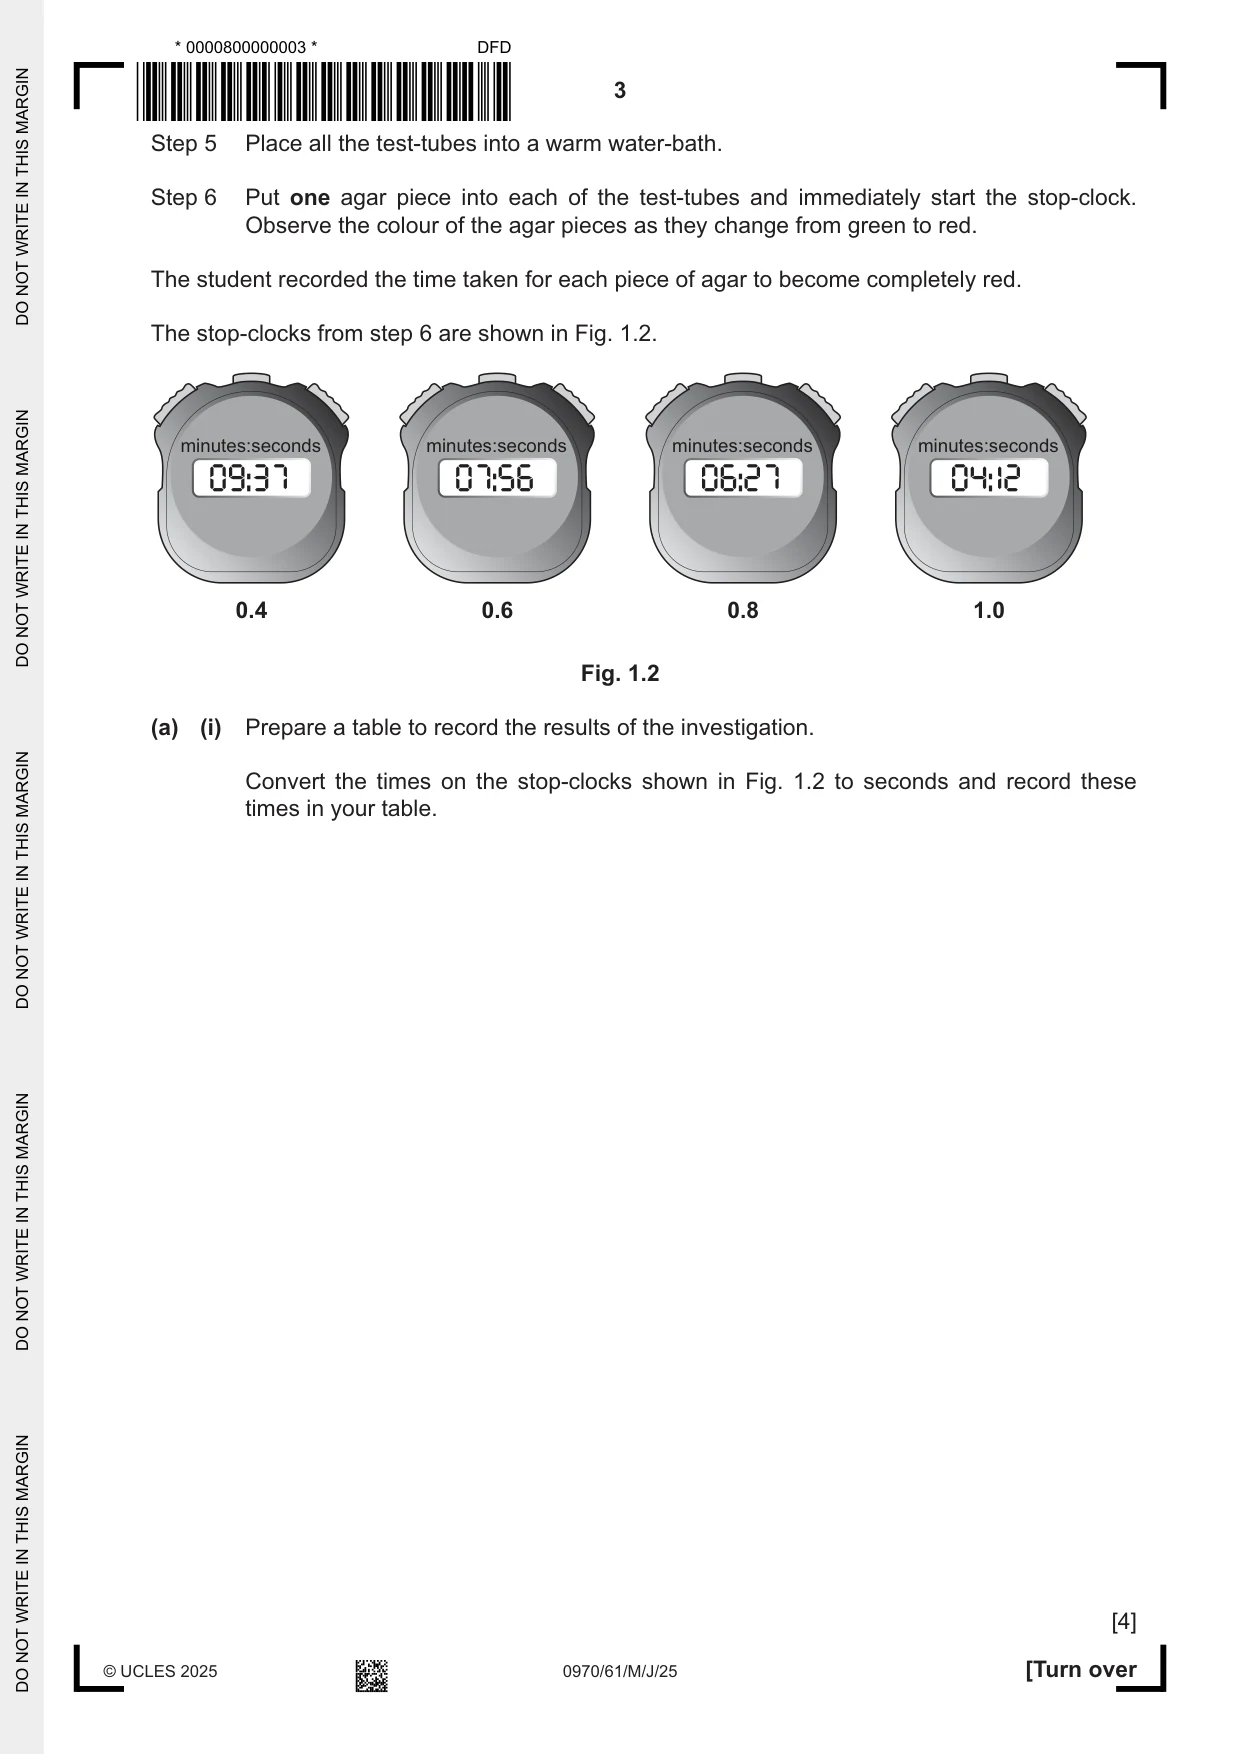
1 A student investigated the effect of concentration on diffusion. The student used pieces of agar which contained universal indicator. Universal indicator is green in substances with a neutral pH and red in substances with an acidic pH. The student placed the pieces of agar into different concentrations of hydrochloric acid solution and measured the time taken for the acid to diffuse to the centre of each piece of agar. At the start of the investigation the agar was green. The student used this method: Step 1 Label four test-tubes 0.4, 0.6, 0.8, 1.0. Table 1.1 shows the volumes of 1.0 mol per dm3 hydrochloric acid solution and distilled water used to make the different concentrations of hydrochloric acid solution. Table 1.1 concentration of volume of 1.0 mol per dm3 volume of distilled water hydrochloric acid solution hydrochloric acid / cm3 / mol per dm3 solution / cm3 0.4 4 6 0.6 6 4 0.8 8 2 1.0 10 0 Step 2 Use a 10 cm3 syringe to put the volumes of 1.0 mol per dm3 hydrochloric acid solution shown in Table 1.1 into the test-tubes labelled 0.4, 0.6, 0.8, 1.0. Step 3 Use the 10 cm3 syringe to put the volumes of distilled water shown in Table 1.1 into the test-tubes labelled 0.4, 0.6, 0.8, 1.0. Step 4 A block of agar which measures approximately 1 cm × 2 cm × 2 cm is provided. Use the knife to cut the agar block into four pieces. agar block white tile not to scale Fig. 1.1 Step 5 Place all the test-tubes into a warm water-bath. Step 6 Put one agar piece into each of the test-tubes and immediately start the stop-clock. Observe the colour of the agar pieces as they change from green to red. The student recorded the time taken for each piece of agar to become completely red. The stop-clocks from step 6 are shown in Fig. 1.2. minutes:seconds minutes:seconds minutes:seconds minutes:seconds 0.4 0.6 0.8 1.0 Fig. 1.2 (a) (i) Prepare a table to record the results of the investigation. Convert the times on the stop-clocks shown in Fig. 1.2 to seconds and record these times in your table. [4] (ii) State a conclusion for the results. ........................................................................................................................................... ........................................................................................................................................... ..................................................................................................................................... [1] (iii) State the independent and dependent variables in this investigation. independent variable ......................................................................................................... ........................................................................................................................................... dependent variable ............................................................................................................ ........................................................................................................................................... [2] (iv) Suggest two improvements to the method used for this investigation. 1 ........................................................................................................................................ ........................................................................................................................................... ........................................................................................................................................... 2 ........................................................................................................................................ ........................................................................................................................................... ........................................................................................................................................... [2] (v) Identify two hazards in this investigation. ........................................................................................................................................... ........................................................................................................................................... ..................................................................................................................................... [1] (b) Plan an investigation to determine the effect of temperature on osmosis in potato plant tissue. ................................................................................................................................................... ................................................................................................................................................... ................................................................................................................................................... ................................................................................................................................................... ................................................................................................................................................... ................................................................................................................................................... ................................................................................................................................................... ................................................................................................................................................... ................................................................................................................................................... ................................................................................................................................................... ................................................................................................................................................... ................................................................................................................................................... ............................................................................................................................................. [6] [Total: 16]
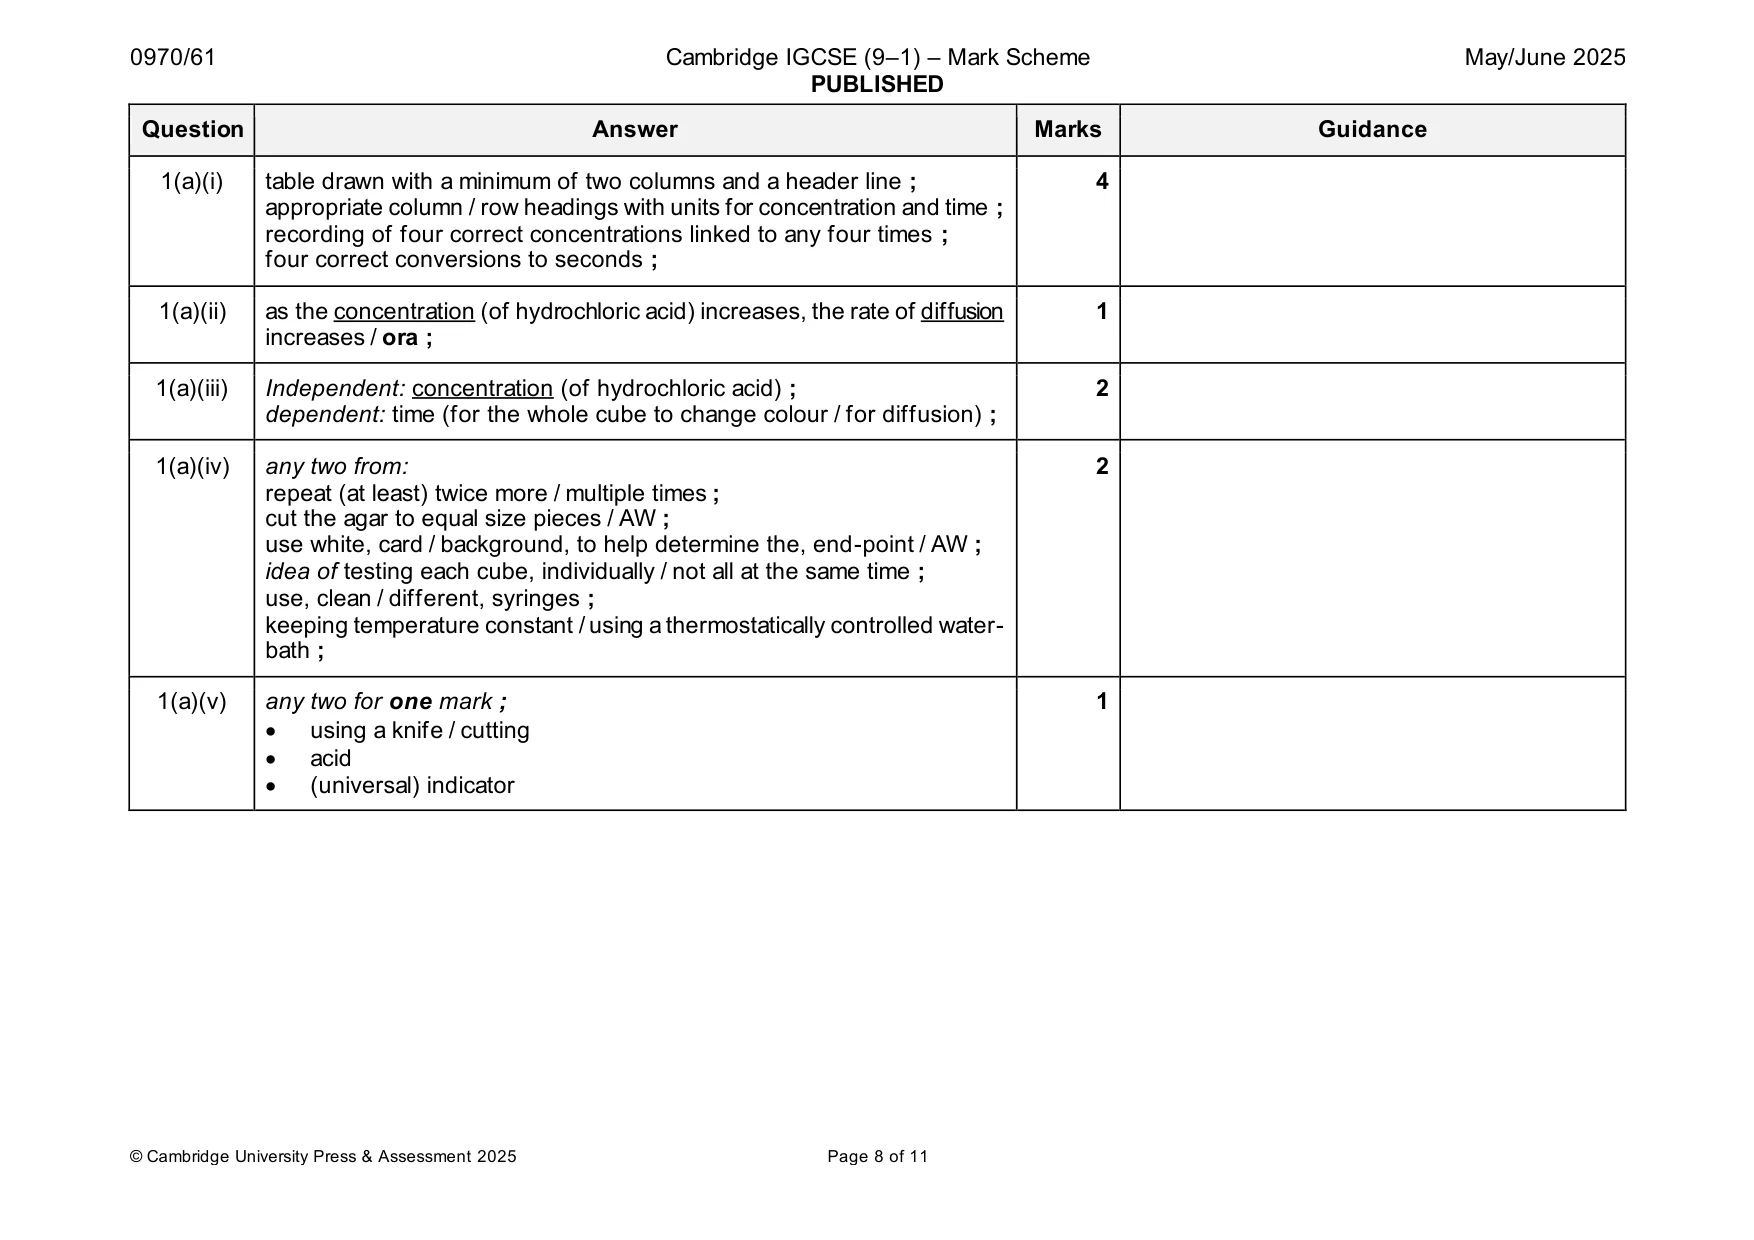
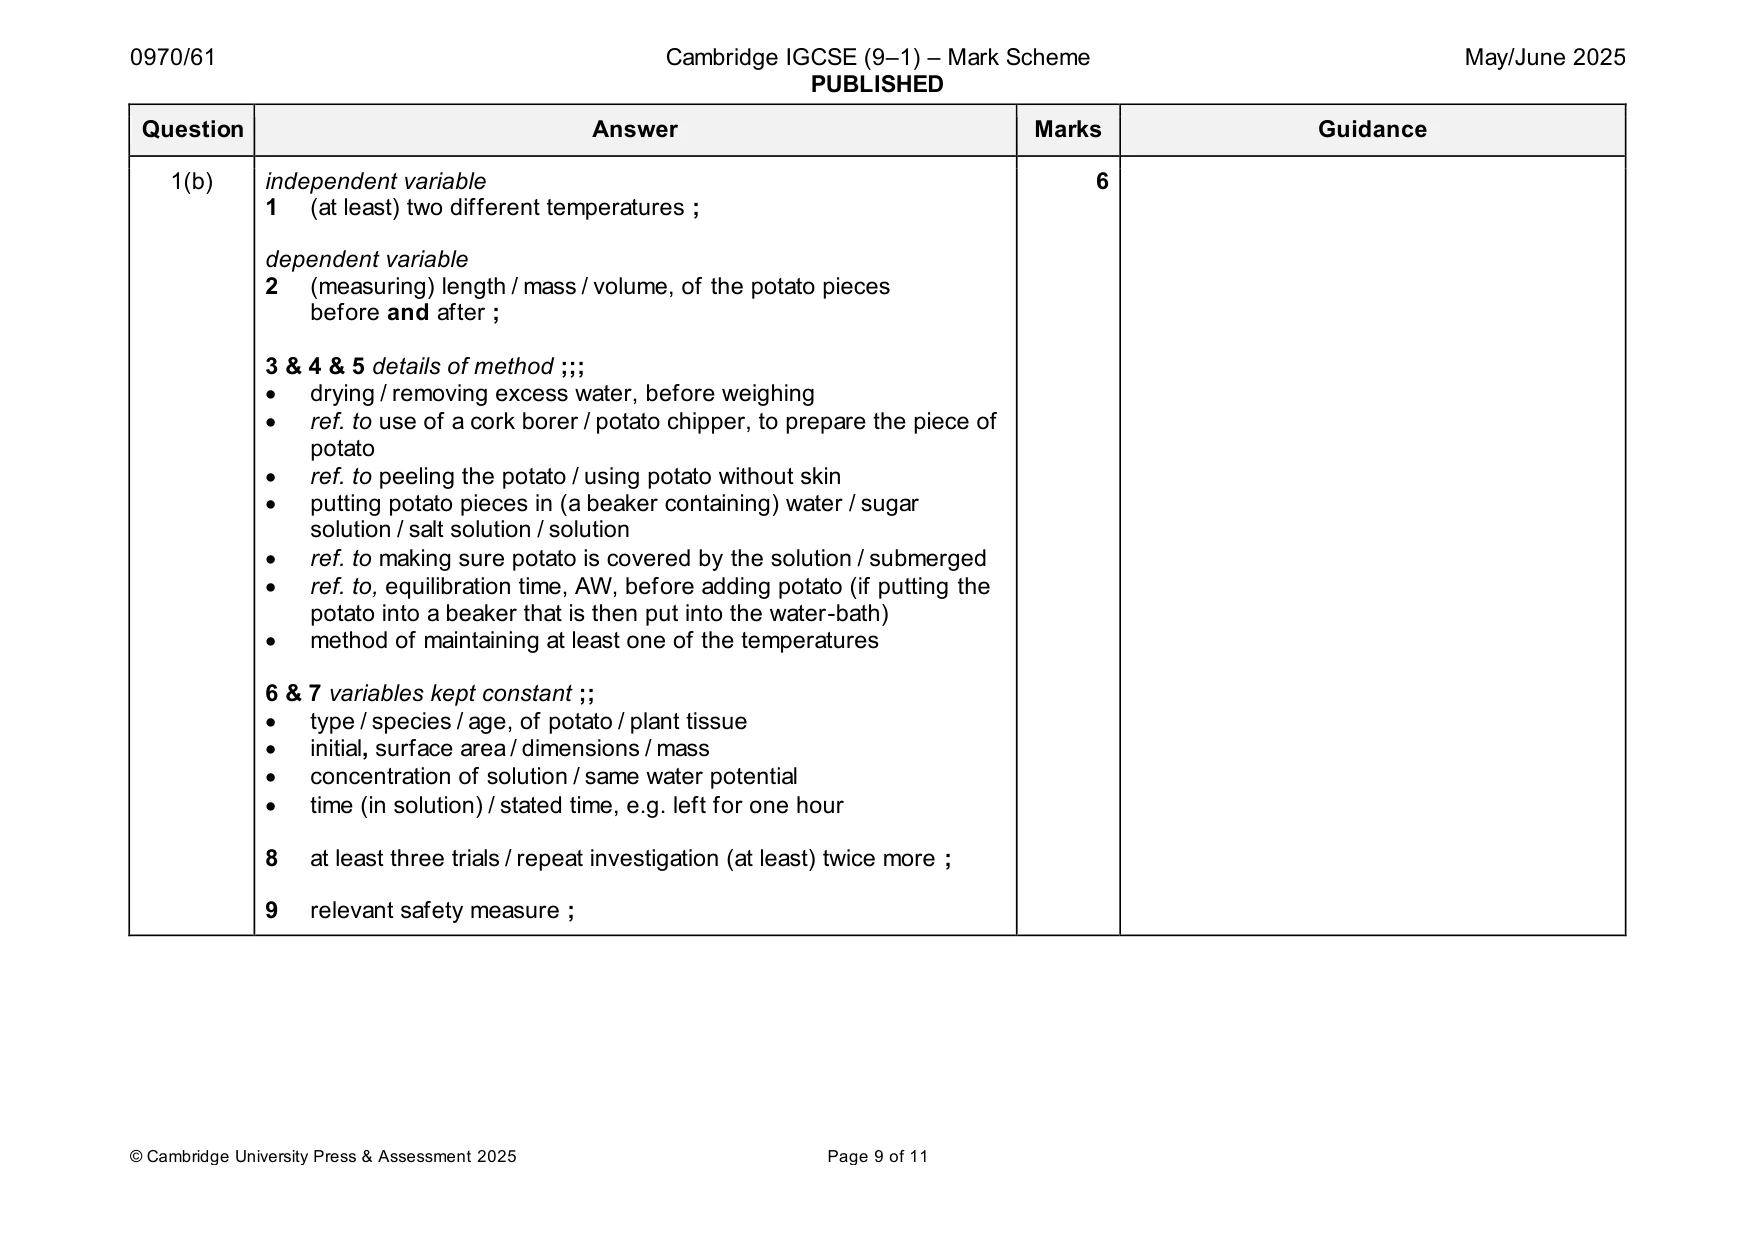
Mark scheme: Question Answer Marks Guidance 1(a)(i) table drawn with a minimum of two columns and a header line ; 4 appropriate column / row headings with units for concentration and time ; recording of four correct concentrations linked to any four times ; four correct conversions to seconds ; 1(a)(ii) as the concentration (of hydrochloric acid) increases, the rate of diffusion 1 increases / ora ; 1(a)(iii) Independent: concentration (of hydrochloric acid) ; 2 dependent: time (for the whole cube to change colour / for diffusion) ; 1(a)(iv) any two from: 2 repeat (at least) twice more / multiple times ; cut the agar to equal size pieces / AW ; use white, card / background, to help determine the, end-point / AW ; idea of testing each cube, individually / not all at the same time ; use, clean / different, syringes ; keeping temperature constant / using a thermostatically controlled water- bath ; 1(a)(v) any two for one mark ; 1 • using a knife / cutting • acid • (universal) indicator 1(b) independent variable 6 1 (at least) two different temperatures ; dependent variable 2 (measuring) length / mass / volume, of the potato pieces before and after ; 3 & 4 & 5 details of method ;;; • drying / removing excess water, before weighing • ref. to use of a cork borer / potato chipper, to prepare the piece of potato • ref. to peeling the potato / using potato without skin • putting potato pieces in (a beaker containing) water / sugar solution / salt solution / solution • ref. to making sure potato is covered by the solution / submerged • ref. to, equilibration time, AW, before adding potato (if putting the potato into a beaker that is then put into the water-bath) • method of maintaining at least one of the temperatures 6 & 7 variables kept constant ;; • type / species / age, of potato / plant tissue • initial, surface area / dimensions / mass • concentration of solution / same water potential • time (in solution) / stated time, e.g. left for one hour 8 at least three trials / repeat investigation (at least) twice more ; 9 relevant safety measure ;
Q2 · A student used DCPIP solution to compare the concentration of vitamin C in five solutions
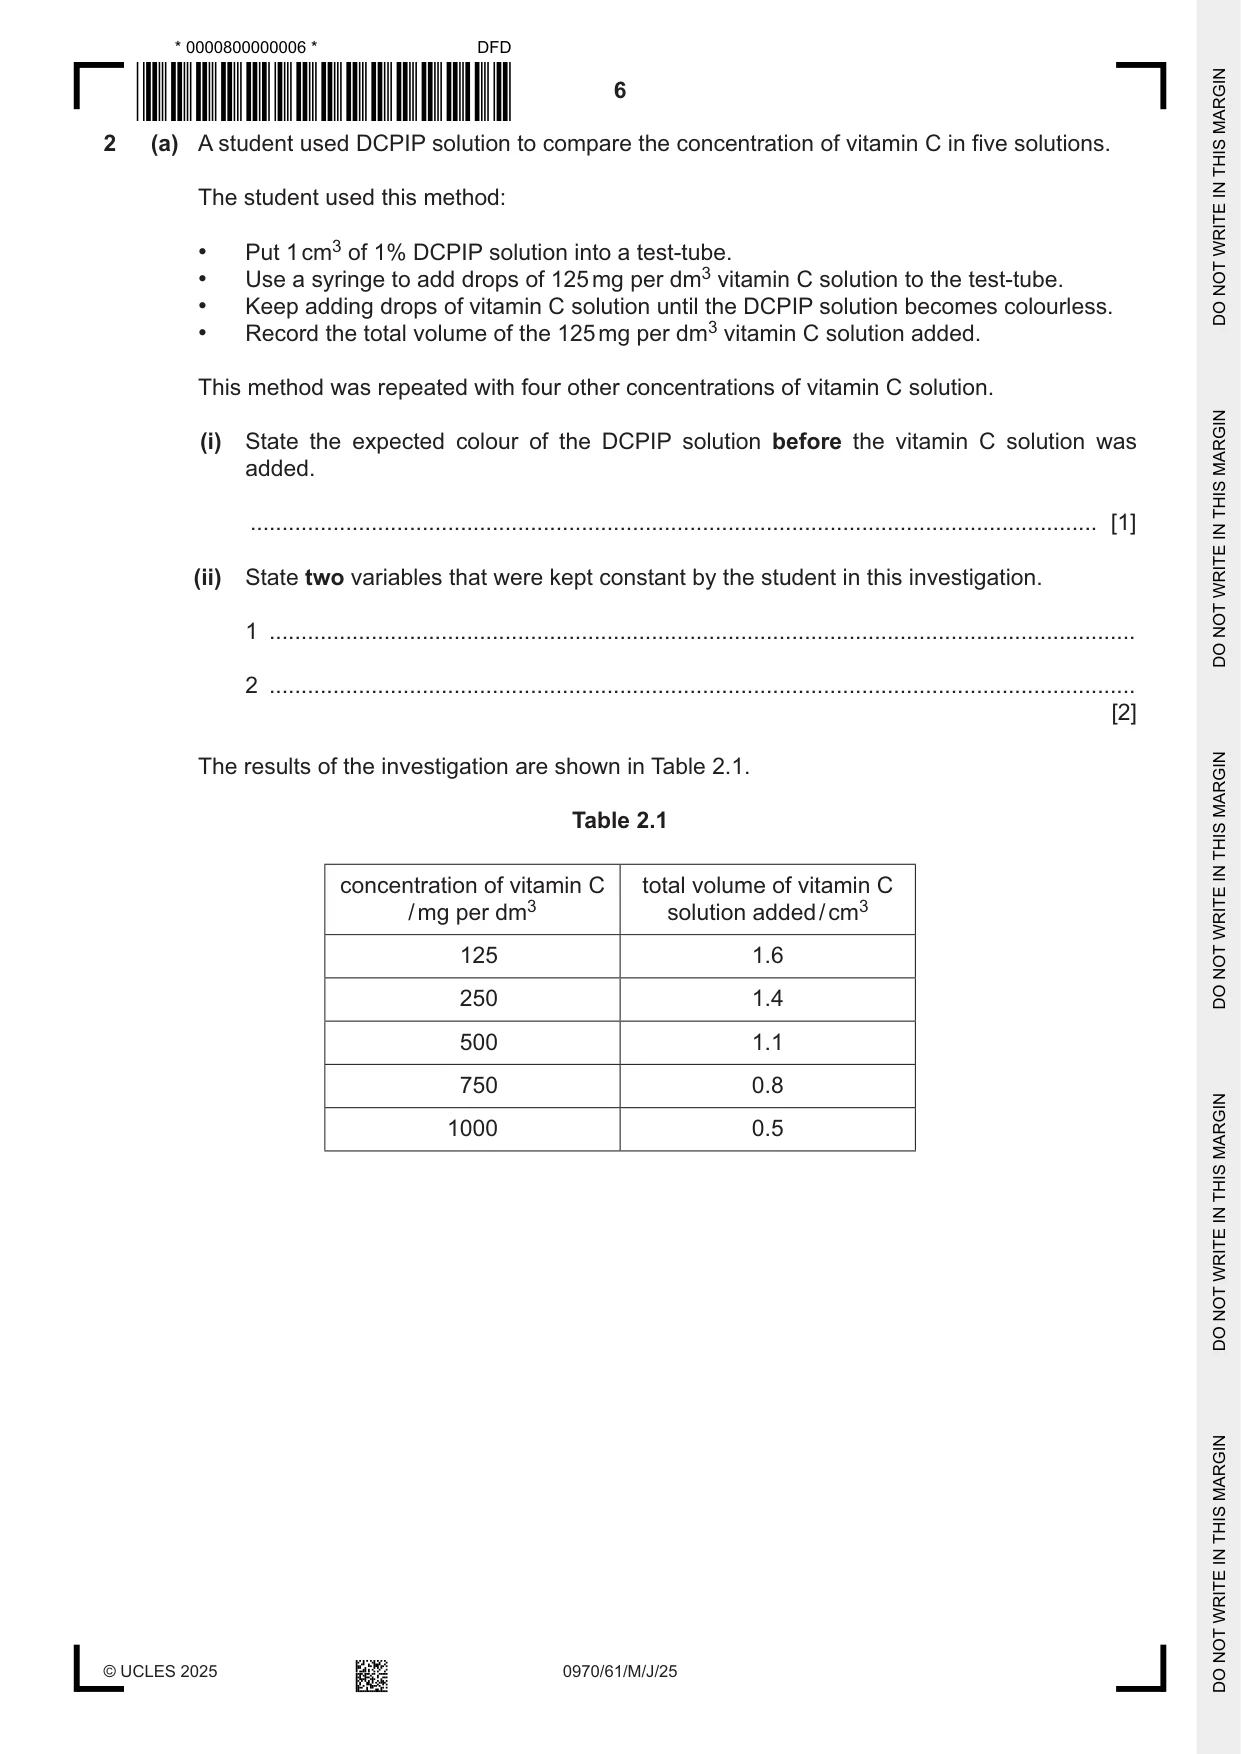
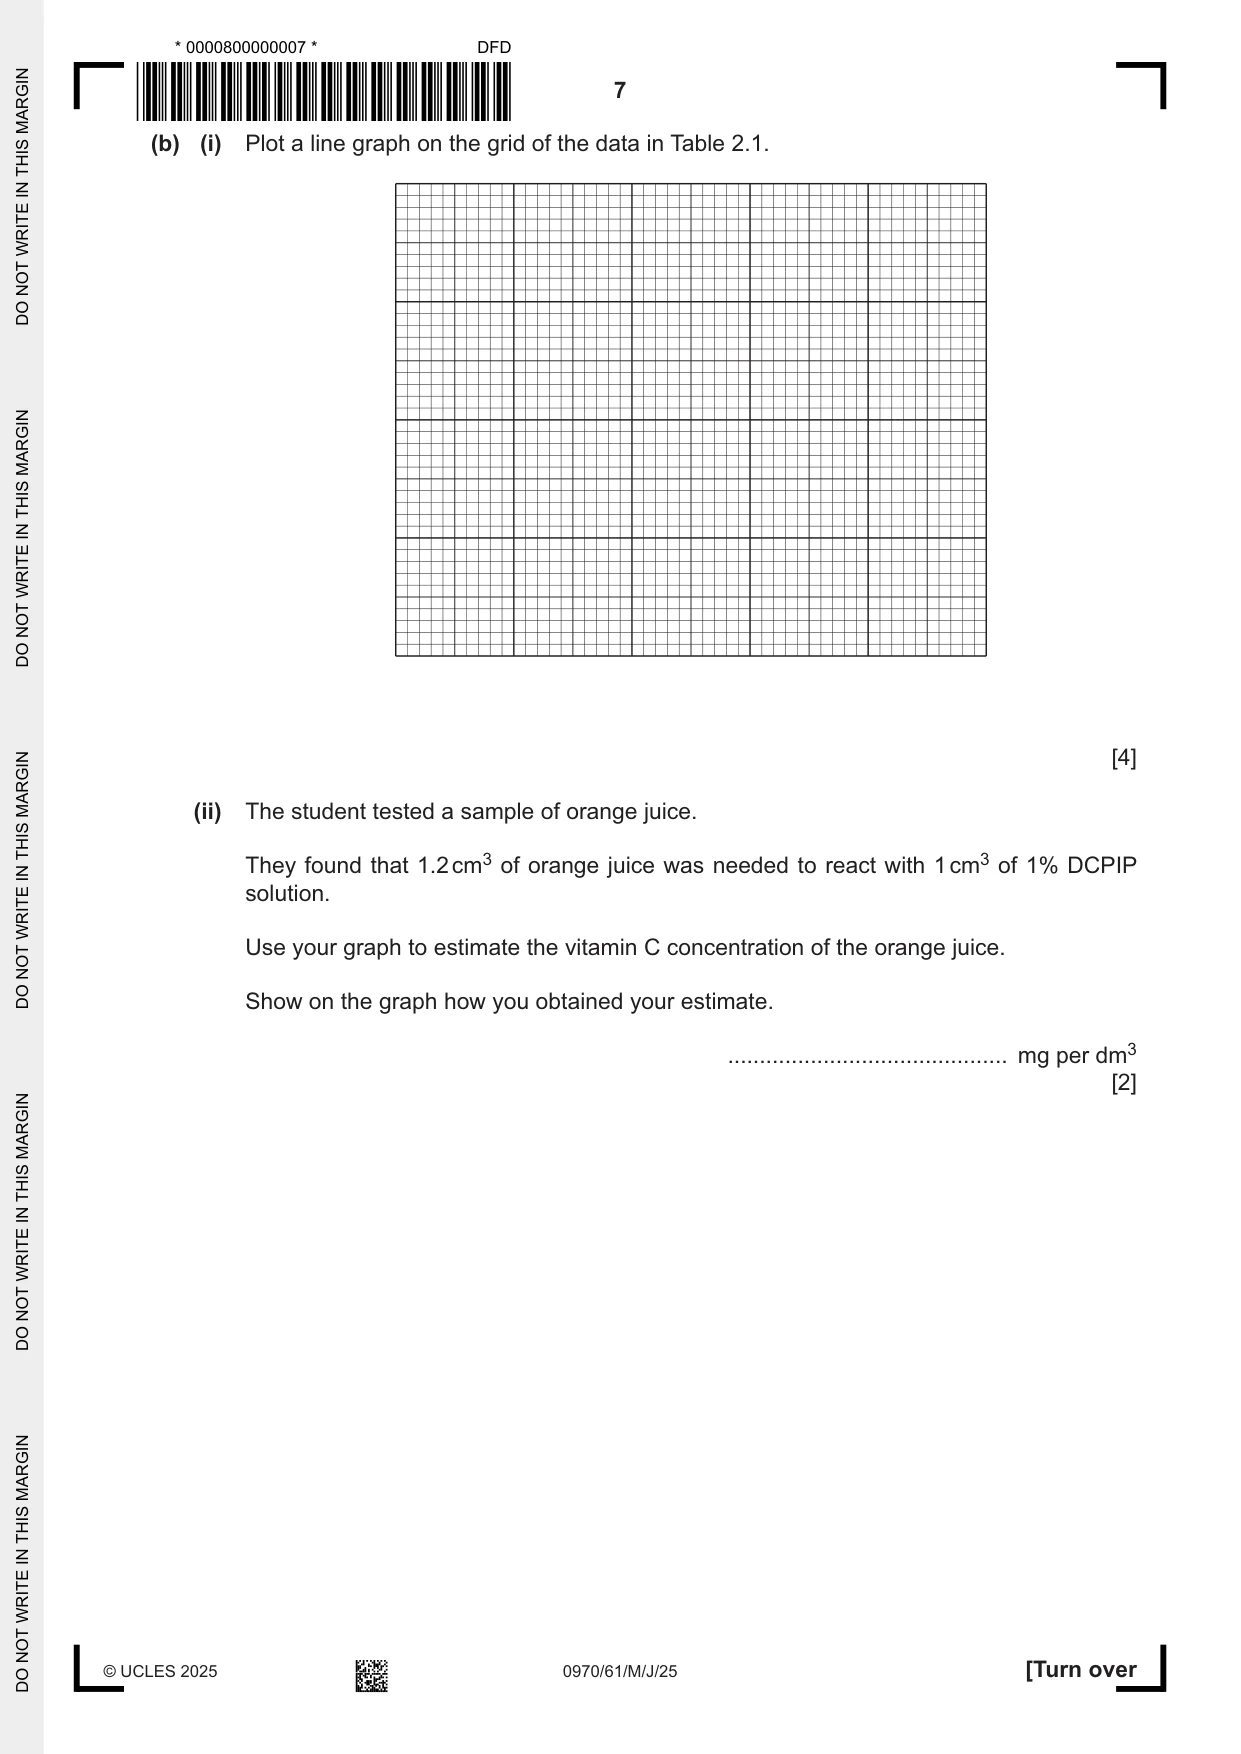
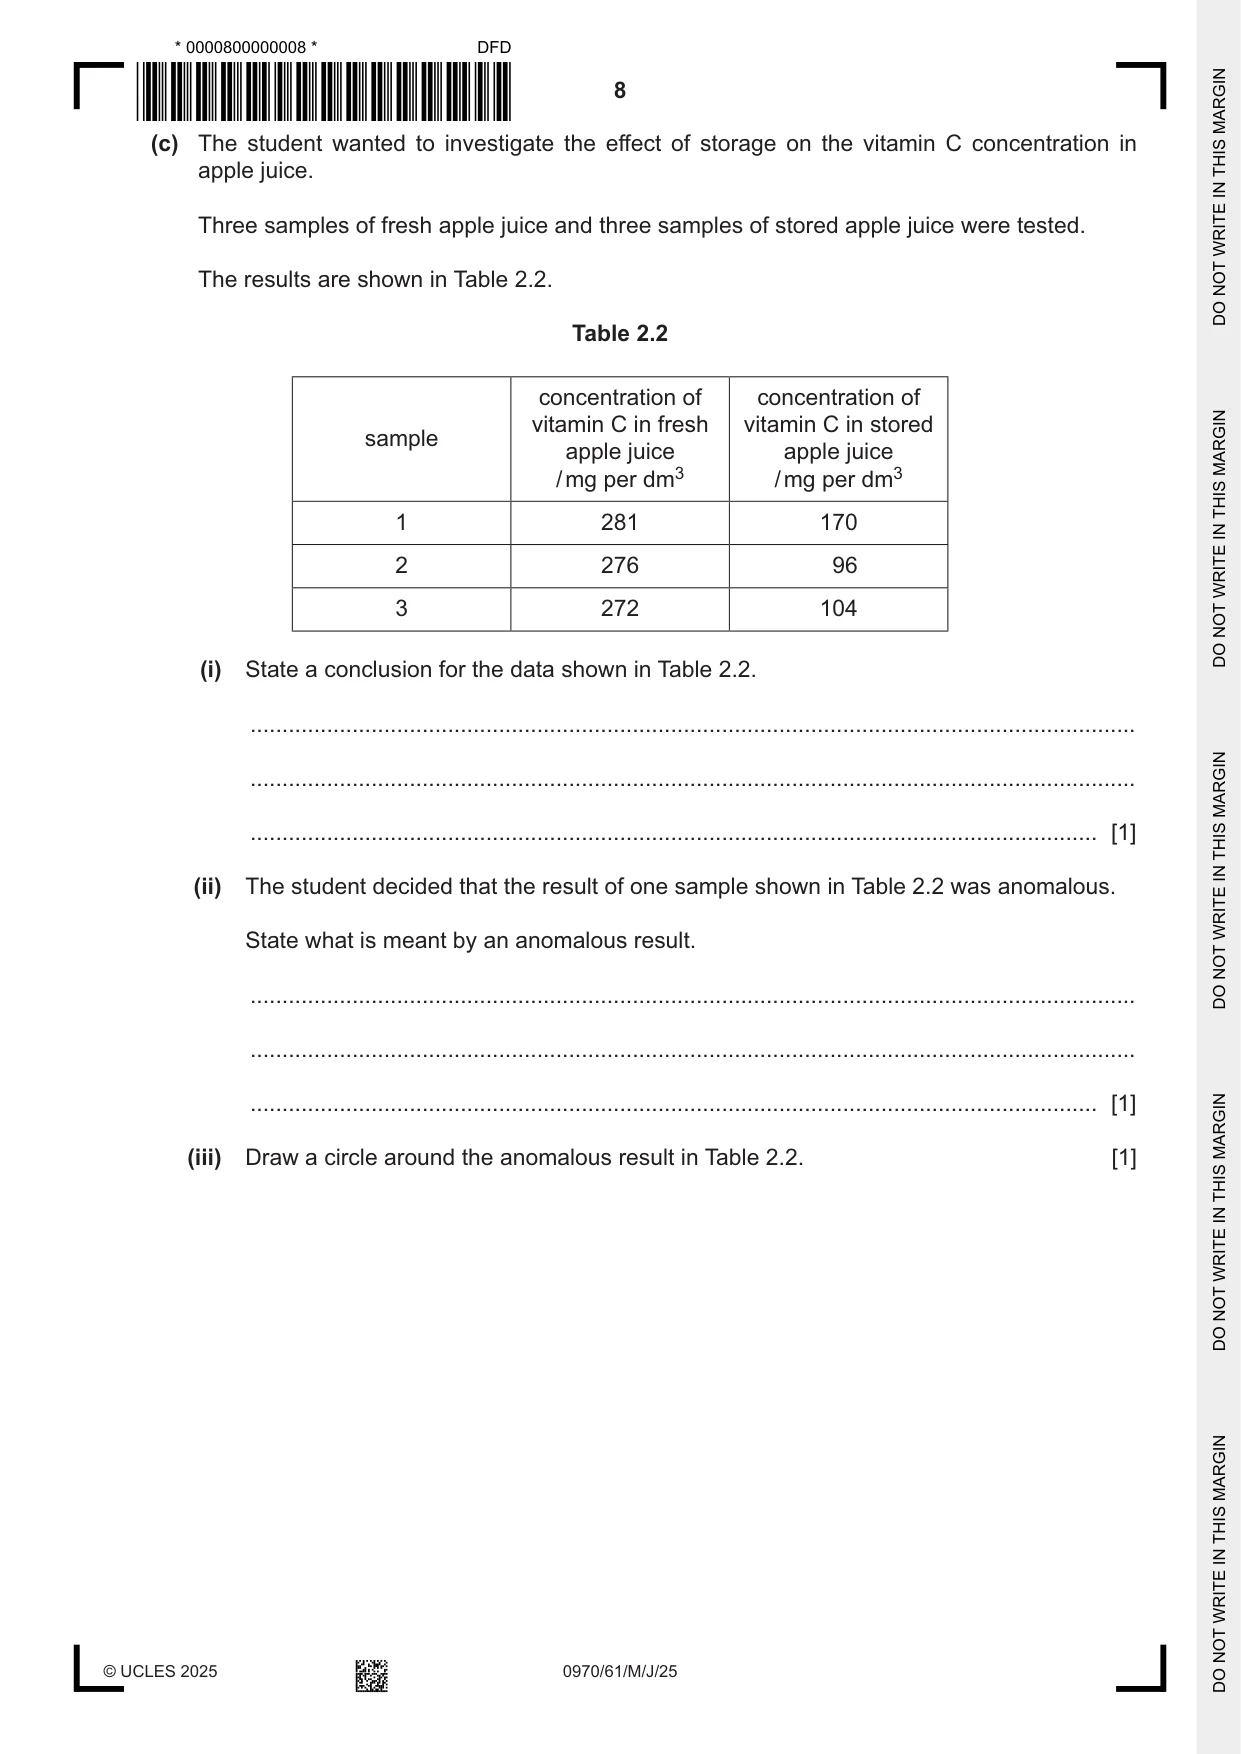
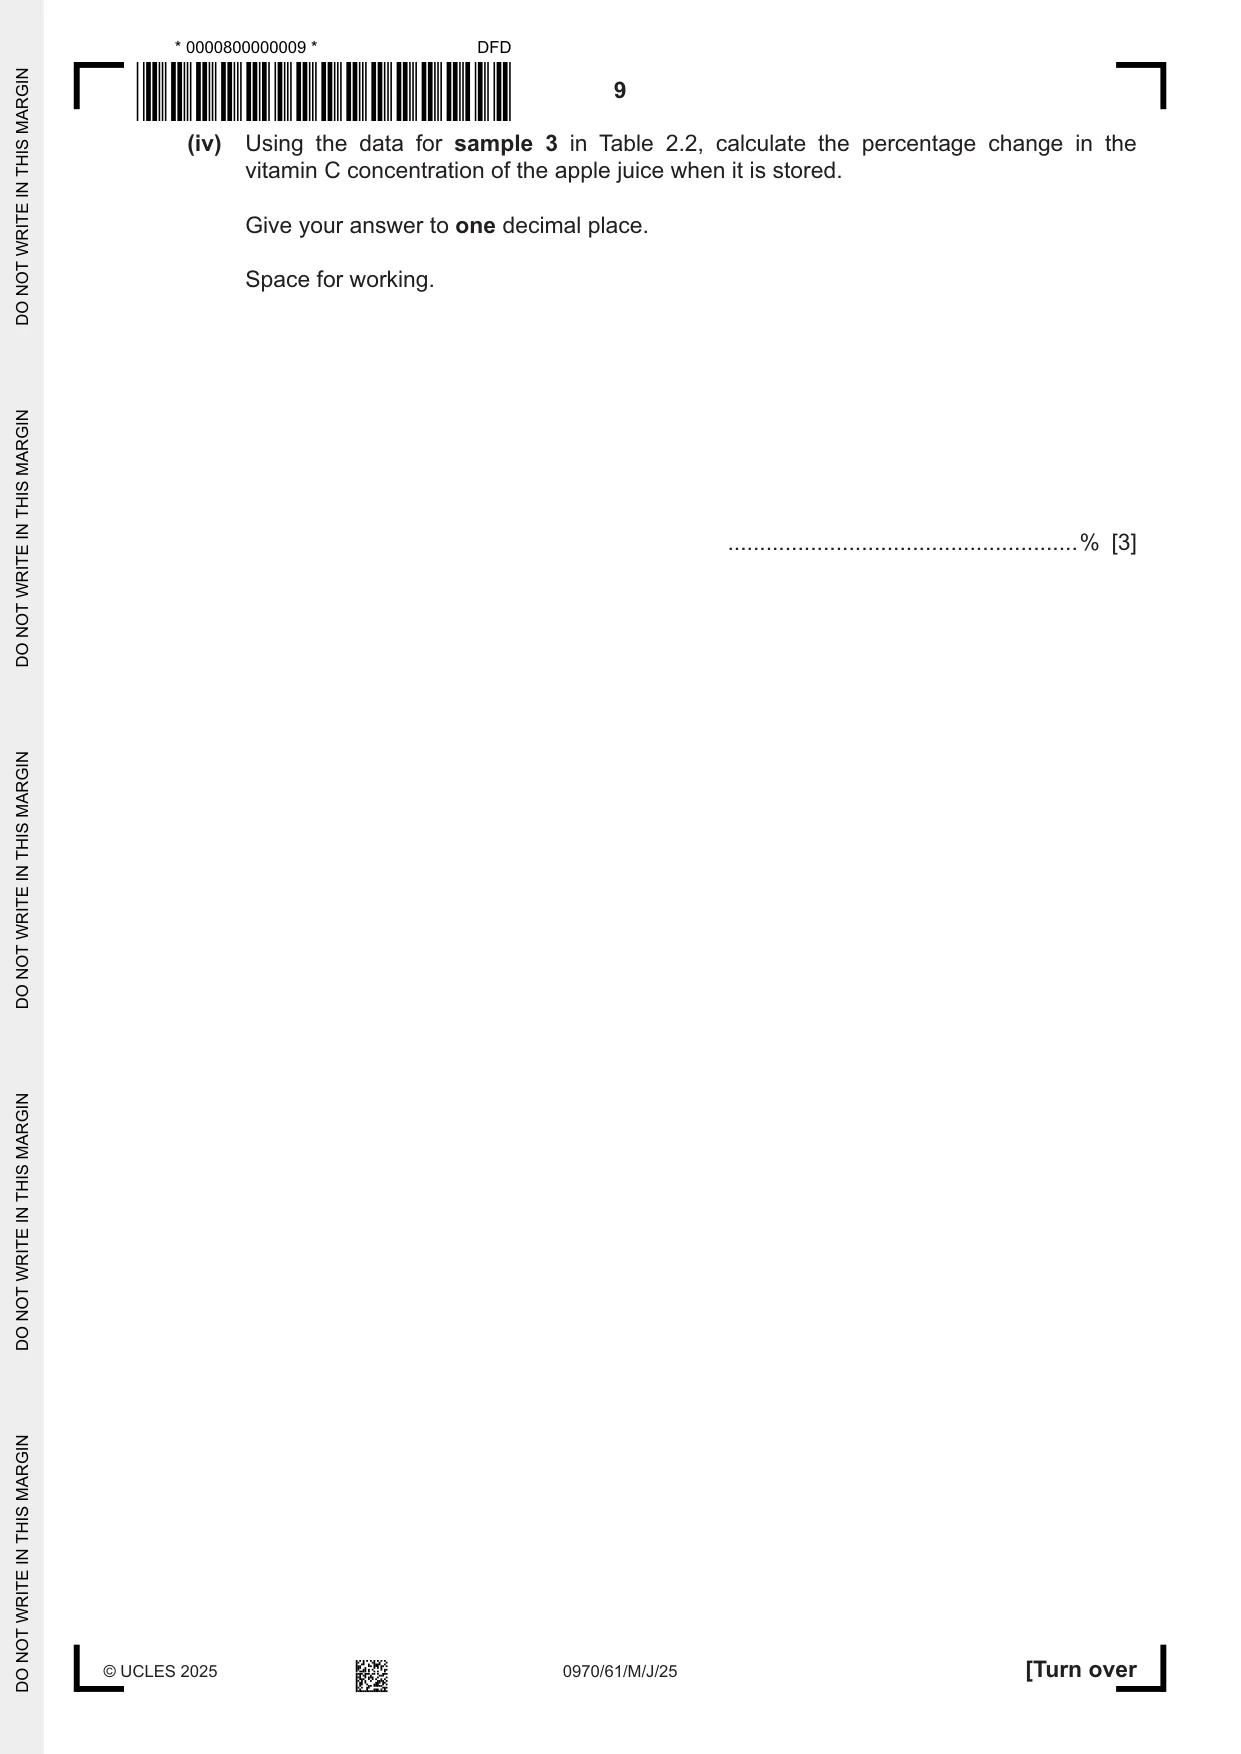
2 (a) A student used DCPIP solution to compare the concentration of vitamin C in five solutions. The student used this method: • Put 1 cm3 of 1% DCPIP solution into a test-tube. • Use a syringe to add drops of 125 mg per dm3 vitamin C solution to the test-tube. • Keep adding drops of vitamin C solution until the DCPIP solution becomes colourless. • Record the total volume of the 125 mg per dm3 vitamin C solution added. This method was repeated with four other concentrations of vitamin C solution. (i) State the expected colour of the DCPIP solution before the vitamin C solution was added. ..................................................................................................................................... [1] (ii) State two variables that were kept constant by the student in this investigation. 1 ........................................................................................................................................ 2 ........................................................................................................................................ [2] The results of the investigation are shown in Table 2.1. Table 2.1 concentration of vitamin C total volume of vitamin C / mg per dm3 solution added / cm3 125 1.6 250 1.4 500 1.1 750 0.8 1000 0.5 (b) (i) Plot a line graph on the grid of the data in Table 2.1. [4] (ii) The student tested a sample of orange juice. They found that 1.2 cm3 of orange juice was needed to react with 1 cm3 of 1% DCPIP solution. Use your graph to estimate the vitamin C concentration of the orange juice. Show on the graph how you obtained your estimate. ............................................ mg per dm3 [2] (c) The student wanted to investigate the effect of storage on the vitamin C concentration in apple juice. Three samples of fresh apple juice and three samples of stored apple juice were tested. The results are shown in Table 2.2. Table 2.2 concentration of concentration of vitamin C in fresh vitamin C in stored sample apple juice apple juice / mg per dm3 / mg per dm3 1 281 170 2 276 96 3 272 104 (i) State a conclusion for the data shown in Table 2.2. ........................................................................................................................................... ........................................................................................................................................... ..................................................................................................................................... [1] (ii) The student decided that the result of one sample shown in Table 2.2 was anomalous. State what is meant by an anomalous result. ........................................................................................................................................... ........................................................................................................................................... ..................................................................................................................................... [1] (iii) Draw a circle around the anomalous result in Table 2.2. [1]
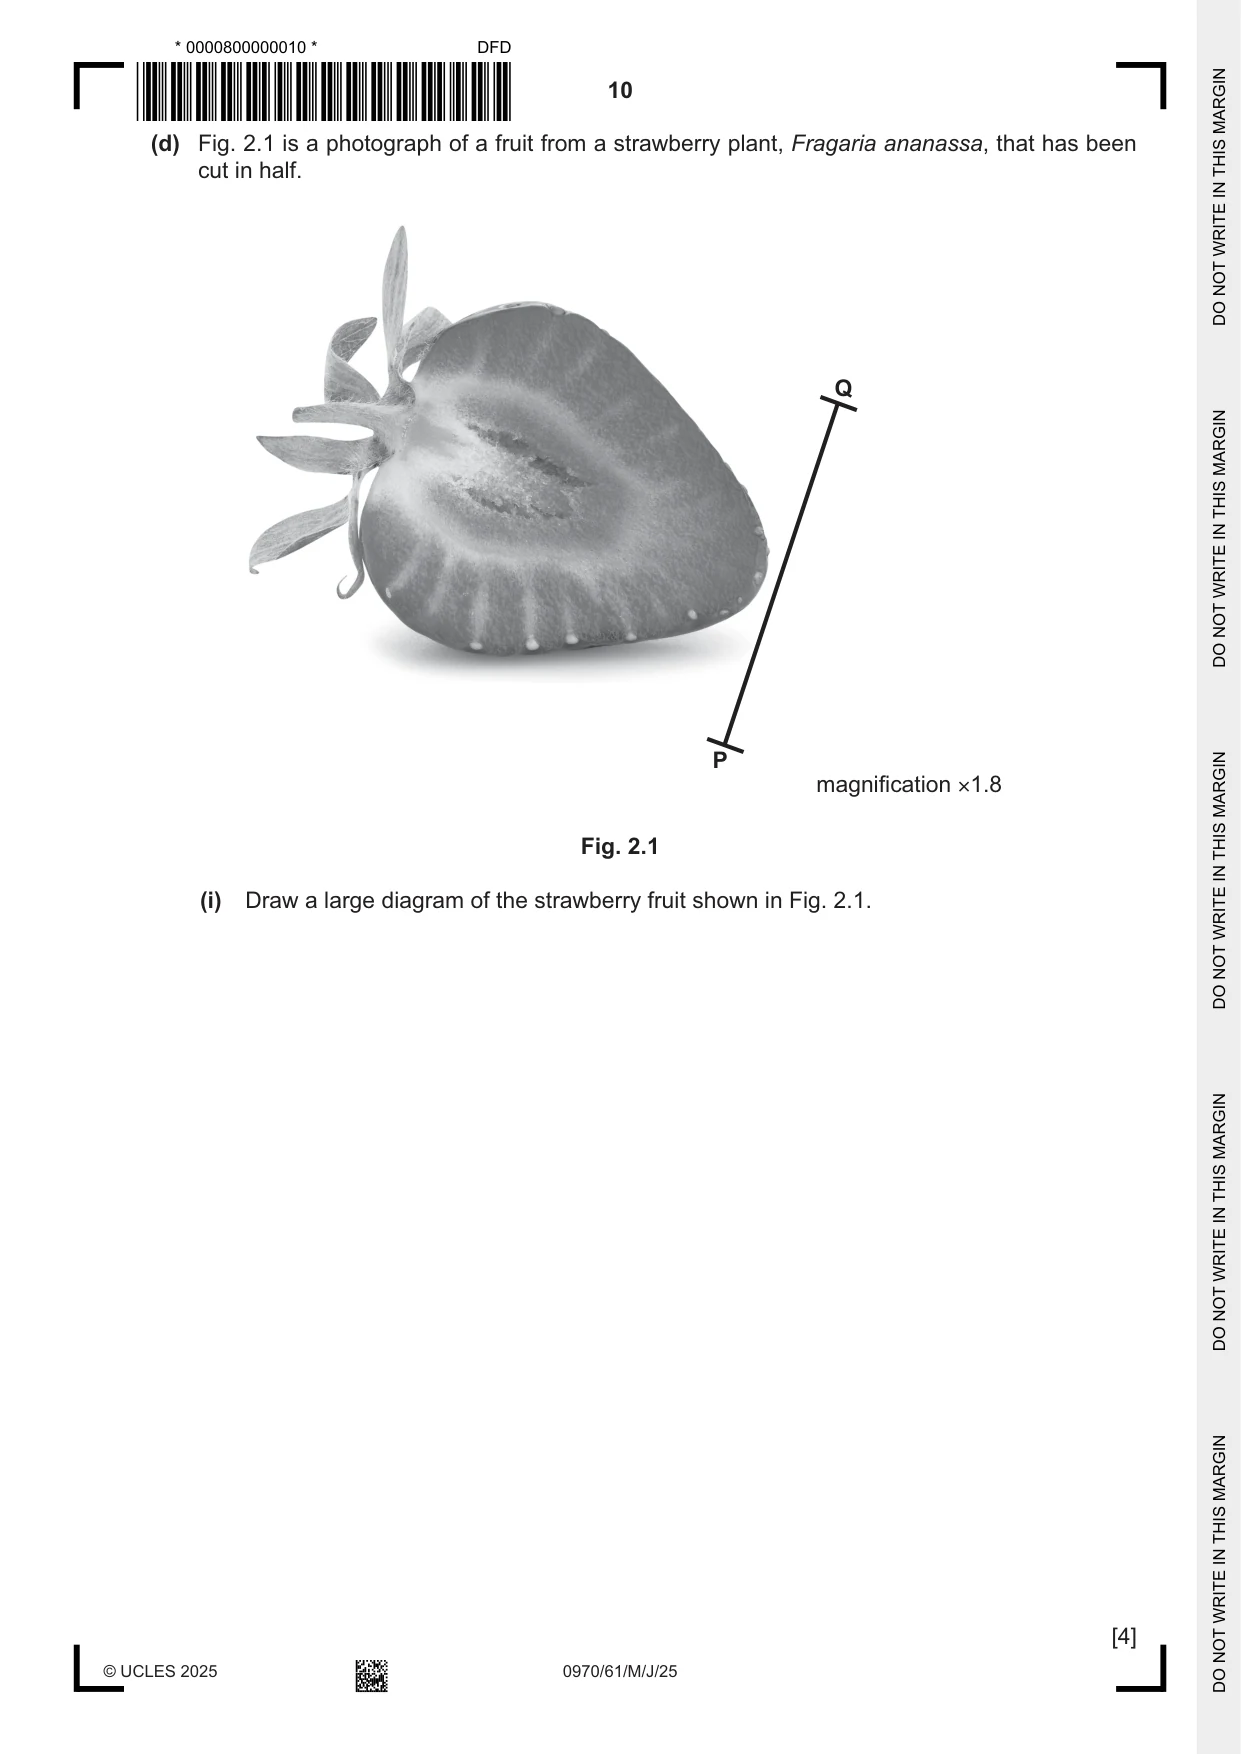
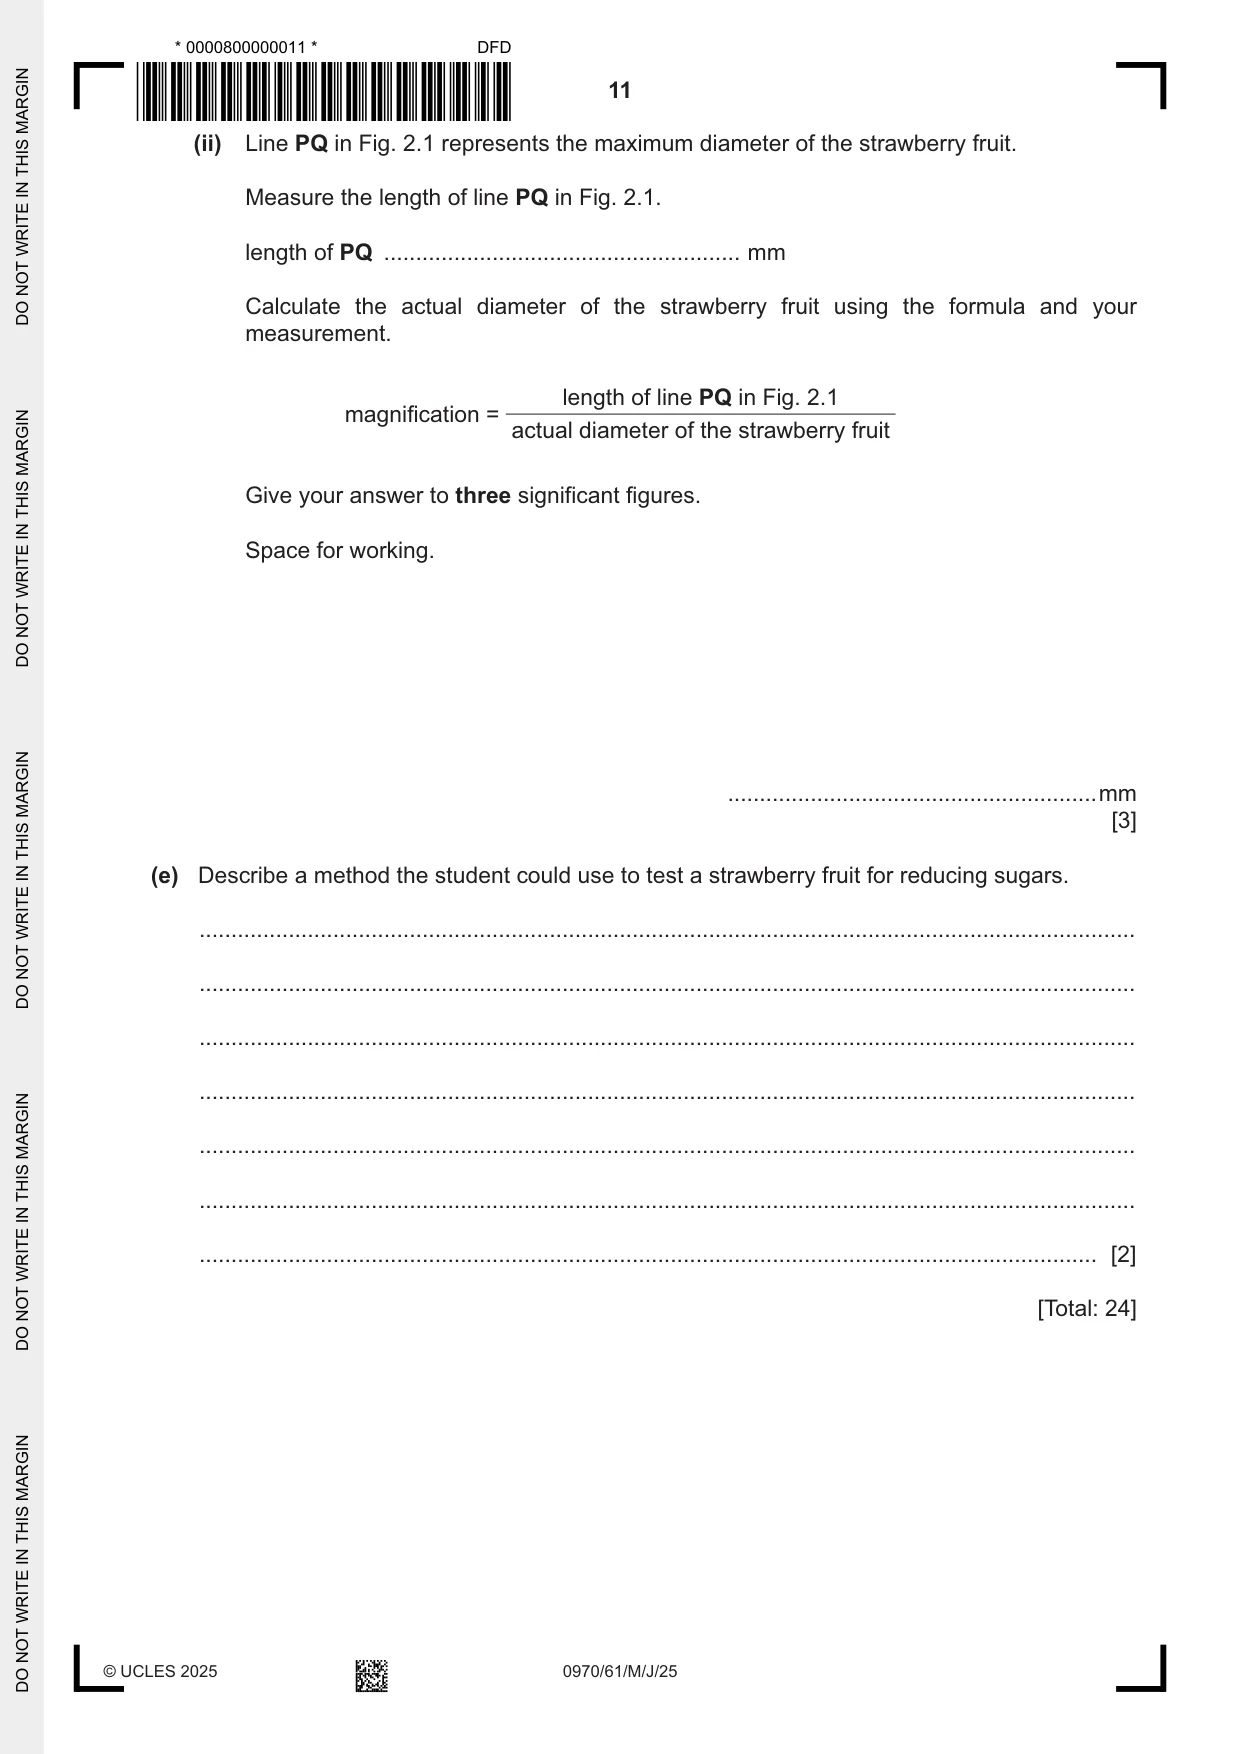
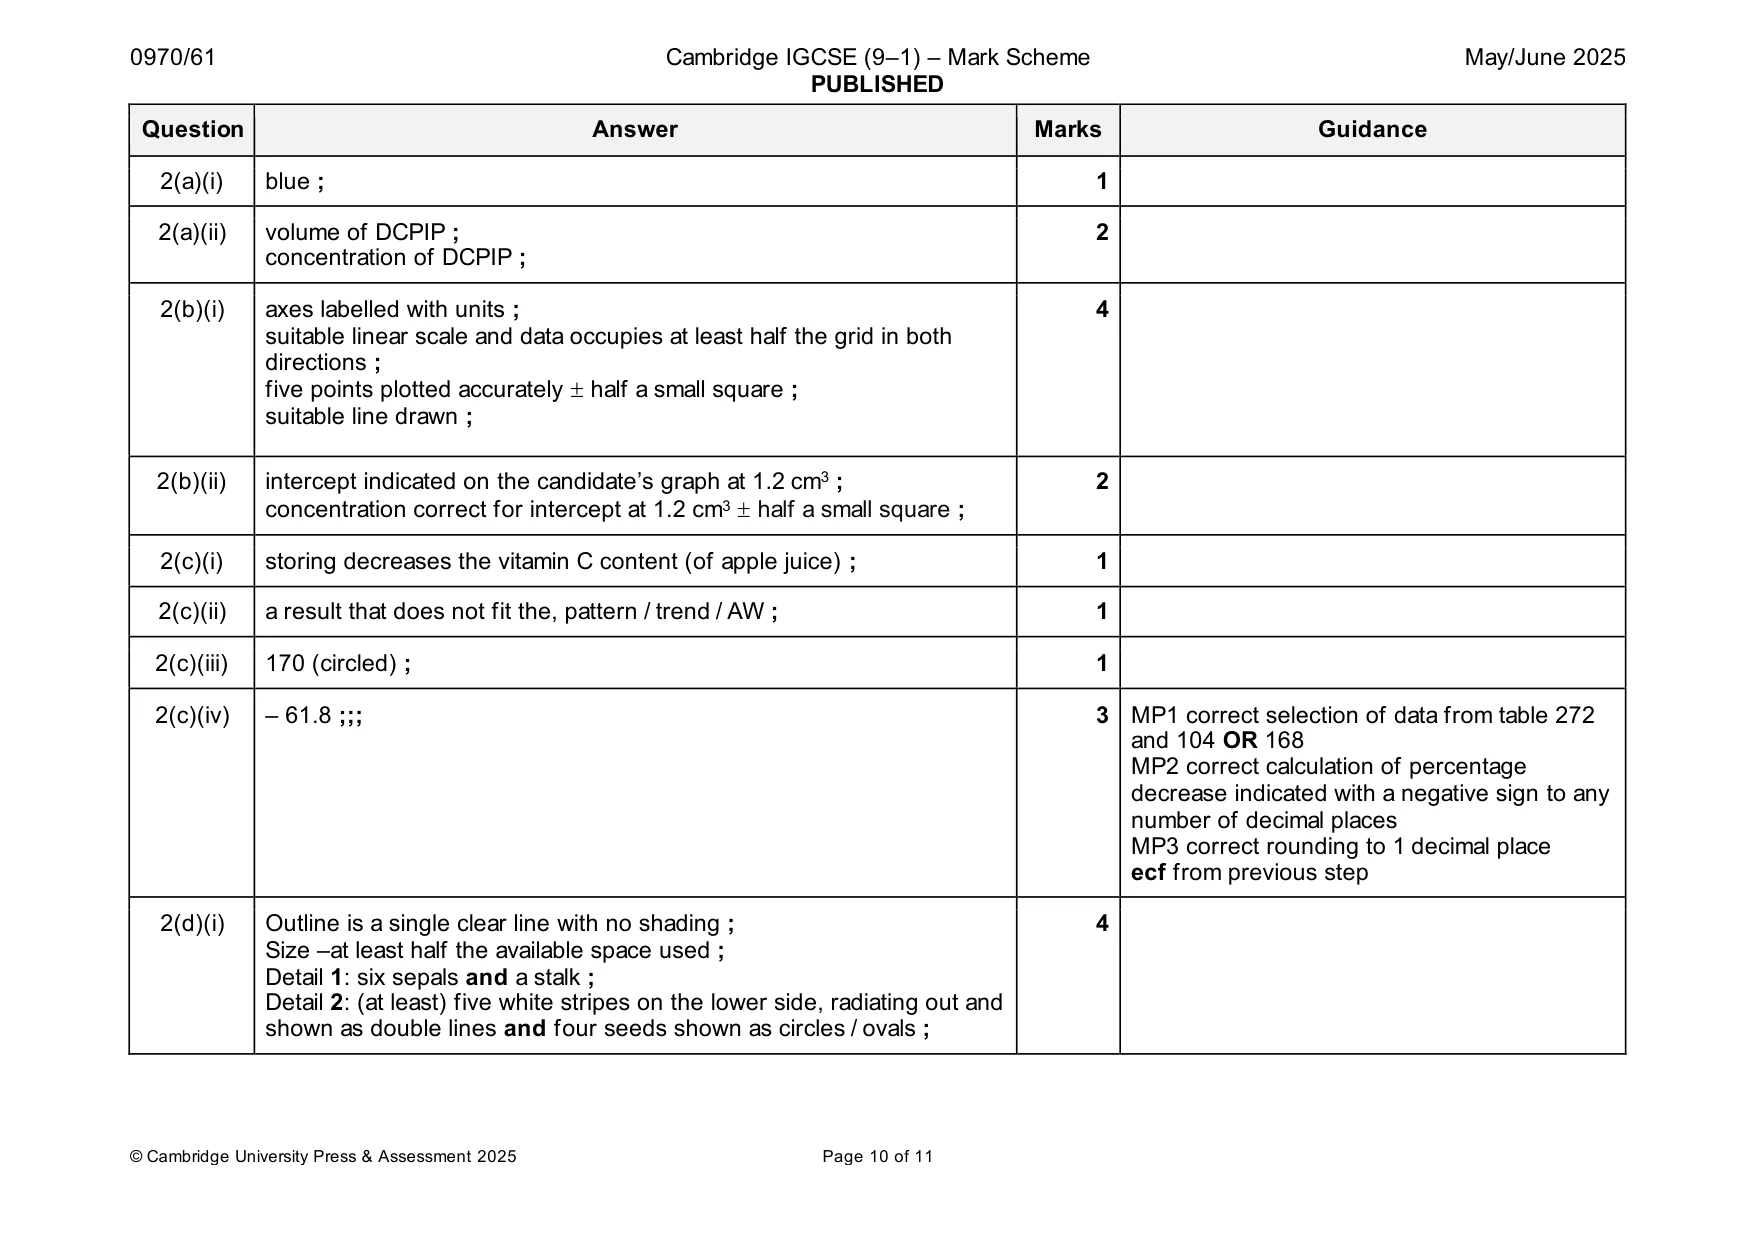
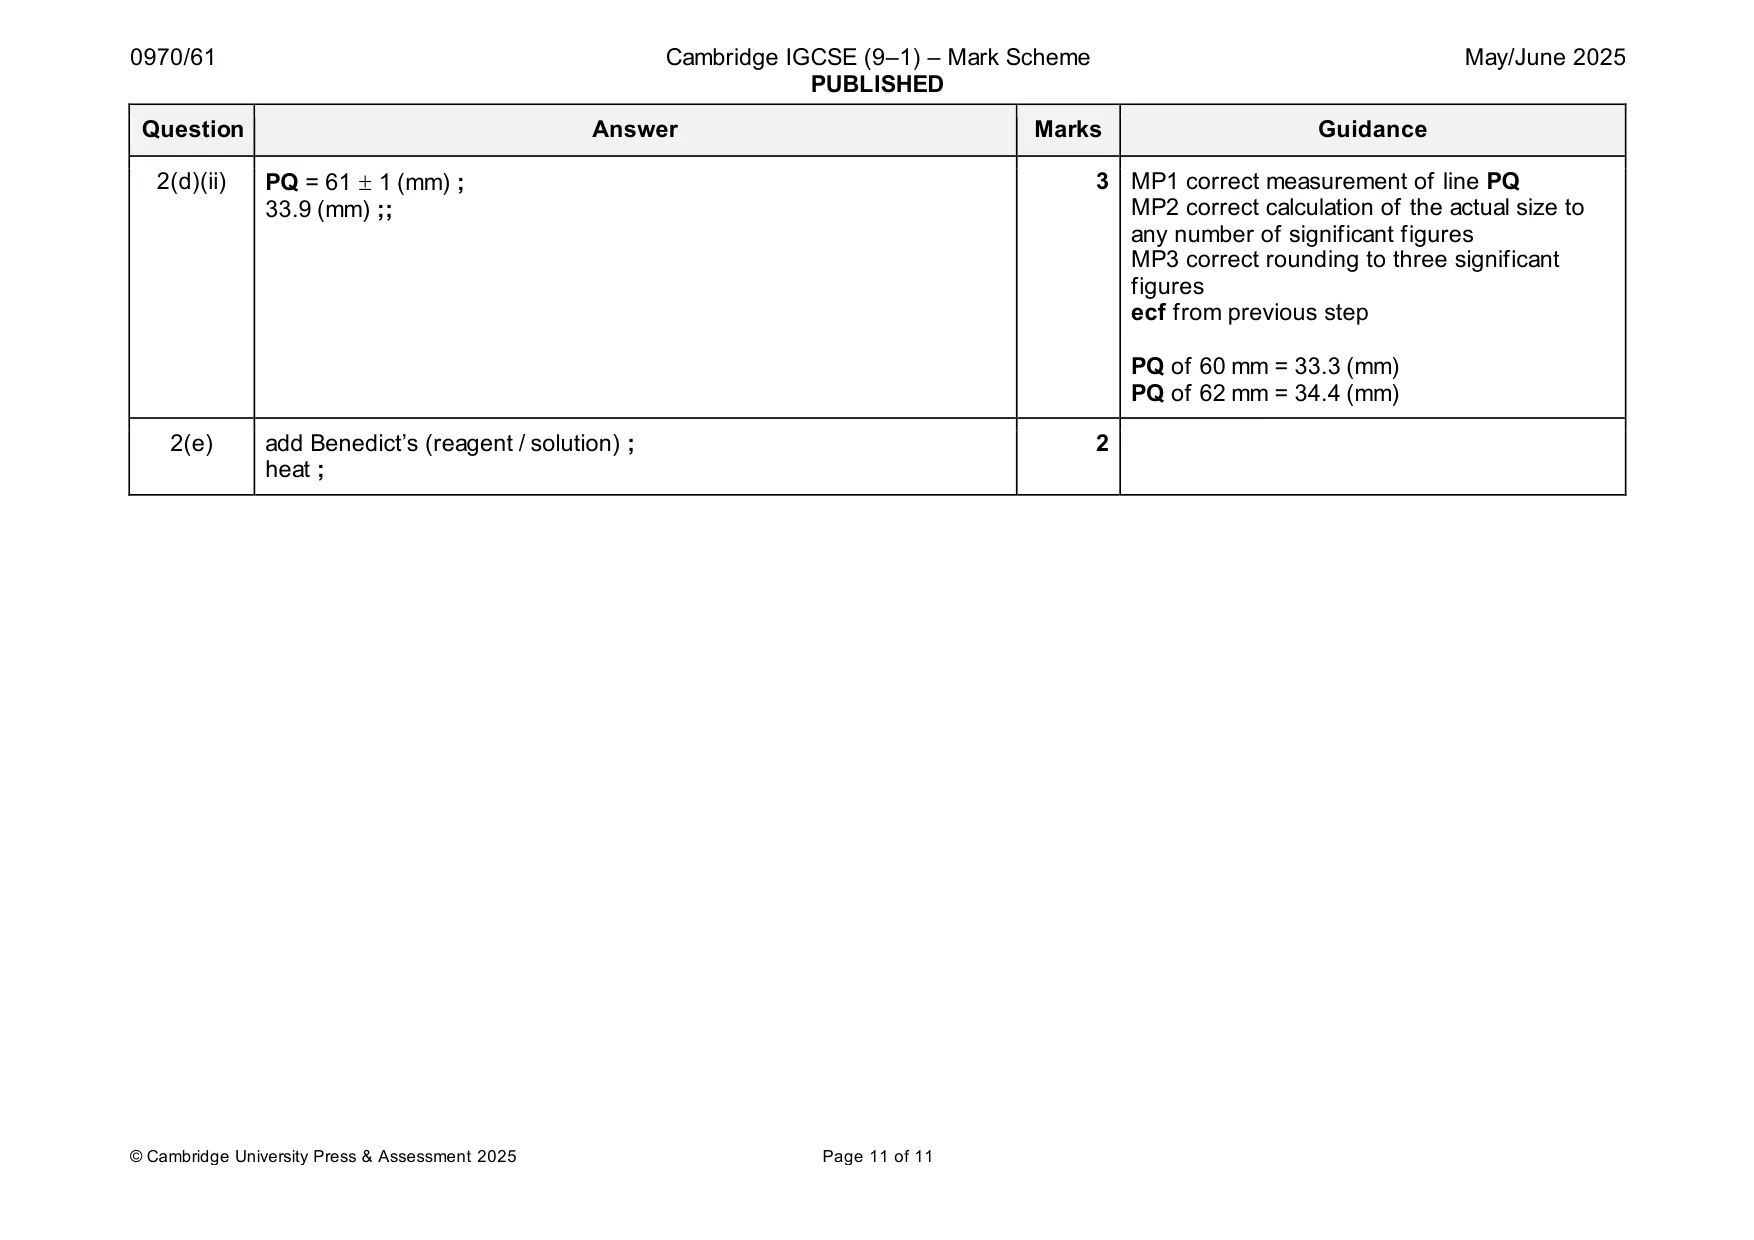
Mark scheme: 2(a)(i) blue ; 1 2(a)(ii) volume of DCPIP ; 2 concentration of DCPIP ; 2(b)(i) axes labelled with units ; 4 suitable linear scale and data occupies at least half the grid in both directions ; five points plotted accurately half a small square ; suitable line drawn ; 2(b)(ii) intercept indicated on the candidate’s graph at 1.2 cm3 ; 2 concentration correct for intercept at 1.2 cm3 half a small square ; 2(c)(i) storing decreases the vitamin C content (of apple juice) ; 1 2(c)(ii) a result that does not fit the, pattern / trend / AW ; 1 2(c)(iii) 170 (circled) ; 1 2(c)(iv) – 61.8 ;;; 3 MP1 correct selection of data from table 272 and 104 OR 168 MP2 correct calculation of percentage decrease indicated with a negative sign to any number of decimal places MP3 correct rounding to 1 decimal place ecf from previous step 2(d)(i) Outline is a single clear line with no shading ; 4 Size –at least half the available space used ; Detail 1: six sepals and a stalk ; Detail 2: (at least) five white stripes on the lower side, radiating out and shown as double lines and four seeds shown as circles / ovals ; 2(d)(ii) PQ = 61 1 (mm) ; 3 MP1 correct measurement of line PQ 33.9 (mm) ;; MP2 correct calculation of the actual size to any number of significant figures MP3 correct rounding to three significant figures ecf from previous step PQ of 60 mm = 33.3 (mm) PQ of 62 mm = 34.4 (mm) 2(e) add Benedict’s (reagent / solution) ; 2 heat ;
What was in this paper
The subtopics covered by these 2 questions, and how many questions each got. Open one in a new tab to see every Cambridge question on it.
What you needed in this session
Cambridge’s own grade thresholds for 2025 May/June, Paper 6 · Variant 1. A higher threshold means an easier paper — the bar moves with how the cohort did.