Cambridge IGCSE Biology (9-1) 0970 — 2022 May/June Paper 6 · Variant 2
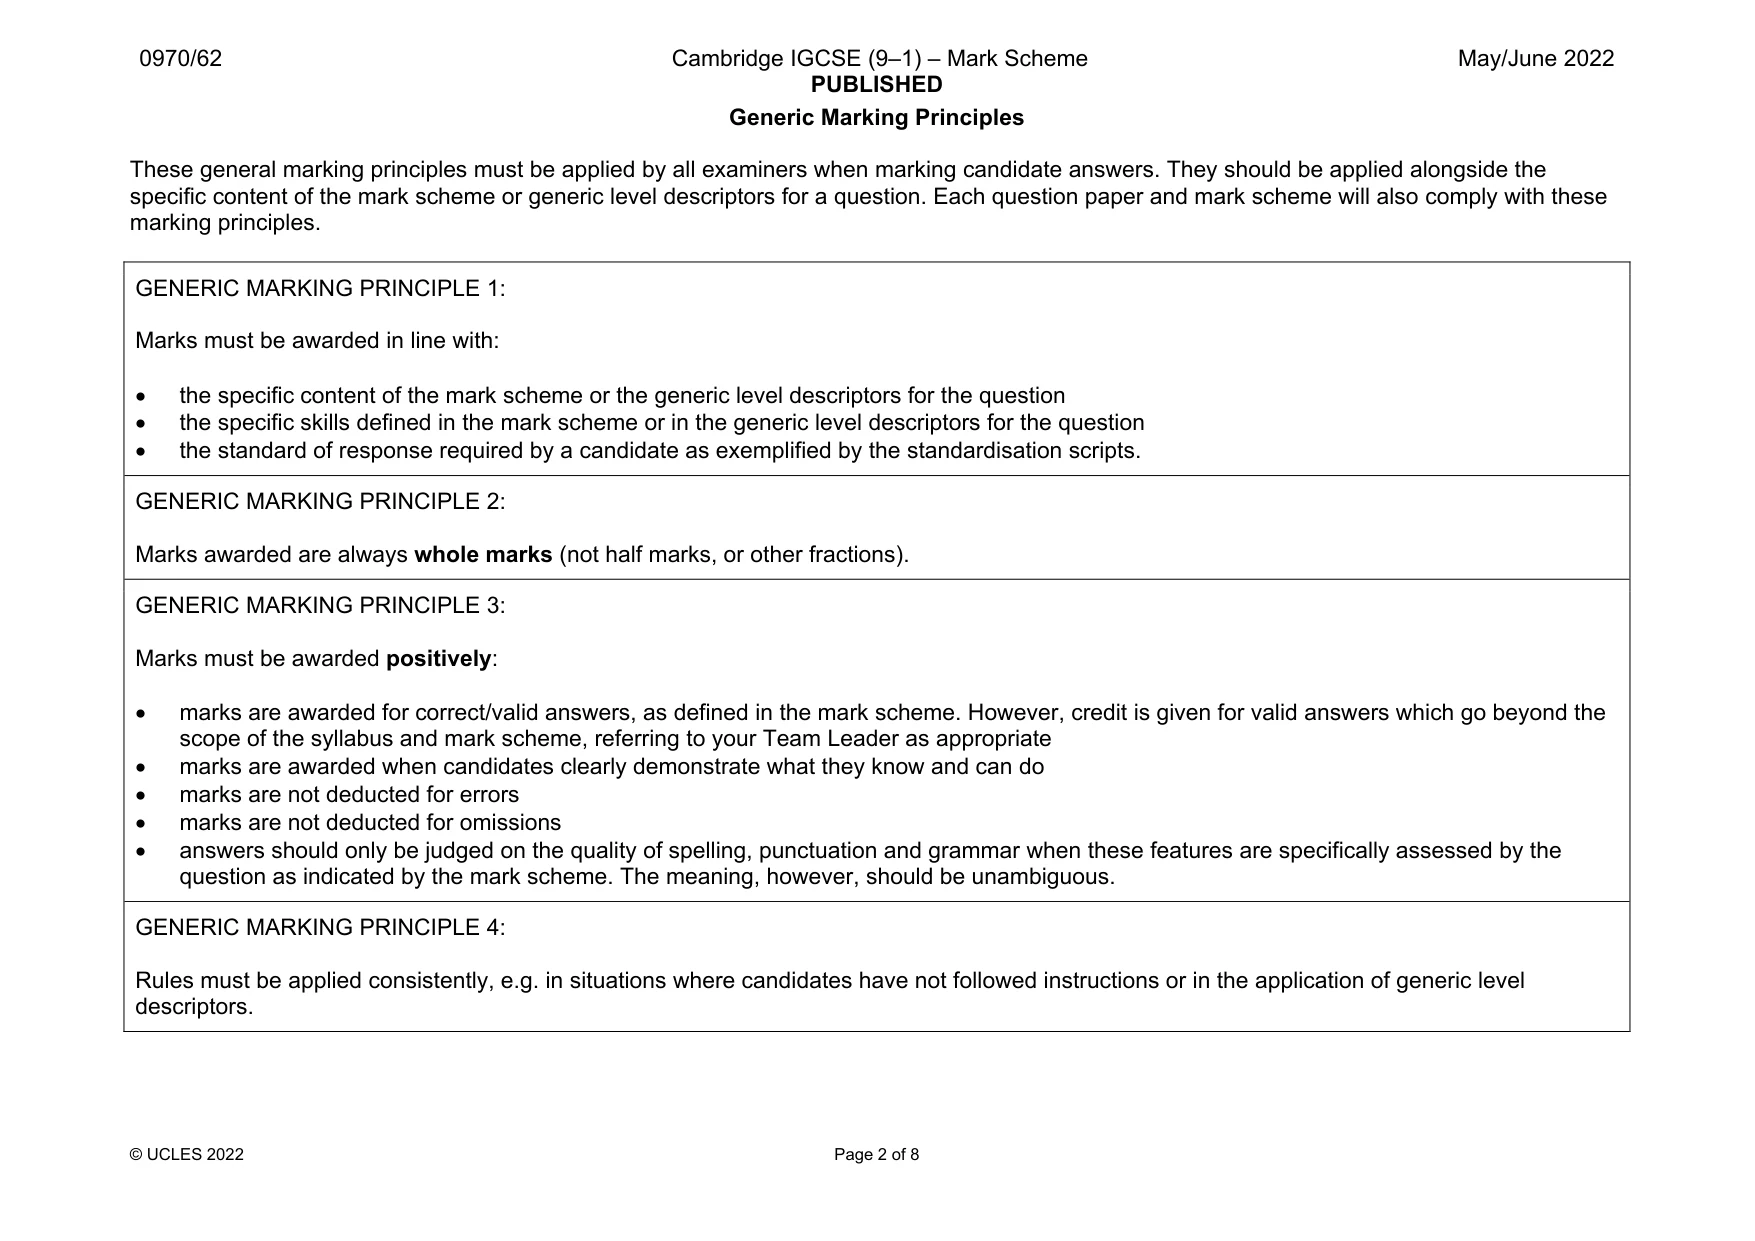
0970/62/M/J/22 · 2 questions · 40 marks · ≈45 min
The question paper and its mark scheme, free to read here and free to download. This is Cambridge’s own paper, exactly as it was sat.
Question paper12 pages

Mark scheme8 pages
Answers below. Sit the paper first if you are practising.
Questions as text
Q1 · A student investigated the effect of temperature on the diffusion of vitamin C
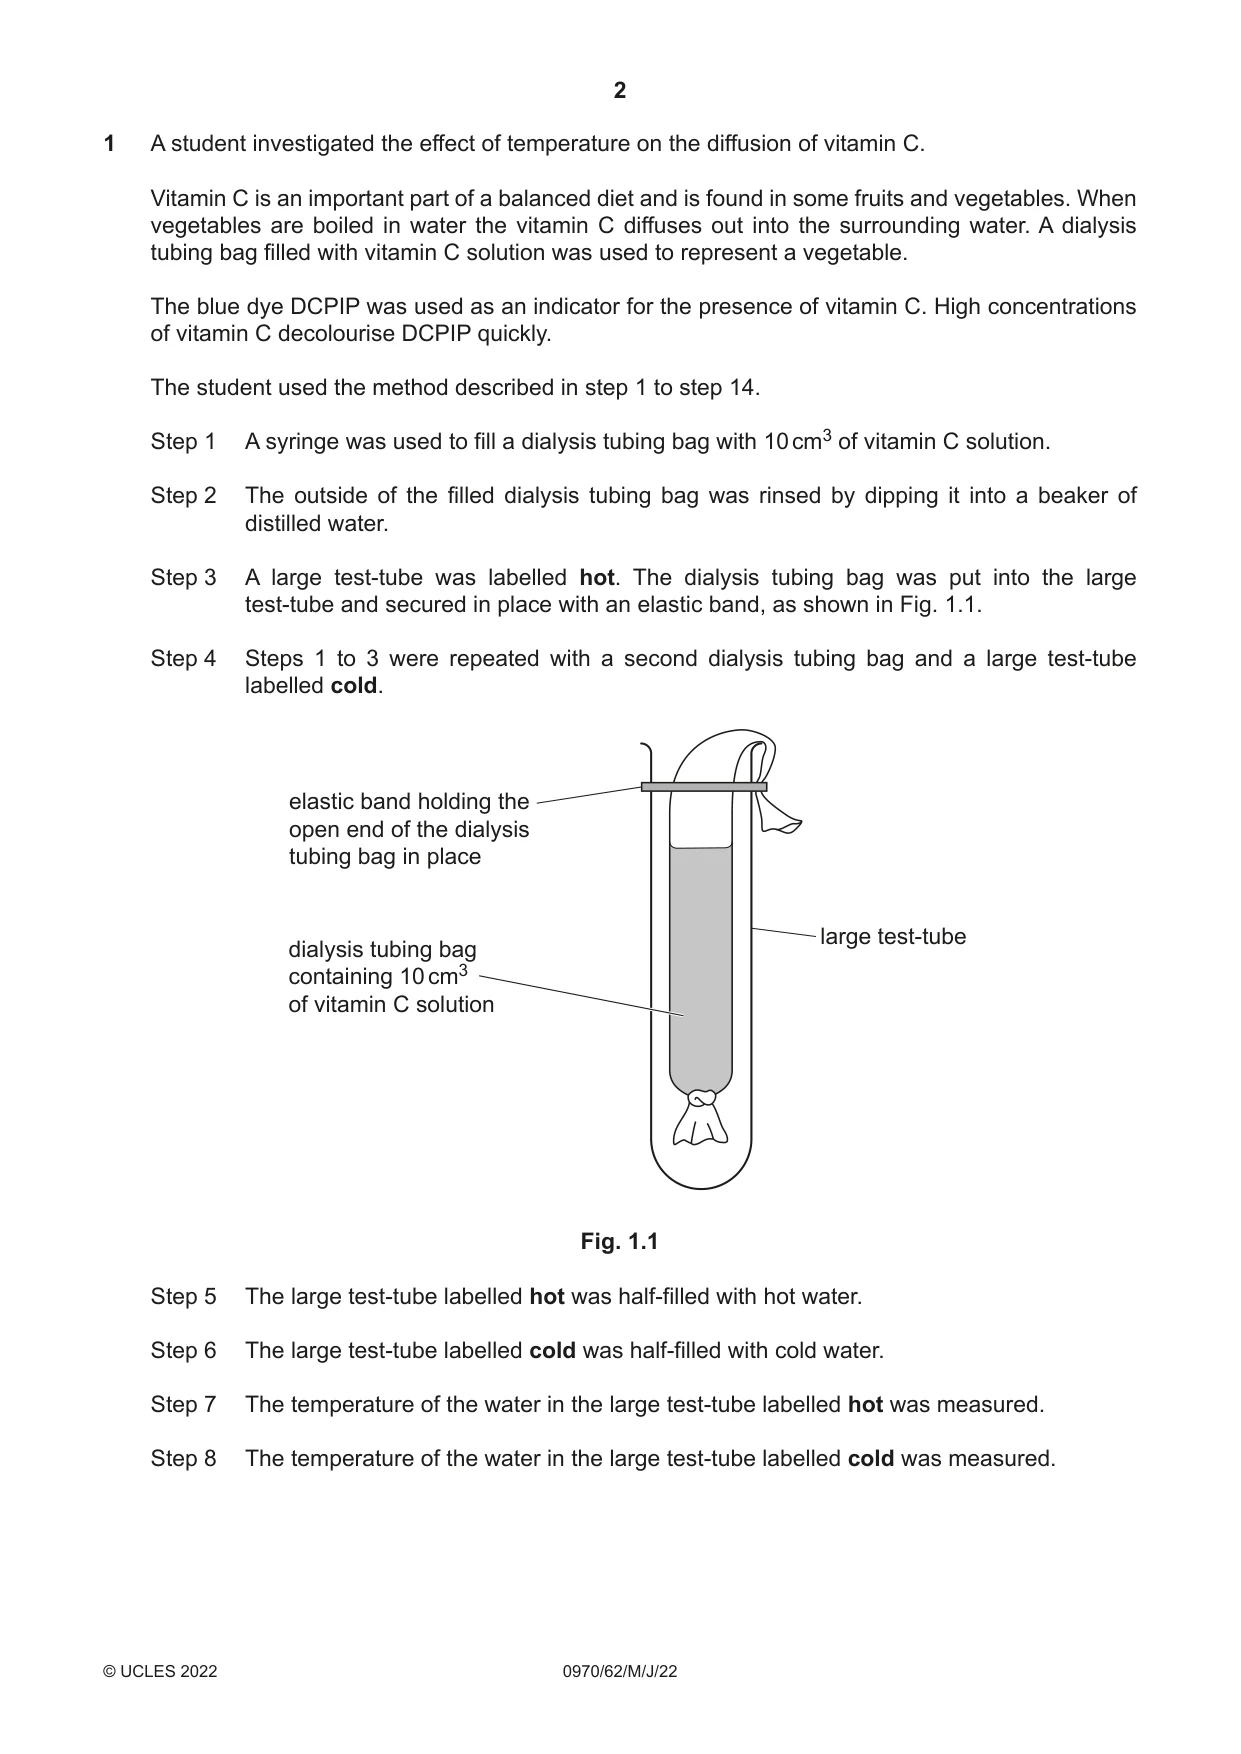
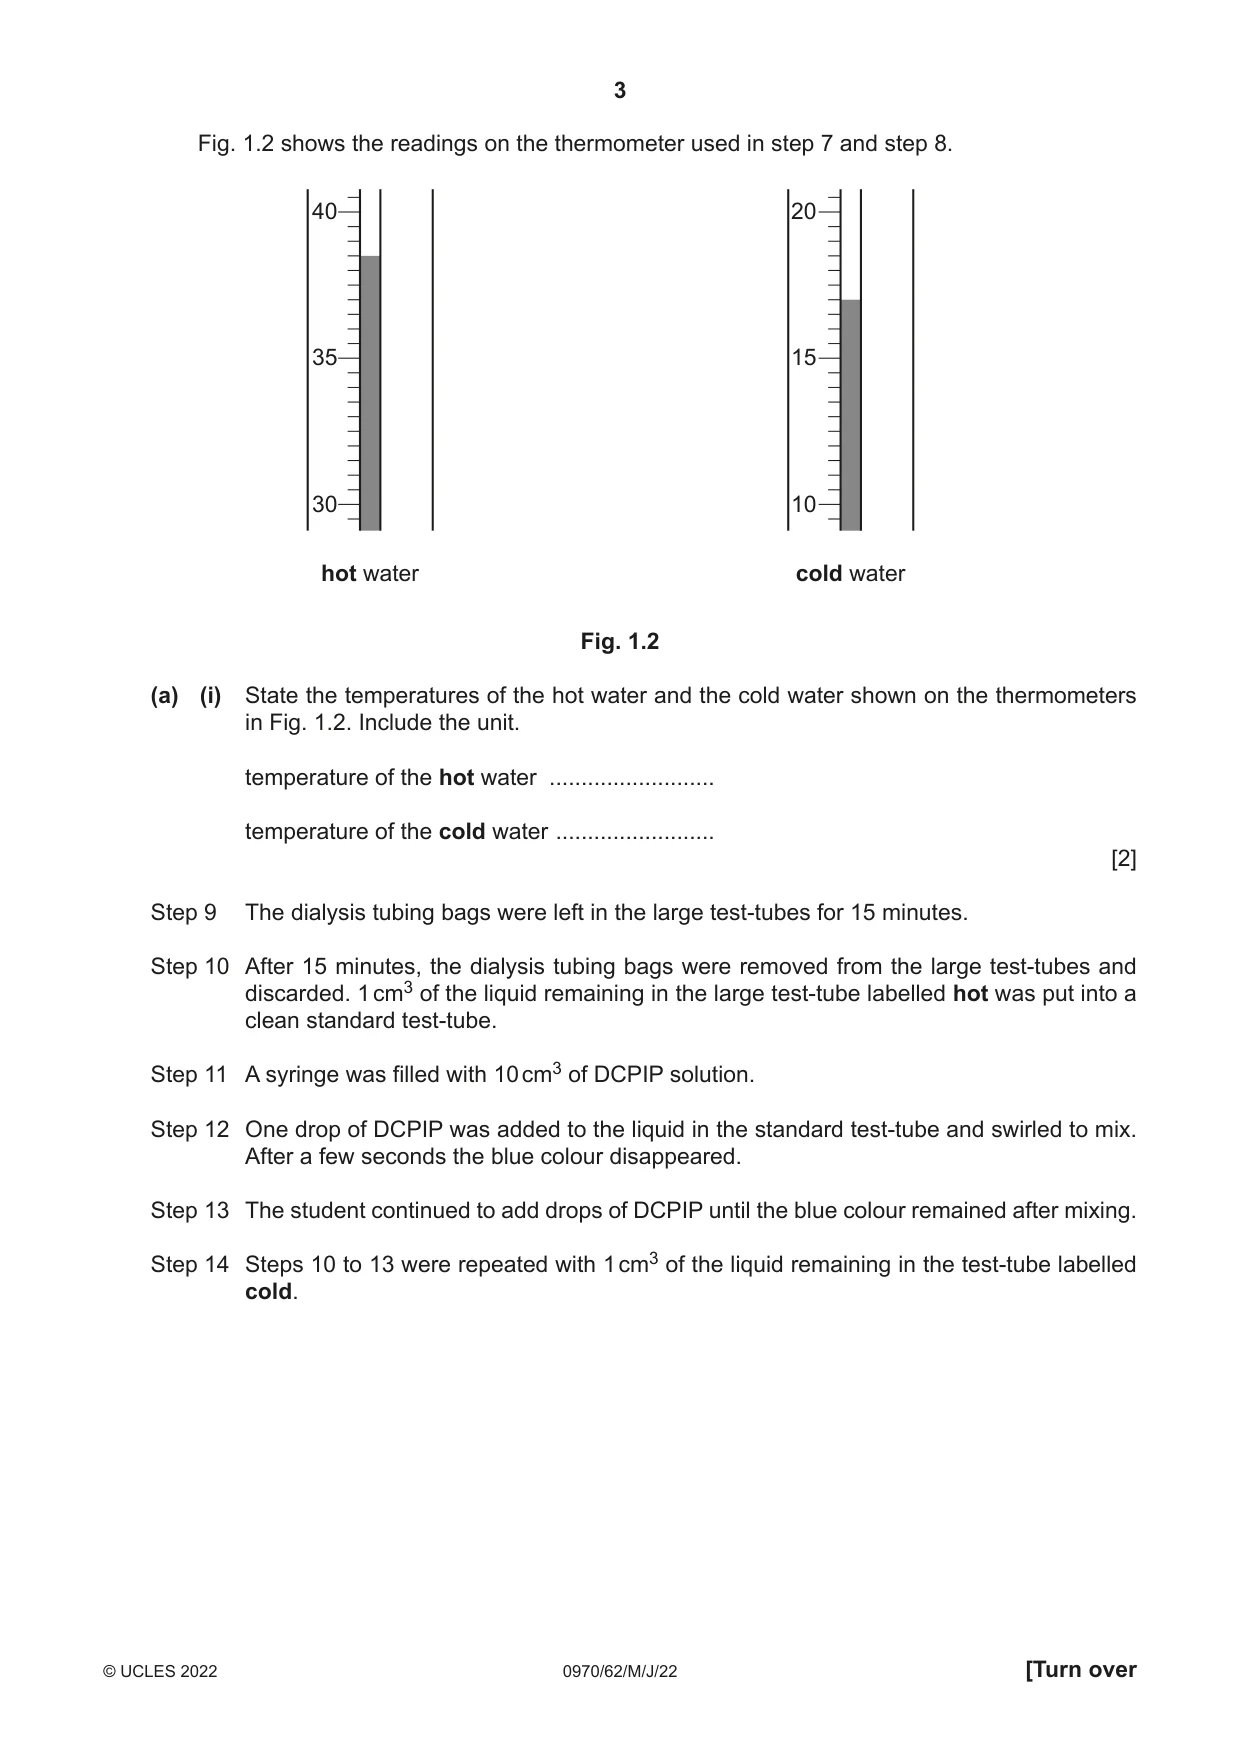
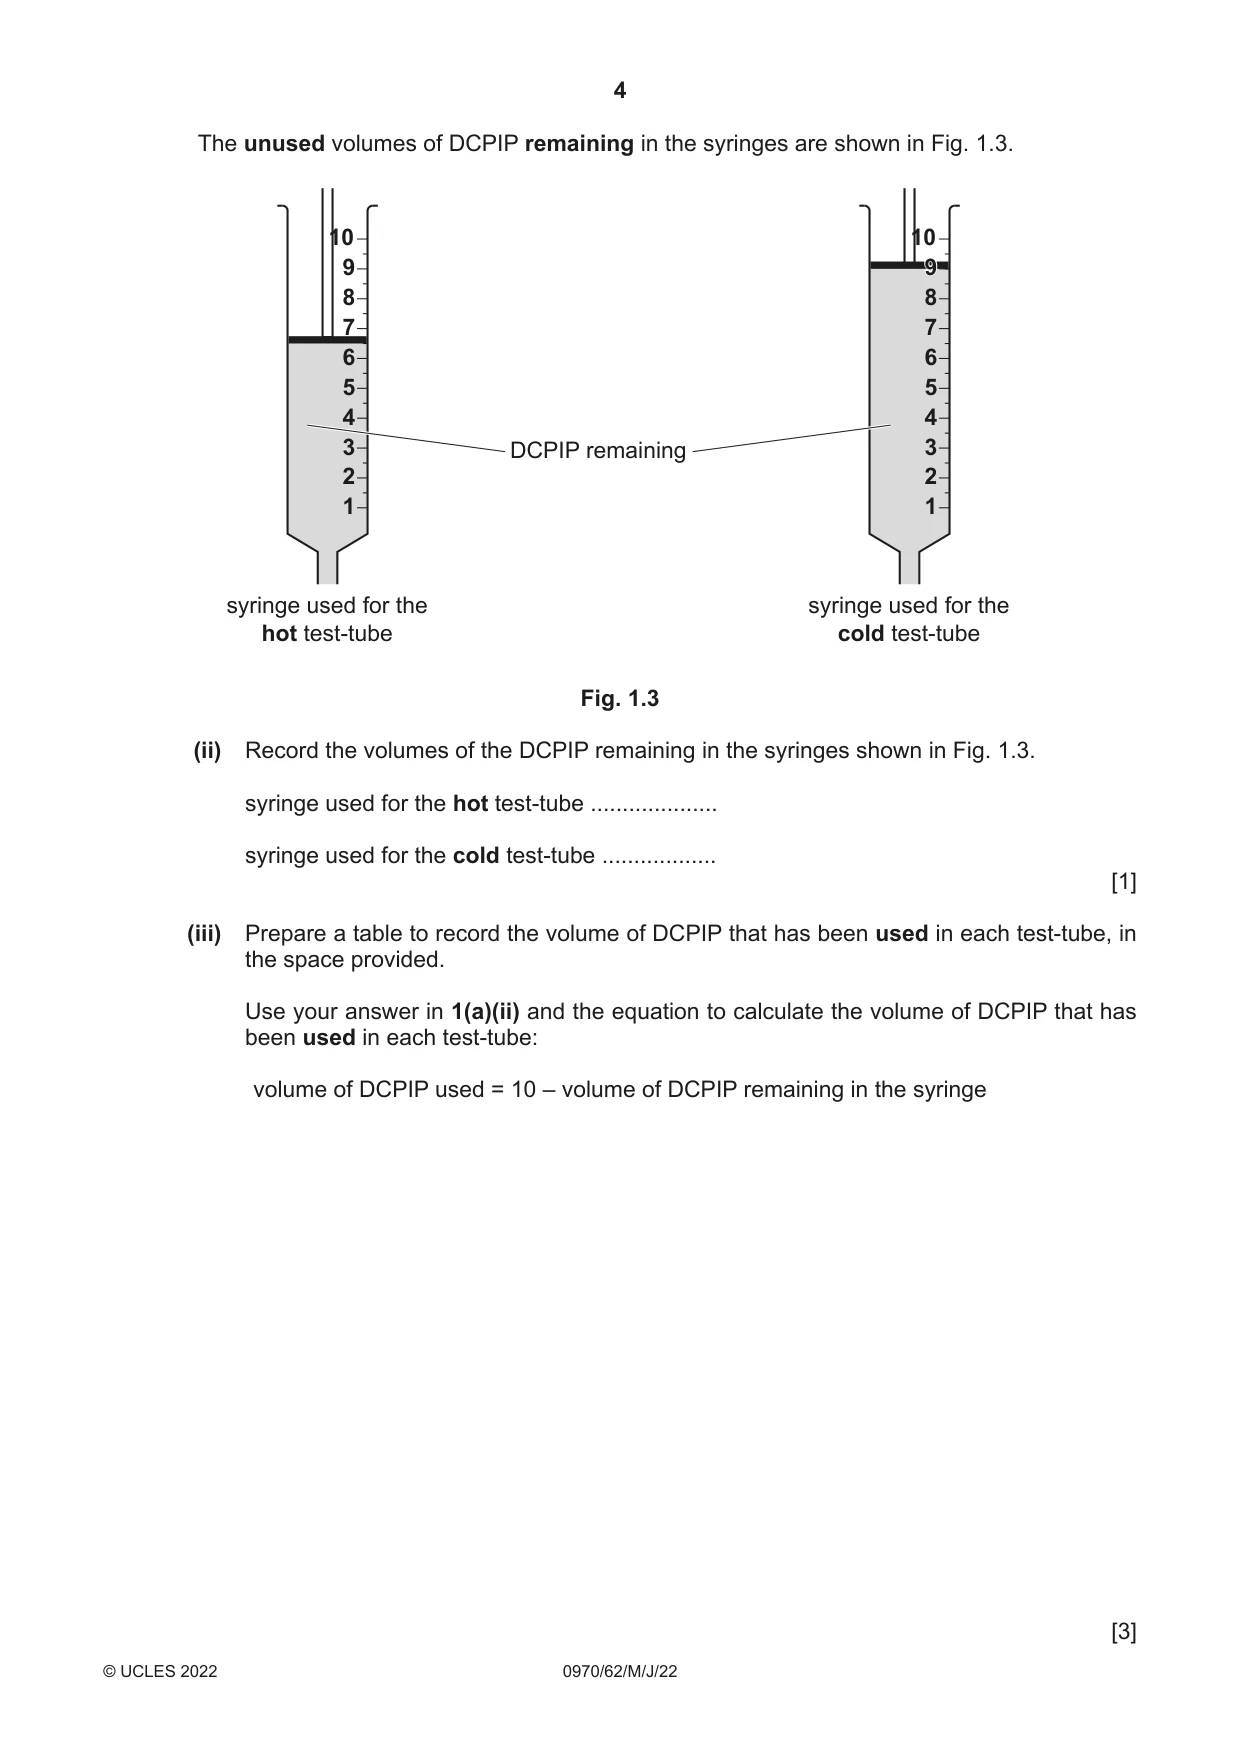
1 A student investigated the effect of temperature on the diffusion of vitamin C. Vitamin C is an important part of a balanced diet and is found in some fruits and vegetables. When vegetables are boiled in water the vitamin C diffuses out into the surrounding water. A dialysis tubing bag filled with vitamin C solution was used to represent a vegetable. The blue dye DCPIP was used as an indicator for the presence of vitamin C. High concentrations of vitamin C decolourise DCPIP quickly. The student used the method described in step 1 to step 14. Step 1 A syringe was used to fill a dialysis tubing bag with 10 cm3 of vitamin C solution. Step 2 The outside of the filled dialysis tubing bag was rinsed by dipping it into a beaker of distilled water. Step 3 A large test-tube was labelled hot. The dialysis tubing bag was put into the large test-tube and secured in place with an elastic band, as shown in Fig. 1.1. Step 4 Steps 1 to 3 were repeated with a second dialysis tubing bag and a large test-tube labelled cold. elastic band holding the open end of the dialysis tubing bag in place large test-tube dialysis tubing bag containing 10 cm3 of vitamin C solution Fig. 1.1 Step 5 The large test-tube labelled hot was half-filled with hot water. Step 6 The large test-tube labelled cold was half-filled with cold water. Step 7 The temperature of the water in the large test-tube labelled hot was measured. Step 8 The temperature of the water in the large test-tube labelled cold was measured. Fig. 1.2 shows the readings on the thermometer used in step 7 and step 8. 40 20 35 15 30 10 hot water cold water Fig. 1.2 (a) (i) State the temperatures of the hot water and the cold water shown on the thermometers in Fig. 1.2. Include the unit. temperature of the hot water .......................... temperature of the cold water ......................... [2] Step 9 The dialysis tubing bags were left in the large test-tubes for 15 minutes. Step 10 After 15 minutes, the dialysis tubing bags were removed from the large test-tubes and discarded. 1 cm3 of the liquid remaining in the large test-tube labelled hot was put into a clean standard test-tube. Step 11 A syringe was filled with 10 cm3 of DCPIP solution. Step 12 One drop of DCPIP was added to the liquid in the standard test-tube and swirled to mix. After a few seconds the blue colour disappeared. Step 13 The student continued to add drops of DCPIP until the blue colour remained after mixing. Step 14 Steps 10 to 13 were repeated with 1 cm3 of the liquid remaining in the test-tube labelled cold. The unused volumes of DCPIP remaining in the syringes are shown in Fig. 1.3. 10 10 9 9 8 8 7 7 6 6 5 5 4 4 3 DCPIP remaining 3 2 2 1 1 syringe used for the syringe used for the hot test-tube cold test-tube Fig. 1.3 (ii) Record the volumes of the DCPIP remaining in the syringes shown in Fig. 1.3. syringe used for the hot test-tube .................... syringe used for the cold test-tube .................. [1] (iii) Prepare a table to record the volume of DCPIP that has been used in each test-tube, in the space provided. Use your answer in 1(a)(ii) and the equation to calculate the volume of DCPIP that has been used in each test-tube: volume of DCPIP used = 10 – volume of DCPIP remaining in the syringe [3] (iv) State a conclusion for these results. ........................................................................................................................................... ........................................................................................................................................... ..................................................................................................................................... [1] (v) Suggest why the dialysis tubing bag was rinsed in step 2. ........................................................................................................................................... ........................................................................................................................................... ..................................................................................................................................... [1] (vi) Identify one source of error in step 5 or step 6 and suggest a suitable piece of equipment to overcome this error. error ................................................................................................................................... ........................................................................................................................................... equipment ......................................................................................................................... ........................................................................................................................................... [2] (vii) Identify the variable that the student changed (independent variable) and the variable that was measured (dependent variable) in this investigation. independent variable ......................................................................................................... ........................................................................................................................................... dependent variable ............................................................................................................ ........................................................................................................................................... [2] (viii) Suggest why repeating the procedure several times would improve the investigation. ........................................................................................................................................... ........................................................................................................................................... ..................................................................................................................................... [1] (b) Dialysis tubing acts as a partially permeable membrane and can be used to represent a model cell to investigate osmosis. Plan an investigation to find out how different concentrations of sugar solutions affect the movement of water into or out of dialysis tubing. ................................................................................................................................................... ................................................................................................................................................... ................................................................................................................................................... ................................................................................................................................................... ................................................................................................................................................... ................................................................................................................................................... ................................................................................................................................................... ................................................................................................................................................... ................................................................................................................................................... ................................................................................................................................................... ................................................................................................................................................... ................................................................................................................................................... ................................................................................................................................................... ................................................................................................................................................... ................................................................................................................................................... ............................................................................................................................................. [6] [Total: 19]
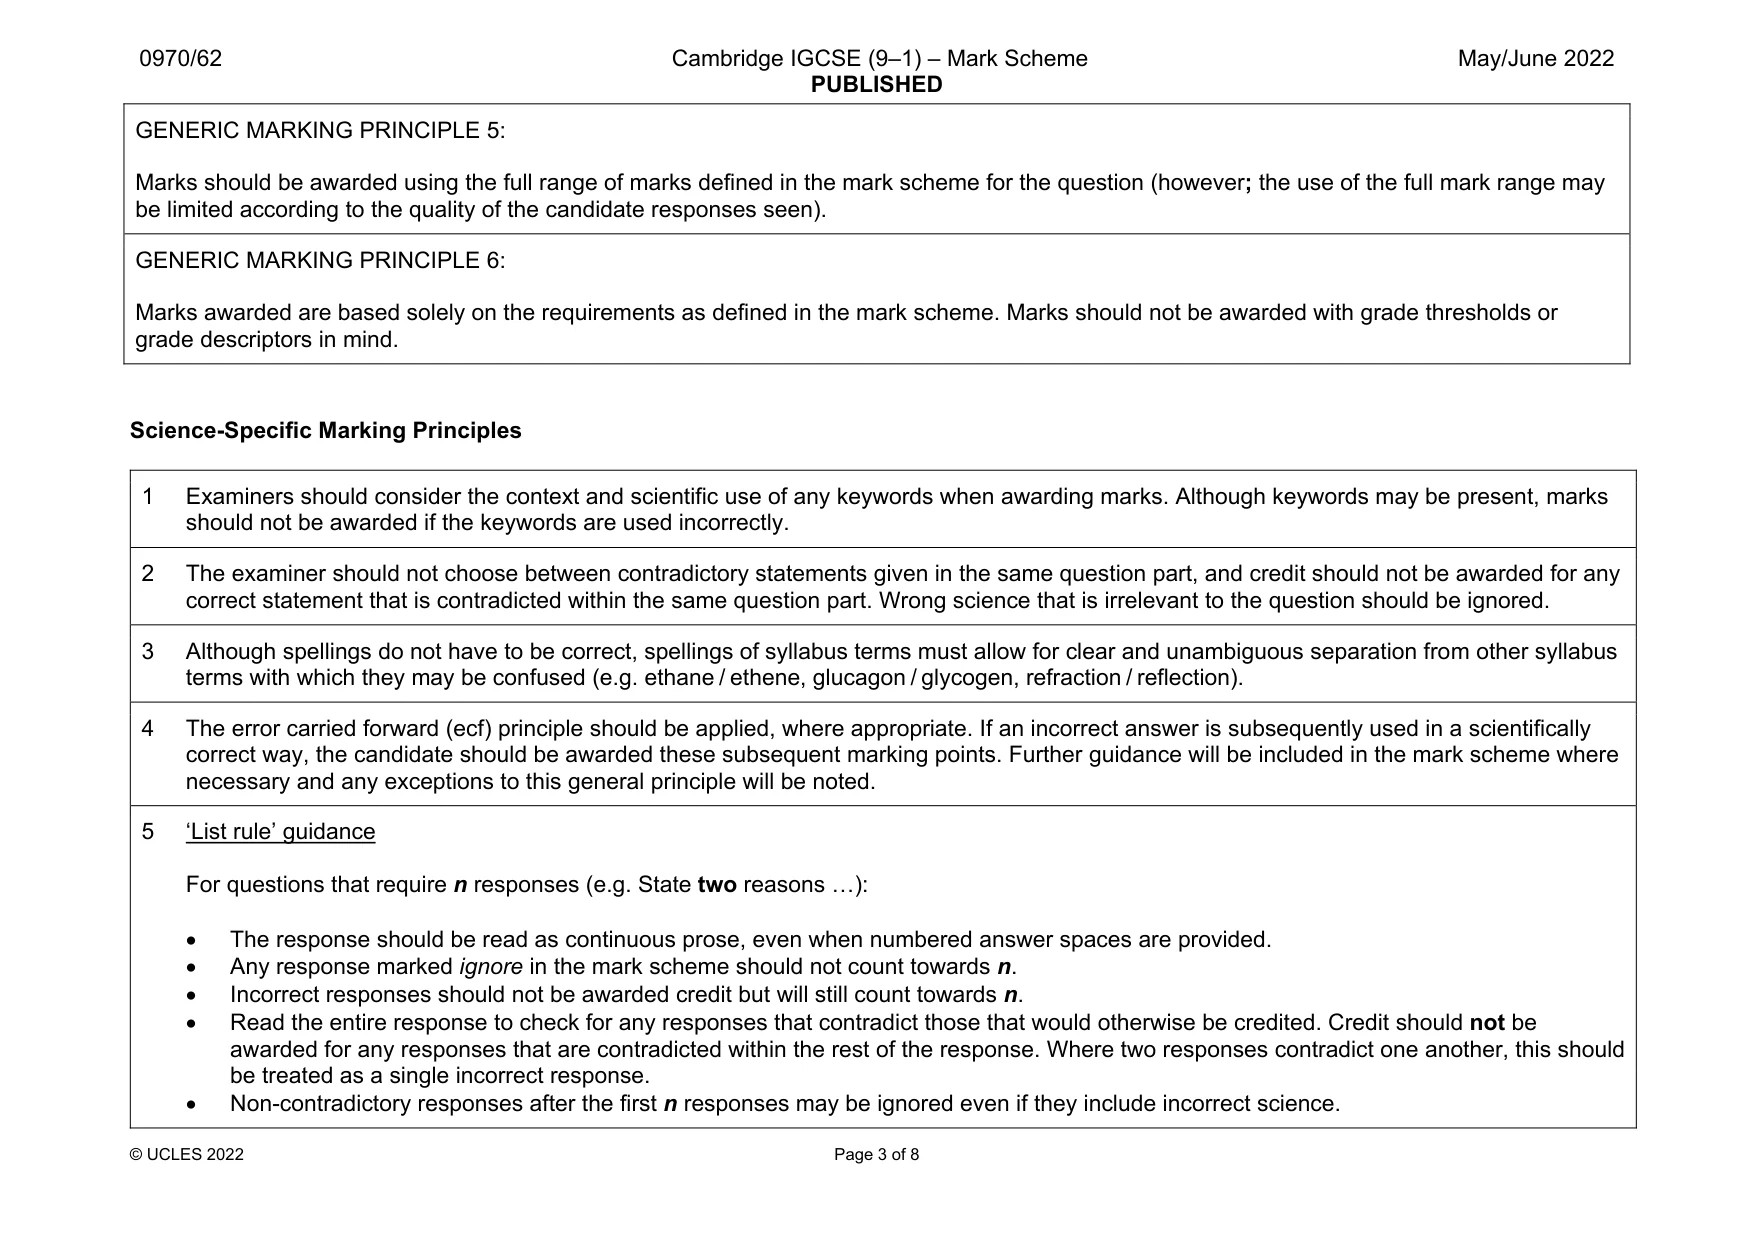
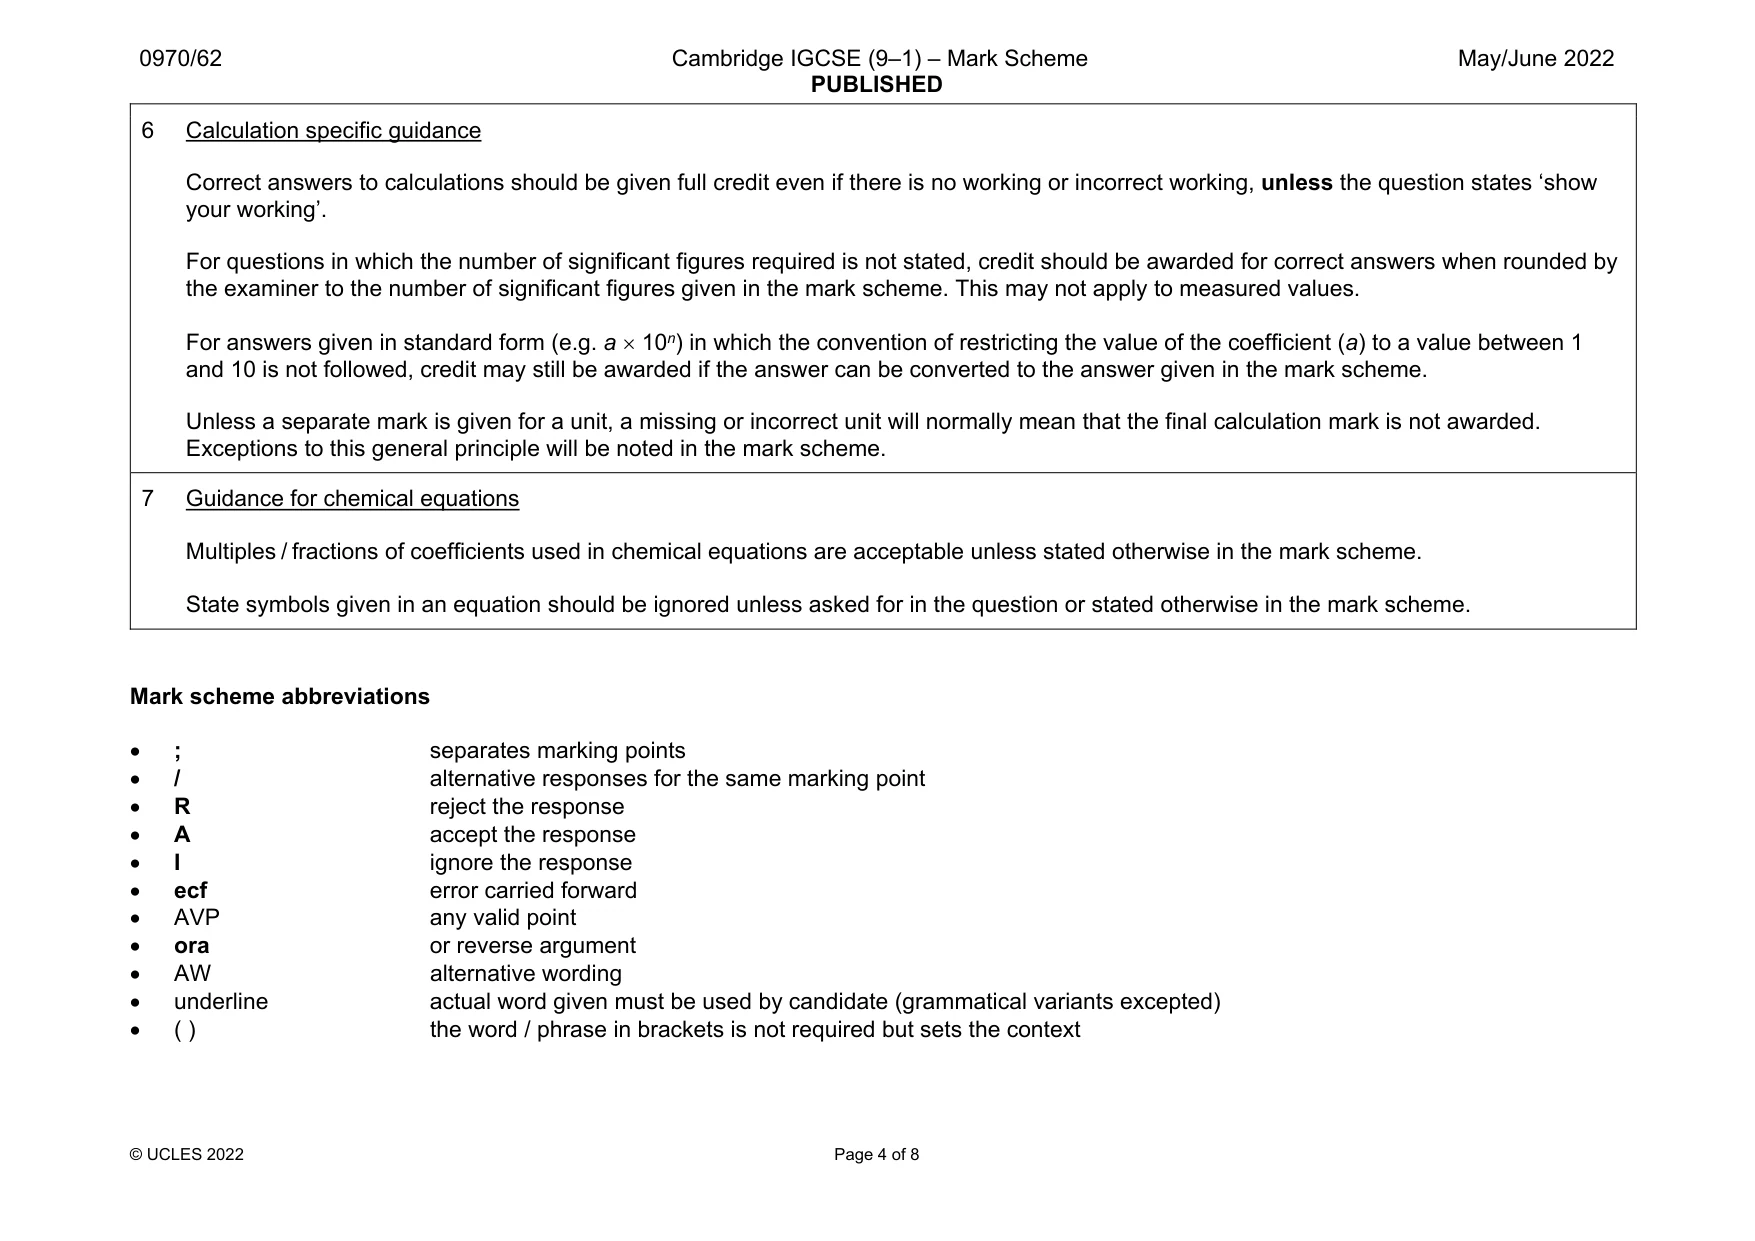
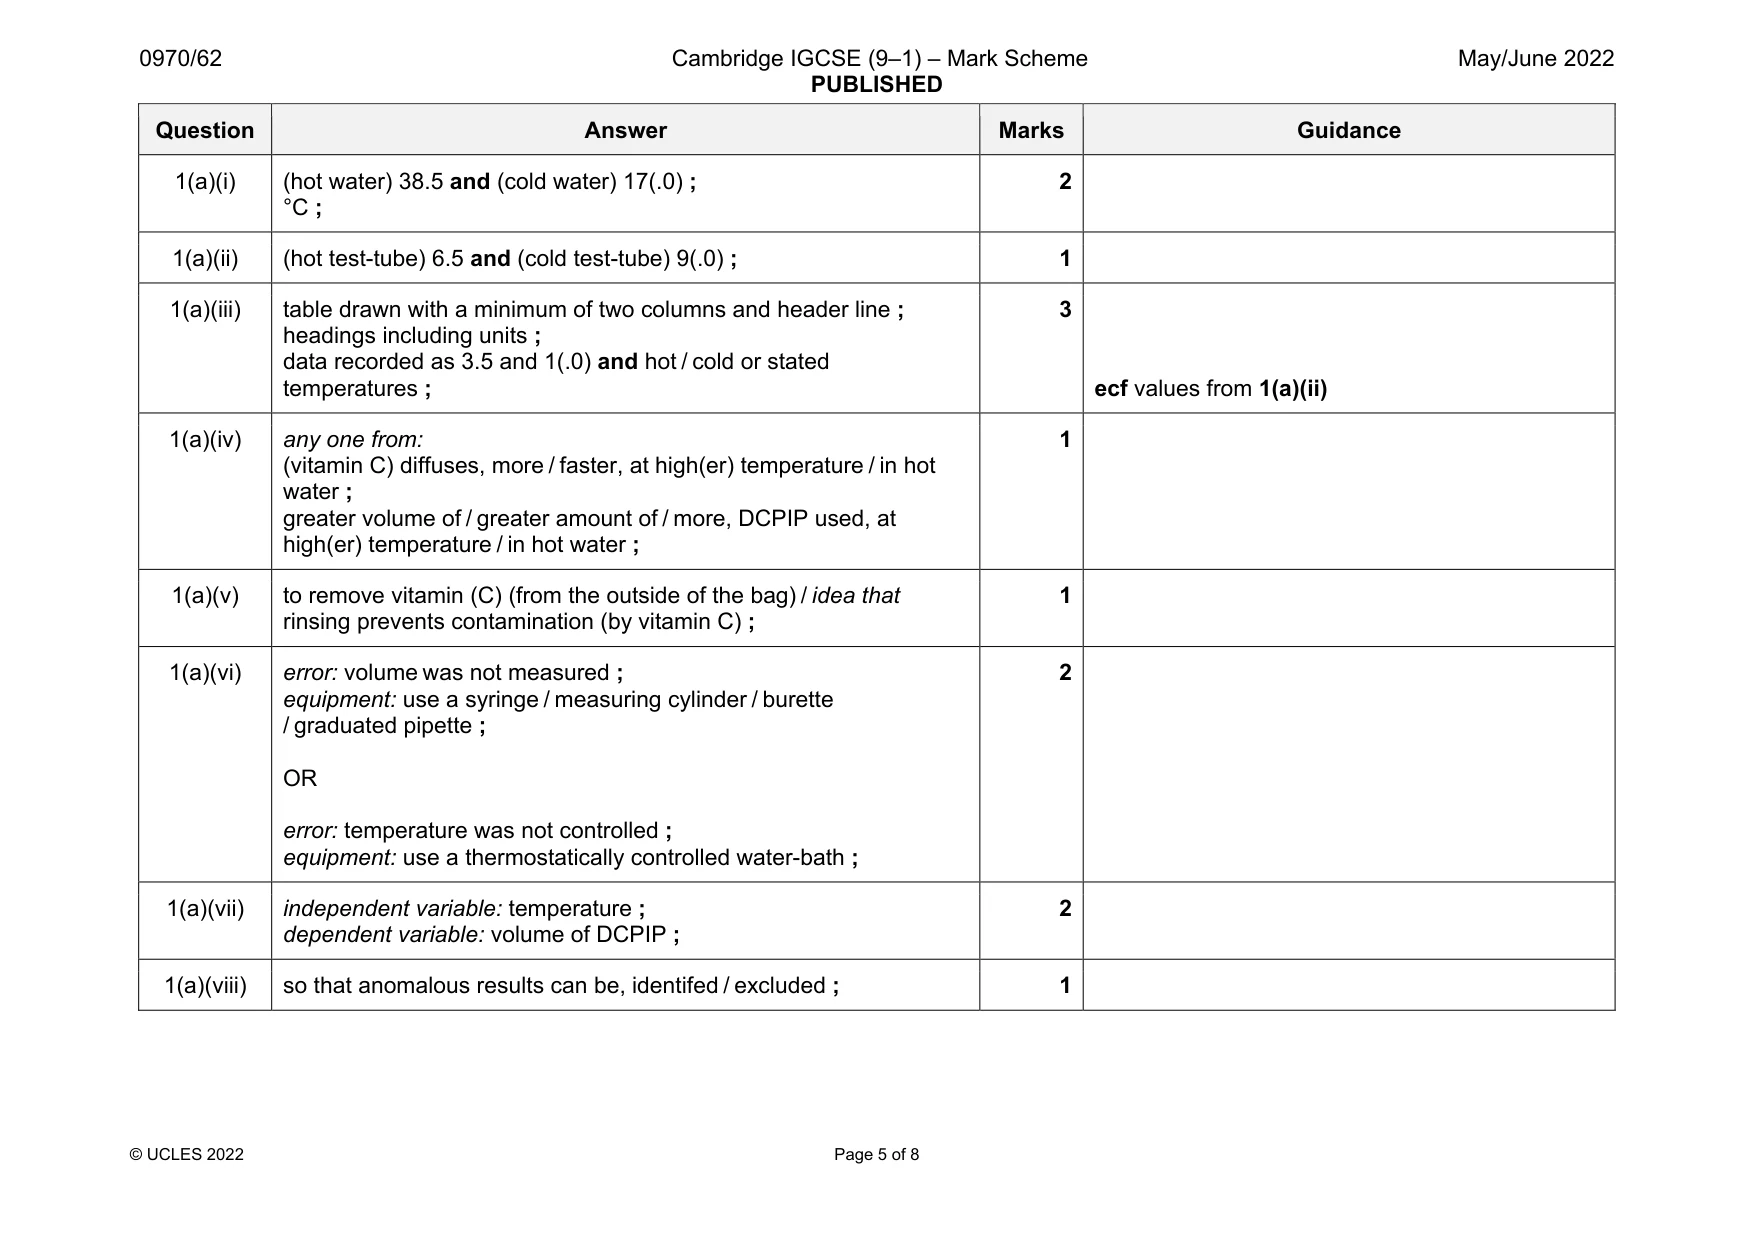
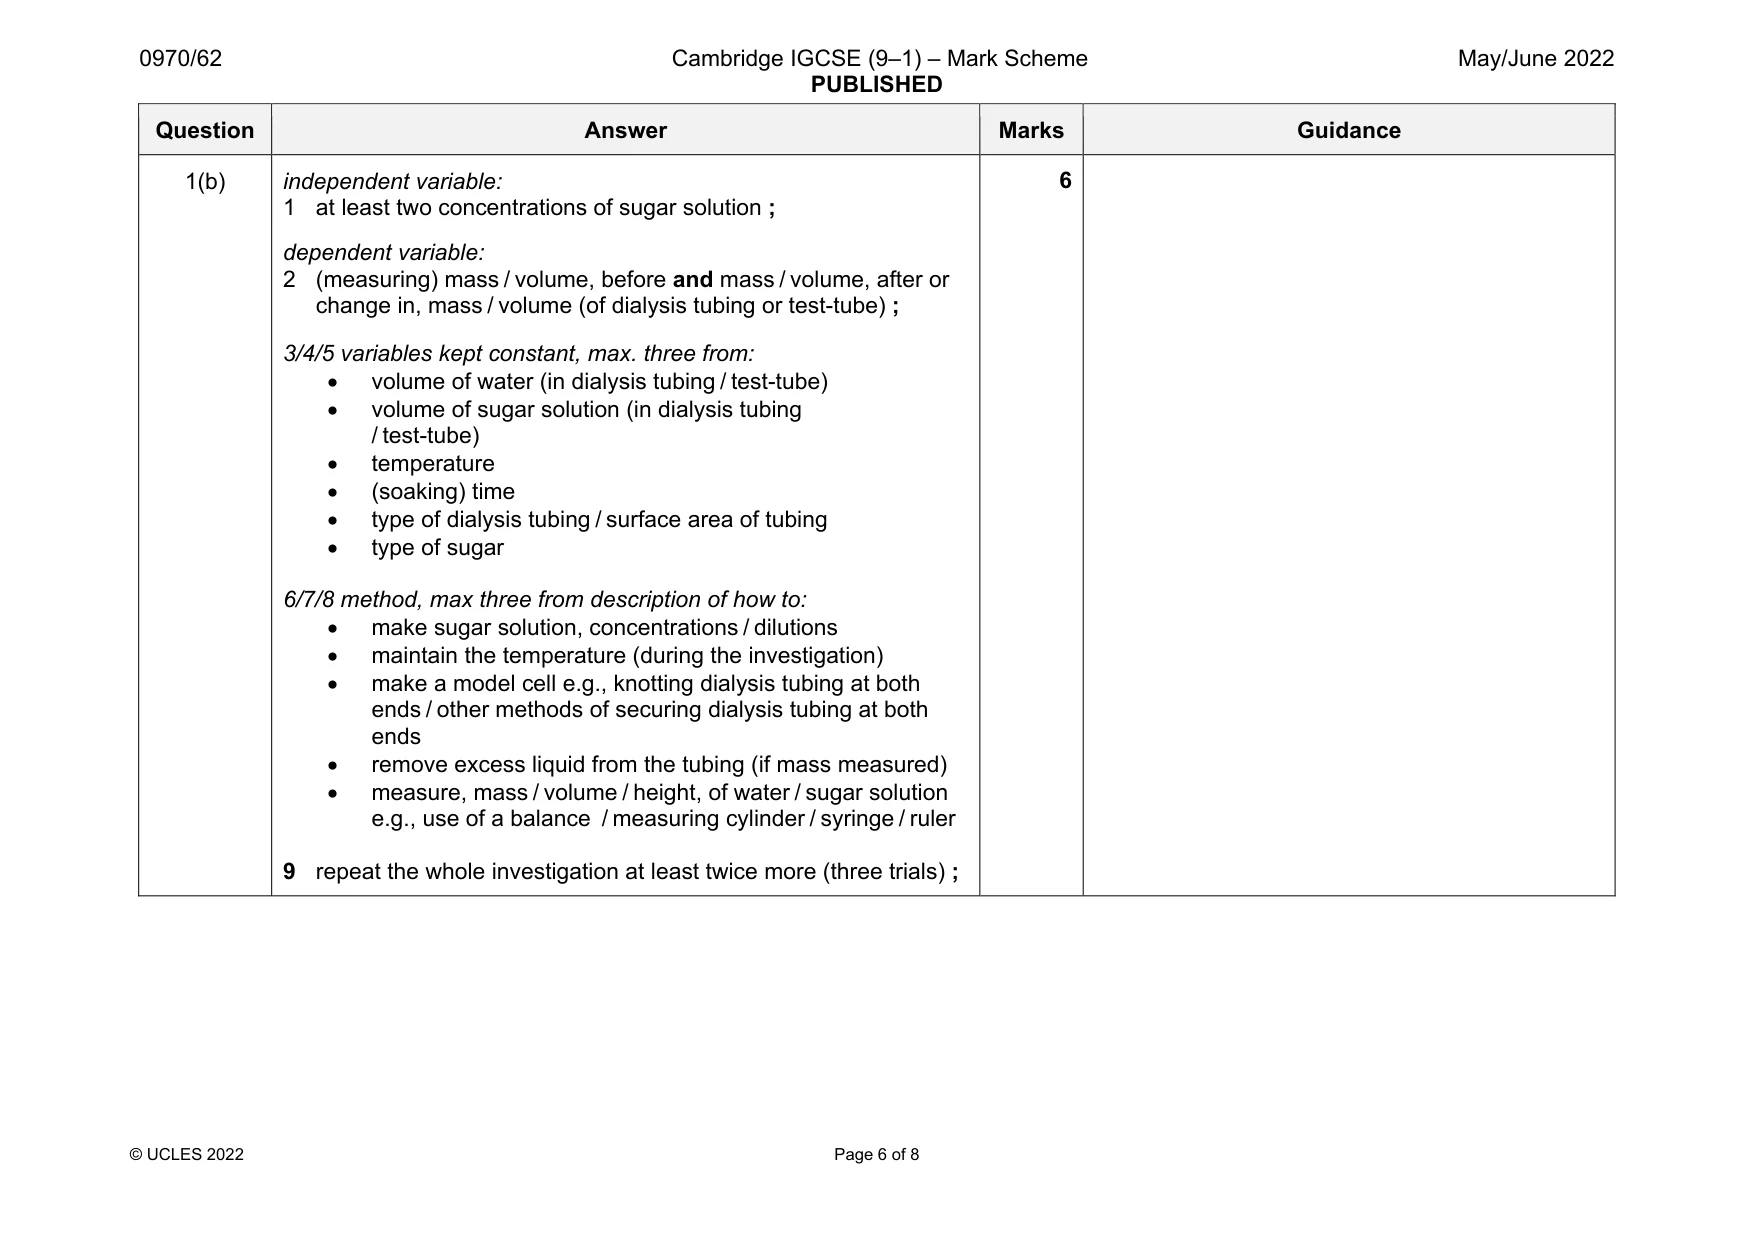
Mark scheme: 1(a)(i) (hot water) 38.5 and (cold water) 17(.0) ; °C ; 2 1(a)(ii) (hot test-tube) 6.5 and (cold test-tube) 9(.0) ; 1 1(a)(iii) table drawn with a minimum of two columns and header line ; headings including units ; data recorded as 3.5 and 1(.0) and hot / cold or stated temperatures ; 3 ecf values from 1(a)(ii) 1(a)(iv) any one from: (vitamin C) diffuses, more / faster, at high(er) temperature / in hot water ; greater volume of / greater amount of / more, DCPIP used, at high(er) temperature / in hot water ; 1 1(a)(v) to remove vitamin (C) (from the outside of the bag) / idea that rinsing prevents contamination (by vitamin C) ; 1 1(a)(vi) error: volume was not measured ; equipment: use a syringe / measuring cylinder / burette / graduated pipette ; OR error: temperature was not controlled ; equipment: use a thermostatically controlled water-bath ; 2 1(a)(vii) independent variable: temperature ; dependent variable: volume of DCPIP ; 2 1(a)(viii) so that anomalous results can be, identifed / excluded ; 1 Question Answer Marks Guidance 1(b) independent variable: 1 at least two concentrations of sugar solution ; dependent variable: 2 (measuring) mass / volume, before and mass / volume, after or change in, mass / volume (of dialysis tubing or test-tube) ; 3/4/5 variables kept constant, max. three from: volume of water (in dialysis tubing / test-tube) volume of sugar solution (in dialysis tubing / test-tube) temperature (soaking) time type of dialysis tubing / surface area of tubing type of sugar 6/7/8 method, max three from description of how to: make sugar solution, concentrations / dilutions maintain the temperature (during the investigation) make a model cell e.g., knotting dialysis tubing at both ends / other methods of securing dialysis tubing at both ends remove excess liquid from the tubing (if mass measured) measure, mass / volume / height, of water / sugar solution e.g., use of a balance / measuring cylinder / syringe / ruler 9 repeat the whole investigation at least twice more (three trials) ; 6
Q2 · Nautiluses are a genus of marine animals that live in shells
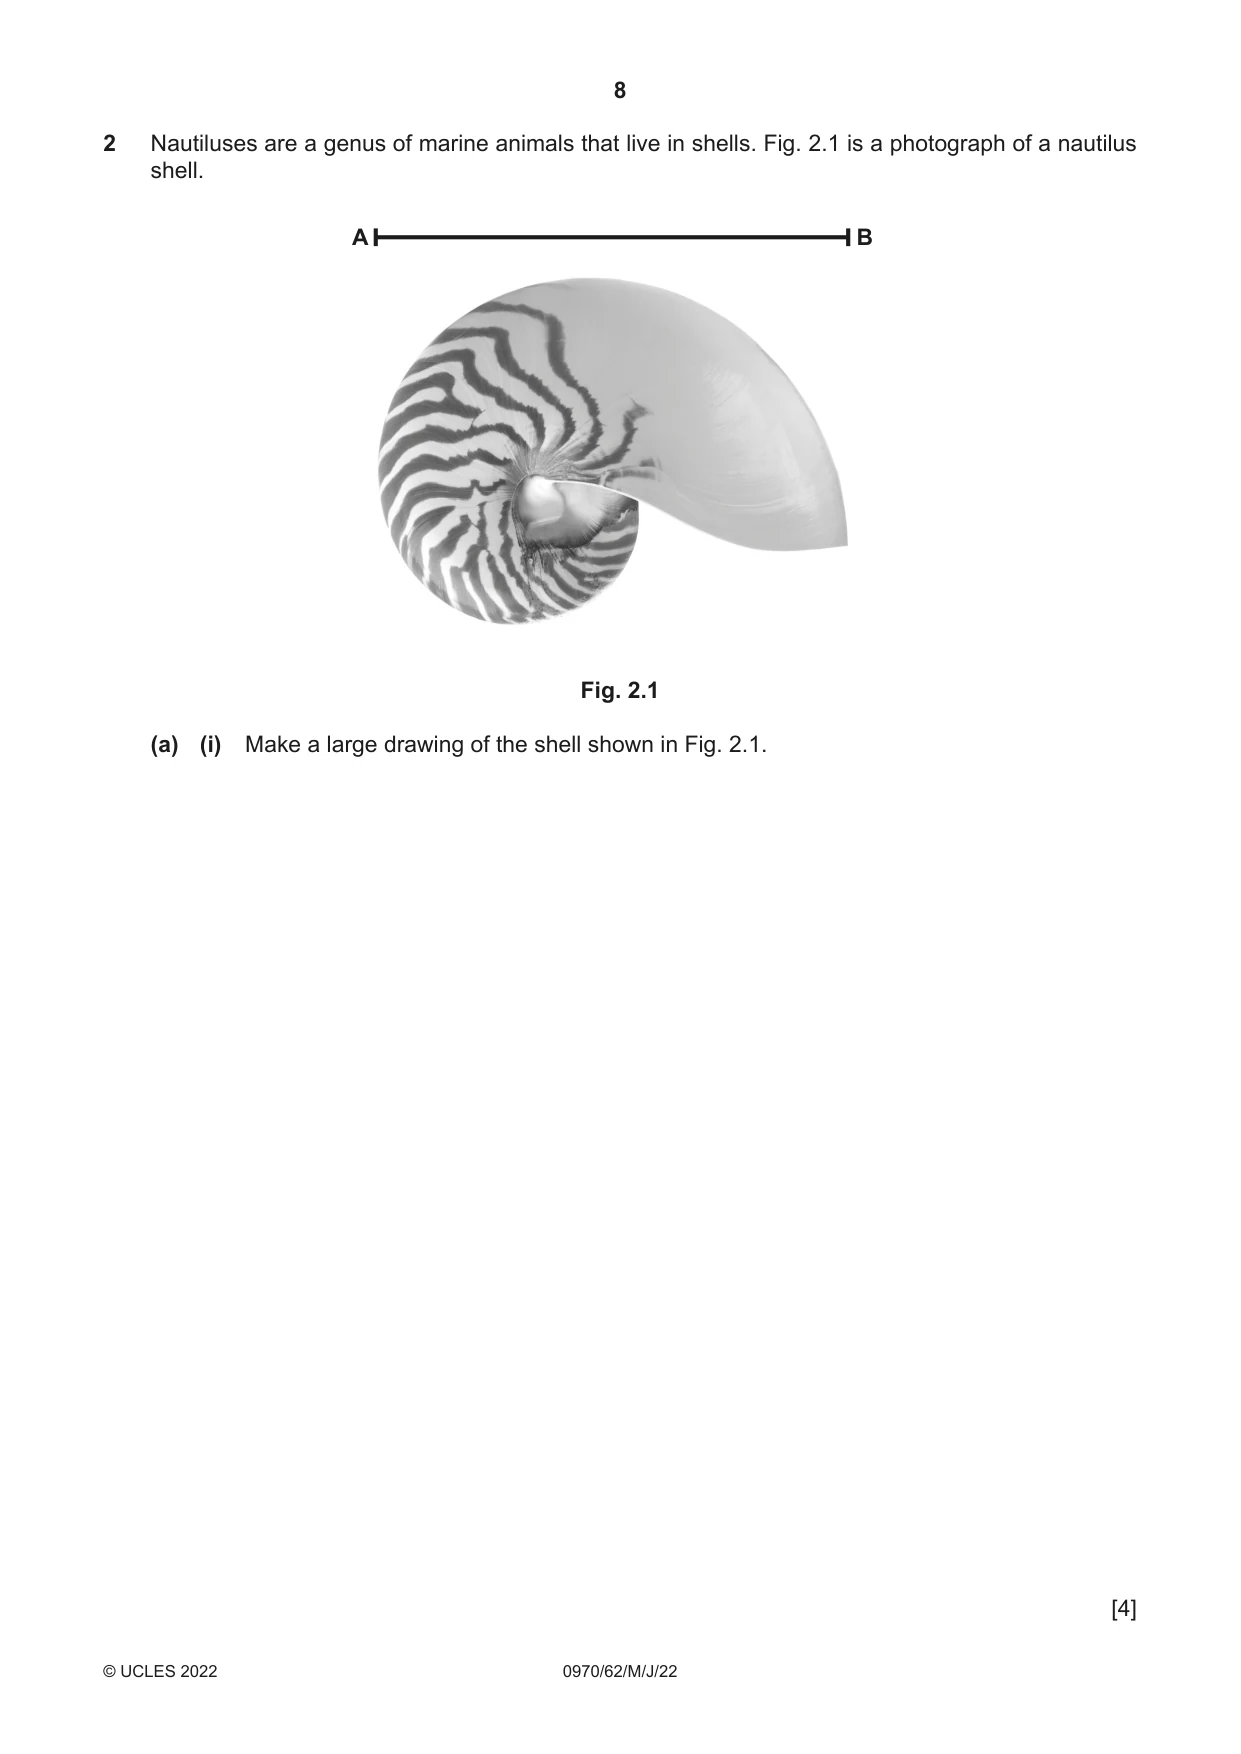
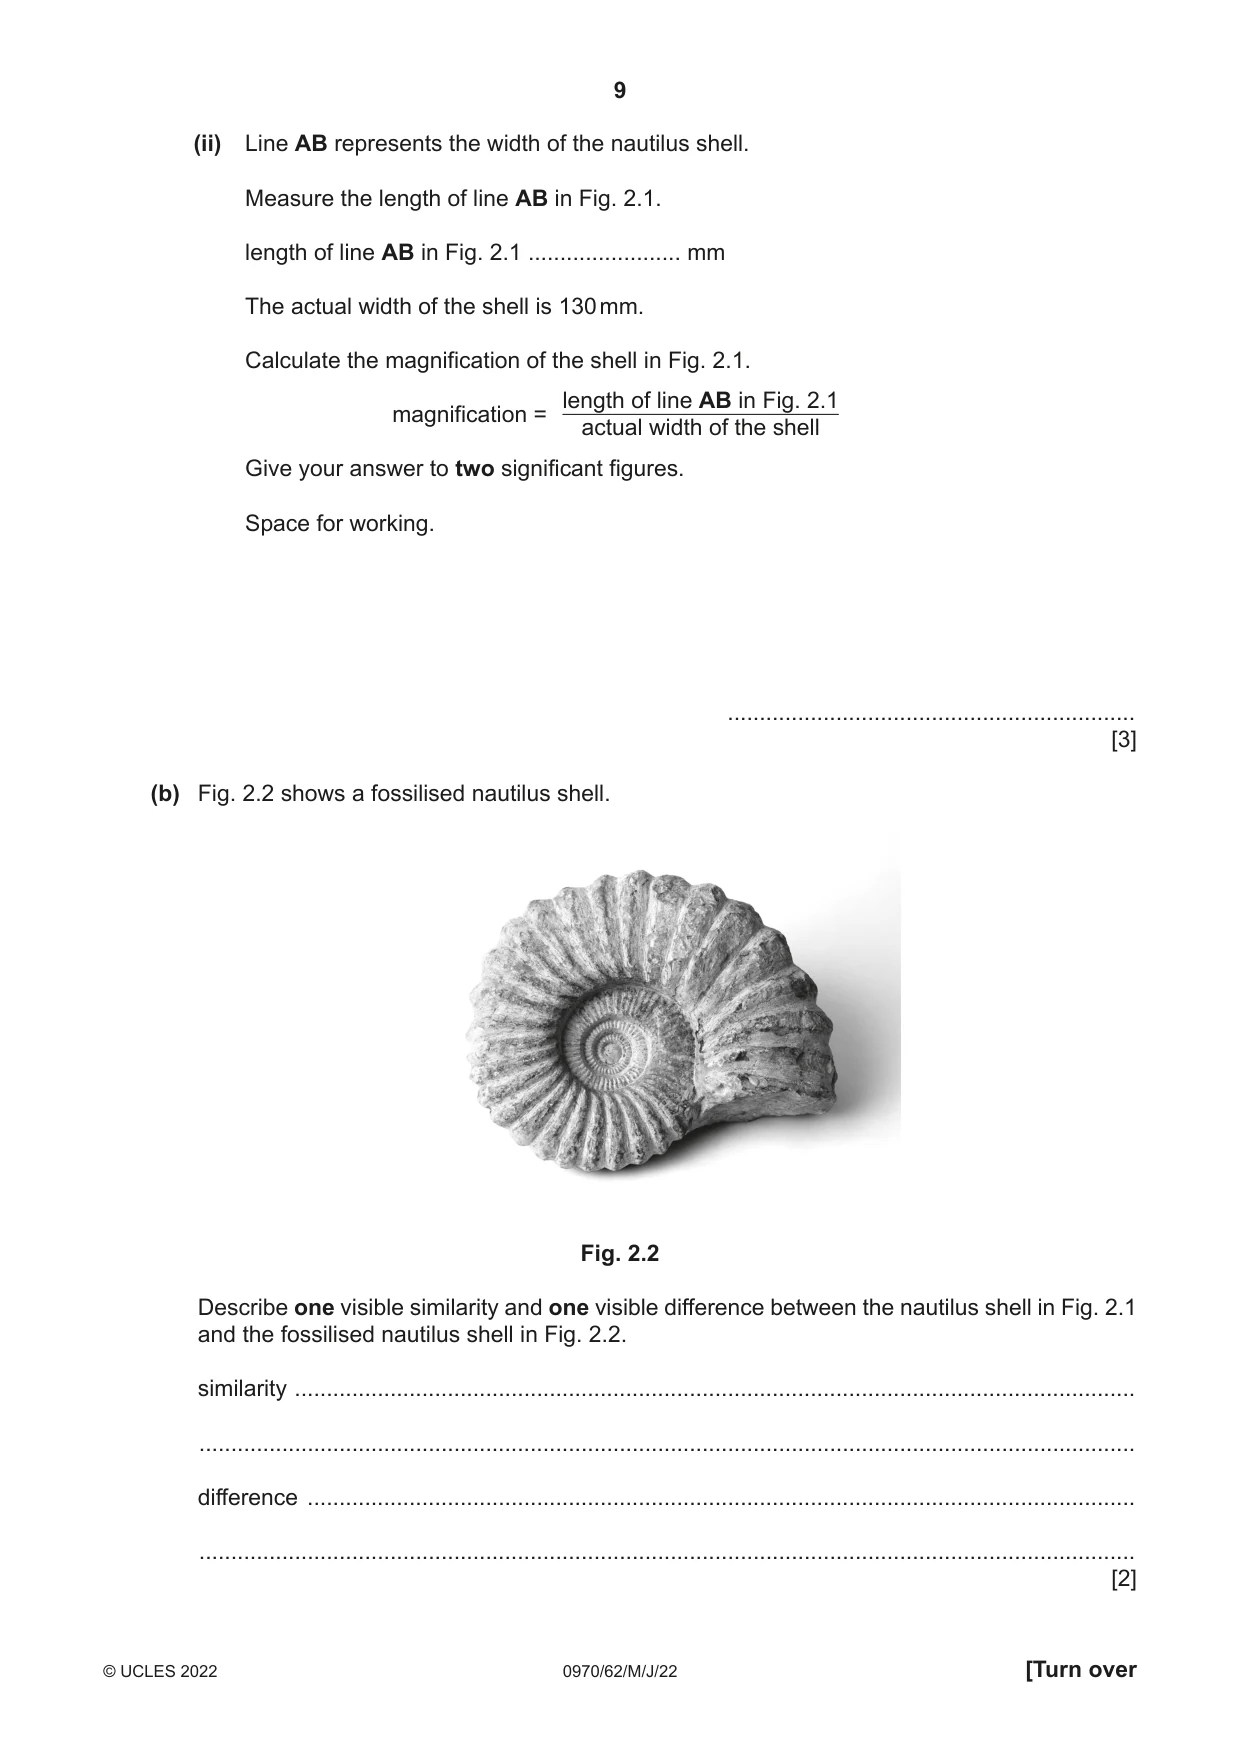
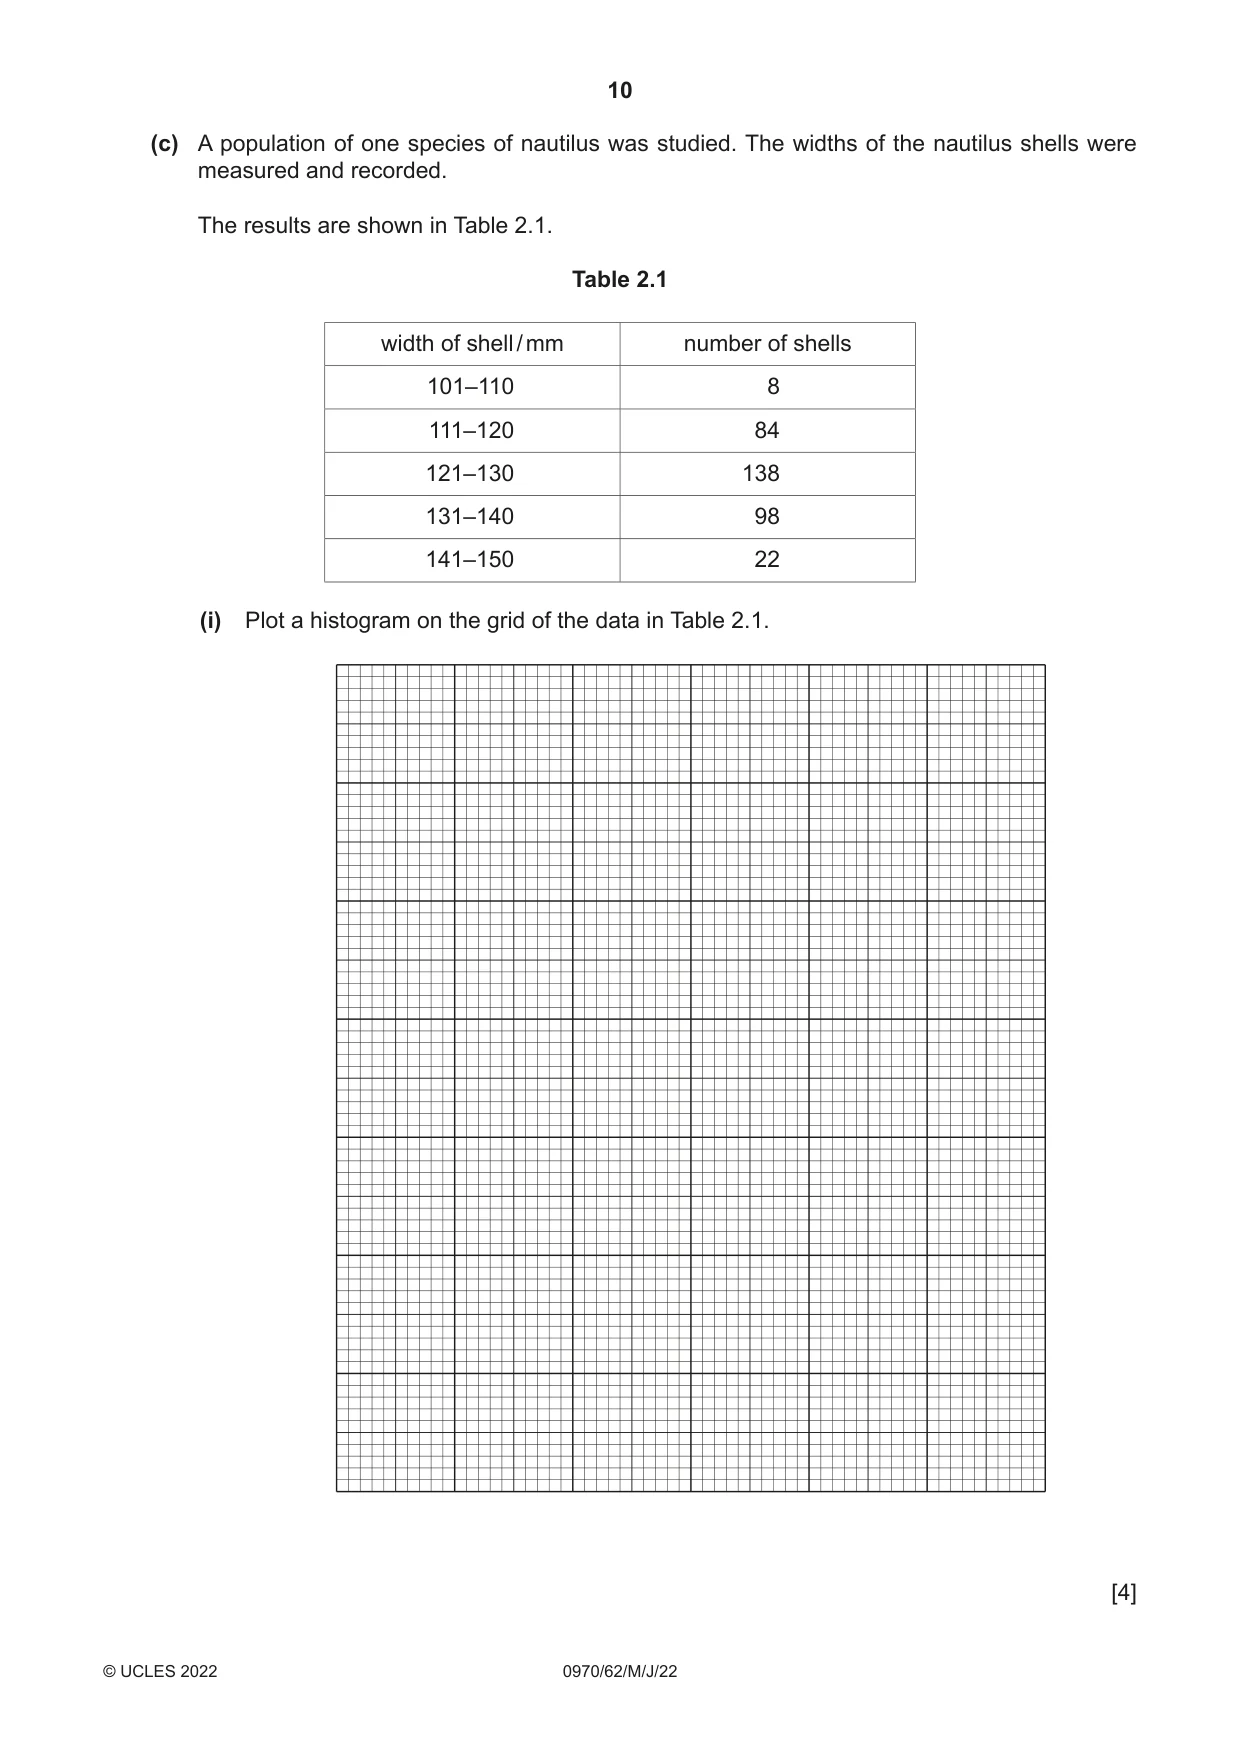
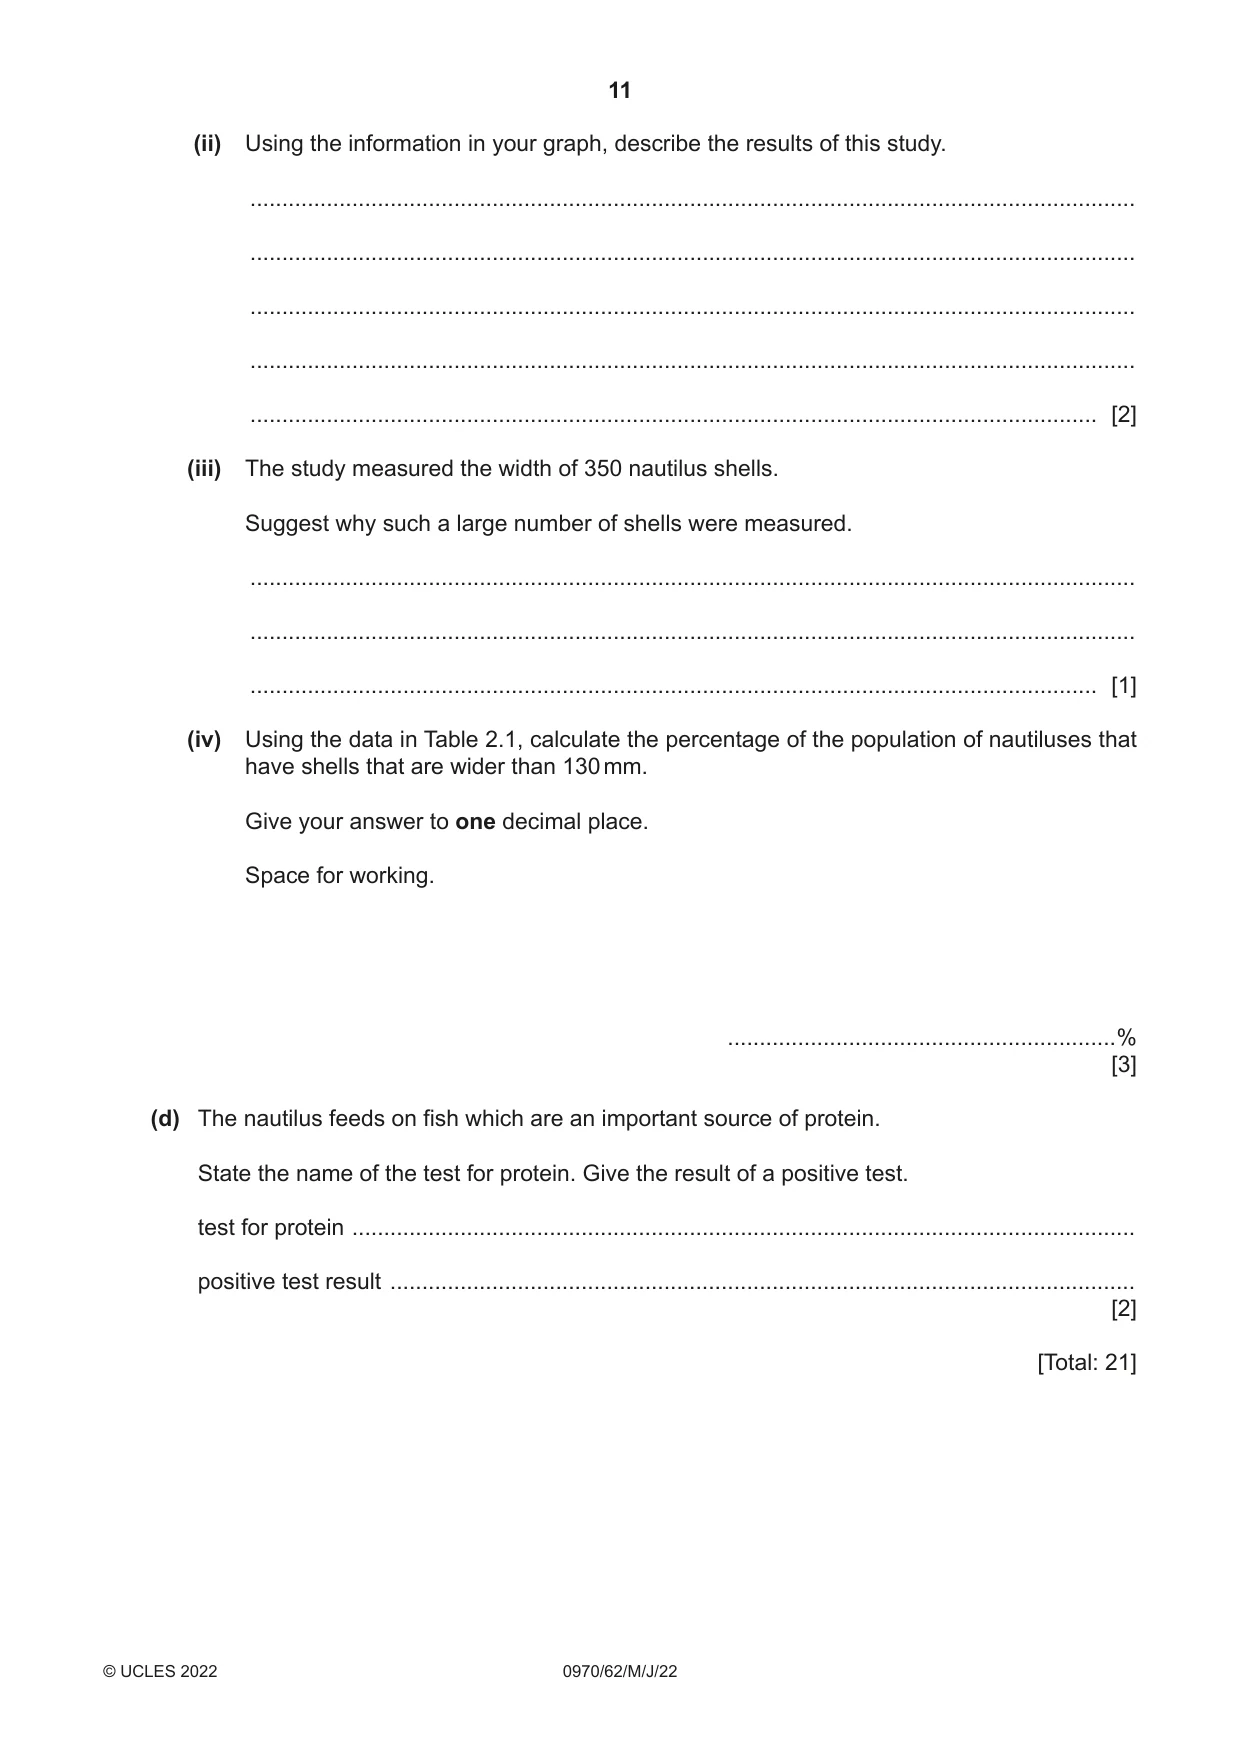
2 Nautiluses are a genus of marine animals that live in shells. Fig. 2.1 is a photograph of a nautilus shell. A B Fig. 2.1 (a) (i) Make a large drawing of the shell shown in Fig. 2.1. [4] (ii) Line AB represents the width of the nautilus shell. Measure the length of line AB in Fig. 2.1. length of line AB in Fig. 2.1 ........................ mm The actual width of the shell is 130 mm. Calculate the magnification of the shell in Fig. 2.1. length of line AB in Fig. 2.1 magnification = actual width of the shell Give your answer to two significant figures. Space for working. ................................................................ [3] (b) Fig. 2.2 shows a fossilised nautilus shell. Fig. 2.2 Describe one visible similarity and one visible difference between the nautilus shell in Fig. 2.1 and the fossilised nautilus shell in Fig. 2.2. similarity .................................................................................................................................... ................................................................................................................................................... difference .................................................................................................................................. ................................................................................................................................................... [2] (c) A population of one species of nautilus was studied. The widths of the nautilus shells were measured and recorded. The results are shown in Table 2.1. Table 2.1 width of shell / mm number of shells 101–110 8 111–120 84 121–130 138 131–140 98 141–150 22 (i) Plot a histogram on the grid of the data in Table 2.1. [4]
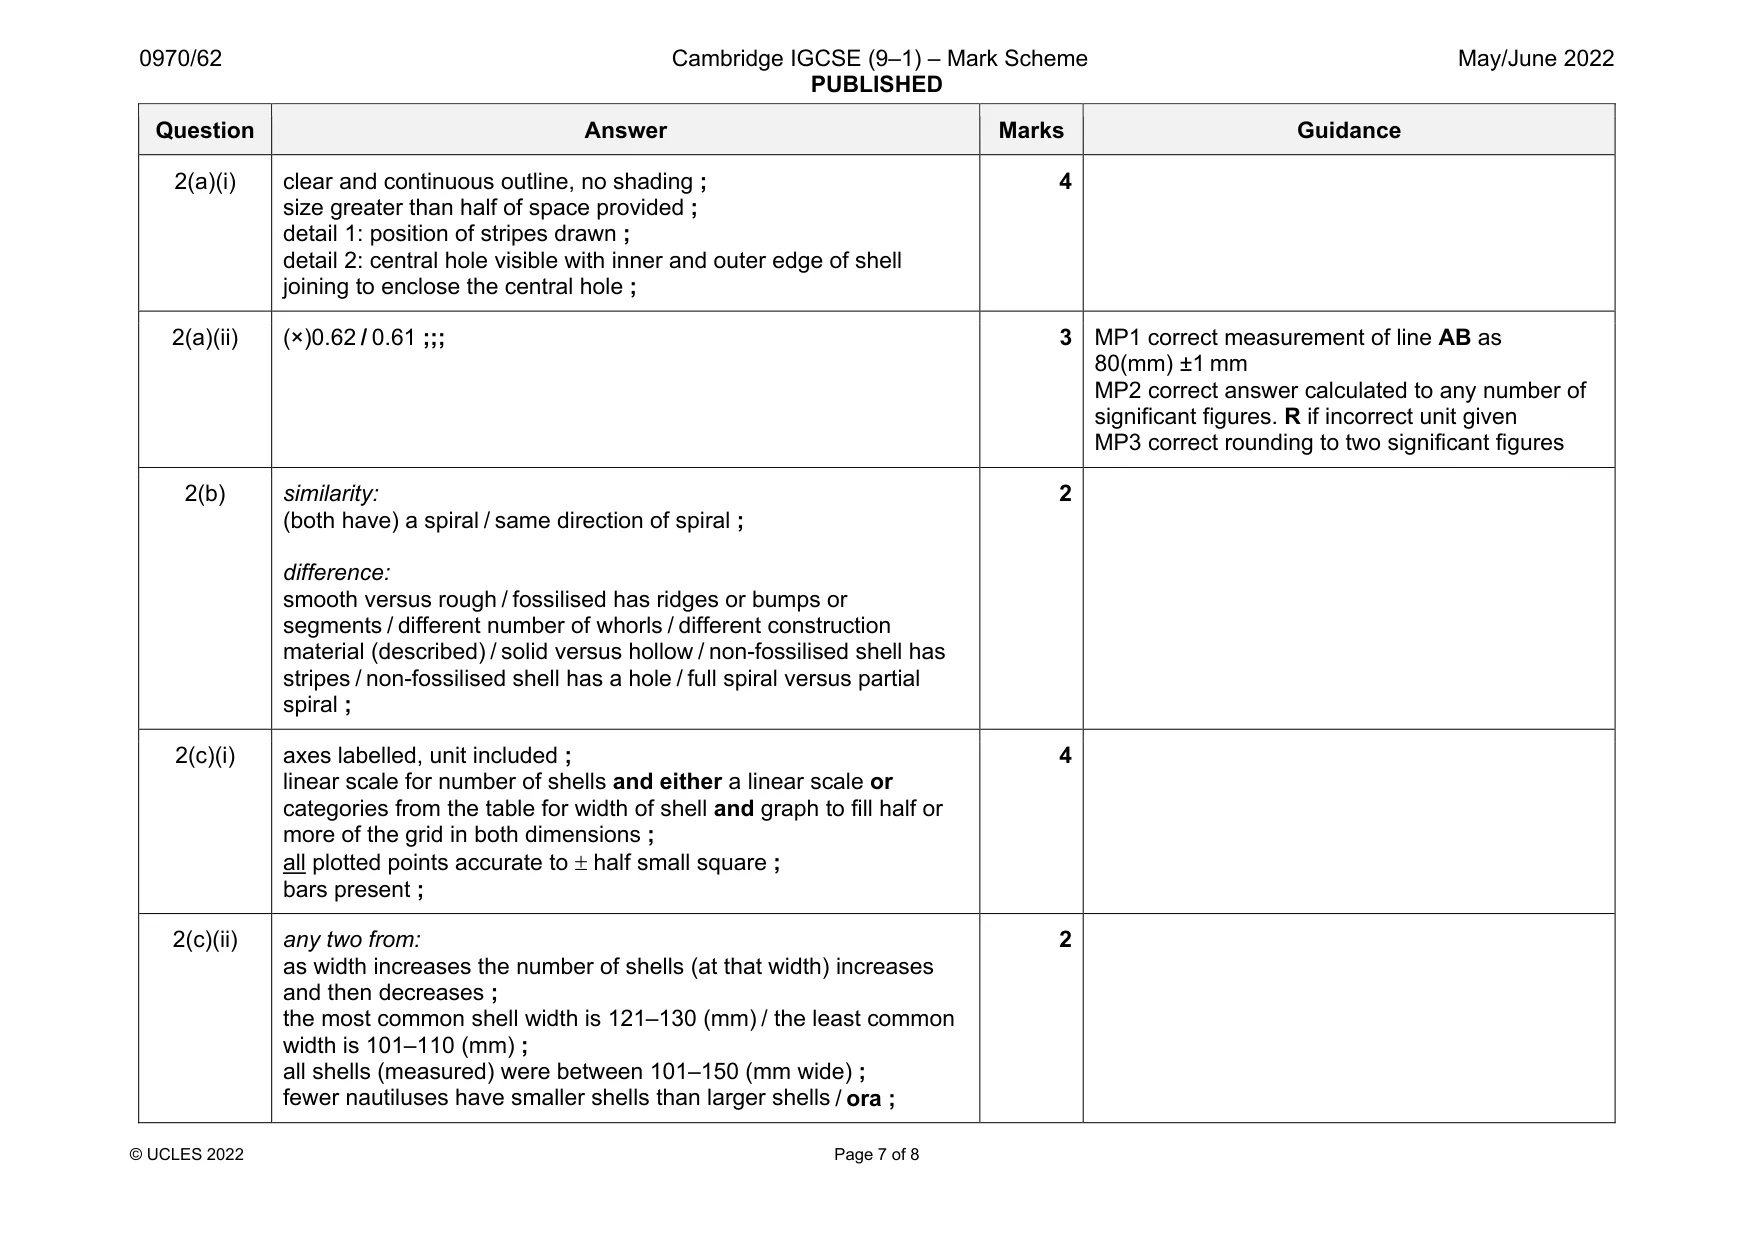
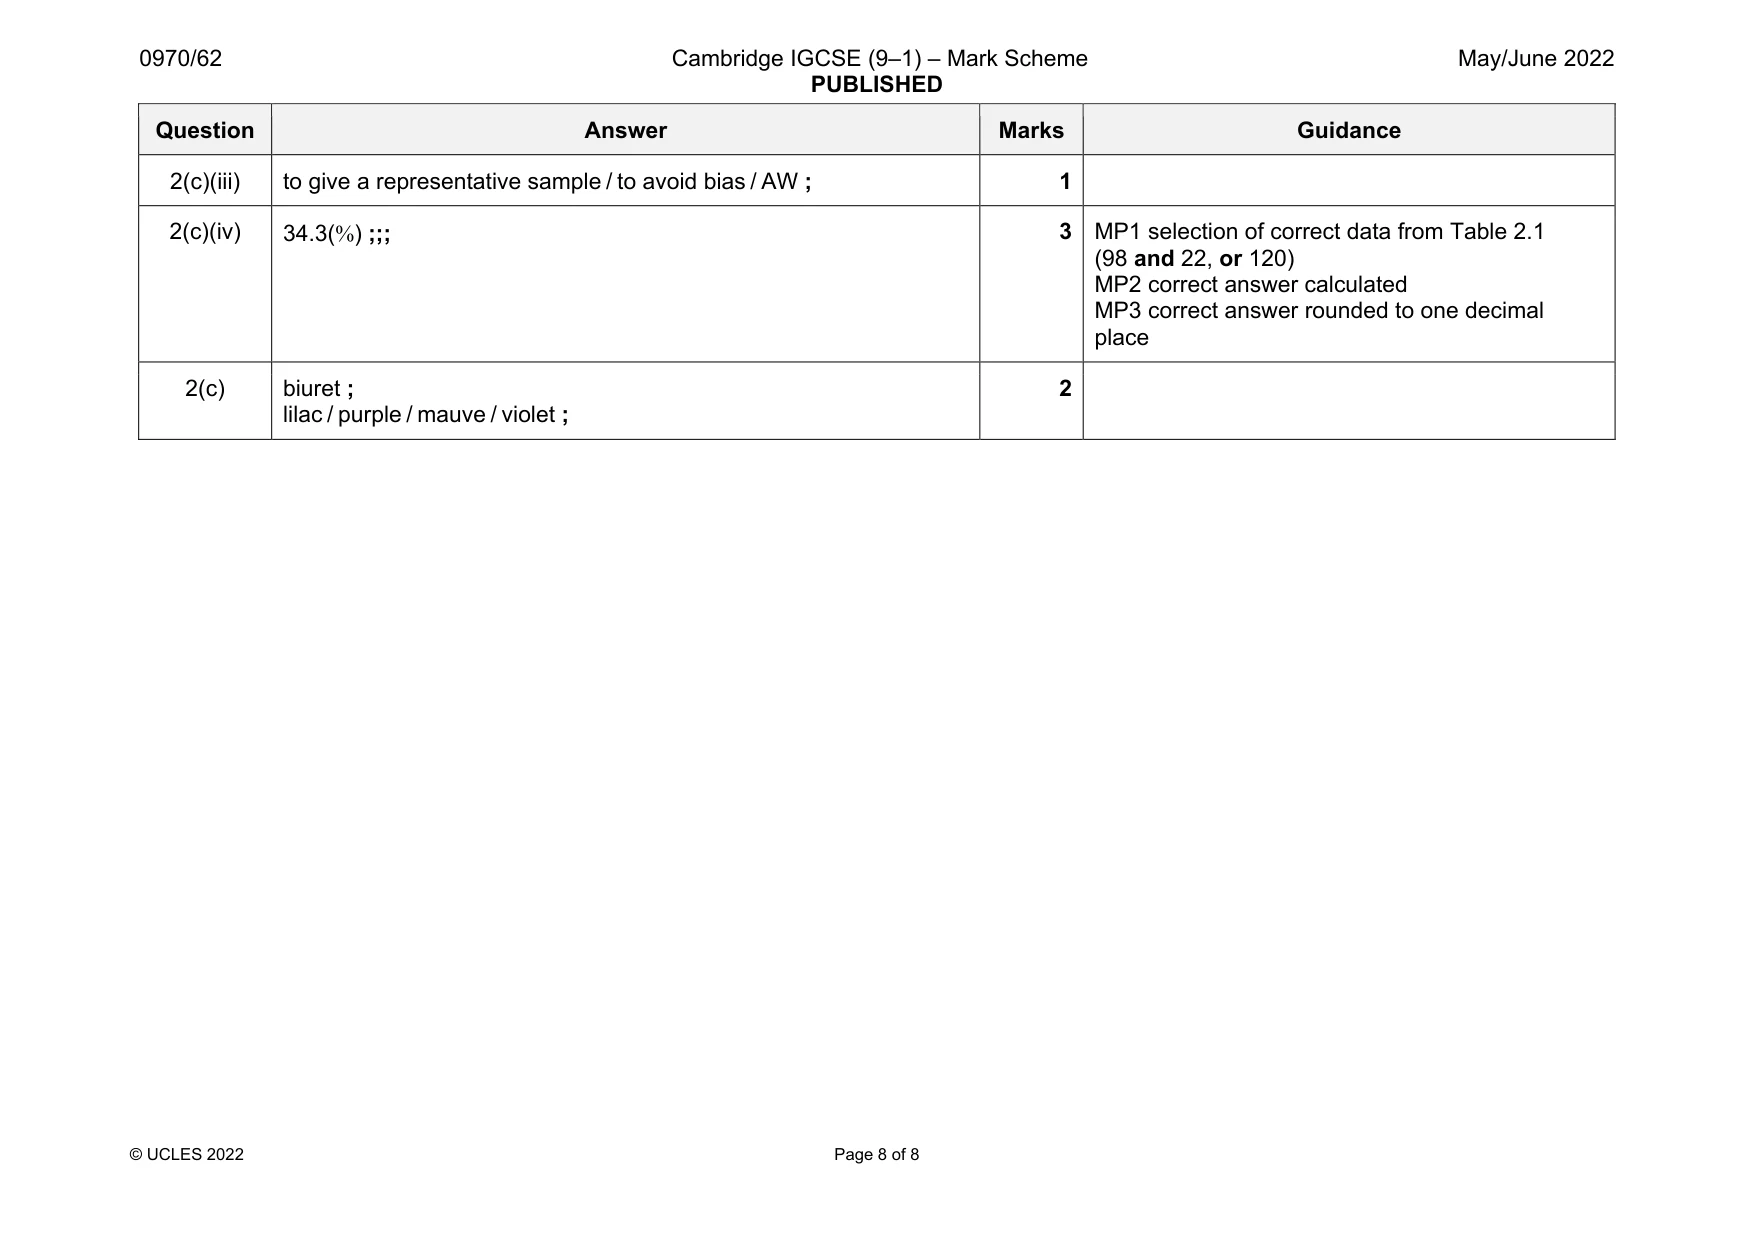
Mark scheme: 2(a)(i) clear and continuous outline, no shading ; size greater than half of space provided ; detail 1: position of stripes drawn ; detail 2: central hole visible with inner and outer edge of shell joining to enclose the central hole ; 4 2(a)(ii) (×)0.62 / 0.61 ;;; 3 MP1 correct measurement of line AB as 80(mm) ±1 mm MP2 correct answer calculated to any number of significant figures. R if incorrect unit given MP3 correct rounding to two significant figures 2(b) similarity: (both have) a spiral / same direction of spiral ; difference: smooth versus rough / fossilised has ridges or bumps or segments / different number of whorls / different construction material (described) / solid versus hollow / non-fossilised shell has stripes / non-fossilised shell has a hole / full spiral versus partial spiral ; 2 2(c)(i) axes labelled, unit included ; linear scale for number of shells and either a linear scale or categories from the table for width of shell and graph to fill half or more of the grid in both dimensions ; all plotted points accurate to half small square ; bars present ; 4 2(c)(ii) any two from: as width increases the number of shells (at that width) increases and then decreases ; the most common shell width is 121–130 (mm) / the least common width is 101–110 (mm) ; all shells (measured) were between 101–150 (mm wide) ; fewer nautiluses have smaller shells than larger shells / ora ; 2 Question Answer Marks Guidance 2(c)(iii) to give a representative sample / to avoid bias / AW ; 1 2(c)(iv) 34.3() ;;; 3 MP1 selection of correct data from Table 2.1 (98 and 22, or 120) MP2 correct answer calculated MP3 correct answer rounded to one decimal place 2(c) biuret ; lilac / purple / mauve / violet ; 2
What was in this paper
The subtopics covered by these 2 questions, and how many questions each got. Open one in a new tab to see every Cambridge question on it.
What you needed in this session
Cambridge’s own grade thresholds for 2022 May/June, Paper 6 · Variant 2. A higher threshold means an easier paper — the bar moves with how the cohort did.