Cambridge IGCSE Biology (9-1) 0970 — 2023 May/June Paper 6 · Variant 2
0970/62/M/J/23 · 2 questions · 40 marks · ≈45 min
The question paper and its mark scheme, free to read here and free to download. This is Cambridge’s own paper, exactly as it was sat.
Question paper12 pages


Mark scheme10 pages
Answers below. Sit the paper first if you are practising.
Questions as text
Q1 · Some animals live in cold places
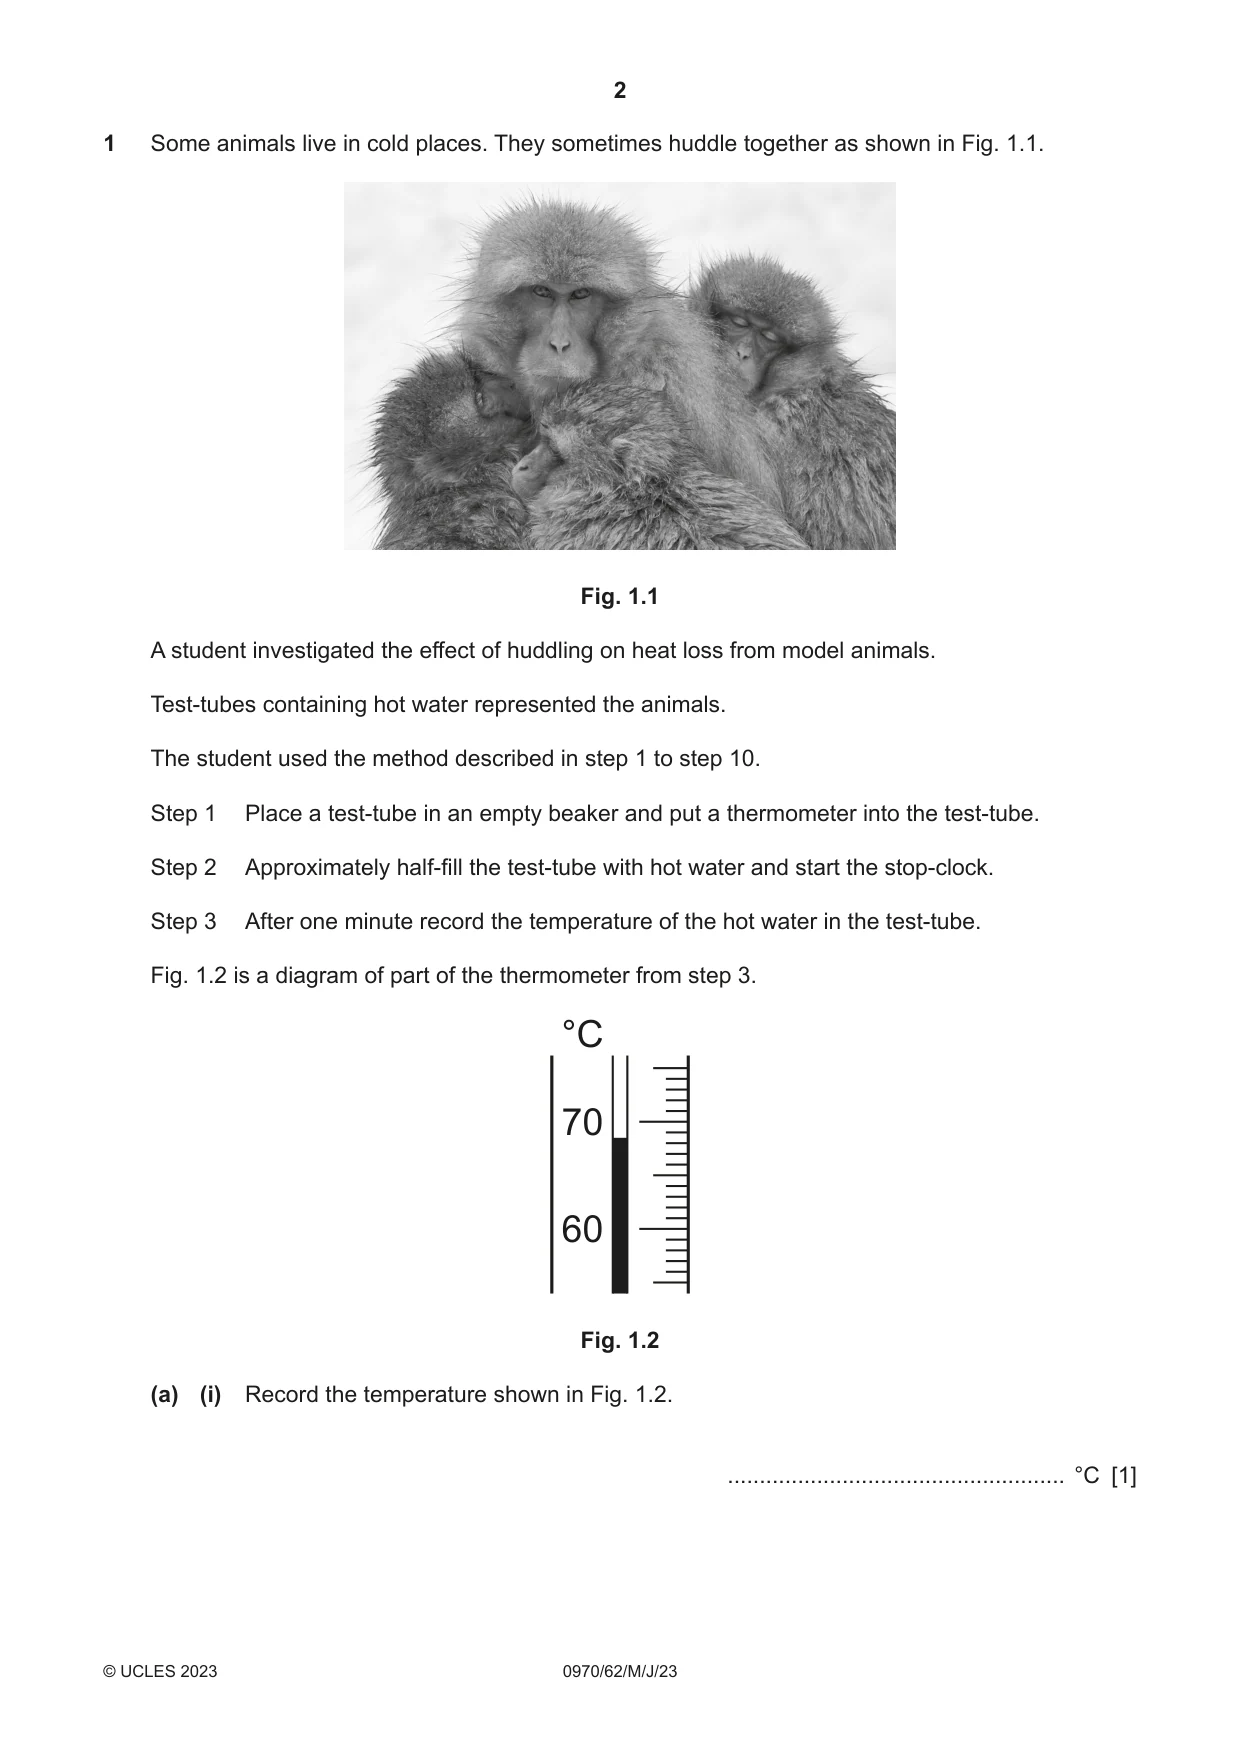
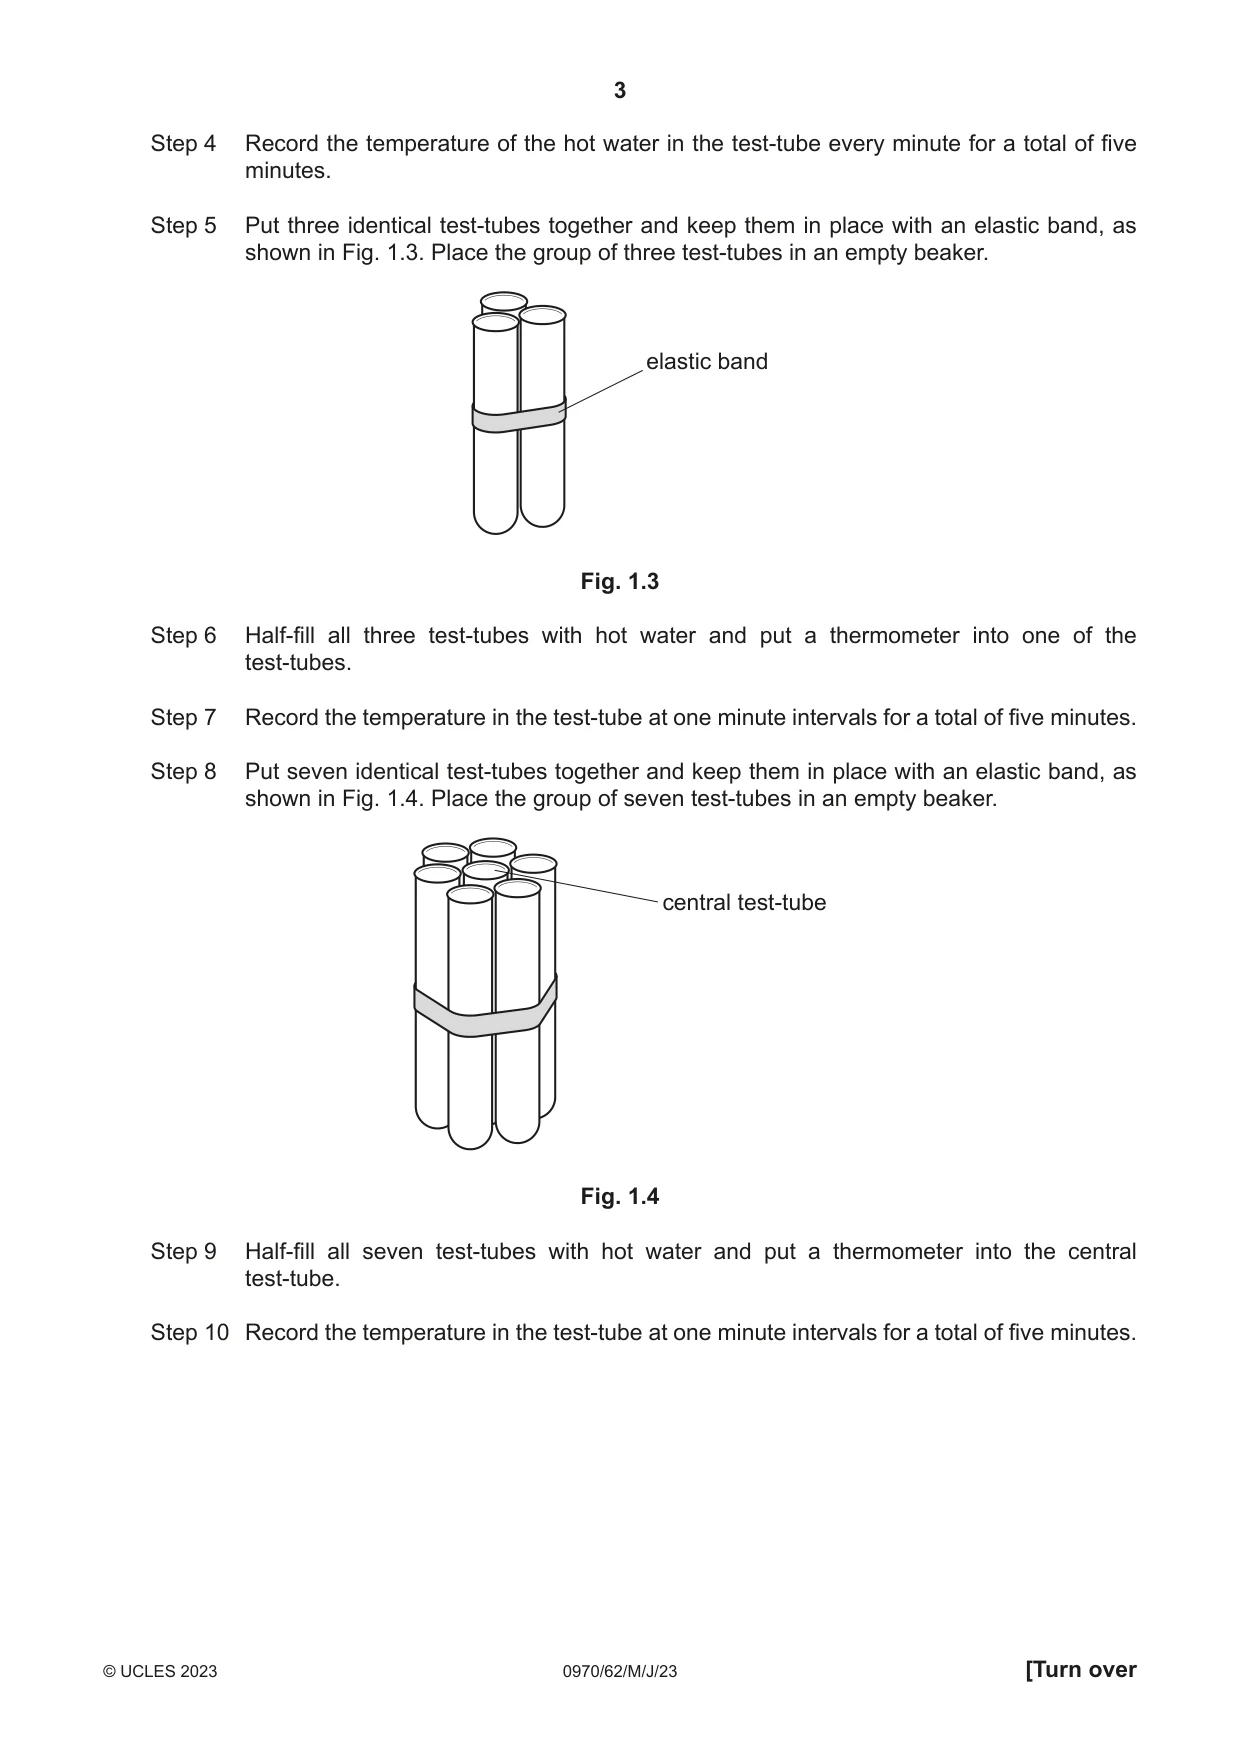
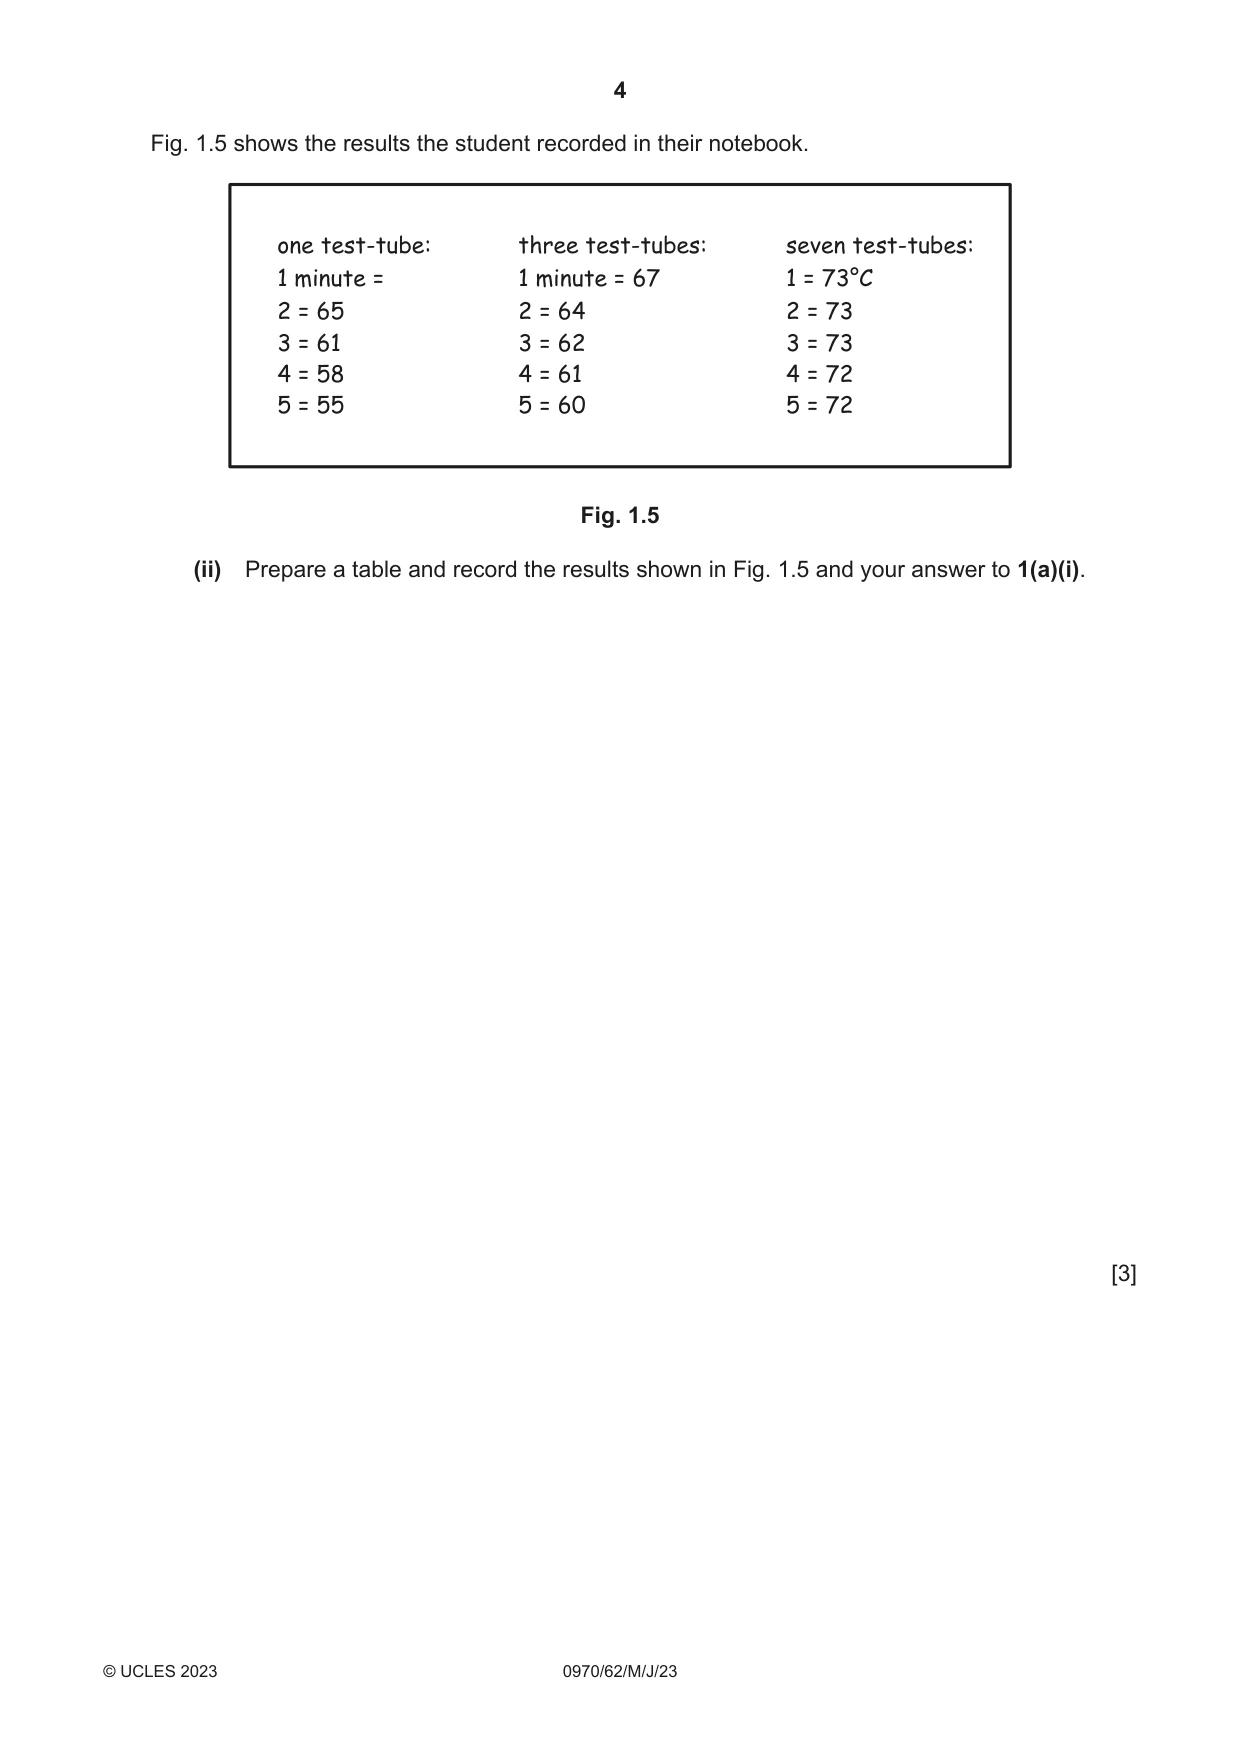
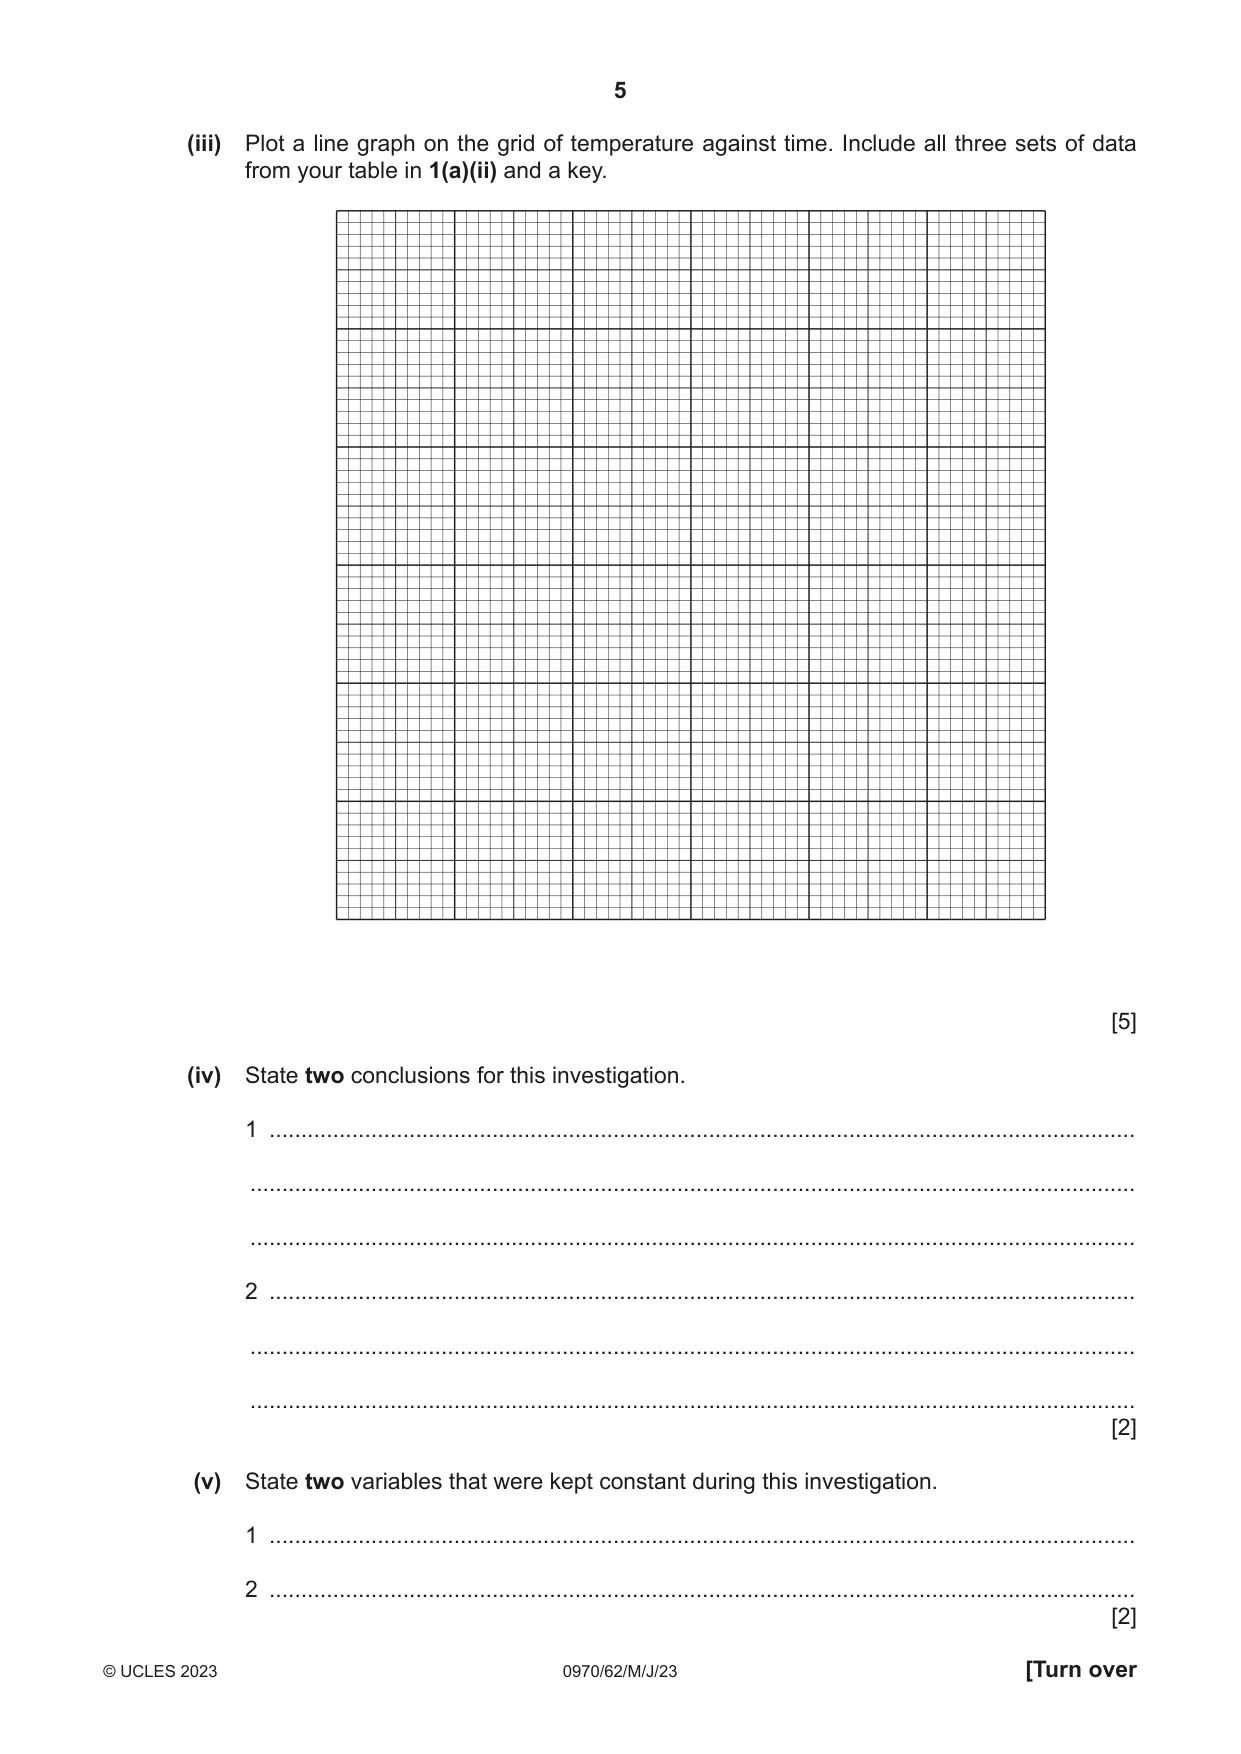
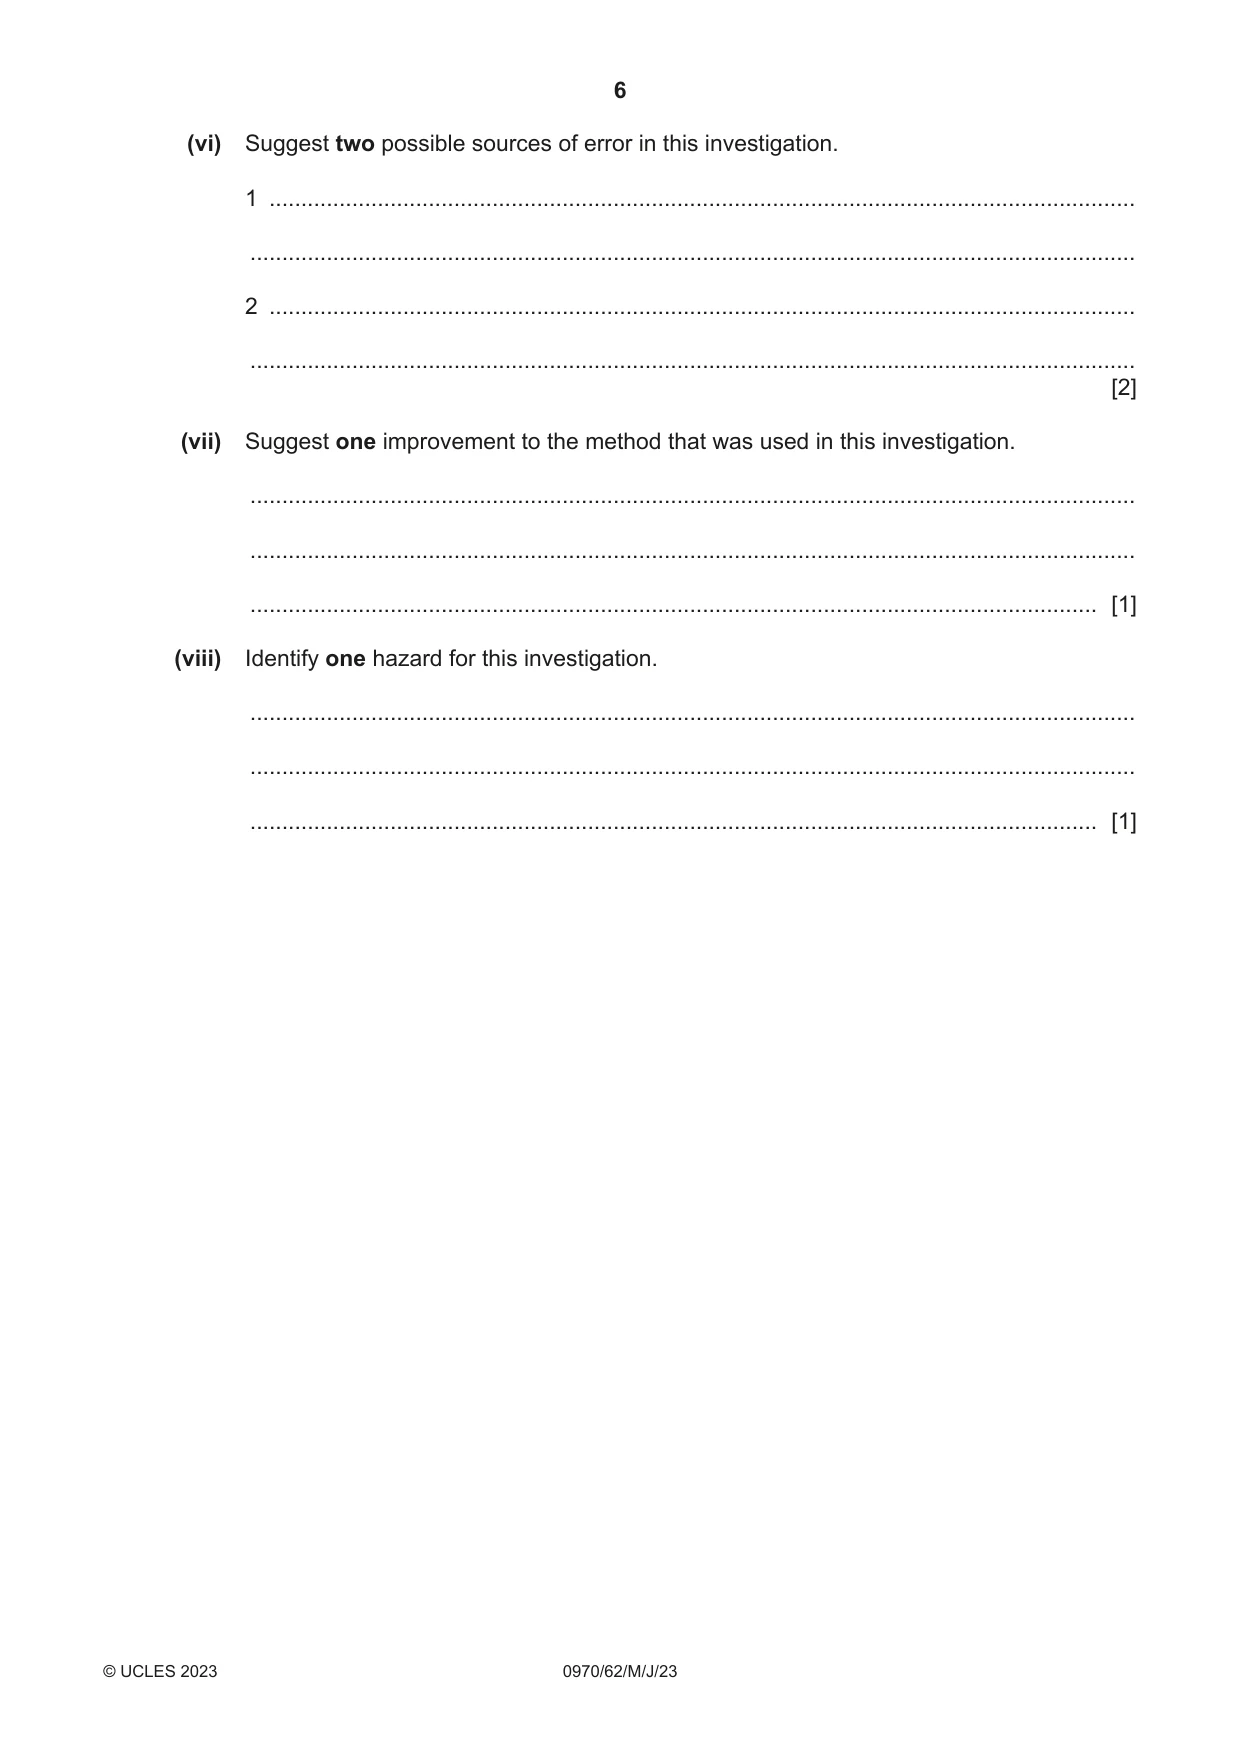
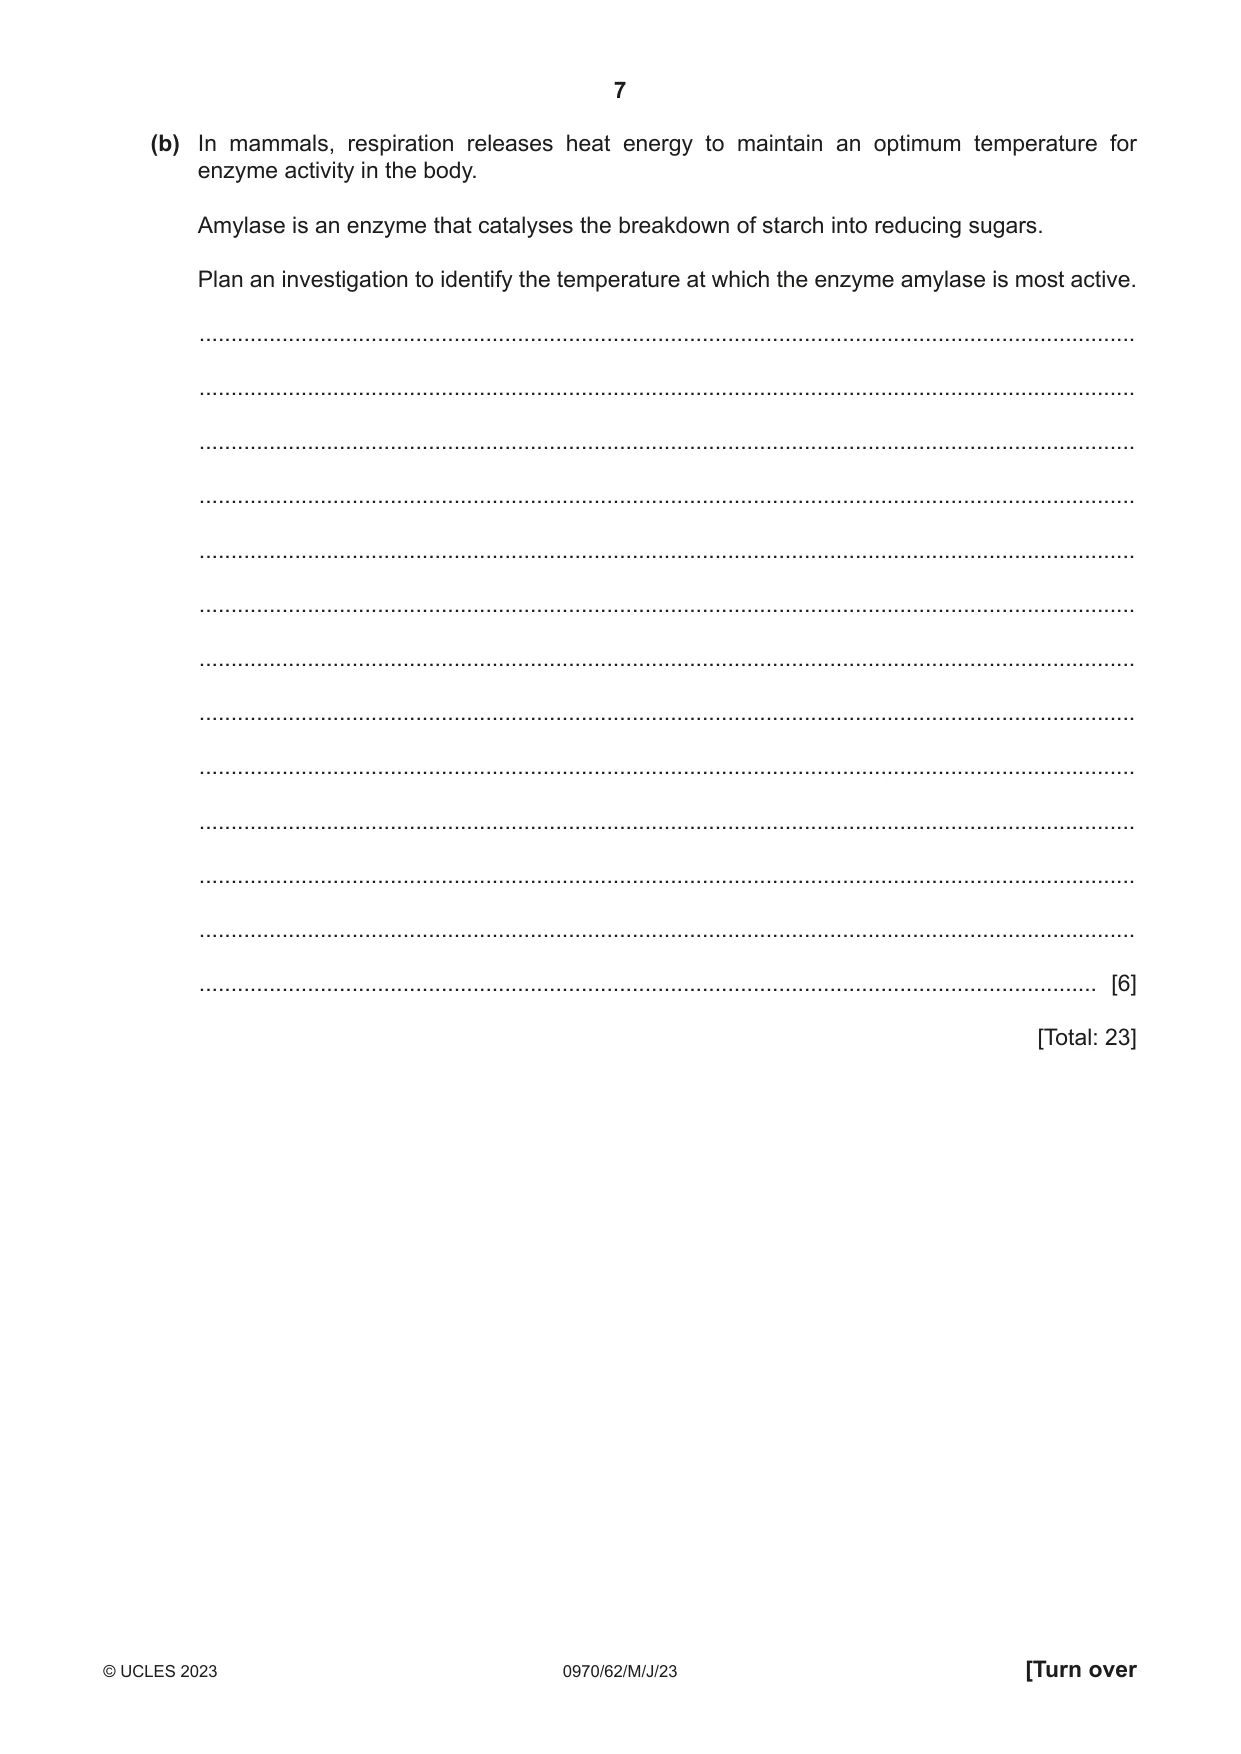
1 Some animals live in cold places. They sometimes huddle together as shown in Fig. 1.1. Fig. 1.1 A student investigated the effect of huddling on heat loss from model animals. Test-tubes containing hot water represented the animals. The student used the method described in step 1 to step 10. Step 1 Place a test-tube in an empty beaker and put a thermometer into the test-tube. Step 2 Approximately half-fill the test-tube with hot water and start the stop-clock. Step 3 After one minute record the temperature of the hot water in the test-tube. Fig. 1.2 is a diagram of part of the thermometer from step 3. °C 70 60 Fig. 1.2 (a) (i) Record the temperature shown in Fig. 1.2. ..................................................... °C [1] Step 4 Record the temperature of the hot water in the test-tube every minute for a total of five minutes. Step 5 Put three identical test-tubes together and keep them in place with an elastic band, as shown in Fig. 1.3. Place the group of three test-tubes in an empty beaker. elastic band Fig. 1.3 Step 6 Half-fill all three test-tubes with hot water and put a thermometer into one of the test-tubes. Step 7 Record the temperature in the test-tube at one minute intervals for a total of five minutes. Step 8 Put seven identical test-tubes together and keep them in place with an elastic band, as shown in Fig. 1.4. Place the group of seven test-tubes in an empty beaker. central test-tube Fig. 1.4 Step 9 Half-fill all seven test-tubes with hot water and put a thermometer into the central test-tube. Step 10 Record the temperature in the test-tube at one minute intervals for a total of five minutes. Fig. 1.5 shows the results the student recorded in their notebook. one test-tube: three test-tubes: seven test-tubes: 1 minute = 1 minute = 67 1 = 73°C 2 = 65 2 = 64 2 = 73 3 = 61 3 = 62 3 = 73 4 = 58 4 = 61 4 = 72 5 = 55 5 = 60 5 = 72 Fig. 1.5 (ii) Prepare a table and record the results shown in Fig. 1.5 and your answer to 1(a)(i). [3] (iii) Plot a line graph on the grid of temperature against time. Include all three sets of data from your table in 1(a)(ii) and a key. [5] (iv) State two conclusions for this investigation. 1 ........................................................................................................................................ ........................................................................................................................................... ........................................................................................................................................... 2 ........................................................................................................................................ ........................................................................................................................................... ........................................................................................................................................... [2] (v) State two variables that were kept constant during this investigation. 1 ........................................................................................................................................ 2 ........................................................................................................................................ [2] (vi) Suggest two possible sources of error in this investigation. 1 ........................................................................................................................................ ........................................................................................................................................... 2 ........................................................................................................................................ ........................................................................................................................................... [2] (vii) Suggest one improvement to the method that was used in this investigation. ........................................................................................................................................... ........................................................................................................................................... ..................................................................................................................................... [1] (viii) Identify one hazard for this investigation. ........................................................................................................................................... ........................................................................................................................................... ..................................................................................................................................... [1] (b) In mammals, respiration releases heat energy to maintain an optimum temperature for enzyme activity in the body. Amylase is an enzyme that catalyses the breakdown of starch into reducing sugars. Plan an investigation to identify the temperature at which the enzyme amylase is most active. ................................................................................................................................................... ................................................................................................................................................... ................................................................................................................................................... ................................................................................................................................................... ................................................................................................................................................... ................................................................................................................................................... ................................................................................................................................................... ................................................................................................................................................... ................................................................................................................................................... ................................................................................................................................................... ................................................................................................................................................... ................................................................................................................................................... ............................................................................................................................................. [6] [Total: 23]
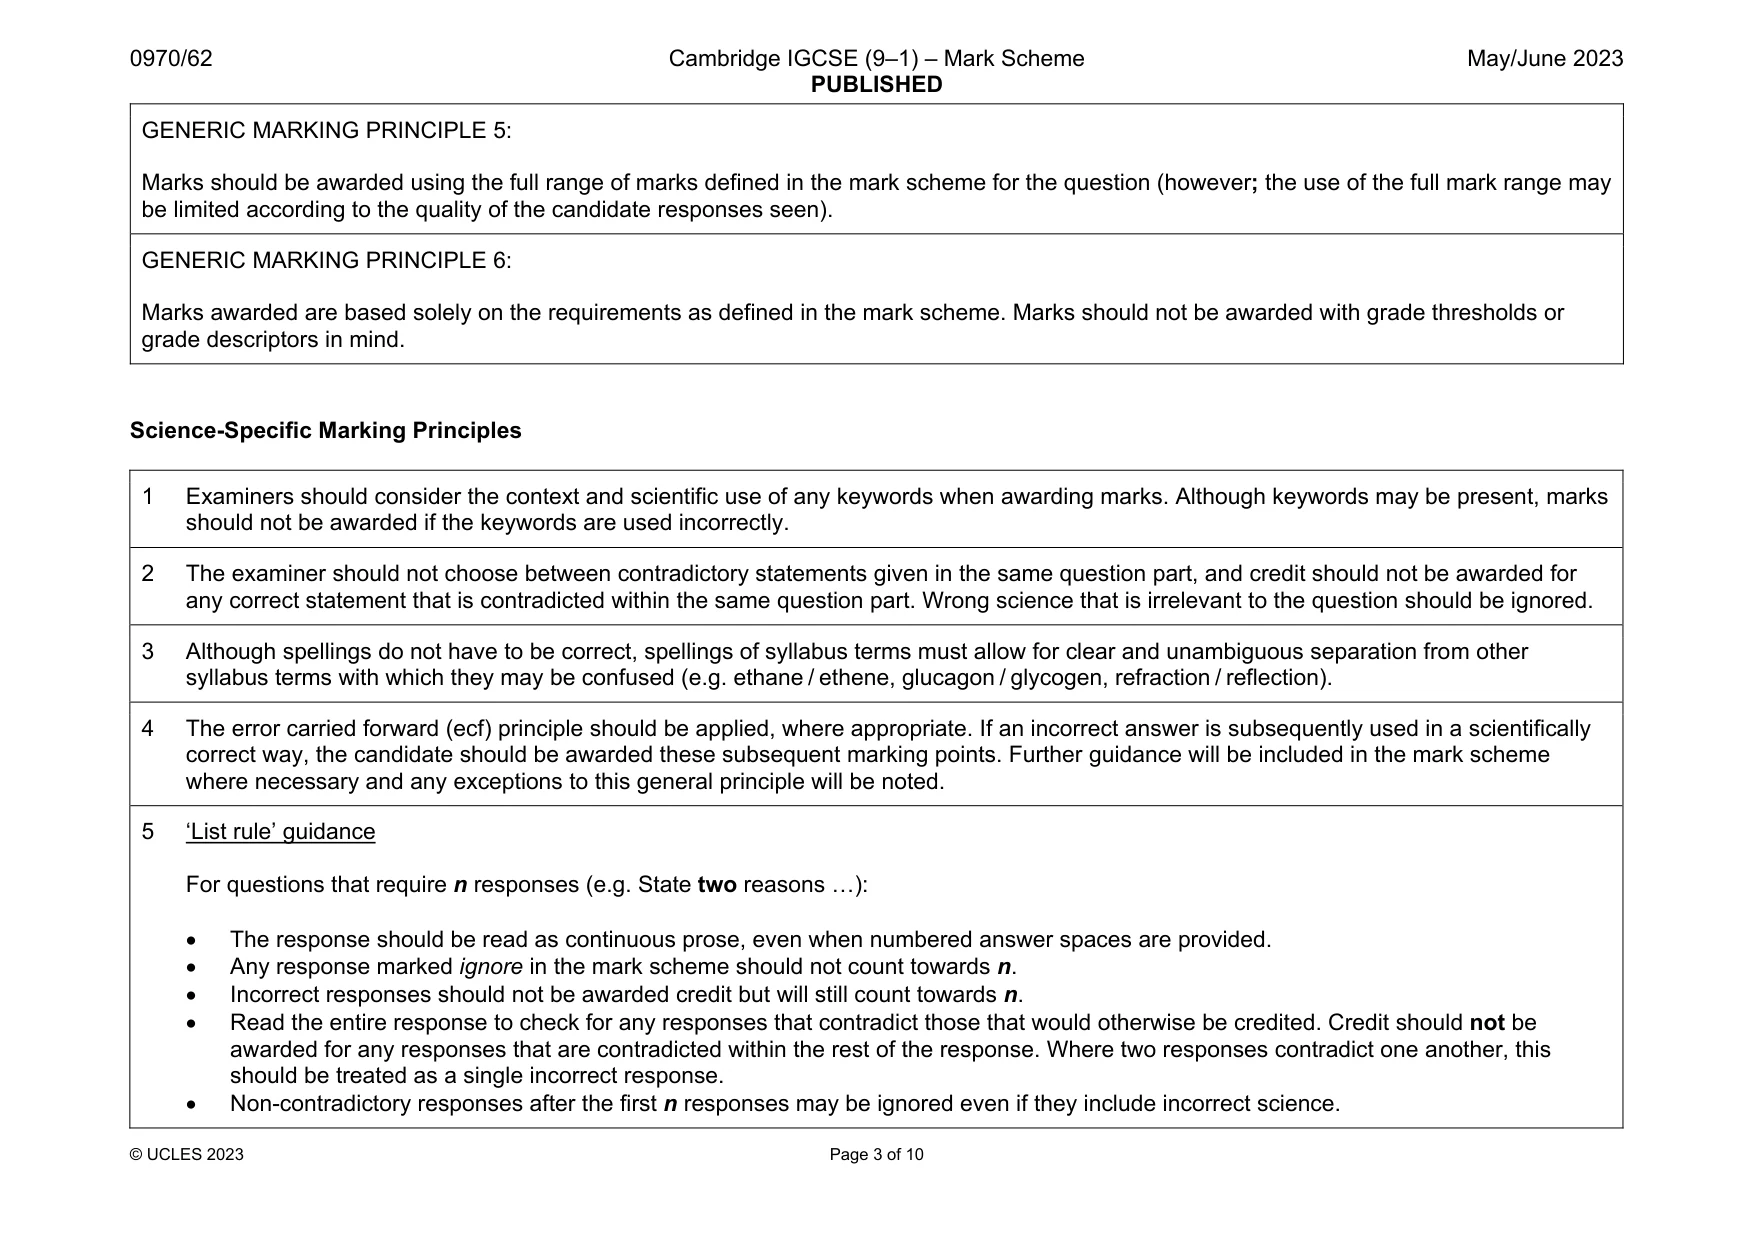
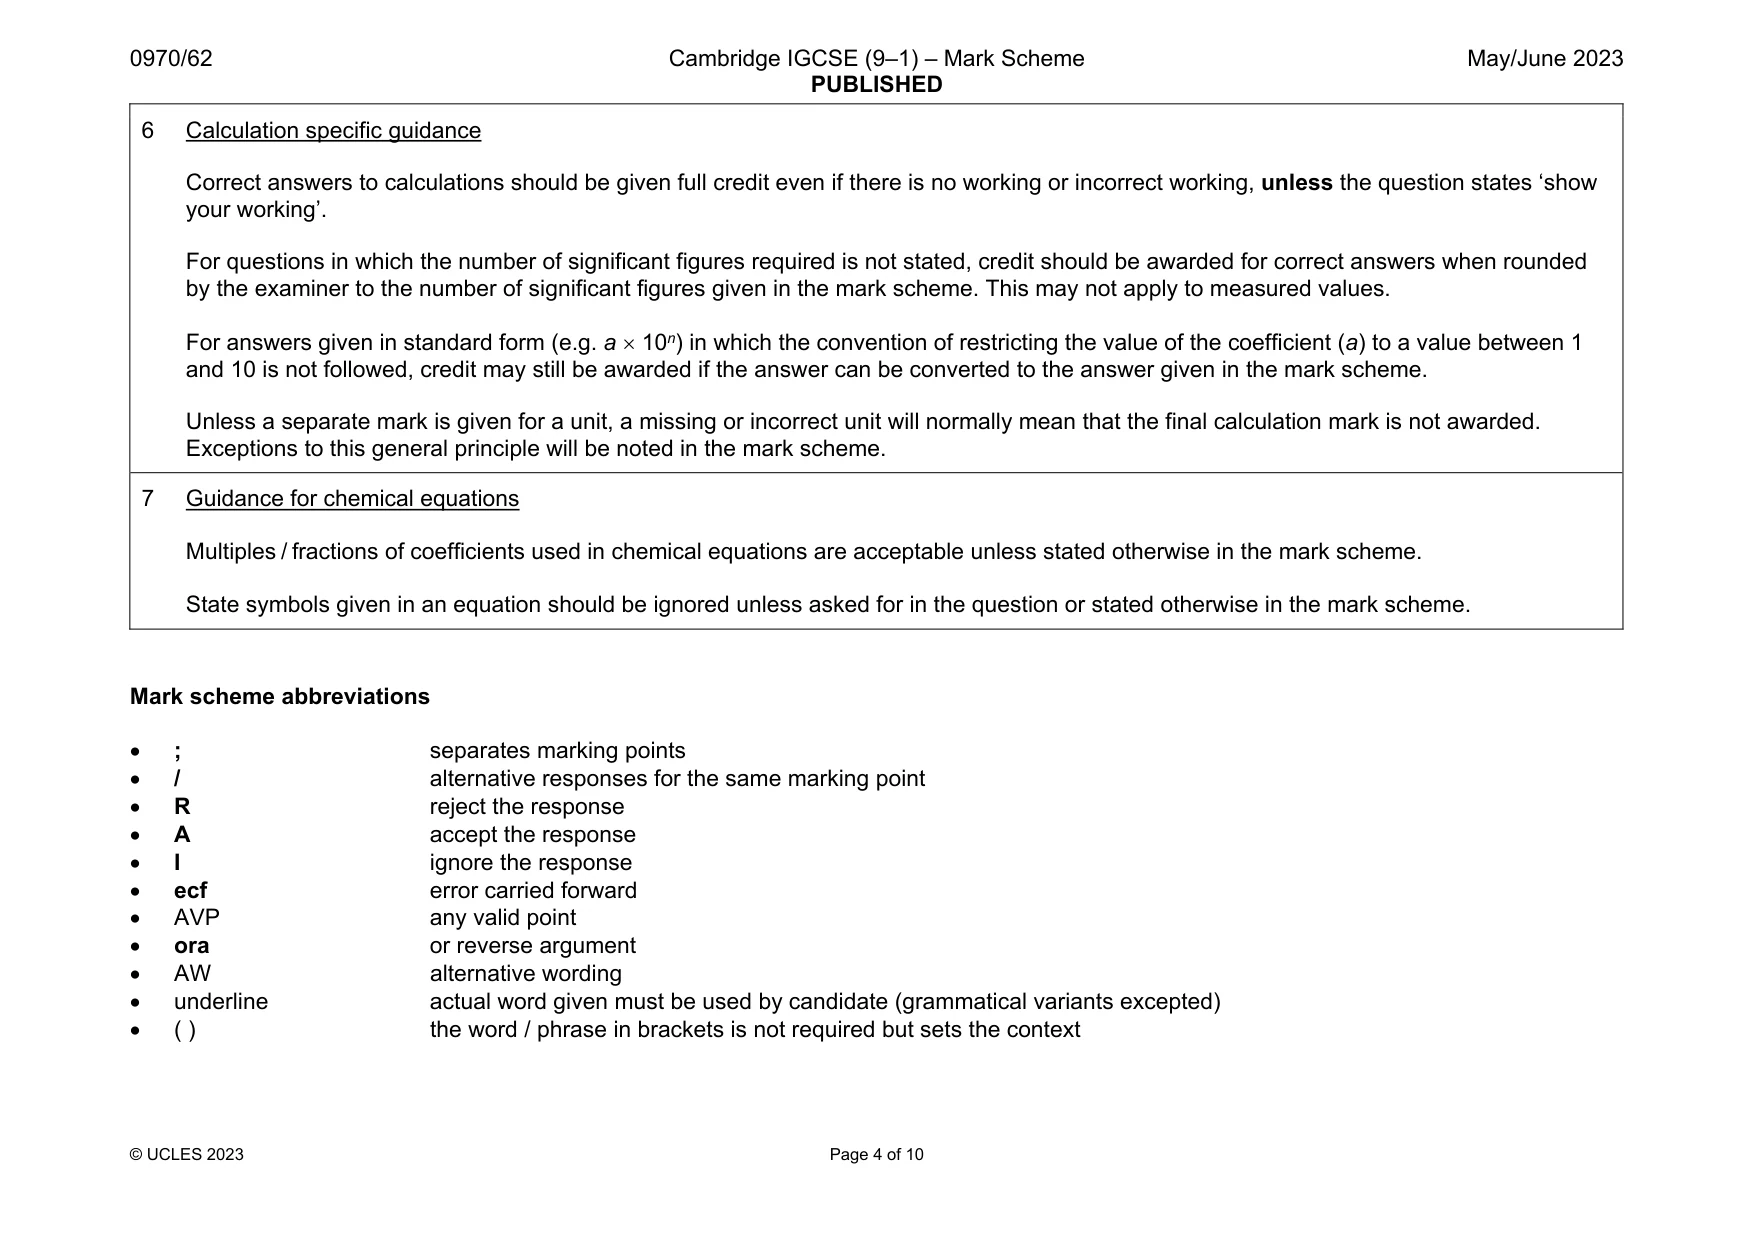
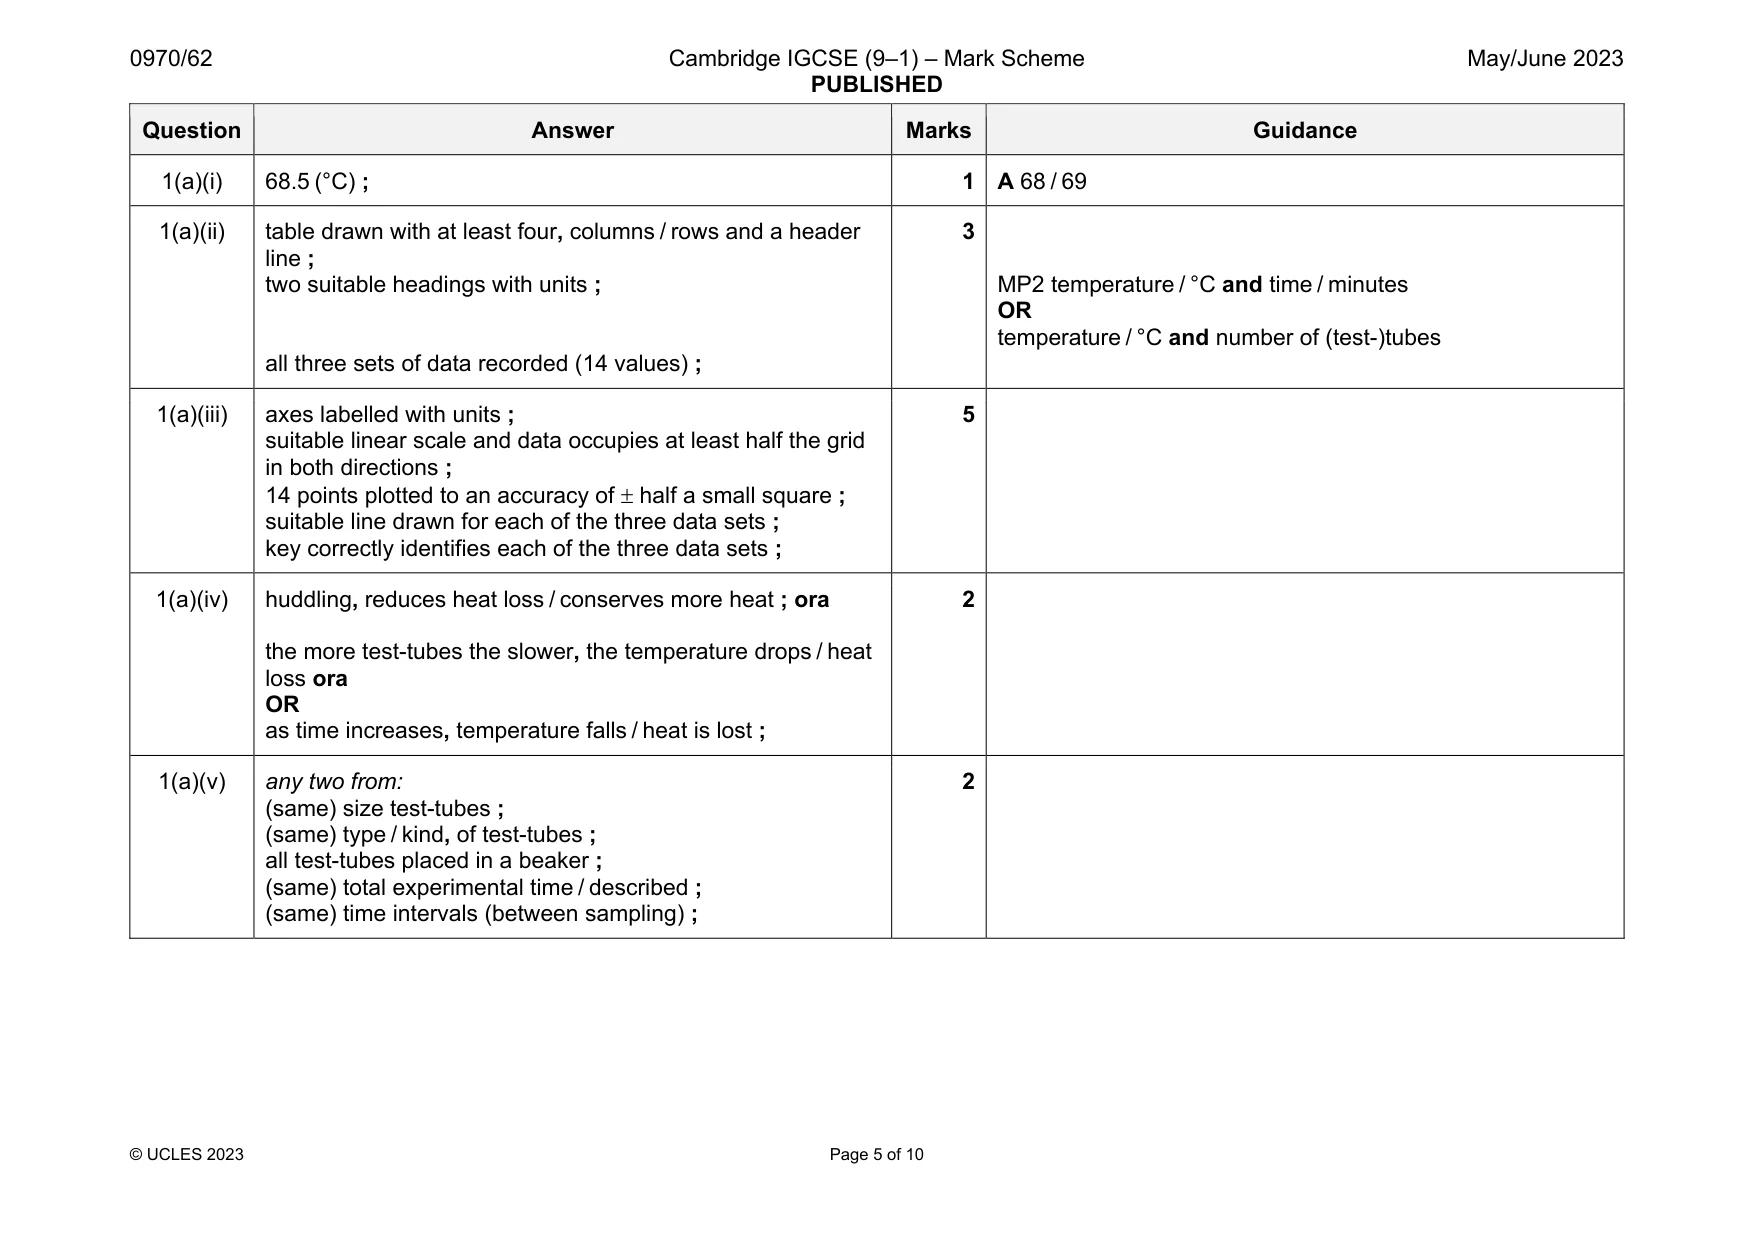
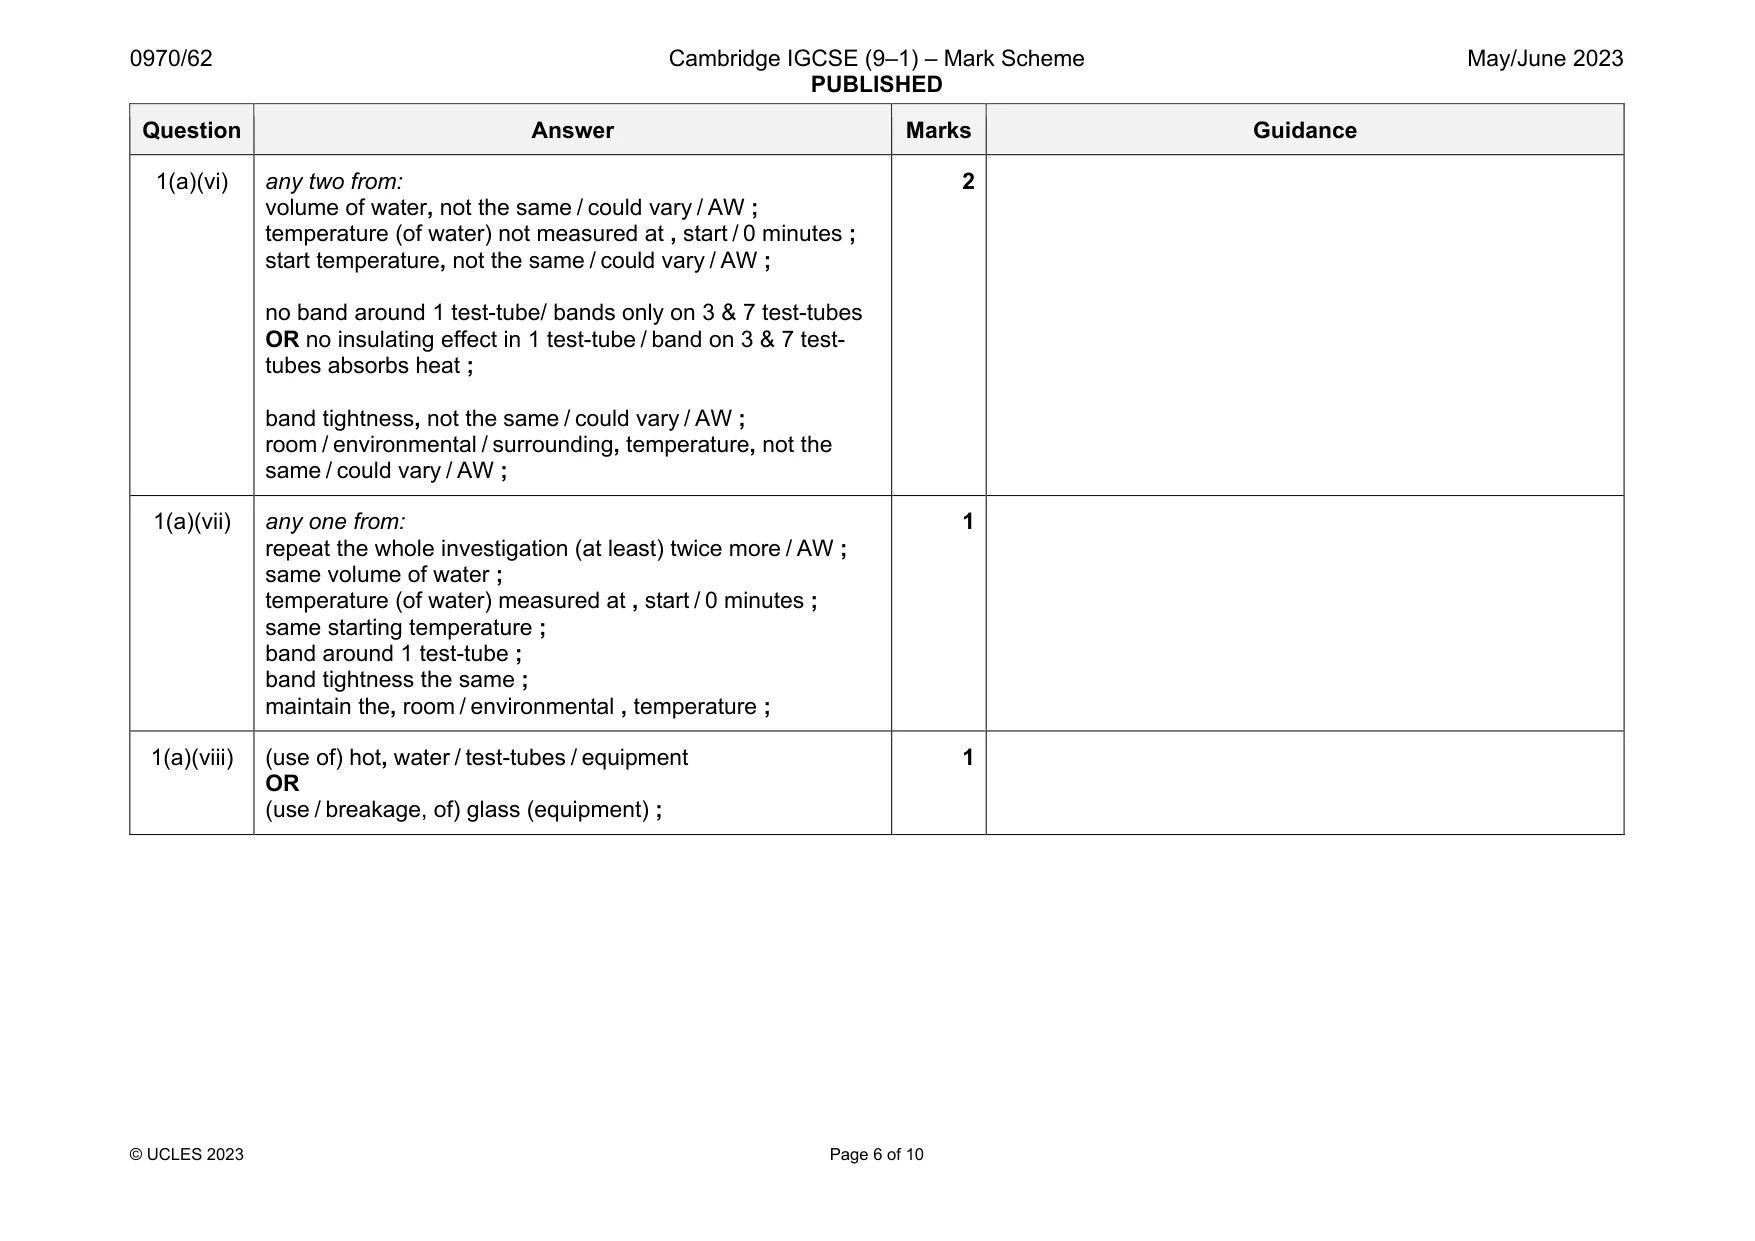
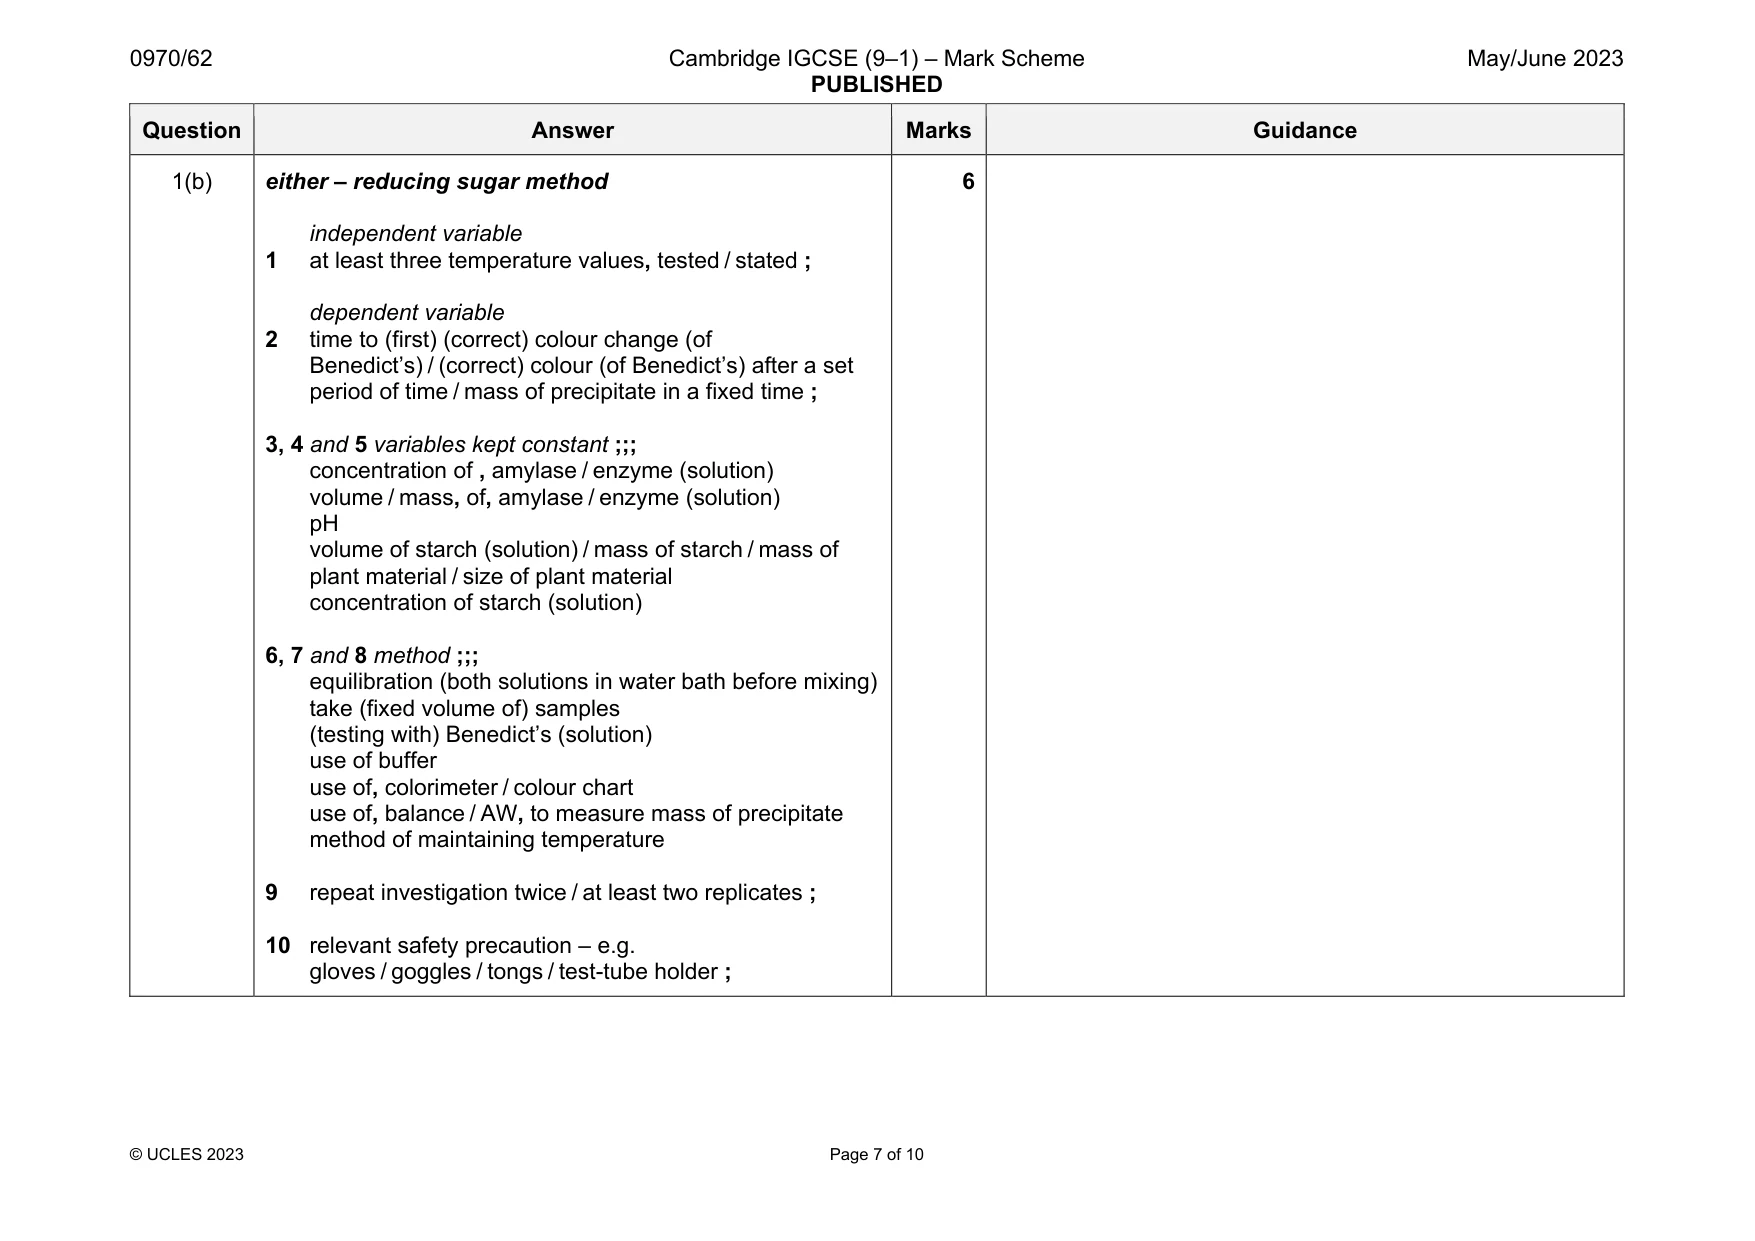
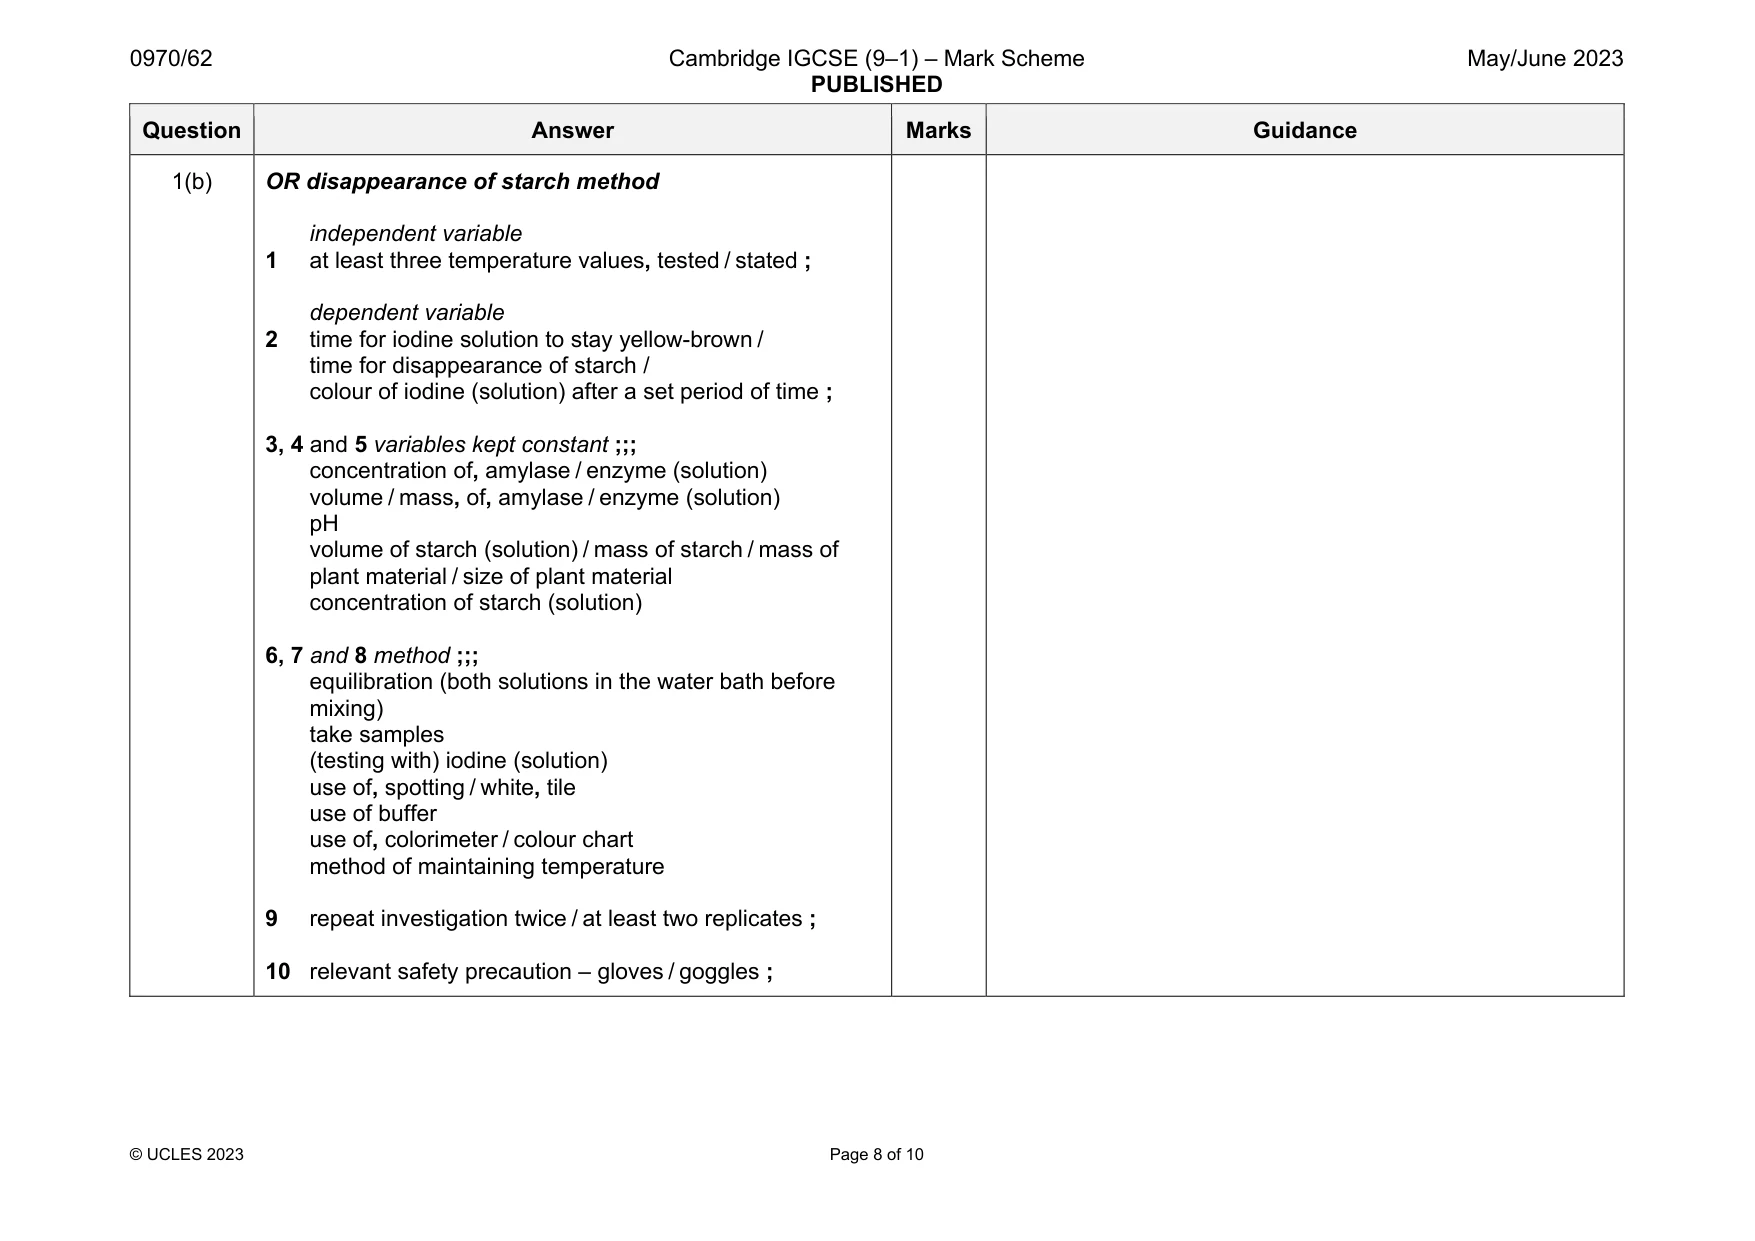
Mark scheme: 1(a)(i) 68.5 (°C) ; 1 A 68 / 69 1(a)(ii) table drawn with at least four, columns / rows and a header line ; two suitable headings with units ; all three sets of data recorded (14 values) ; 3 MP2 temperature / °C and time / minutes OR temperature / °C and number of (test-)tubes 1(a)(iii) axes labelled with units ; suitable linear scale and data occupies at least half the grid in both directions ; 14 points plotted to an accuracy of half a small square ; suitable line drawn for each of the three data sets ; key correctly identifies each of the three data sets ; 5 1(a)(iv) huddling, reduces heat loss / conserves more heat ; ora the more test-tubes the slower, the temperature drops / heat loss ora OR as time increases, temperature falls / heat is lost ; 2 1(a)(v) any two from: (same) size test-tubes ; (same) type / kind, of test-tubes ; all test-tubes placed in a beaker ; (same) total experimental time / described ; (same) time intervals (between sampling) ; 2 Question Answer Marks Guidance 1(a)(vi) any two from: volume of water, not the same / could vary / AW ; temperature (of water) not measured at , start / 0 minutes ; start temperature, not the same / could vary / AW ; no band around 1 test-tube/ bands only on 3 & 7 test-tubes OR no insulating effect in 1 test-tube / band on 3 & 7 test- tubes absorbs heat ; band tightness, not the same / could vary / AW ; room / environmental / surrounding, temperature, not the same / could vary / AW ; 2 1(a)(vii) any one from: repeat the whole investigation (at least) twice more / AW ; same volume of water ; temperature (of water) measured at , start / 0 minutes ; same starting temperature ; band around 1 test-tube ; band tightness the same ; maintain the, room / environmental , temperature ; 1 1(a)(viii) (use of) hot, water / test-tubes / equipment OR (use / breakage, of) glass (equipment) ; 1 Question Answer Marks Guidance 1(b) either – reducing sugar method independent variable 1 at least three temperature values, tested / stated ; dependent variable 2 time to (first) (correct) colour change (of Benedict’s) / (correct) colour (of Benedict’s) after a set period of time / mass of precipitate in a fixed time ; 3, 4 and 5 variables kept constant ;;; concentration of , amylase / enzyme (solution) volume / mass, of, amylase / enzyme (solution) pH volume of starch (solution) / mass of starch / mass of plant material / size of plant material concentration of starch (solution) 6, 7 and 8 method ;;; equilibration (both solutions in water bath before mixing) take (fixed volume of) samples (testing with) Benedict’s (solution) use of buffer use of, colorimeter / colour chart use of, balance / AW, to measure mass of precipitate method of maintaining temperature 9 repeat investigation twice / at least two replicates ; 10 relevant safety precaution – e.g. gloves / goggles / tongs / test-tube holder ; 6 Question Answer Marks Guidance 1(b) OR disappearance of starch method independent variable 1 at least three temperature values, tested / stated ; dependent variable 2 time for iodine solution to stay yellow-brown / time for disappearance of starch / colour of iodine (solution) after a set period of time ; 3, 4 and 5 variables kept constant ;;; concentration of, amylase / enzyme (solution) volume / mass, of, amylase / enzyme (solution) pH volume of starch (solution) / mass of starch / mass of plant material / size of plant material concentration of starch (solution) 6, 7 and 8 method ;;; equilibration (both solutions in the water bath before mixing) take samples (testing with) iodine (solution) use of, spotting / white, tile use of buffer use of, colorimeter / colour chart method of maintaining temperature 9 repeat investigation twice / at least two replicates ; 10 relevant safety precaution – gloves / goggles ;
Q2 · Some plants lose their leaves in the winter and grow new leaves in the spring
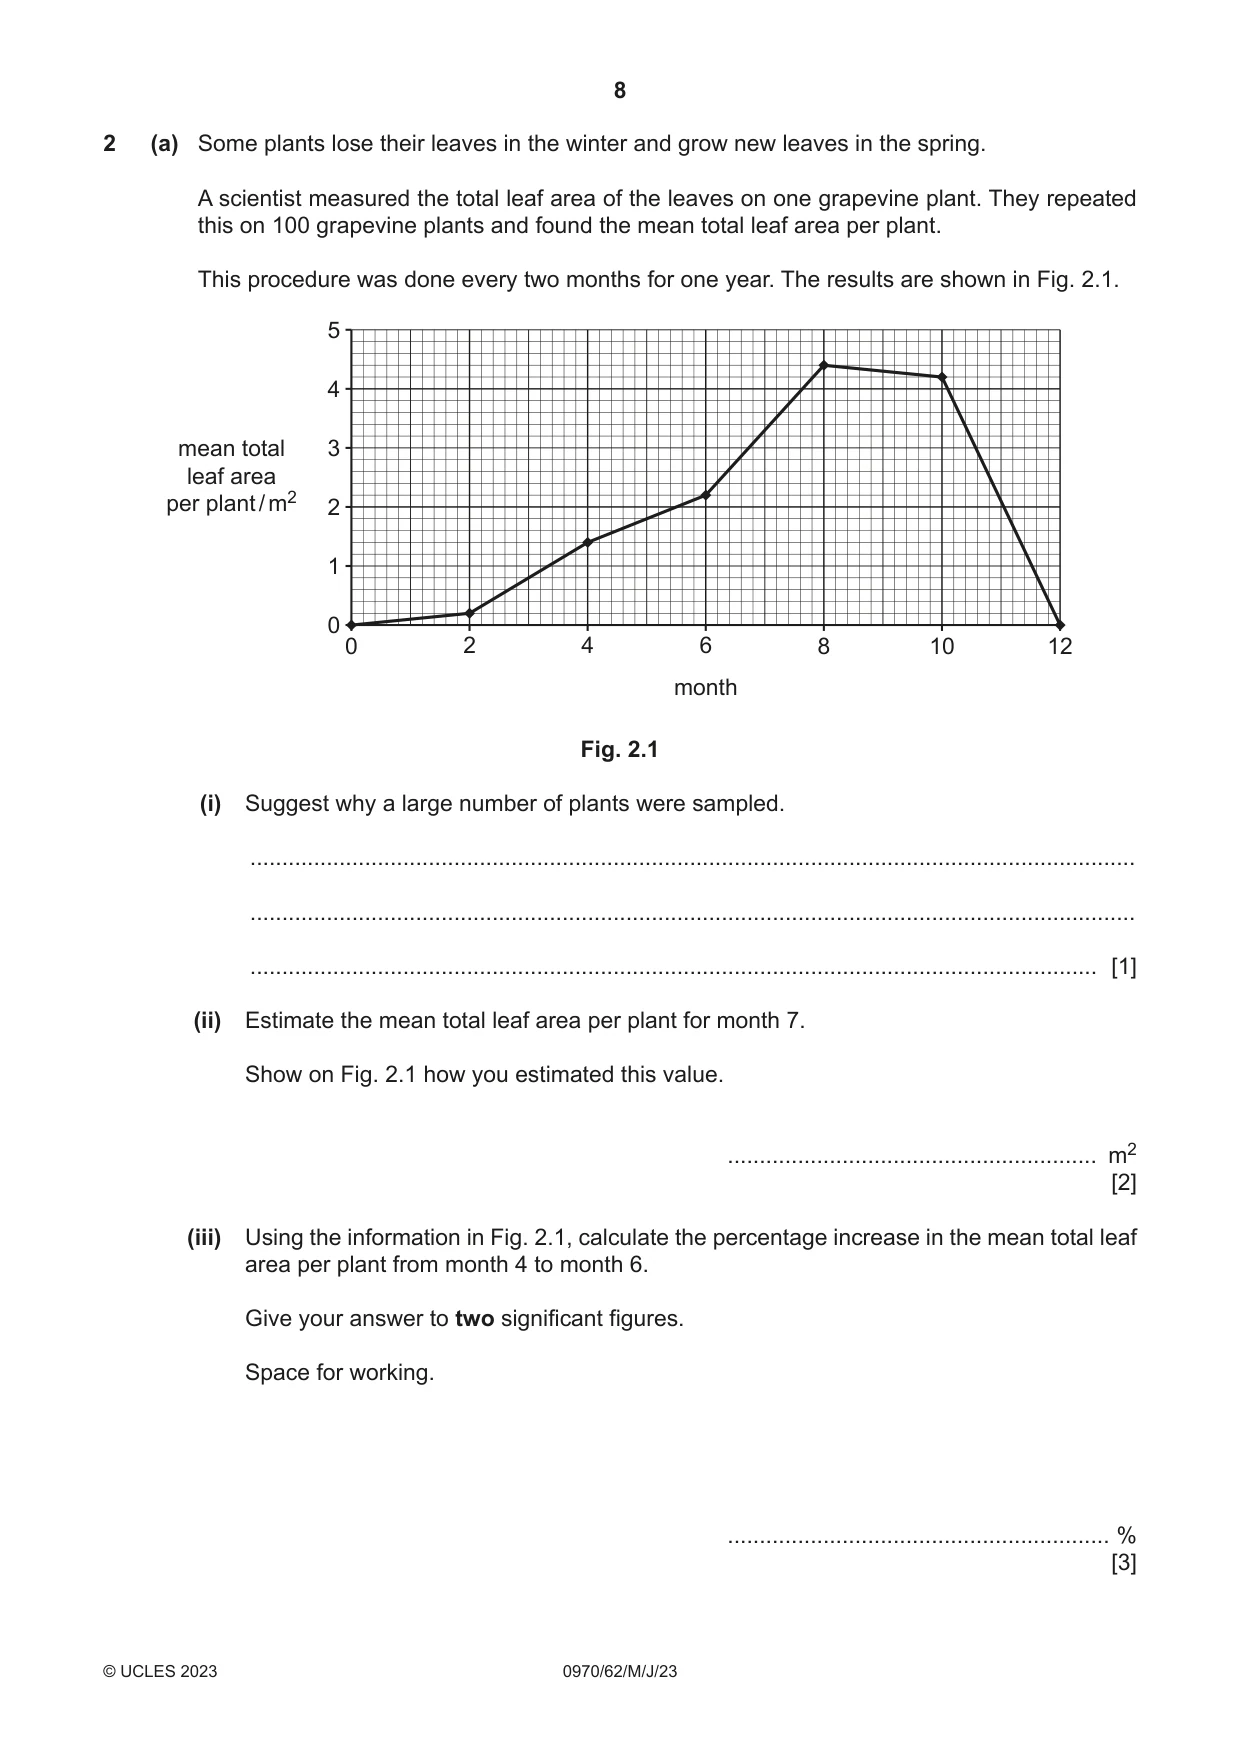
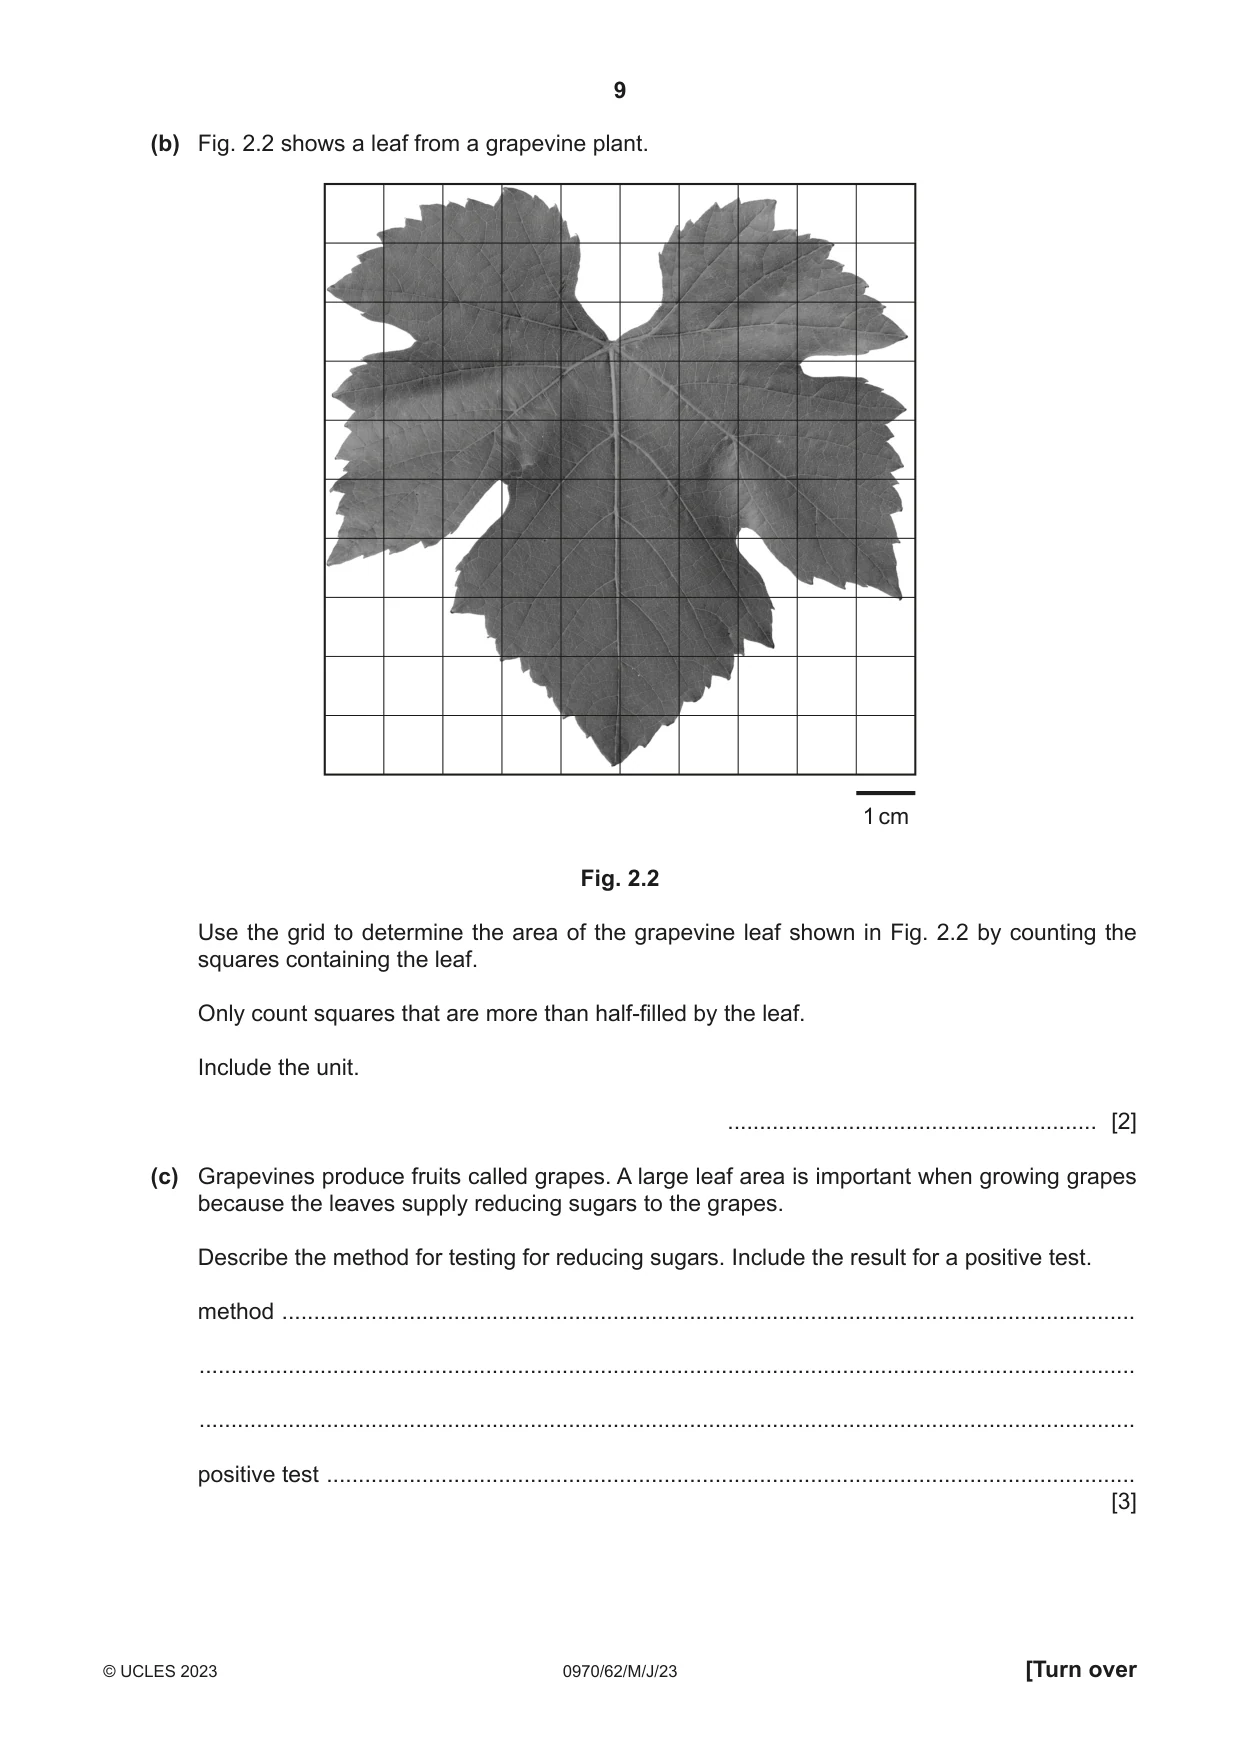
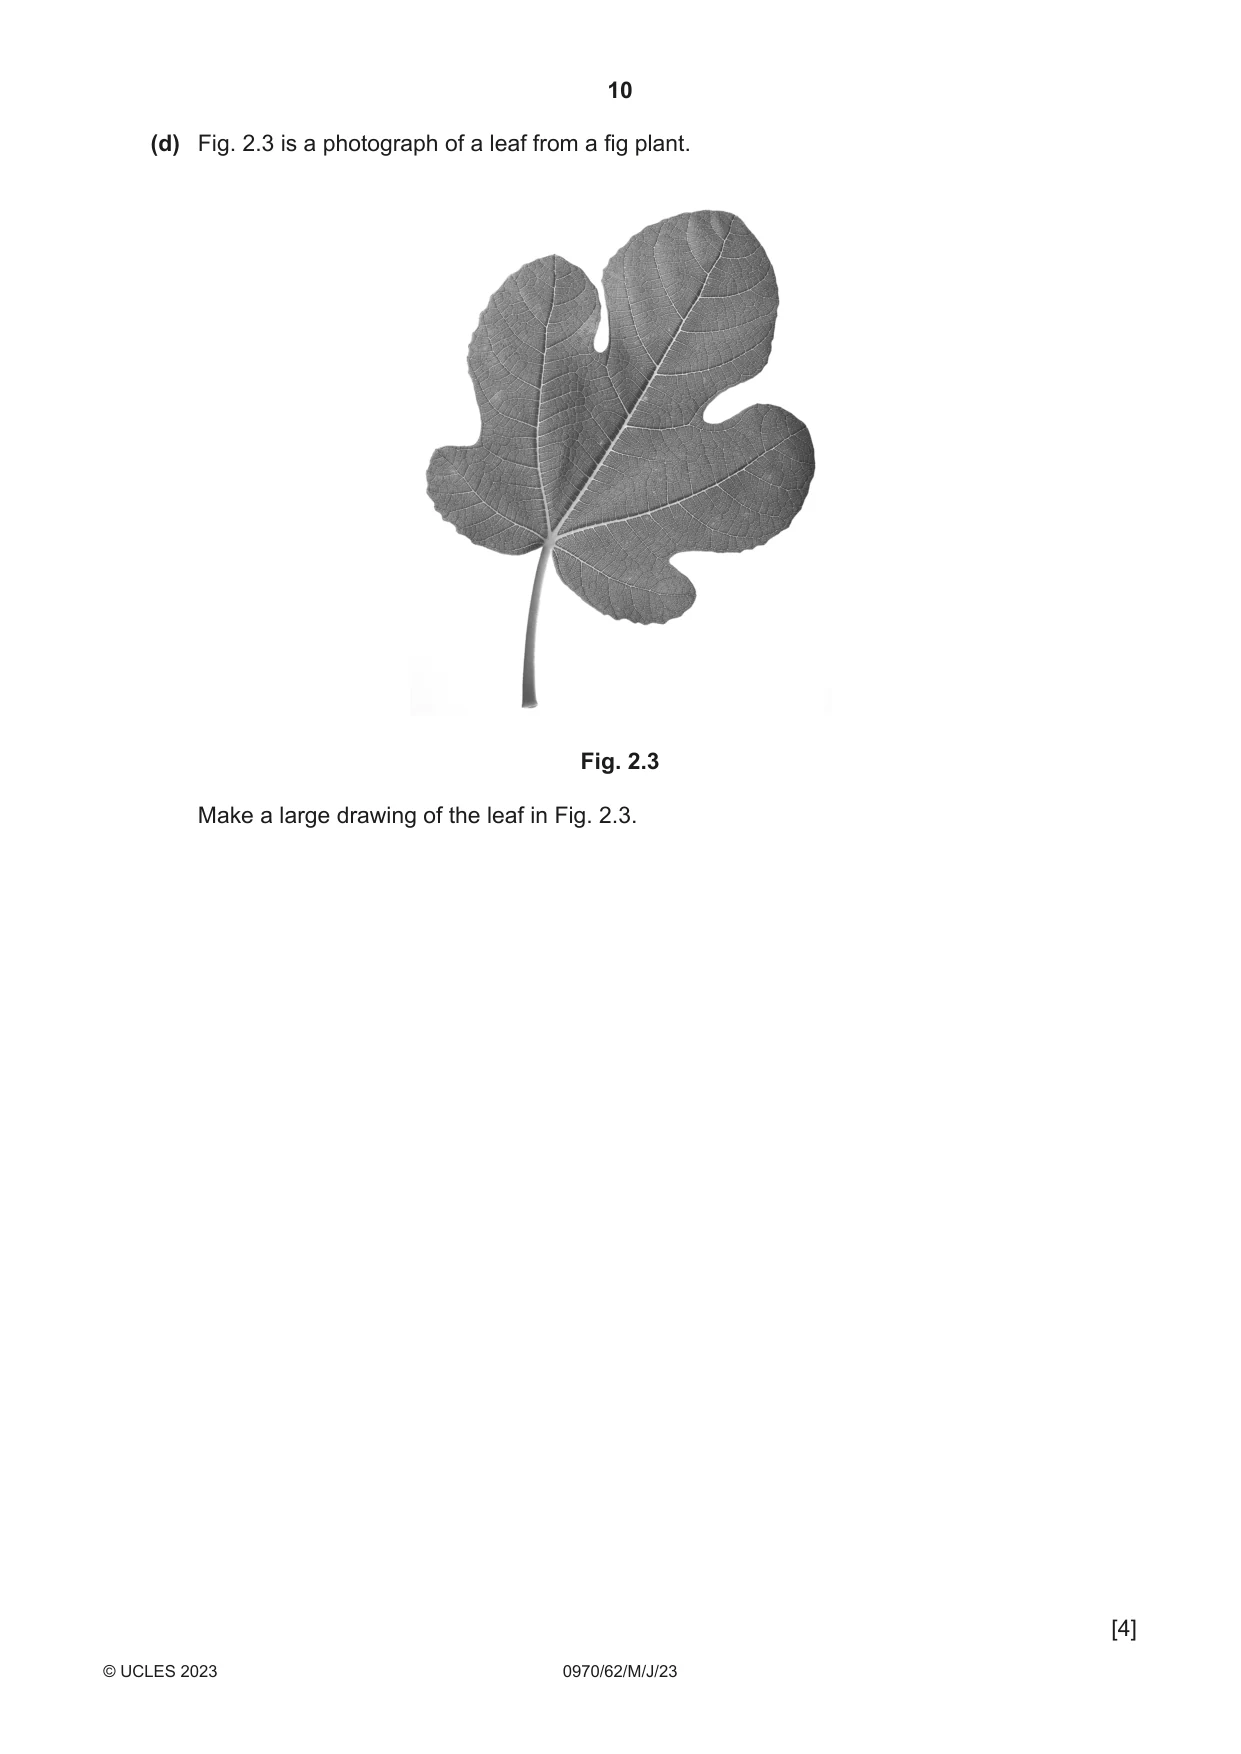
2 (a) Some plants lose their leaves in the winter and grow new leaves in the spring. A scientist measured the total leaf area of the leaves on one grapevine plant. They repeated this on 100 grapevine plants and found the mean total leaf area per plant. This procedure was done every two months for one year. The results are shown in Fig. 2.1. 5 4 mean total 3 leaf area per plant / m2 2 1 0 0 2 4 6 8 10 12 month Fig. 2.1 (i) Suggest why a large number of plants were sampled. ........................................................................................................................................... ........................................................................................................................................... ..................................................................................................................................... [1] (ii) Estimate the mean total leaf area per plant for month 7. Show on Fig. 2.1 how you estimated this value. .......................................................... m2 [2] (iii) Using the information in Fig. 2.1, calculate the percentage increase in the mean total leaf area per plant from month 4 to month 6. Give your answer to two significant figures. Space for working. ............................................................ % [3] (b) Fig. 2.2 shows a leaf from a grapevine plant. 1 cm Fig. 2.2 Use the grid to determine the area of the grapevine leaf shown in Fig. 2.2 by counting the squares containing the leaf. Only count squares that are more than half-filled by the leaf. Include the unit. .......................................................... [2] (c) Grapevines produce fruits called grapes. A large leaf area is important when growing grapes because the leaves supply reducing sugars to the grapes. Describe the method for testing for reducing sugars. Include the result for a positive test. method ...................................................................................................................................... ................................................................................................................................................... ................................................................................................................................................... positive test ............................................................................................................................... [3] (d) Fig. 2.3 is a photograph of a leaf from a fig plant. Fig. 2.3 Make a large drawing of the leaf in Fig. 2.3. [4]
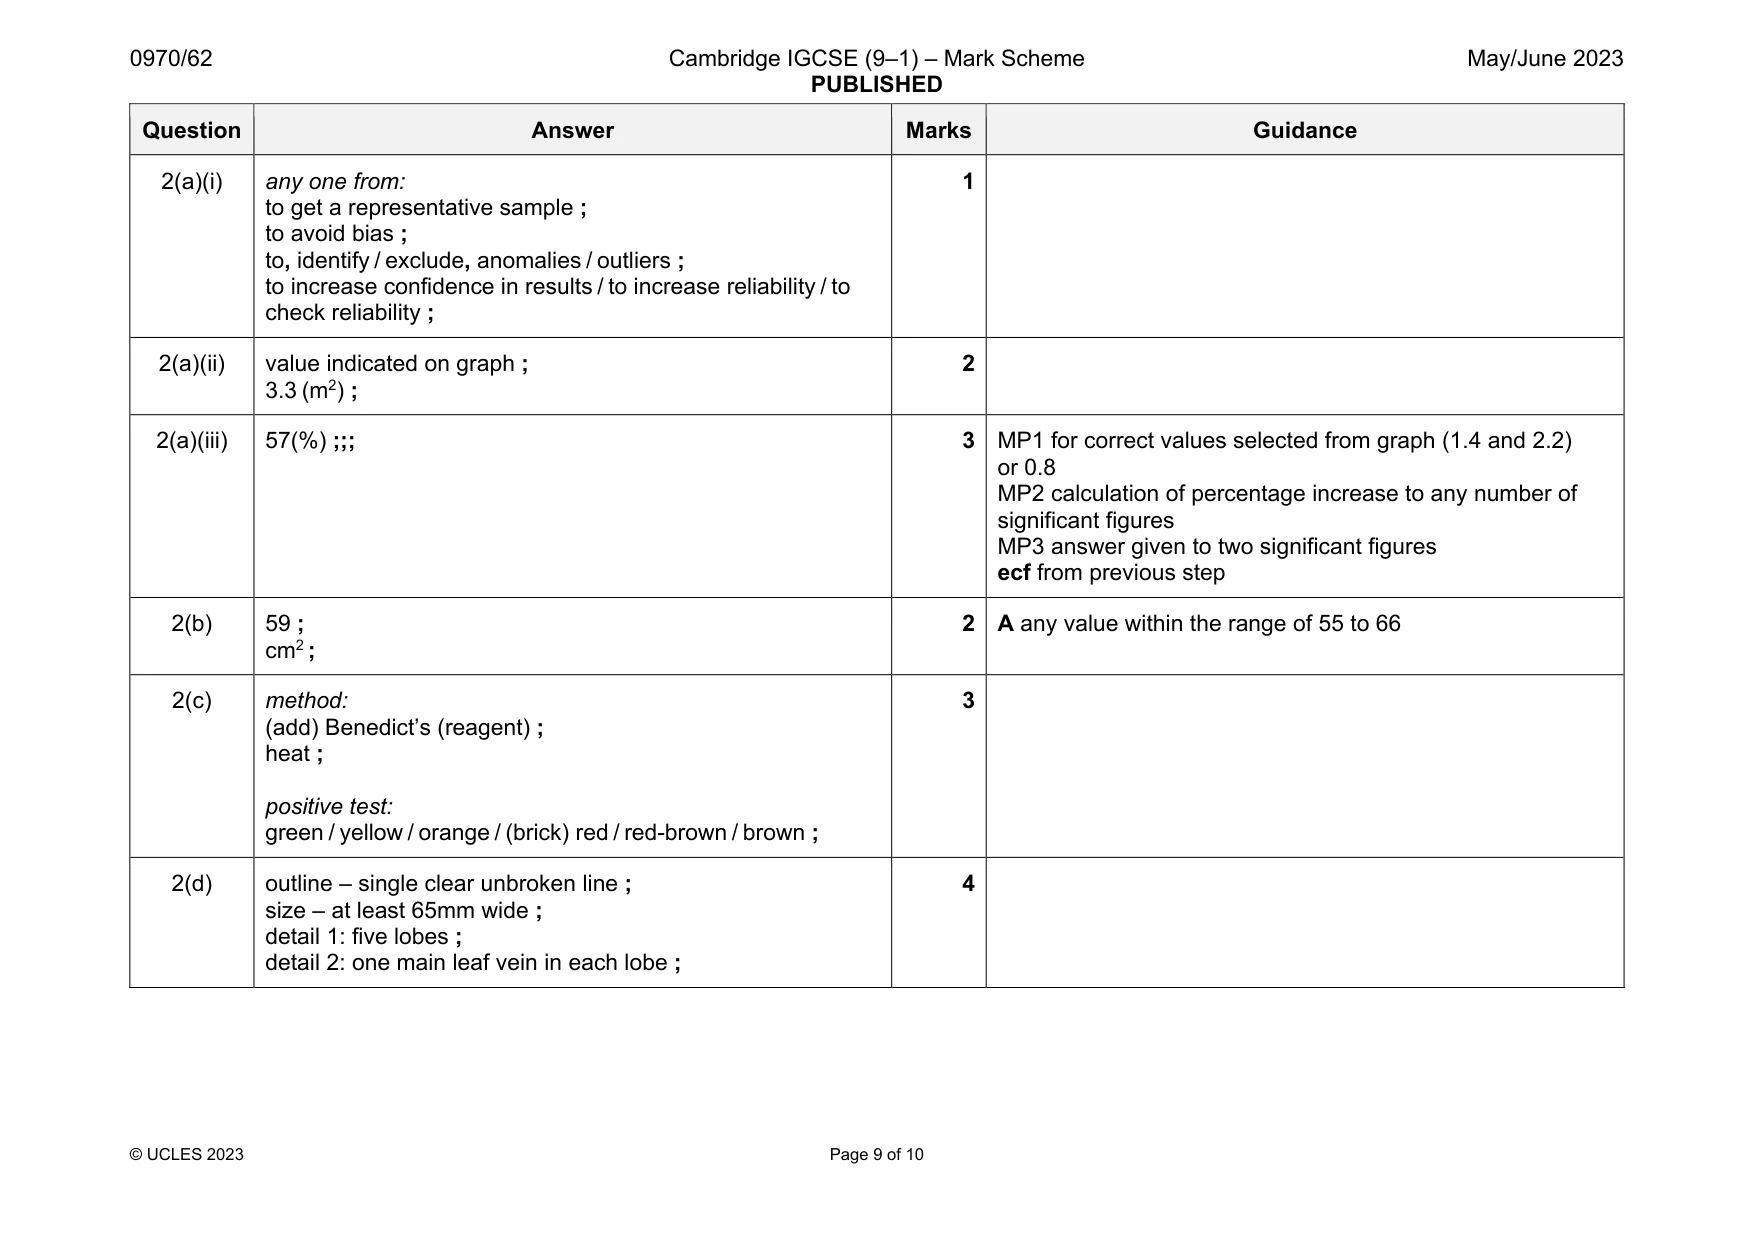
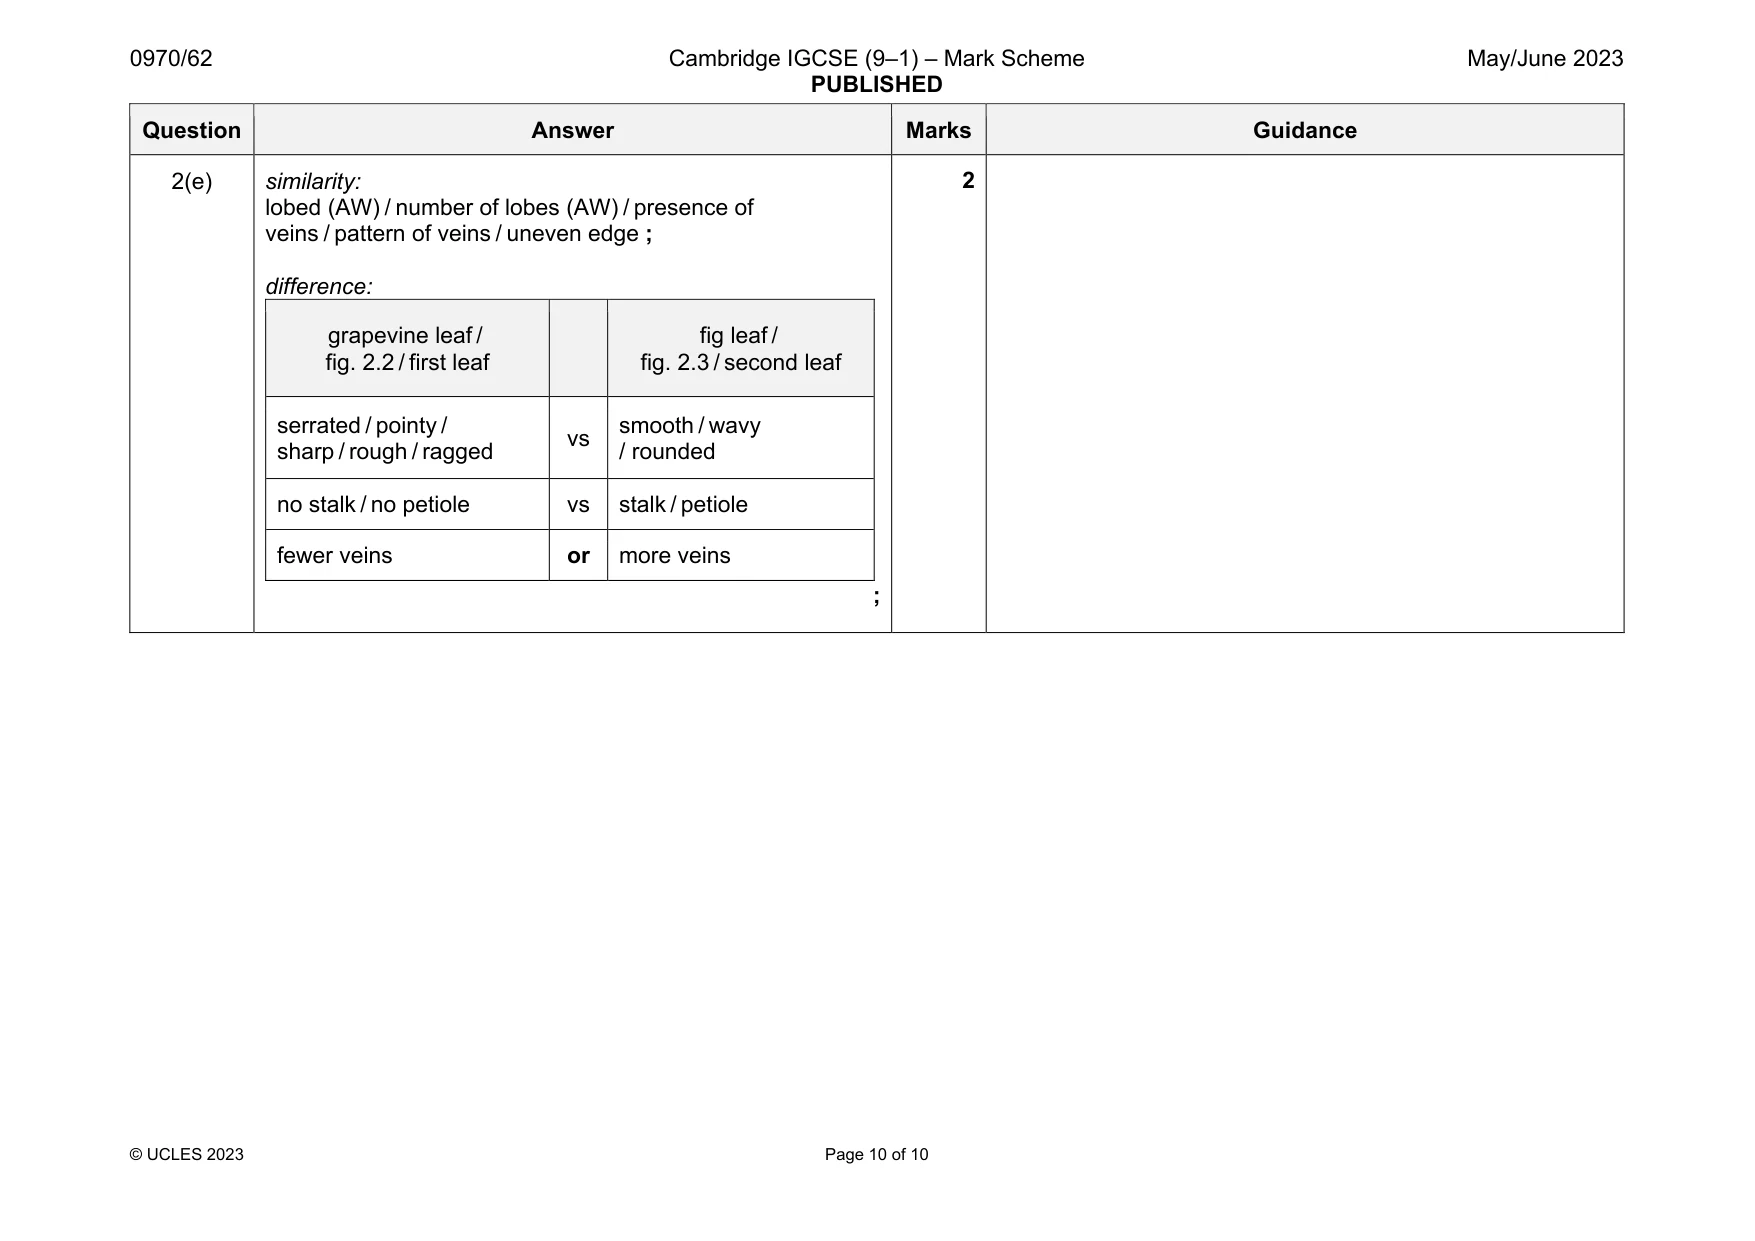
Mark scheme: 2(a)(i) any one from: to get a representative sample ; to avoid bias ; to, identify / exclude, anomalies / outliers ; to increase confidence in results / to increase reliability / to check reliability ; 2(a)(ii) value indicated on graph ; 3.3 (m2) ; 2 2(a)(iii) 57(%) ;;; 3 MP1 for correct values selected from graph (1.4 and 2.2) or 0.8 MP2 calculation of percentage increase to any number of significant figures MP3 answer given to two significant figures ecf from previous step 2(b) 59 ; cm2 ; 2 A any value within the range of 55 to 66 2(c) method: (add) Benedict’s (reagent) ; heat ; positive test: green / yellow / orange / (brick) red / red-brown / brown ; 3 2(d) outline – single clear unbroken line ; size – at least 65mm wide ; detail 1: five lobes ; detail 2: one main leaf vein in each lobe ; 4 Question Answer Marks Guidance 2(e) similarity: lobed (AW) / number of lobes (AW) / presence of veins / pattern of veins / uneven edge ; difference: grapevine leaf / fig. 2.2 / first leaf fig leaf / fig. 2.3 / second leaf serrated / pointy / sharp / rough / ragged vs smooth / wavy / rounded no stalk / no petiole vs stalk / petiole fewer veins or more veins ; 2
What was in this paper
The subtopics covered by these 2 questions, and how many questions each got. Open one in a new tab to see every Cambridge question on it.
What you needed in this session
Cambridge’s own grade thresholds for 2023 May/June, Paper 6 · Variant 2. A higher threshold means an easier paper — the bar moves with how the cohort did.