Cambridge IGCSE Biology (9-1) 0970 — 2022 May/June Paper 6 · Variant 1
0970/61/M/J/22 · 2 questions · 40 marks · ≈45 min
The question paper and its mark scheme, free to read here and free to download. This is Cambridge’s own paper, exactly as it was sat.
Question paper12 pages


Mark scheme9 pages
Answers below. Sit the paper first if you are practising.
Questions as text
Question 1
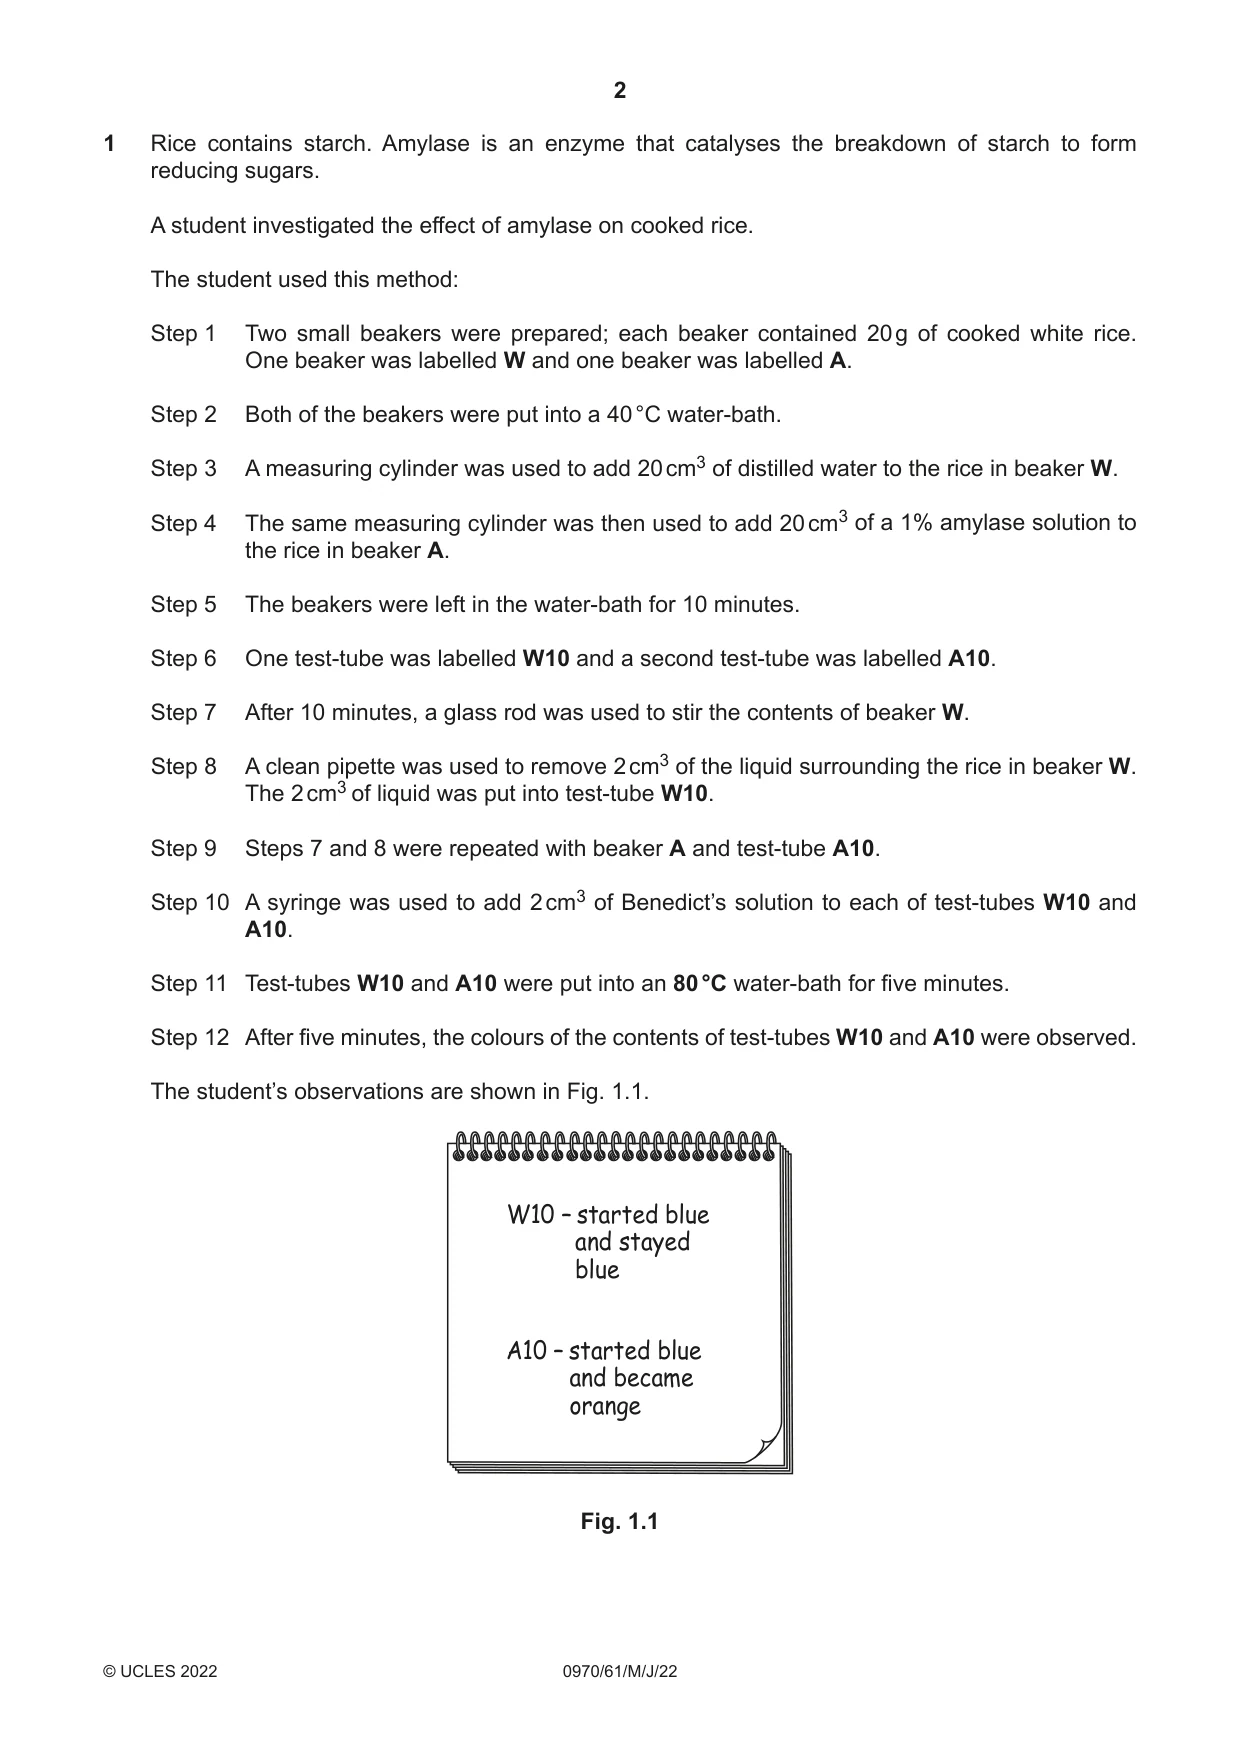
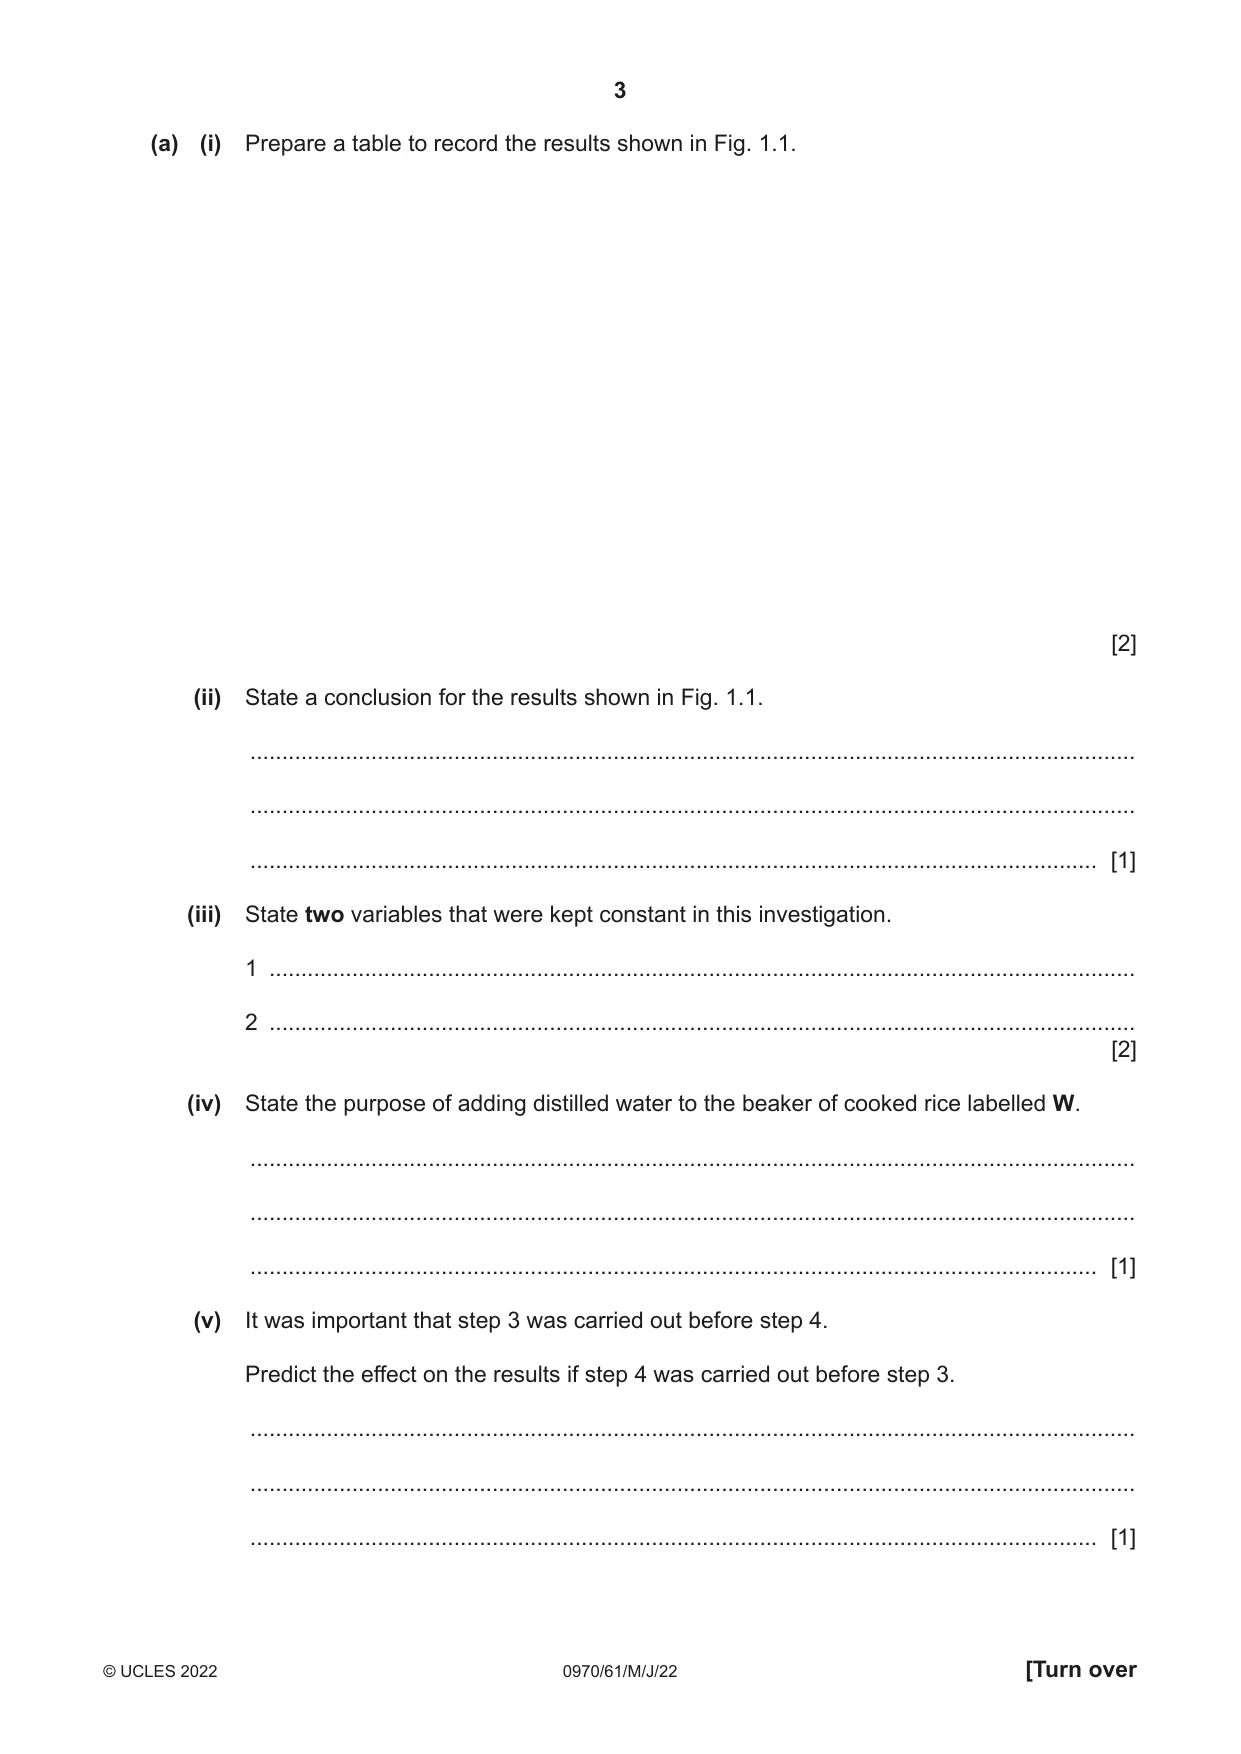
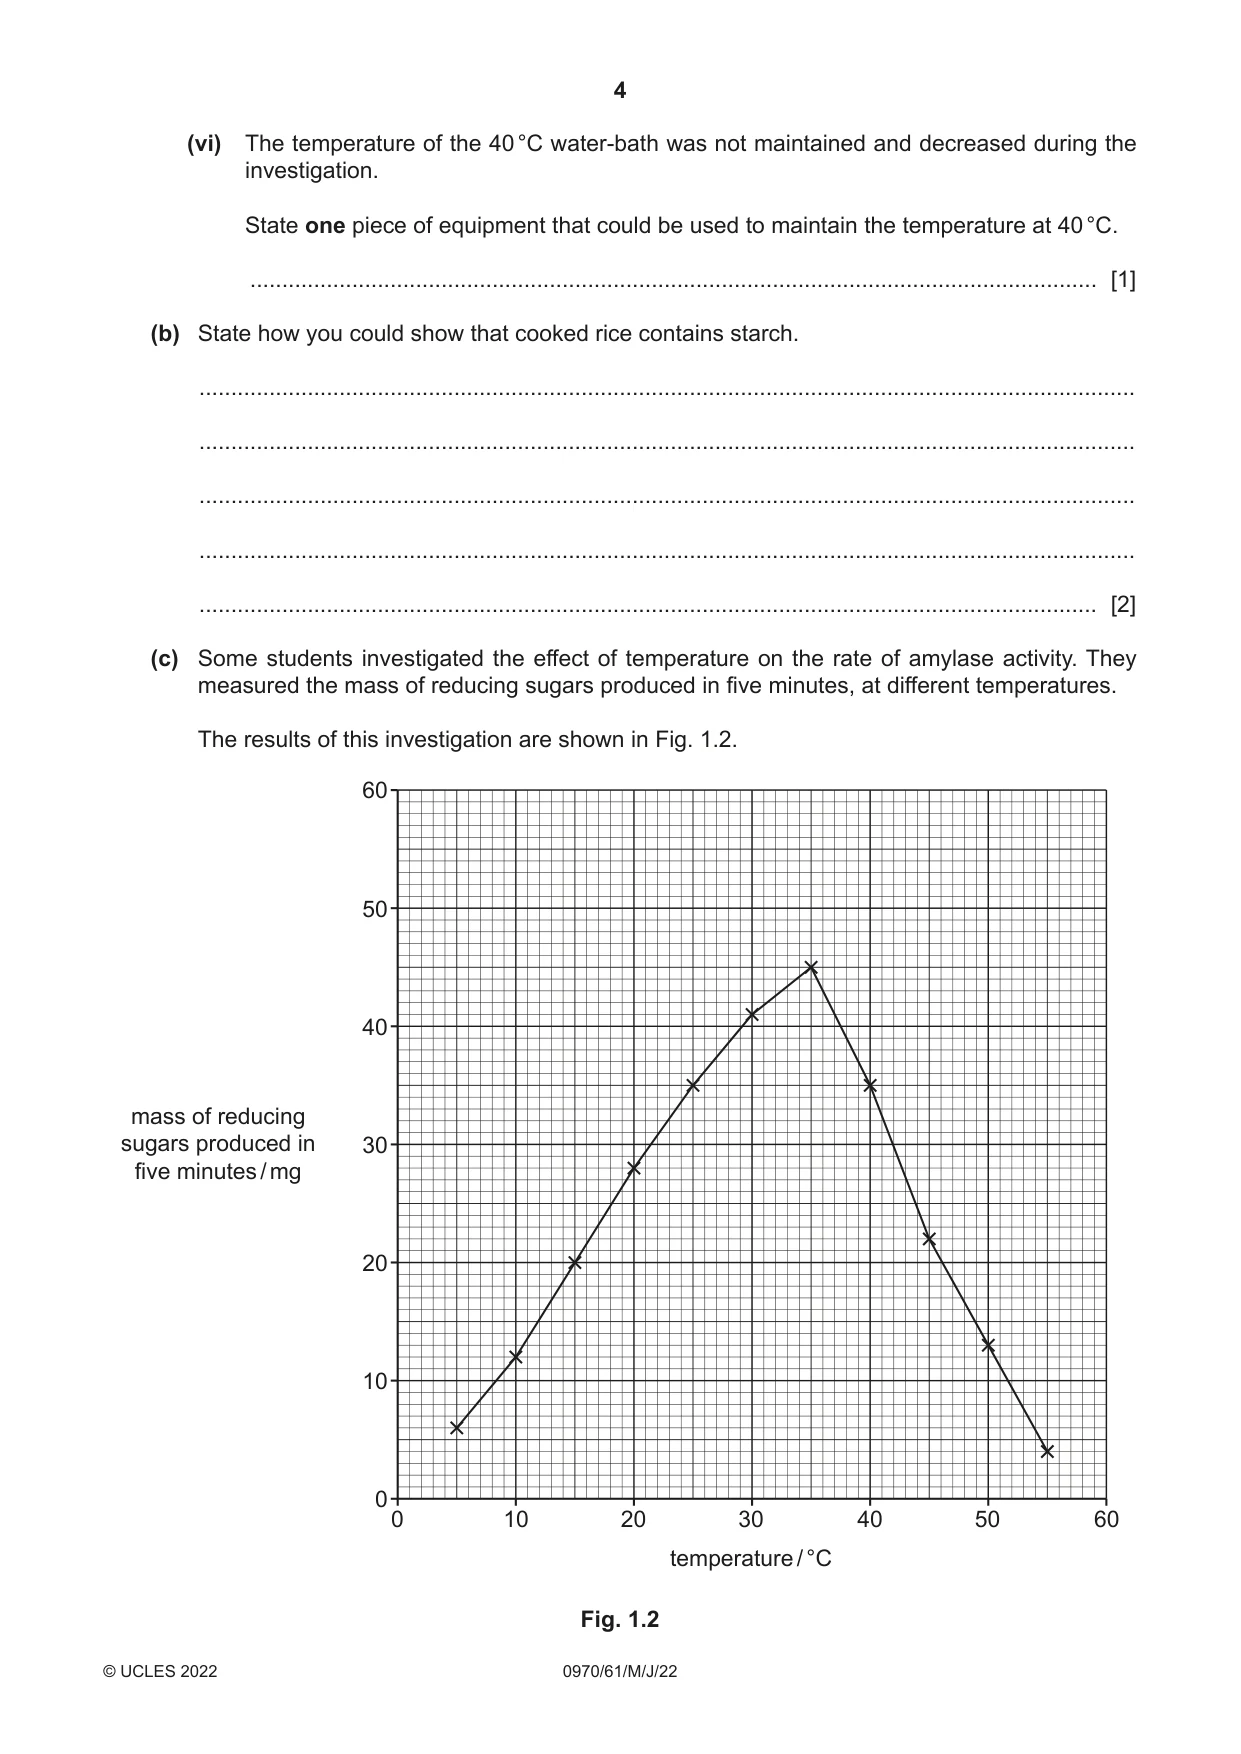
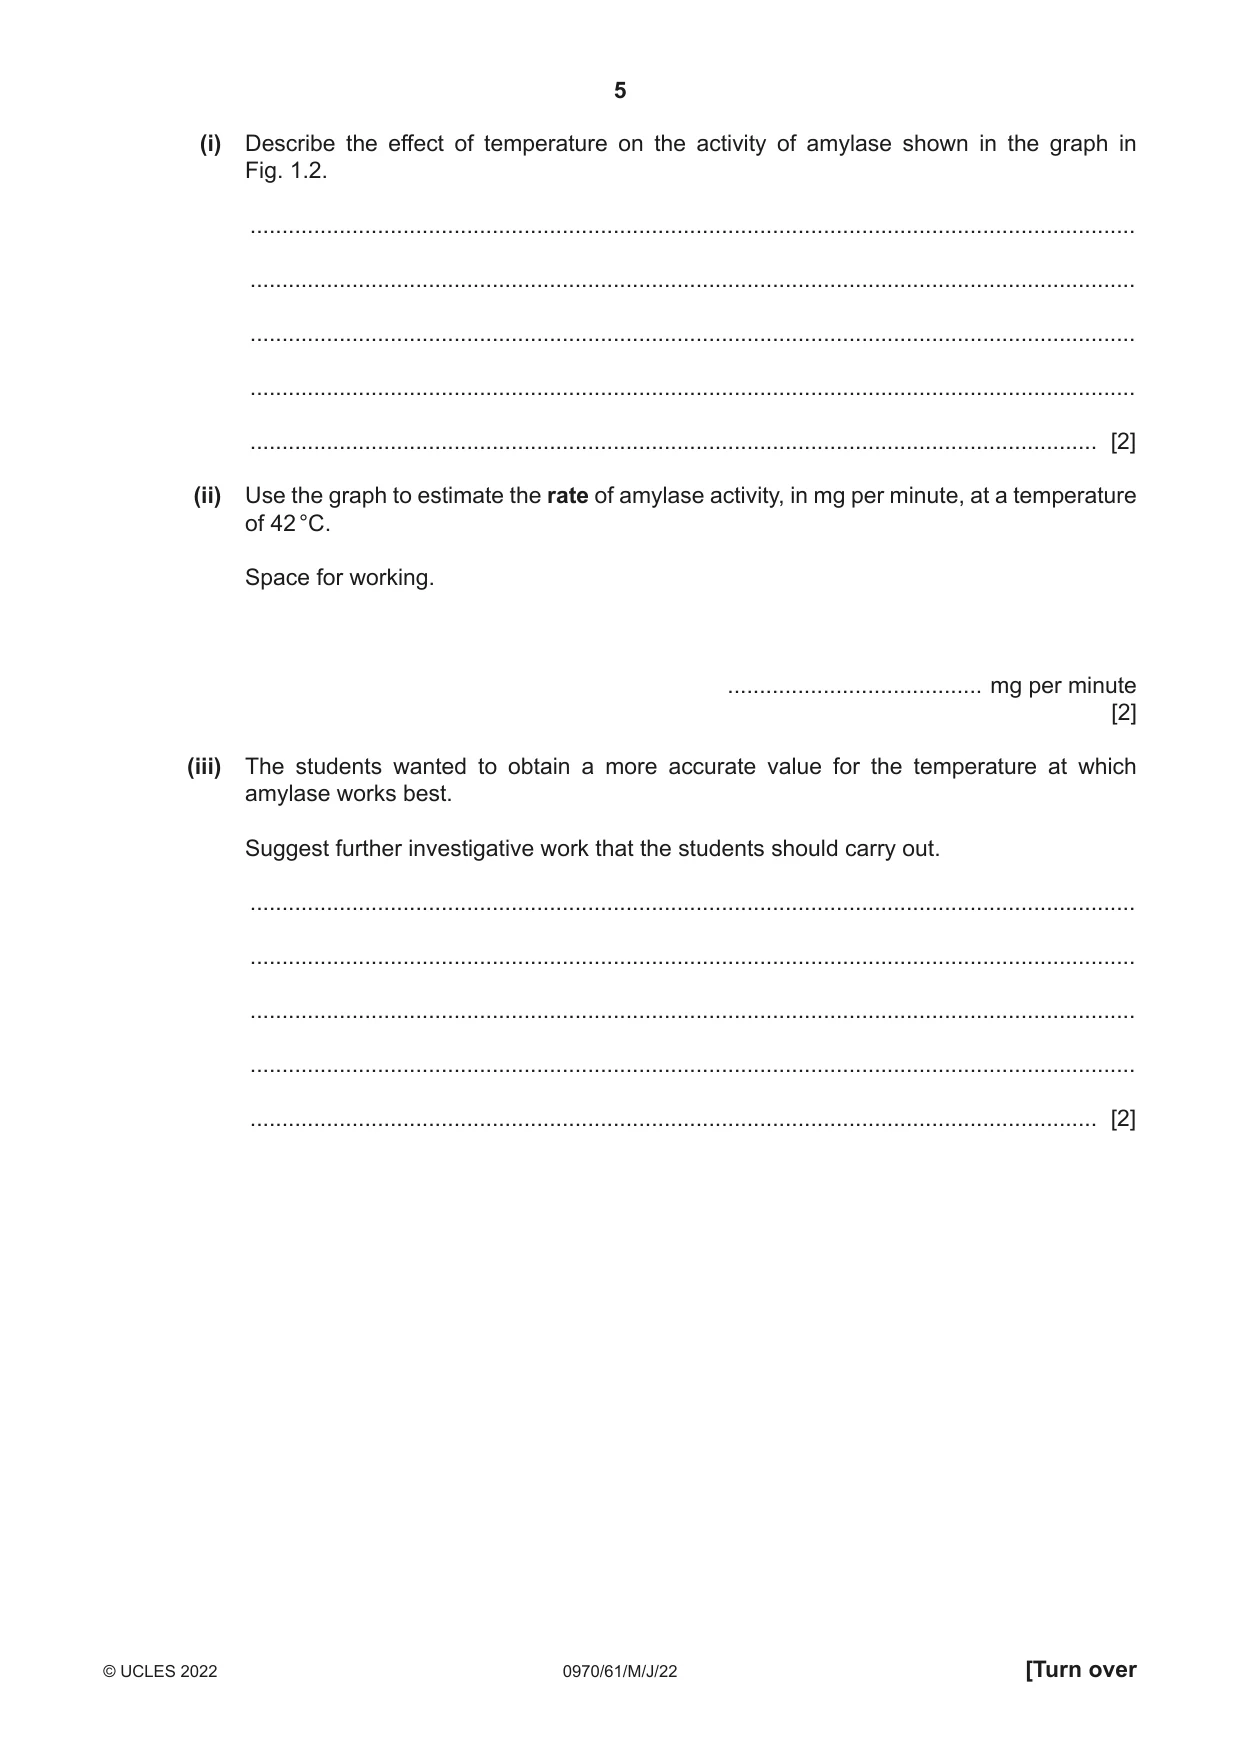
1 Rice contains starch. Amylase is an enzyme that catalyses the breakdown of starch to form reducing sugars. A student investigated the effect of amylase on cooked rice. The student used this method: Step 1 Two small beakers were prepared; each beaker contained 20 g of cooked white rice. One beaker was labelled W and one beaker was labelled A. Step 2 Both of the beakers were put into a 40 °C water-bath. Step 3 A measuring cylinder was used to add 20 cm3 of distilled water to the rice in beaker W. Step 4 The same measuring cylinder was then used to add 20 cm3 of a 1% amylase solution to the rice in beaker A. Step 5 The beakers were left in the water-bath for 10 minutes. Step 6 One test-tube was labelled W10 and a second test-tube was labelled A10. Step 7 After 10 minutes, a glass rod was used to stir the contents of beaker W. Step 8 A clean pipette was used to remove 2 cm3 of the liquid surrounding the rice in beaker W. The 2 cm3 of liquid was put into test-tube W10. Step 9 Steps 7 and 8 were repeated with beaker A and test-tube A10. Step 10 A syringe was used to add 2 cm3 of Benedict’s solution to each of test-tubes W10 and A10. Step 11 Test-tubes W10 and A10 were put into an 80 °C water-bath for five minutes. Step 12 After five minutes, the colours of the contents of test-tubes W10 and A10 were observed. The student’s observations are shown in Fig. 1.1. W10 – started blue and stayed blue A10 – started blue and became orange Fig. 1.1 (a) (i) Prepare a table to record the results shown in Fig. 1.1. [2] (ii) State a conclusion for the results shown in Fig. 1.1. ........................................................................................................................................... ........................................................................................................................................... ..................................................................................................................................... [1] (iii) State two variables that were kept constant in this investigation. 1 ........................................................................................................................................ 2 ........................................................................................................................................ [2] (iv) State the purpose of adding distilled water to the beaker of cooked rice labelled W. ........................................................................................................................................... ........................................................................................................................................... ..................................................................................................................................... [1] (v) It was important that step 3 was carried out before step 4. Predict the effect on the results if step 4 was carried out before step 3. ........................................................................................................................................... ........................................................................................................................................... ..................................................................................................................................... [1] (vi) The temperature of the 40 °C water-bath was not maintained and decreased during the investigation. State one piece of equipment that could be used to maintain the temperature at 40 °C. ..................................................................................................................................... [1] (b) State how you could show that cooked rice contains starch. ................................................................................................................................................... ................................................................................................................................................... ................................................................................................................................................... ................................................................................................................................................... ............................................................................................................................................. [2] (c) Some students investigated the effect of temperature on the rate of amylase activity. They measured the mass of reducing sugars produced in five minutes, at different temperatures. The results of this investigation are shown in Fig. 1.2. 60 50 40 mass of reducing sugars produced in 30 five minutes / mg 20 10 0 0 10 20 30 40 50 60 temperature / °C Fig. 1.2 (i) Describe the effect of temperature on the activity of amylase shown in the graph in Fig. 1.2. ........................................................................................................................................... ........................................................................................................................................... ........................................................................................................................................... ........................................................................................................................................... ..................................................................................................................................... [2] (ii) Use the graph to estimate the rate of amylase activity, in mg per minute, at a temperature of 42 °C. Space for working. ........................................ mg per minute [2] (iii) The students wanted to obtain a more accurate value for the temperature at which amylase works best. Suggest further investigative work that the students should carry out. ........................................................................................................................................... ........................................................................................................................................... ........................................................................................................................................... ........................................................................................................................................... ..................................................................................................................................... [2] (d) Plan an investigation to determine the effect of pH on the activity of amylase. ................................................................................................................................................... ................................................................................................................................................... ................................................................................................................................................... ................................................................................................................................................... ................................................................................................................................................... ................................................................................................................................................... ................................................................................................................................................... ................................................................................................................................................... ................................................................................................................................................... ................................................................................................................................................... ................................................................................................................................................... ................................................................................................................................................... ............................................................................................................................................. [6] [Total: 22]
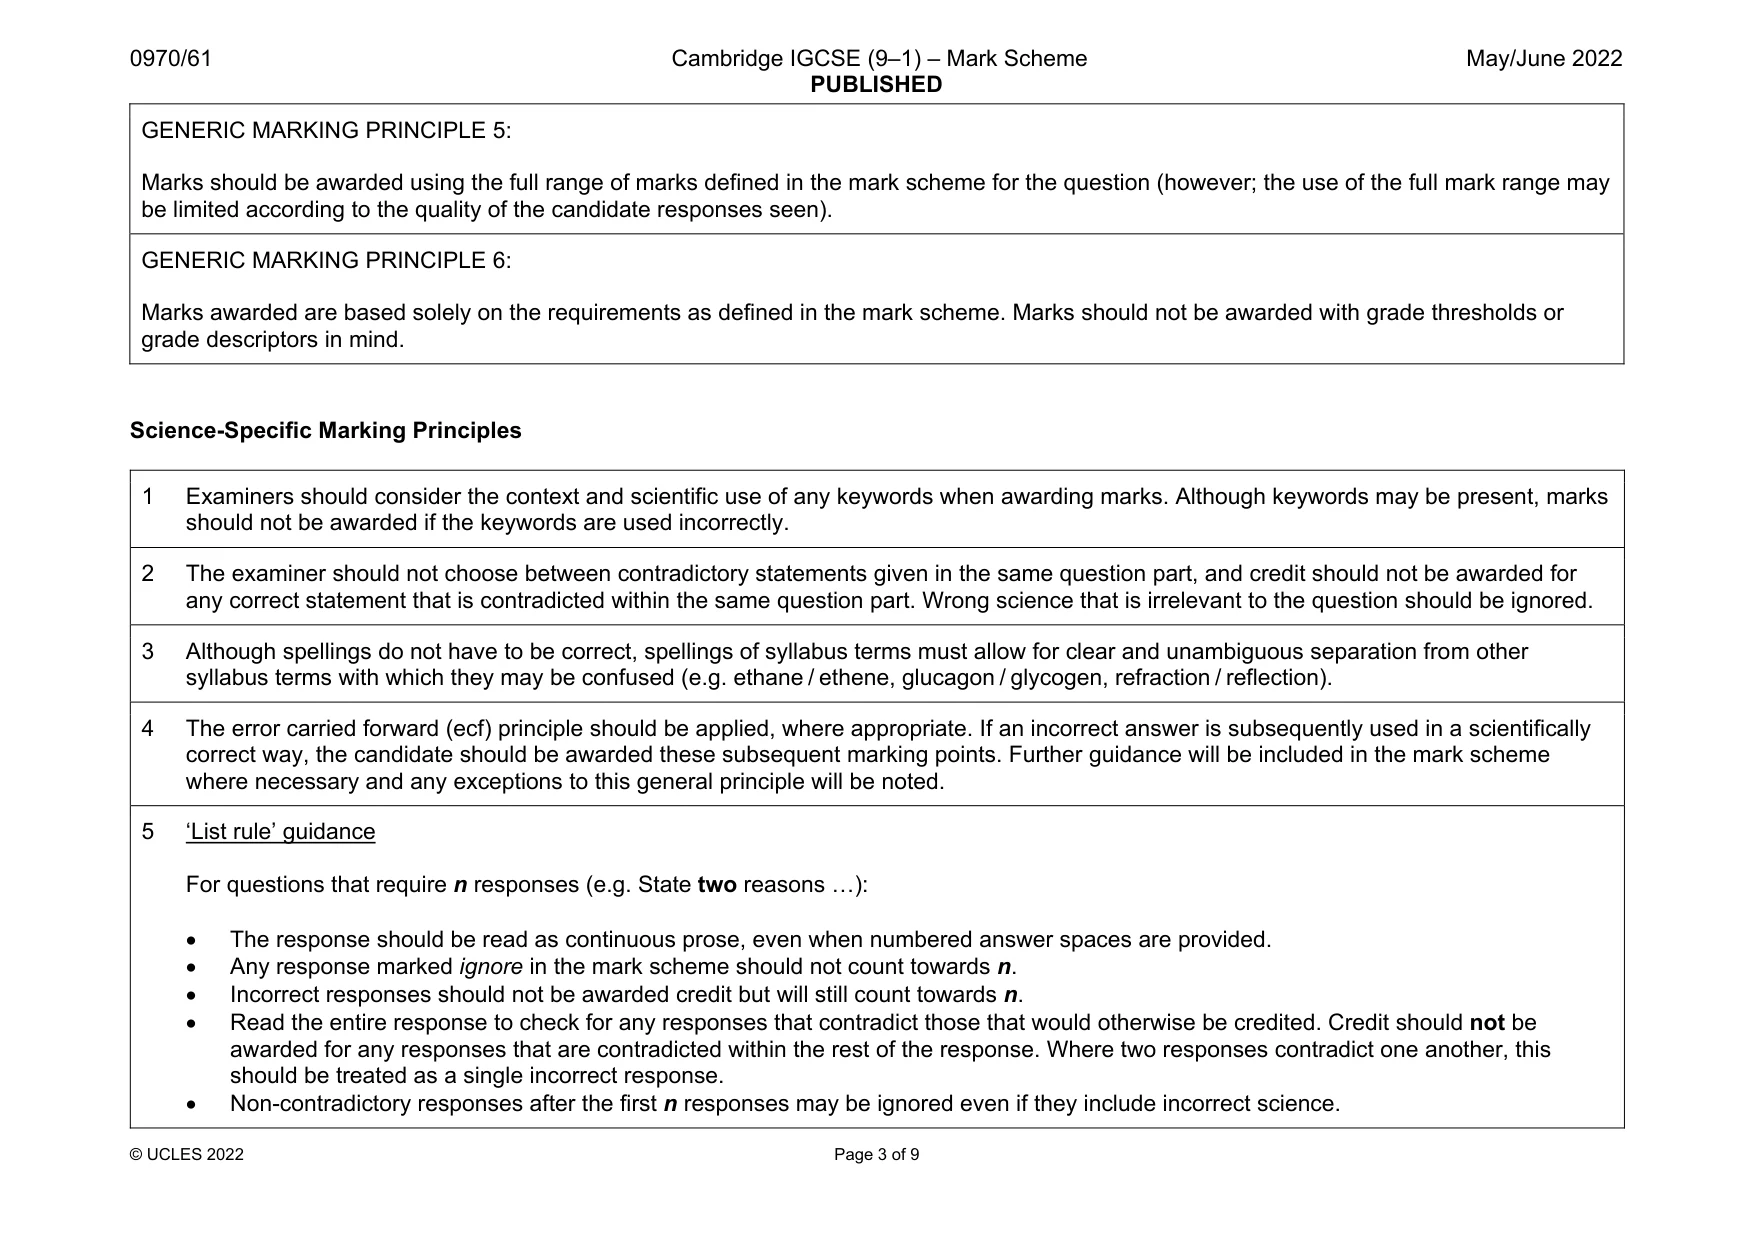
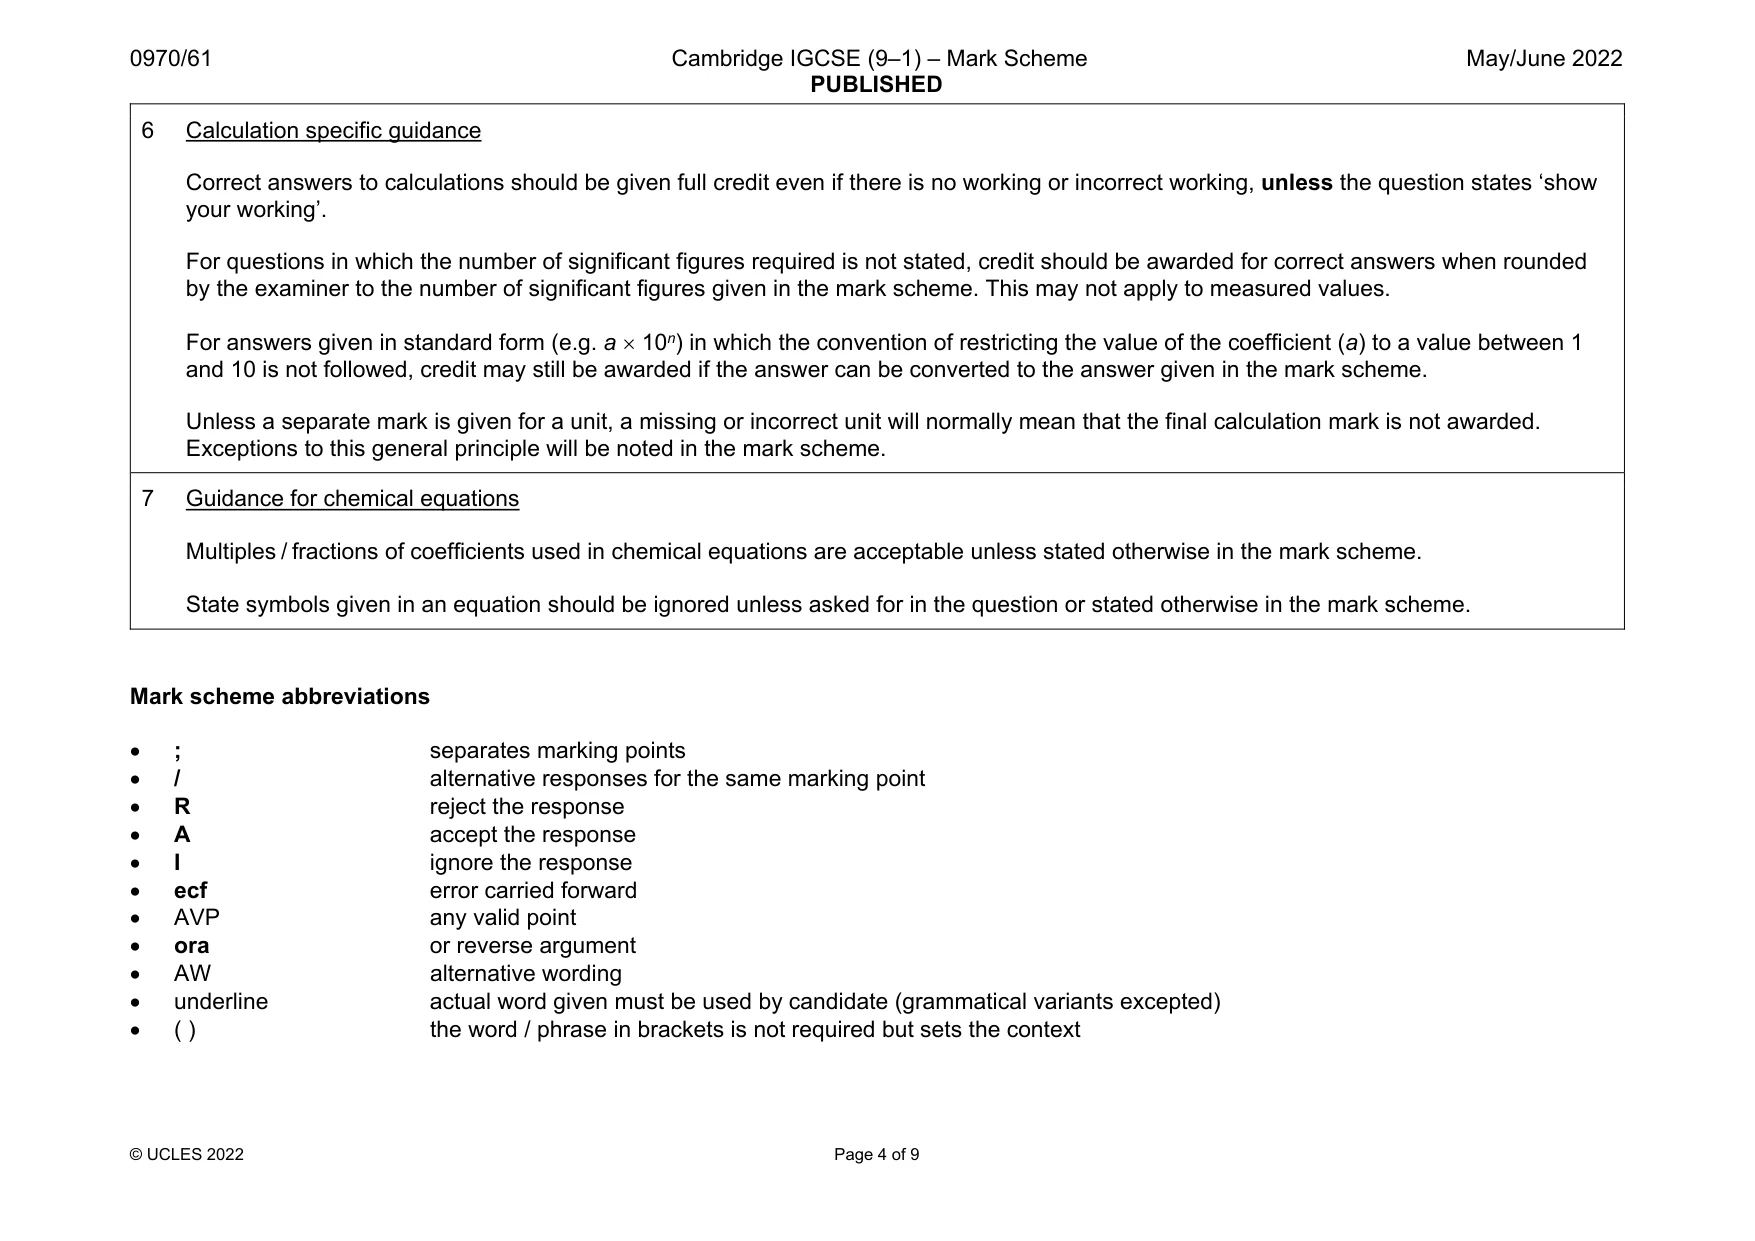
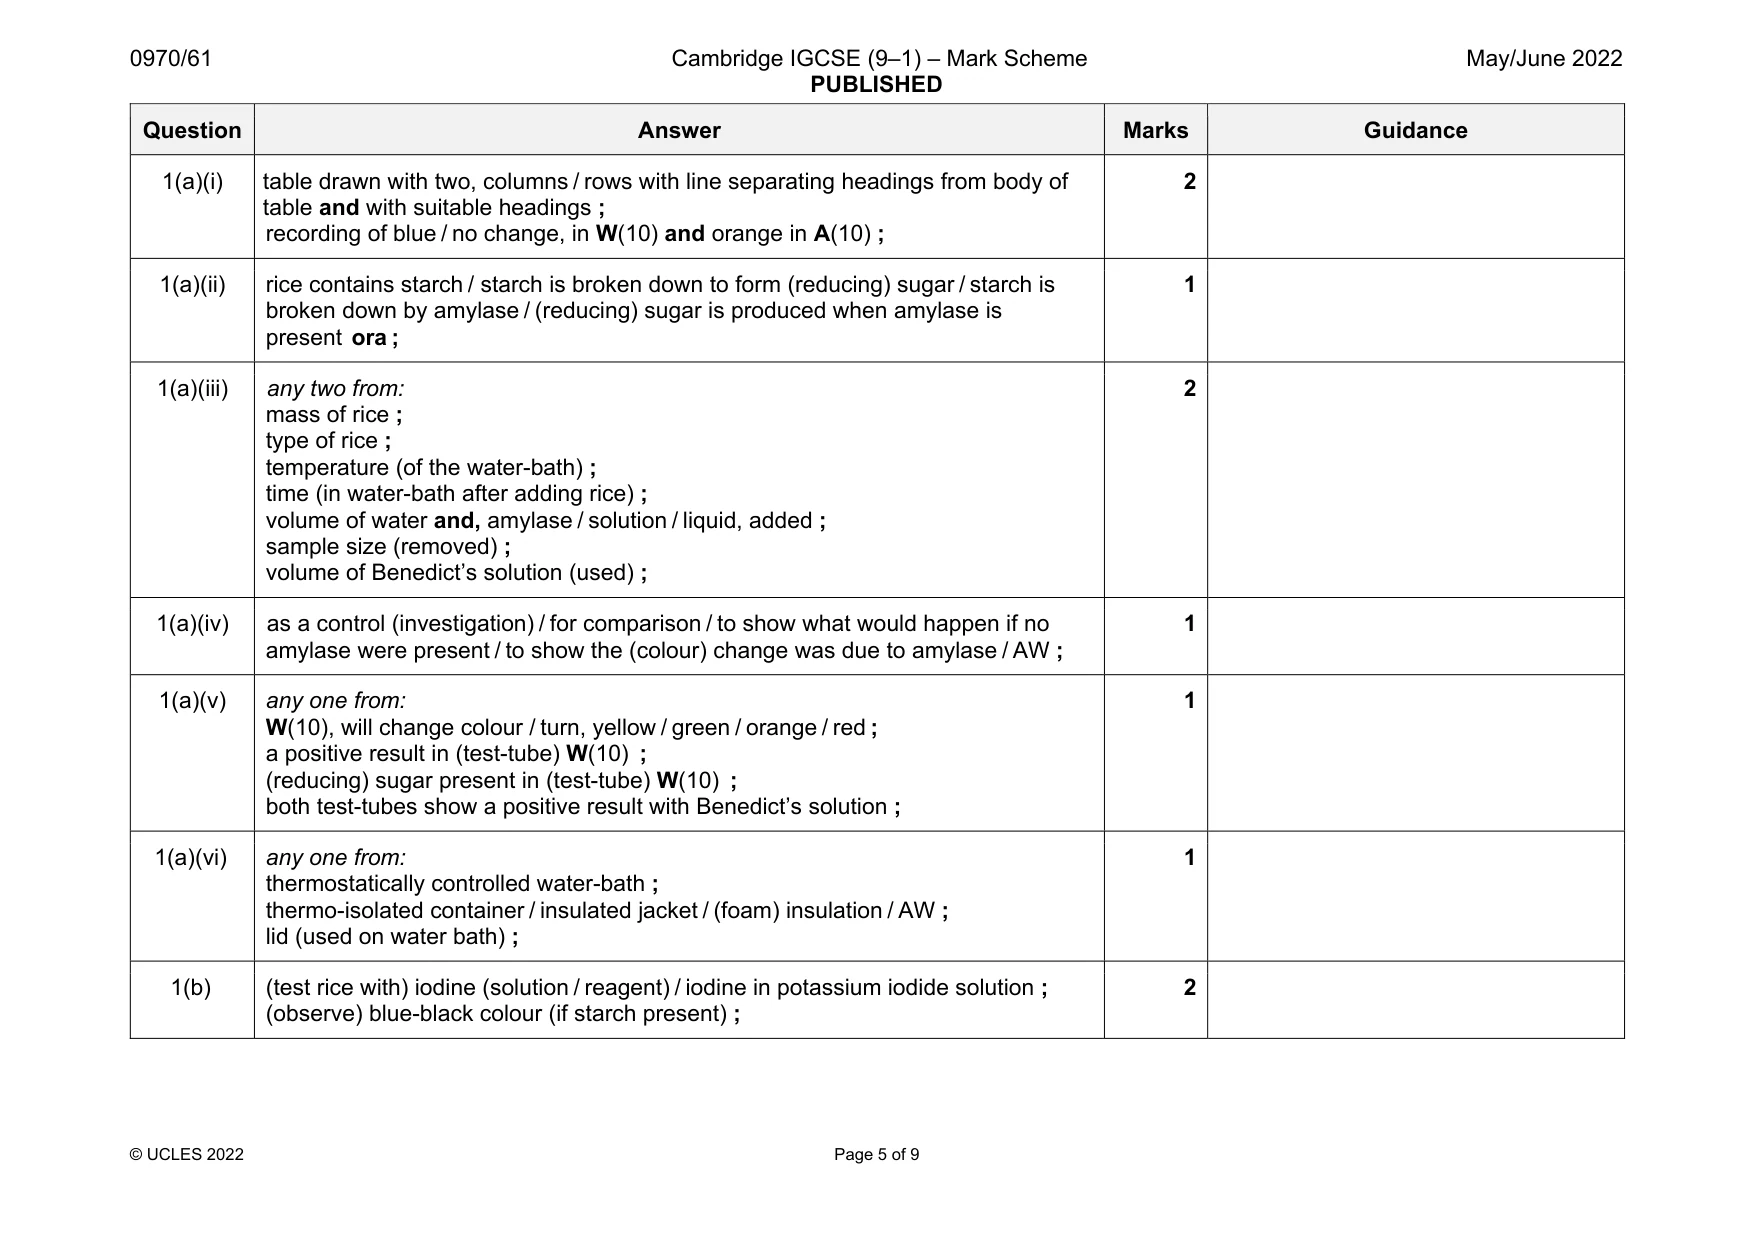
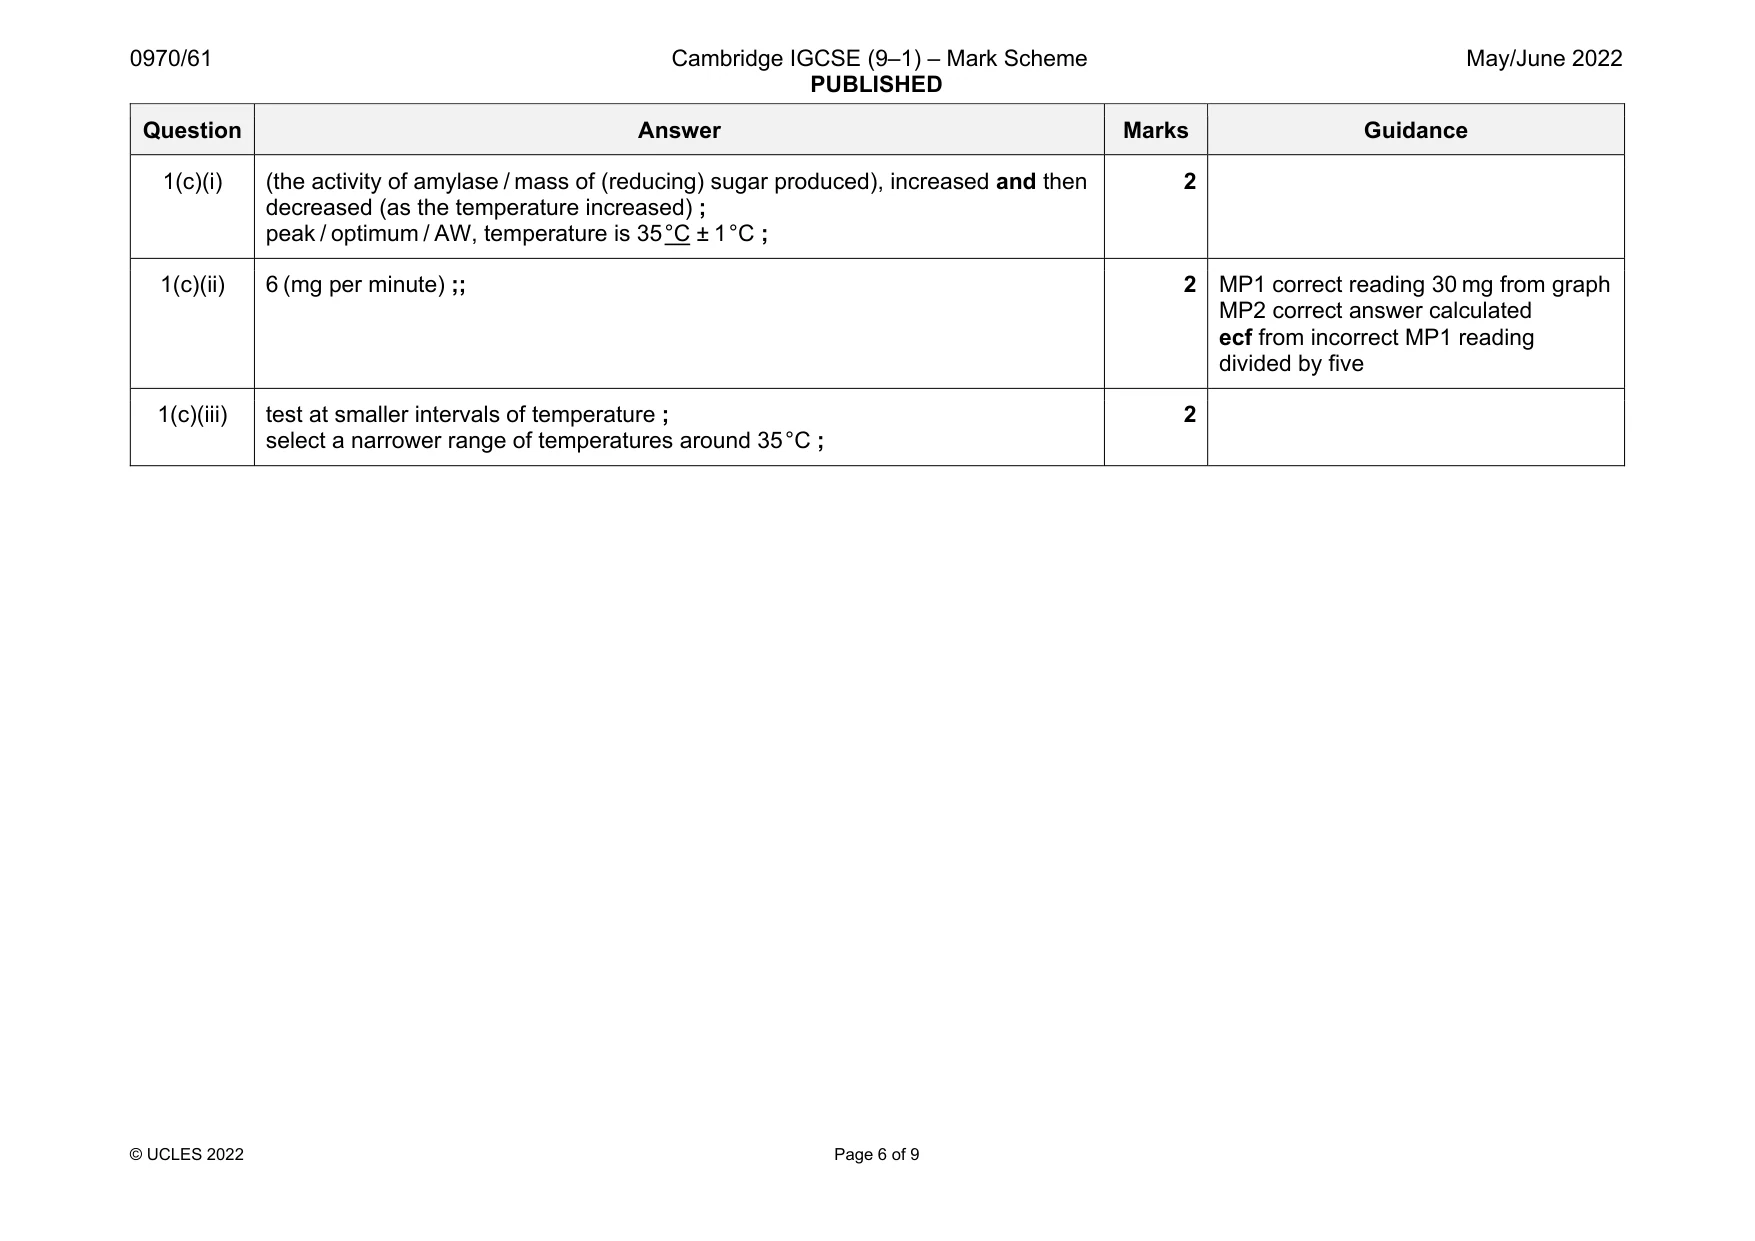
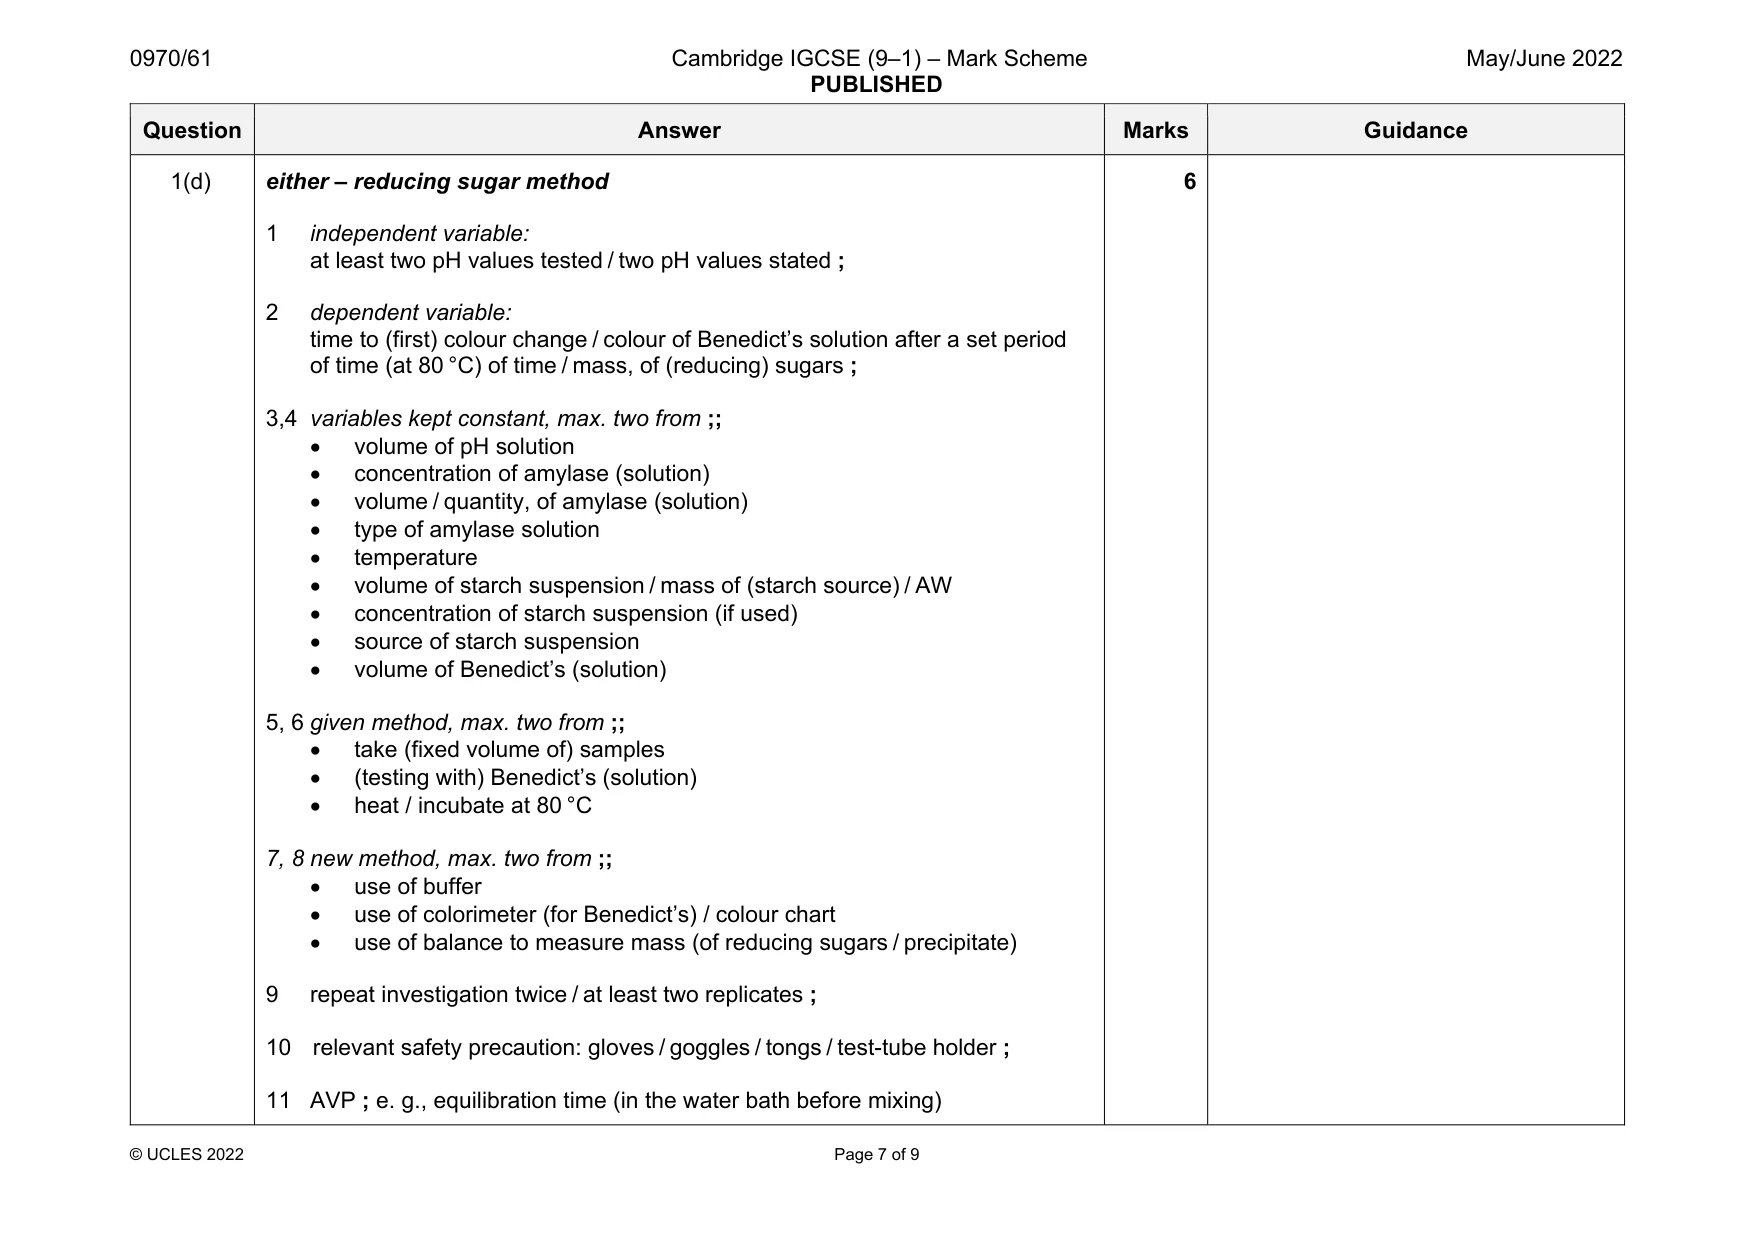
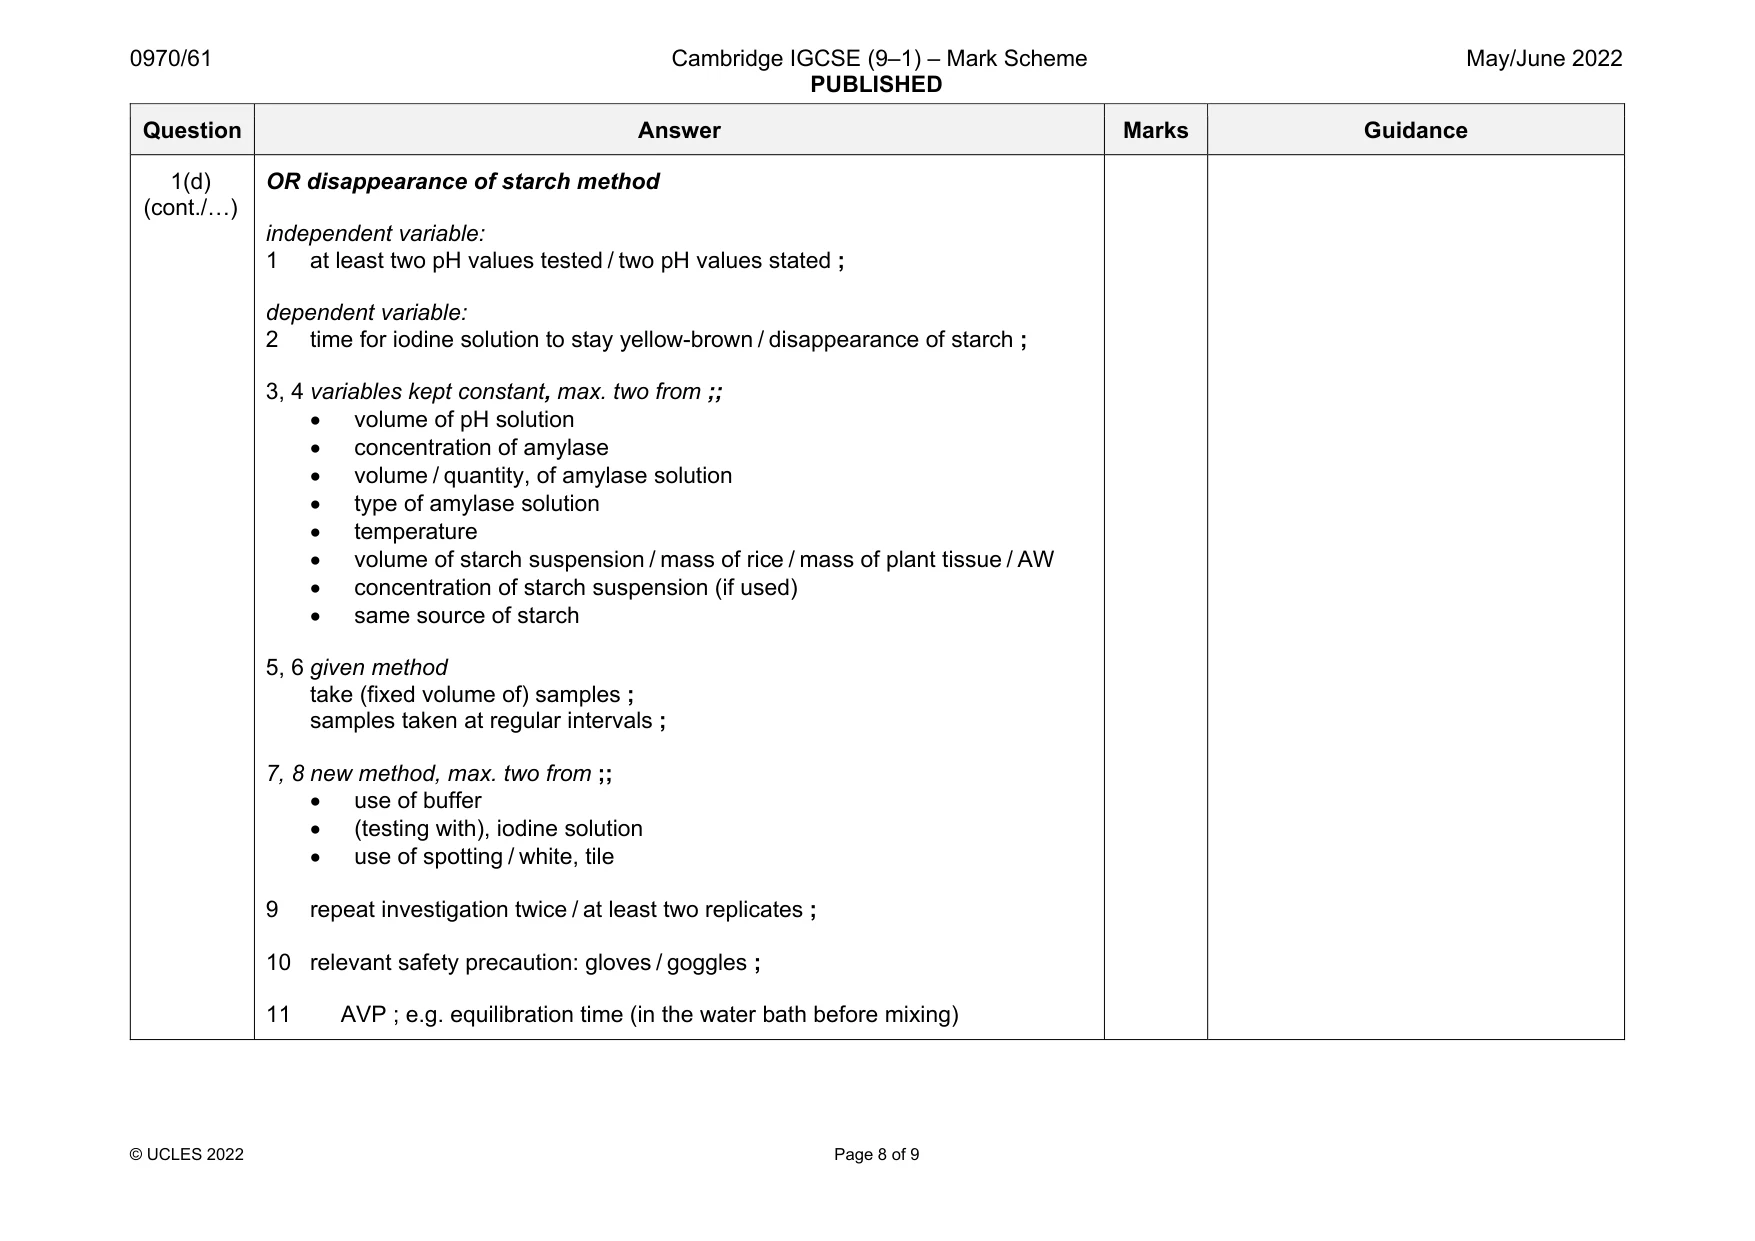
Mark scheme: 1(a)(i) table drawn with two, columns / rows with line separating headings from body of table and with suitable headings ; recording of blue / no change, in W(10) and orange in A(10) ; 2 1(a)(ii) rice contains starch / starch is broken down to form (reducing) sugar / starch is broken down by amylase / (reducing) sugar is produced when amylase is present ora ; 1 1(a)(iii) any two from: mass of rice ; type of rice ; temperature (of the water-bath) ; time (in water-bath after adding rice) ; volume of water and, amylase / solution / liquid, added ; sample size (removed) ; volume of Benedict’s solution (used) ; 2 1(a)(iv) as a control (investigation) / for comparison / to show what would happen if no amylase were present / to show the (colour) change was due to amylase / AW ; 1 1(a)(v) any one from: W(10), will change colour / turn, yellow / green / orange / red ; a positive result in (test-tube) W(10) ; (reducing) sugar present in (test-tube) W(10) ; both test-tubes show a positive result with Benedict’s solution ; 1 1(a)(vi) any one from: thermostatically controlled water-bath ; thermo-isolated container / insulated jacket / (foam) insulation / AW ; lid (used on water bath) ; 1 1(b) (test rice with) iodine (solution / reagent) / iodine in potassium iodide solution ; (observe) blue-black colour (if starch present) ; 2 Question Answer Marks Guidance 1(c)(i) (the activity of amylase / mass of (reducing) sugar produced), increased and then decreased (as the temperature increased) ; peak / optimum / AW, temperature is 35 °C ± 1 °C ; 2 1(c)(ii) 6 (mg per minute) ;; 2 MP1 correct reading 30 mg from graph MP2 correct answer calculated ecf from incorrect MP1 reading divided by five 1(c)(iii) test at smaller intervals of temperature ; select a narrower range of temperatures around 35 °C ; 2 Question Answer Marks Guidance 1(d) either – reducing sugar method 1 independent variable: at least two pH values tested / two pH values stated ; 2 dependent variable: time to (first) colour change / colour of Benedict’s solution after a set period of time (at 80 °C) of time / mass, of (reducing) sugars ; 3,4 variables kept constant, max. two from ;; volume of pH solution concentration of amylase (solution) volume / quantity, of amylase (solution) type of amylase solution temperature volume of starch suspension / mass of (starch source) / AW concentration of starch suspension (if used) source of starch suspension volume of Benedict’s (solution) 5, 6 given method, max. two from ;; take (fixed volume of) samples (testing with) Benedict’s (solution) heat / incubate at 80 °C 7, 8 new method, max. two from ;; use of buffer use of colorimeter (for Benedict’s) / colour chart use of balance to measure mass (of reducing sugars / precipitate) 9 repeat investigation twice / at least two replicates ; 10 relevant safety precaution: gloves / goggles / tongs / test-tube holder ; 11 AVP ; e. g., equilibration time (in the water bath before mixing) 6 Question Answer Marks Guidance 1(d) (cont./…) OR disappearance of starch method independent variable: 1 at least two pH values tested / two pH values stated ; dependent variable: 2 time for iodine solution to stay yellow-brown / disappearance of starch ; 3, 4 variables kept constant, max. two from ;; volume of pH solution concentration of amylase volume / quantity, of amylase solution type of amylase solution temperature volume of starch suspension / mass of rice / mass of plant tissue / AW concentration of starch suspension (if used) same source of starch 5, 6 given method take (fixed volume of) samples ; samples taken at regular intervals ; 7, 8 new method, max. two from ;; use of buffer (testing with), iodine solution use of spotting / white, tile 9 repeat investigation twice / at least two replicates ; 10 relevant safety precaution: gloves / goggles ; 11 AVP ; e.g. equilibration time (in the water bath before mixing)
Q2 · A photomicrograph of a section through part of a marram grass leaf, Ammophila arenaria
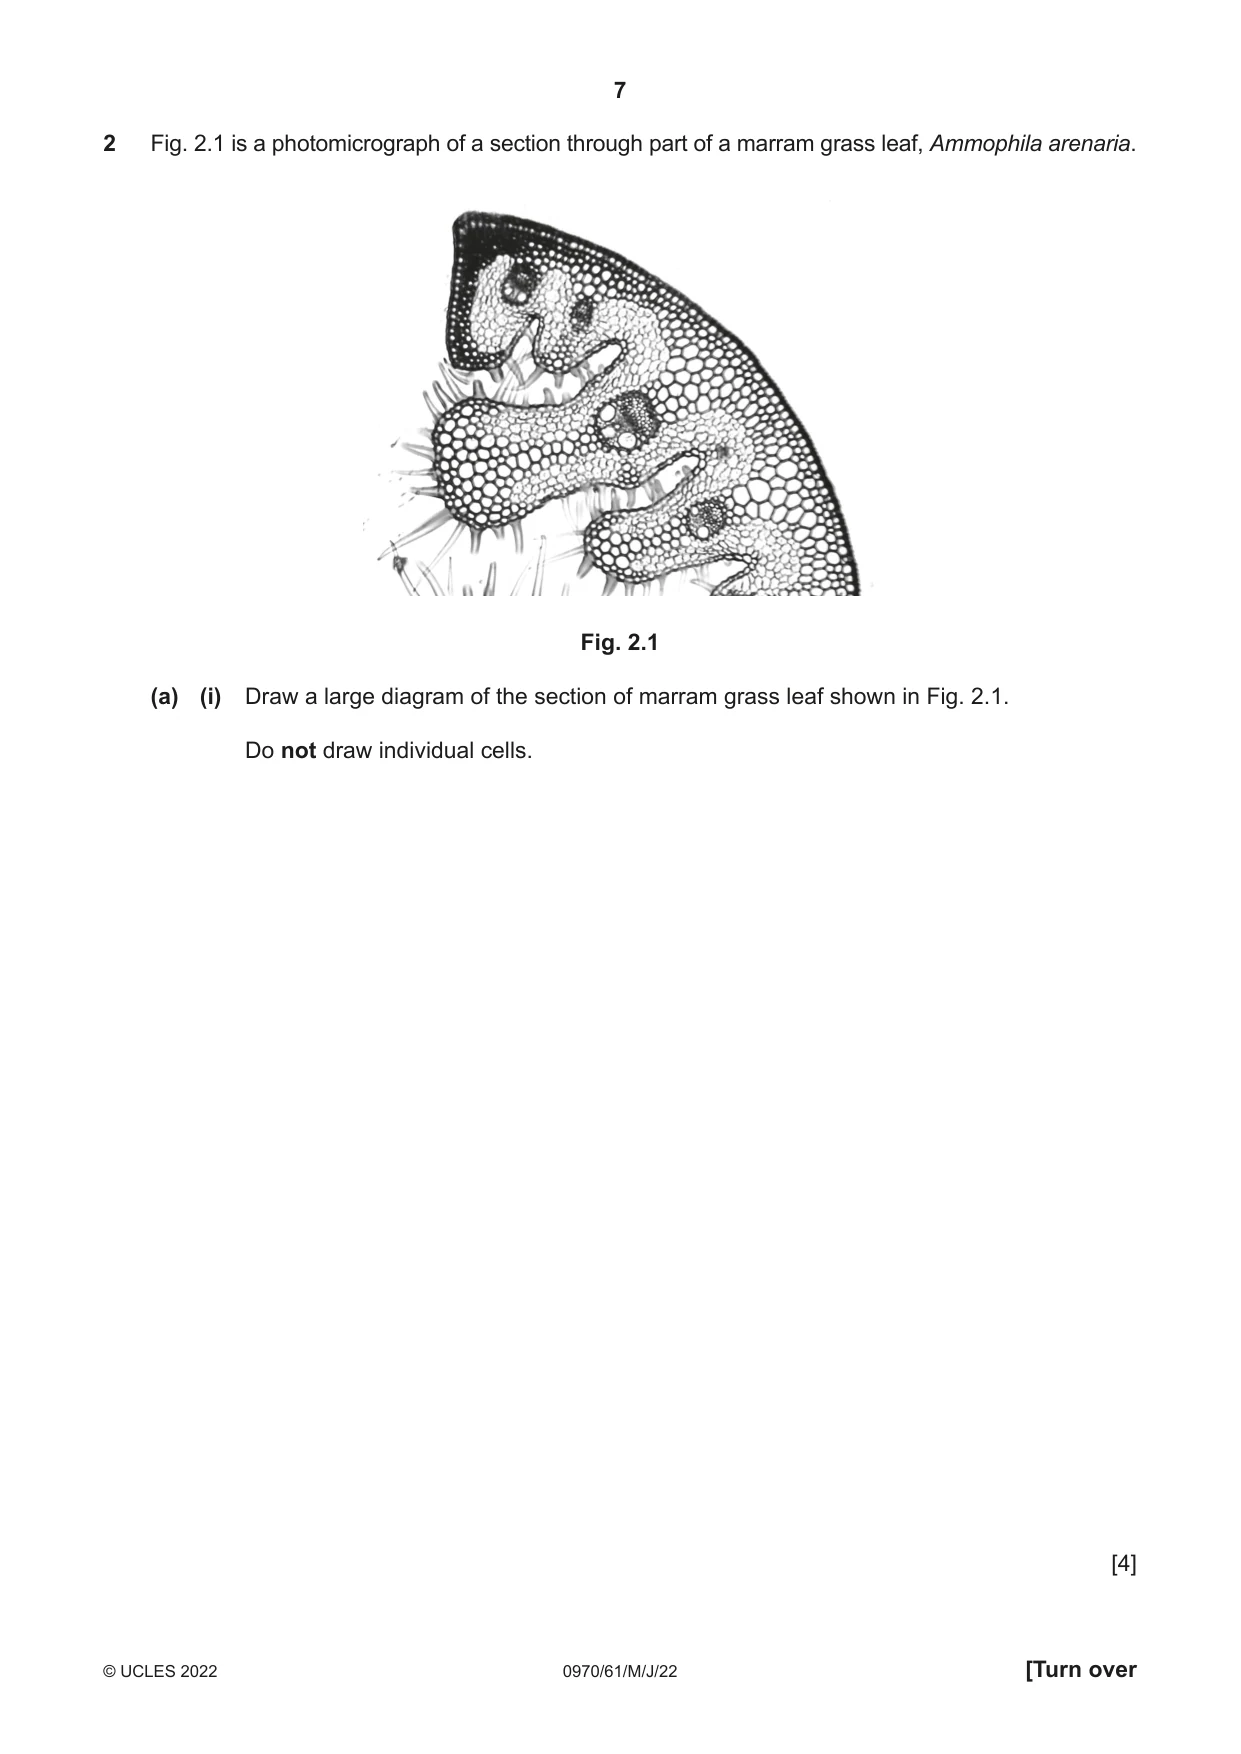
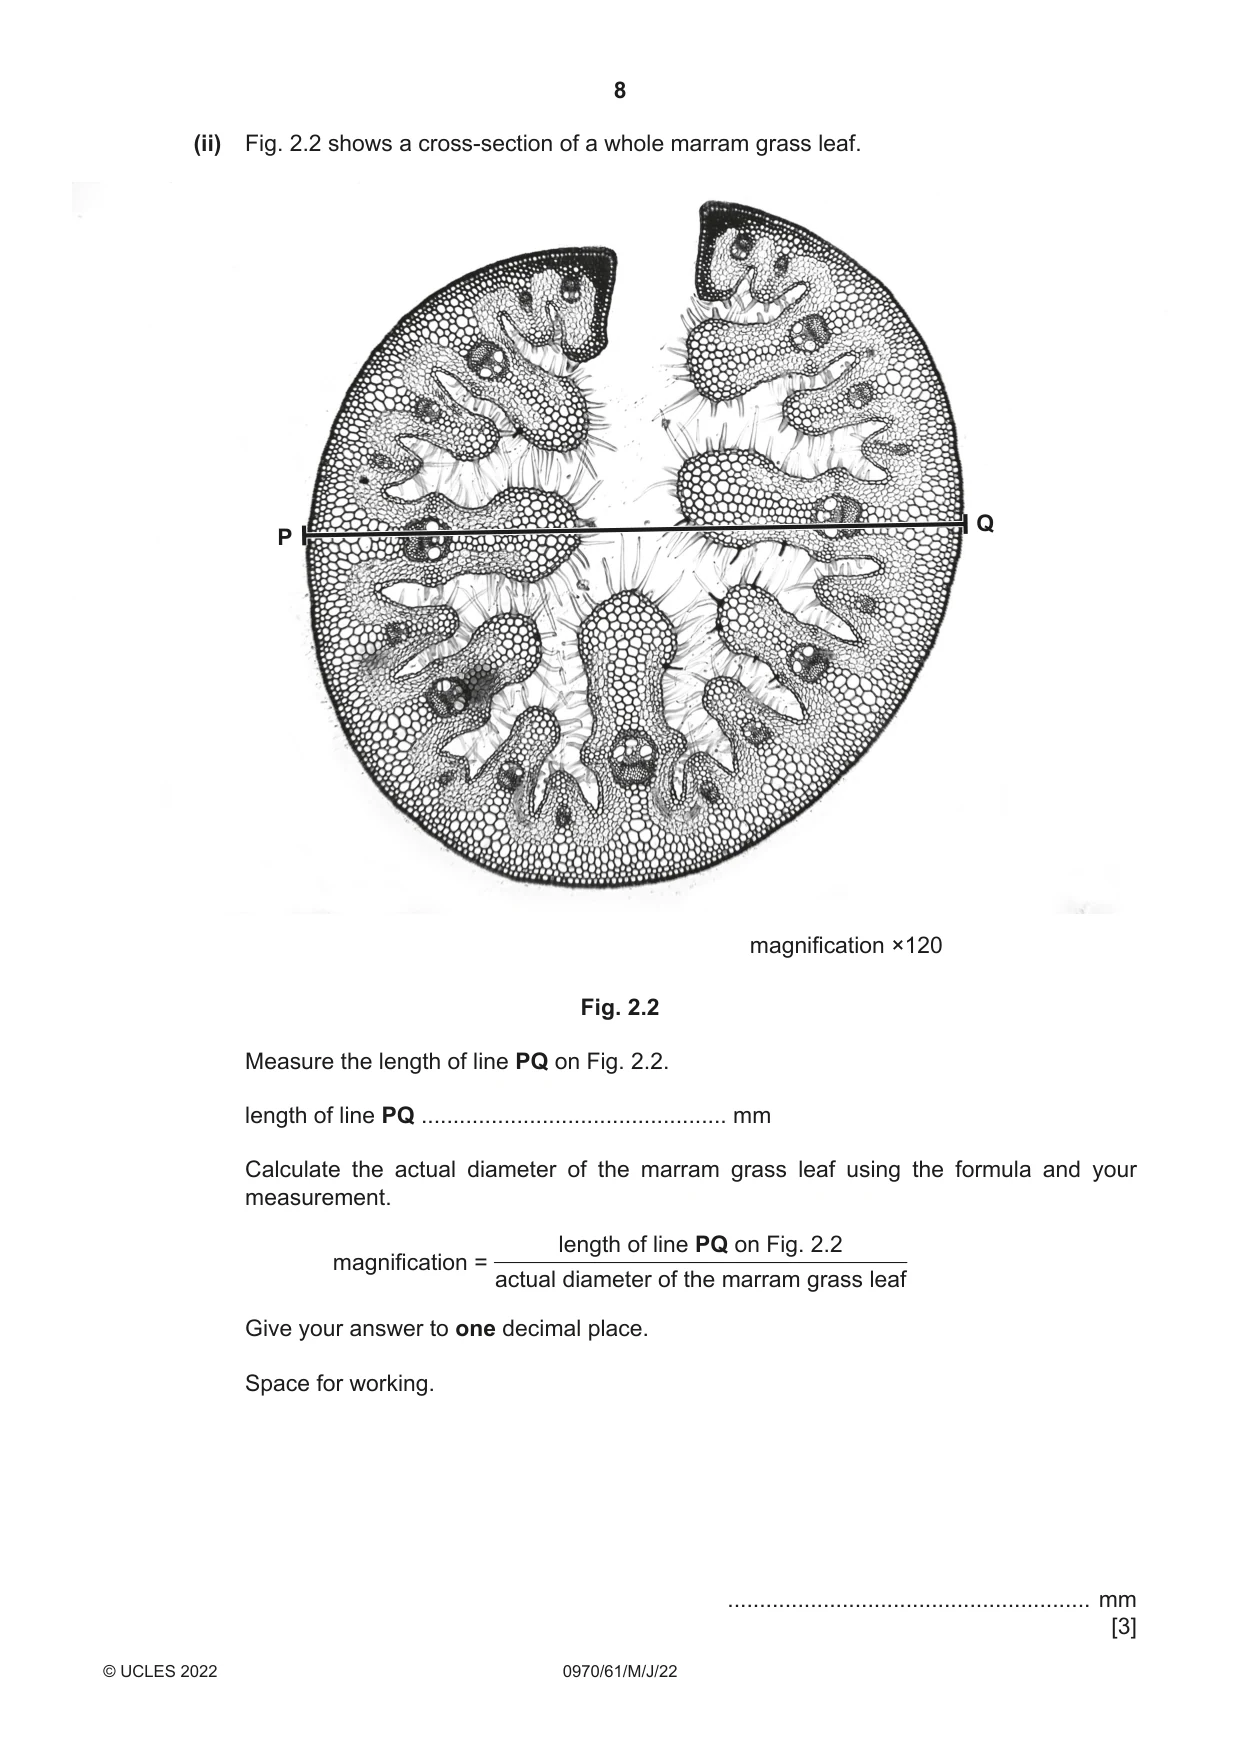
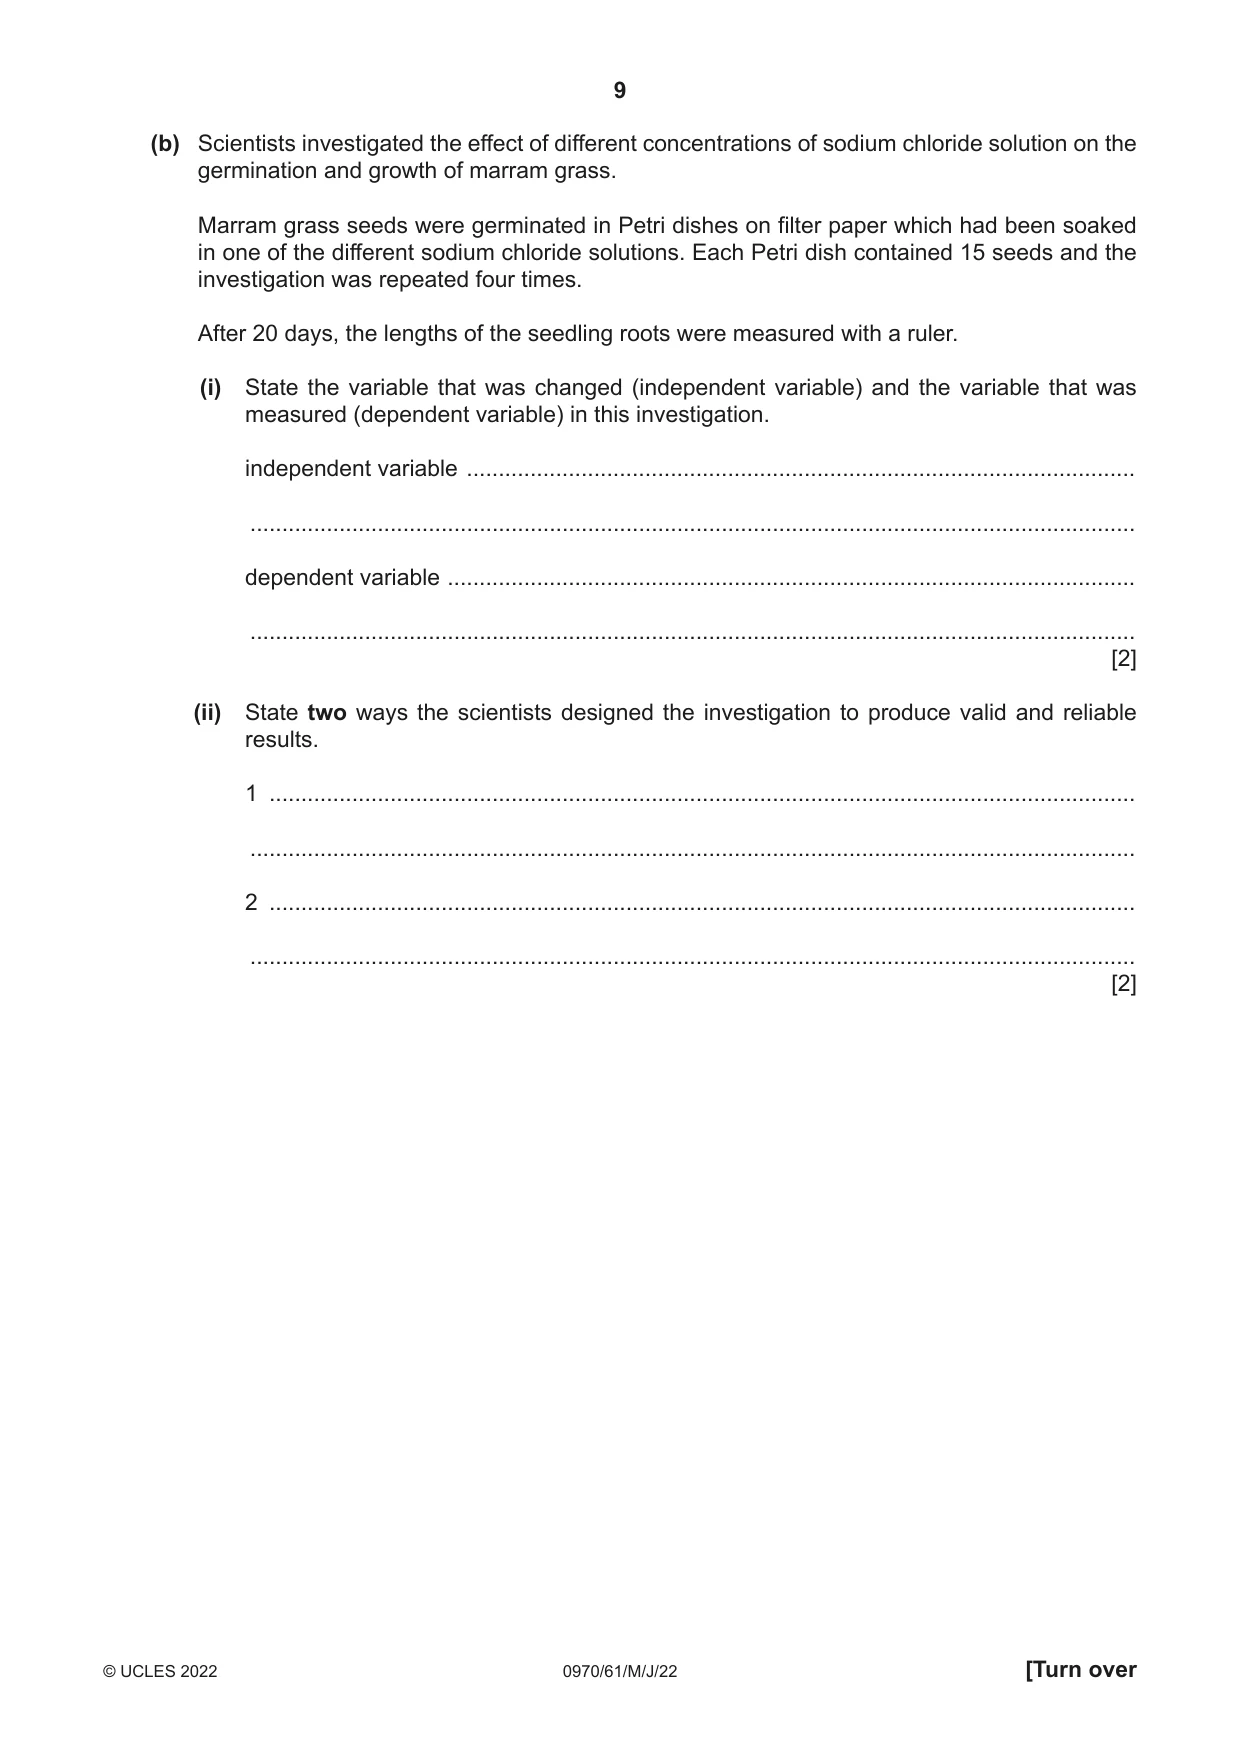
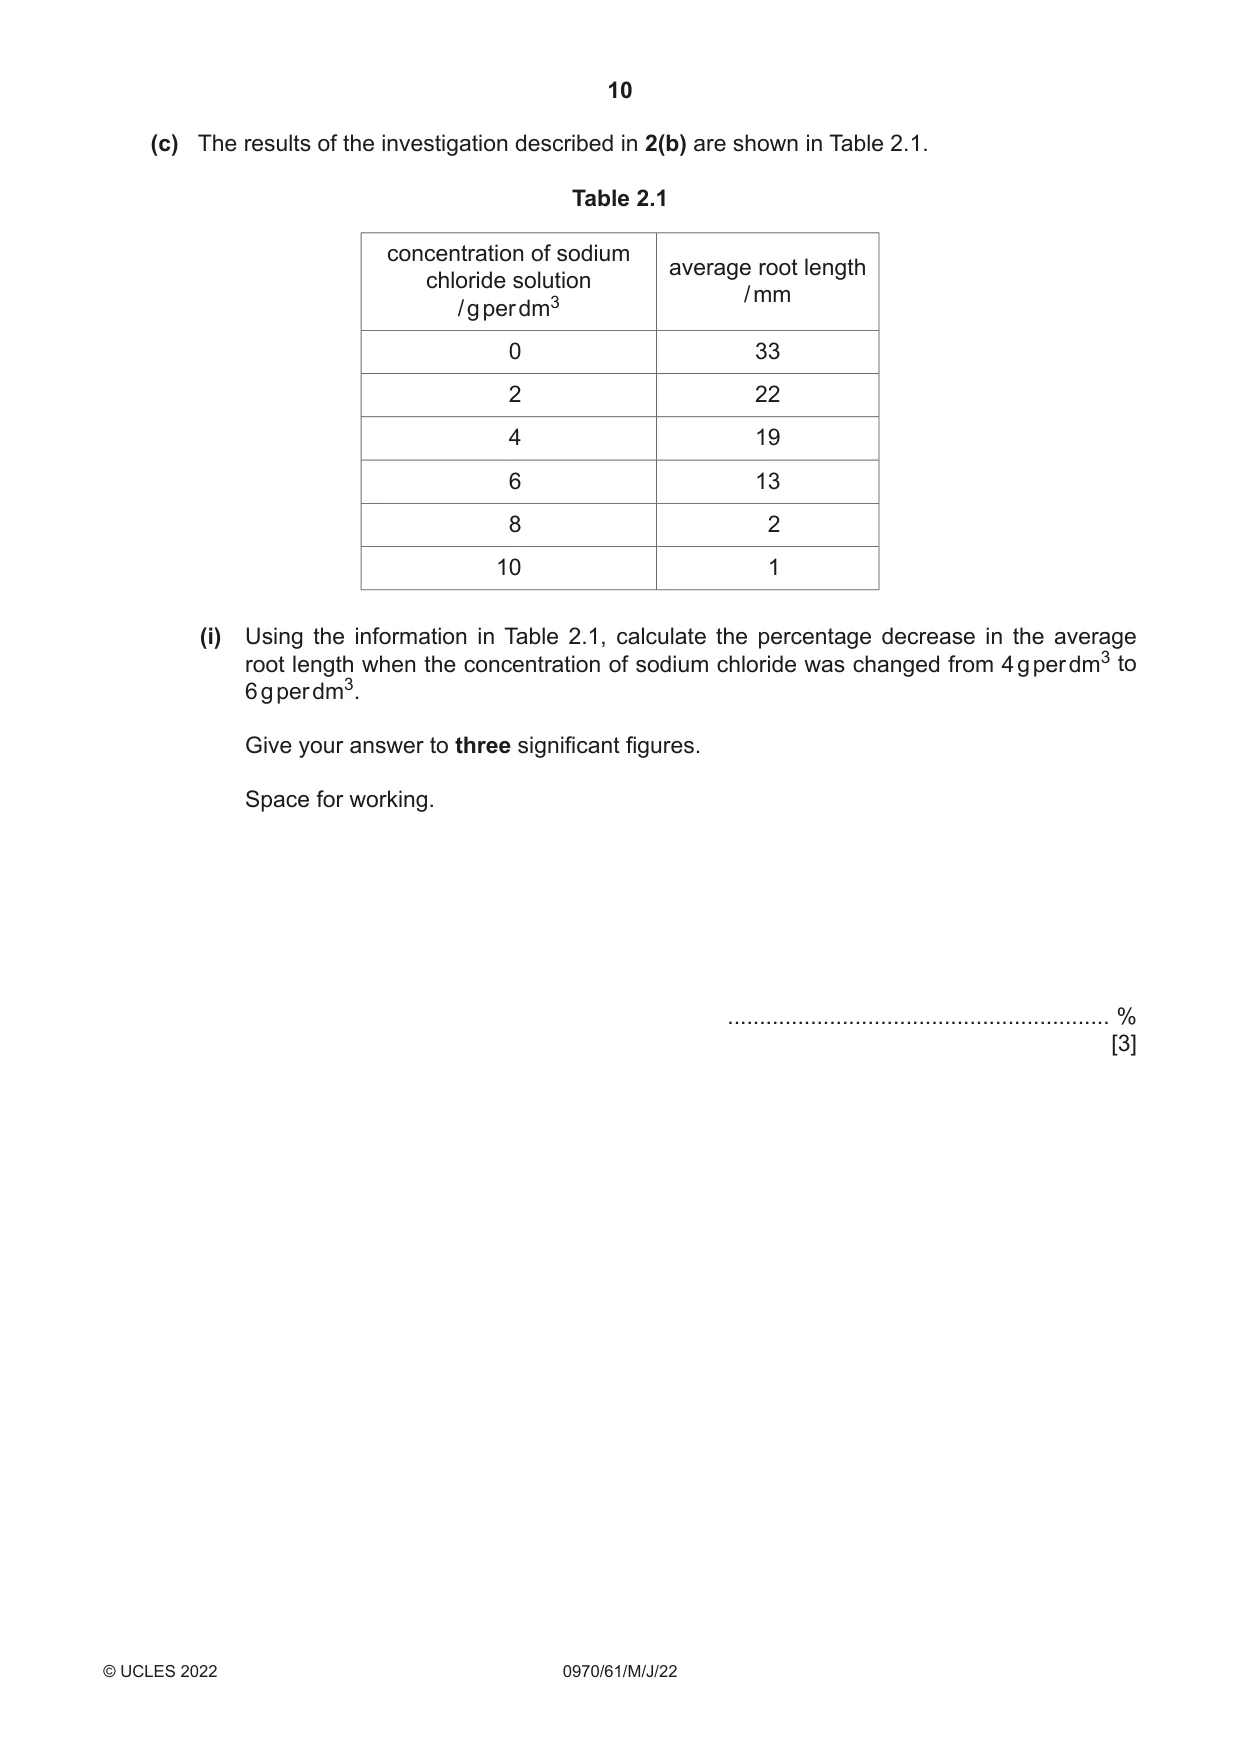
2 Fig. 2.1 is a photomicrograph of a section through part of a marram grass leaf, Ammophila arenaria. Fig. 2.1 (a) (i) Draw a large diagram of the section of marram grass leaf shown in Fig. 2.1. Do not draw individual cells. [4] (ii) Fig. 2.2 shows a cross-section of a whole marram grass leaf. Q P magnification ×120 Fig. 2.2 Measure the length of line PQ on Fig. 2.2. length of line PQ ................................................ mm Calculate the actual diameter of the marram grass leaf using the formula and your measurement. length of line PQ on Fig. 2.2 magnification = actual diameter of the marram grass leaf Give your answer to one decimal place. Space for working. ......................................................... mm [3] (b) Scientists investigated the effect of different concentrations of sodium chloride solution on the germination and growth of marram grass. Marram grass seeds were germinated in Petri dishes on filter paper which had been soaked in one of the different sodium chloride solutions. Each Petri dish contained 15 seeds and the investigation was repeated four times. After 20 days, the lengths of the seedling roots were measured with a ruler. (i) State the variable that was changed (independent variable) and the variable that was measured (dependent variable) in this investigation. independent variable ......................................................................................................... ........................................................................................................................................... dependent variable ............................................................................................................ ........................................................................................................................................... [2] (ii) State two ways the scientists designed the investigation to produce valid and reliable results. 1 ........................................................................................................................................ ........................................................................................................................................... 2 ........................................................................................................................................ ........................................................................................................................................... [2]
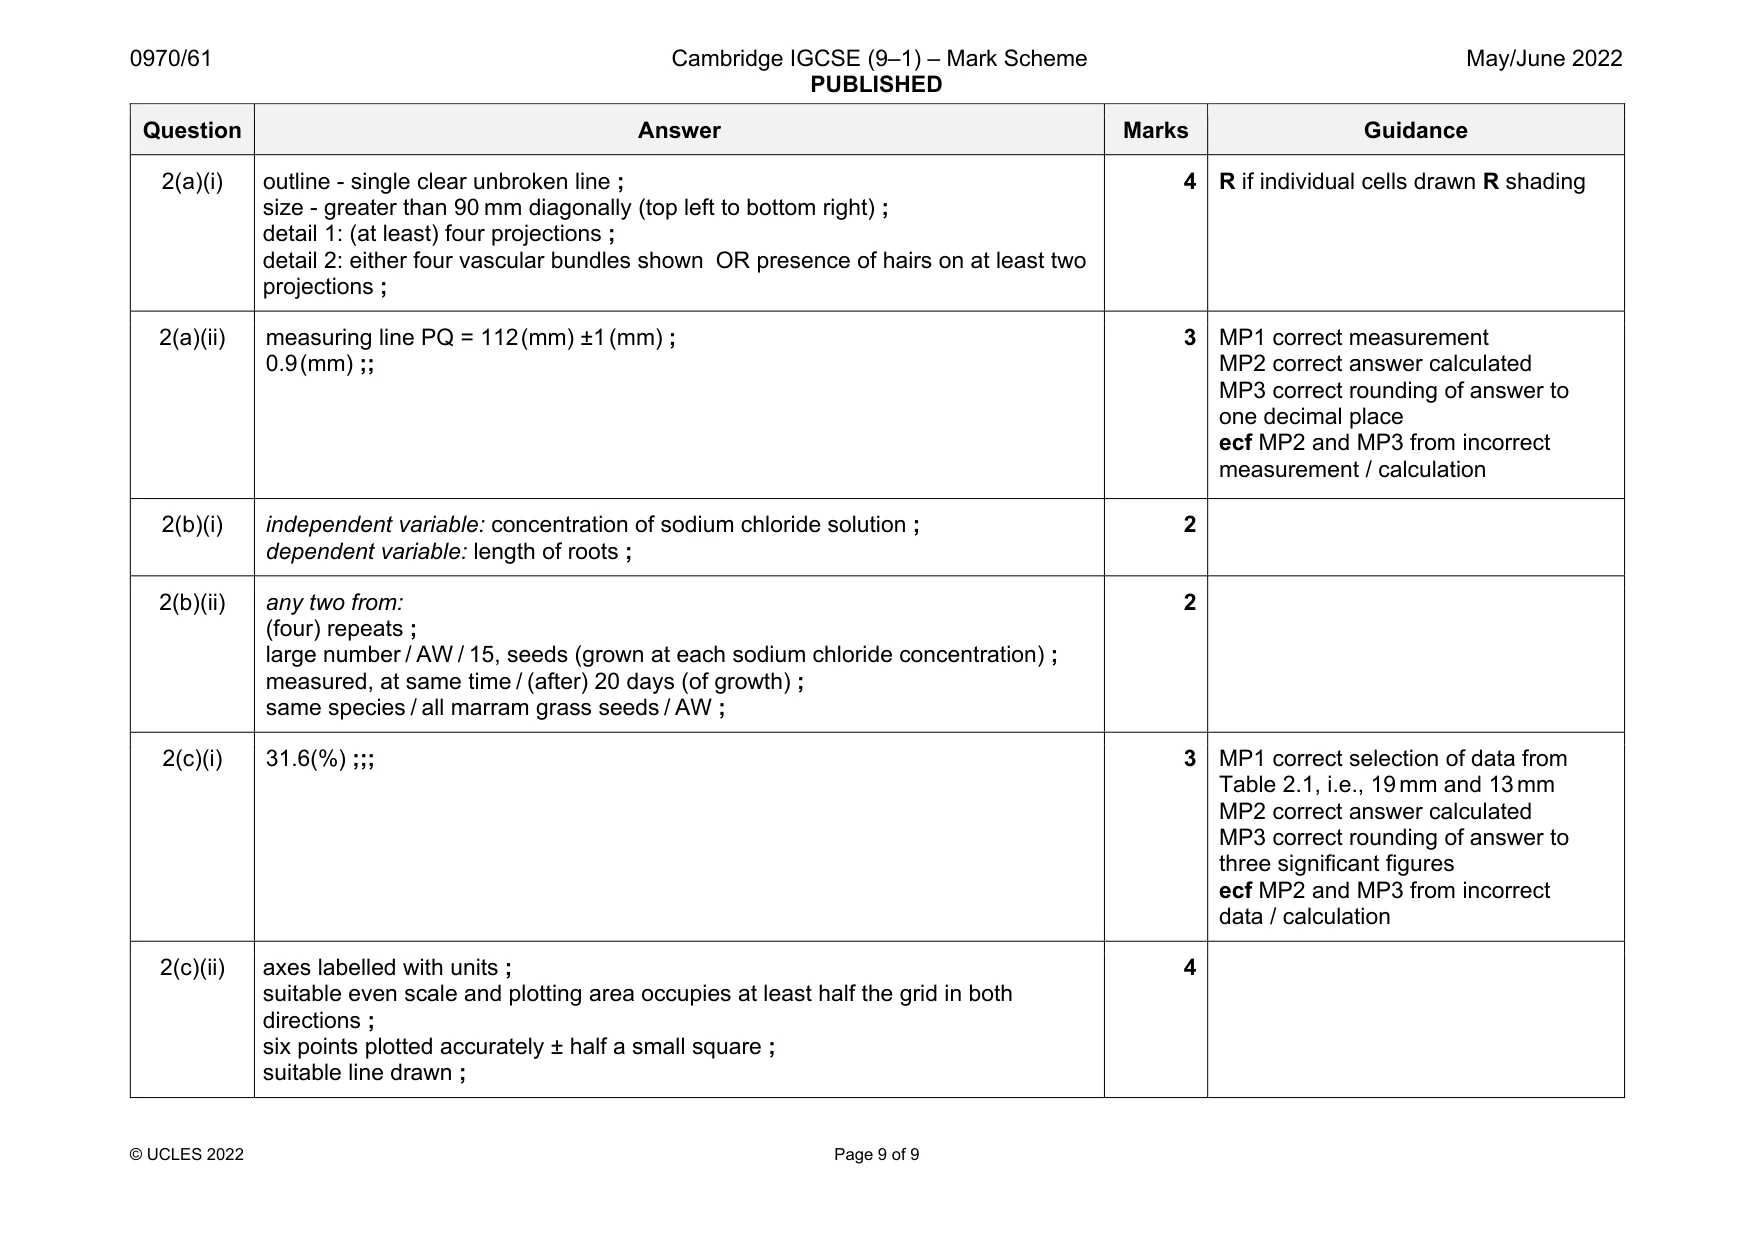
Mark scheme: 2(a)(i) outline - single clear unbroken line ; size - greater than 90 mm diagonally (top left to bottom right) ; detail 1: (at least) four projections ; detail 2: either four vascular bundles shown OR presence of hairs on at least two projections ; 4 R if individual cells drawn R shading 2(a)(ii) measuring line PQ = 112 (mm) ±1 (mm) ; 0.9 (mm) ;; 3 MP1 correct measurement MP2 correct answer calculated MP3 correct rounding of answer to one decimal place ecf MP2 and MP3 from incorrect measurement / calculation 2(b)(i) independent variable: concentration of sodium chloride solution ; dependent variable: length of roots ; 2 2(b)(ii) any two from: (four) repeats ; large number / AW / 15, seeds (grown at each sodium chloride concentration) ; measured, at same time / (after) 20 days (of growth) ; same species / all marram grass seeds / AW ; 2 2(c)(i) 31.6(%) ;;; 3 MP1 correct selection of data from Table 2.1, i.e., 19 mm and 13 mm MP2 correct answer calculated MP3 correct rounding of answer to three significant figures ecf MP2 and MP3 from incorrect data / calculation 2(c)(ii) axes labelled with units ; suitable even scale and plotting area occupies at least half the grid in both directions ; six points plotted accurately ± half a small square ; suitable line drawn ; 4
What was in this paper
The subtopics covered by these 2 questions, and how many questions each got. Open one in a new tab to see every Cambridge question on it.
What you needed in this session
Cambridge’s own grade thresholds for 2022 May/June, Paper 6 · Variant 1. A higher threshold means an easier paper — the bar moves with how the cohort did.