Questions as text
Q1 · Eggs are sold in boxes of 20 9709/61 May/June 2017
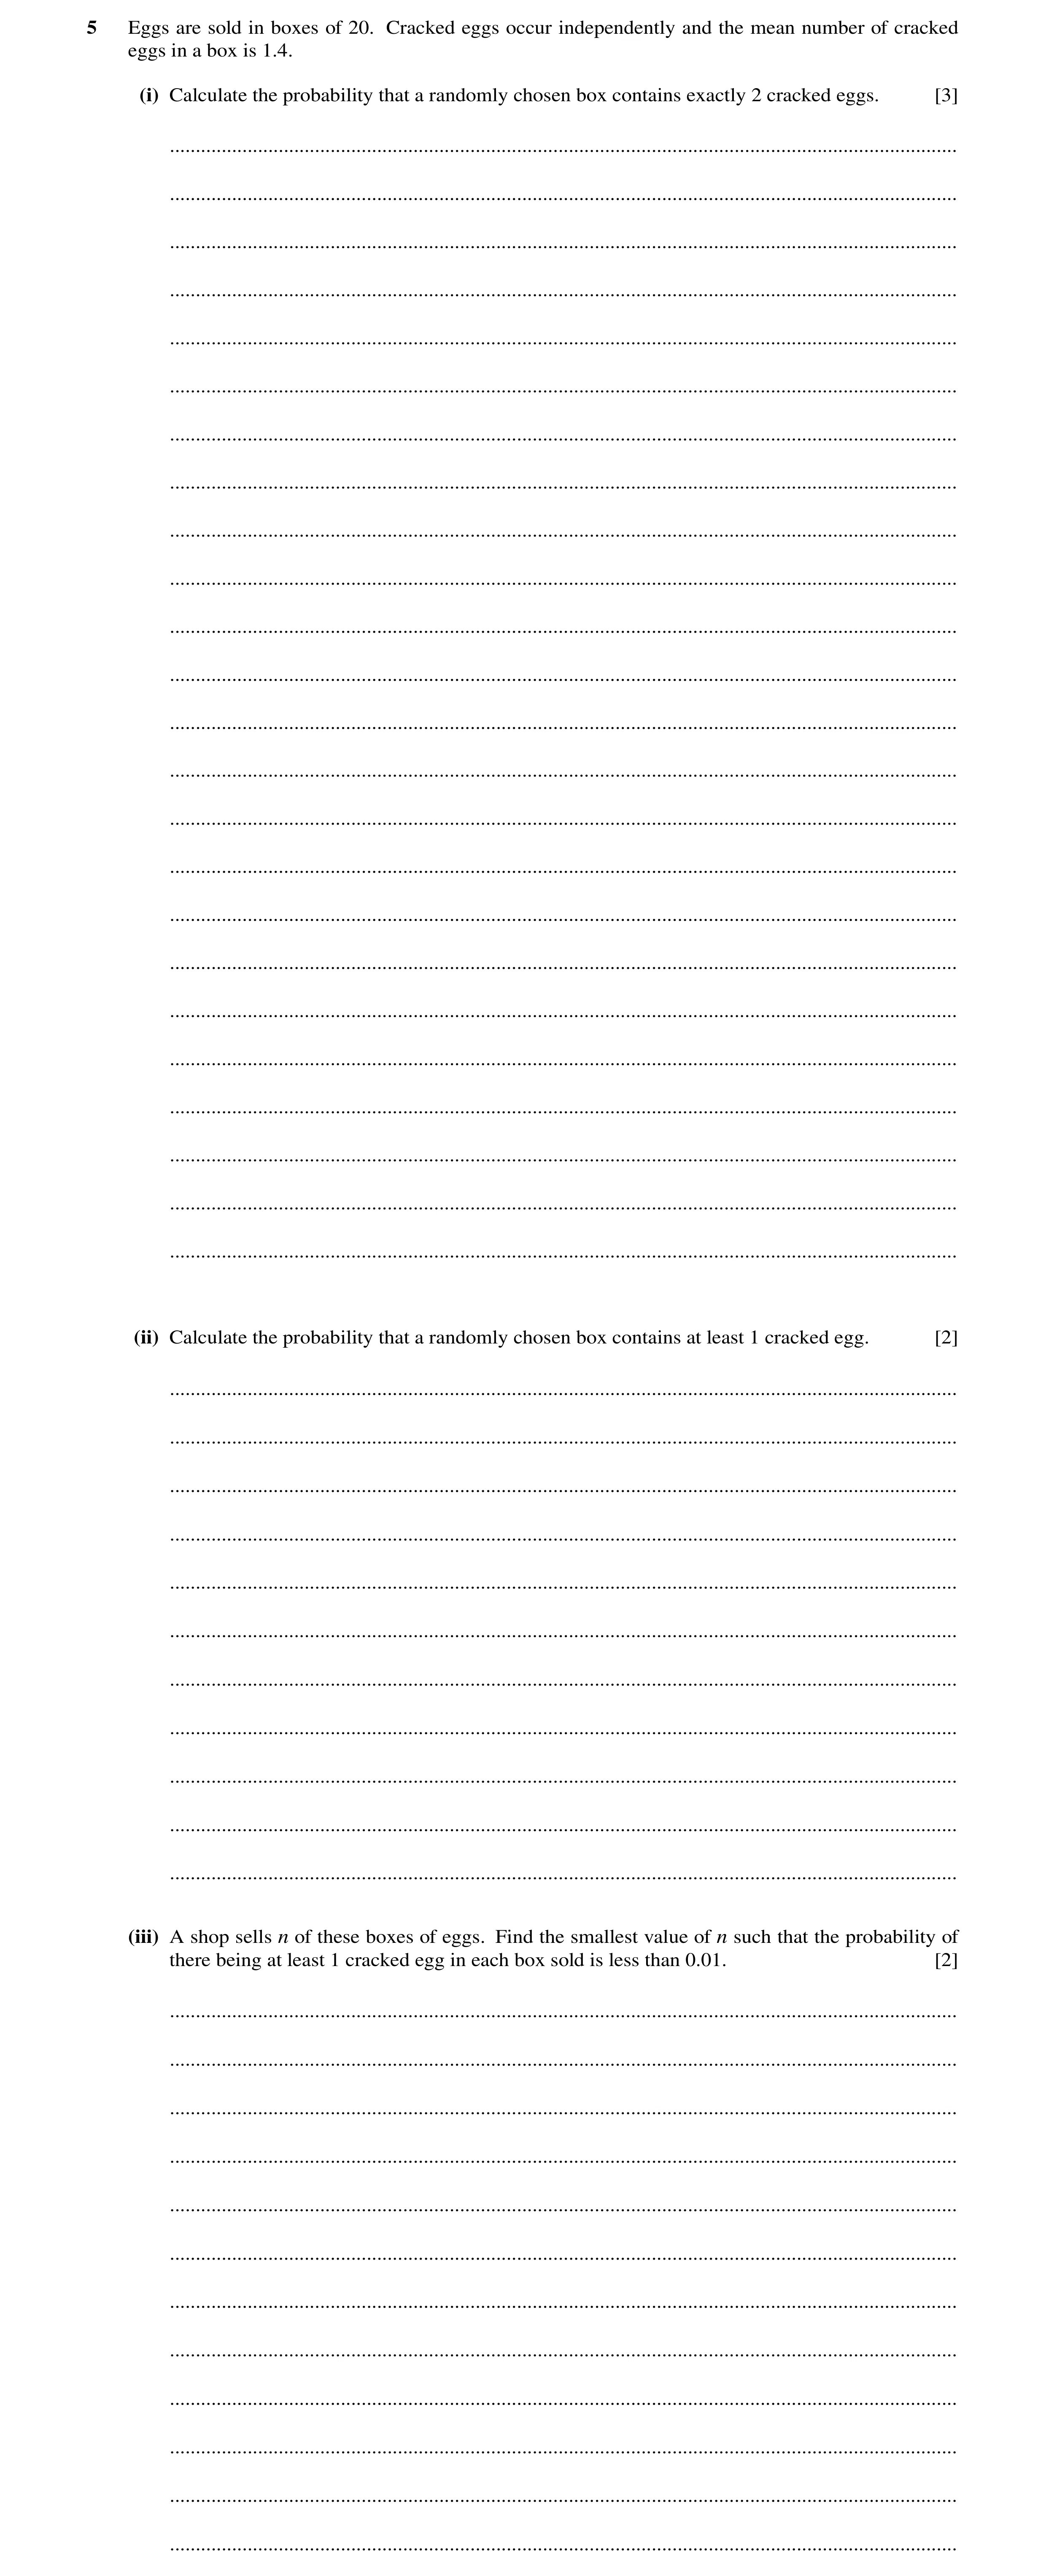
5 Eggs are sold in boxes of 20. Cracked eggs occur independently and the mean number of cracked eggs in a box is 1.4. (i) Calculate the probability that a randomly chosen box contains exactly 2 cracked eggs. [3] … … … … … … … … … … … … … … … … … … … … … … … … (ii) Calculate the probability that a randomly chosen box contains at least 1 cracked egg. [2] … … … … … … … … … … … (iii) A shop sells n of these boxes of eggs. Find the smallest value of n such that the probability of there being at least 1 cracked egg in each box sold is less than 0.01. [2] … … … … … … … … … … … …
7 marks
Mark scheme: 5(i) p = 0.07 B1 ( ) ( ) ( ) 2 18 20 2 P 2 C 0.07 0.93 = M1 Bin term ( ) 20 20C 1 − − x x x p p their p = 0.252 A1 Total: 3 5(ii) P(at least 1 cracked egg)=1–(0.93)20=1–0.2342 M1 Attempt to find P(at least1 cracked egg) with their p from (i) allow 1 – P(0, 1) OE = 0.766 A1 Rounding to 0.766 Total: 2 5(iii) (0.7658)n<0.01 M1 Eqn or inequal containing (their 0.766)n or (their 0.234)n, together with 0.01 or 0.99 n = 18 A1 Total: 2
This question in 9709/61 May/June 2017
Q2 · The lifetimes, in hours, of a particular type of light bulb are normally distributed with… 9709/63 Oct/Nov 2018
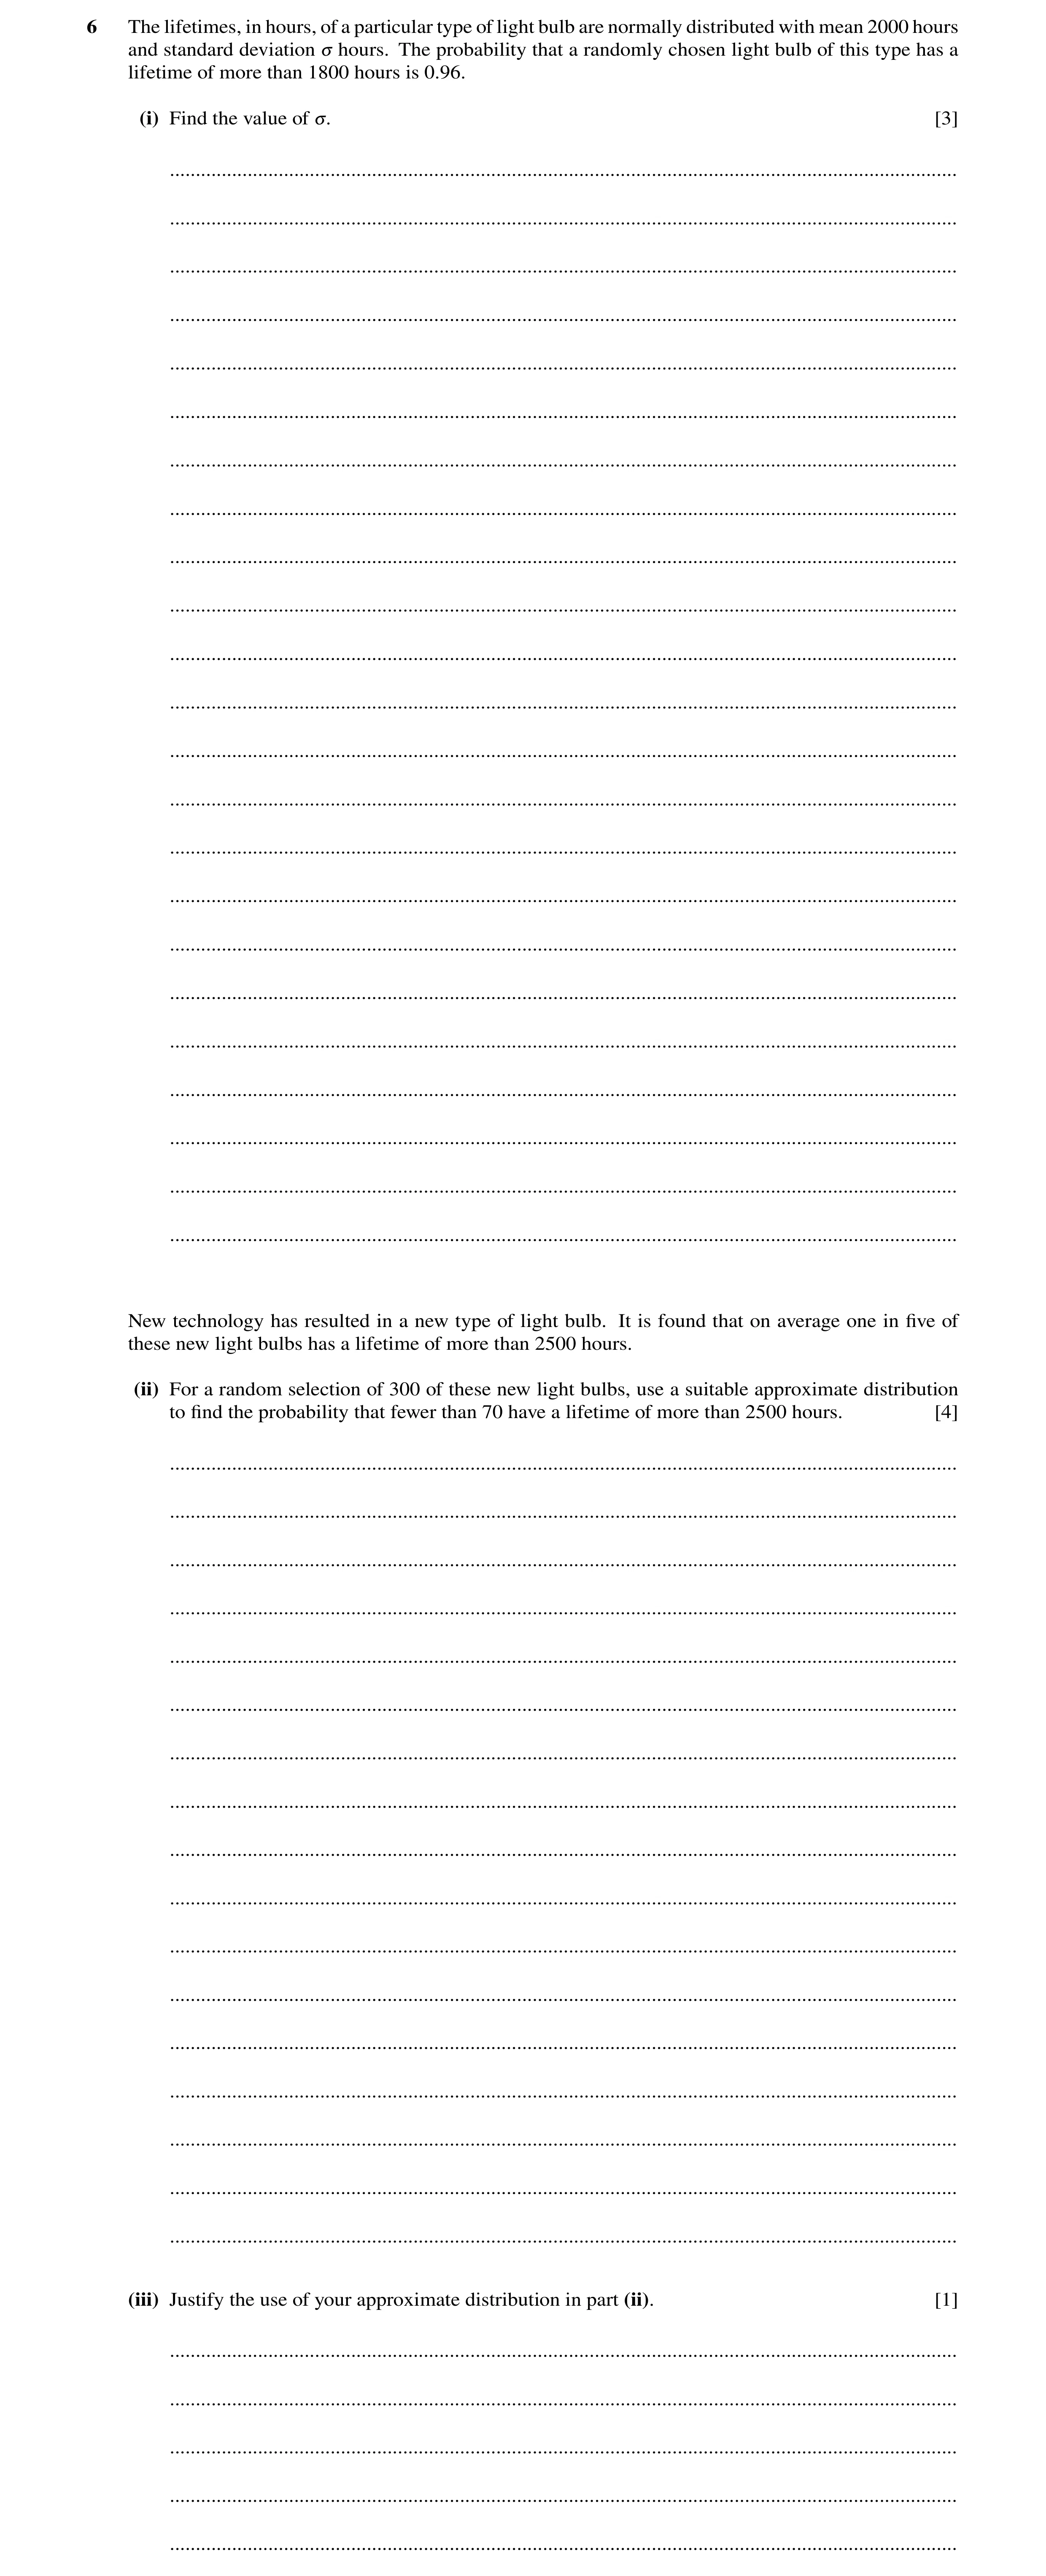
6 The lifetimes, in hours, of a particular type of light bulb are normally distributed with mean 2000 hours and standard deviation 3 hours. The probability that a randomly chosen light bulb of this type has a lifetime of more than 1800 hours is 0.96. (i) Find the value of 3. [3] … … … … … … … … … … … … … … … … … … … … … … … New technology has resulted in a new type of light bulb. It is found that on average one in five of these new light bulbs has a lifetime of more than 2500 hours. (ii) For a random selection of 300 of these new light bulbs, use a suitable approximate distribution to find the probability that fewer than 70 have a lifetime of more than 2500 hours. [4] … … … … … … … … … … … … … … … … … (iii) Justify the use of your approximate distribution in part (ii). [1] … … … … …
8 marks
Mark scheme: 6(i) P(X >1800) = 0.96, so P( 1800 2000 Z σ > ) = 0.96 B1 ± 1.75 seen 200 Φ( ) σ = 0.96 200 1.751 σ = M1 1800 2000 z σ − = ± , allow cc, allow sq rt, allow sq equated to a z-value 114 σ = A1 Correct final answer www 3 6(ii) Mean = 300 × 0.2 = 60 and variance = 300 × 0.2 × 0.8 = 48 B1 Correct unsimplified mean and variance P(X < 70) = P( 69.5 60 48 Z − > ) M1 Z = ± 60 48 x their their − = ( ) Φ 1.371 M1 69.5 or 70.5 seen in an attempted standardisation expression as cc =0.915 A1 Correct final answer 4 6(iii) np = 60, nq = 240: both > 5, (so normal approximation holds) B1 Both parts evaluated are required 1
This question in 9709/63 Oct/Nov 2018
Q3 · The number of accidents on a certain road has a Poisson distribution with mean 0.4 per… 9709/62 Feb/March 2020
4 The number of accidents on a certain road has a Poisson distribution with mean 0.4 per 50-day period. (a) Find the probability that there will be fewer than 3 accidents during a year (365 days). [3] … … … … … … … … … … (b) The probability that there will be no accidents during a period of n days is greater than 0.95. Find the largest possible value of n. [4] … … … … … … … … … … … …
7 marks
Mark scheme: 4(a) λ (= 0.4 × 365 ÷ 50) = 2.92 B1 e–2.92(1 + 2.92 + 2 2.92 2 ) M1 Any λ. Allow one end error = 0.441 (3 sf) A1 3 4(b) e–λ > 0.95 M1 Allow ‘=’ throughout –λ > ln 0.95 or λ < 0.051293 OE M1 Attempt ln both sides ‘0.051293’ × 50 ÷ 0.4 (= 6.411) M1 Largest n is 6 (3 sf) Allow n = 6 or n ⩽ 6 (NOT n < 6 or n ⩾ 6 as final answer) A1 SC Trial and Improvement M1 for e–λ > 0.95 SOI; M1 for 0.4 50 n λ = × ; M1 for use of both n = 6 giving 0.9531 and n = 7 giving 0.9455; A1 n = 6 4
This question in 9709/62 Feb/March 2020
Q4 · The number of absences per week by workers at a factory has the distribution Po 2.1 9709/61 Oct/Nov 2020
5 The number of absences per week by workers at a factory has the distribution Po 2.1 . (a) Find the standard deviation of the number of absences per week. [1] … … … (b) Find the probability that the number of absences in a 2-week period is at least 2. [3] … … … … … … … … … (c) Find the probability that the number of absences in a 3-week period is more than 4 and less than 8. [2] … … … … … … … … … Following a change in working conditions, the management wished to test whether the mean number of absences has decreased. They found that, in a randomly chosen 3-week period, there were exactly 2 absences. (d) Carry out the test at the 10% significance level. [5] … … … … … … … … … … … … … … … (e) State, with a reason, which of the errors, Type I or Type II, might have been made in carrying out the test in part (d). [2] … … … … … …
13 marks
Mark scheme: 5(a) √2.1 or 1.45 (3 sf) B1 1 5(b) λ = 4.2 B1 1 – e–4.2(1 + 4.2) M1 1 – P(X ⩽ 1) any λ, allow one end error. = 0.922 (3 sf) A1 3 5(c) λ = 6.3 5 6 7 6.3 6.3 6.3 6.3 e 5! 6! 7! − + + M1 P(X = 5, 6, 7) any λ, allow one end error. = 0.455 (3 sf) A1 2 5(d) H0: λ = 6.3 H1: λ < 6.3 B1 Accept µ, accept 2.1 (per week) P(X ⩽ 2) = 2 6.3 6.3 e 1 6.3 2! − + + M1 = 0.0498 or 0.0499 A1 Accept 0.0499 ‘0.0498’ < 0.1 M1 For valid comparison. For CV method the comparison can be ‘2 lies in CR of X ⩽ 2’ There is evidence that mean number of absences has decreased. A1 FT In context, not definite, e.g. not ‘Mean number of absences has decreased.’ No contradictions. 5 Question Answer Marks Guidance 5(e) H0 rejected *B1 FT OE Hence Type I error possible DB1 FT 2
This question in 9709/61 Oct/Nov 2020
Q5 · On average, 1 in 50 000 people have a certain gene 9709/62 Oct/Nov 2020
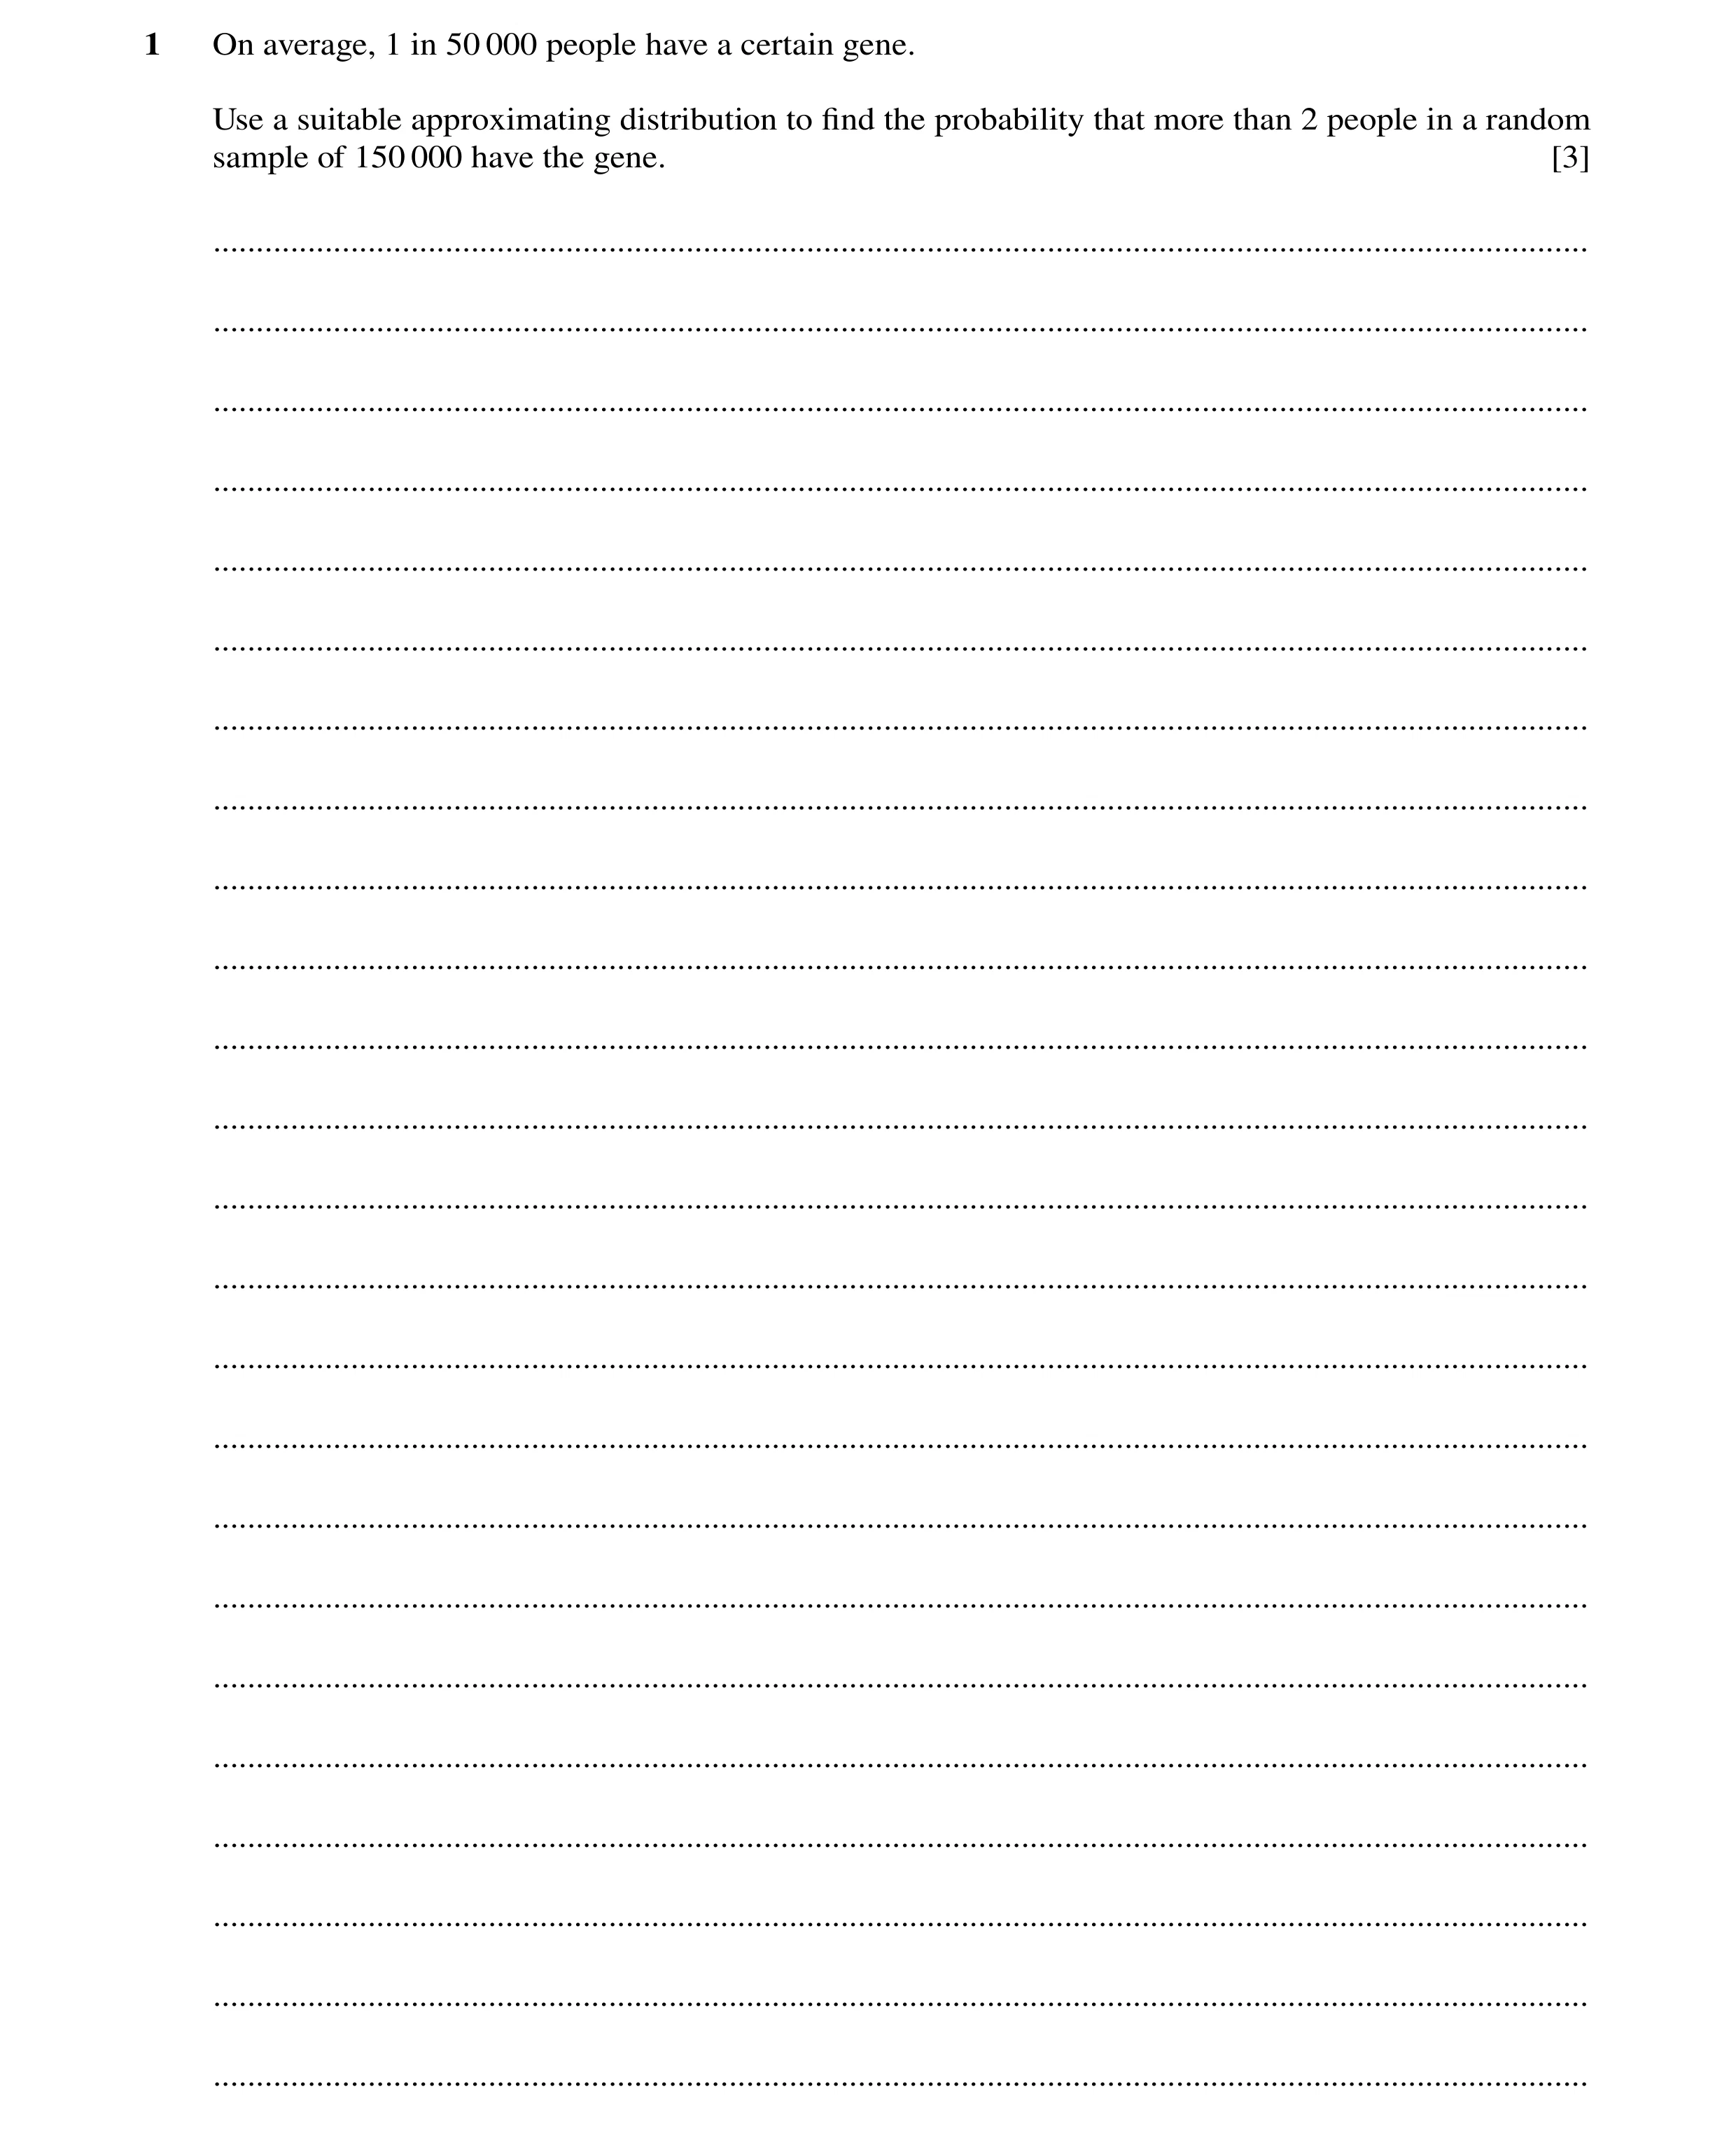
1 On average, 1 in 50 000 people have a certain gene. Use a suitable approximating distribution to find the probability that more than 2 people in a random sample of 150 000 have the gene. [3] … … … … … … … … … … … … … … … … … … … … … … … …
3 marks
Mark scheme: 1 Poisson, any λ M1 Used 1 – e–3 23 1 3 2 + + M1 Allow one end error = 0.577 (3sf) A1 SC Use of Binomial (or unsupported correct answer) scores B1 only 3
This question in 9709/62 Oct/Nov 2020
Q6 · The number of absences per week by workers at a factory has the distribution Po 2.1 9709/63 Oct/Nov 2020
5 The number of absences per week by workers at a factory has the distribution Po 2.1 . (a) Find the standard deviation of the number of absences per week. [1] … … … (b) Find the probability that the number of absences in a 2-week period is at least 2. [3] … … … … … … … … … (c) Find the probability that the number of absences in a 3-week period is more than 4 and less than 8. [2] … … … … … … … … … Following a change in working conditions, the management wished to test whether the mean number of absences has decreased. They found that, in a randomly chosen 3-week period, there were exactly 2 absences. (d) Carry out the test at the 10% significance level. [5] … … … … … … … … … … … … … … … (e) State, with a reason, which of the errors, Type I or Type II, might have been made in carrying out the test in part (d). [2] … … … … … …
13 marks
Mark scheme: 5(a) √2.1 or 1.45 (3 sf) B1 1 5(b) λ = 4.2 B1 1 – e–4.2(1 + 4.2) M1 1 – P(X ⩽ 1) any λ, allow one end error. = 0.922 (3 sf) A1 3 5(c) λ = 6.3 5 6 7 6.3 6.3 6.3 6.3 e 5! 6! 7! − + + M1 P(X = 5, 6, 7) any λ, allow one end error. = 0.455 (3 sf) A1 2 5(d) H0: λ = 6.3 H1: λ < 6.3 B1 Accept µ, accept 2.1 (per week) P(X ⩽ 2) = 2 6.3 6.3 e 1 6.3 2! − + + M1 = 0.0498 or 0.0499 A1 Accept 0.0499 ‘0.0498’ < 0.1 M1 For valid comparison. For CV method the comparison can be ‘2 lies in CR of X ⩽ 2’ There is evidence that mean number of absences has decreased. A1 FT In context, not definite, e.g. not ‘Mean number of absences has decreased.’ No contradictions. 5 Question Answer Marks Guidance 5(e) H0 rejected *B1 FT OE Hence Type I error possible DB1 FT 2
This question in 9709/63 Oct/Nov 2020
Q7 · Accidents at two factories occur randomly and independently 9709/61 May/June 2021
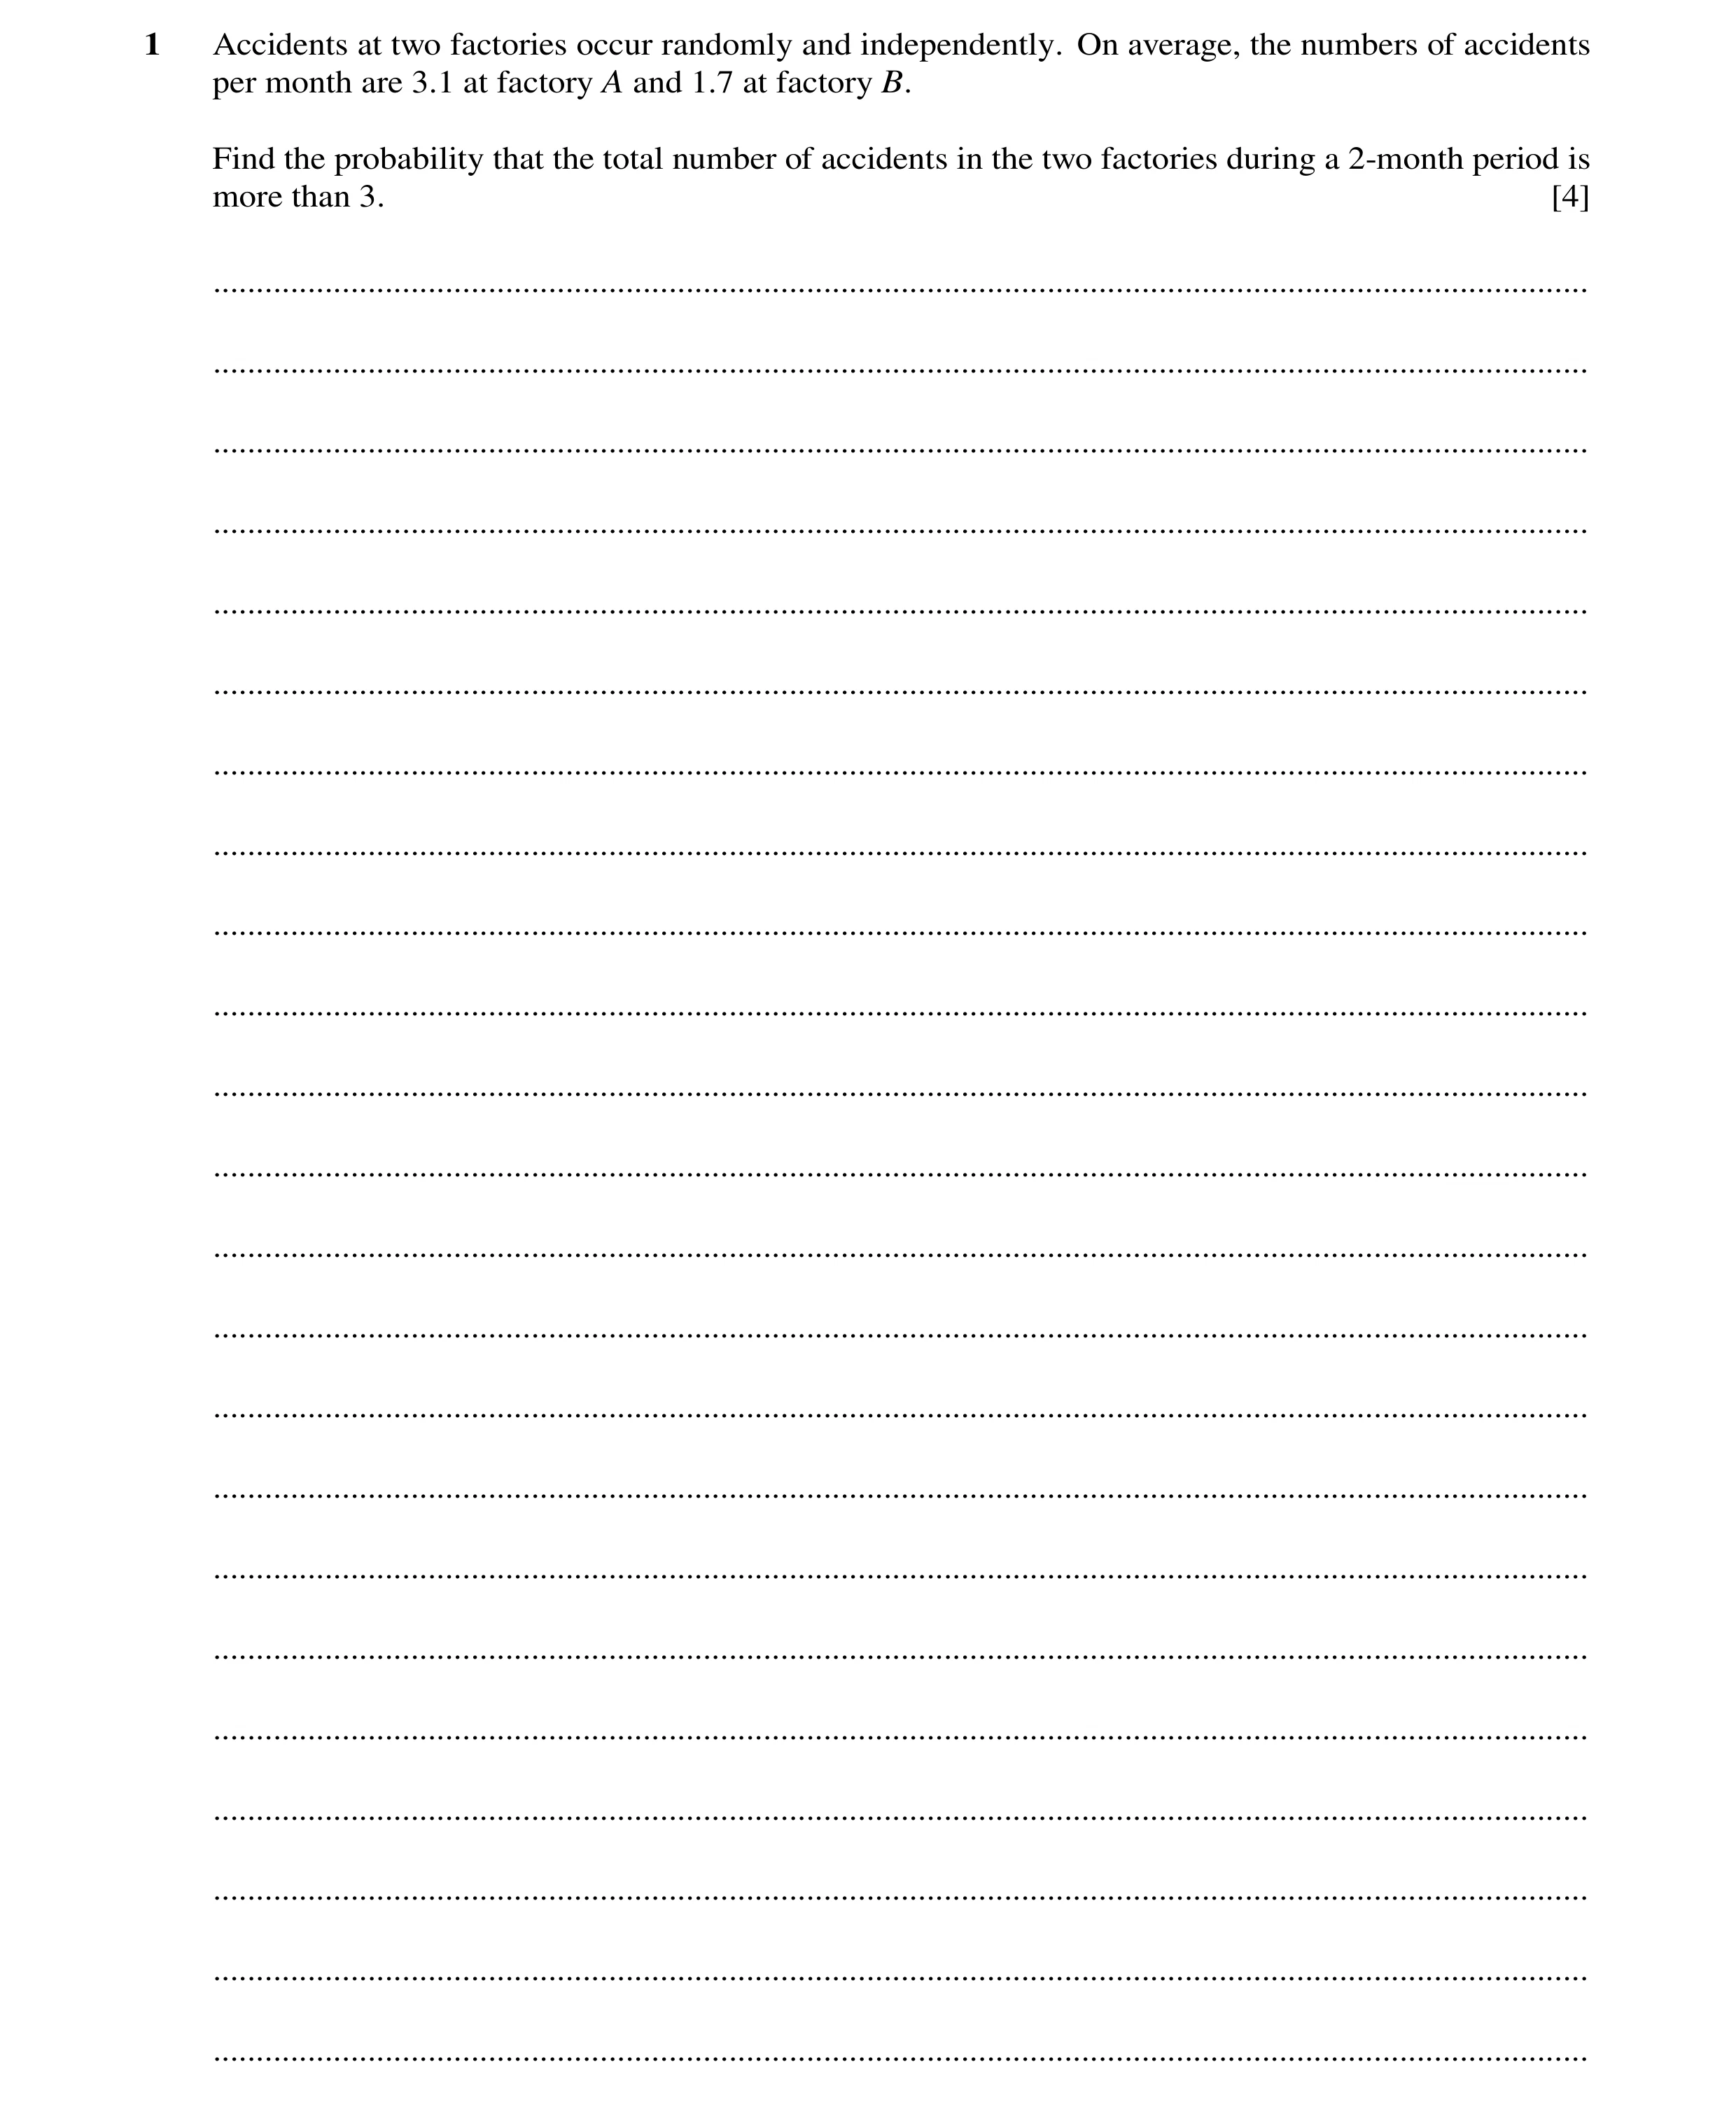
1 Accidents at two factories occur randomly and independently. On average, the numbers of accidents per month are 3.1 at factory A and 1.7 at factory B. Find the probability that the total number of accidents in the two factories during a 2-month period is more than 3. [4] … … … … … … … … … … … … … … … … … … … … … … …
4 marks
Mark scheme: 1 λ = (3.1 + 1.7) × 2 M1 Attempt combined mean. Allow 3.1 + 1.7 for M1 = 9.6 A1 Correct mean 1 – e–9.6 (1 + 9.6 + 2 3 9.6 9.6 2 3! ) + M1 Allow incorrect mean. Allow one end error. = 0.986 (3 sf) A1 SC If 9.6 seen and unsupported 0.986 M1A1B1. SC Unsupported correct answer of 0.986 only if 9.6 also not seen scores B2 only. 4
This question in 9709/61 May/June 2021
Q8 · Customers arrive at a particular shop at random times 9709/62 May/June 2021
7 Customers arrive at a particular shop at random times. It has been found that the mean number of customers who arrive during a 5-minute interval is 2.1. (a) Find the probability that exactly 4 customers arrive during a 10-minute interval. [2] … … … … … … … … … … … (b) Find the probability that at least 4 customers arrive during a 20-minute interval. [2] … … … … … … … … … … … (c) Use a suitable approximating distribution to find the probability that fewer than 40 customers arrive during a 2-hour interval. [4] … … … … … … … … … … … … … … … … … … … … … … … … …
8 marks
Mark scheme: 7(a) 4.2 e− × 4 4.2 4! 0.194 (3 sf) A1 As final answer. SC Unsupported correct answer scores B1 only. 2 7(b) 2 3 8.4 8.4 8.4 1 e 1 8.4 2 3! − − + + + M1 Allow M1 with incorrect λ. Accept one end error. 0.968 (3 sf) A1 As final answer. SC Unsupported correct answer scores B1 only. 2 7(c) N(50.4, 50.4) M1 SOI 39.5 50.4 50.4 − [= –1.535] M1 Allow wrong or no continuity correction. Must have √ Φ(‘–1.535’) = 1 – Φ(‘1.535’) M1 For correct probability area consistent with their working. 0.0624 (3 sf) or 0.0623 A1 4
This question in 9709/62 May/June 2021
Q9 · The number of goals scored by a team in a match is independent of other matches, and is… 9709/63 May/June 2021
1 The number of goals scored by a team in a match is independent of other matches, and is denoted by the random variable X, which has a Poisson distribution with mean 1.36. A supporter offers to make a donation of $5 to the team for each goal that they score in the next 10 matches. Find the expectation and standard deviation of the amount that the supporter will pay. [5] … … … … … … … … … … … … … … … … … … … … … … …
5 marks
Mark scheme: 1 λ = 10 × 1.36 [= 13.6] M1 E(amount) = 5 × 13.6 = [$]68 A1 Var(amount) = 52 × 13.6 [= 340] M1 52 × … M1 … × their λ Standard Deviation = [$]18.4(4) (3 s.f.) A1 CAO condone 2 85 5
This question in 9709/63 May/June 2021
Q10 · The local council claims that the average number of accidents per year on a particular… 9709/63 May/June 2021
3 The local council claims that the average number of accidents per year on a particular road is 0.8. Jane claims that the true average is greater than 0.8. She looks at the records for a random sample of 3 recent years and finds that the total number of accidents during those 3 years was 5. (a) Assume that the number of accidents per year follows a Poisson distribution. (i) State null and alternative hypotheses for a test of Jane’s claim. [1] … … … (ii) Test at the 5% significance level whether Jane’s claim is justified. [4] … … … … … … … … … … (b) Jane finds that the number of accidents per year has been gradually increasing over recent years. State how this might affect the validity of the test carried out in part (a)(ii). [1] … … … … … …
6 marks
Mark scheme: 3(a)(i) H0: λ = 2.4 H1: λ > 2.4 B1 Accept λ or µ Accept 2.4 or 0.8 (per year) 1 3(a)(ii) 1 – e–2.4(1 + 2.4 + 2 3 4 2.4 2.4 2.4 2 3! 4! + + ) M1 Any λ; allow one end error 0.0959 (3 sf) A1 SC unsupported answer 0.0959 scores B1 only not M1A1 0.0959 > 0.05 M1 Valid comparison Use of 0.9041 < 0.95 can recover either M1A1 or B1 There is evidence that Jane’s claim not justified or There is insufficient evidence to support Jane’s claim A1 FT OE. In context, not definite, e.g. not ‘Jane is wrong’, no contradictions. Condone omission of Jane. 4 3(b) Mean not constant so Poisson model not valid B1 1
This question in 9709/63 May/June 2021
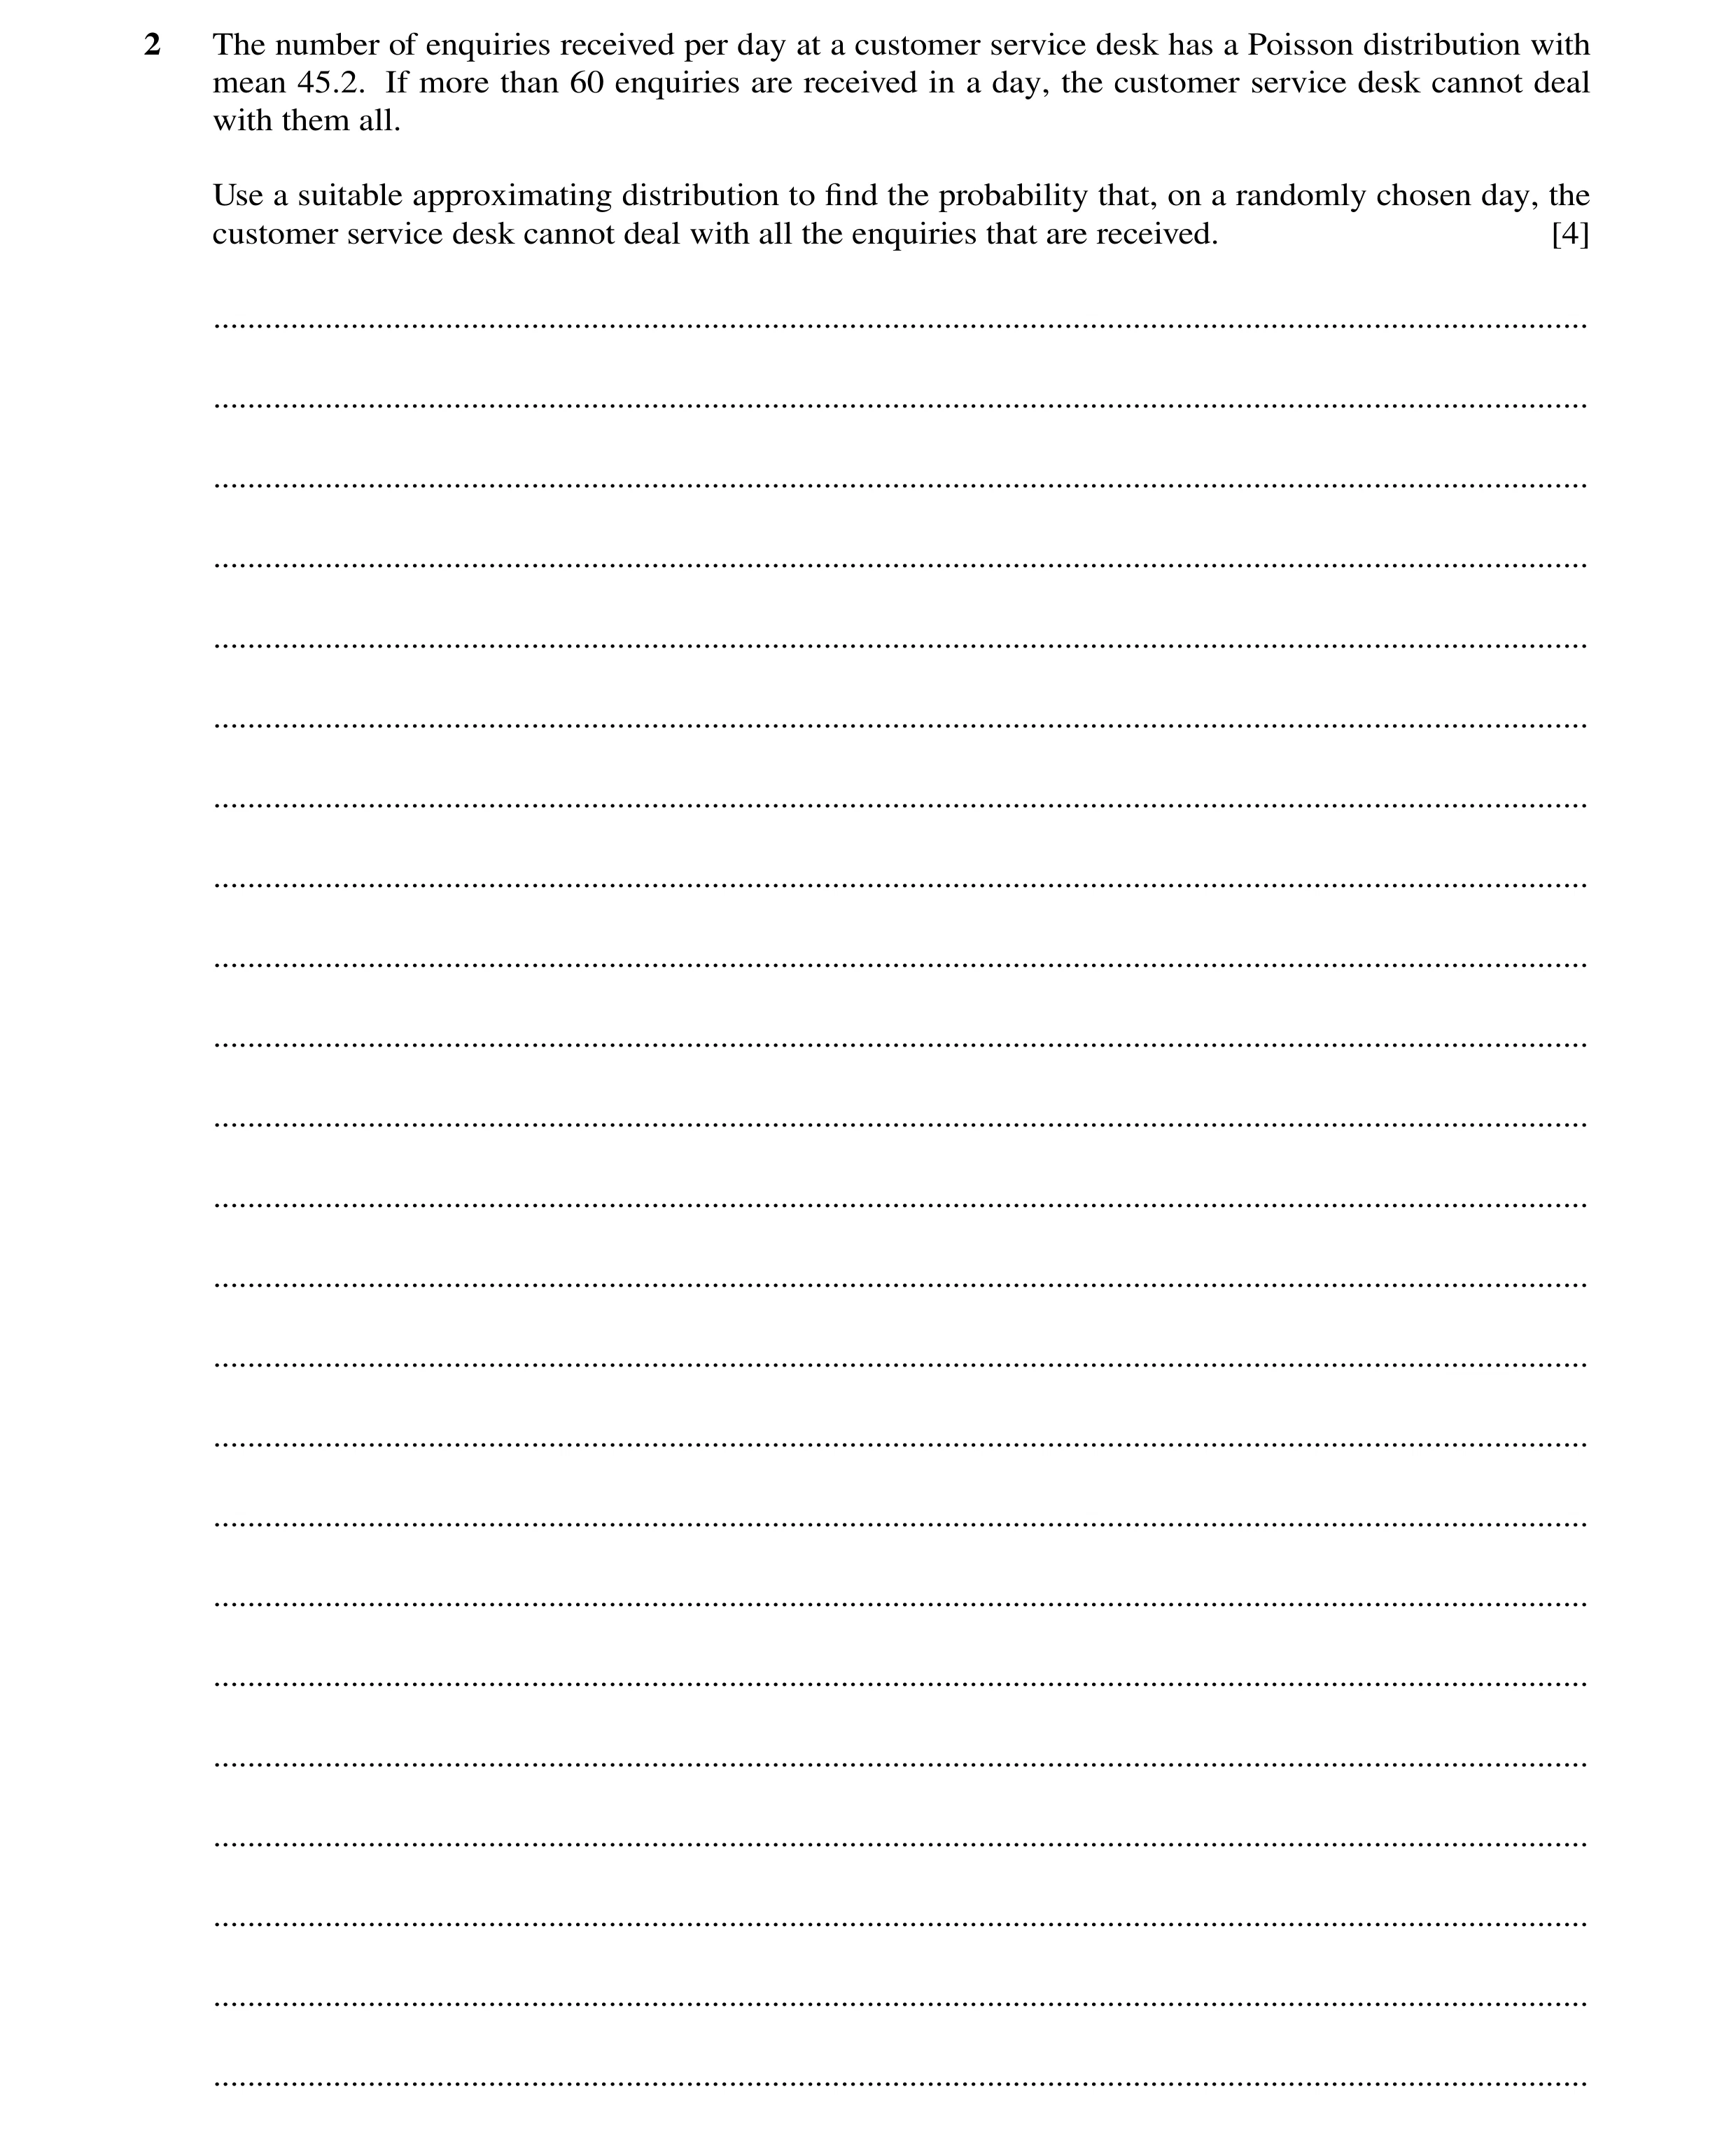
Q11 · The number of enquiries received per day at a customer service desk has a Poisson… 9709/61 Oct/Nov 2021
2 The number of enquiries received per day at a customer service desk has a Poisson distribution with mean 45.2. If more than 60 enquiries are received in a day, the customer service desk cannot deal with them all. Use a suitable approximating distribution to find the probability that, on a randomly chosen day, the customer service desk cannot deal with all the enquiries that are received. [4] … … … … … … … … … … … … … … … … … … … … … … …
4 marks
Mark scheme: 2 N(45.2, 45.2) B1 SOI 60.5 45.2 45.2 − [= 2.276] M1 Allow with wrong or no continuity correction. 1 –ɸ(‘2.276’) M1 0.0114 A1 4
This question in 9709/61 Oct/Nov 2021
Q12 · In a certain large document, typing errors occur at random and at a constant mean rate of… 9709/62 Oct/Nov 2021
5 In a certain large document, typing errors occur at random and at a constant mean rate of 0.2 per page. (a) Find the probability that there are fewer than 3 typing errors in 10 randomly chosen pages. [2] … … … … … … … … … (b) Use an approximating distribution to find the probability that there are more than 50 typing errors in 200 randomly chosen pages. [4] … … … … … … … … … … … … … In the same document, formatting errors occur at random and at a constant mean rate of 0.3 per page. (c) Find the probability that the total number of typing and formatting errors in 20 randomly chosen pages is between 8 and 11 inclusive. [3] … … … … … … … … … … … … … … … … … … … … … … … …
9 marks
Mark scheme: 5(a) e–2(1 + 2 + 2 2 2! ) M1 P(X < 3) any λ. Allow one end error. 0.677 (3sf) A1 Unsupported correct answer scores SC B1 only. 2 5(b) N(40, 40) M1 SOI 50.5 40 40 − [= 1.660] M1 For standardising with their values. Allow with wrong or no cc must have square root. P(z > ‘1.660’) = 1 – Φ(‘1.660’) M1 Correct area consistent with their working. 0.0485 or 0.0484 (3sf) A1 4 5(c) λ = 10 B1 Condone mean = 10. 8 9 10 11 10 10 10 10 10 e 8! 9! 10! 11! − + + + M1 Allow any λ (allow one end error). 0.477 (3sf) A1 Unsupported correct answer scores SC B2 only. 3
This question in 9709/62 Oct/Nov 2021
Q13 · The number of enquiries received per day at a customer service desk has a Poisson… 9709/63 Oct/Nov 2021
2 The number of enquiries received per day at a customer service desk has a Poisson distribution with mean 45.2. If more than 60 enquiries are received in a day, the customer service desk cannot deal with them all. Use a suitable approximating distribution to find the probability that, on a randomly chosen day, the customer service desk cannot deal with all the enquiries that are received. [4] … … … … … … … … … … … … … … … … … … … … … … …
4 marks
Mark scheme: 2 N(45.2, 45.2) B1 SOI 60.5 45.2 45.2 − [= 2.276] M1 Allow with wrong or no continuity correction. 1 –ɸ(‘2.276’) M1 0.0114 A1 4
This question in 9709/63 Oct/Nov 2021
Q14 · The number of clients who arrive at an information desk has a Poisson distribution with… 9709/63 May/June 2022
5 The number of clients who arrive at an information desk has a Poisson distribution with mean 2.2 per 5-minute period. (a) Find the probability that, in a randomly chosen 15-minute period, exactly 6 clients arrive at the desk. [3] … … … … … … … … … … (b) If more than 4 clients arrive during a 5-minute period, they cannot all be served. Find the probability that, during a randomly chosen 5-minute period, not all the clients who arrive at the desk can be served. [2] … … … … … … … … … … (c) Use a suitable approximating distribution to find the probability that, during a randomly chosen 1-hour period, fewer than 20 clients arrive at the desk. [4] … … … … … … … … … … … … … … … … … … … … … … … … …
9 marks
Mark scheme: 5(a) λ = 6.6 B1 e-6.6 × 6 6.6 6! M1 Any λ 0.156 (3 s.f.) A1 If M0 awarded SC B1 for 0.156 3 5(b) 1 – e-2.2(1 + 2.2 + 2 3 4 2.2 2.2 2.2 2 3! 4! ) M1 Allow one end error. Need 1 – … Any λ 0.0725 (3 s.f.) A1 If M0 awarded SC B1 for 0.0725 2 Question Answer Marks Guidance 5(c) N(26.4, 26.4) B1 Give at early stage 2.2 12 19.5 '26.4' '26.4' [= –1.343] M1 Standardising with their values. Allow wrong or no continuity correction ɸ('–1.343') = 1 – ɸ('1.343') M1 Area consistent with their working 0.0897 or 0.0896 (3 s.f.) A1 4
This question in 9709/63 May/June 2022
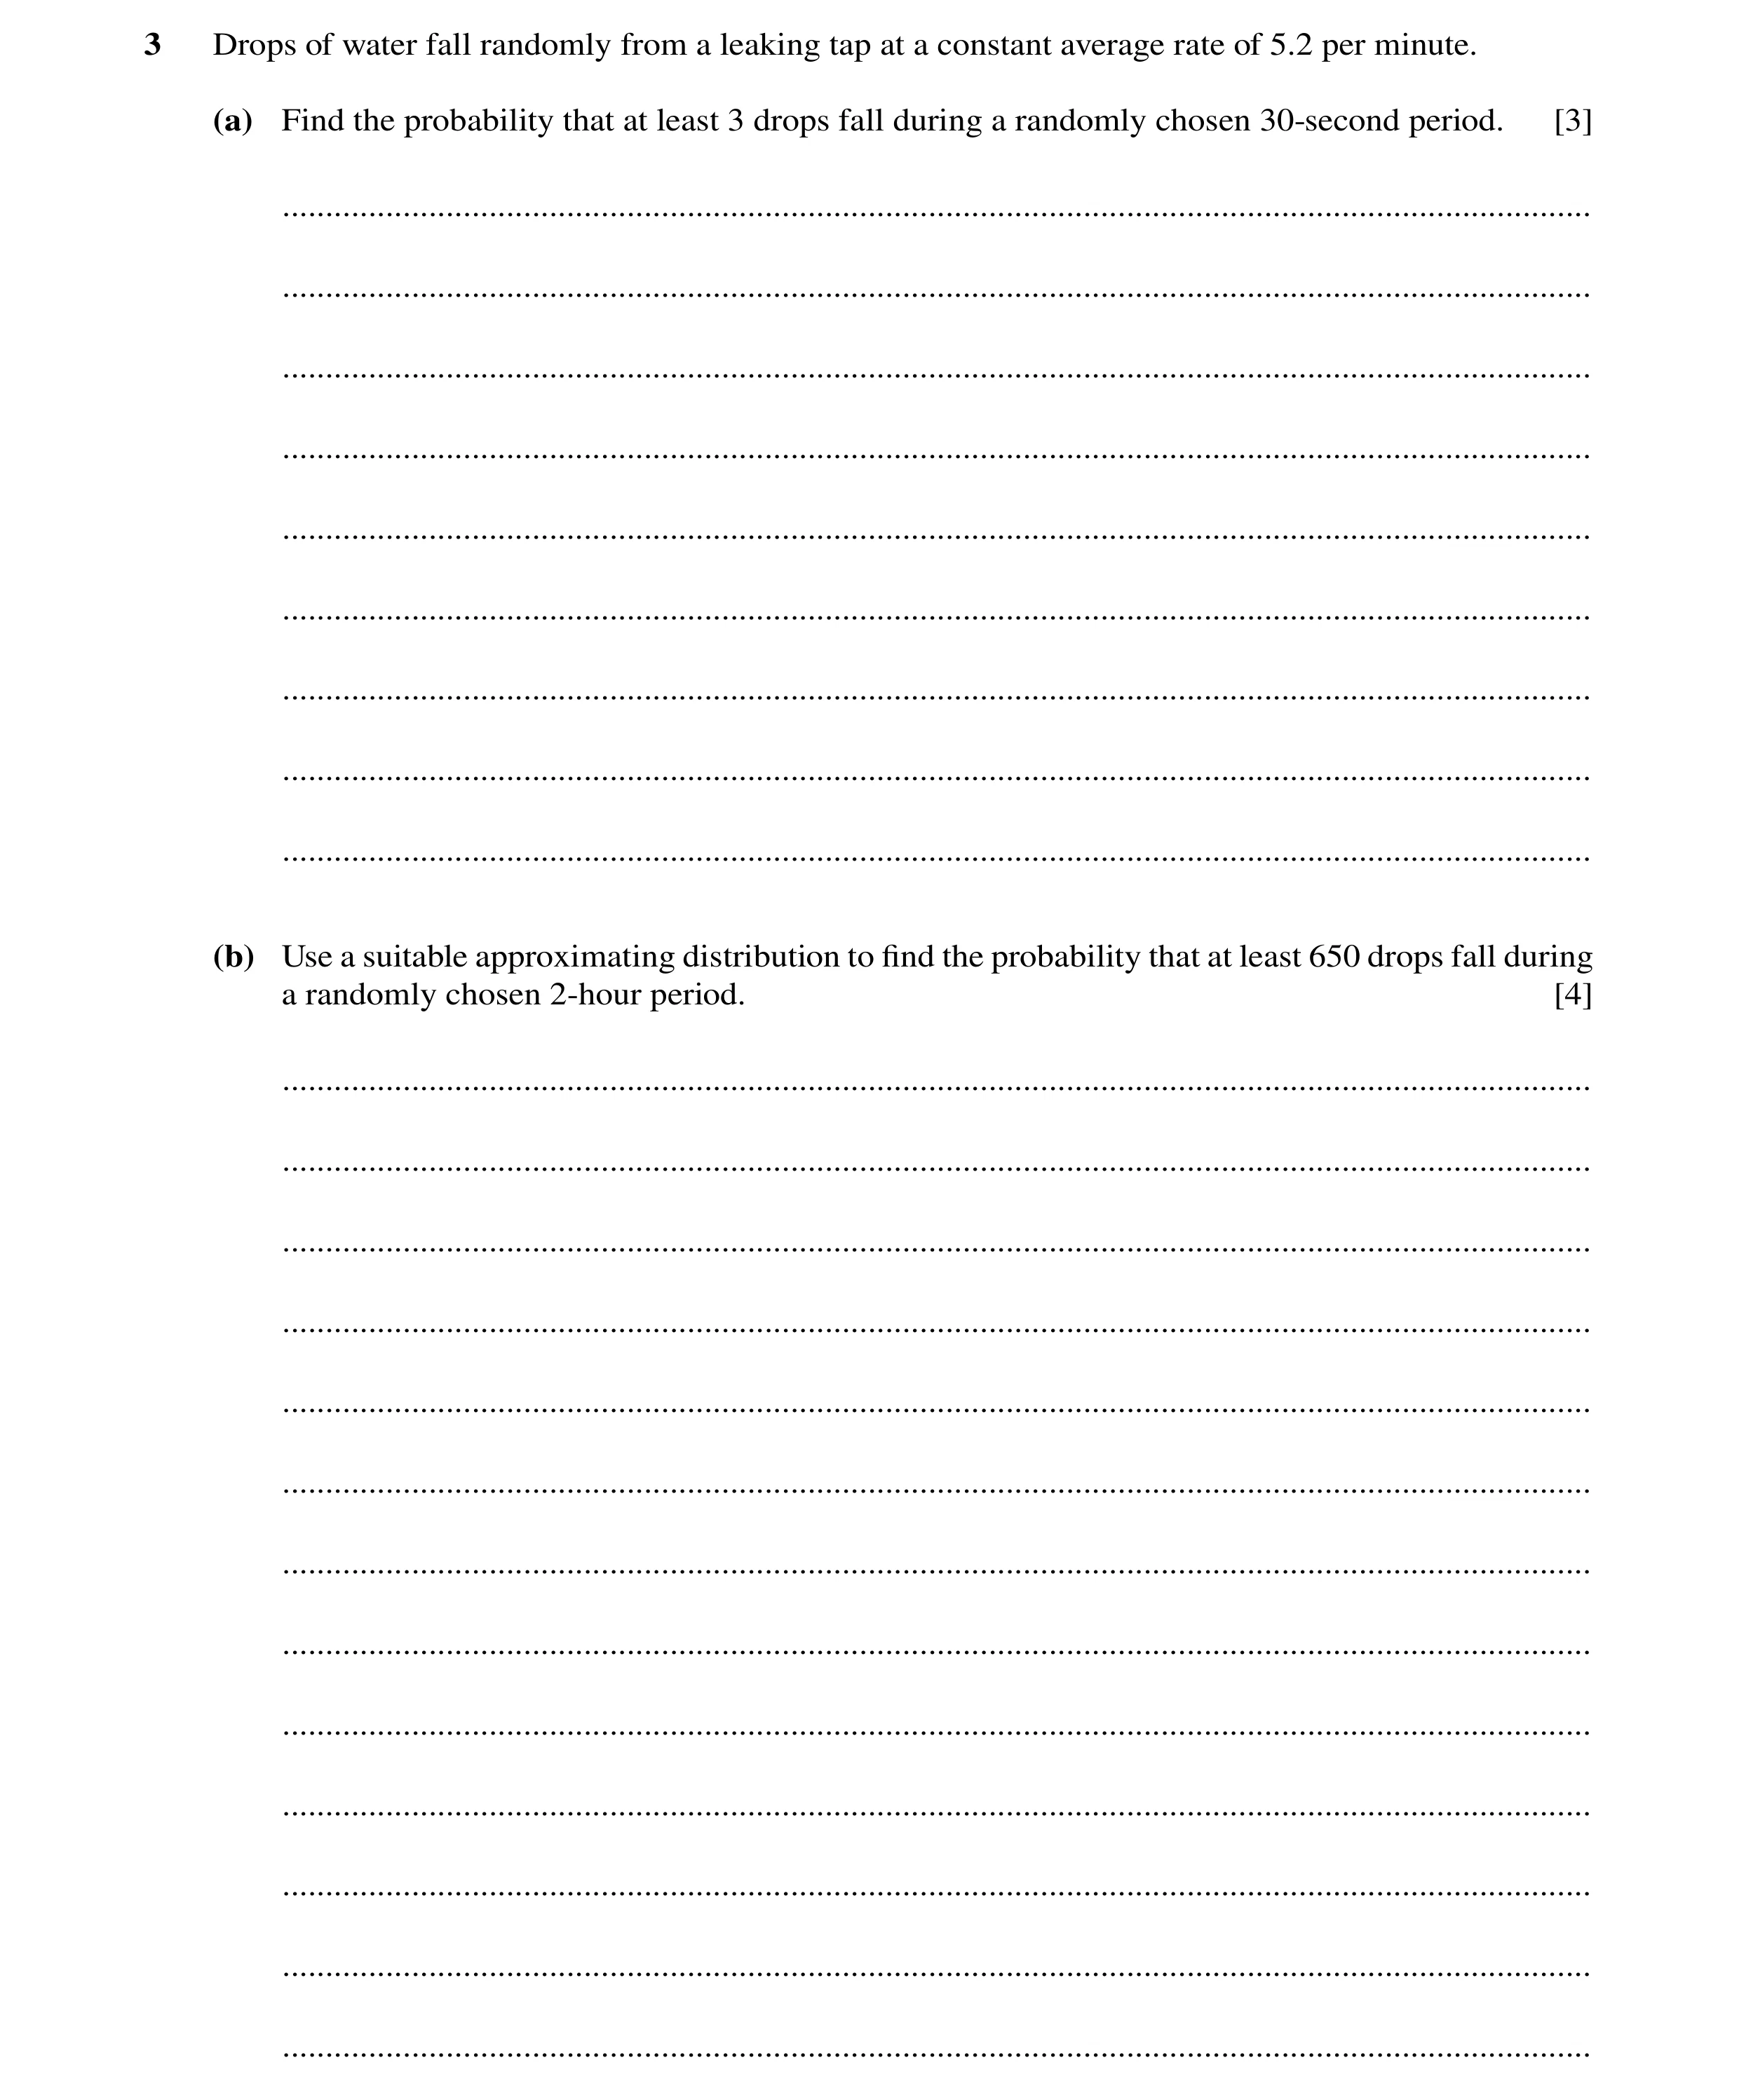
Q15 · Drops of water fall randomly from a leaking tap at a constant average rate of 5.2 per… 9709/61 Oct/Nov 2022
3 Drops of water fall randomly from a leaking tap at a constant average rate of 5.2 per minute. (a) Find the probability that at least 3 drops fall during a randomly chosen 30-second period. [3] … … … … … … … … … (b) Use a suitable approximating distribution to find the probability that at least 650 drops fall during a randomly chosen 2-hour period. [4] … … … … … … … … … … … … …
7 marks
Mark scheme: 3(a) λ = 5.2 ÷ 2 [= 2.6] B1 1 – e–2.6(1 + 2.6 + 2.62 ) or 1 – e-2.6( 1 + 2.6 + 3.38 ) M1 Allow any λ. 2 Allow one end error. or 1- ( 0.07427 + 0.1931 + 0.2510 ) Must see expression. = 0.482 (3 sf) B1 3 3(b) N(120×5.2, 120×5.2) B1 Stated or implied. Give at early stage. 649.5 − their '624' M1 Allow with no or wrong continuity correction. [= 1.021] their '624' 1– Φ(their ‘1.021’) M1 For area consistent with their working. = 0.154 (3 sf) A1 4
This question in 9709/61 Oct/Nov 2022
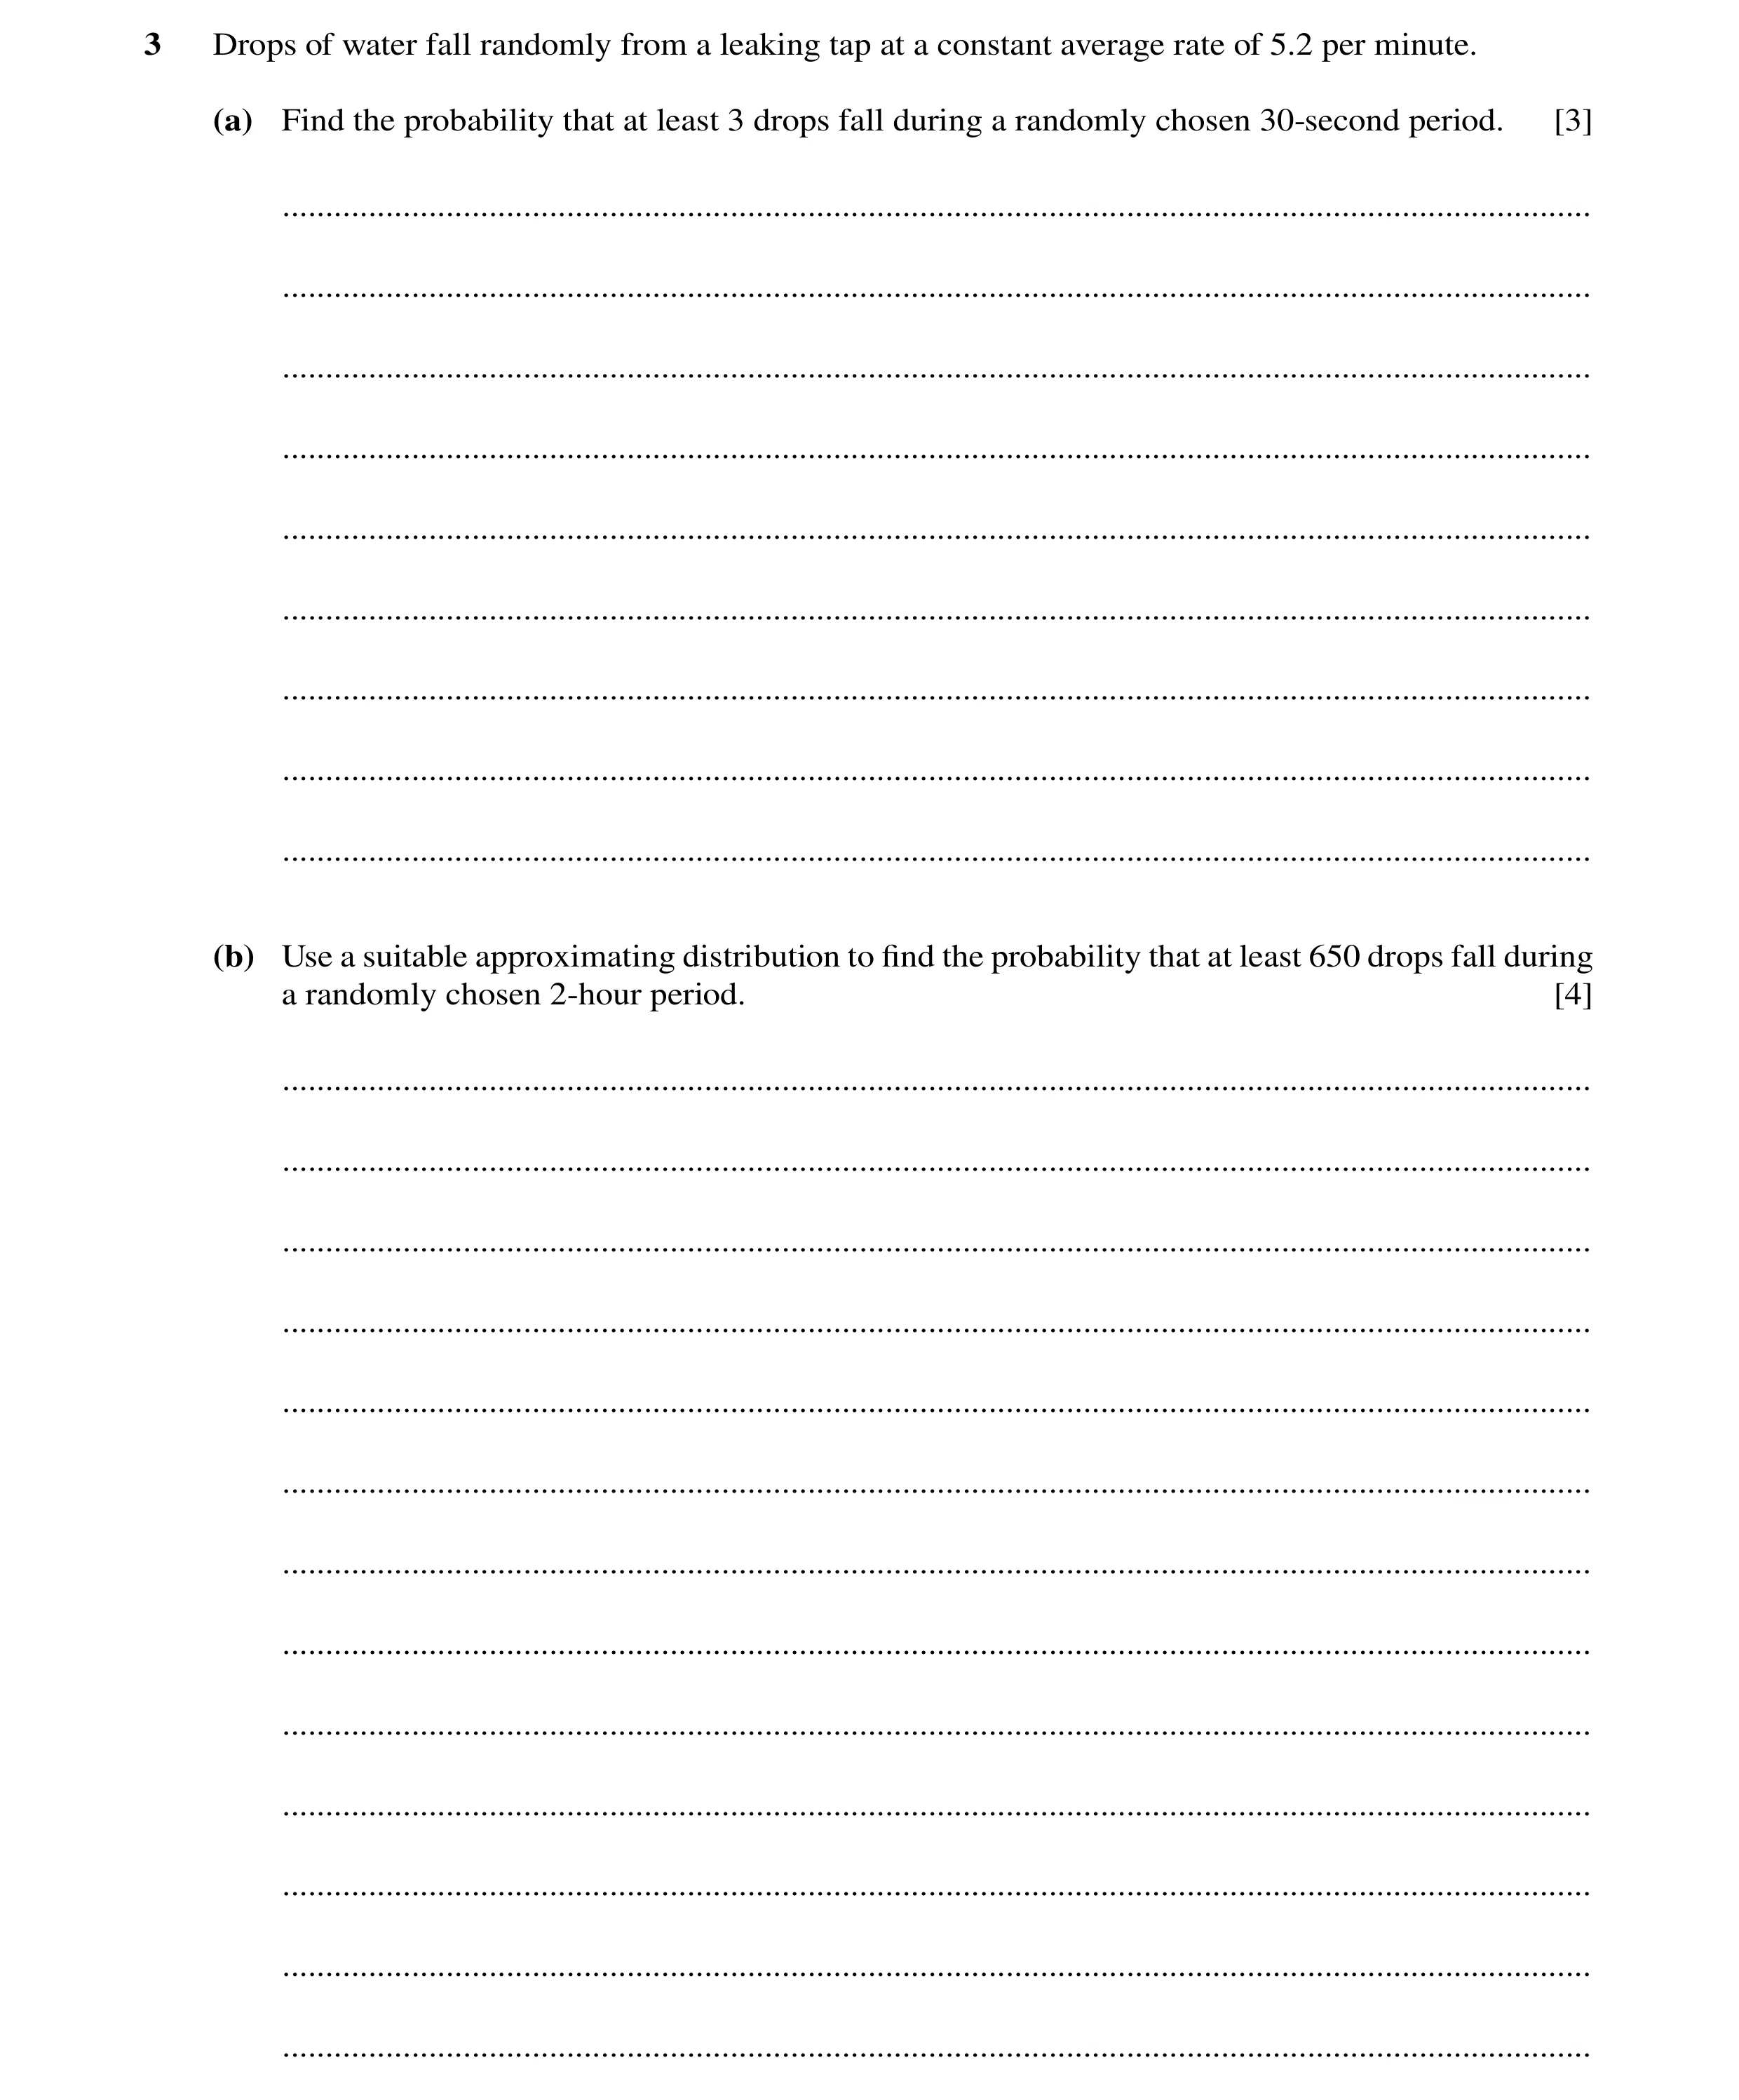
Q16 · Drops of water fall randomly from a leaking tap at a constant average rate of 5.2 per… 9709/63 Oct/Nov 2022
3 Drops of water fall randomly from a leaking tap at a constant average rate of 5.2 per minute. (a) Find the probability that at least 3 drops fall during a randomly chosen 30-second period. [3] … … … … … … … … … (b) Use a suitable approximating distribution to find the probability that at least 650 drops fall during a randomly chosen 2-hour period. [4] … … … … … … … … … … … … …
7 marks
Mark scheme: 3(a) λ = 5.2 ÷ 2 [= 2.6] B1 1 – e–2.6(1 + 2.6 + 2.62 ) or 1 – e-2.6( 1 + 2.6 + 3.38 ) M1 Allow any λ. 2 Allow one end error. or 1- ( 0.07427 + 0.1931 + 0.2510 ) Must see expression. = 0.482 (3 sf) B1 3 3(b) N(120×5.2, 120×5.2) B1 Stated or implied. Give at early stage. 649.5 − their '624' M1 Allow with no or wrong continuity correction. [= 1.021] their '624' 1– Φ(their ‘1.021’) M1 For area consistent with their working. = 0.154 (3 sf) A1 4
This question in 9709/63 Oct/Nov 2022
Q17 · The number of orders arriving at a shop during an 8-hour working day is modelled by the… 9709/62 Feb/March 2023
2 The number of orders arriving at a shop during an 8-hour working day is modelled by the random variable X with distribution Po 25.2 . (a) State two assumptions that are required for the Poisson model to be valid in this context. [2] … … … … (b) (i) Find the probability that the number of orders that arrive in a randomly chosen 3-hour period is between 3 and 5 inclusive. [3] … … … … … … (ii) Find the probability that, in two randomly chosen 1-hour periods, exactly 1 order will arrive in one of the 1-hour periods, and at least 2 orders will arrive in the other 1-hour period. [4] … … … … … … … … … … … … … … … (c) The shop can only deal with a maximum of 120 orders during any 36-hour period. Use a suitable approximating distribution to find the probability that, in a randomly chosen 36-hour period, there will be too many orders for the shop to deal with. [4] … … … … … … … … … … … … … … … … … …
13 marks
Mark scheme: 2(a) Orders arrive at constant mean rate (must say mean or rate) Must be in context (accept 25.2 as context). Orders arrive at random Orders arrive independently B1 Any one reason correctly stated. Orders arrive singly B1 A second reason correctly stated. SC B1: both correct, not in context. 2 2(b)(i) λ = 83 × 25.2 [= 9.45] B1 e–’9.45’( 9.45 3! 3 + 9.454! 4 + 9.455! 5 ) or e–‘9.45’ (140.65 + 332.29 + 628.03) or 0.01107 + M1 Allow any λ. Allow end errors. Expression must be seen. 0.02615 + 0.04942 = 0.0866 (3 sf) A1 If M0 allow SC B1 for 0.0866 no working seen. 3 2(b)(ii) e–3.15 ×3.15 or (1 – e–3.15(1 + 3.15)) or 0.135 or 0.822 (3 sf) B1 e–3.15 × 3.15 × (1 – e–3.15(1 + 3.15) ) M1 M1 for product of two Poisson probabilities P(1) (1– P(0,1)) (no end errors accepted). Accept any λ. × 2 or 0.111 × 2 M1 M1 for their product of two Poisson probabilities (accept end errors) × 2. Accept any λ 0.222 (3 sf) A1 4 2(c) N(113.4, 113.4) B1 SOI 120.5−113.4 [= 0.667] M1 Standardise with their values. Allow wrong or no cc. 113.4 Must have √. 1 – ɸ(their ‘0.667’) M1 For probability area consistent with their values. = 0.252 (3 sf) A1 4
This question in 9709/62 Feb/March 2023
Q18 · The number of accidents per 3-month period on a certain road has the distribution Po , 9709/62 Feb/March 2023
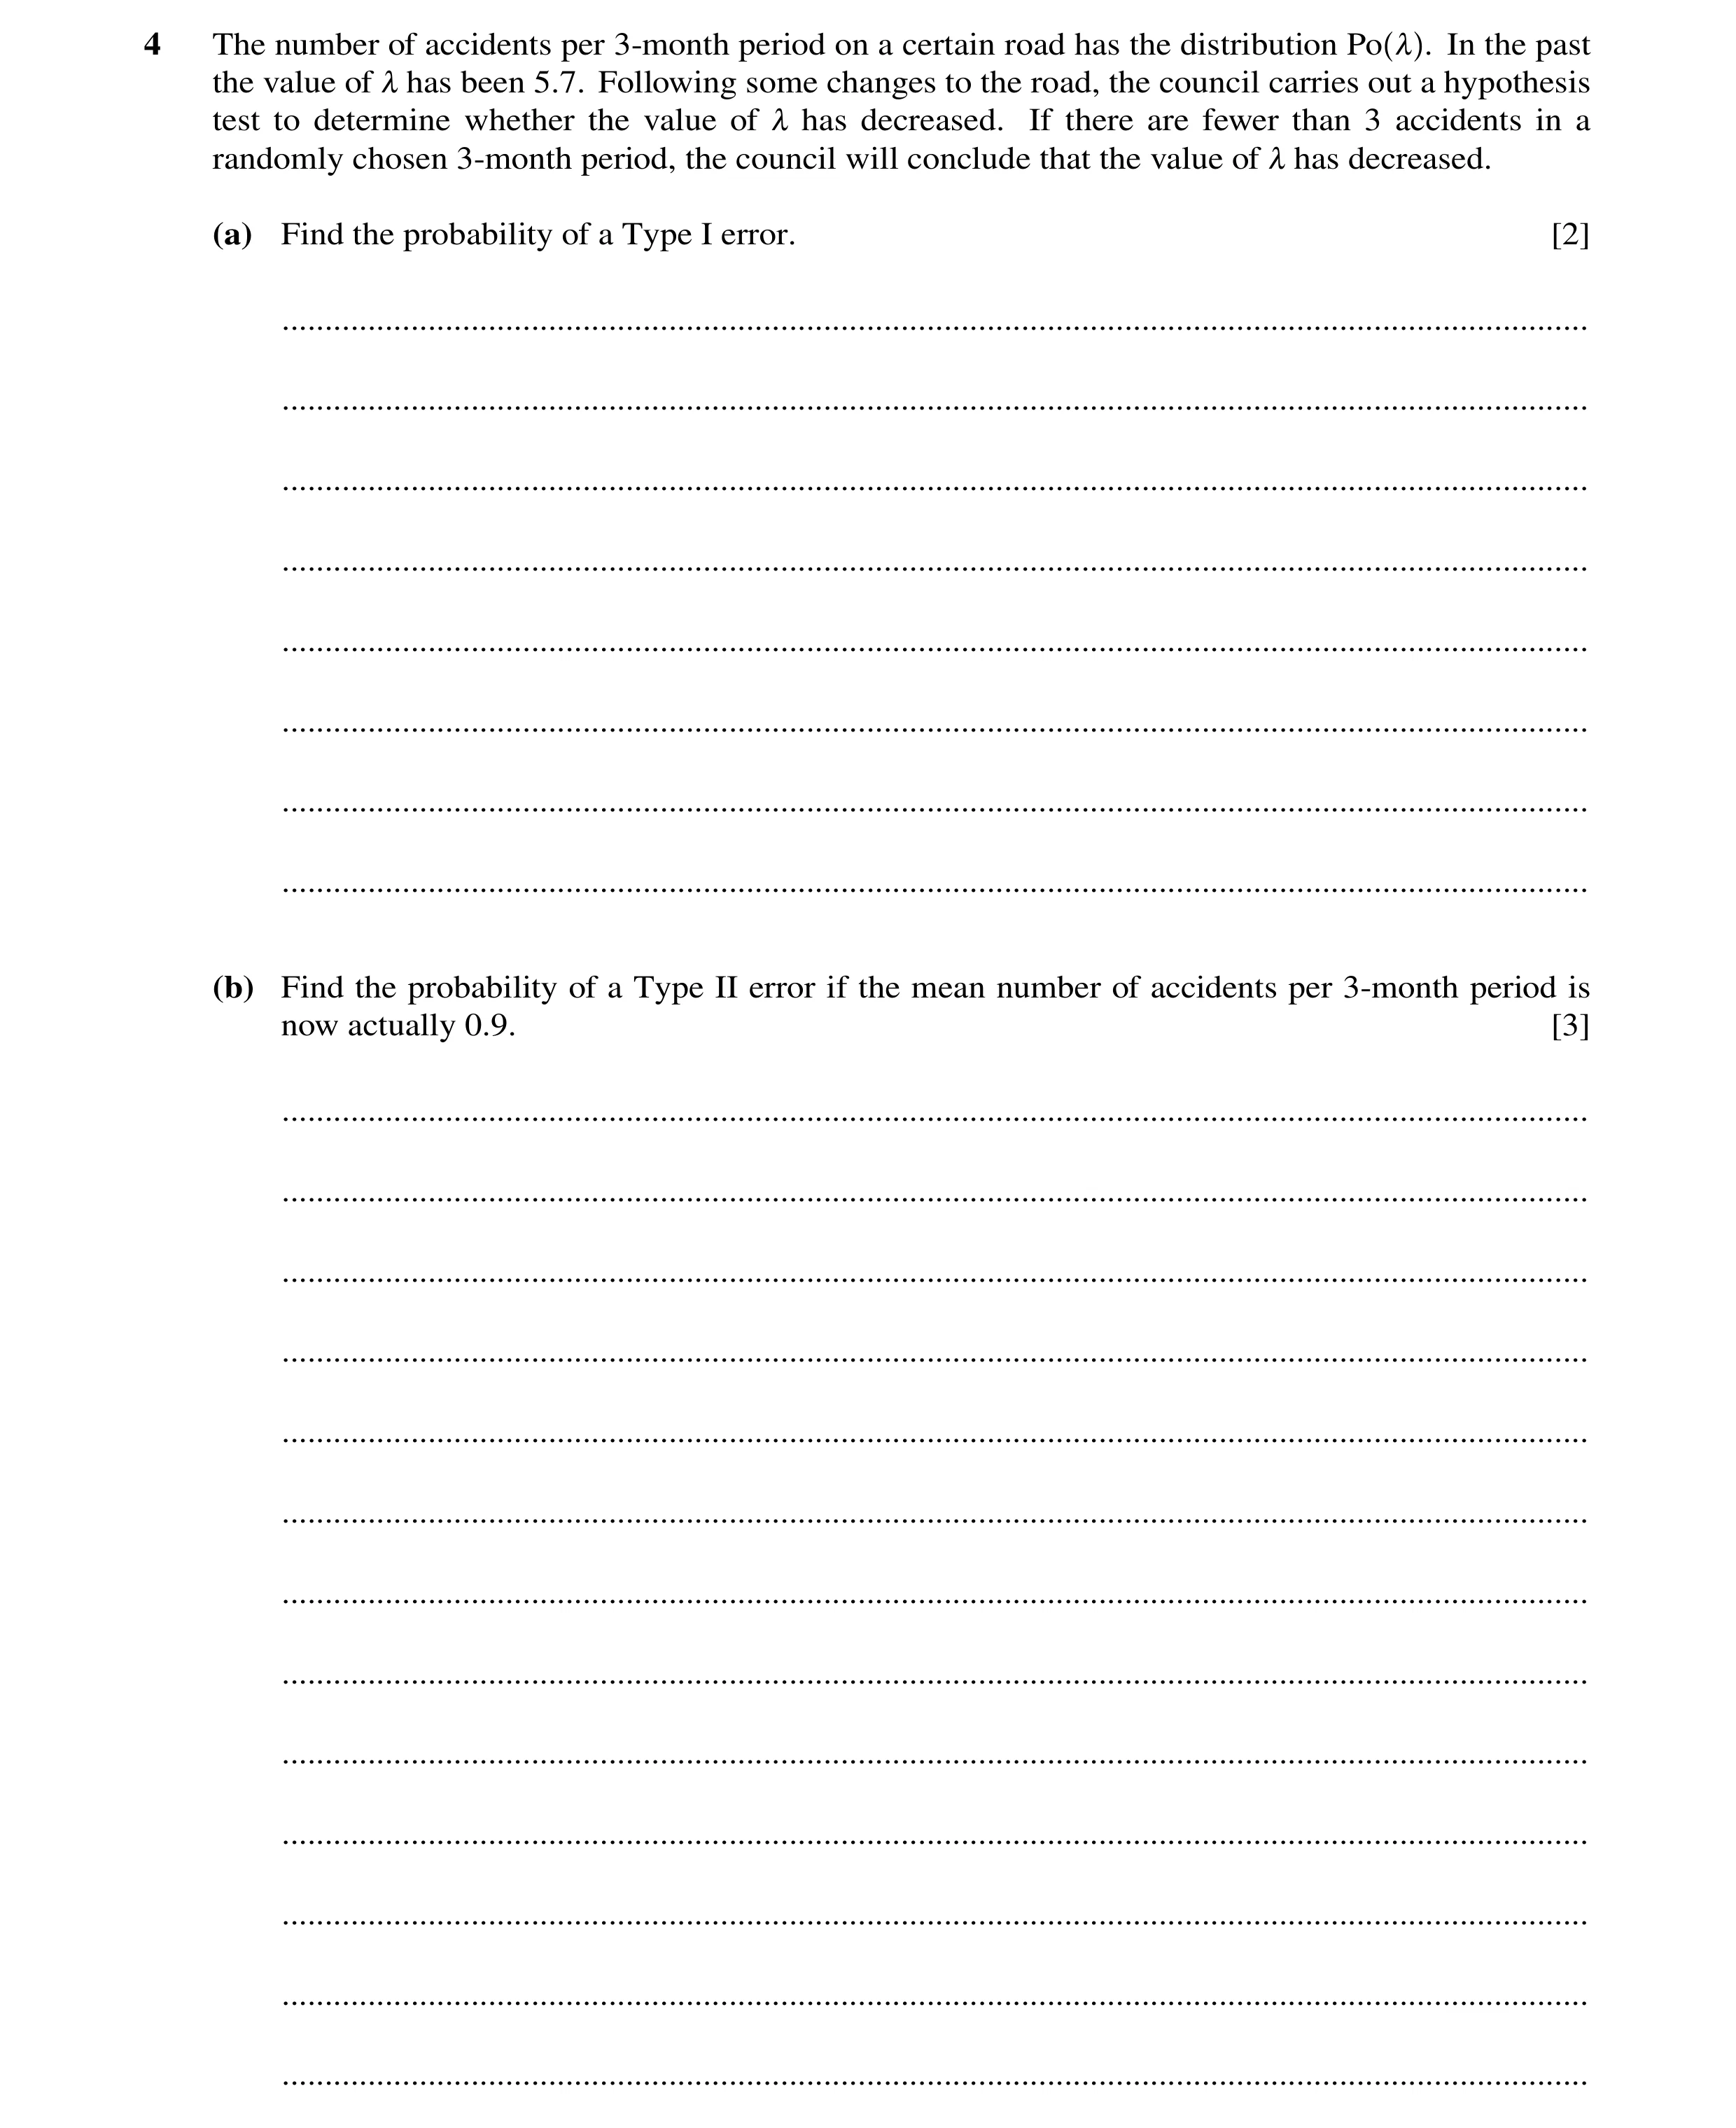
4 The number of accidents per 3-month period on a certain road has the distribution Po , . In the past the value of , has been 5.7. Following some changes to the road, the council carries out a hypothesis test to determine whether the value of , has decreased. If there are fewer than 3 accidents in a randomly chosen 3-month period, the council will conclude that the value of , has decreased. (a) Find the probability of a Type I error. [2] … … … … … … … … (b) Find the probability of a Type II error if the mean number of accidents per 3-month period is now actually 0.9. [3] … … … … … … … … … … … … …
5 marks
Mark scheme: 4(a) e-5.7(1 + 5.7 + 5.72 ) or e-5.7(1 + 5.7 + 16.245) or 0.003346 + 0.01907 + 0.05436 M1 Allow one end error. 2! Must see this expression. = 0.0768 (3 sf) A1 SC B1 for unsupported answer of 0.0768 . 2 4(b) e –0.9(1 + 0.9 + 0.92 ) M1 Attempted; allow one end error (must see expression). 2! = 1 – e –0.9(1 + 0.9 + 0.92 )= 1 – e –0.9(1 + 0.9 + 0.405) = 1 – (0.4066 + 3659 + A1 Correct expression P(X ⩾ 3) no end errors (must see 2! expression). 0.1647) = 0.0629 (3 sf) A1 SC B2 for unsupported answer of 0.0629 . 3
This question in 9709/62 Feb/March 2023
Q19 · The number of accidents per week at a certain factory has a Poisson distribution 9709/61 May/June 2023
7 The number of accidents per week at a certain factory has a Poisson distribution. In the past the mean has been 1.9 accidents per week. Last year, the manager gave all his employees a new booklet on safety. He decides to test, at the 5% significance level, whether the mean number of accidents has been reduced. He notes the number of accidents during 4 randomly chosen weeks this year. (a) State suitable null and alternative hypotheses for the test. [1] … … … … (b) Find the critical region for the test and state the probability of a Type I error. [6] … … … … … … … … … … … … … … … … … (c) State what is meant by a Type I error in this context. [1] … … … (d) During the 4 randomly chosen weeks there are a total of 3 accidents. State the conclusion that the manager should reach. Give a reason for your answer. [2] … … … … … … … (e) Assuming that the mean remains 1.9 accidents per week, use a suitable approximation to calculate the probability that there will be more than 100 accidents during a 52-week period. [4] … … … … … … … … … … …
14 marks
Mark scheme: 7(a) H0: λ = 7.6 [or 1.9] H1: λ < 7.6 [or 1.9] B1 Or Population mean = 7.6 or µ (not just ‘mean’). Or Population mean < 7.6 or µ. 1 Question Answer Marks Guidance 7(b) Mean = 7.6 B1 Seen. P(X ⩽ 2) = e-7.6 (1 + 7.6 + 2 7.6 2 ) [= 0.0188 or 0.0187] M1 OE. P(X ⩽ 3) = e-7.6(1 + 7.6 + 2 7.6 2 + 3 7.6 3! ) [= 0.0554 or 0.0553] M1 OE. Expression must be seen in at least one probability calculation. 0.0188 or 0.0187 and 0.0554 or 0.0553 A1 A1 for both values. Critical region is X ⩽ 2 A1 Dep on both M marks. SC No Poisson expression seen in either prob scores B1 for 0.0188 or 0.0187 and B1 for 0.0554 or 0.0553 and B1 for CR. P(Type I error) = P(X ⩽ 2) = 0.0188 or 0.0187 (3 sf) B1FT FT their P(X ⩽ 2) or their CR. 6 7(c) Concluding that the (mean) no. of accidents has reduced when it has not. B1 OE. Must be in context. Accept: ‘It is believed that the booklet has helped to improve safety when actually it has not’. 1 7(d) 3 not in critical region. M1 FT their CR or P(X < 3) = 0.0554 > 0.05 . No evidence mean number of accidents has decreased. A1FT In context. Cannot be a definite statement, e.g., ‘mean number accidents has not decreased’. 2 Question Answer Marks Guidance 7(e) N(98.8, 98.8) B1 May be implied. 100.5 98.8 98.8 [= 0.171] M1 For standardising (could be implied by correct answer). Allow with wrong or no continuity correction. 1 – Φ(‘0.171’) M1 For probability area consistent with their working. = 0.432 (3 sf) A1 4
This question in 9709/61 May/June 2023
Q20 · The number, X, of books received at a charity shop has a constant mean of 5.1 per day 9709/62 May/June 2023
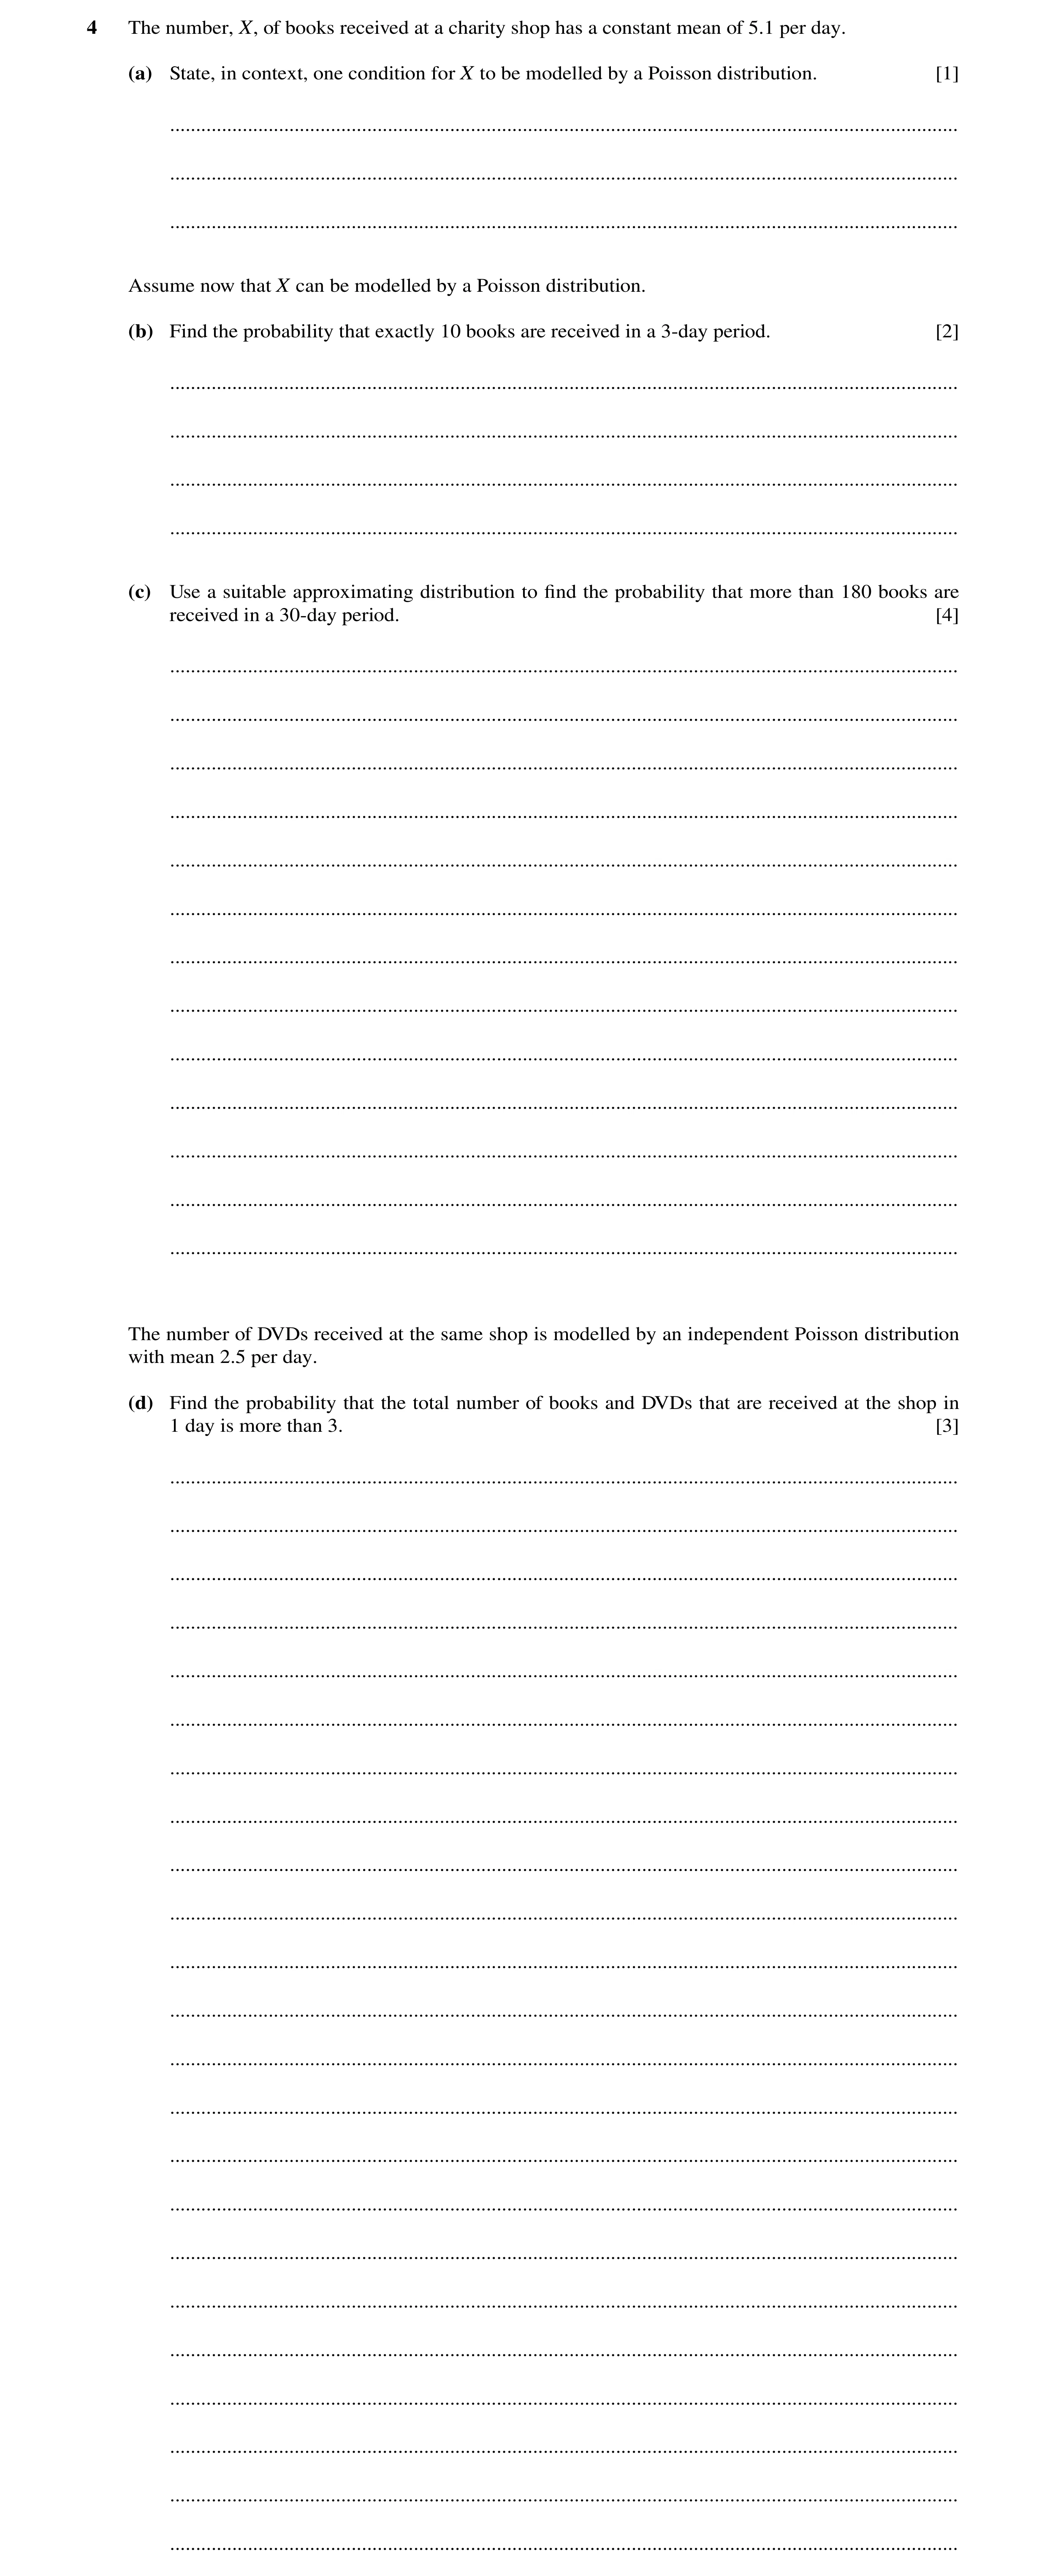
4 The number, X, of books received at a charity shop has a constant mean of 5.1 per day. (a) State, in context, one condition for X to be modelled by a Poisson distribution. [1] … … … Assume now that X can be modelled by a Poisson distribution. (b) Find the probability that exactly 10 books are received in a 3-day period. [2] … … … … (c) Use a suitable approximating distribution to find the probability that more than 180 books are received in a 30-day period. [4] … … … … … … … … … … … … … The number of DVDs received at the same shop is modelled by an independent Poisson distribution with mean 2.5 per day. (d) Find the probability that the total number of books and DVDs that are received at the shop in 1 day is more than 3. [3] … … … … … … … … … … … … … … … … … … … … … … …
10 marks
Mark scheme: 4(a) Books received independently or singly or randomly. B1 OE. Must be in context. If more than one condition given, ignore extras. 1 Question Answer Marks Guidance 4(b) 10 15.3 15.3 10! e M1 Allow incorrect λ. = 0.0439 (3sf) A1 SC No working shown but correct answer seen scores B1. 2 4(c) N(153, 153) B1 Seen or implied. 180.5 153 153 [= 2.223] M1 For standardising with their values (can be implied). Allow with wrong or missing continuity correction. 1 ̶ ɸ(‘2.223’) M1 For correct probability area consistent with their values. = 0.0131 (3sf) A1 4 4(d) (λ =) 5.1 + 2.5 [= 7.6] B1 Give at early stage (seen or implied). 1 – 2 3 7.6 7.6 7.6 2 3! e (1 7.6 ) = 1– e-7.6(1+7.6+28.88+73.16) = 1 – (0.0005005+0.003803+0.01445+0.03661) M1 Allow incorrect λ. Allow one end error. Must see an expression (accept correct sigma notation). = 0.945 (3sf) A1 SC No working, 0.945 B1(could be implied) SC B1. 3
This question in 9709/62 May/June 2023
Q21 · A website owner finds that, on average, his website receives 0.3 hits per minute 9709/61 Oct/Nov 2023
3 A website owner finds that, on average, his website receives 0.3 hits per minute. He believes that the number of hits per minute follows a Poisson distribution. (a) Assume that the owner is correct. (i) Find the probability that there will be at least 4 hits during a 10-minute period. [3] … … … … … … … … … … (ii) Use a suitable approximating distribution to find the probability that there will be fewer than 40 hits during a 3-hour period. [4] … … … … … … … … … … … A friend agrees that the website receives, on average, 0.3 hits per minute. However, she notices that the number of hits during the day-time (9.00am to 9.00pm) is usually about twice the number of hits during the night-time (9.00pm to 9.00am). (b) (i) Explain why this fact contradicts the owner’s belief that the number of hits per minute follows a Poisson distribution. [1] … … … … … … … (ii) Specify separate Poisson distributions that might be suitable models for the number of hits during the day-time and during the night-time. [2] … … … … … … … … … … … … … …
10 marks
Mark scheme: 3(a)(i) λ = 3 B1 For mean = 3. 3 2 33 M1 Any λ. Allow one end error. 1 – e–3(1 + 3 + + ) or 1 – e–3(1 + 3 + 4.5 + 4.5) 2 3! or 1 – (0.04979 + 0.14936 + 0.22404 + 0.22404) = 0.353 (3 sf) A1 No working scores B1. 3 3(a)(ii) N(54, 54) M1 soi 39.5 − 54 M1 Allow with wrong or no continuity correction. (= –1.973) 54 For standardising with their mean and variance. 1 – ɸ ('1.973') M1 For area consistent with their working. = 0.0242 (3 sf) A1 Special case: if no working seen, 0.0242 scores SC B3, 0.0284 scores SC B2. 4 3(b)(i) ‘Mean not constant’ or’ ‘number of hits per minute not constant’ or ‘not a B1 constant rate’ 1 3(b)(ii) 2p + p = 2 × 0.3 [p = 0.2] M1 May be implied by answer. [where p is the rate per minute for night time] [During day-time]: Po(0.4). [During night-time]: Po(0.2) A1 Accept Po(24) [per daytime hour], Po(12) [per night time hour]. Accept Po(288) [per day time shift], Po(144)[ per night time shift]. Note: Po(432), Po(216) scores M0A0. 2
This question in 9709/61 Oct/Nov 2023
Q22 · A website owner finds that, on average, his website receives 0.3 hits per minute 9709/63 Oct/Nov 2023
3 A website owner finds that, on average, his website receives 0.3 hits per minute. He believes that the number of hits per minute follows a Poisson distribution. (a) Assume that the owner is correct. (i) Find the probability that there will be at least 4 hits during a 10-minute period. [3] … … … … … … … … … … (ii) Use a suitable approximating distribution to find the probability that there will be fewer than 40 hits during a 3-hour period. [4] … … … … … … … … … … … A friend agrees that the website receives, on average, 0.3 hits per minute. However, she notices that the number of hits during the day-time (9.00am to 9.00pm) is usually about twice the number of hits during the night-time (9.00pm to 9.00am). (b) (i) Explain why this fact contradicts the owner’s belief that the number of hits per minute follows a Poisson distribution. [1] … … … … … … … (ii) Specify separate Poisson distributions that might be suitable models for the number of hits during the day-time and during the night-time. [2] … … … … … … … … … … … … … …
10 marks
Mark scheme: 3(a)(i) λ = 3 B1 For mean = 3. 3 2 33 M1 Any λ. Allow one end error. 1 – e–3(1 + 3 + + ) or 1 – e–3(1 + 3 + 4.5 + 4.5) 2 3! or 1 – (0.04979 + 0.14936 + 0.22404 + 0.22404) = 0.353 (3 sf) A1 No working scores B1. 3 3(a)(ii) N(54, 54) M1 soi 39.5 − 54 M1 Allow with wrong or no continuity correction. (= –1.973) 54 For standardising with their mean and variance. 1 – ɸ ('1.973') M1 For area consistent with their working. = 0.0242 (3 sf) A1 Special case: if no working seen, 0.0242 scores SC B3, 0.0284 scores SC B2. 4 3(b)(i) ‘Mean not constant’ or’ ‘number of hits per minute not constant’ or ‘not a B1 constant rate’ 1 3(b)(ii) 2p + p = 2 × 0.3 [p = 0.2] M1 May be implied by answer. [where p is the rate per minute for night time] [During day-time]: Po(0.4). [During night-time]: Po(0.2) A1 Accept Po(24) [per daytime hour], Po(12) [per night time hour]. Accept Po(288) [per day time shift], Po(144)[ per night time shift]. Note: Po(432), Po(216) scores M0A0. 2
This question in 9709/63 Oct/Nov 2023
Q23 · A teacher models the numbers of girls and boys who arrive late for her class on any day… 9709/62 Feb/March 2024
5 A teacher models the numbers of girls and boys who arrive late for her class on any day by the independent random variables G + Po(0.10) and B + Po(0.15) respectively. (a) Find the probability that during a randomly chosen 2-day period no girls arrive late. [1] … … … … … … … (b) Find the probability that during a randomly chosen 5-day period the total number of students who arrive late is less than 3. [3] … … … … … … … … (c) It is given that the values of P(G = r) and P(B = r) for r H 3 are very small and can be ignored. Find the probability that on a randomly chosen day more girls arrive late than boys. [3] … … … … … … … … … … … … … … … … Following a timetable change the teacher claims that on average more students arrive late than before the change. During a randomly chosen 5-day period a total of 4 students are late. (d) Test the teacher’s claim at the 5% significance level. [5] … … … … … … … … … … … … … … … …
12 marks
Mark scheme: 5(a) [e−0.2] = 0.819 (3 sf) B1 Accept e–0.2 as final answer. 1 5(b) λ = 1.25 B1 1.25 2 M1 Any λ Allow one end error. e−1.25 1 + 1.25 + Must see expression (in any form). 2 Accept correct Σ notation. or e−1.25(1 + 1.25 + 0.78125) or 0.2865 + 0.3581 + 0.2238 = 0.868 (3 sf) A1 SC Answer with no working seen scores B1 (could be implied). 3 5(c) e−0.15 × e−0.1(0.1) = 0.077879 M1 P(B = 0) × P(G = 1) 0.8607 0.09048 0 . 12 P(B = 0) × P(G = 2) 0.8607 0.004524 = 0.003894 e−0.15 × e−0.1 P(B = 1) × P(G = 2) 0.1291 0.004524 2 0 . 12 Note: P(B = 0) P(G = 2) and P(B = 1) P(G = 2) e−0.15 × 0.15 × e−0.1 × = 0.0005841 2 may be seen within P(G = 2) P(B < 2). For one expression seen. 0 . 12 0 . 12 M1 P(B = 0) × P(G = 1) + P(B = 0) × P(G = 2) e−0.15 × e−0.1 (0.1) + e−0.15 × e−0.1 + e−0.15 × 0.15 × e−0.1 × + P(B = 1) × P(G = 2). 2 2 For the three Poisson terms added (must be from a = 0.077879 + 0.00389036 + 0.0005841 complete attempt at all 3 terms). = 0.0824 (3 sf) A1 Alternative method for Question 5(c) P(B = 0) P(G > 0) M1 For one expression seen. e−0.15 × (1 − e−0.1) P(B = 1) P(G > 1) e−0.15 × 0.15 × (1 − e−0.1(1 + 0.1)) e−0.15 × (1 − e−0.1) + e−0.15 × 0.15 × (1 − e−0.1(1 + 0.1)) M1 For adding their expressions. = 0.0824 (3 sf) A1 3 5(d) H0: λ = 1.25 or 0.25[per day] B1 Or µ or ‘population mean’. H1: λ > 1.25 or 0.25[per day] 1.252 1.253 M1 Any λ. No end errors. Expression must be seen (in P(> 4 late) = 1 − e−1.25 1 + 1.25 + + any form). Accept correct Σ notation. 2 3! or 1 – e−1.25(1 + 1.25 + 0.7813 + 0.3255) or 1 – (0.2865 + 0.3581 + 0.2238 + 0.09326) = 0.0383 A1 SC 0.0383 with no working scores B1. 0.0383 < 0.05 M1 For a valid comparison. [Reject H0] A1 FT No contradictions. In context and not definite, ‘Hence there is sufficient evidence to suggest that the teacher’s claim is true’ e.g. not ‘More students are late’ or ‘Claim is or ‘There is sufficient evidence to suggest that more students are late on correct’. average’. Ft their 0.0383. 5
This question in 9709/62 Feb/March 2024
Q24 · A bus station has exactly four entrances 9709/61 May/June 2024
1 A bus station has exactly four entrances. In the morning the numbers of passengers arriving at these entrances during a 10-second period have the independent distributions Po(0.4), Po(0.1), Po(0.2) and Po(0.5). Find the probability that the total number of passengers arriving at the four entrances to the bus station during a randomly chosen 1-minute period in the morning is more than 3. [3] … … … … … … … … … … … … … … … … … … … … … … … … …
3 marks
Mark scheme: 1 λ = 7.2 B1 P(X > 3) = 1 − e-7.2(1 + 7.2 + 2 3 7.2 7.2 2! 3! ) or 1 − e-7.2(1 + 7.2 + 25.92 + 62.21) or 1 − (0.0007466 + 0.005375 + 0.01935 + 0.04644) M1 Allow any λ. Allow one end error. Must see expression. Allow fully correct sigma notation. = 0.928 (3sf) A1 SC 0.928 with no working seen scores B1 B1. 3
This question in 9709/61 May/June 2024
Q25 · Sales of cell phones at a certain shop occur singly, randomly and independently 9709/61 May/June 2024
5 Sales of cell phones at a certain shop occur singly, randomly and independently. (a) State one further condition that must be satisfied for the number of sales in a certain time period to be well modelled by a Poisson distribution. [1] … … … … … The average number of sales per hour is 1.2 . Assume now that a Poisson distribution is a suitable model. (b) Find the probability that the number of sales during a randomly chosen 12-hour period will be more than 12 and less than 16. [3] … … … … … … … … … … … … … … … … … (c) Use a suitable approximating distribution to find the probability that the number of sales during a randomly chosen 1-month period (140 hours) will be less than 150. [4] … … … … … … … … … … … … … … … … … … … … … … … … … … …
8 marks
Mark scheme: 5(a) Accept constant rate. Allow without context. 1 5(b) λ = 14.4 B1 14.4 e ( 13 14.4 13! + 14 14.4 14! + 15 14.4 15! ) or e-14.4 (183837 + 189089 + 181526) or (0.102469 + 0.105396 + 0.101181) M1 Poisson P(13, 14, 15). Expression must be seen. Allow one end error; allow any λ. Allow fully correct sigma notation. = 0.309 (3sf) A1 SC: 0.309 with no working scores B1 B1. 3 5(c) N(140×1.2, 140×1.2) or N(168, 168) B1 Stated or implied. 149.5 168 168 [= −1.427] M1 Standardising using their mean and variance. Allow with wrong or no continuity correction. Φ(“−1.427”) = 1 − Φ(“1.427”) M1 For area consistent with their working. = 0.0768 or 0.0767 (3sf) A1 4
This question in 9709/61 May/June 2024
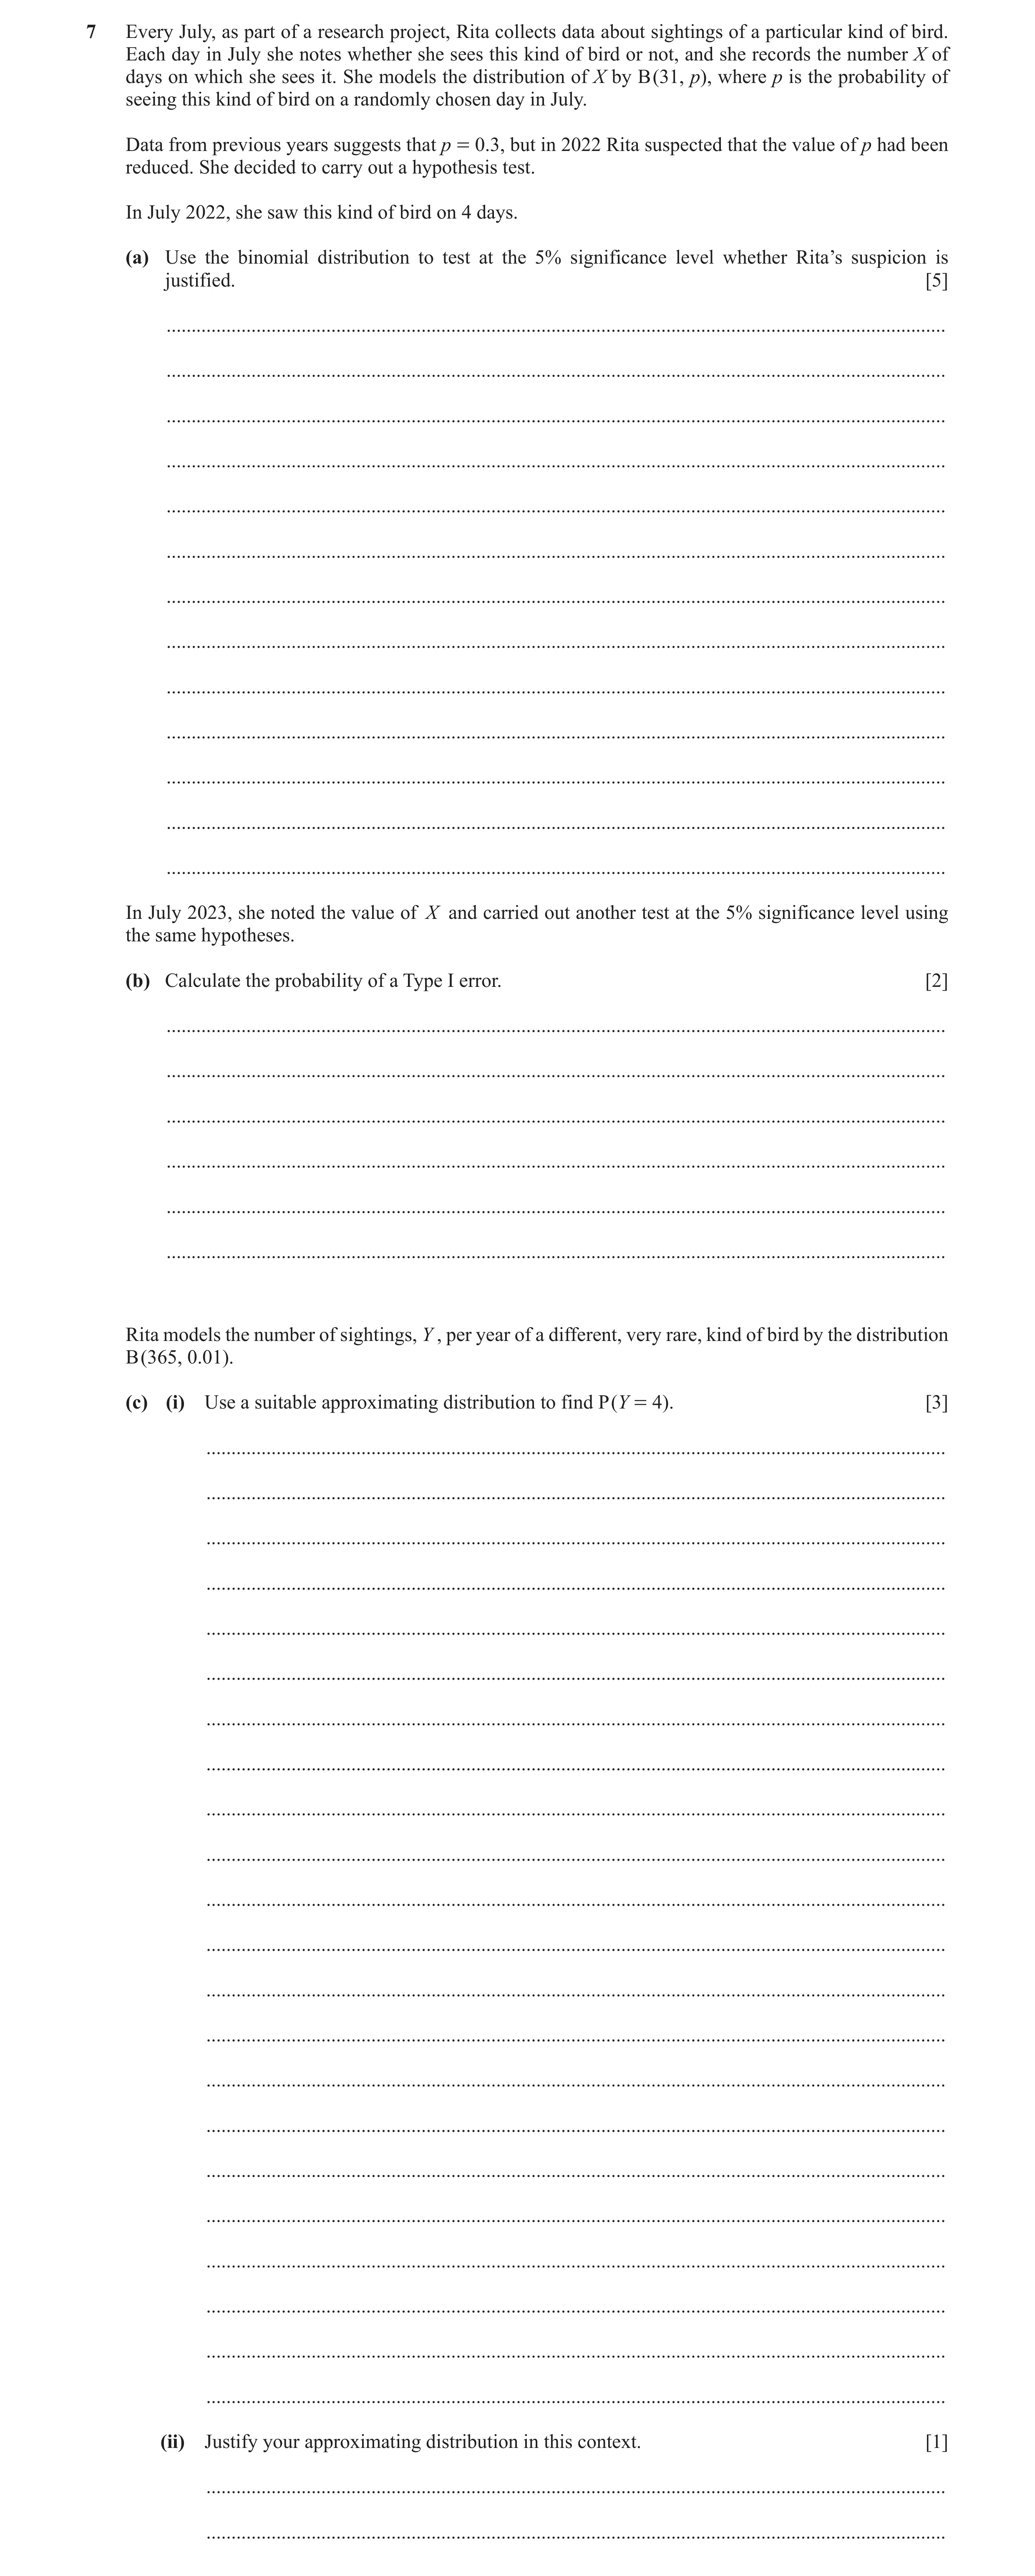
Q26 · Every July, as part of a research project, Rita collects data about sightings of a… 9709/61 May/June 2024
7 Every July, as part of a research project, Rita collects data about sightings of a particular kind of bird. Each day in July she notes whether she sees this kind of bird or not, and she records the number X of days on which she sees it. She models the distribution of X by B (31, p), where p is the probability of seeing this kind of bird on a randomly chosen day in July. Data from previous years suggests that p = 0.3, but in 2022 Rita suspected that the value of p had been reduced. She decided to carry out a hypothesis test. In July 2022, she saw this kind of bird on 4 days. (a) Use the binomial distribution to test at the 5% significance level whether Rita’s suspicion is justified. [5] … … … … … … … … … … … … … In July 2023, she noted the value of X and carried out another test at the 5% significance level using the same hypotheses. (b) Calculate the probability of a Type I error. [2] … … … … … … Rita models the number of sightings, Y , per year of a different, very rare, kind of bird by the distribution B (365, 0.01). (c) (i) Use a suitable approximating distribution to find P (Y = 4). [3] … … … … … … … … … … … … … … … … … … … … … … (ii) Justify your approximating distribution in this context. [1] … …
11 marks
Mark scheme: 7(a) H1: p < 0.3 B(31, 0.3), P(X ⩽ 4) = 0.731 + 31×0.730×0.3 + 31C2×0.729×0.32 + 31C3×0.728×0.33 + 31C4×0.727×0.34 = 0.00001577 + 0.0002096 + 0.0013475 + 0.0055826 + 0.016748 M1 No end errors. = 0.0239 (3sf) A1 SC 0.0239 with no working scores B1. ‘0.0239’ < 0.05 M1 Valid comparison. [reject H0] ‘There is sufficient evidence (at 5% level) to support Rita’s suspicion’, or ‘There is sufficient evidence to suggest the probability of seeing this type of bird has decreased’ A1FT In context. Not definite. No contradictions. FT their 0.0239. 5 7(b) P(X < 5) = [‘0.0239’ + 31C5×0.726×0.35] = 0.0627 [which is > 0.05] B1FT Attempt P(X ⩽ 5). Only FT if > 0.05. Only FT their 0.0239 if P(X ⩽ 4) attempted in (a); arithmetic error only. P(Type I error) = ‘0.0239’ B1FT Only FT their 0.0239 if P(X ⩽ 4) attempted in (a); arithmetic error only and their 0.0239 < 0.05. 2 Question Answer Marks Guidance 7(c)(i) [λ=] 3.65 B1 Stated or implied. e−3.65 × 4 3.65 4! M1 Must see expression. Any λ. = 0.192 (3sf) A1 SC: Use of Binomial. 0.193 scores B1. SC: 0.192 with no working scores B1 B1. 3 7(c)(ii) n = 365 > 50 np = 3.65 < 5 or p = 0.01 < 0.1 B1 Explicit. Both needed. Note: and ‘n large, p small’ is insufficient. 1
This question in 9709/61 May/June 2024
Q27 · A random variable X has the distribution Po ( 145) 9709/62 May/June 2024
1 A random variable X has the distribution Po ( 145) . (a) Use a suitable approximating distribution to calculate P ( X G 150 ) . [4] … … … … … … … … … … … … … … … … … (b) Justify the use of your approximating distribution in this case. [1] … … … … … … … …
5 marks
Mark scheme: 1(a) N(145, 145) B1 Stated or implied. ± 150.5 145 145 [= ±0.457] M1 Condone incorrect or omitted continuity correction. Φ(‘0.457’) M1 For area consistent with their working. = 0.676 (3sf) A1 SC: Unsupported answer of 0.676 scores B3. Unsupported answer of 0.646 or 0.661 scores B2. Unsupported answer of 0.6799 scores B1. 4 1(b) 145 > 15 B1 Explicit. λ > 15 B0 if λ = 145 not stated. Accept ⩾ Accept mean for λ. 1
This question in 9709/62 May/June 2024
Q28 · The number of goals scored by a sports team in the first half of any match has the… 9709/62 May/June 2024
5 The number of goals scored by a sports team in the first half of any match has the distribution X + Po ( 3. 1) . The number of goals scored by the same team in the second half of any match has the distribution Y + Po ( 2.4) . You may assume that the distributions of X and Y are independent. (a) Find P ( X 1 4) . [2] … … … … … … … … … … (b) Find the probability that, in a randomly chosen match, the team scores at least 5 goals. [3] … … … … … … … … … … … … … … (c) Given that the team scores a total of 5 goals in a randomly chosen match, find the probability that they score exactly 3 goals in the first half. [4] … … … … … … … … … … … … … … … … … … … … … … … … … … …
9 marks
Mark scheme: 5(a) e−3.1(1 + 3.1 + 2 3 3.1 3.1 2! 3! ) or e−3.1(1 + 3.1 + 4.805 + 4.965) or 0.0450 + 0.1397 + 0.2165 + 0.22368 M1 Condone one end error. Any λ. Accept fully correct Σ notation. Expression must be seen. = 0.625 (3sf) A1 Correct answer with no working scores SC B1. 2 Question Answer Marks Guidance 5(b) [λ]= 5.5 B1 SOI 1 − e−5.5(1 + 5.5 + 2 3 4 5.5 5.5 5.5 2! 3! 4! ) or 1 − e−5.5(1 + 5.5 + 15.125 + 27.7292 + 38.1276) or 1 − e−5.5(0.004087 + 0.0224772 + 0.061812 + 0.113323 + 0.155819) M1 Condone one end error. Any λ. Accept fully correct Σ notation. Expression must be seen. = 0.642 or 0.643 (3sf) A1 Correct answer with no working scores SC B1 B1. 3 5(c) [P(X = 3) × P(Y = 2) = ] = e−3.1× 3 3.1 3! × e−2.4 × 2 2.4 2! or 0.223676 × 0.261267 [= 0.05844] M1 Find P(3 in first half AND 2 in second half). Must see expression. [P(total 5) = ] 5 5.5 5.5 5! e or 0.17140 M1 Use of 5.5 to find P(5). P(P(exactly 3 in 1st half given total 5) = st exactly 3 in 1 half and total 5) total 5) P( P( M1 Attempt at conditional probability; numerator = their 0.05844 and denominator = P(total 5) Note: ( 3 3.1 3! × 2 2.4 2! )÷( 5 5.5 5! ) scores M1 M1 M1. [= '0.05844' '0.17140' ] = 0.341 (3sf) A1 4
This question in 9709/62 May/June 2024
Q29 · The independent random variables X and Y have the distributions Po(1.9) and Po(2.2)… 9709/63 May/June 2024
7 The independent random variables X and Y have the distributions Po(1.9) and Po(2.2) respectively. (a) Find P ( X + Y 1 4 ) . [3] … … … … … … … … … (b) Find the probability that X = 2 given that X + Y 1 4 . [4] … … … … … … … … … … … … … … … … (c) A sample of 60 randomly chosen pairs of values of X and Y is taken, and the value of X + Y is calculated for each pair. The sample mean of these 60 values is found. Find the probability that the sample mean of X + Y is less than 4.0 . [6] … … … … … … … … … … … … … … … … … … … … … … … … … …
13 marks
Mark scheme: 7(a) λ = 1.9 + 2.2 [= 4.1] B1 e−4.1(1 + 4.1 + 2 4.1 2! + 3 4.1 3! ) or e−4.1(1 + 4.1 + 8.405 + 11.487) or 0.01657 + 0.06795 + 0.13929 + 0.19037 M1 Allow any λ. Allow one end error. Must see expression. = 0.414 (3sf) A1 SC: unsupported answer 0.414 scores B1 B1. 3 7(b) P(X + Y < 4 and X = 2) = P(2, 0 or 2, 1) M1 Stated or implied. = e−1.9× 2 1.9 2 (e−2.2 + e−2.2×2.2) [= 0.0957] M1 P(X = 2 | X + Y < 4) = '0.0957' '0.414' M1 Attempt P 4 and 2 ( ) P( 4) . X X Y X Y Prob for denominator can be found in (a). 0.231 (3sf) A1 4 Question Answer Marks Guidance 7(c) E(X + Y) = 4.1 Var(X + Y) = 4.1 or Po(246) B1 SOI Normal and var = 4.1 60 Or normal and var = 246 M1 4.0 4.1 4.1 60 or totals method 240 246 246 or use of continuity correction M1 No mixed methods. Or continuity correction: 1 120 4.0 4.1 (4.1 60) or 239.5 246 246 . Condone incorrect continuity correction for M1. = −0.383 (3sf) A1 = −0.414 Φ(‘−0.383’) = 1 − Φ(‘0.383’) M1 Φ(‘−0.414’) = 1 − Φ(‘0.414’) = 0.351 (3sf) A1 = 0.340 or 0.339 6
This question in 9709/63 May/June 2024
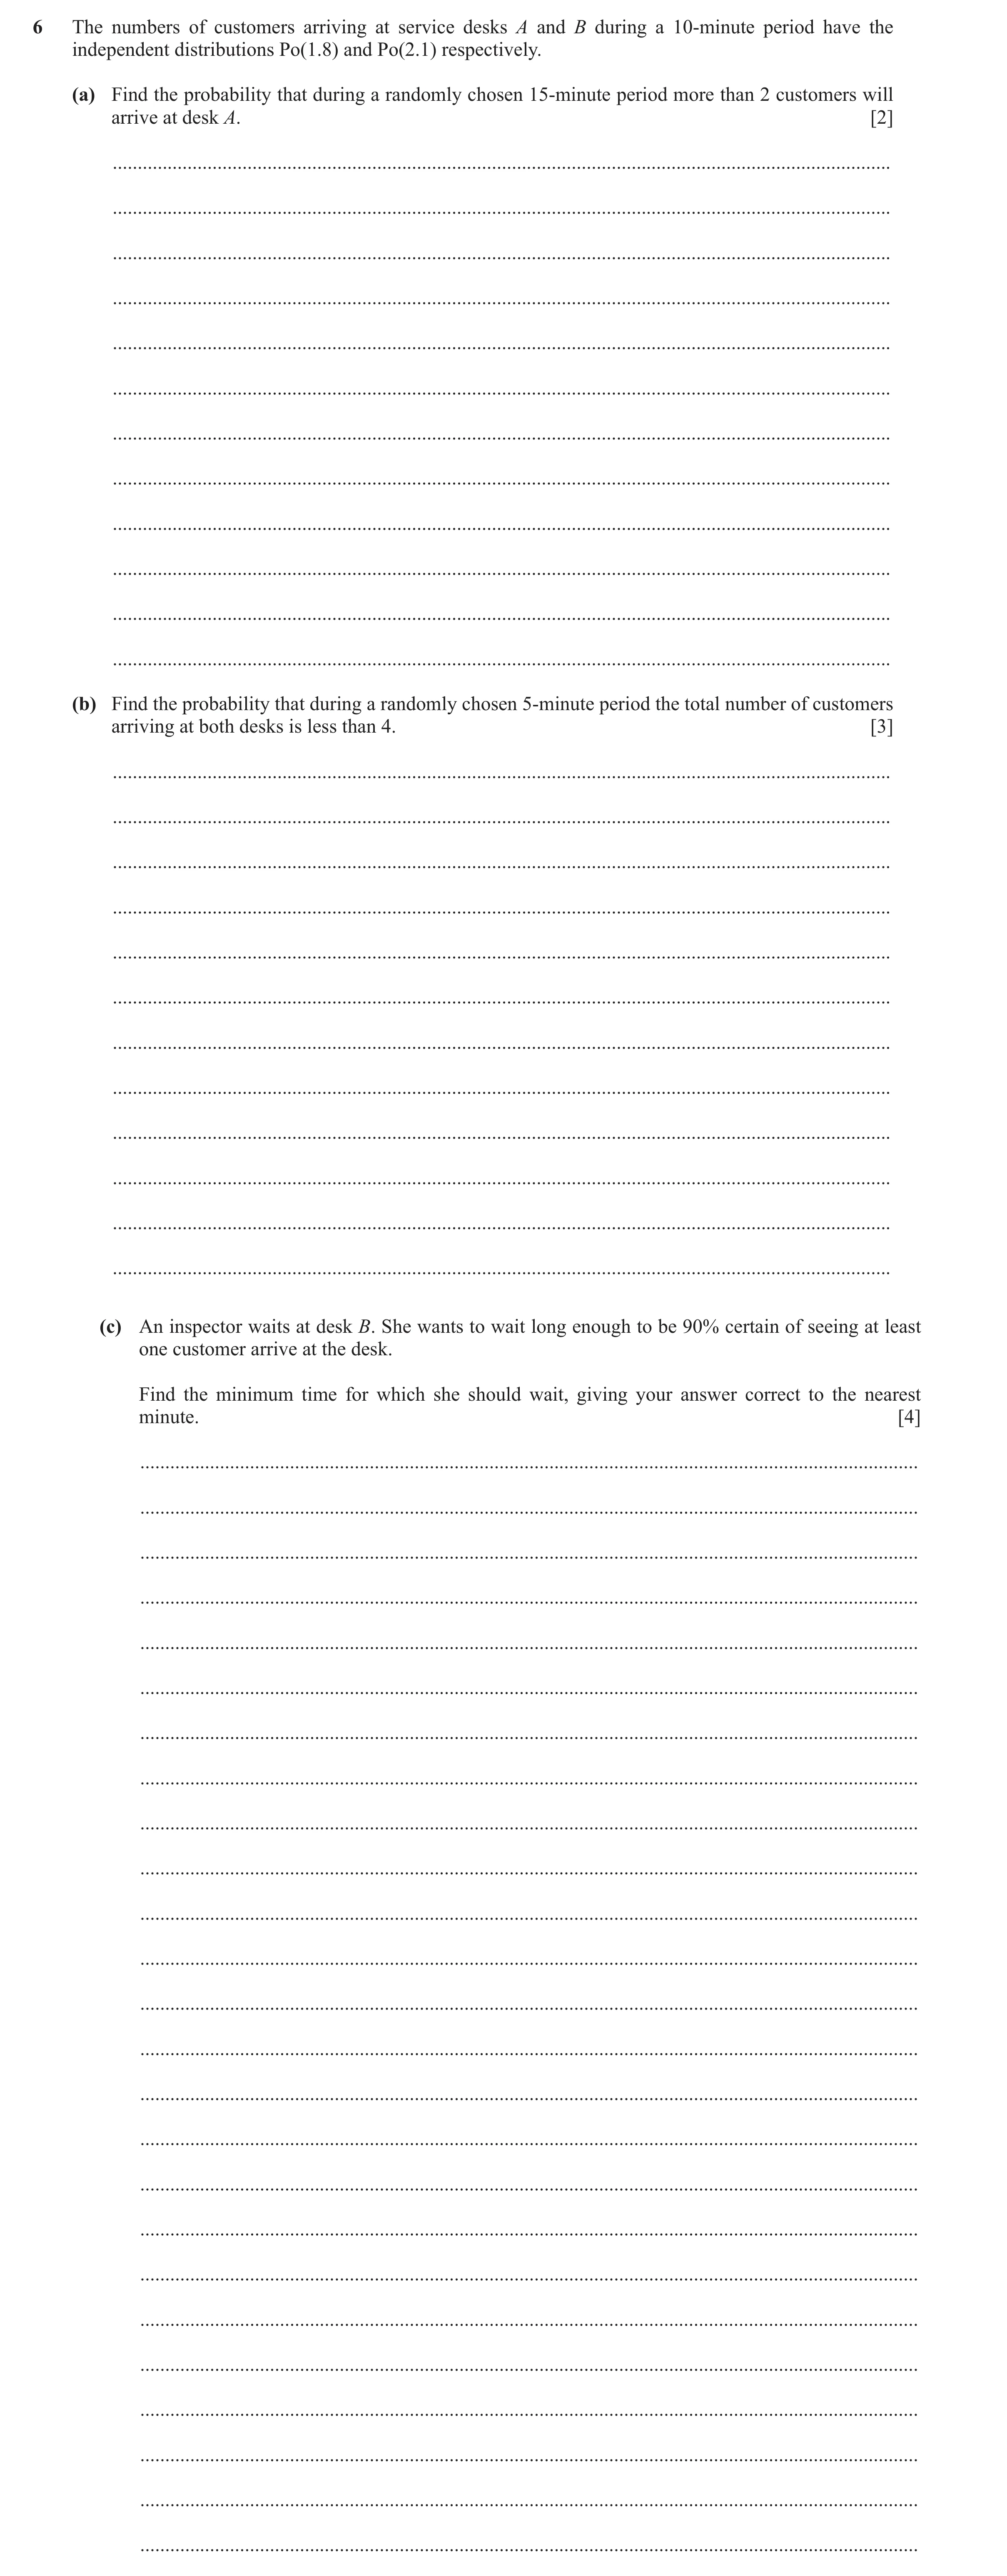
Q30 · The numbers of customers arriving at service desks A and B during a 10-minute period have… 9709/61 Oct/Nov 2024
6 The numbers of customers arriving at service desks A and B during a 10-minute period have the independent distributions Po(1.8) and Po(2.1) respectively. (a) Find the probability that during a randomly chosen 15-minute period more than 2 customers will arrive at desk A. [2] … … … … … … … … … … … … (b) Find the probability that during a randomly chosen 5-minute period the total number of customers arriving at both desks is less than 4. [3] … … … … … … … … … … … … (c) An inspector waits at desk B. She wants to wait long enough to be 90% certain of seeing at least one customer arrive at the desk. Find the minimum time for which she should wait, giving your answer correct to the nearest minute. [4] … … … … … … … … … … … … … … … … … … … … … … … … …
9 marks
Mark scheme: 6(a) [λ = 2.7] 1 − e−2.7(1 + 2.7 + 2.72 ) or 1 − e−2.7(1 + 2.7 +3.645) M1 Any λ. Allow one end error. 2 Must see expression. or 1- ( 0.06721 + 0.1815 + 0.2450 ) = 0.506 (3 sf) A1 SC unsupported answer 0.506 scores B1. 2 6(b) λ = 1.95 B1 e−1.95(1 + 1.95 + 1.952 + 1.953 ) or e−1.95(1 + 1.95 + 1.90125 +1.2358) M1 Any λ. Allow one end error. 2 3! Must see expression. or 0.1423 + 0.2774+ 0.2705 + 0.1758 = 0.866 A1 SC unsupported answer 0.866 scores B1B1. 3 6(c) 1 – e-2.1x ⩾ 0.90 or 1 – e−λ ⩾ 0.90 M1 OE Condone use of ‘=’ throughout. [e−2.1x < 0.1] or e−λ < 0.1 M1 Rearrange and attempt take logs of relevant form. −2.1x < ln0.1 or −λ < ln0.1 [ λ > 2.3026, 2.3026/2.1 ] 1.096 or 10.96 accept 1.097 or 10.97 *A1 Seen. She must wait for at least 11 minutes A1 dep SC Use of trial and improvement. Use of 1–e-λ any numerical λ (not 2.1) ie one trial M1. Use of enough trials to give an answer of 0.90 (2sf) M1. λ=2.30 i.e. 3sf accuracy AND 1.09… or 10.9 … A1. Then 11 A1 dep. 4
This question in 9709/61 Oct/Nov 2024
Q31 · 1 A random variable X has the distribution B e4500000, o 9709/62 Oct/Nov 2024
1 1 A random variable X has the distribution B e4500000, o. 1000000 Use a Poisson distribution to calculate an estimate of P ( X H 4) . [3] … … … … … … … … … … … … … … … … … … … … … … … … … …
3 marks
Mark scheme: Question Answer Marks Guidance 1 λ = 4.5 B1 1 − e−4.5(1 + 4.5 + 4.52 + 4.53 ) =1– e−4.5(1 + 4.5 +10.125 +15.1875) M1 Expression must be seen or implied by correct figures. 2 3! Any λ. Allow one end error. = 1– (0.011109 + 0.049999+0.11248 + 0.16872) Accept fully correct Σ notation. 0.658 (3 sf) A1 SC unsupported 0.658 scores B1 B1. 3
This question in 9709/62 Oct/Nov 2024
Q32 · The random variable X has the distribution Po(1.5) 9709/62 Feb/March 2025
3 The random variable X has the distribution Po(1.5). (a) Find P ( X H 3) . [2] … … … … … … … … … … … (b) Find the probability that the sum of three independent values of X is between 3 and 5 inclusive. [3] … … … … … … … … … … … … … … (c) The sum of a large number, n, of values of X is denoted by T. Using a suitable approximation, it was found that P ( T 2 330) = 0.0391, correct to 3 significant figures. Find the value of n. [5] … … … … … … … … … … … … … … … … … … … … … … … … … …
10 marks
Mark scheme: 3(a) 1 − e-1.5(1 + 1.5 + 1.52 ) = 1- e-1.5(1 + 1.5 +1.125) = 1-(0.22313 +0.334695 M1 Allow one end error. Accept fully correct sigma 2 notation. +0.25102) = 0.191 A1 SC unsupported correct answer scores B1. 2 3(b) λ = 4.5 B1 4.53 4.54 4.55 M1 Any λ. Allow one end error. Accept fully correct sigma e-4.5( + + )= e-4.5 (15.1875 +17.0859 + 15.3773) 3! 4! 5! notation. = 0.1687 + 0.1898+0.1708 = 0.529 A1 SC. Unsupported correct answer scores B1 B1. 3 3(c) T ~ N(1.5n, 1.5n) B1 May be implied. Φ−1(1 − 0.0391) [= 1.761] M1 Attempted. 330.5 −1.5 n M1* Attempt to standardise and = Φ−1(1 − 0.0391). = 1.761 Allow no or incorrect cc instead of 330.5. 1.5 n Note: (330.5–1.5n)/√1.5 scores either B1M0* or B0M1* [1.5n +1.761 1.5n − 330.5 = 0 or 1.5n + 2.1568 n − 330.5 = 0 or 2.25n2 - M1dep Correctly forming and valid attempt to solve a quadratic 996.1516n +109230.25 = 0] equation in n or n or √(1.5n) OE. SOI by correct answer. [ n = 14.14 [or −15.58] ] n = 200 (only) A1 Dep 330.5 used. 5
This question in 9709/62 Feb/March 2025
Q33 · The random variables W and X have the independent distributions Po(1.2) and Po(2.3)… 9709/61 May/June 2025
5 (a) The random variables W and X have the independent distributions Po(1.2) and Po(2.3) respectively. (i) Find P ( 3 G W + X G 5) . [2] … … … … … … The random variable S is the sum of 100 independent values of W and 200 independent values of X. (ii) Use a suitable approximation to find P ( S 2 600 ) . [6] … … … … … … … … … … … … … … … … … … (b) The random variable Y has the distribution Po ( m) , where m 2 0 . 5 It is given that P ( Y = 3) + P ( Y = 4) = P ( Y = 5 ) . 2 Find the value of m. [3] … … … … … … … … … … … … … … … … … … … … … … … … … …
11 marks
Mark scheme: 5(a)(i) -3.5 3.53 3.5 4 3.55 -3.5 M1 Any λ, allow one end error. e + + = e (7.1458 + 6.2526 + 4.37682) = Must see expression or terms. 3! 4! 5! 0.21579 + 0.18881 + 0.13217 = 0.537 A1 SCB1 for unsupported answer of 0.537. 2 5(a)(ii) Use of N(1.2 ×100 + 2.3 × 200, …) = N(580, ….) B1 SOI give at early stage. Var(S) = 1.2 × 100 + 2.3 × 200 = 580 M1 SOI give at early stage. 600.5 − '580' M1 For standardising with their values. Allow with omitted or incorrect continuity '580' correction. = 0.851 A1 1 – Φ(‘0.581’) M1 For area consistent with their working = 0.197 (3sf) A1 6 5(b) 5 λ 3 λ 4 λ 5 5 − 3 − 4 − 5 B1 Accept with or without each term multiplied by e-λ. × + = Or e +e = e 2 3! 4! 5! 2 3! 4! 5! 2 − 5− 50 = 0 M1 Legitimately obtain quadratic in λ. 5 ± 25 + 4 × 50 A1 ( λ − 10 )( λ + 5 ) = 0 or λ = 2 Alone. λ = 10 3
This question in 9709/61 May/June 2025
Q34 · The random variable X has the distribution Po ( 15) 9709/62 May/June 2025
3 The random variable X has the distribution Po ( 15) . (a) Write down an expression in terms of e for P ( X = 12) . [1] … … It is given that P ( X = n) = P ( X = n + 1 ) . (b) Write down an equation in n, and hence find the value of n. [3] … … … … … … … … … … … … … … … … … … … … … …
4 marks
Mark scheme: 3(a) 12 B1 Seen. 15 e−15 × 12! 1 3(b) n n +1 B1 If brackets (n+1)! missing allow benefit of doubt. 15 15 e-15 × = e-15 × n ! ( n +1)! 15 M1 OE. 1 = n+1 Attempt to legitimately remove powers and factorials i.e. powers reduced to 15/λ seen, and factorials reduced to n + 1 seen. n = 14 A1 Note: Trial and error solutions: B1B2 for 14. 3
This question in 9709/62 May/June 2025
Q35 · Use suitable approximating distributions to answer the following 9709/62 May/June 2025
6 Use suitable approximating distributions to answer the following. (a) The random variable W has the distribution B ( 700 , 0 .005 ) . (i) Find P ( W H 4) . [3] … … … … … … … … … Two values of W are chosen at random. (ii) Find the probability that the sum of these two values is less than 3. [3] … … … … … … … … … … … … … … (b) The random variable X has the distribution Po ( 200) . Use a suitable approximating distribution to find P ( X 2 205) . [4] … … … … … … … … … … … … … … … … … … … … … … … … … …
10 marks
Mark scheme: 6(a)(i) (λ) = 3.5 B1 2 3 M1 Any λ. Expression or terms must be seen. 3.5 3.5 1 − e−3.5(1 + 3.5 + + ) = 1- e-3.5 (1 + 3.5 + 6.125 + 7.1458) 2! 3! Allow one end error. Accept fully correct Σ notation. = 1 – ( 0.030197 + 0.105691+ 0.1849589 + 0.215785) = 0.463 (3 sf) A1 SC Unsupported correct answer scores B1B1 SC Use of Binomial scores B1 for 0.464. Note: Use of Normal can score B1 for mean =3.5. 3 6(a)(ii) (λ =) 7 B1 Seen. 2 M1 Any λ. Expression or terms must be seen. 7 e−7(1 + 7 + ) = e-7 ( 1 + 7 + 24.5) = 0.0009119 + 0.006383 + 0.0223411 2! Allow one end error Accept fully correct Σ notation. Accept combination method for Poisson (6 combinations) allow 6 correct combinations identified B1, attempt to calculate and combine at least four correct combinations M1. = 0.0296 (3 sf) A1 SC Unsupported correct answer scores B1B1. SC Use of Bin B1 for 0.0294. Note: Use of Normal can score B1 for mean =7. 3 6(b) N(200, 200) M1 SOI. 205.5 − 200 M1 Allow with omitted or incorrect cc. [= 0.38891] 200 1 − Φ(“0.38891”) M1 For finding area consistent with their values. = 0.349 (3 sf) A1 4
This question in 9709/62 May/June 2025
Q36 · The random variable X has the distribution Po(1.5) 9709/65 May/June 2025
1 The random variable X has the distribution Po(1.5). The sum of three independent values of X is denoted by S. (a) Find P( S G 3 ) . [3] … … … … … … … … … … … … P( S G 2 ) 125 (b) Show that the exact value of is . [3] P( S G 1 ) 44 … … … … … … … … … … … … …
6 marks
Mark scheme: Question Answer Marks Guidance 1(a) λ = 4.5 B1 SOI. e-4.5(1 + 4.5 + 4.52!2 + 4.53!3 )= e −4.5 (1 + 4.5 + 10.125 + 15.1875 ) M1 Allow any λ; allow one end error; expression or terms must be seen. = 0.01111 + 0.04999 + 0.11248 + 0.16872 = 0.342 (3 sf) A1 SC Unsupported answer of 0.342 scores B1. 3 1(b) P(S ⩽ 1) = e–4.5(1 + 4.5) or 5.5e–4.5 M1 For either expression. or P(S ⩽ 2) = e–4.5(1 + 4.5 + 4.52 2 ) or 1258 e-4.5 Allow any , allow one end error. P(S ⩽ 2) ÷ P(S ⩽ 1) [= 1258 ÷ 5.5] M1 Both expressions. No end error, = 4.5 . Division attempted. Allow in decimal form for this mark. P( S 2) 125 A1 AG. = 44 P( S 1) Must be exact, not decimal approximation. No decimals seen (condone exact decimals). 4.5 2 Convincingly obtained, 1 + 4.5 and 1 + 4.5 + 2 evaluated. 3
This question in 9709/65 May/June 2025
 5 / 56
 8 / 56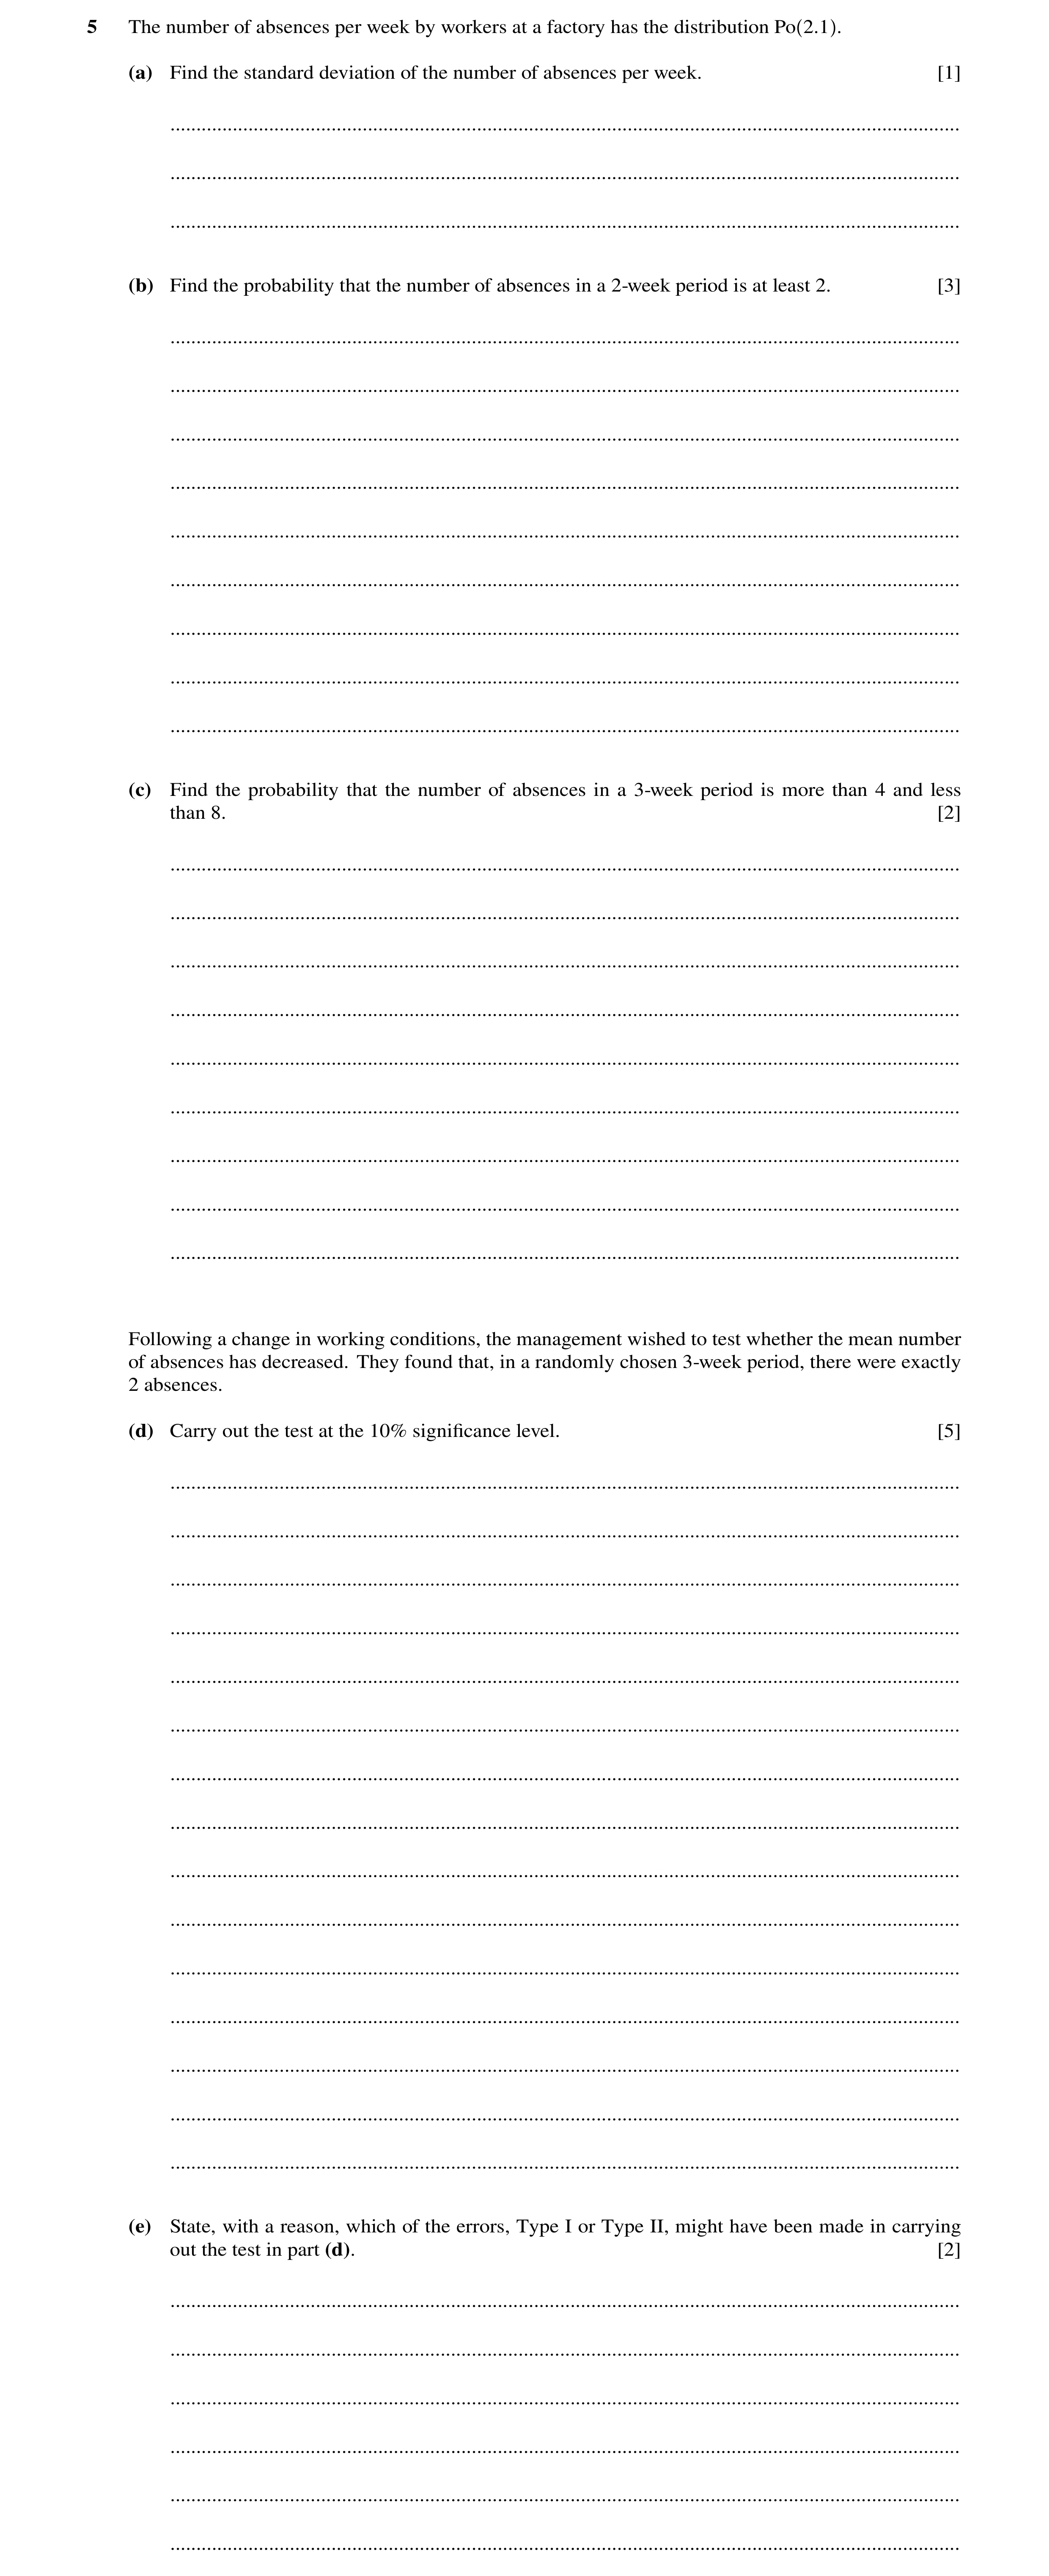
 11 / 56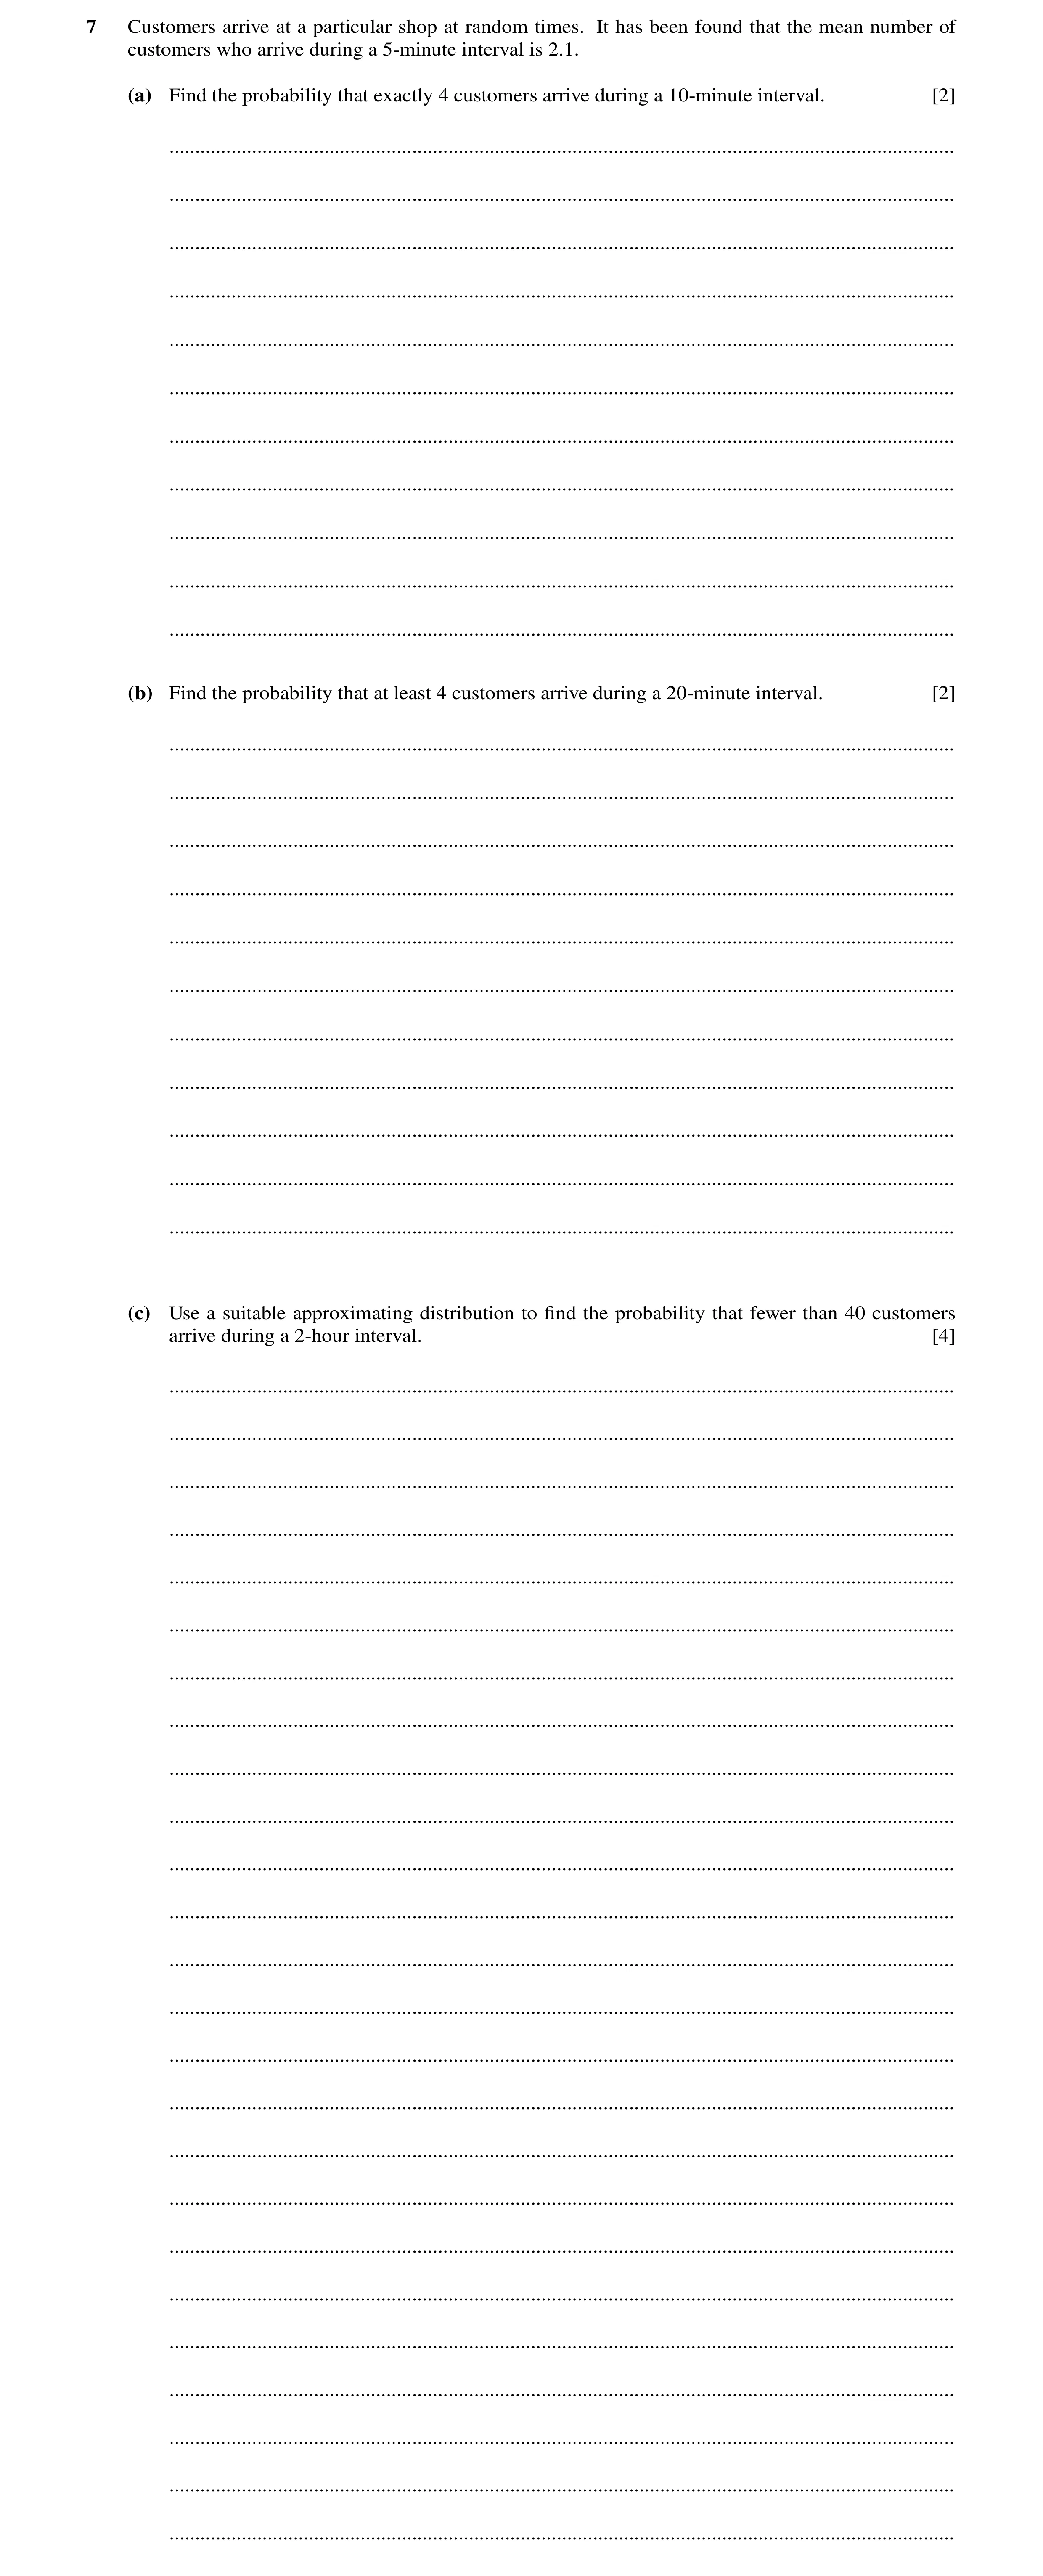
 14 / 56
 15 / 56
 16 / 56
 19 / 56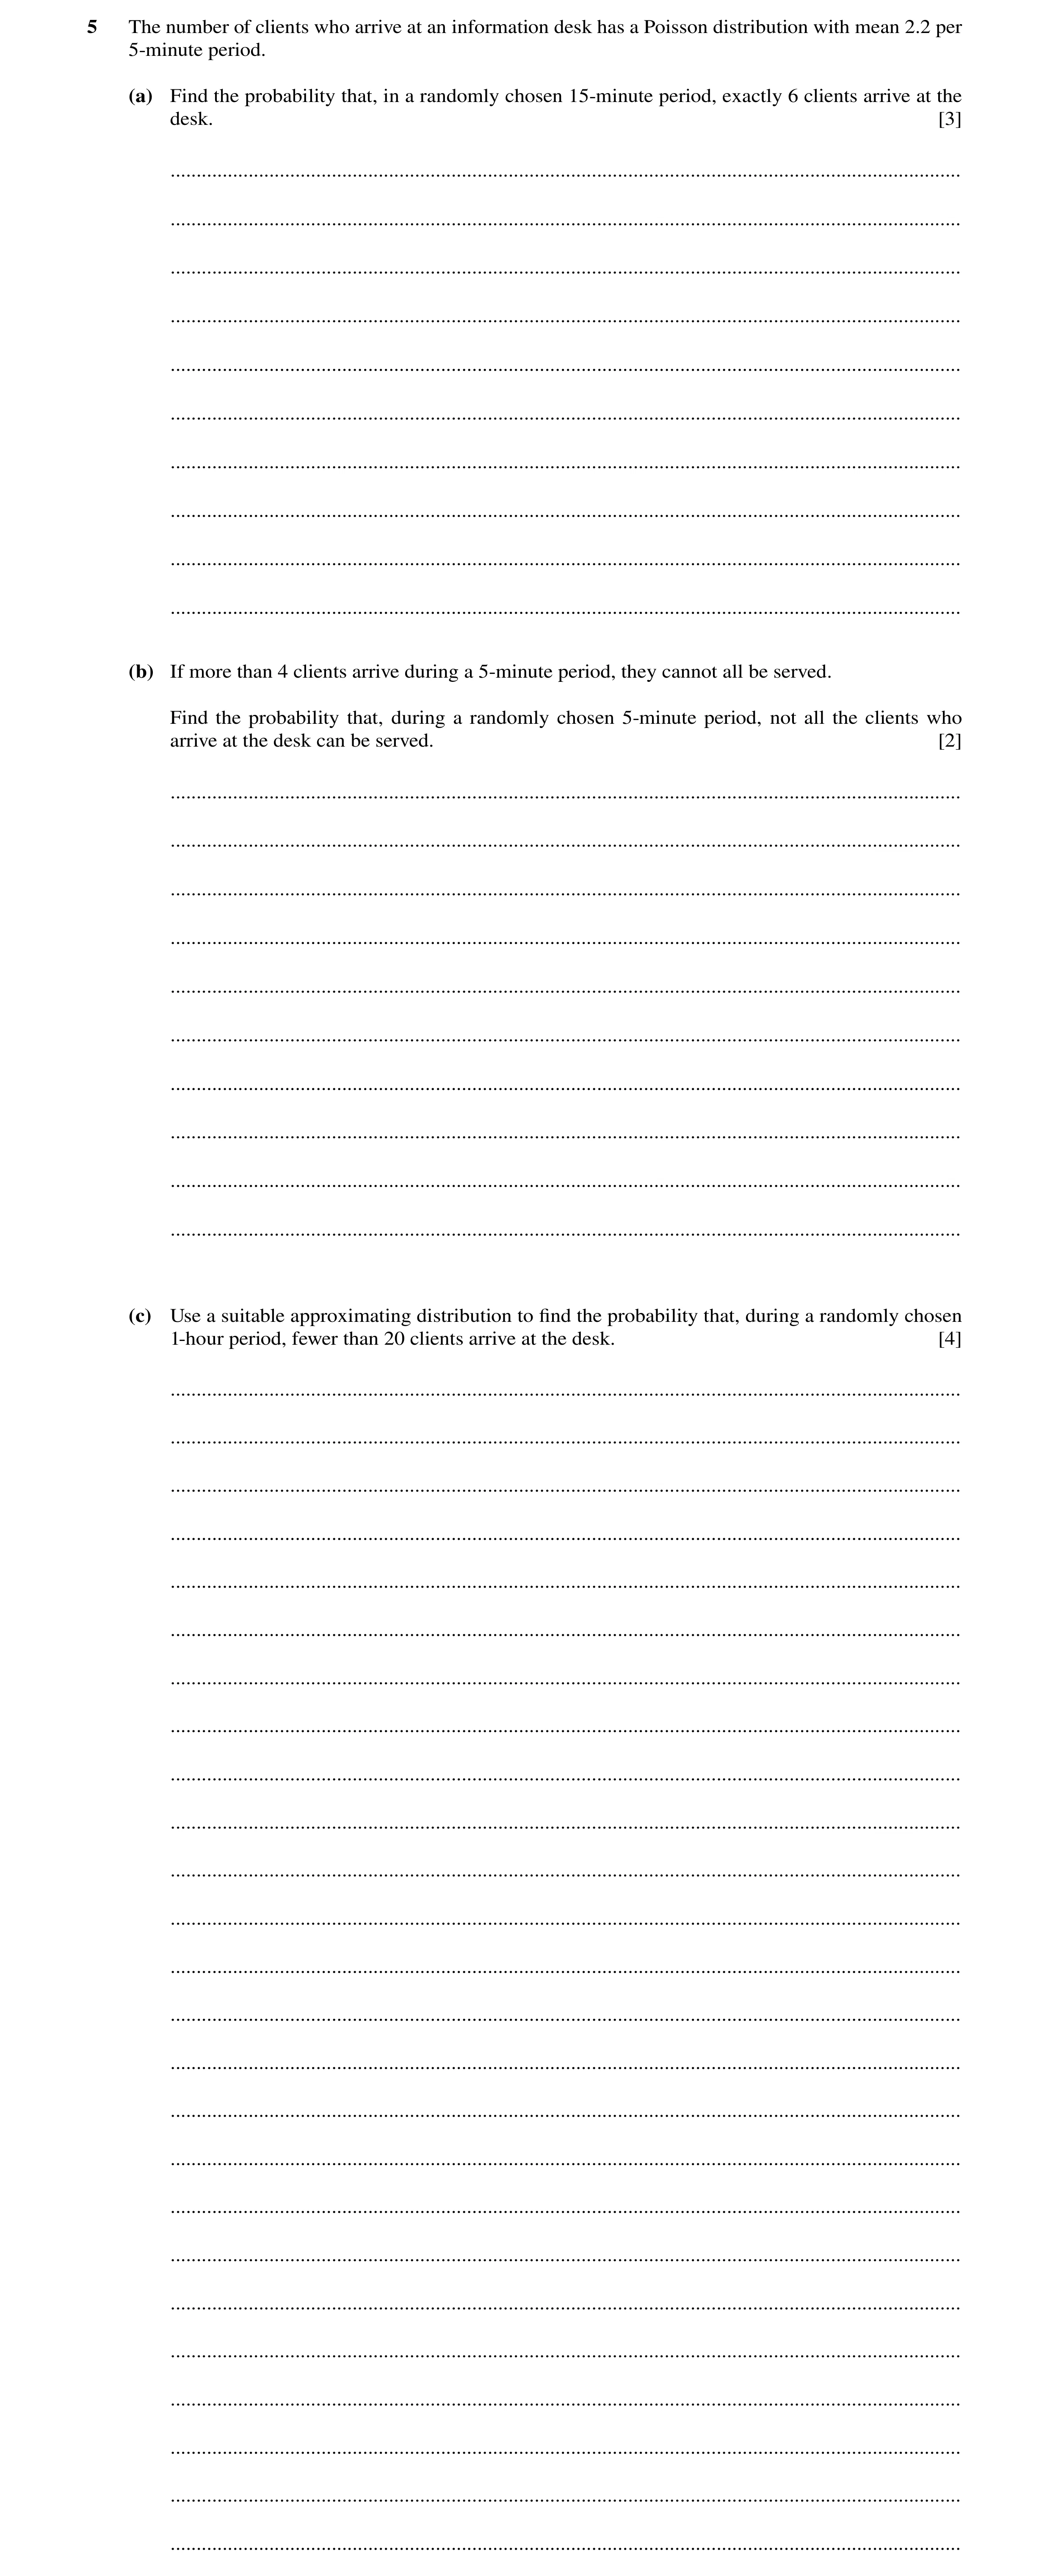
 22 / 56
 23 / 56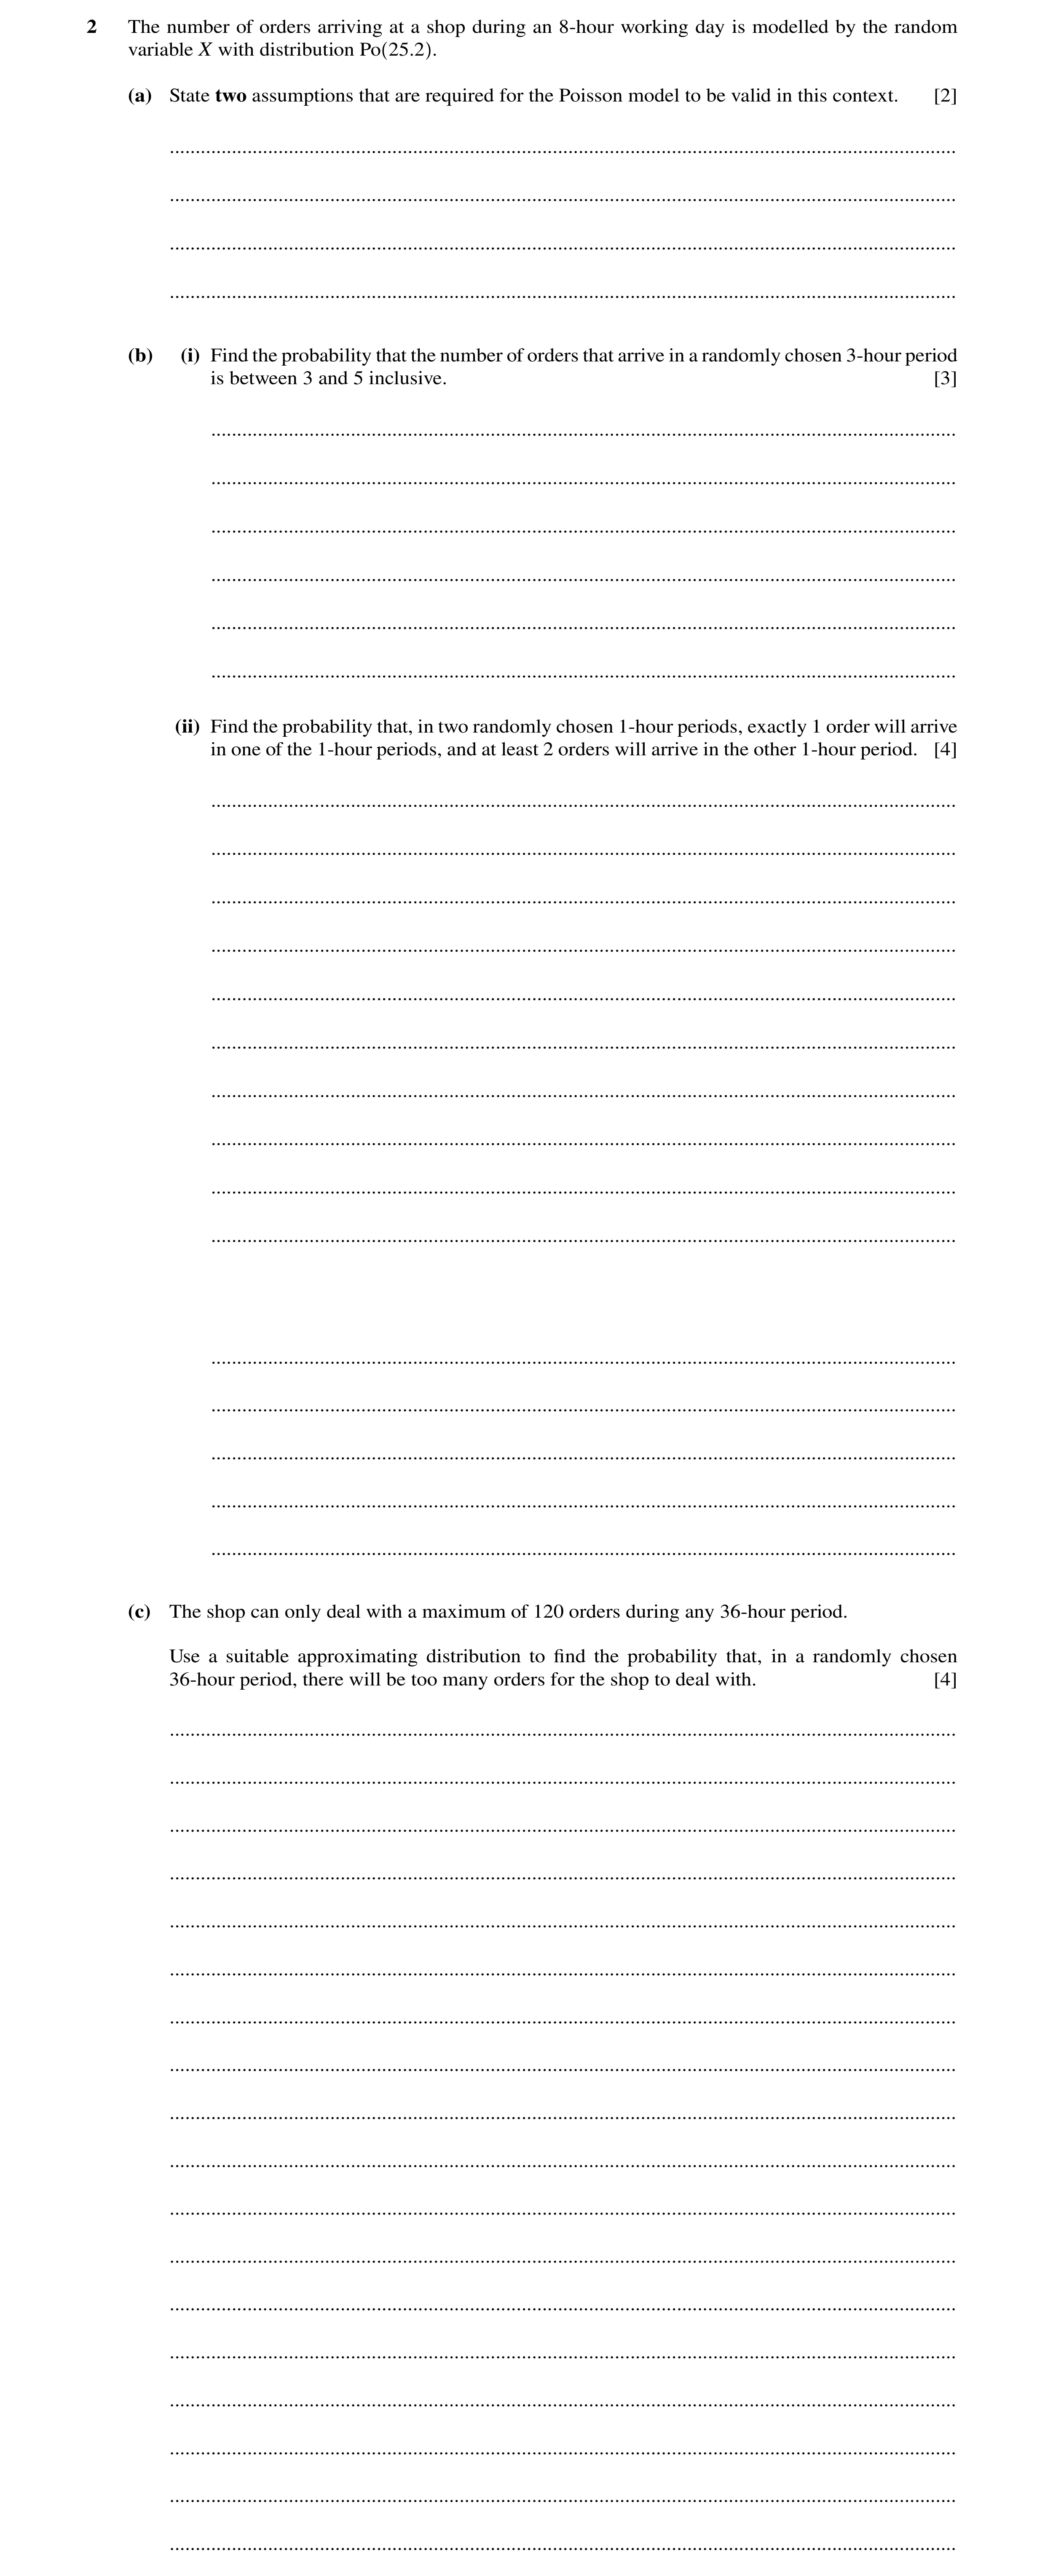
 26 / 56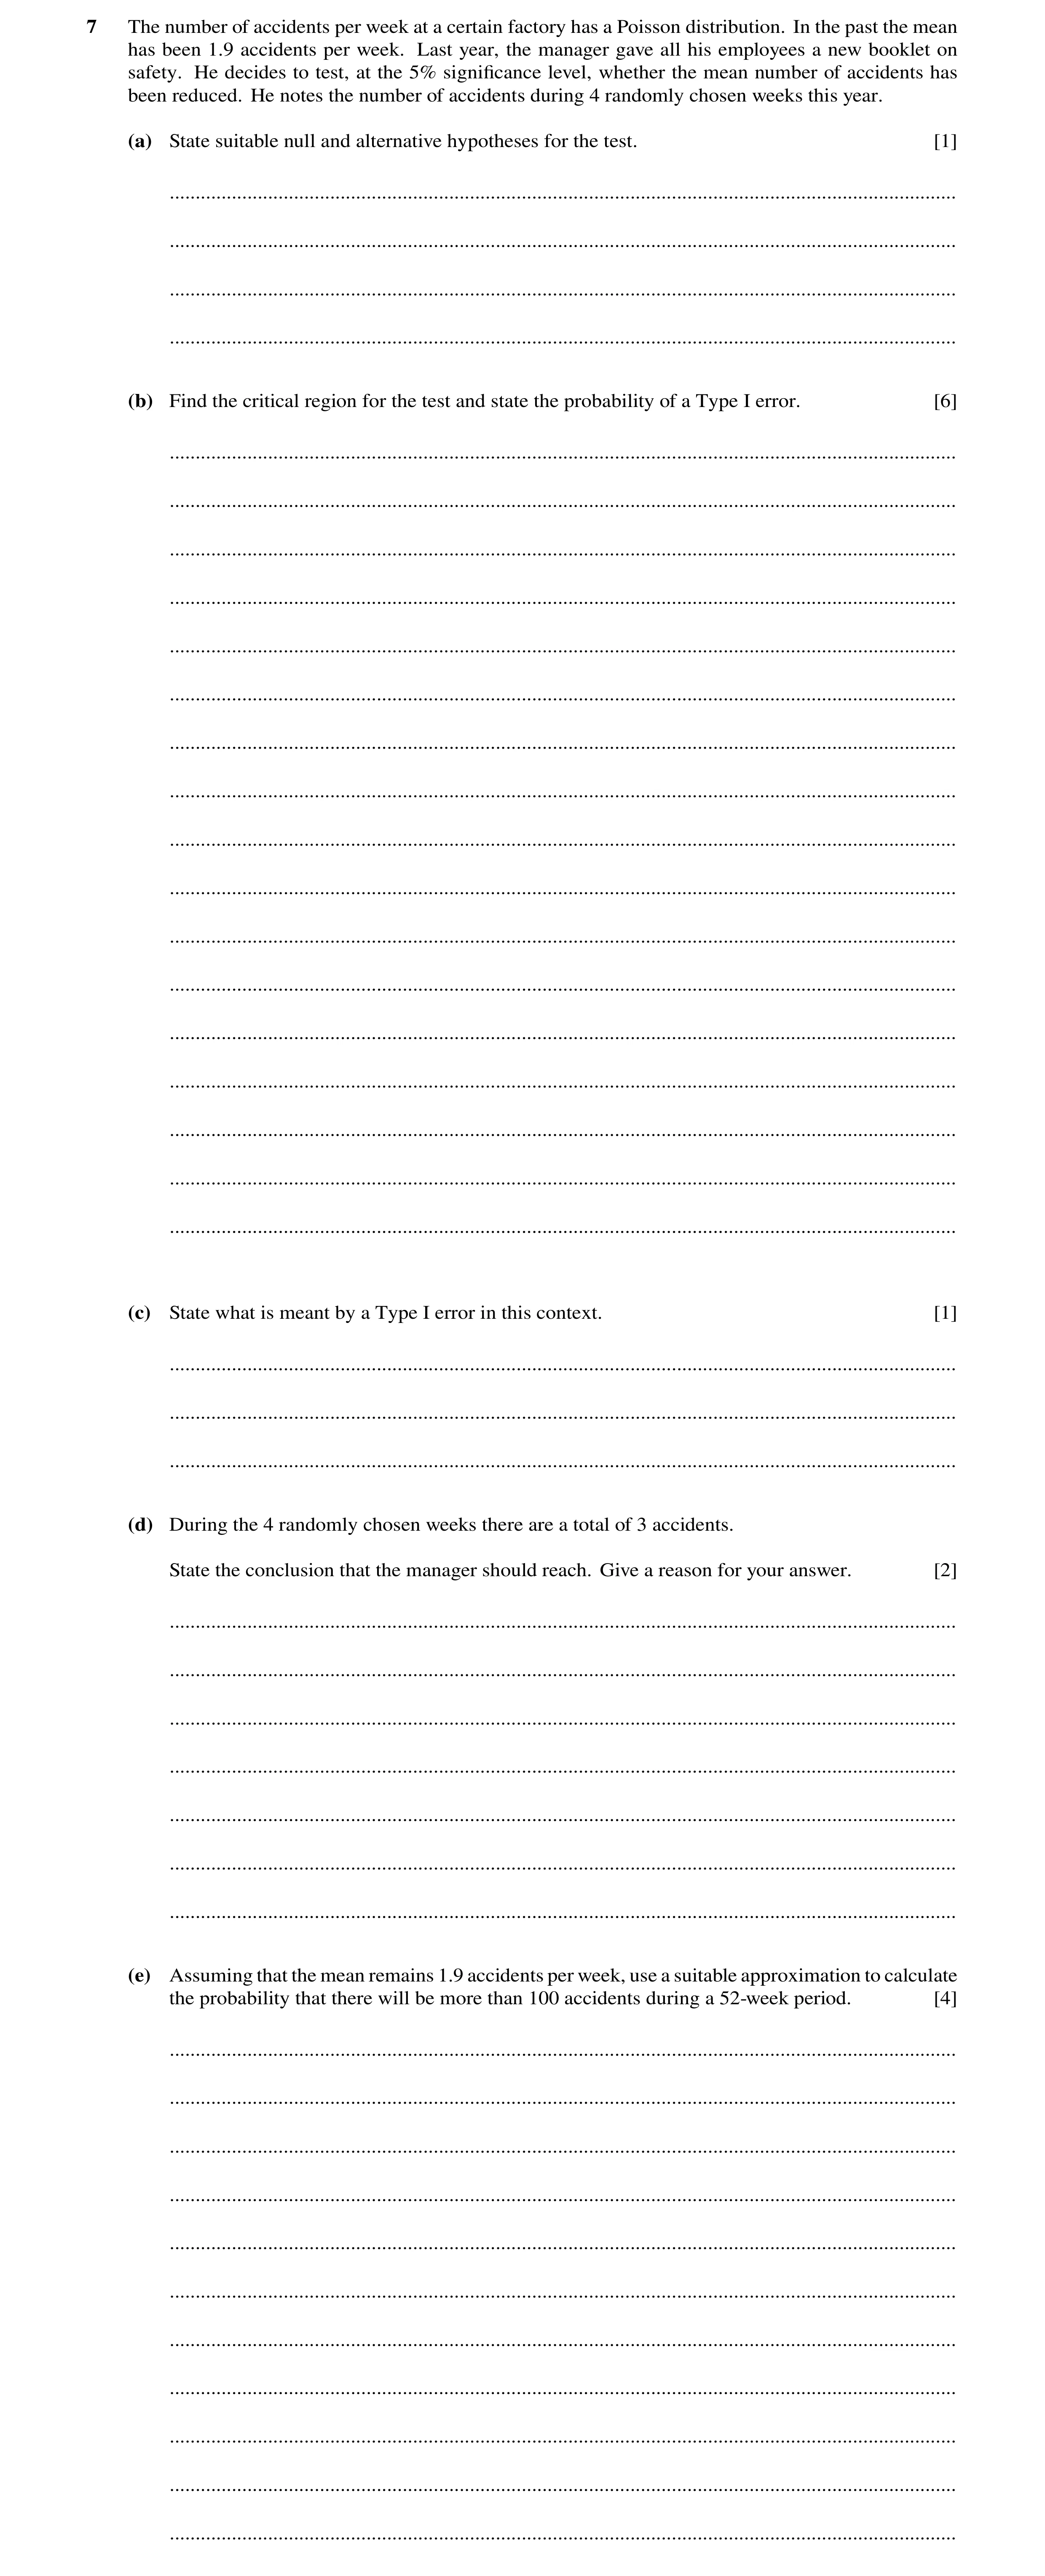
 36 / 56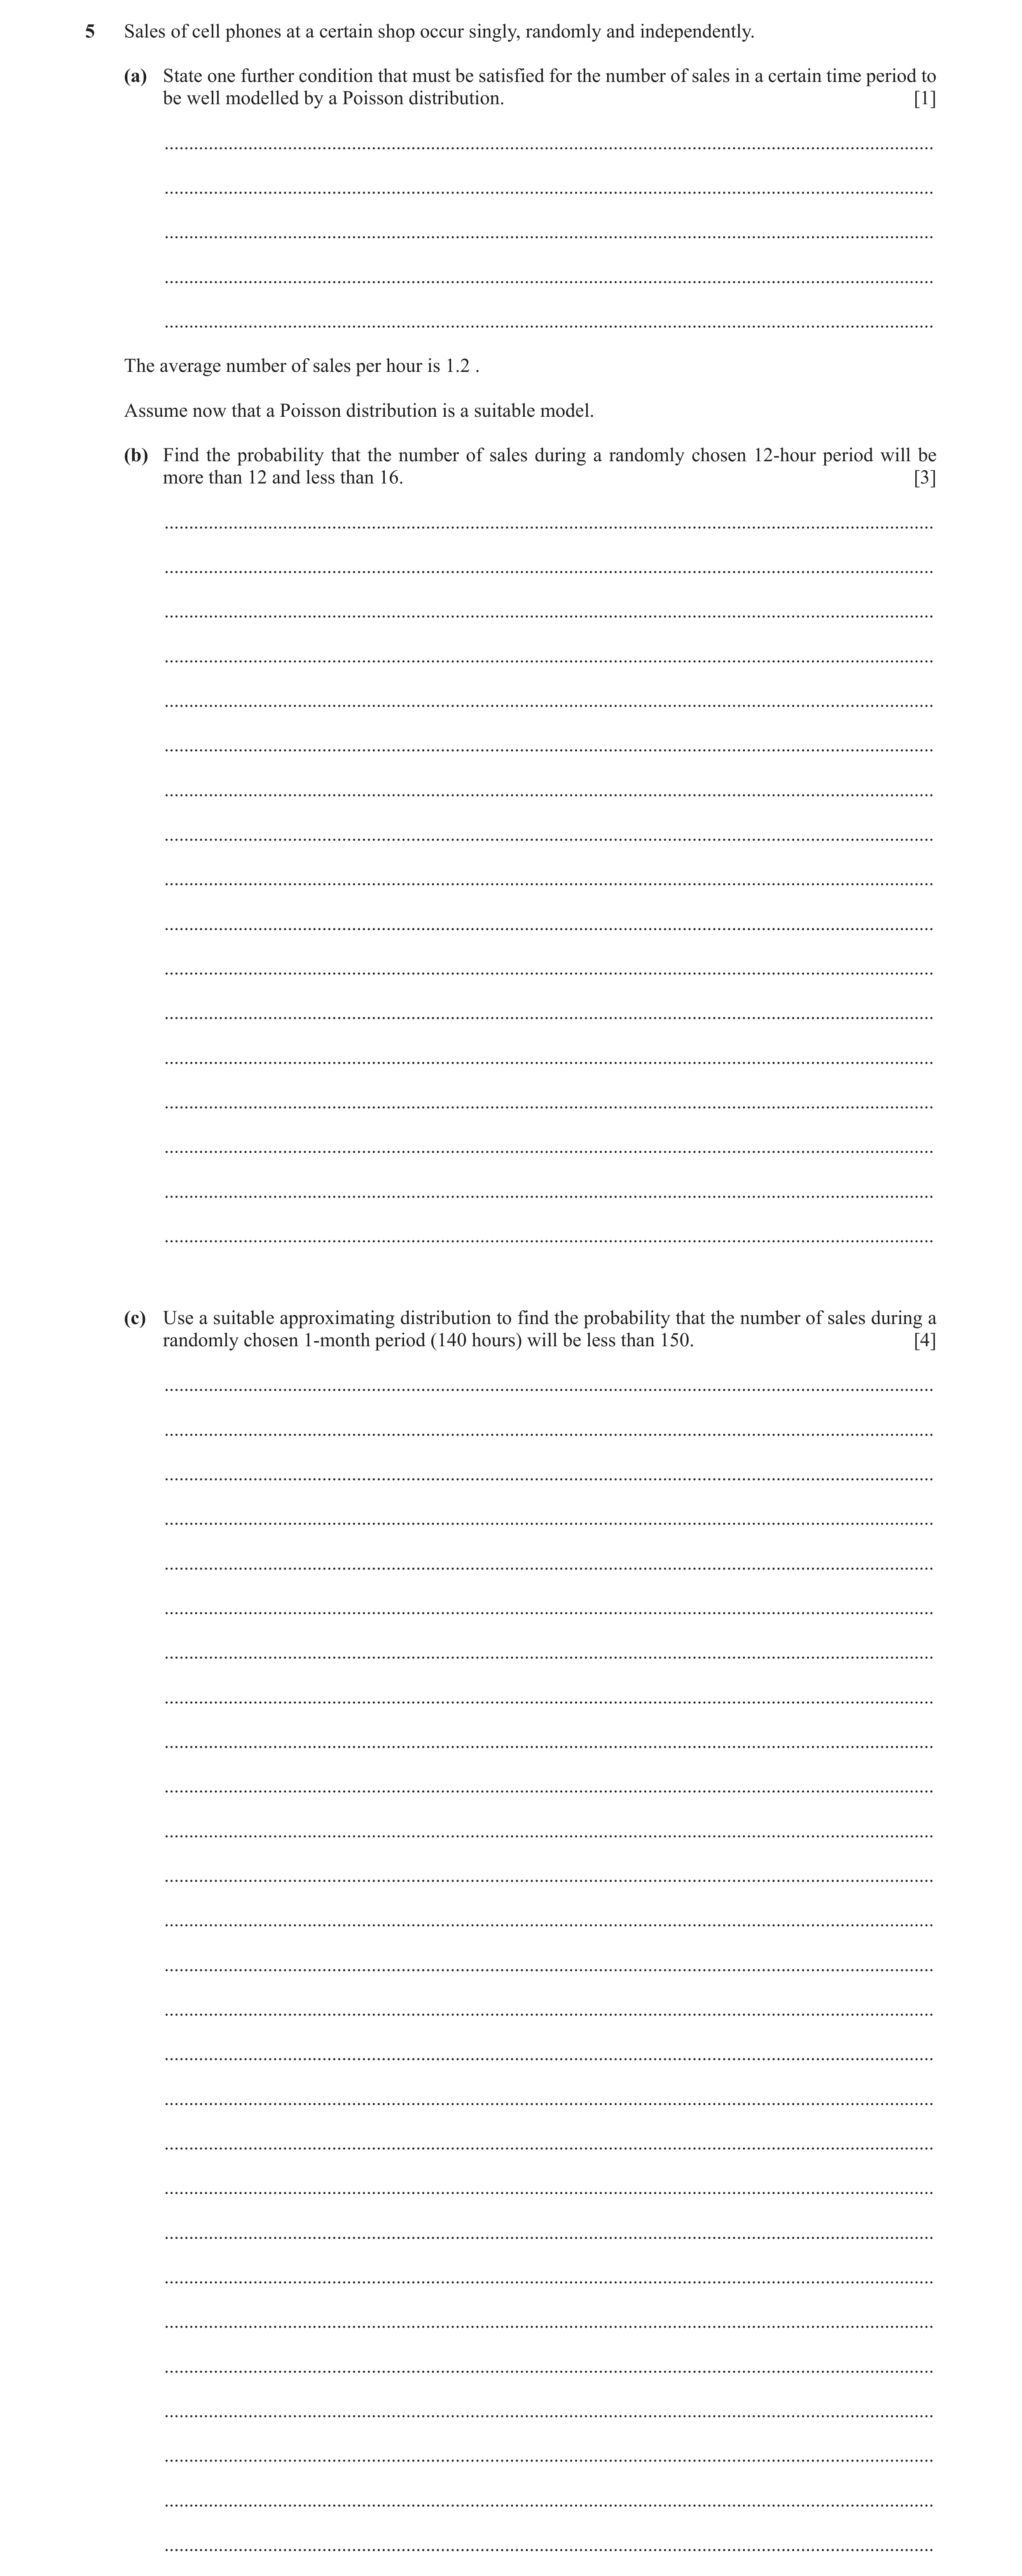
![Question 27: A random variable X has the distribution Po ( 145) . (a) Use a suitable approximating distribution to calculate P ( X G 150 ) . [4] .......…](https://img.pastlit.com/crops/ed14c923-8ab1-4c82-b201-182fb2d7e92c/q1.webp) 41 / 56
41 / 56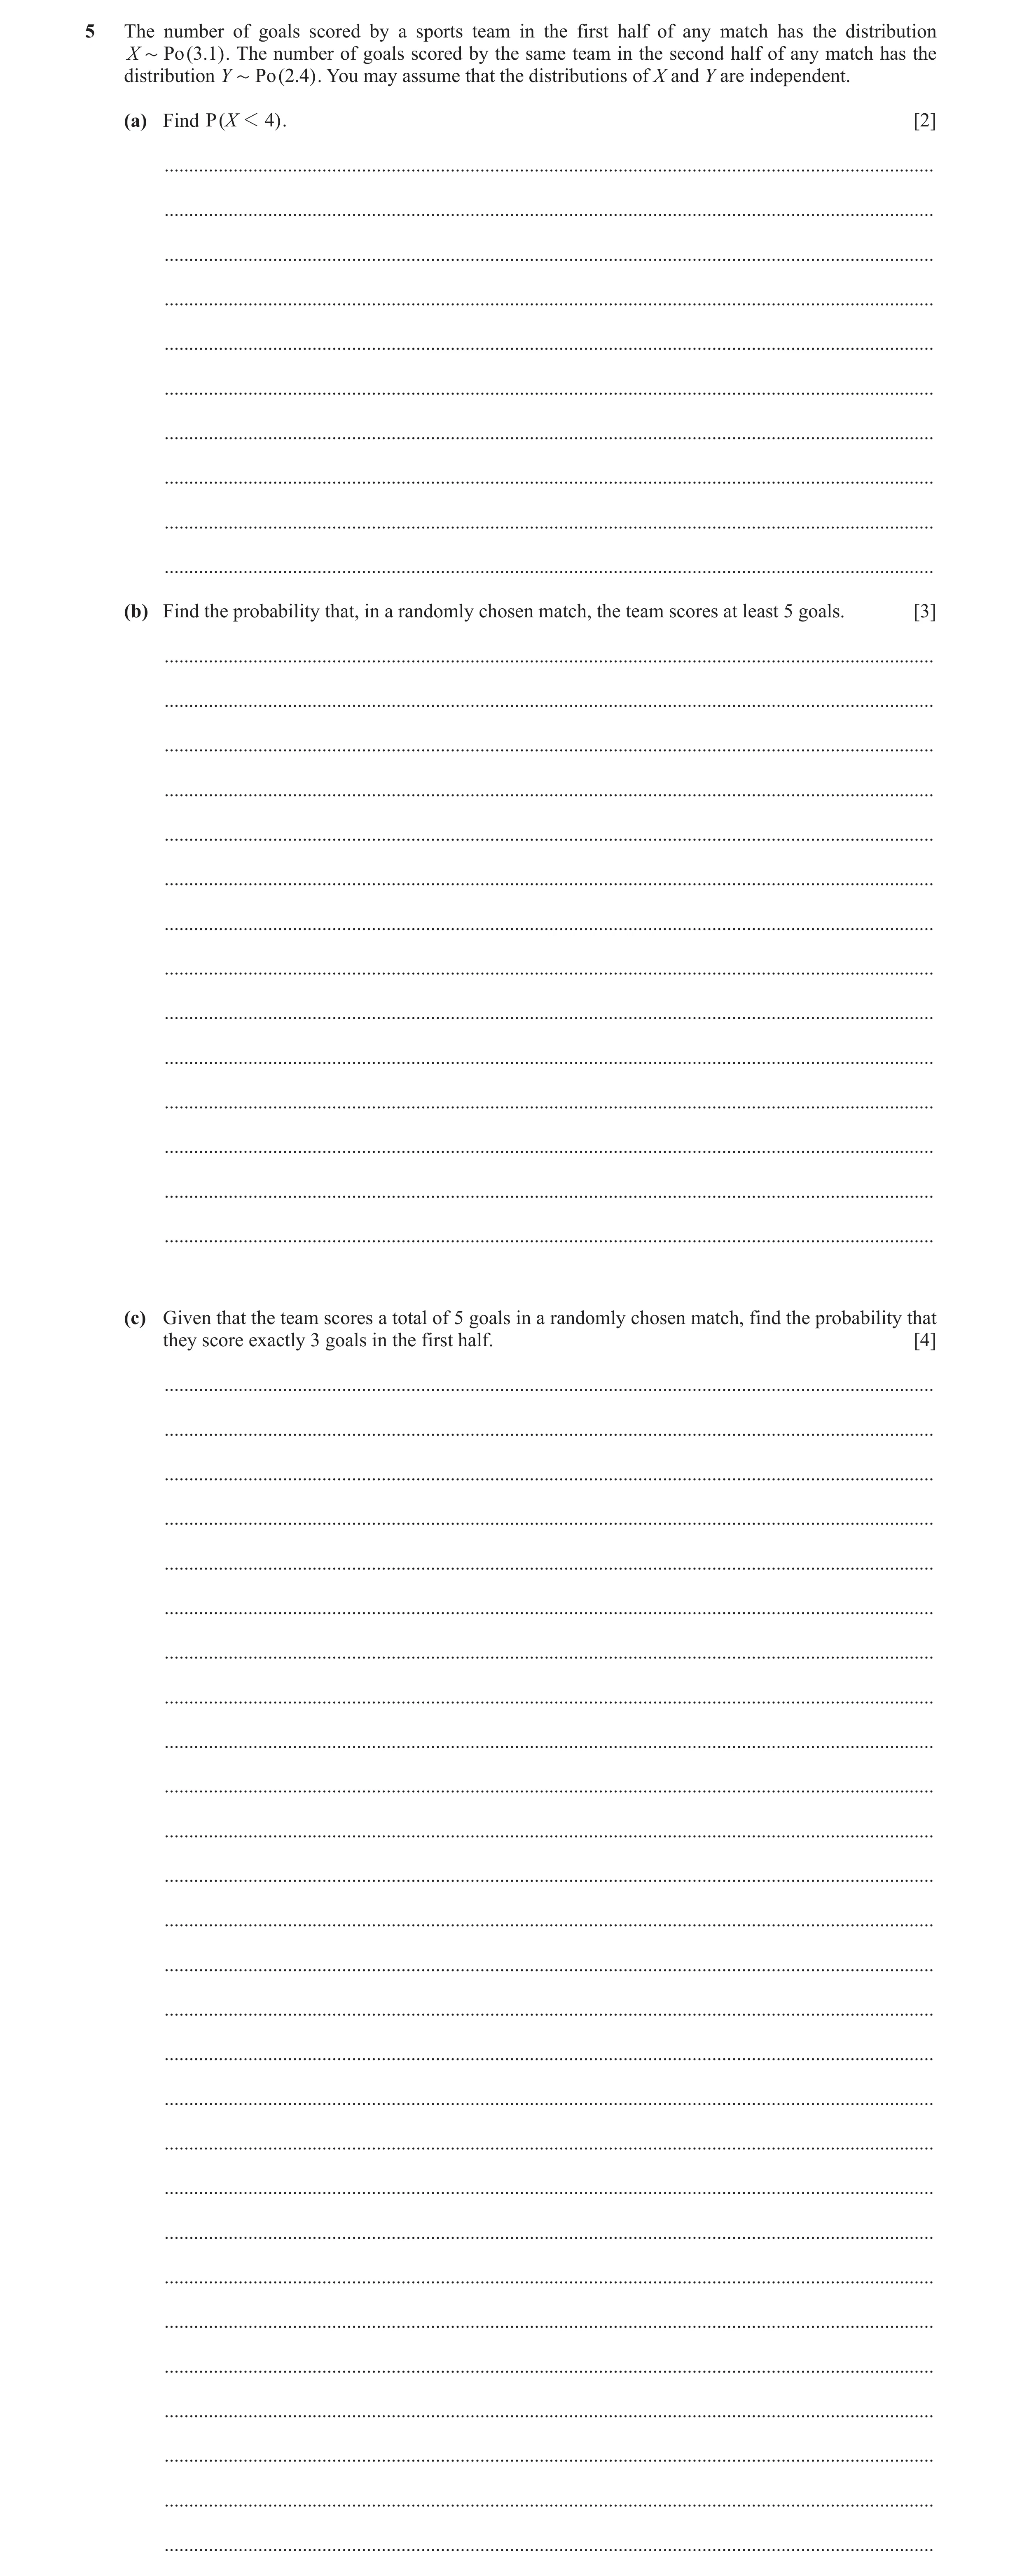
![Question 29: The independent random variables X and Y have the distributions Po(1.9) and Po(2.2) respectively. (a) Find P ( X + Y 1 4 ) . [3] ..........…](https://img.pastlit.com/crops/e606ea69-e120-4006-946c-198bf33e3e7d/q7.webp)
![Question 31: 1 A random variable X has the distribution B e4500000, o. 1000000 Use a Poisson distribution to calculate an estimate of P ( X H 4) . [3] .…](https://img.pastlit.com/crops/ad0da93e-0d9a-488b-8400-fa01a6c442ea/q1.webp) 48 / 56
48 / 56![Question 32: The random variable X has the distribution Po(1.5). (a) Find P ( X H 3) . [2] .............................................................…](https://img.pastlit.com/crops/99cffce1-152a-4069-a2d9-91017d774b70/q3.webp)
![Question 33: (a) The random variables W and X have the independent distributions Po(1.2) and Po(2.3) respectively. (i) Find P ( 3 G W + X G 5) . [2] ...…](https://img.pastlit.com/crops/8e0a365a-913a-45d6-acf2-a2e7608a161e/q5.webp)
![Question 34: The random variable X has the distribution Po ( 15) . (a) Write down an expression in terms of e for P ( X = 12) . [1] ....................…](https://img.pastlit.com/crops/fa4bb94a-5dad-4669-9099-20b155e59a41/q3.webp) 53 / 56
53 / 56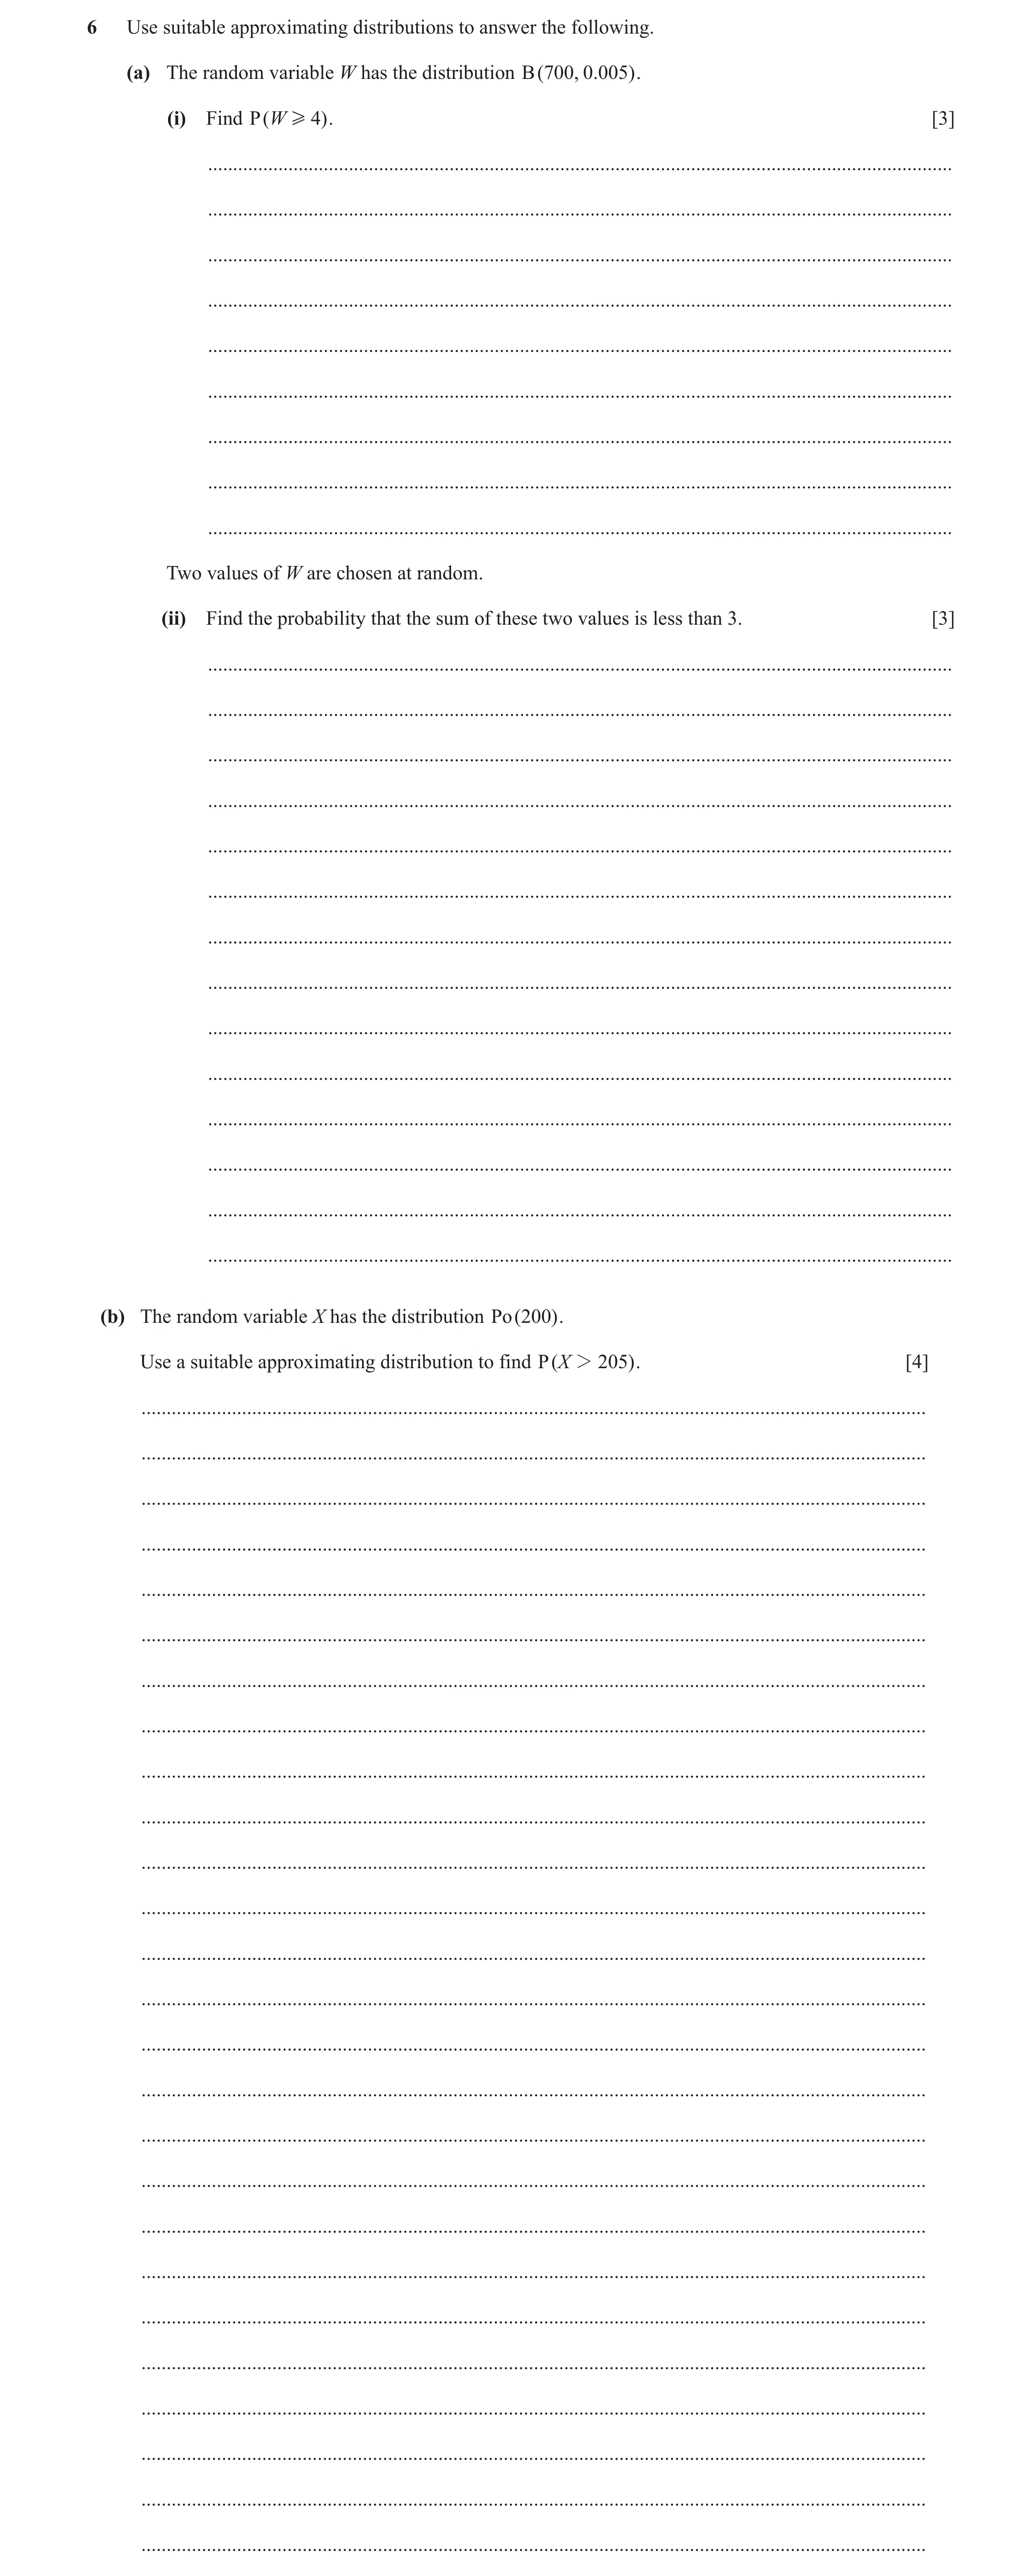
![Question 36: The random variable X has the distribution Po(1.5). The sum of three independent values of X is denoted by S. (a) Find P( S G 3 ) . [3] ...…](https://img.pastlit.com/crops/2116f0cd-6336-44f1-a3d4-49b05a67bf90/q1.webp) 56 / 56
56 / 56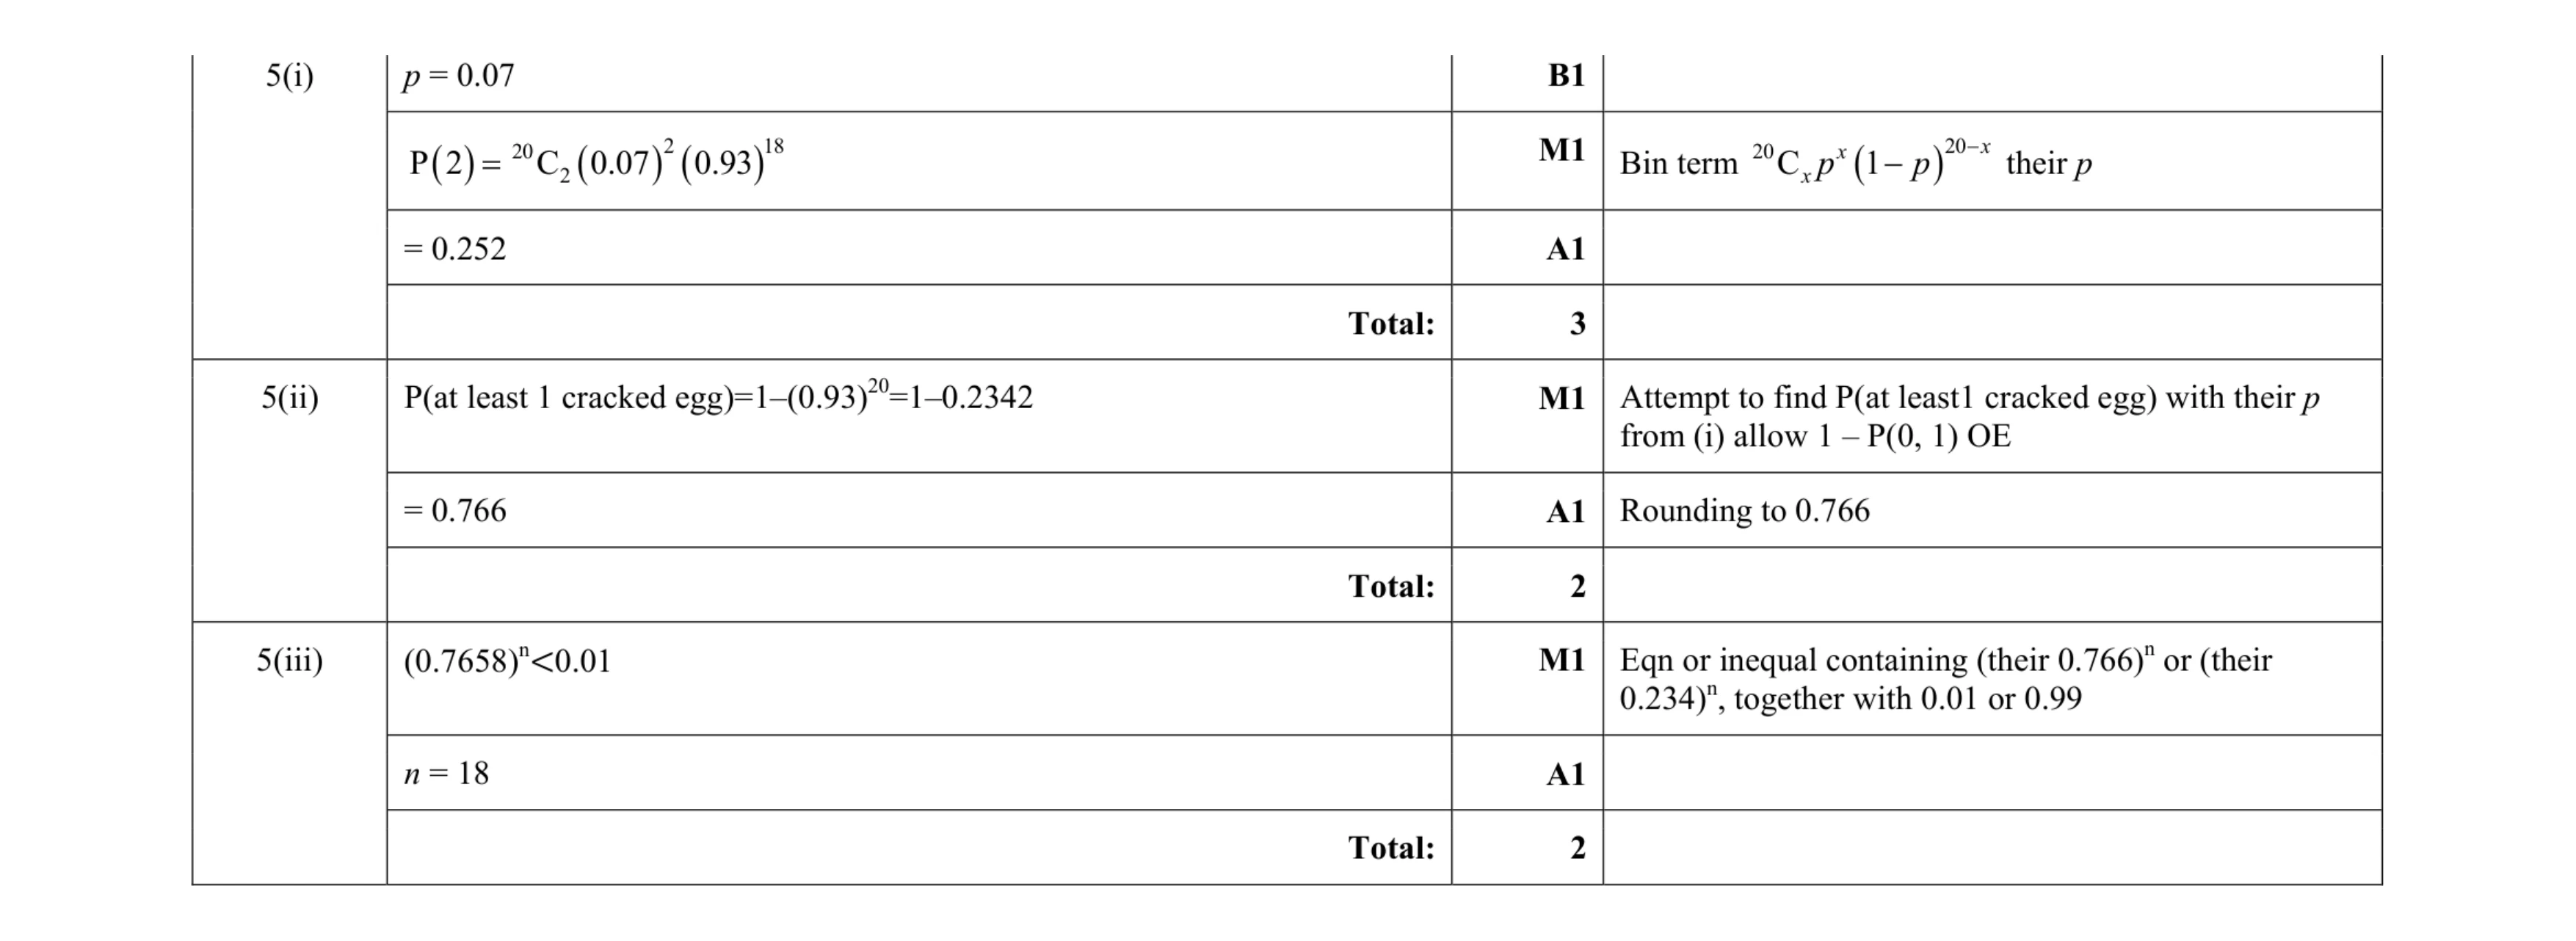 7
7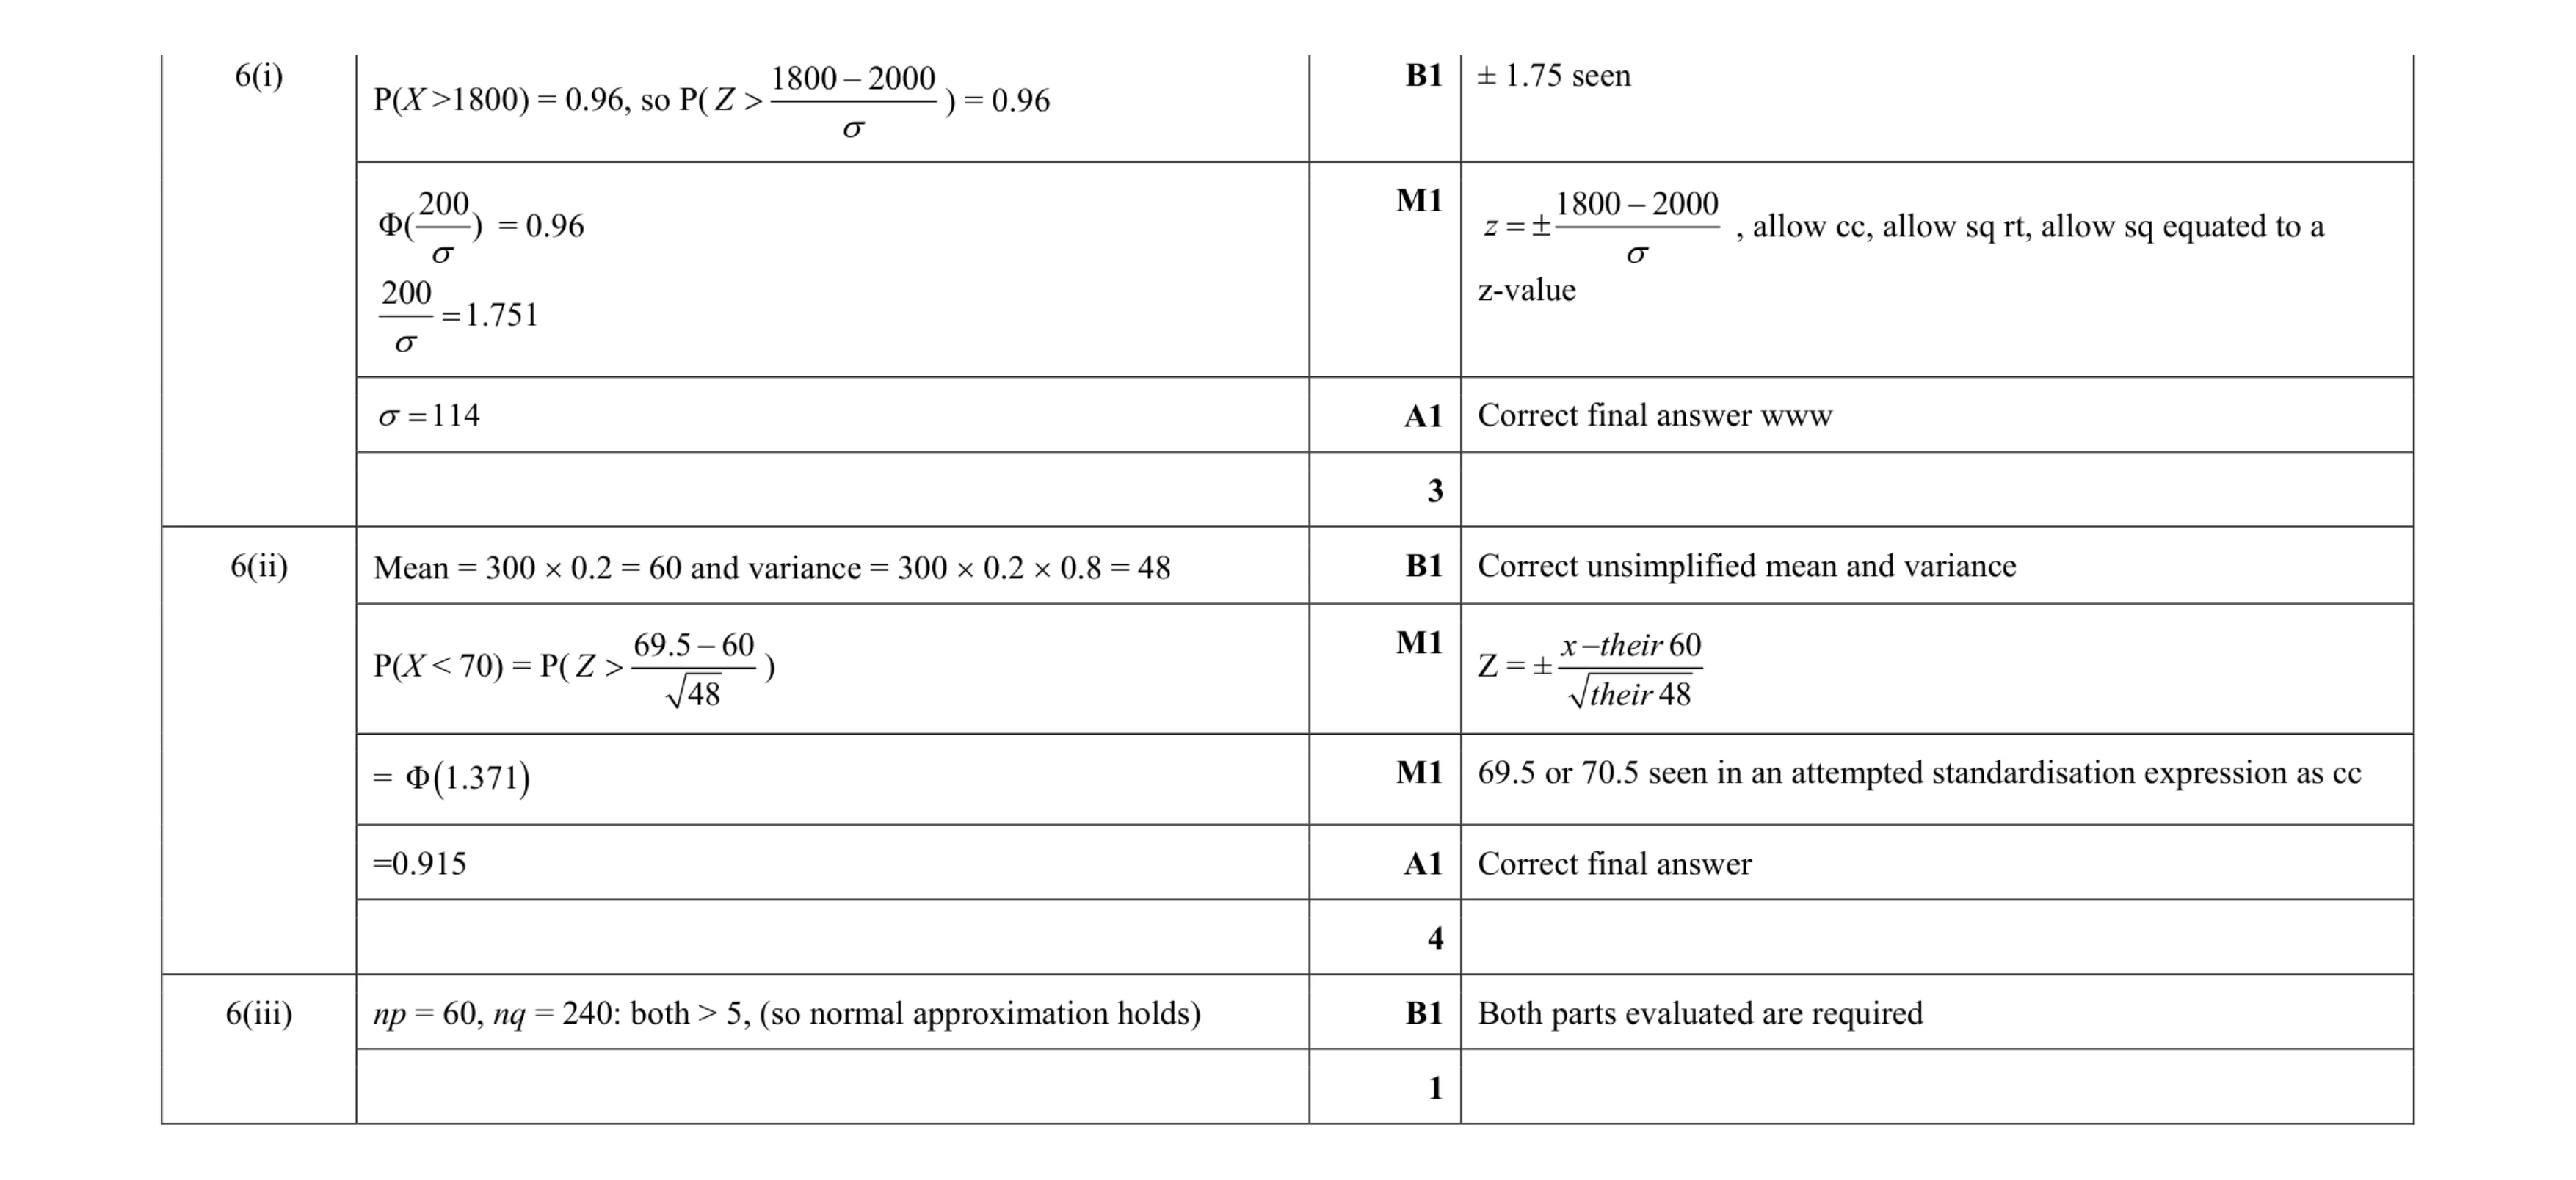 8
8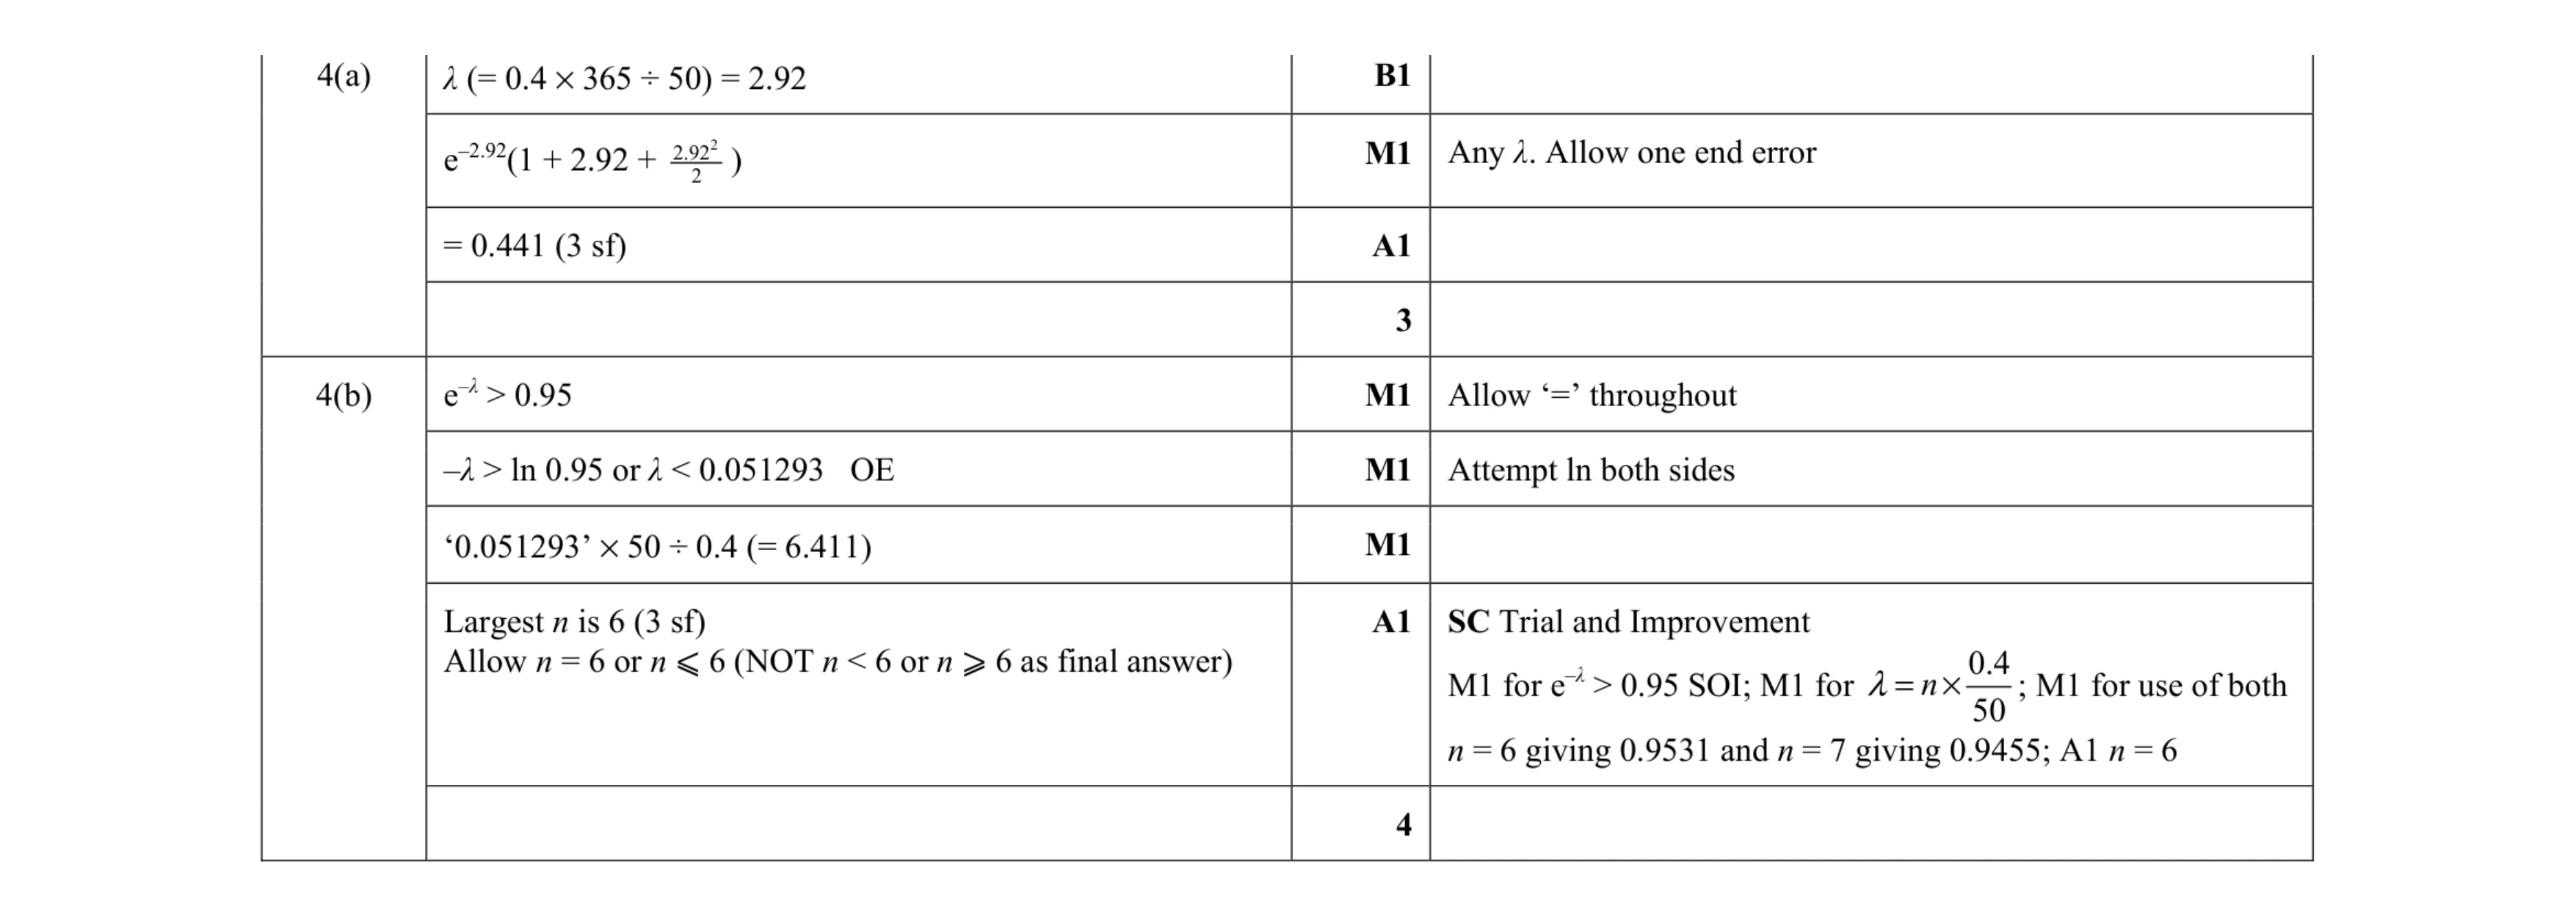 7
7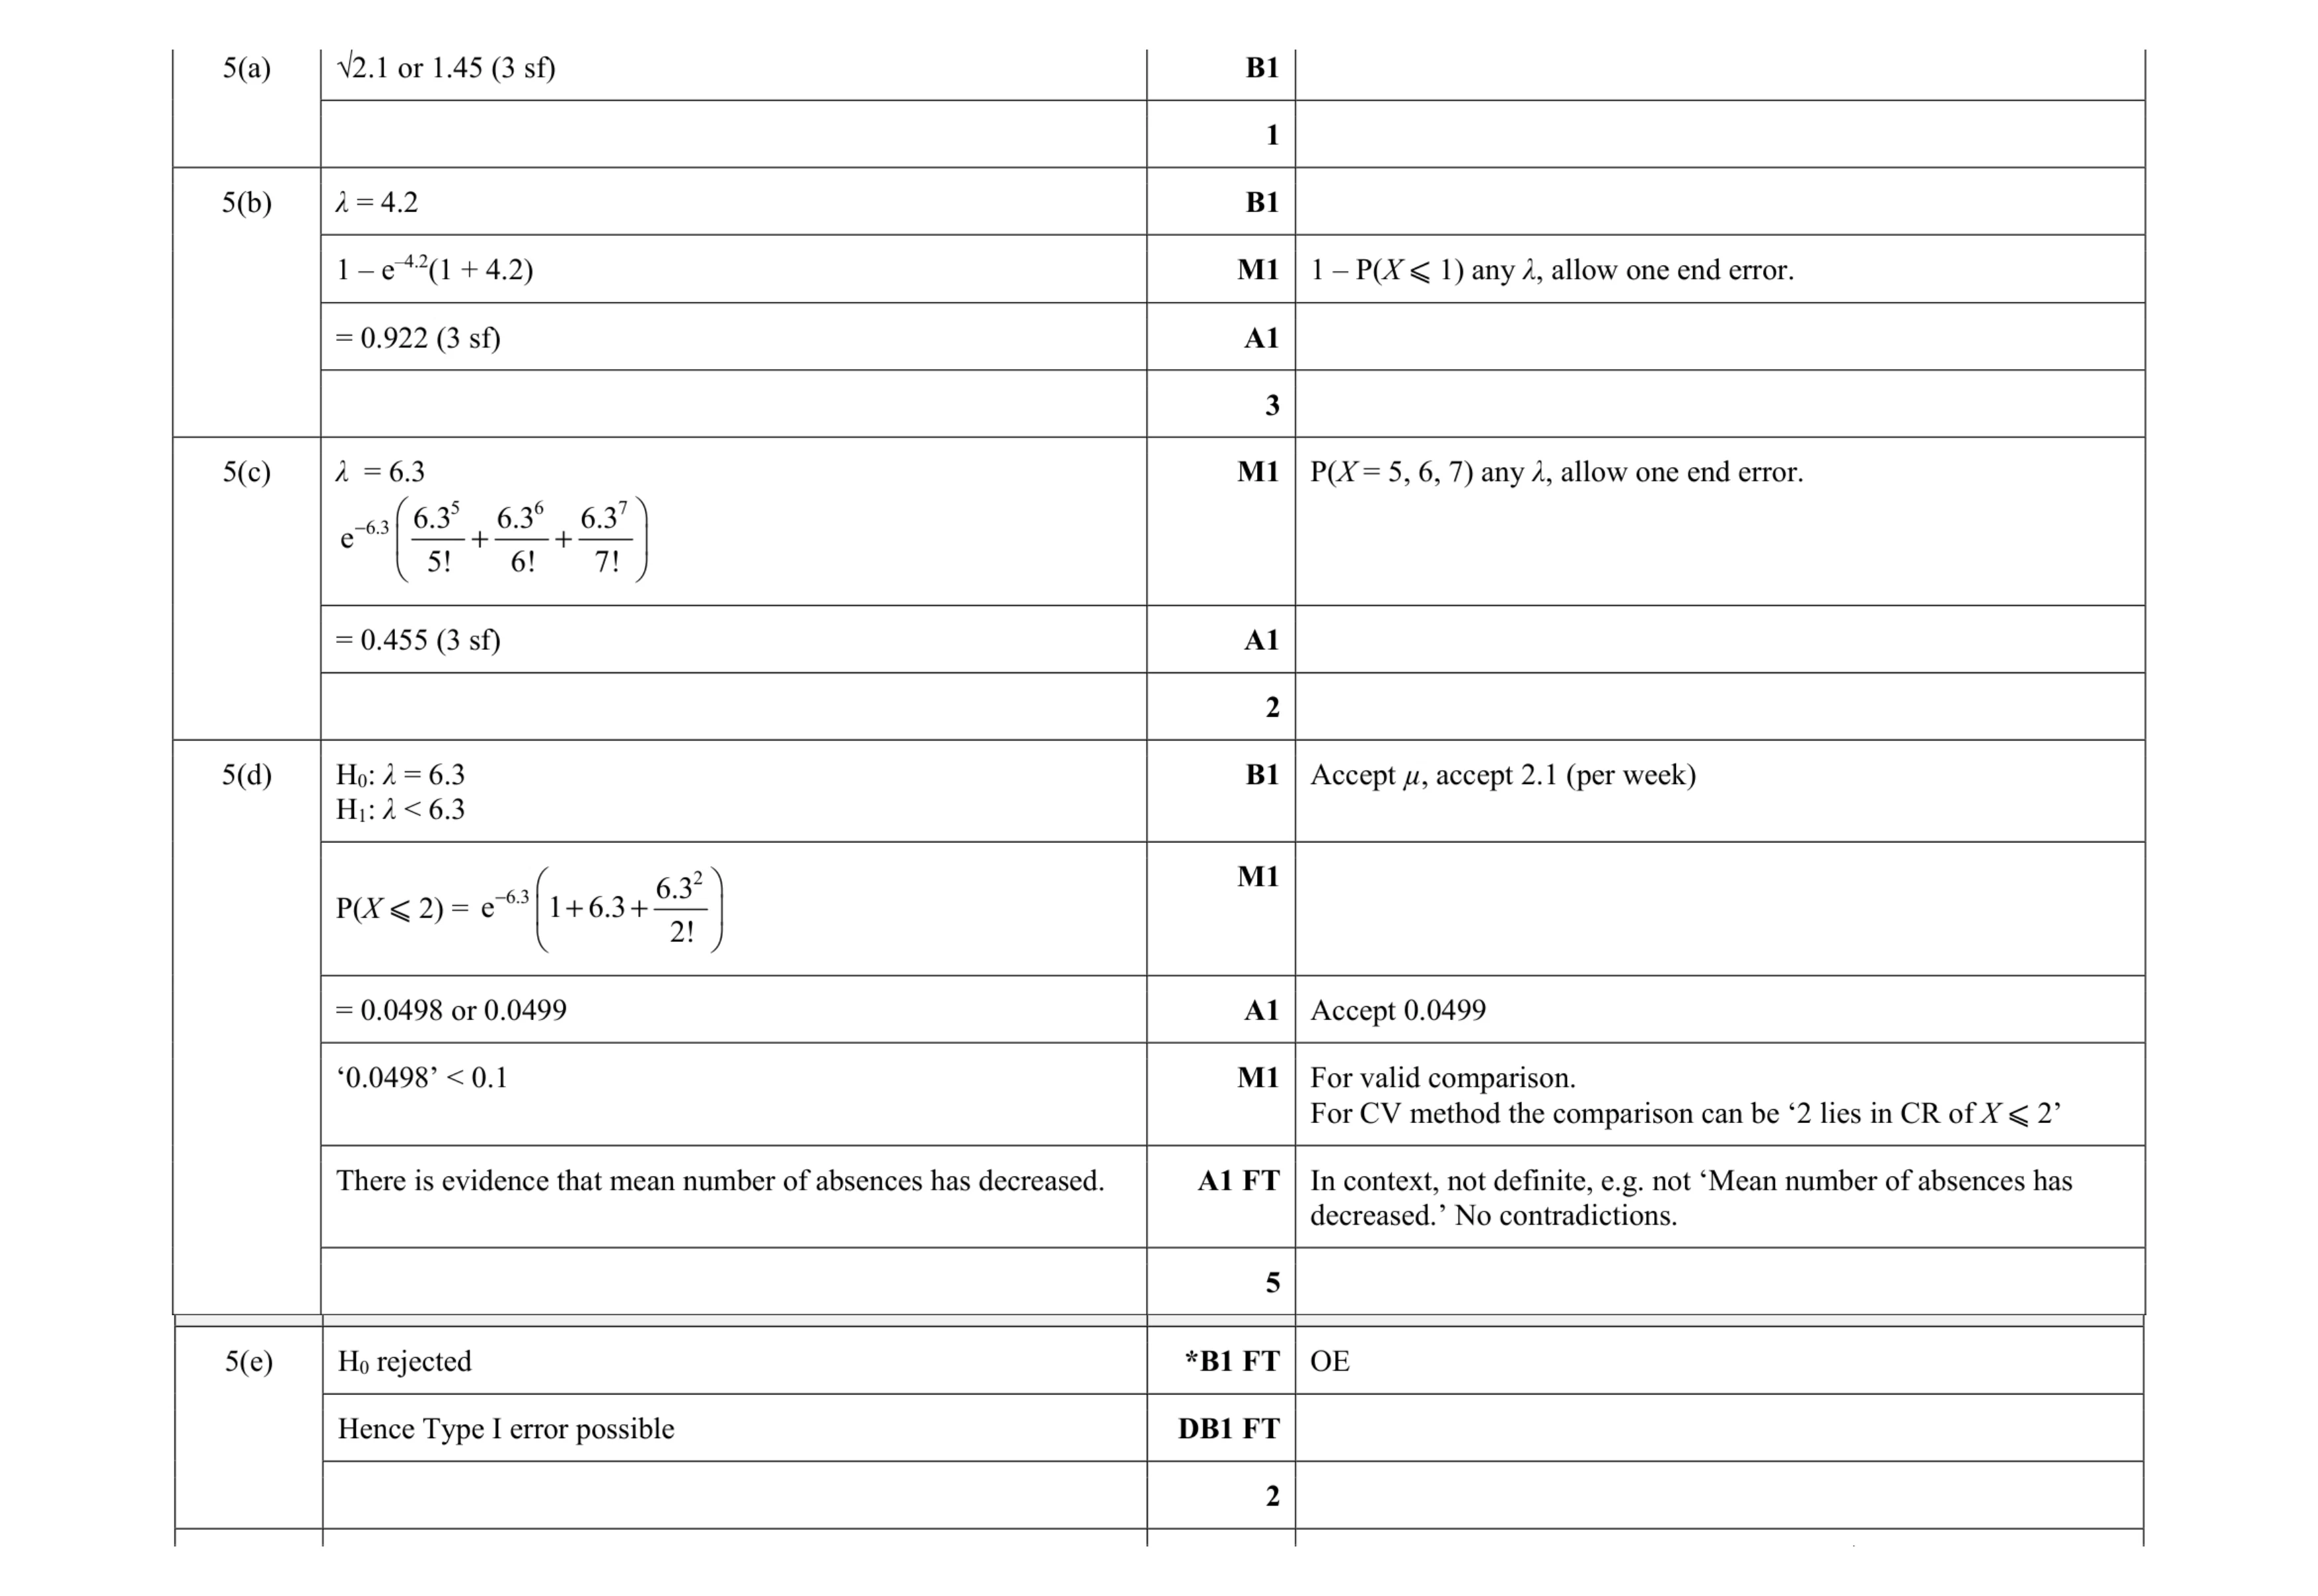 13
13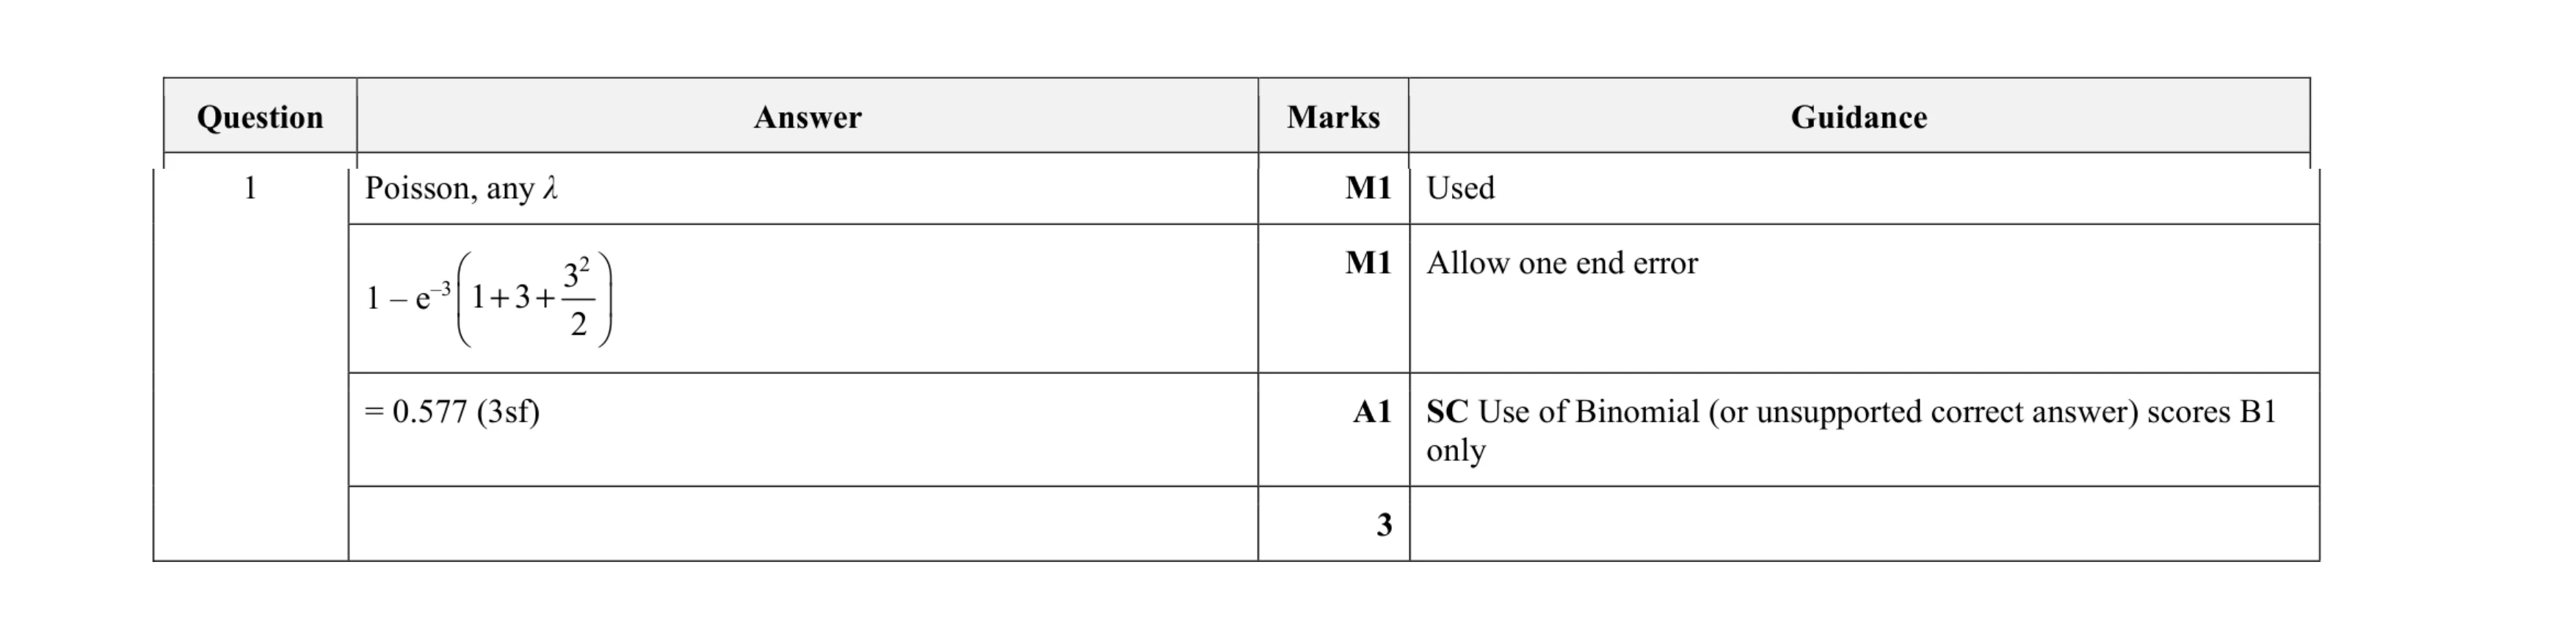 3
3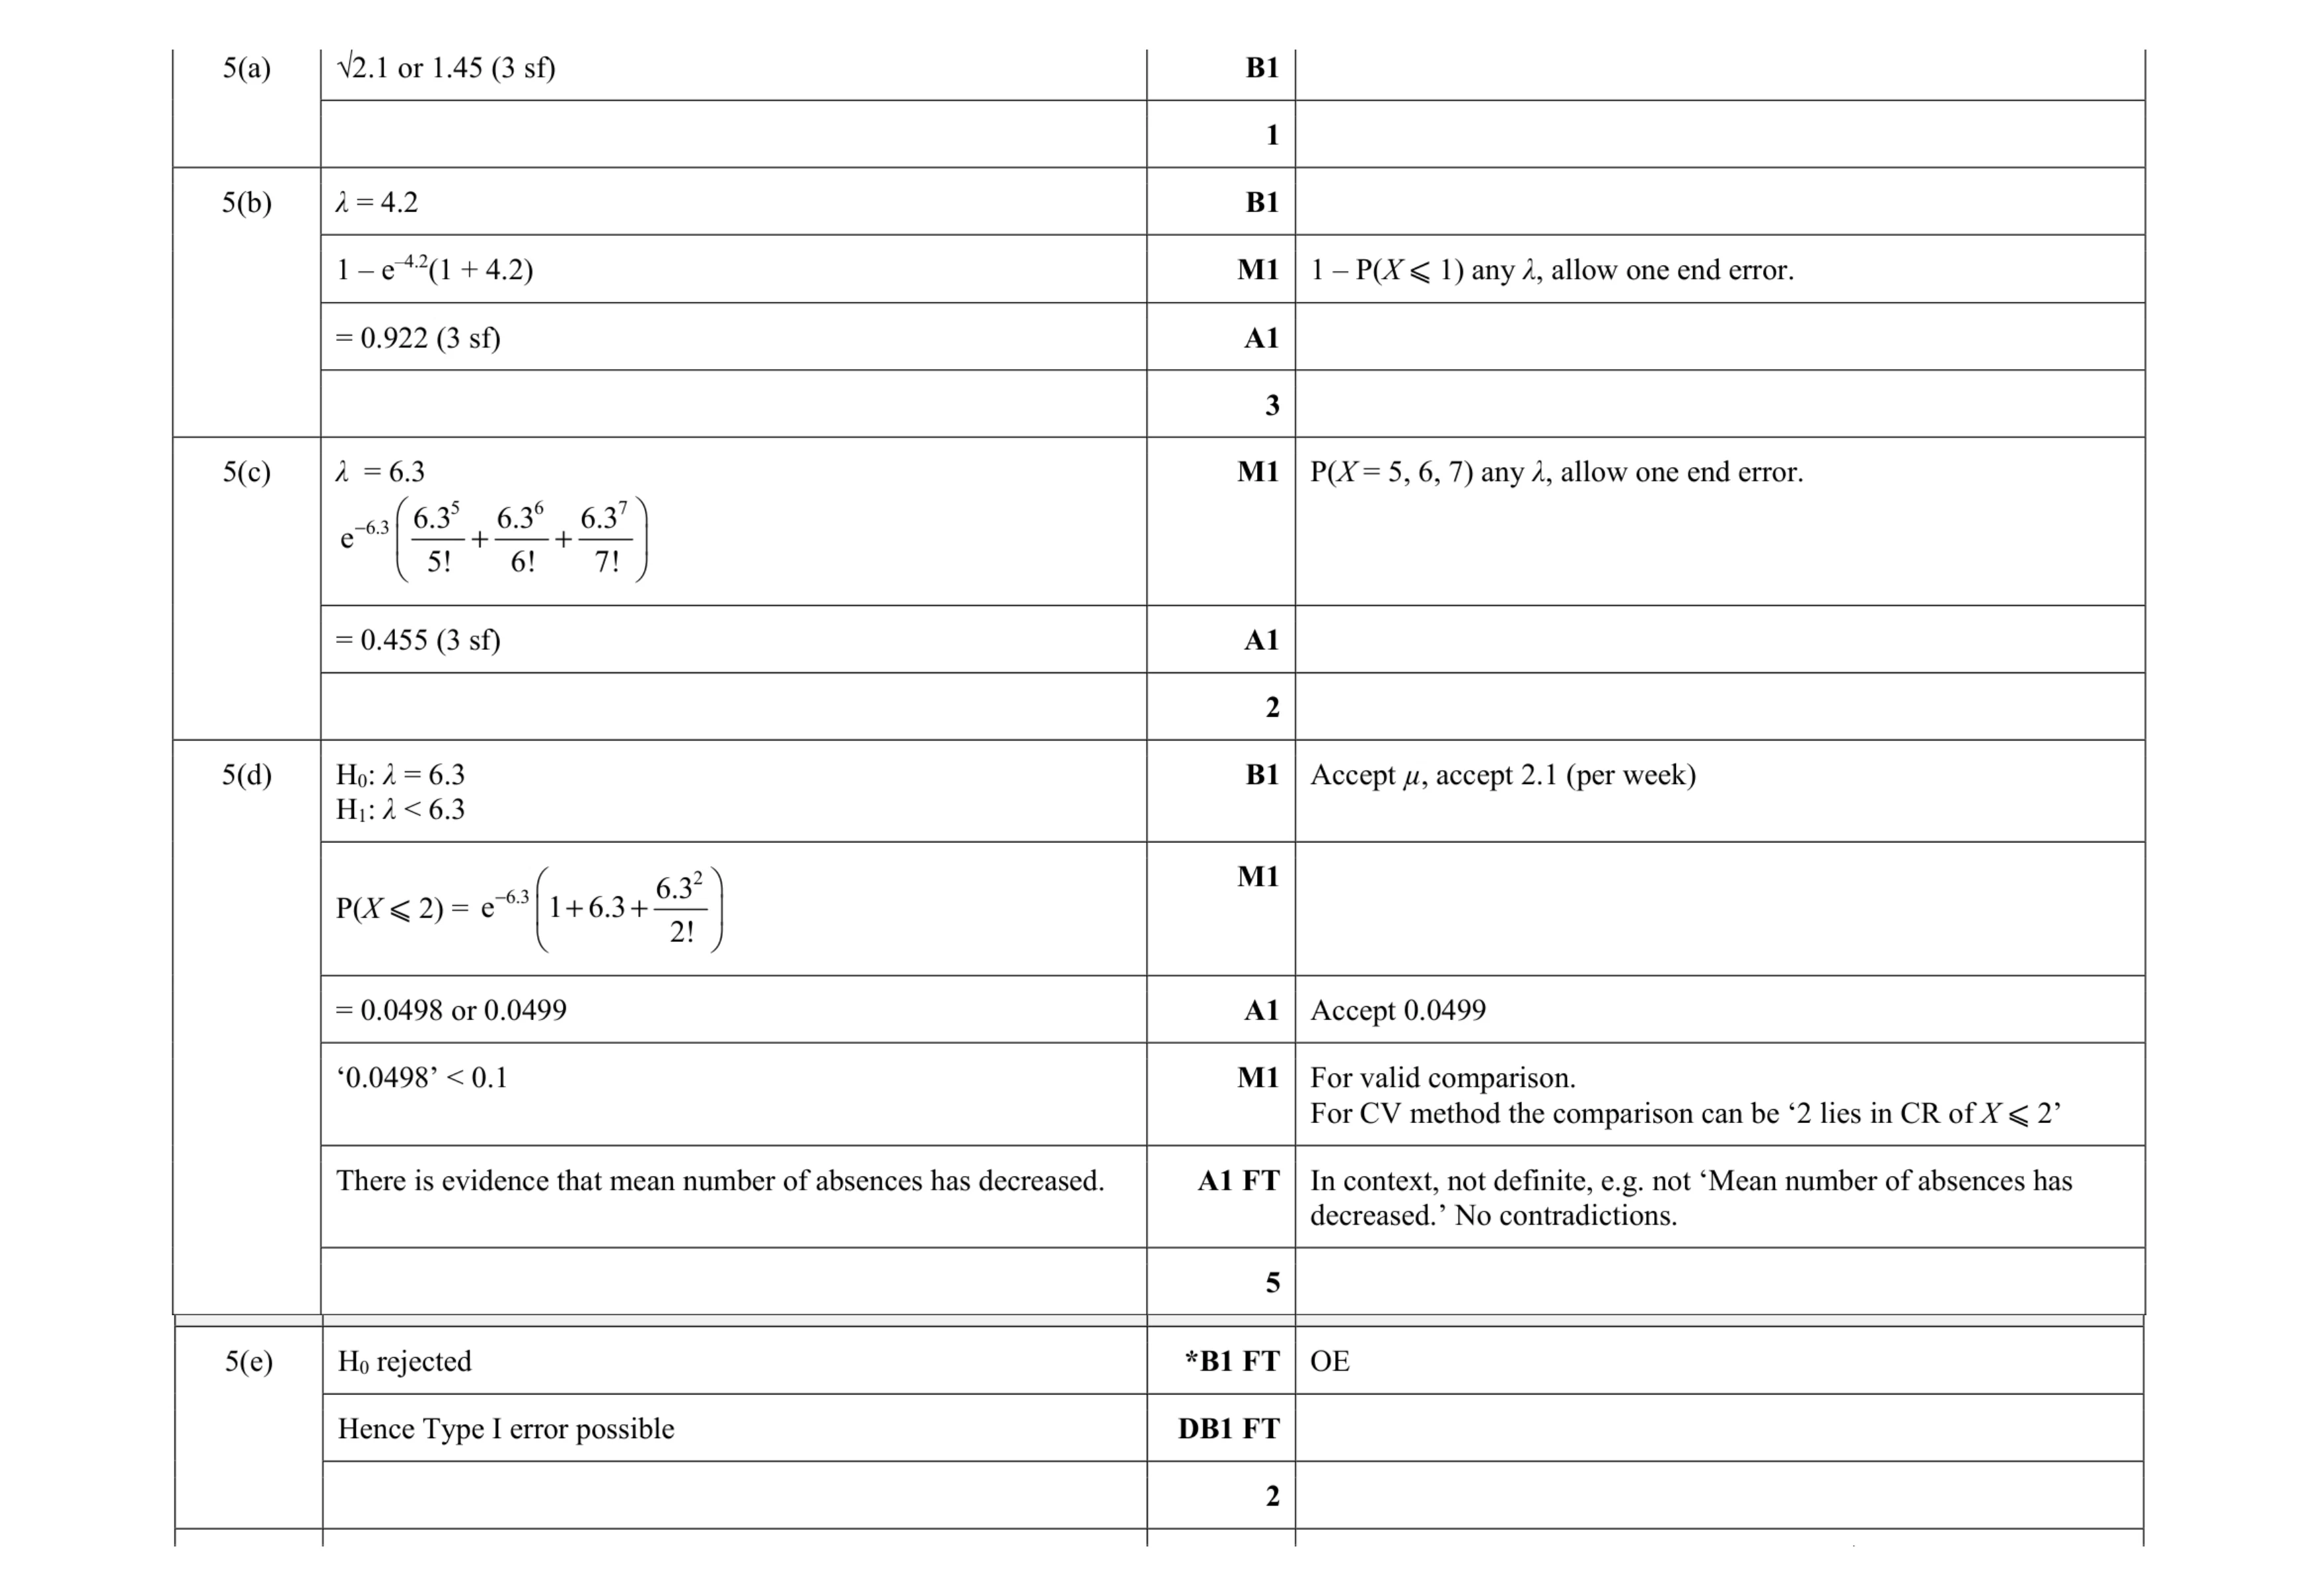 13
13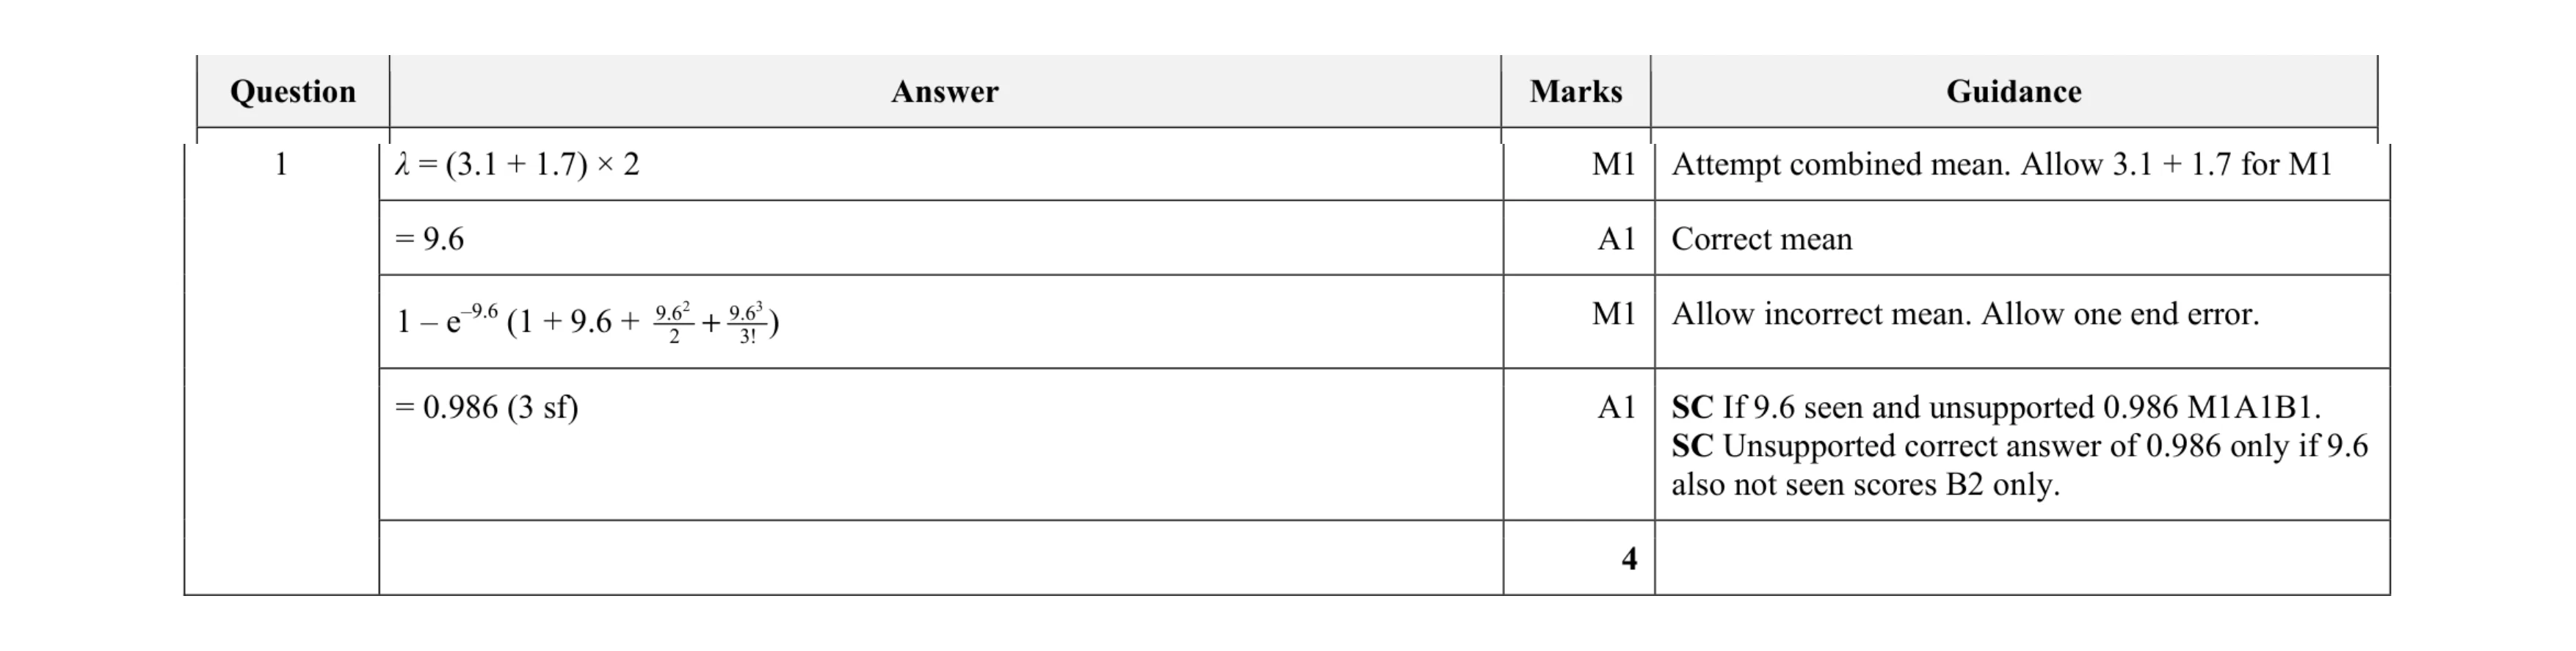 4
4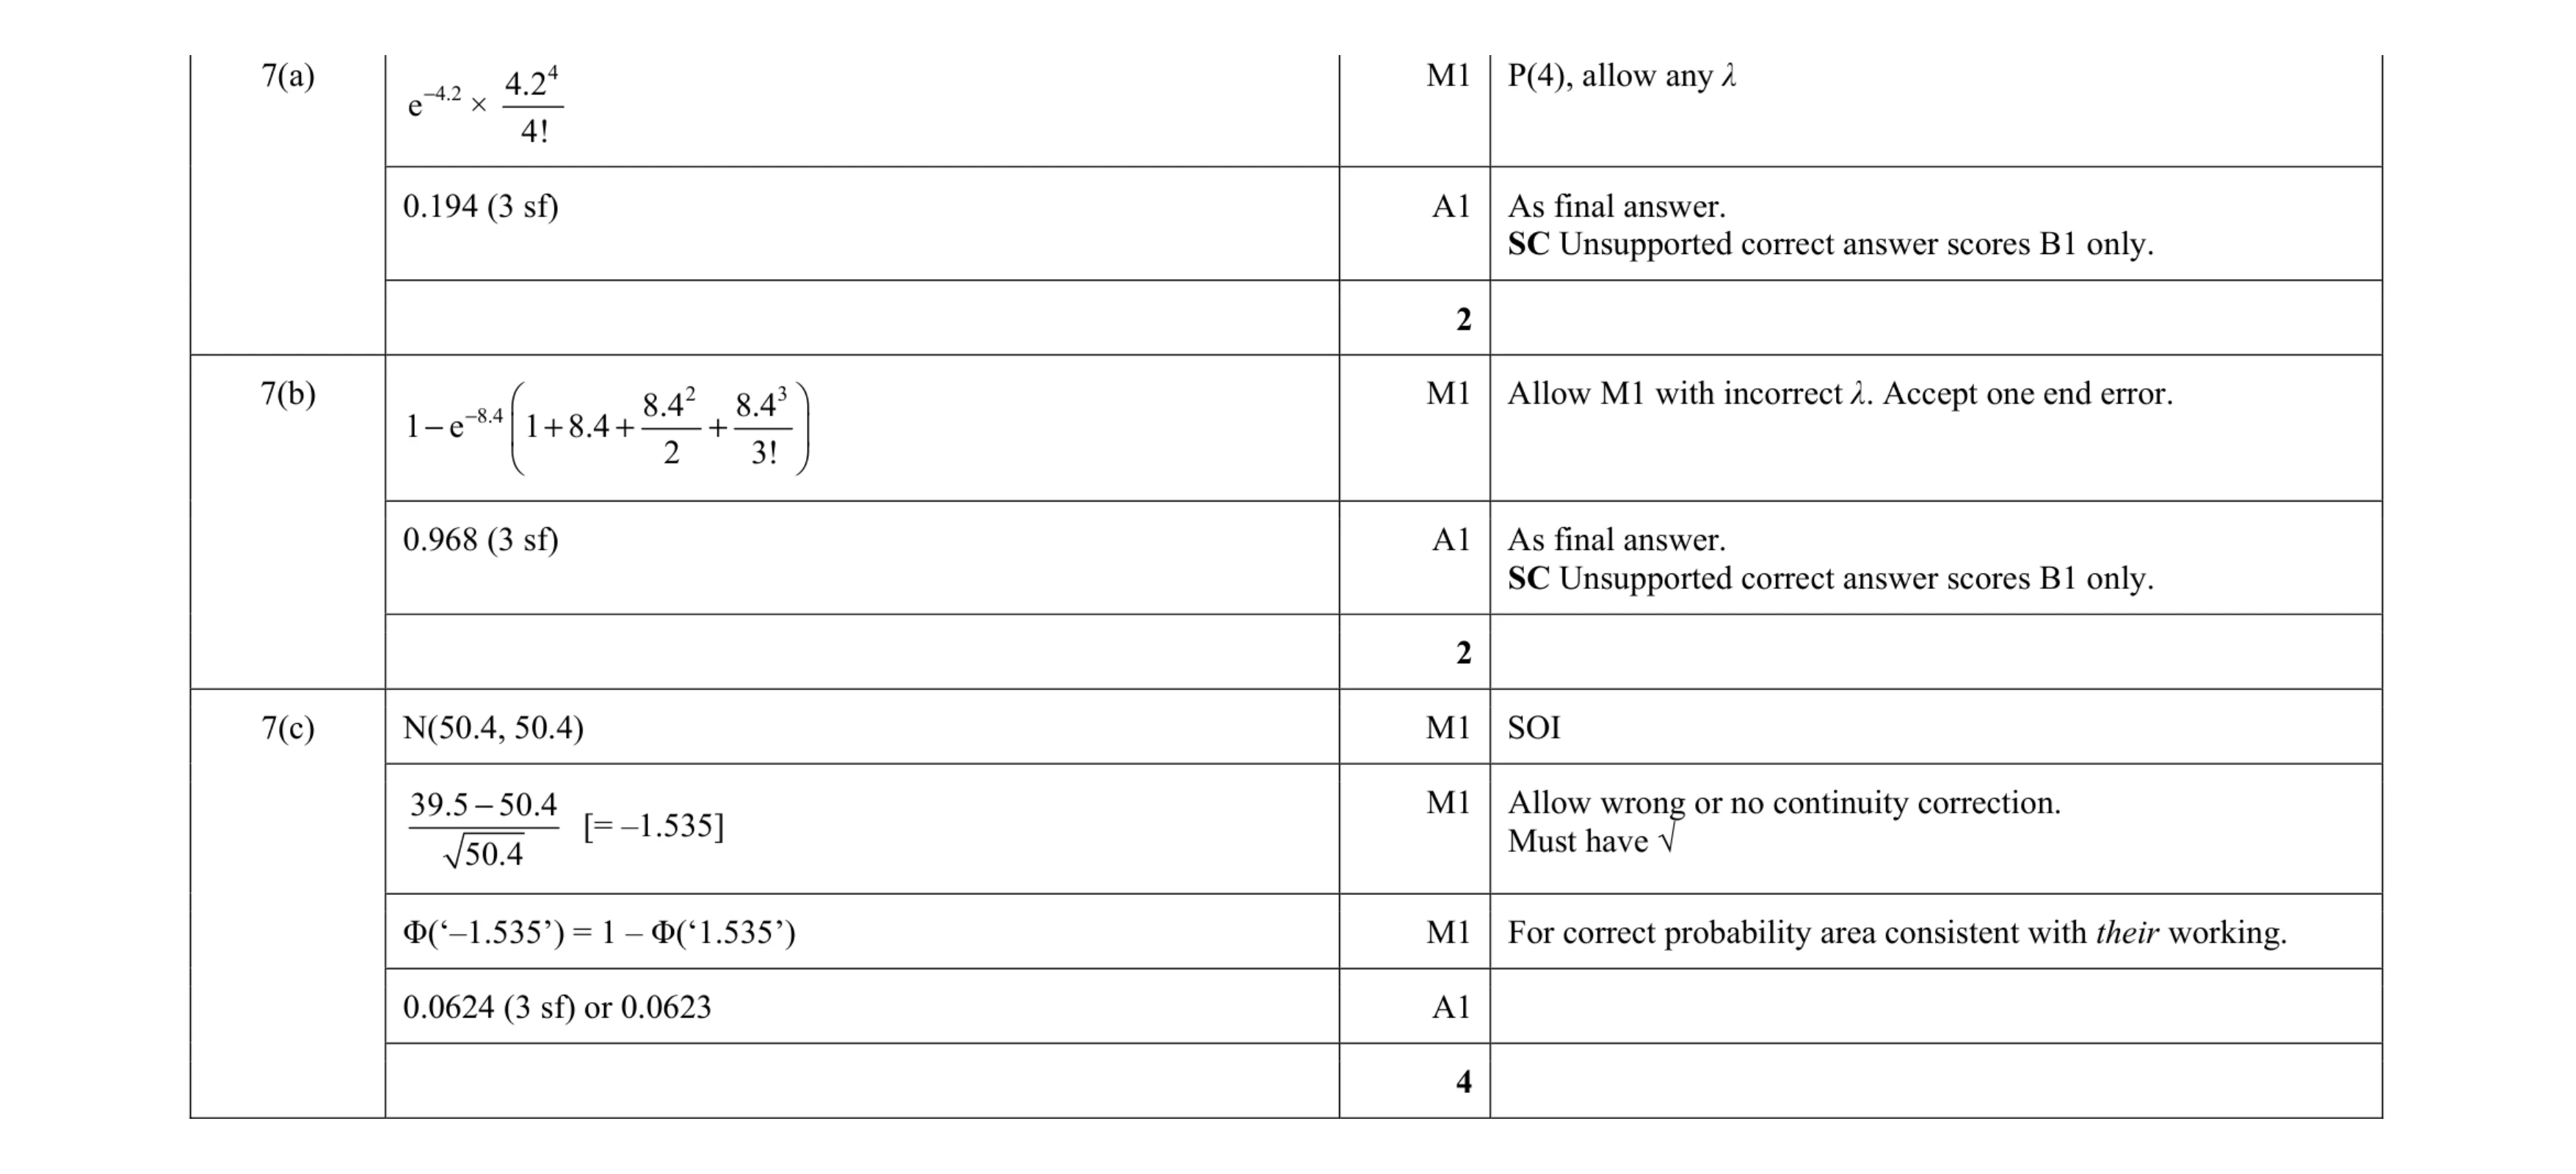 8
8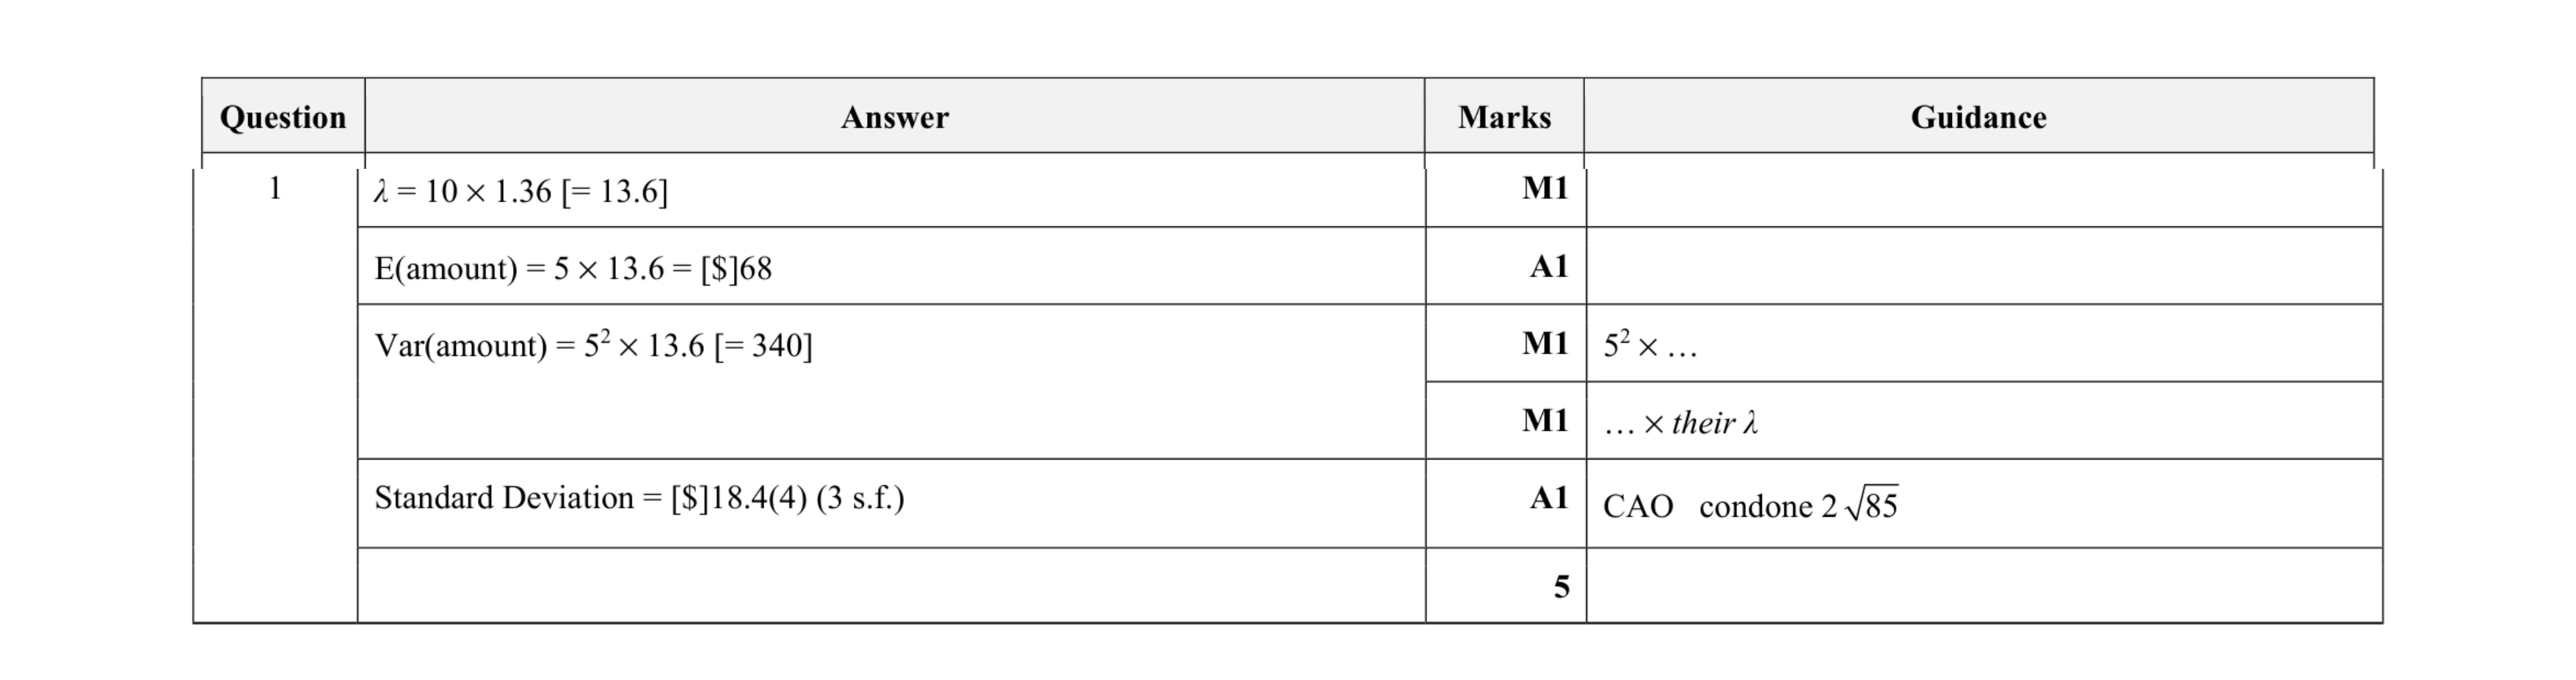 5
5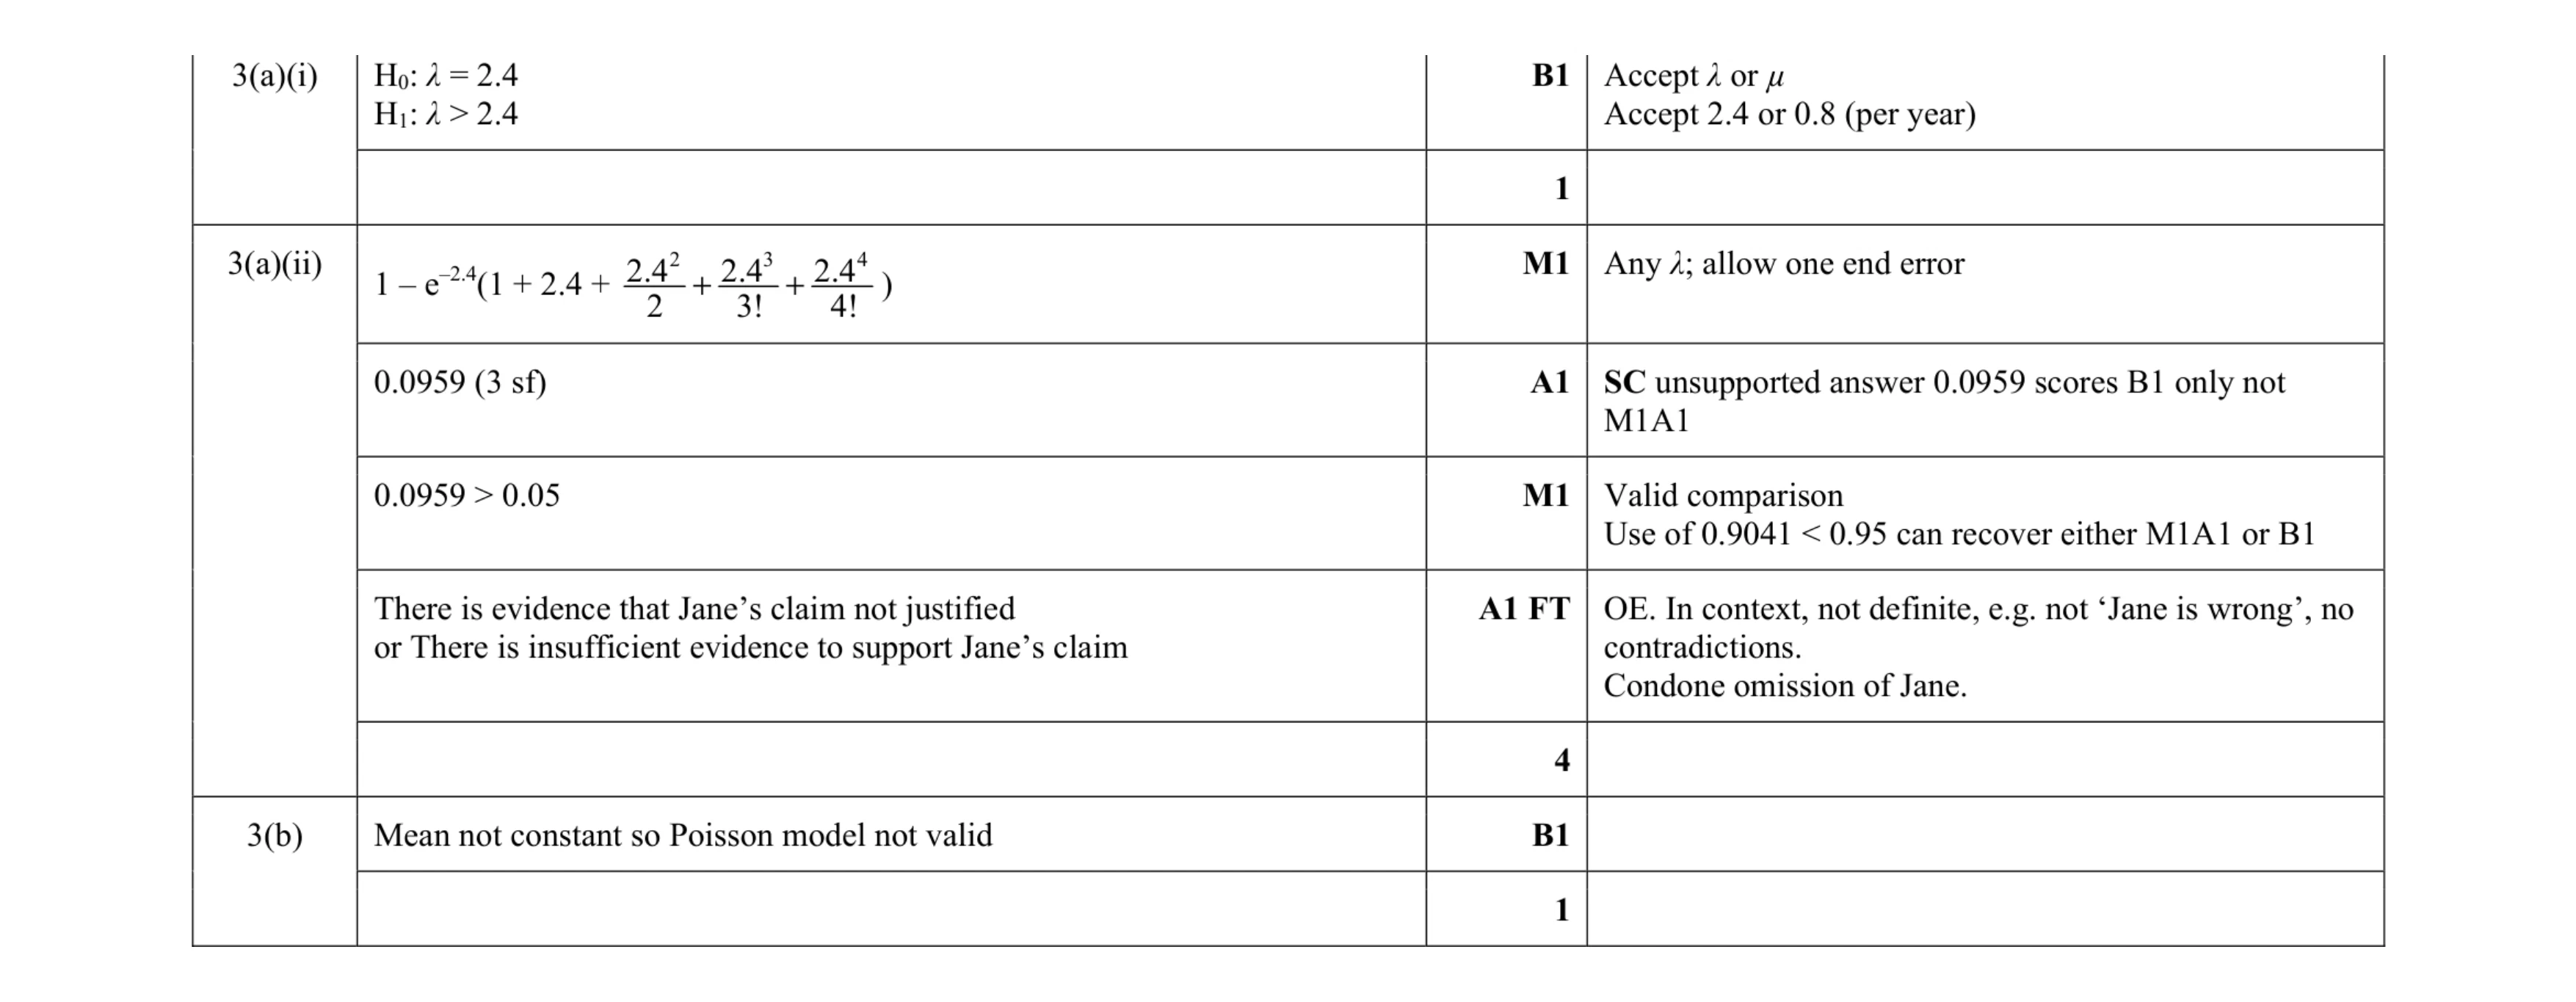 6
6 4
4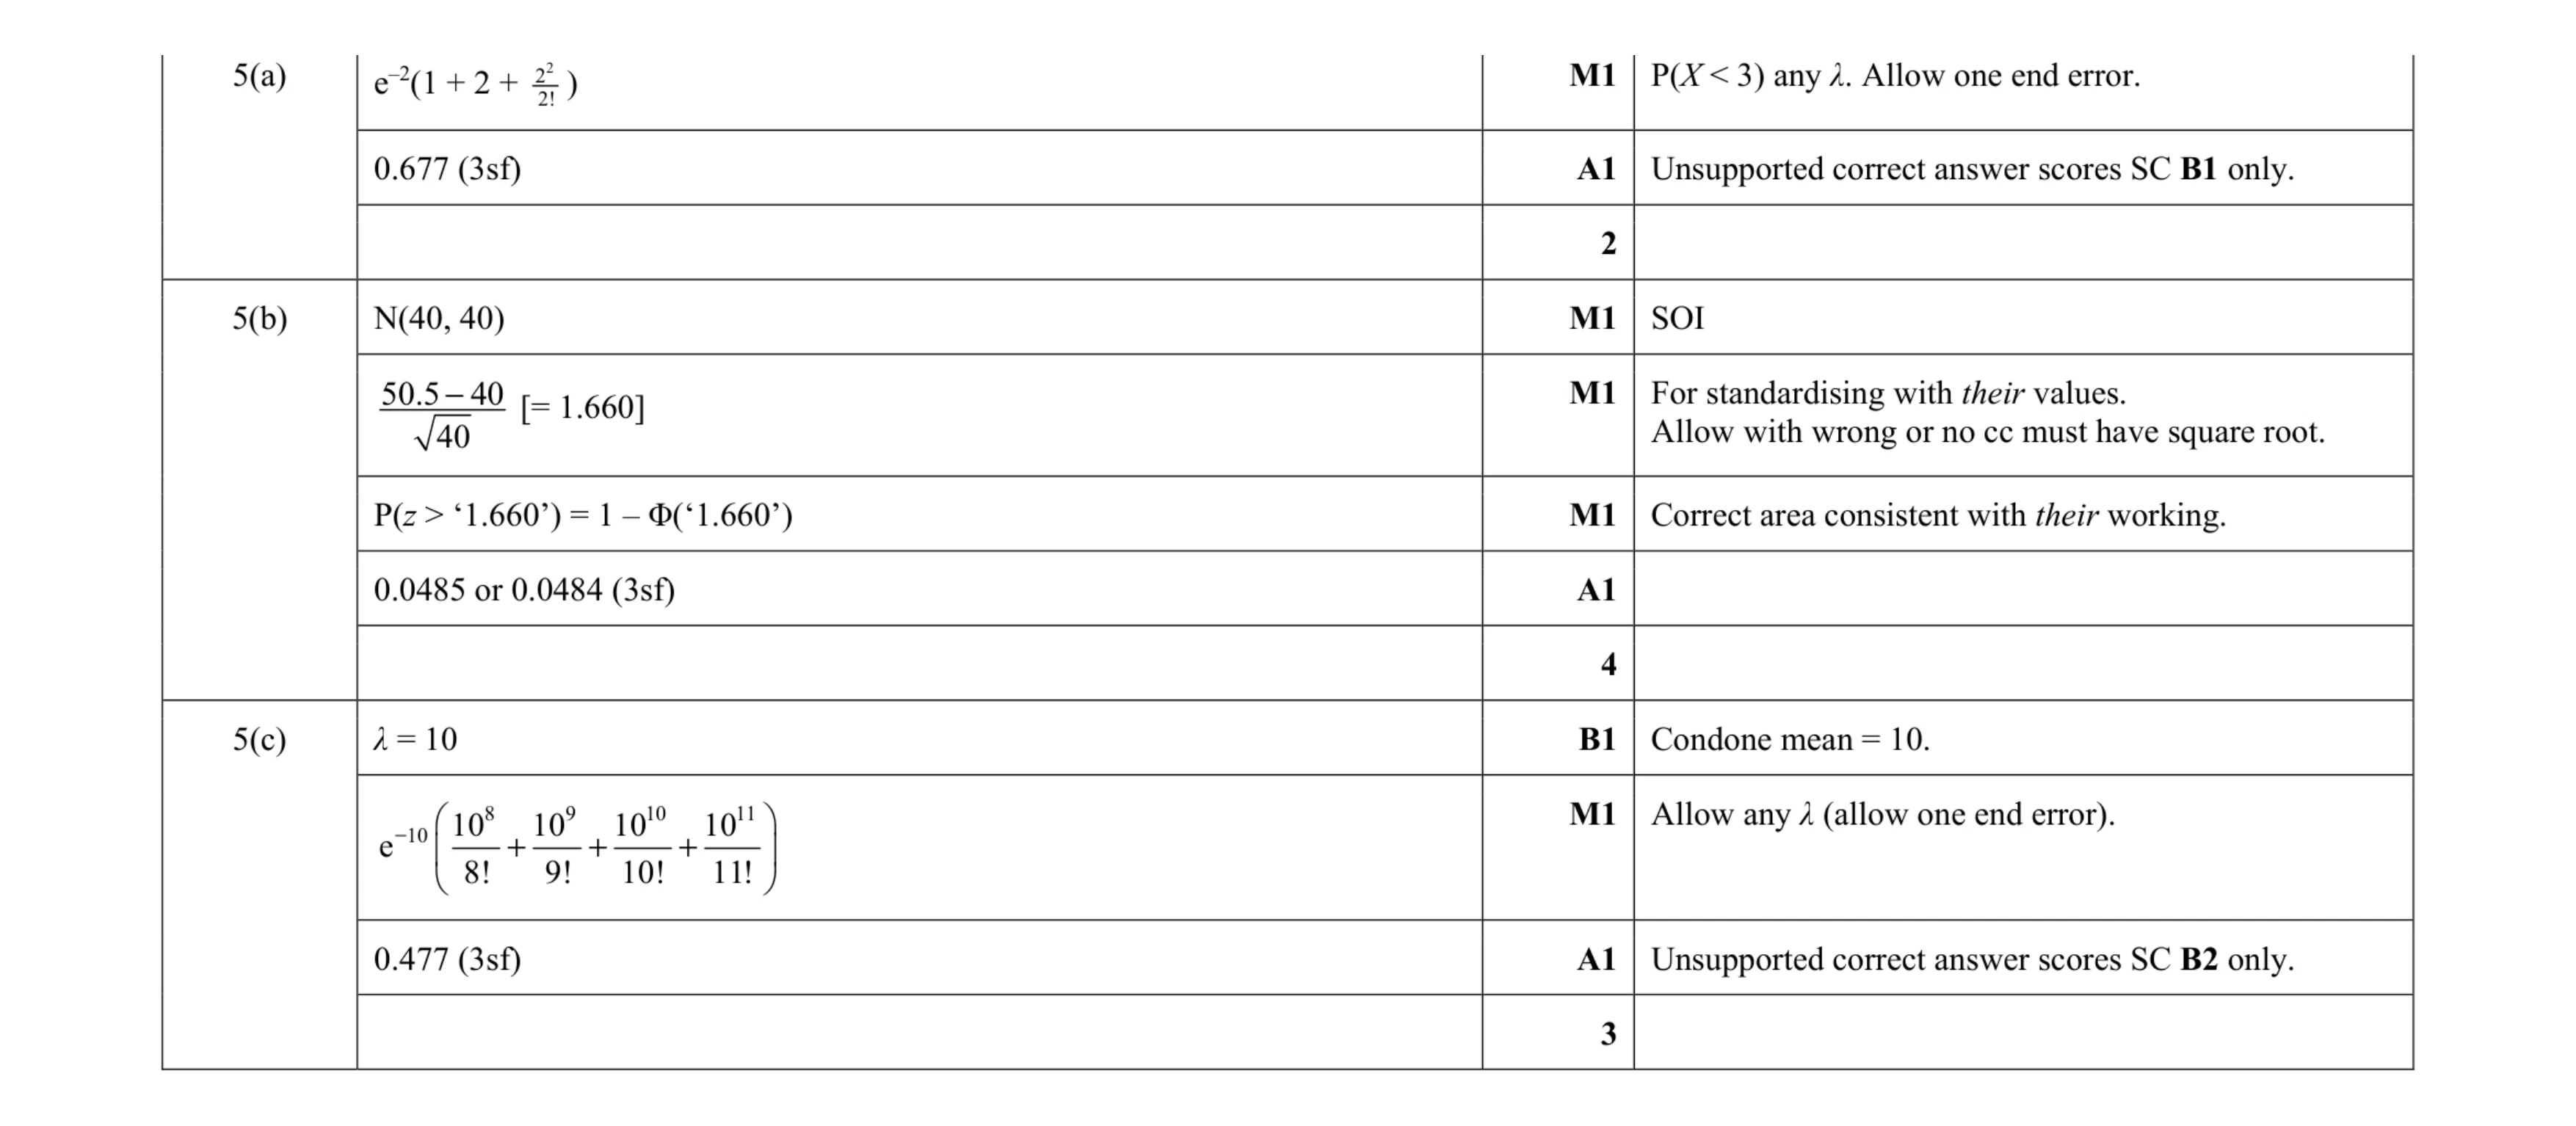 9
9 4
4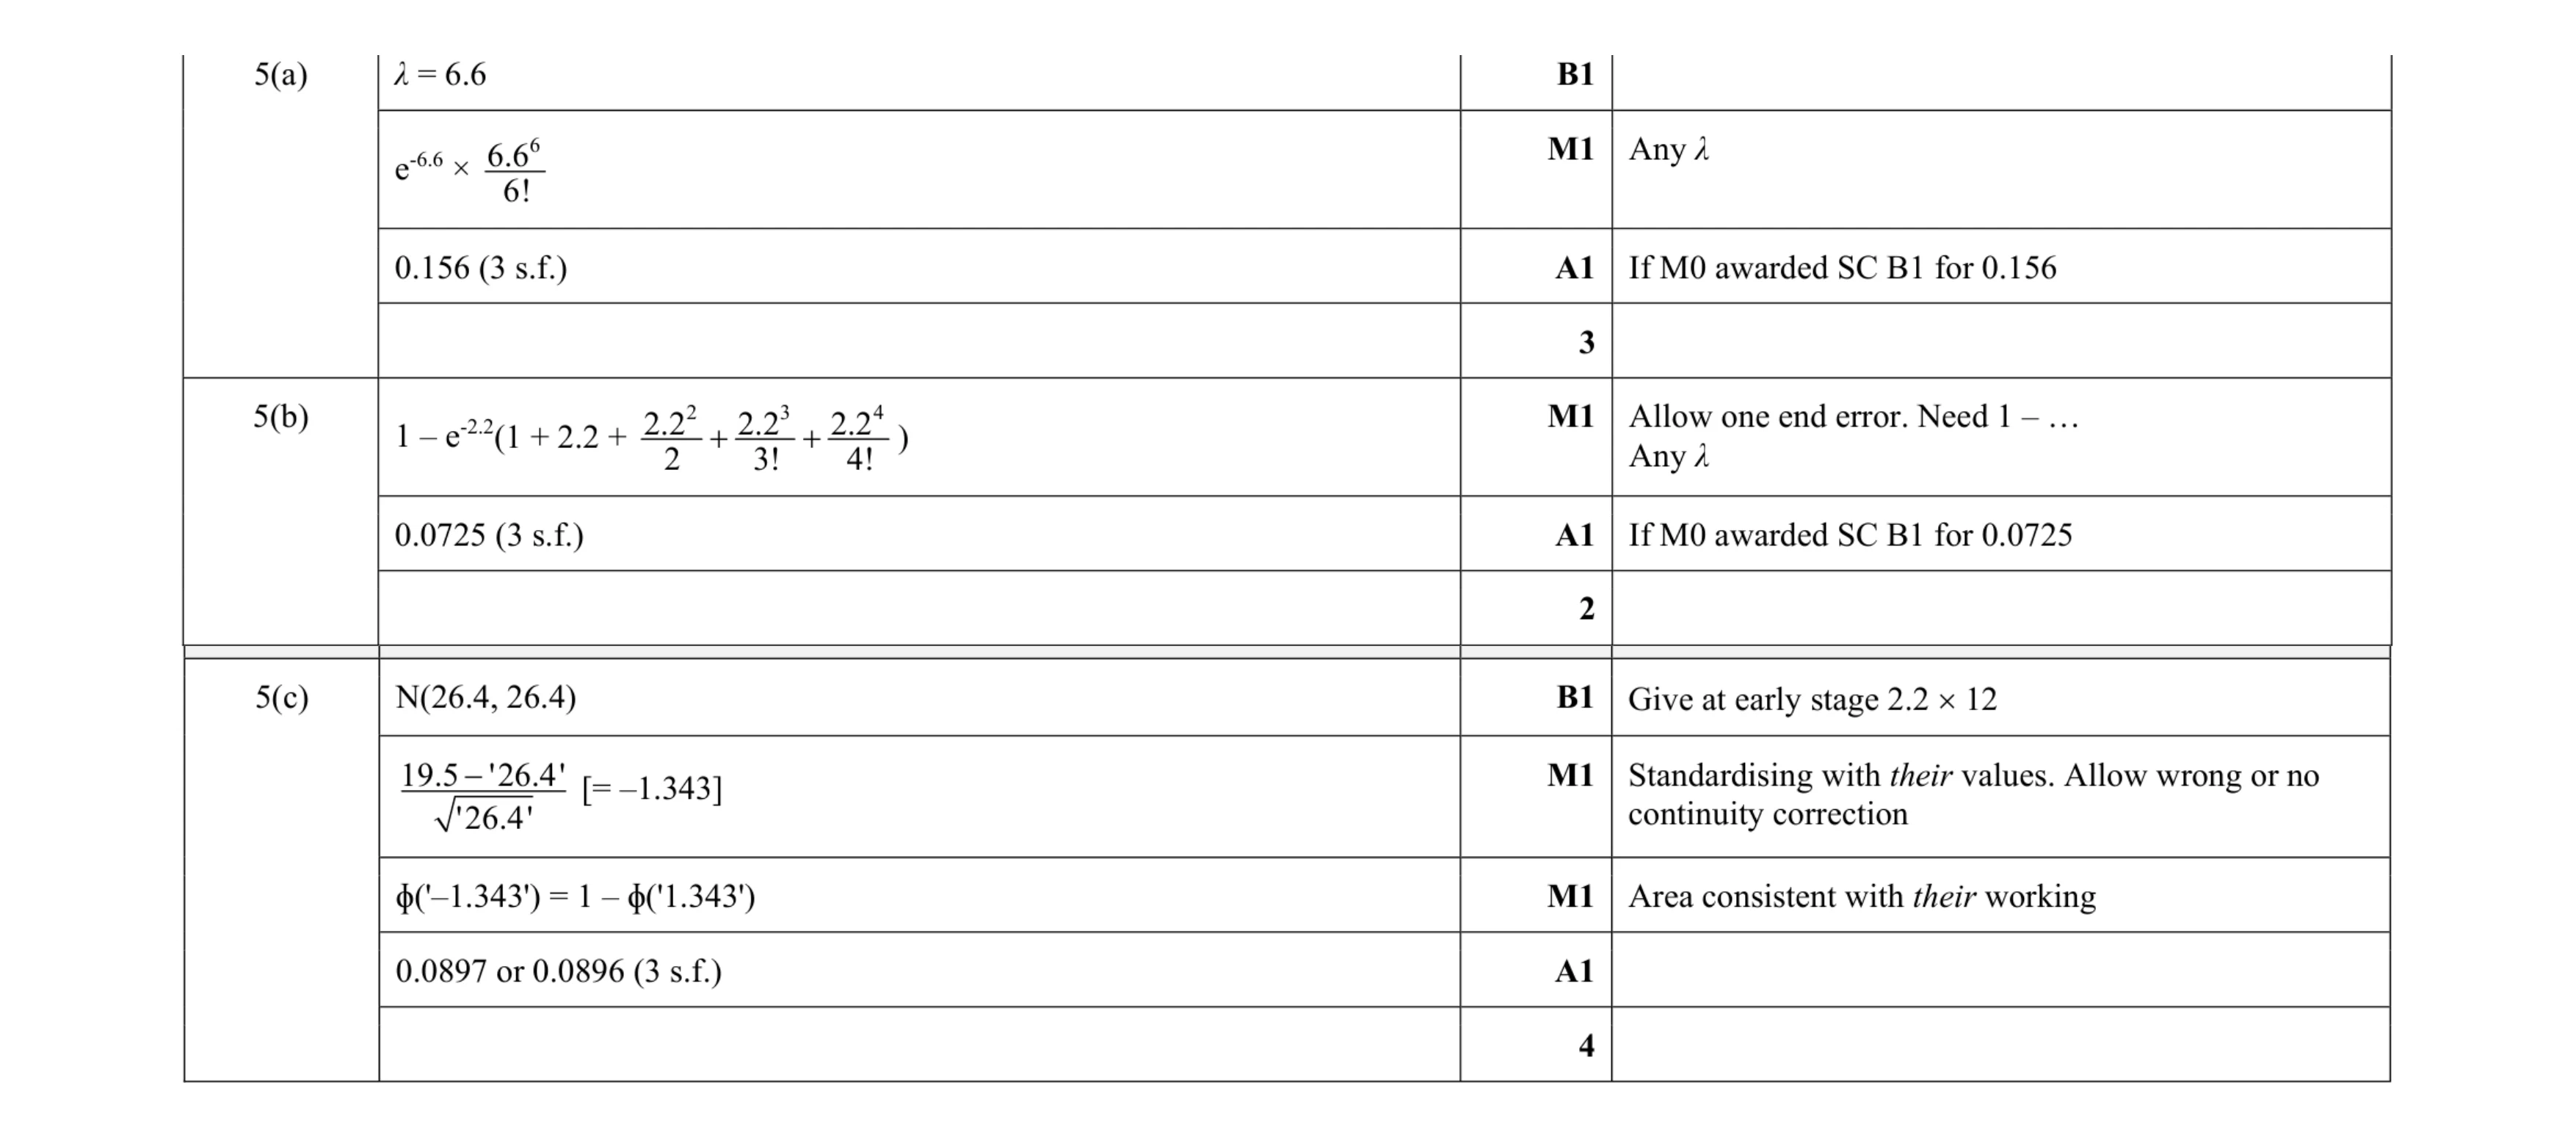 9
9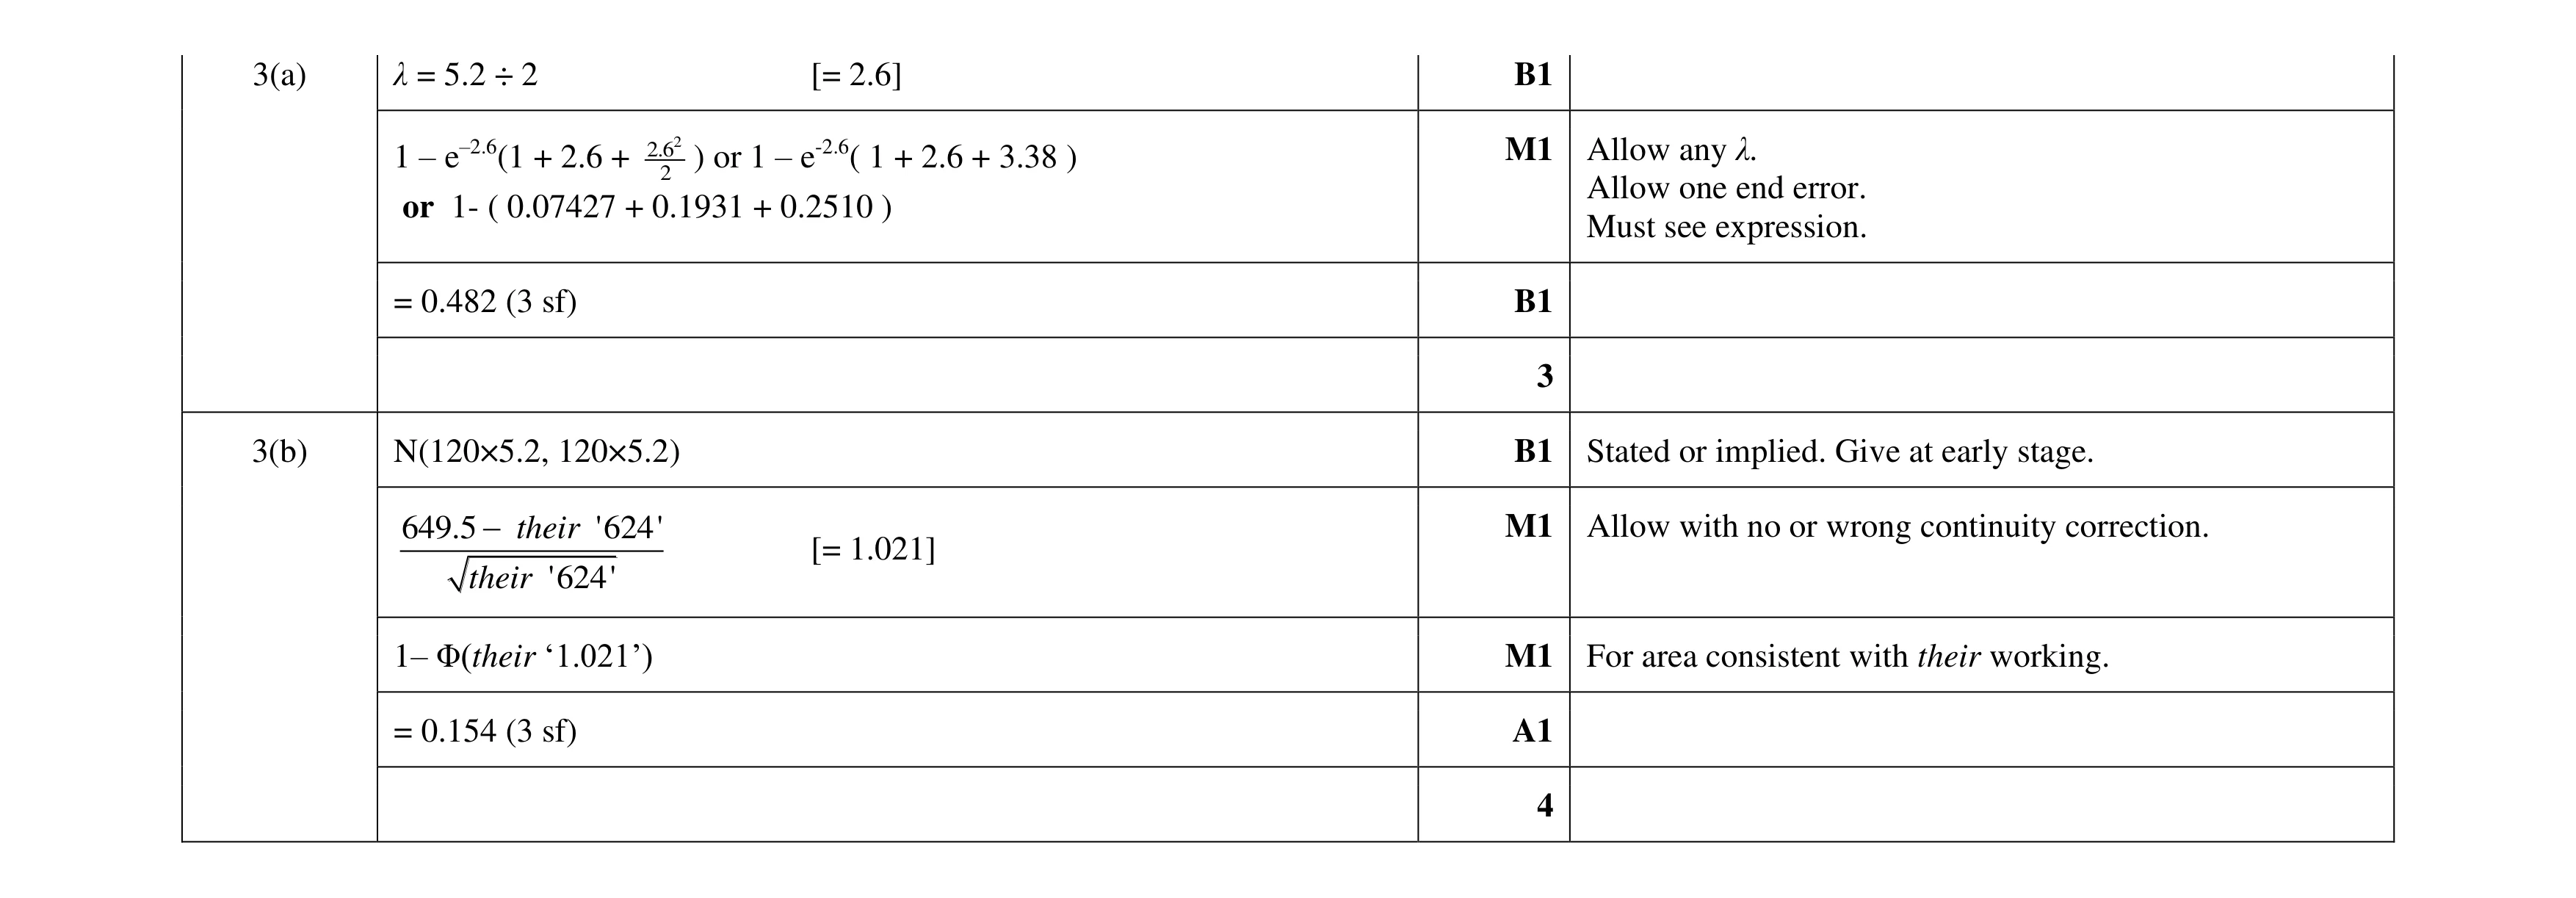 7
7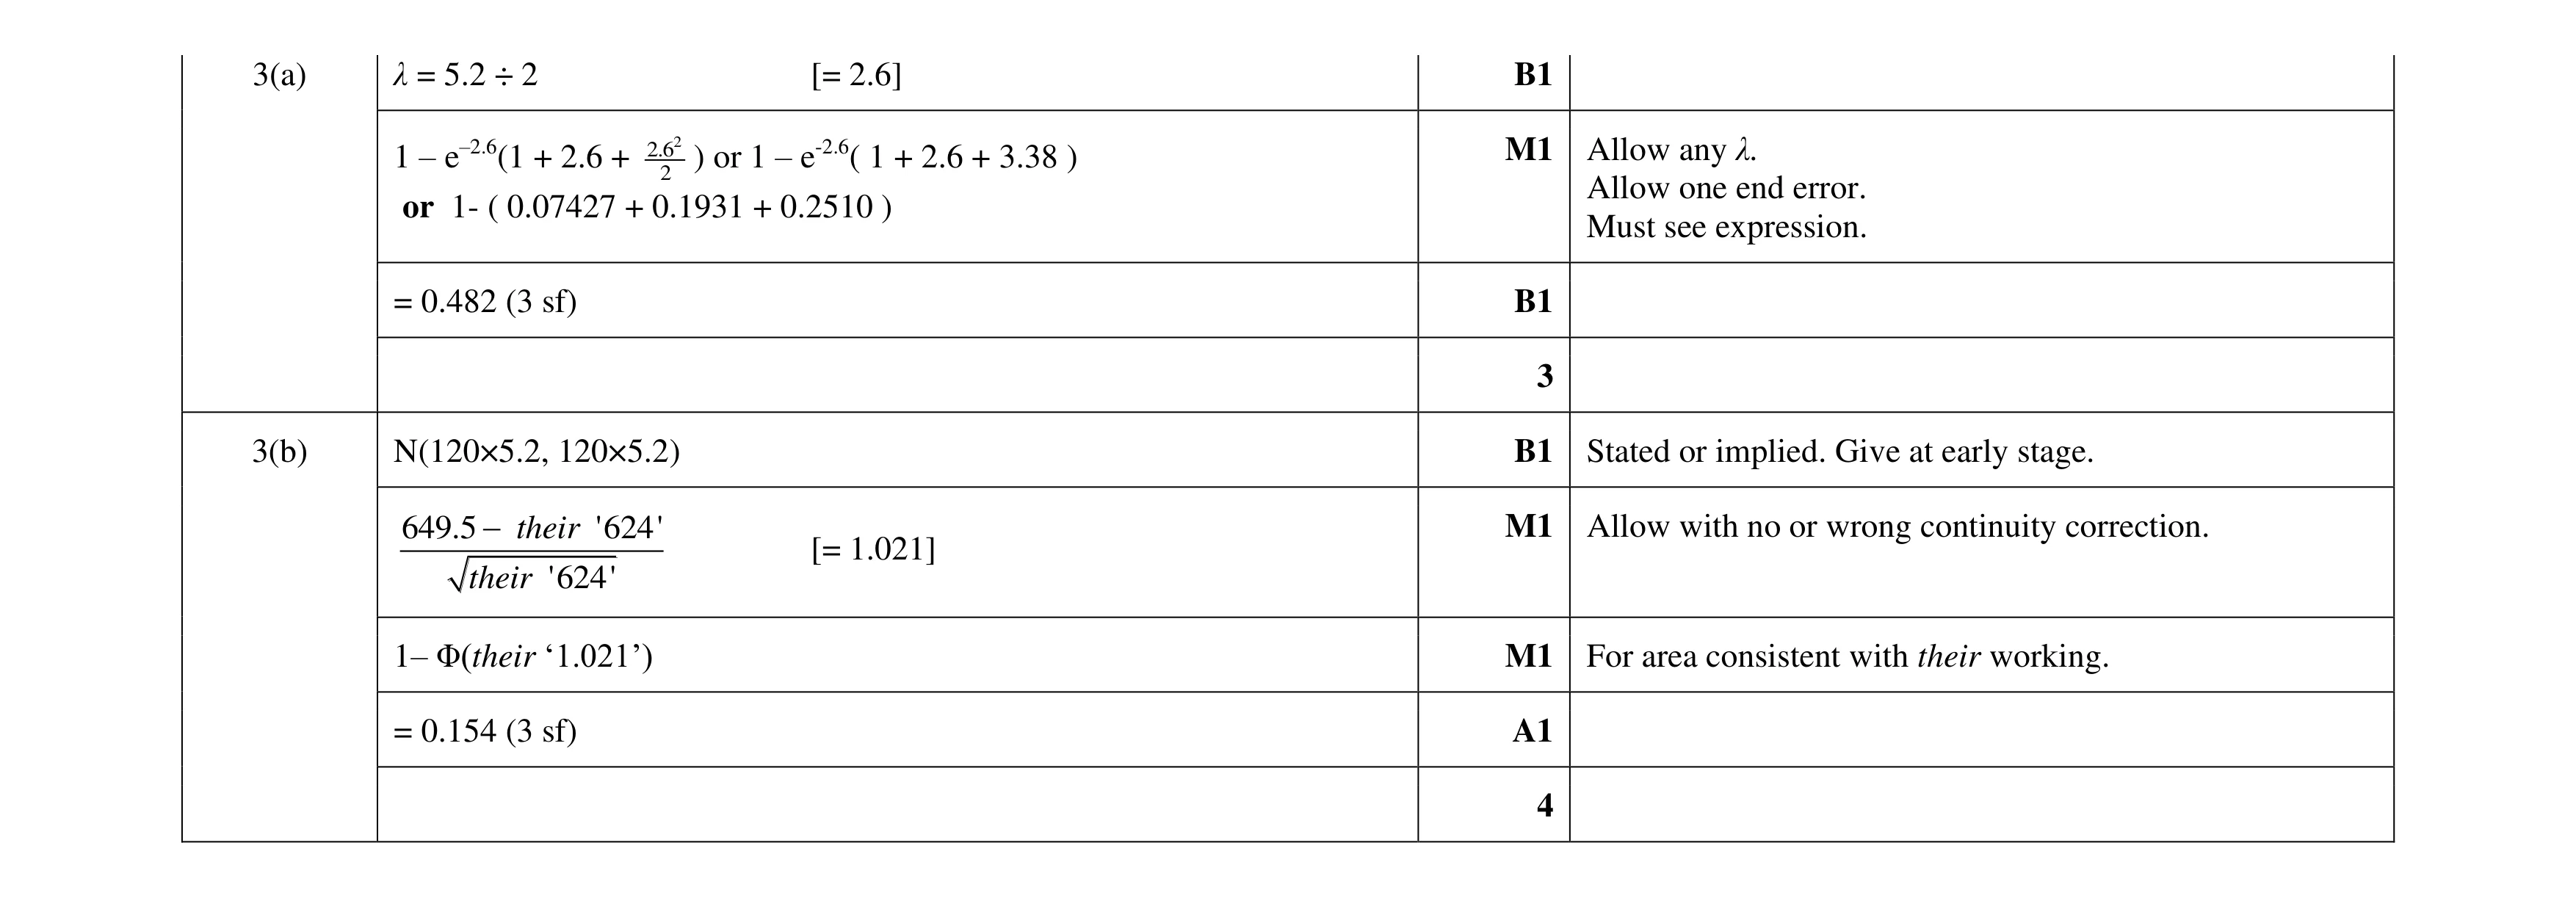 7
7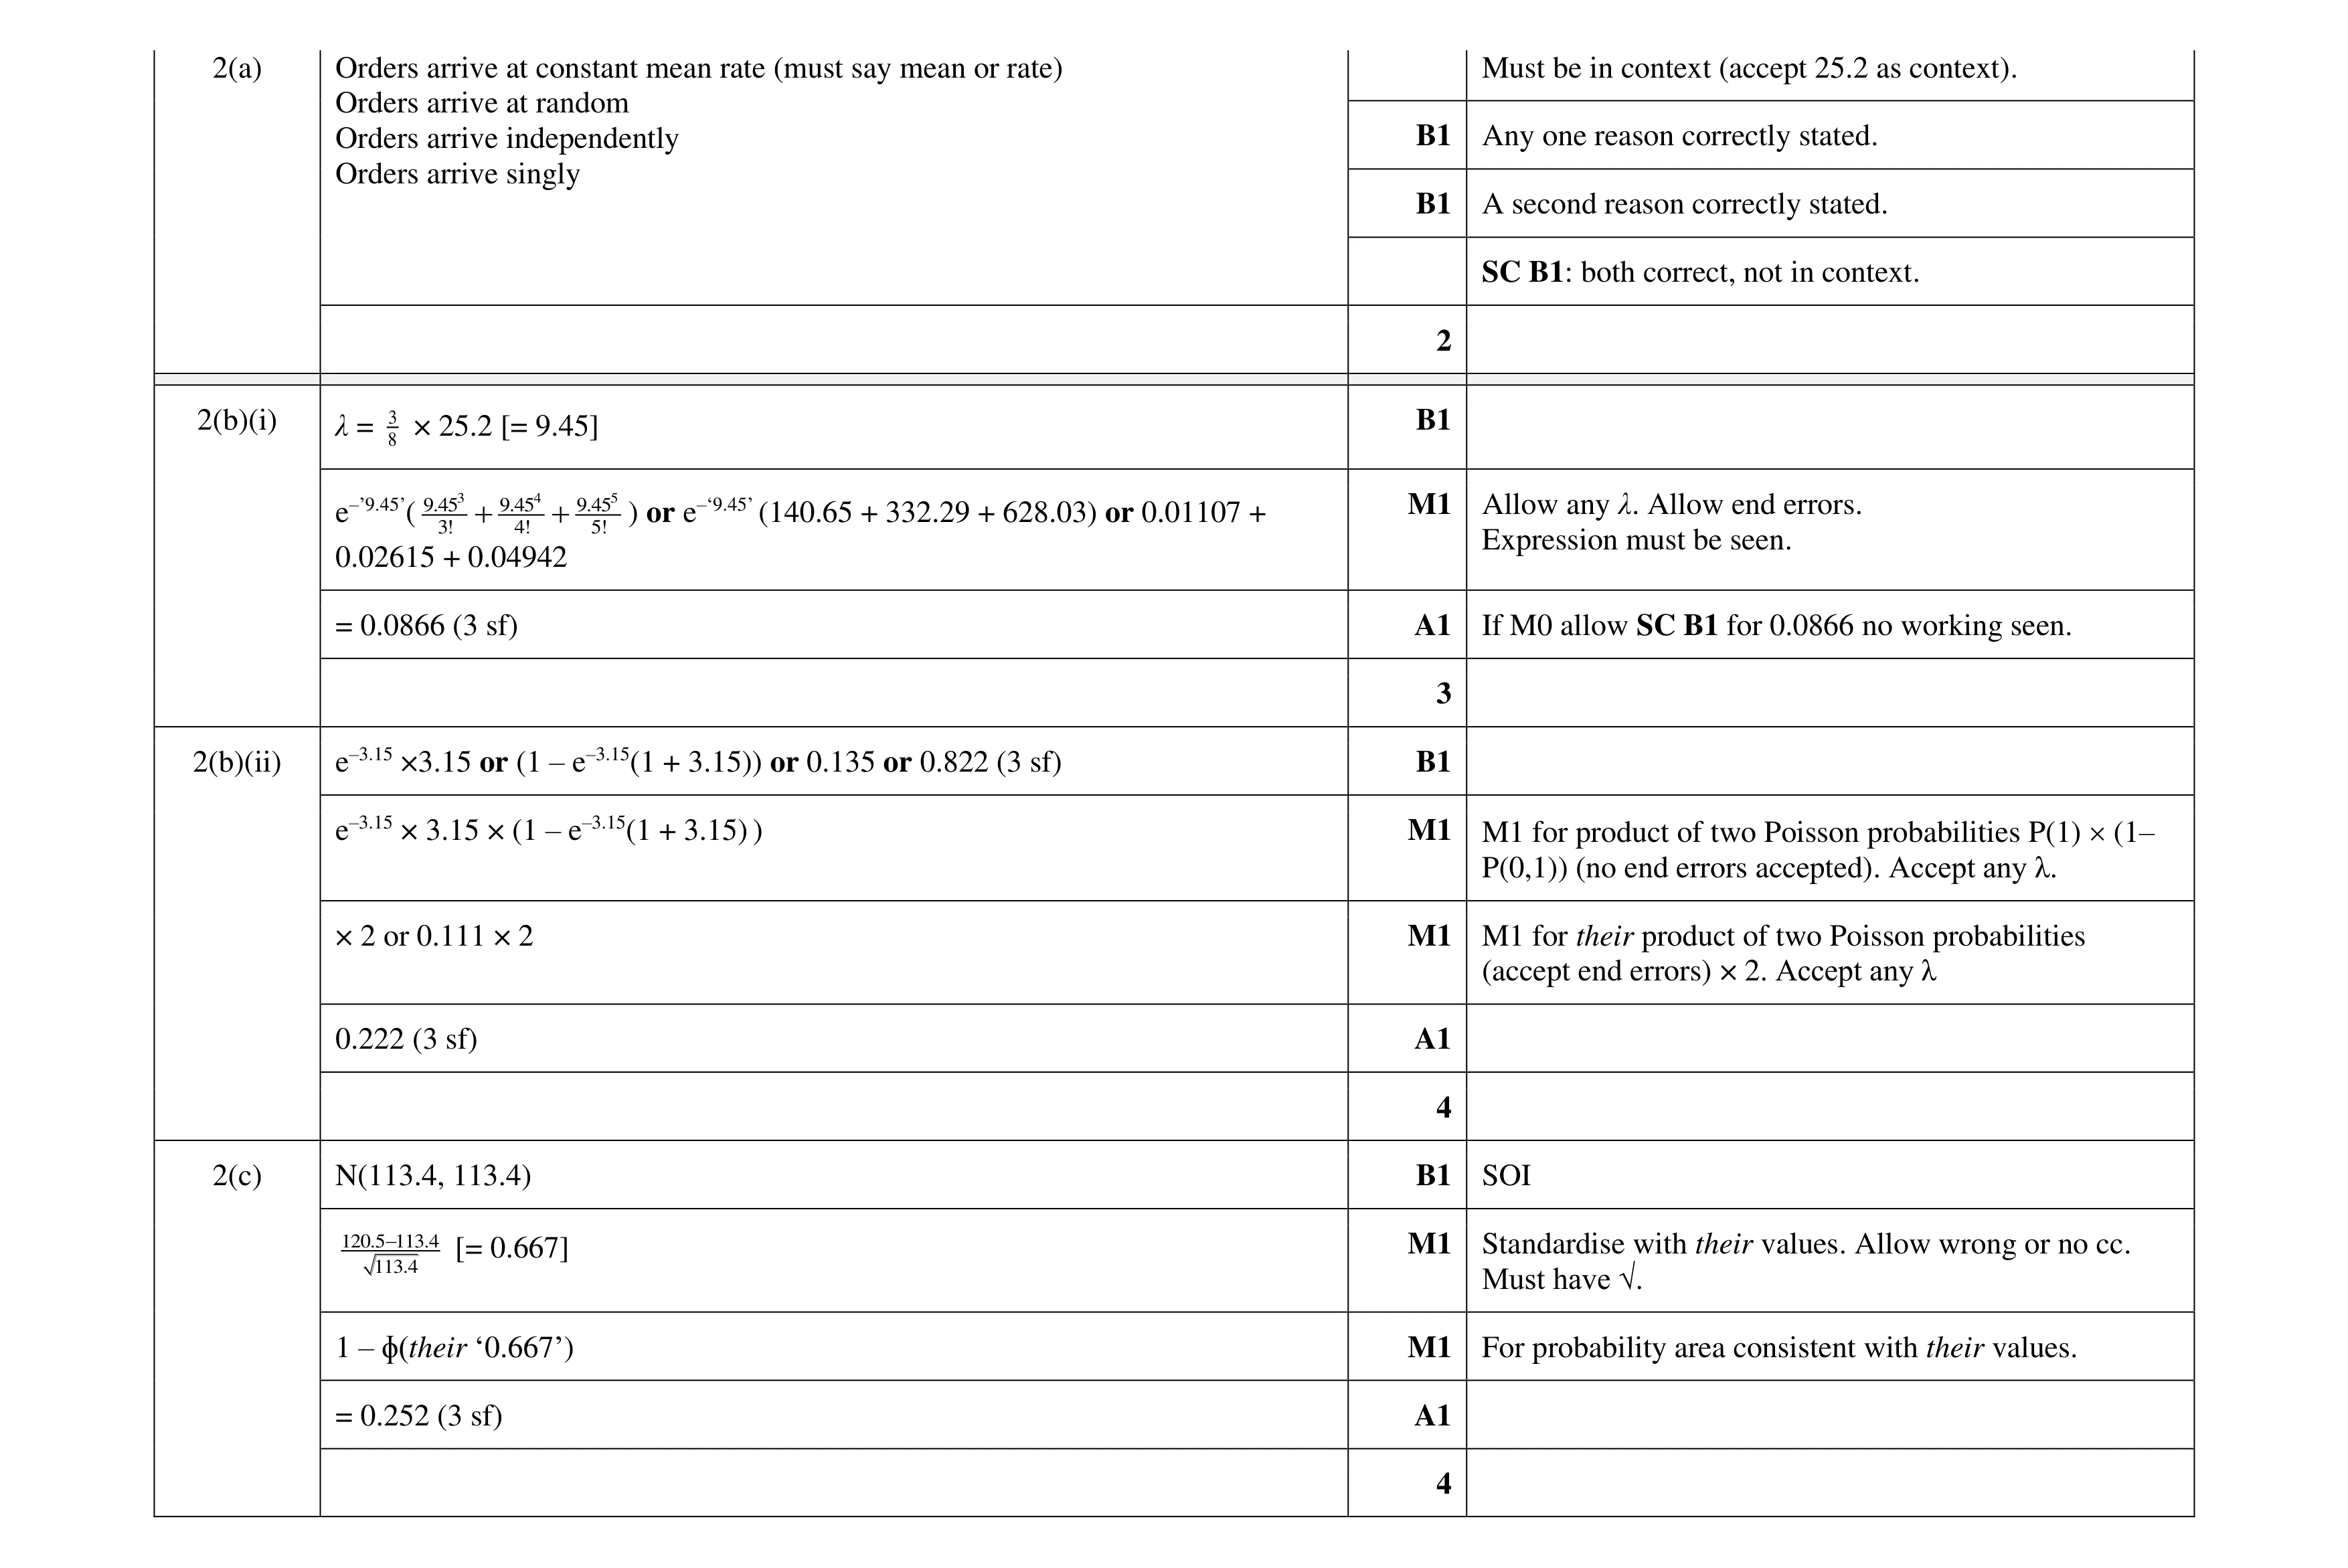 13
13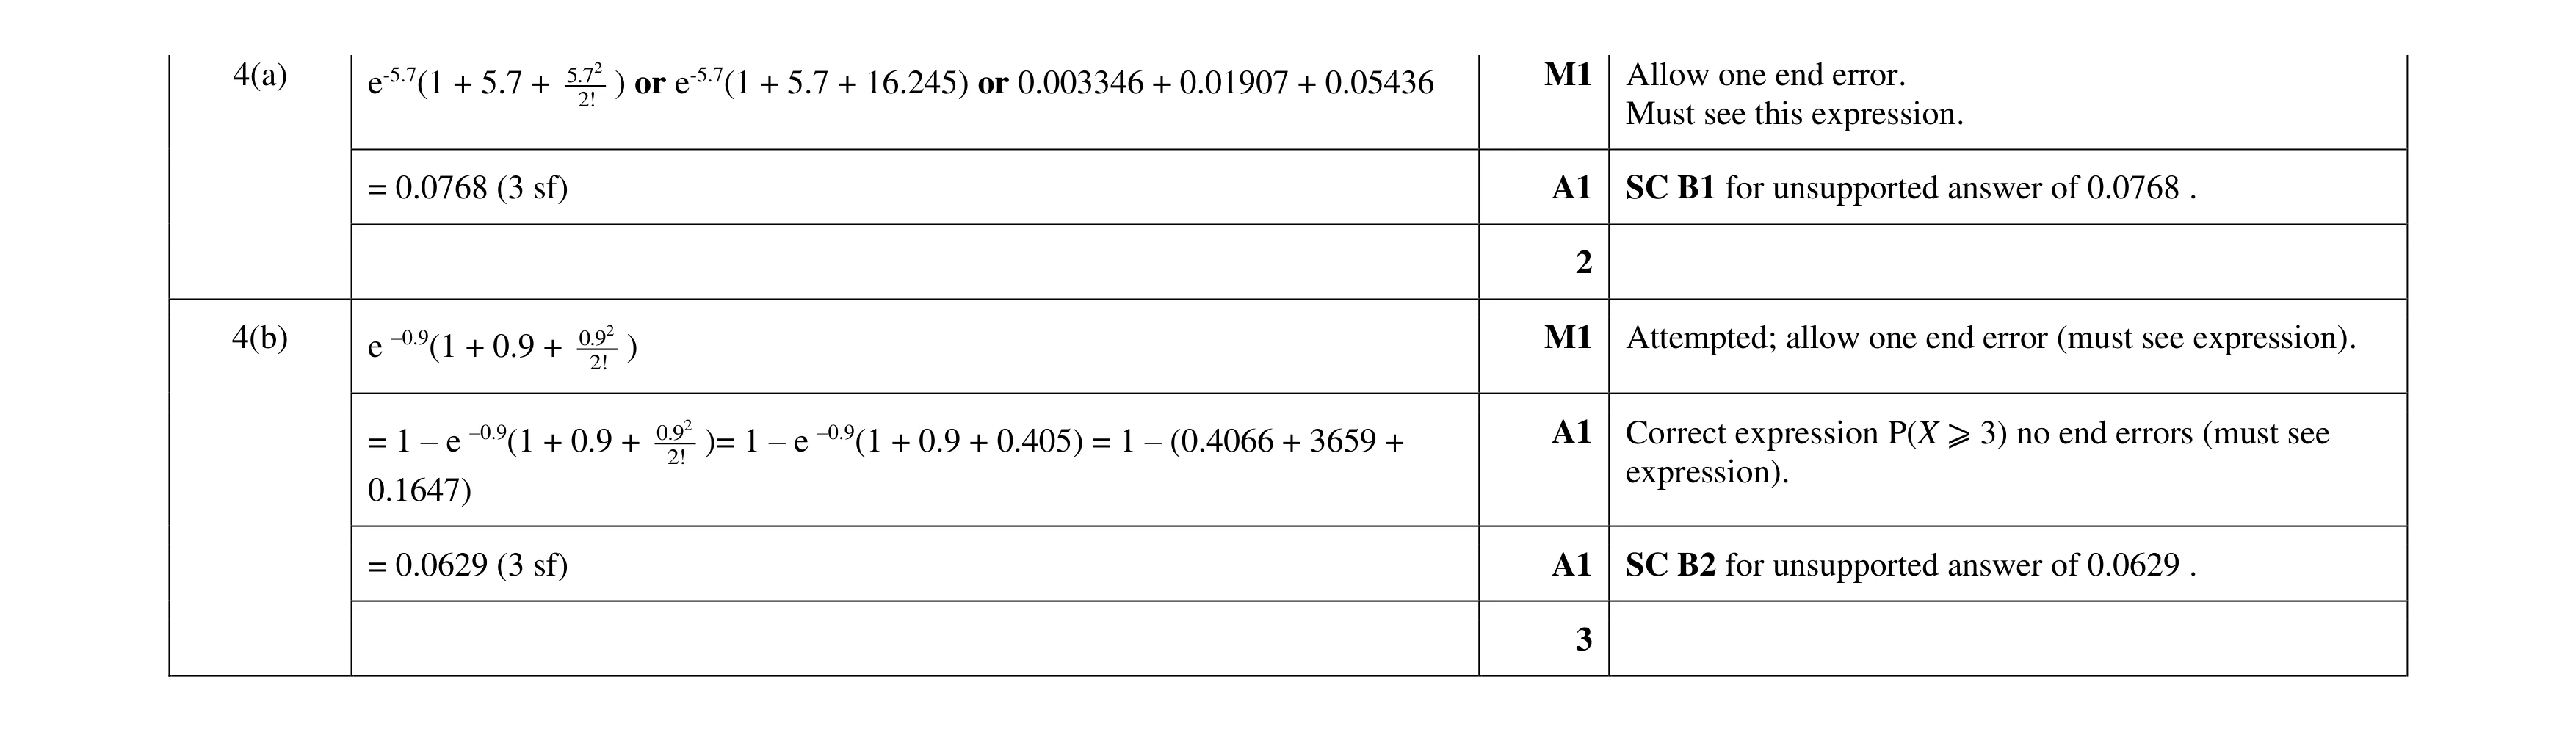 5
5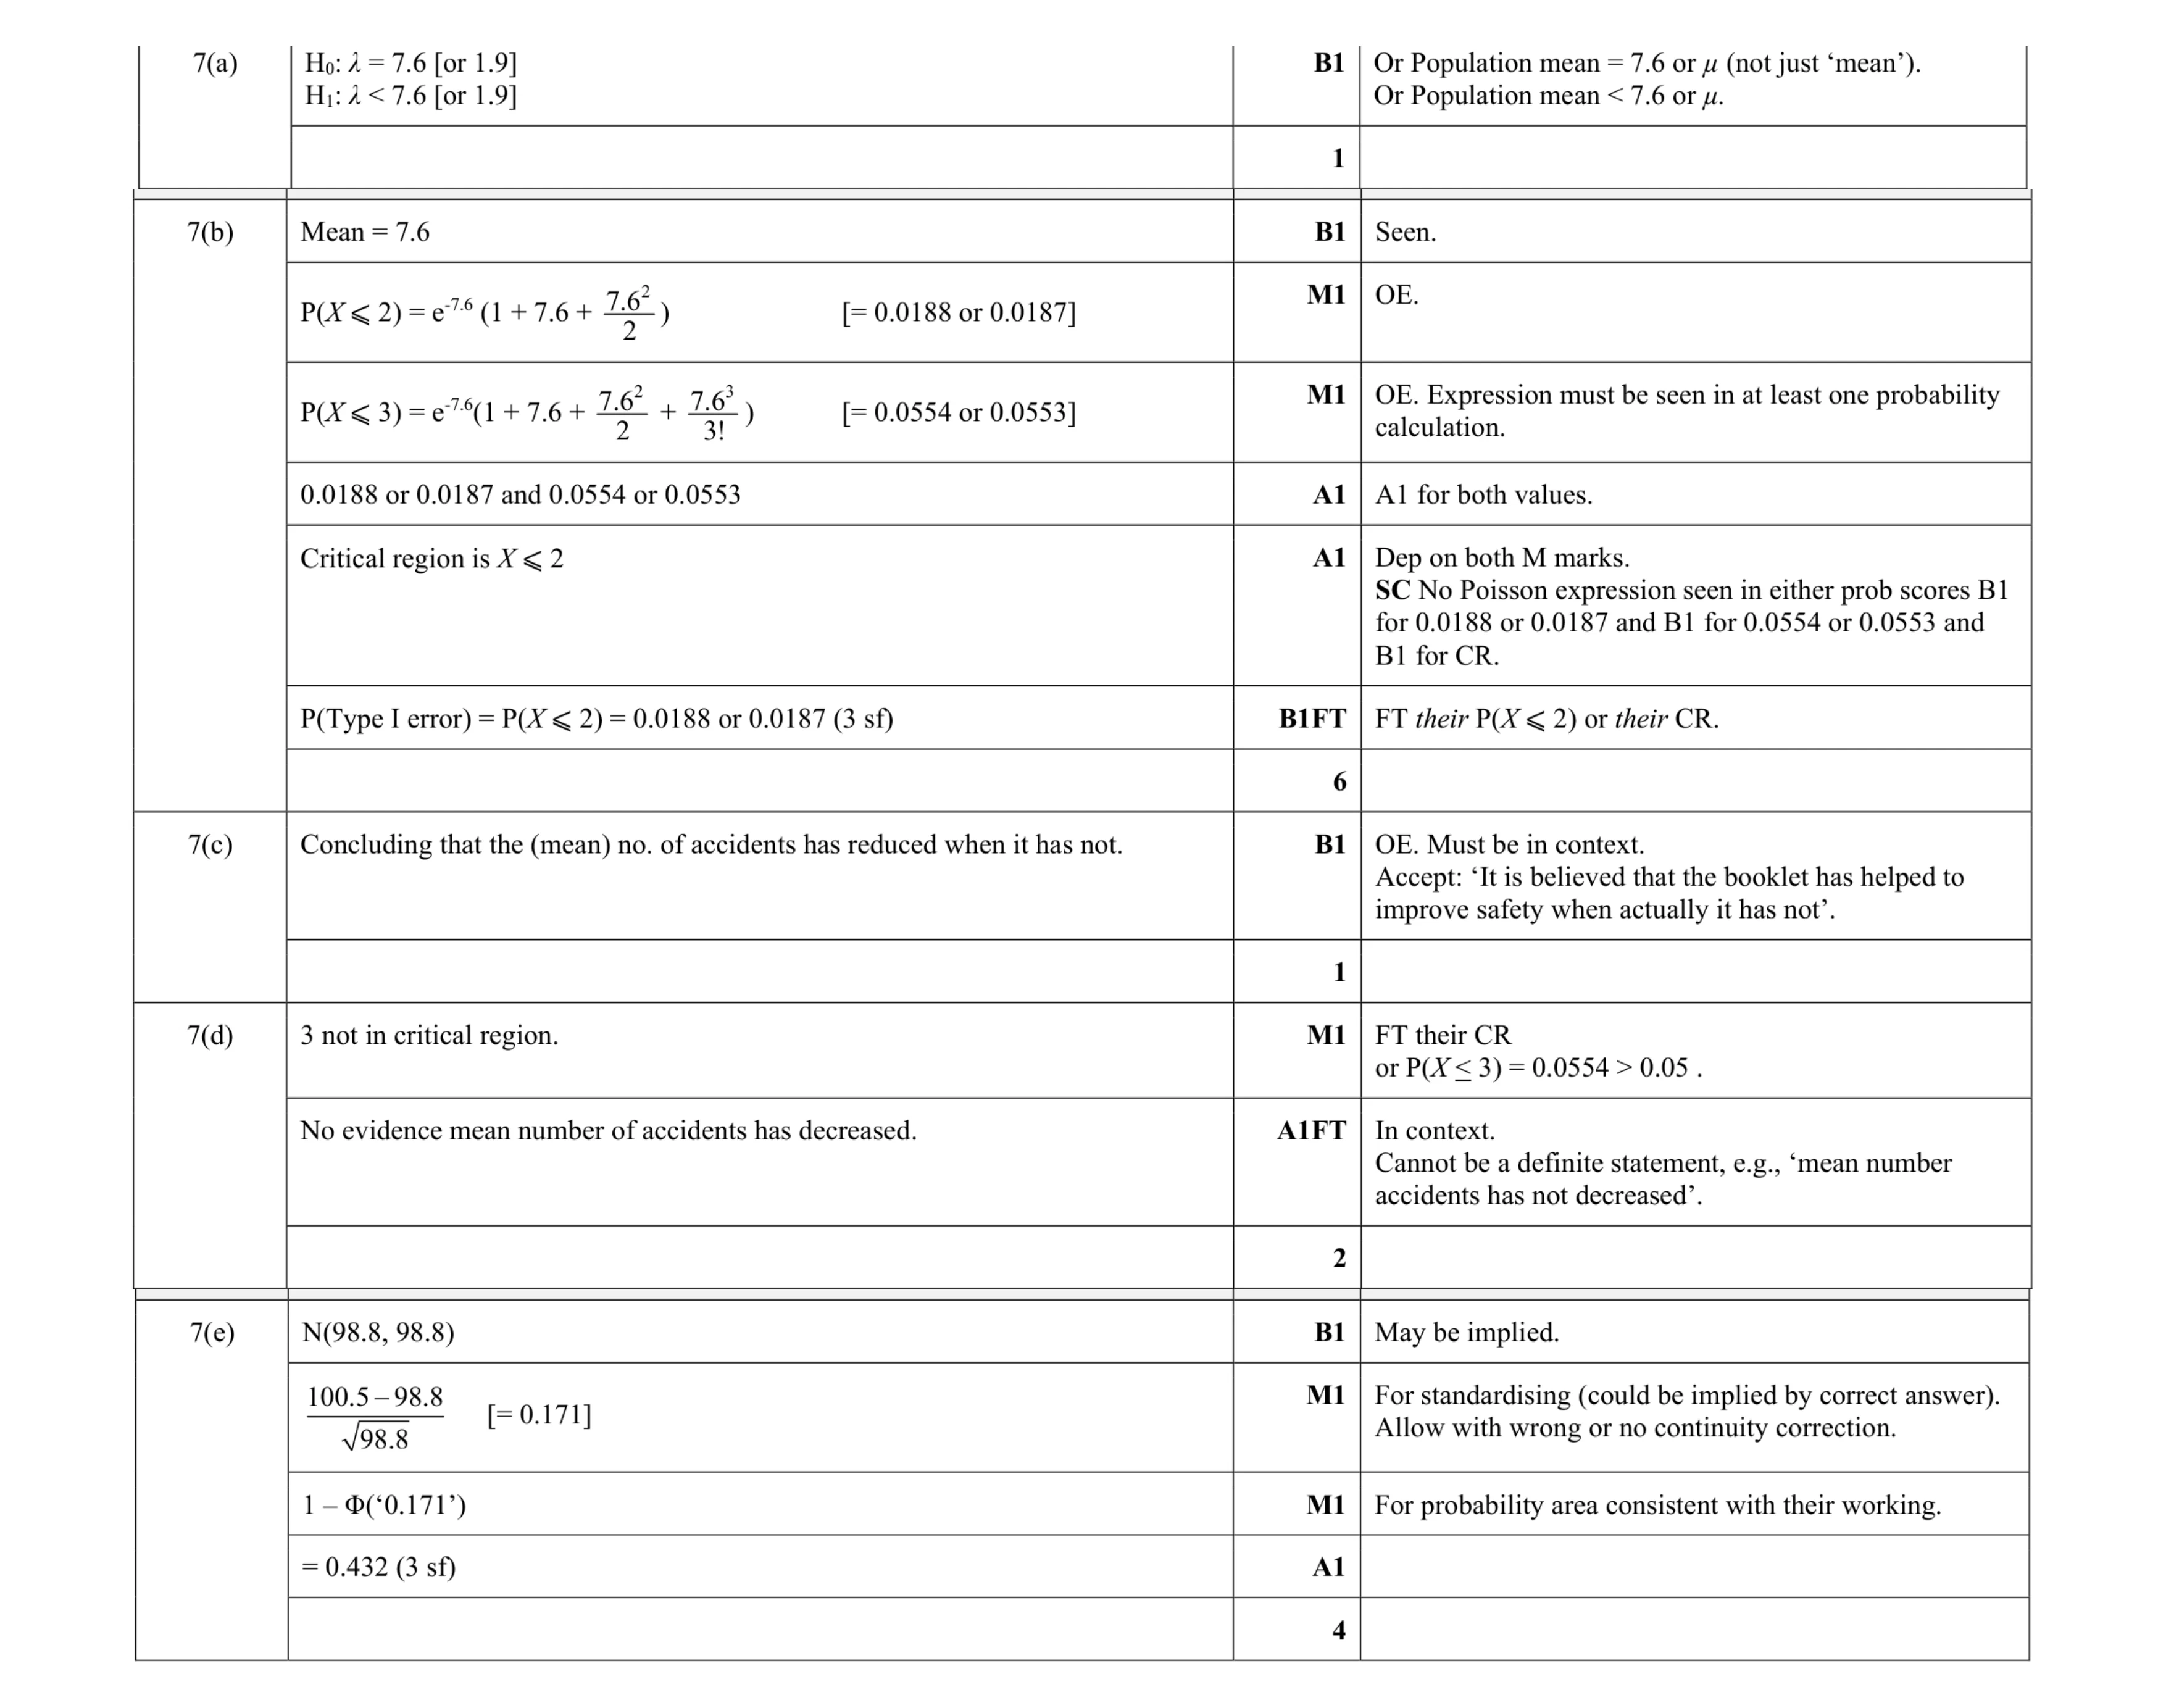 14
14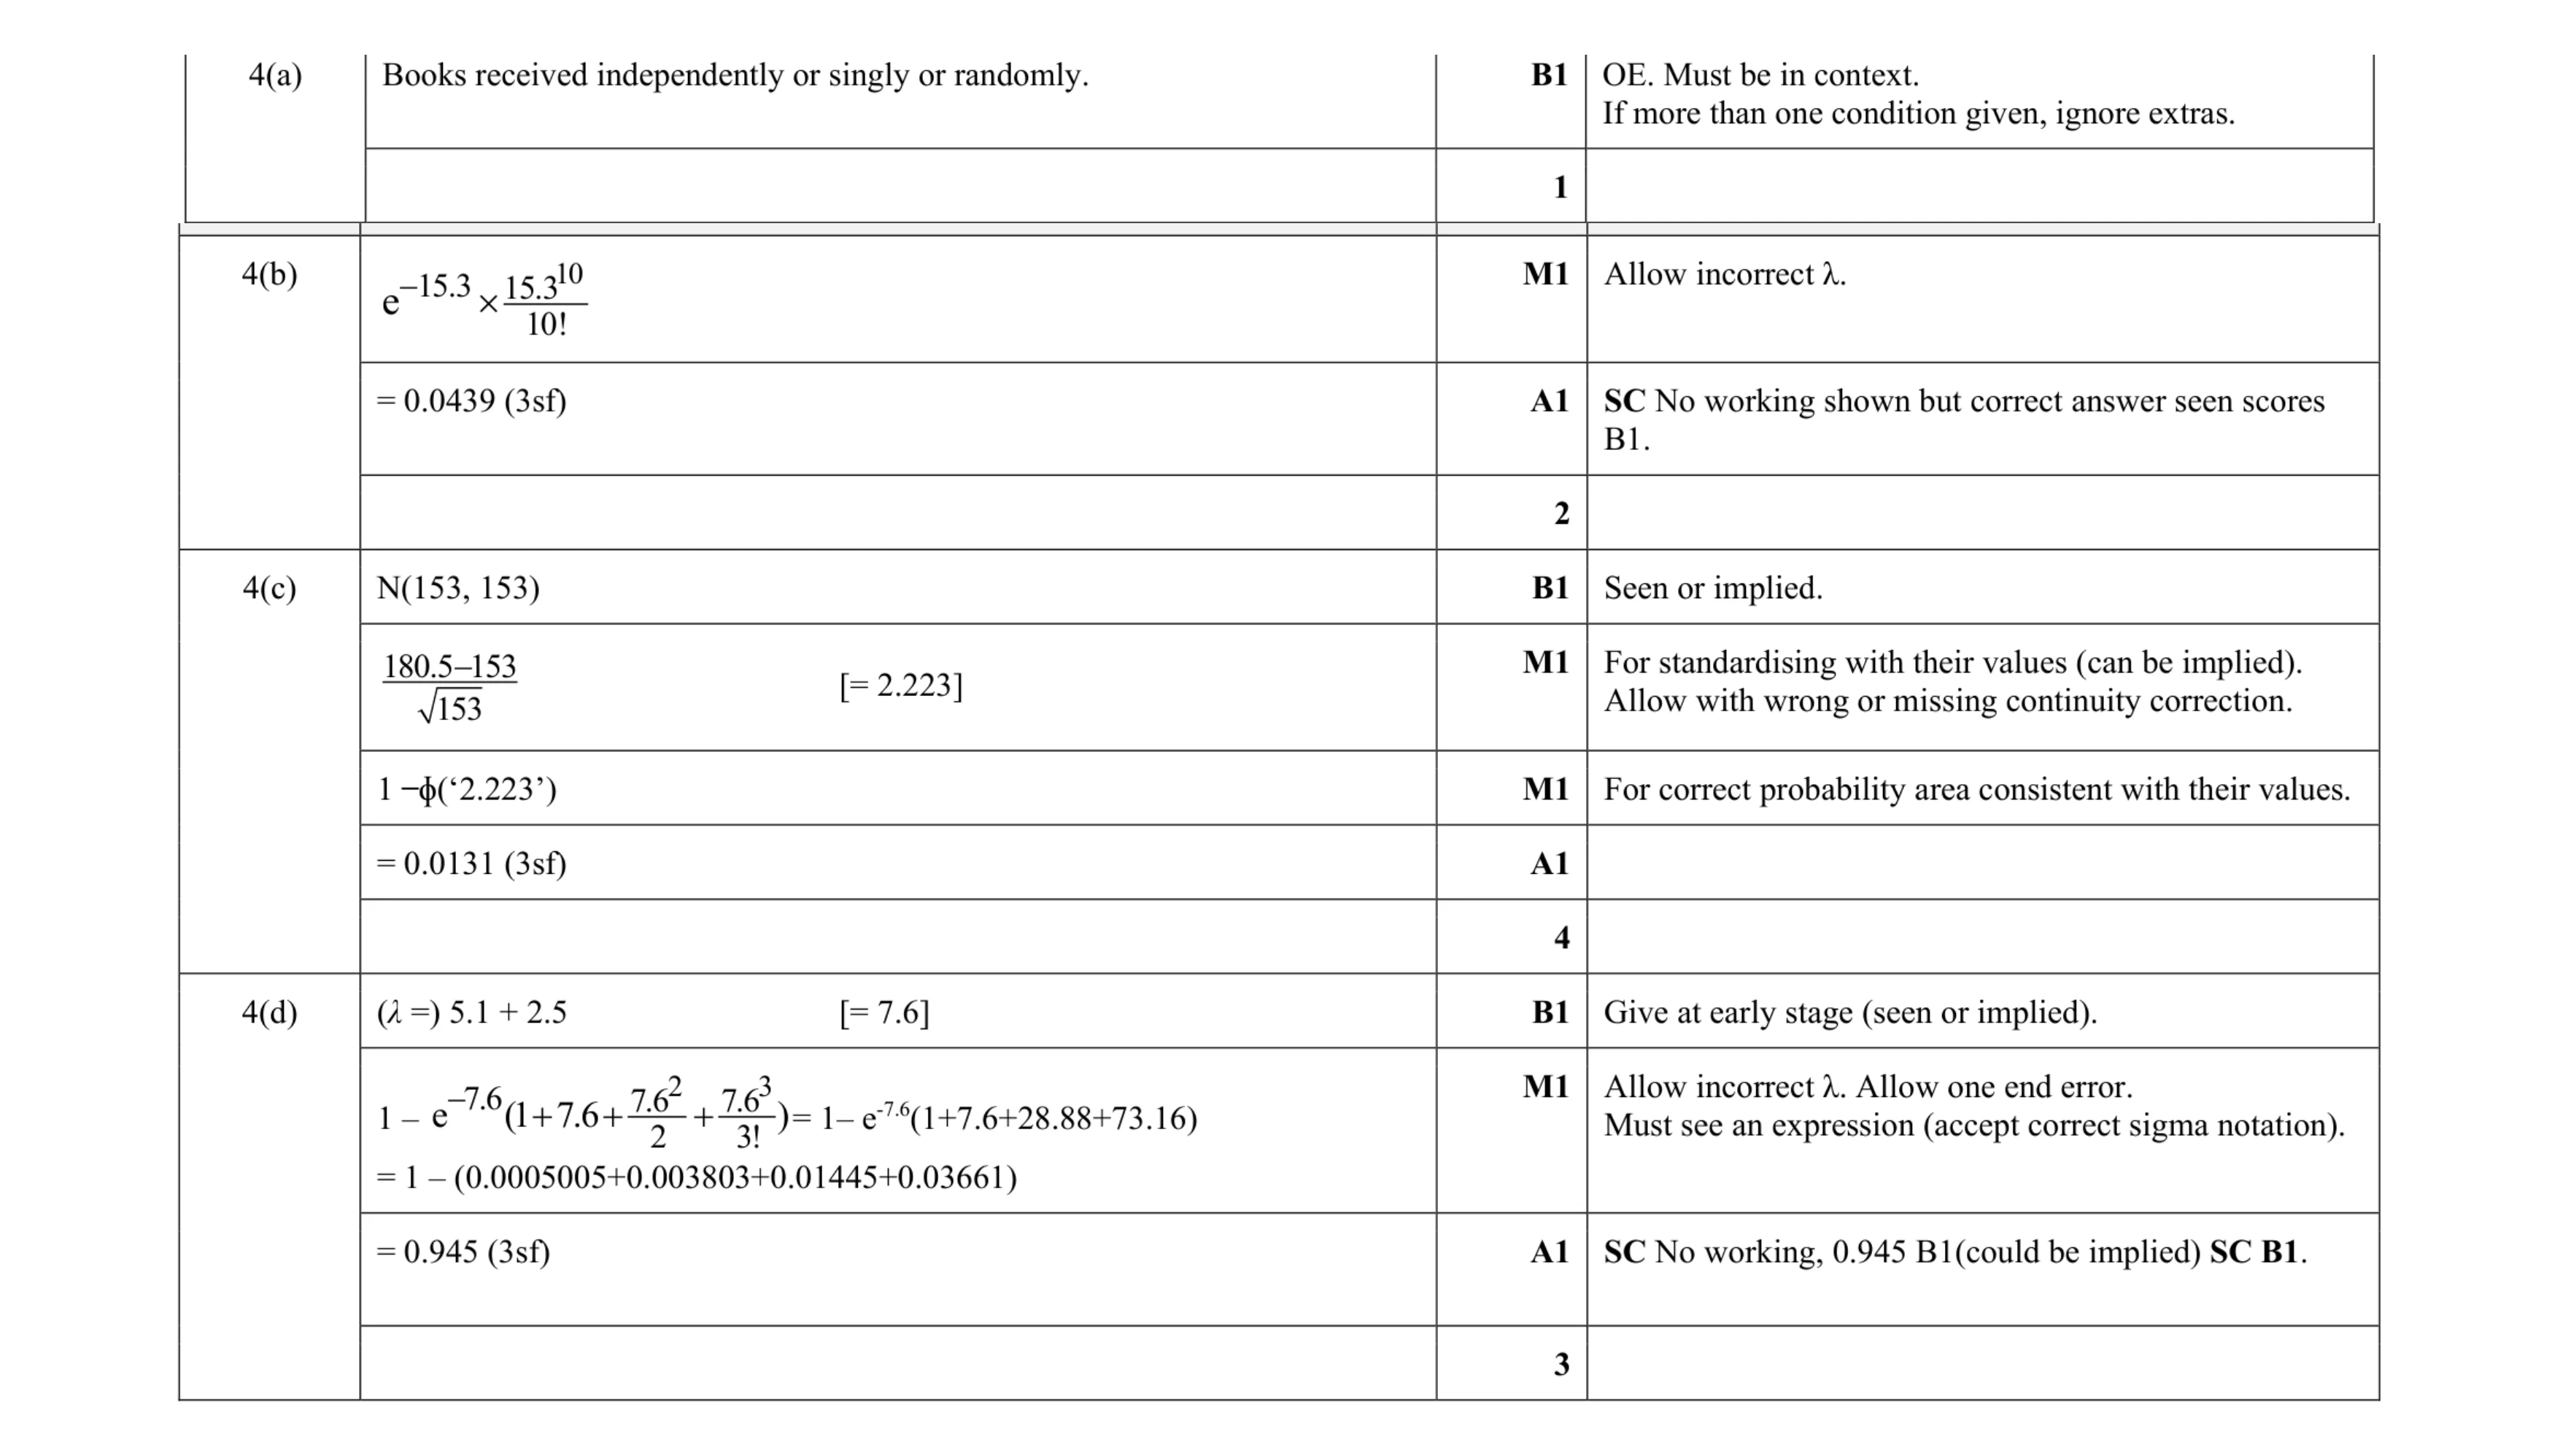 10
10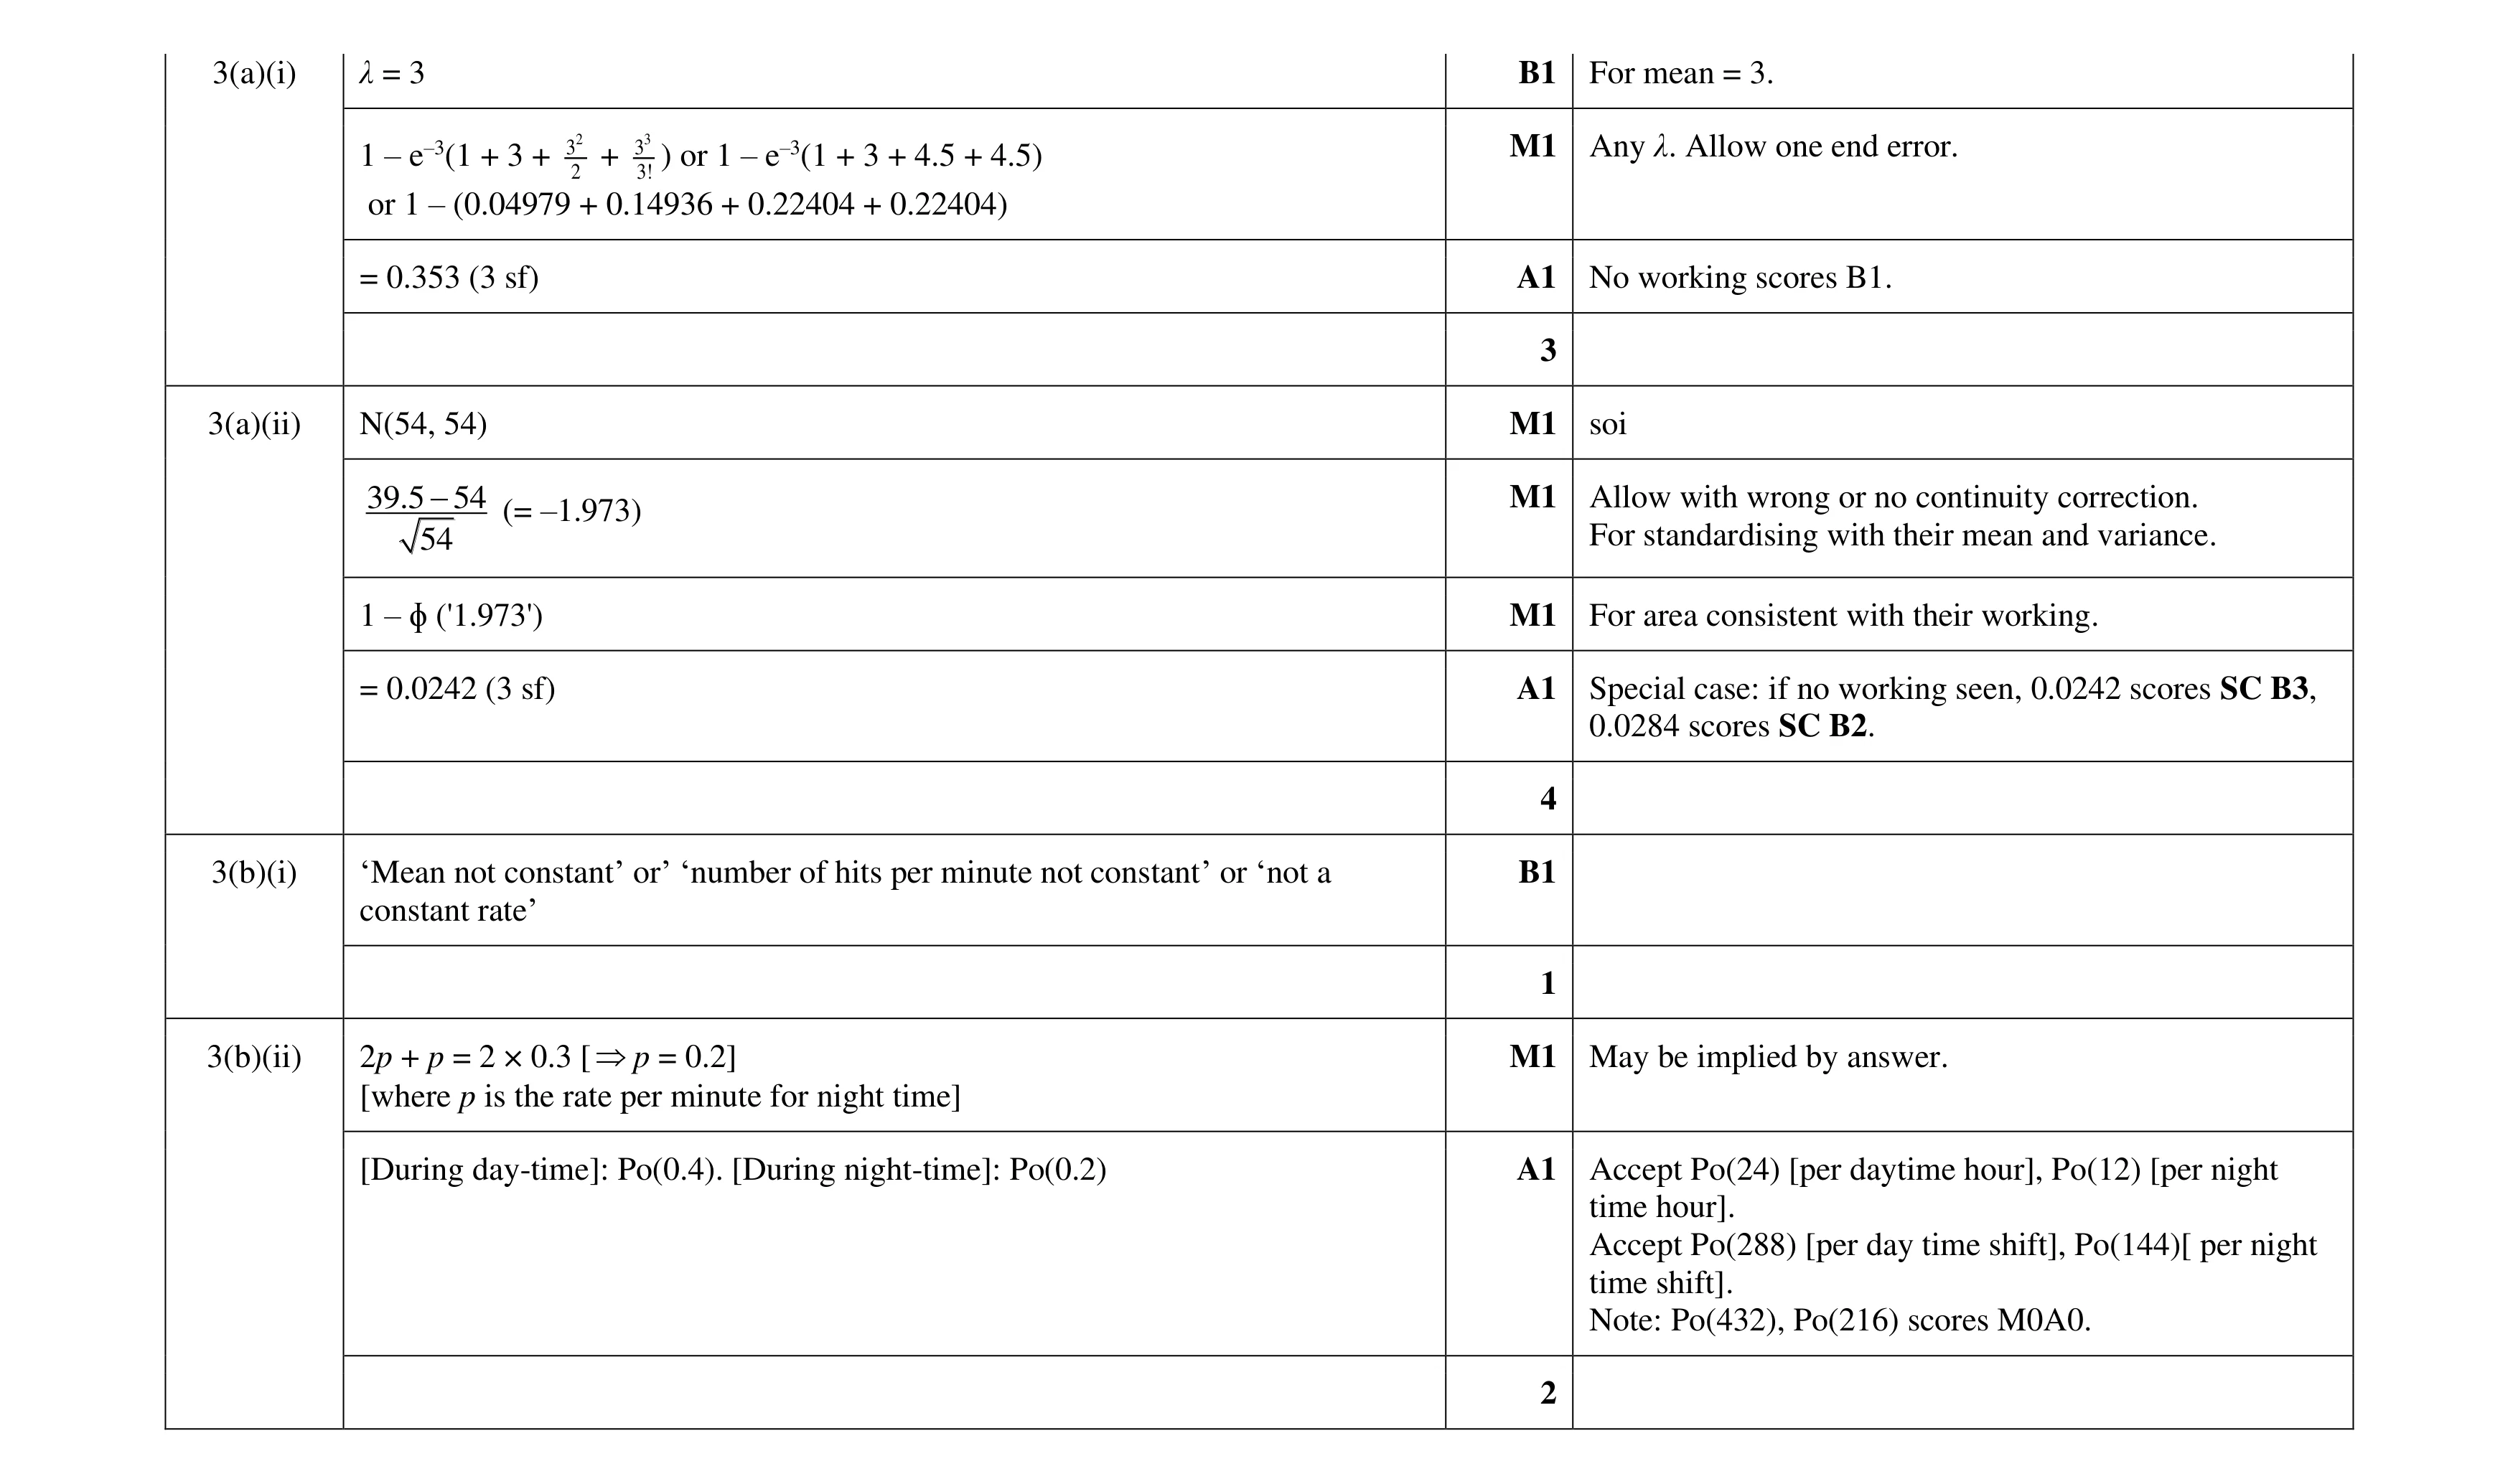 10
10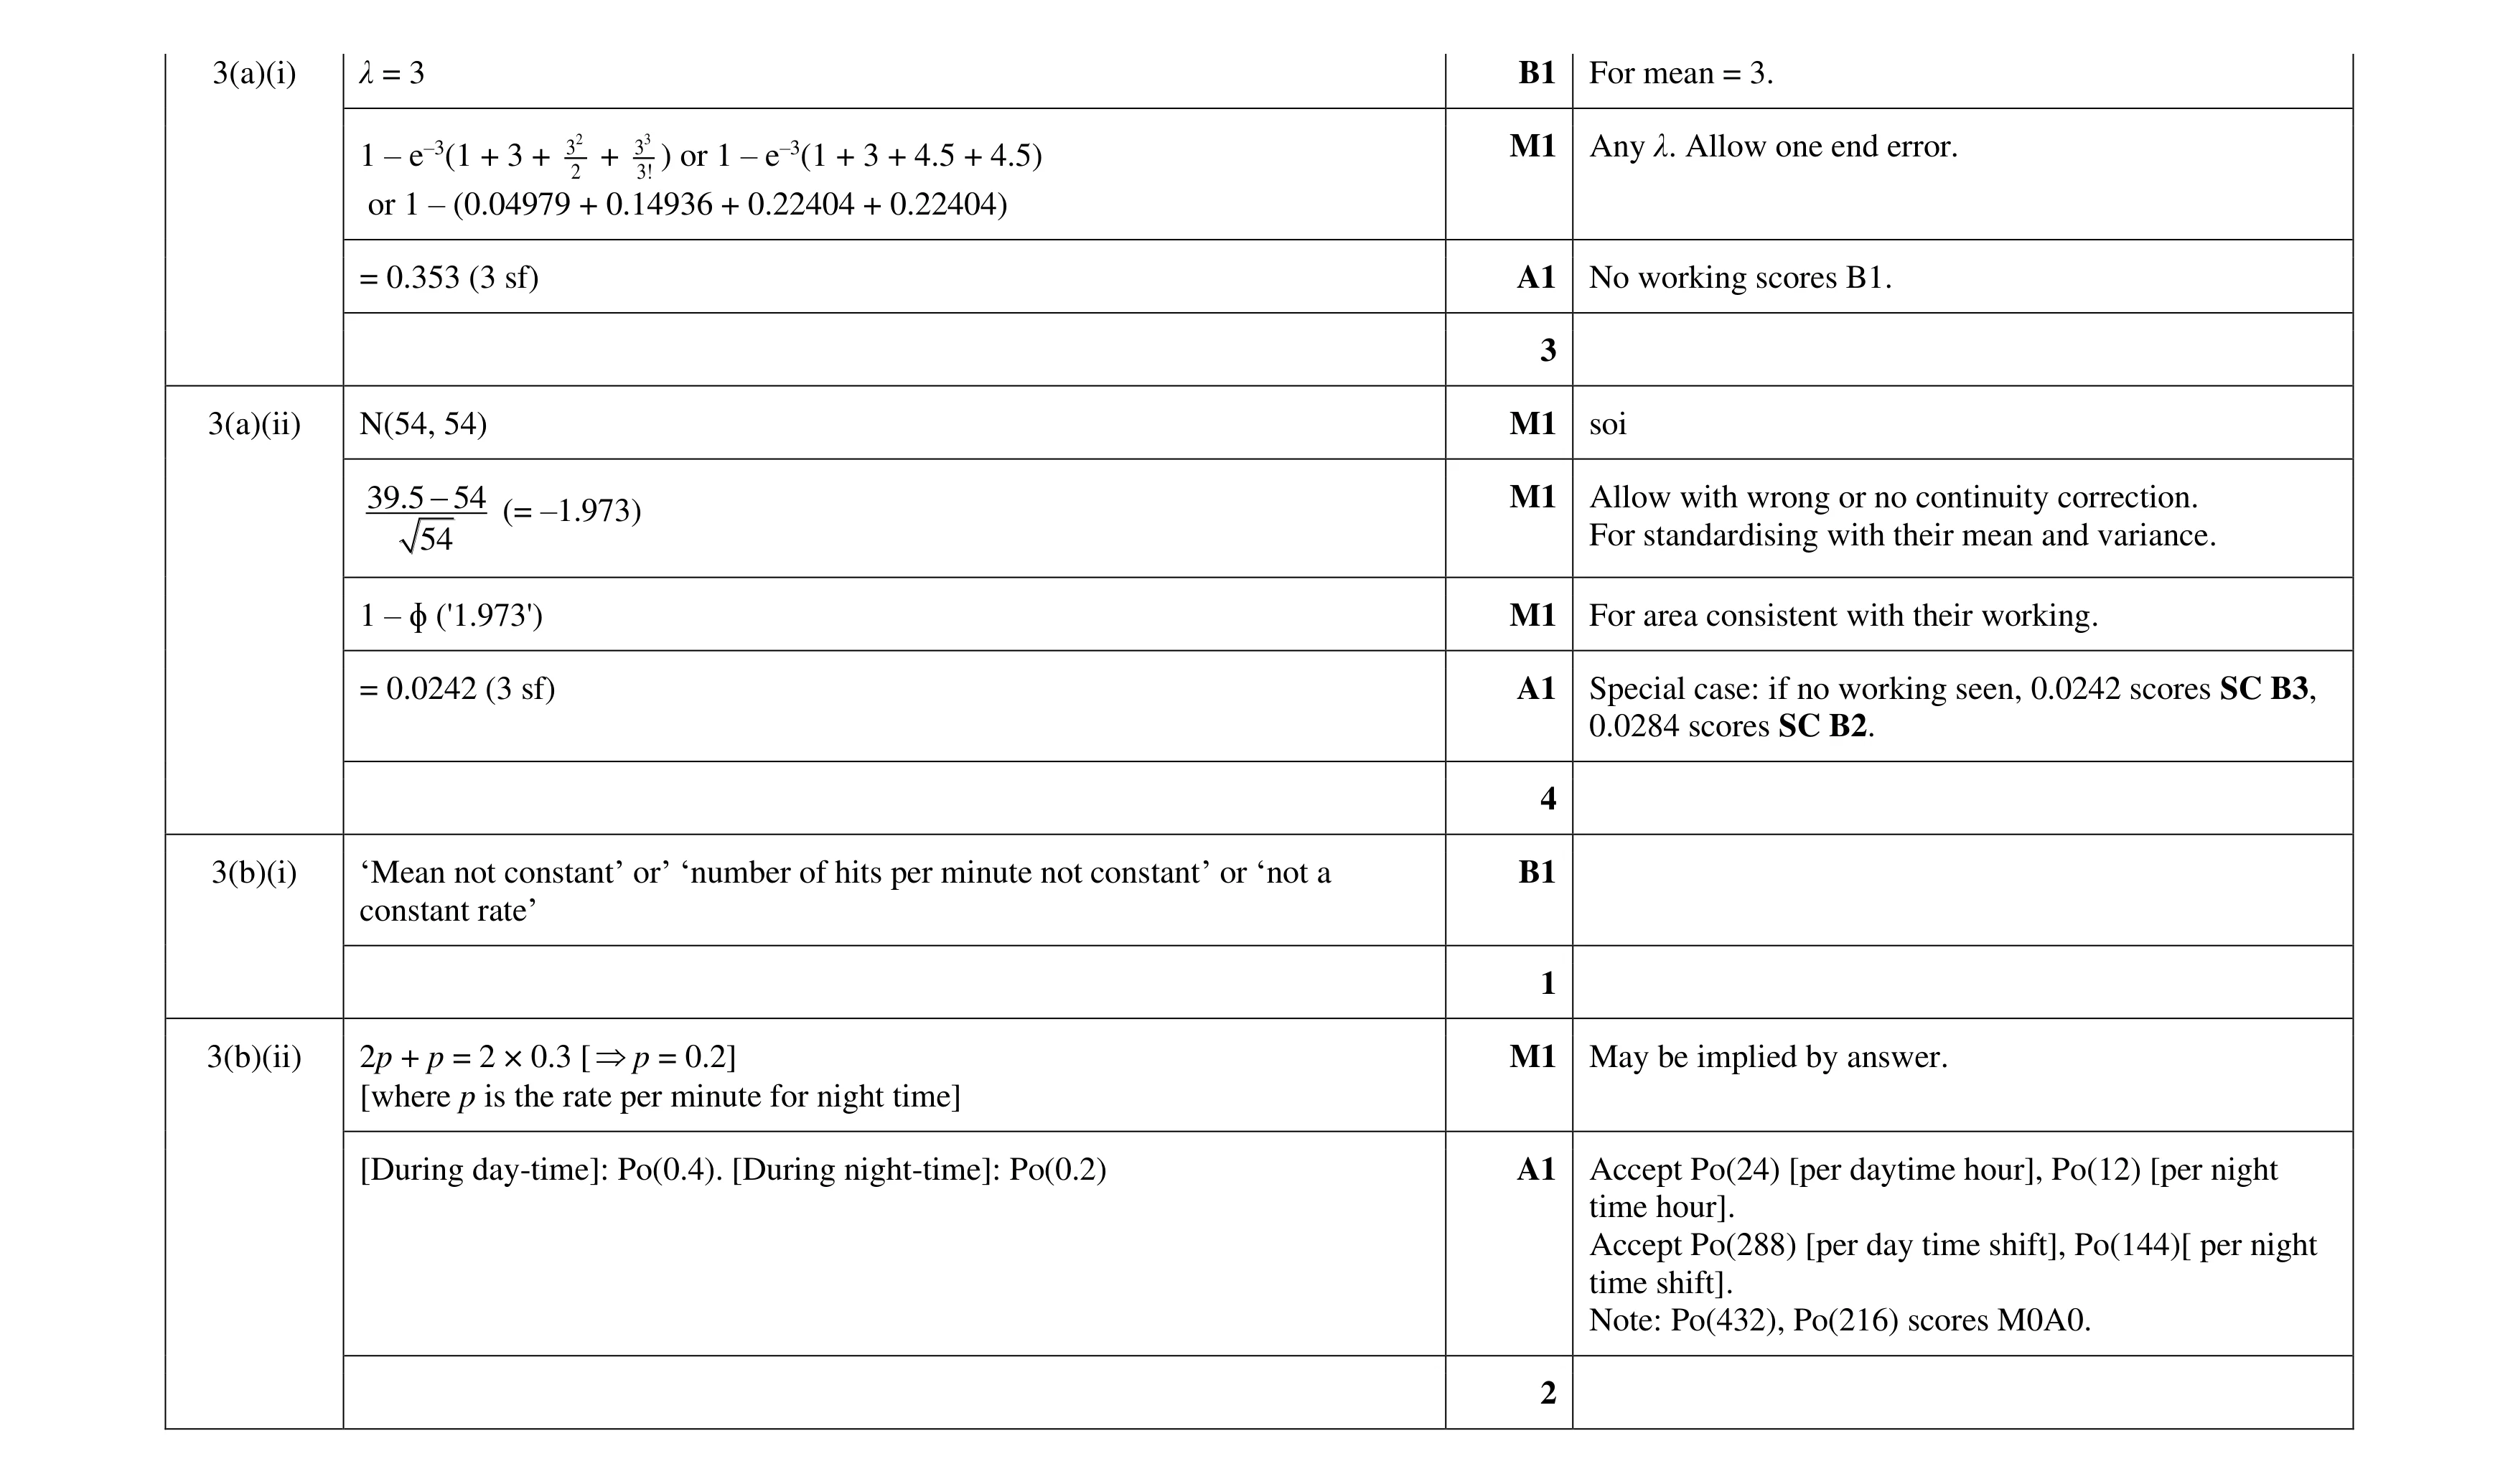 10
10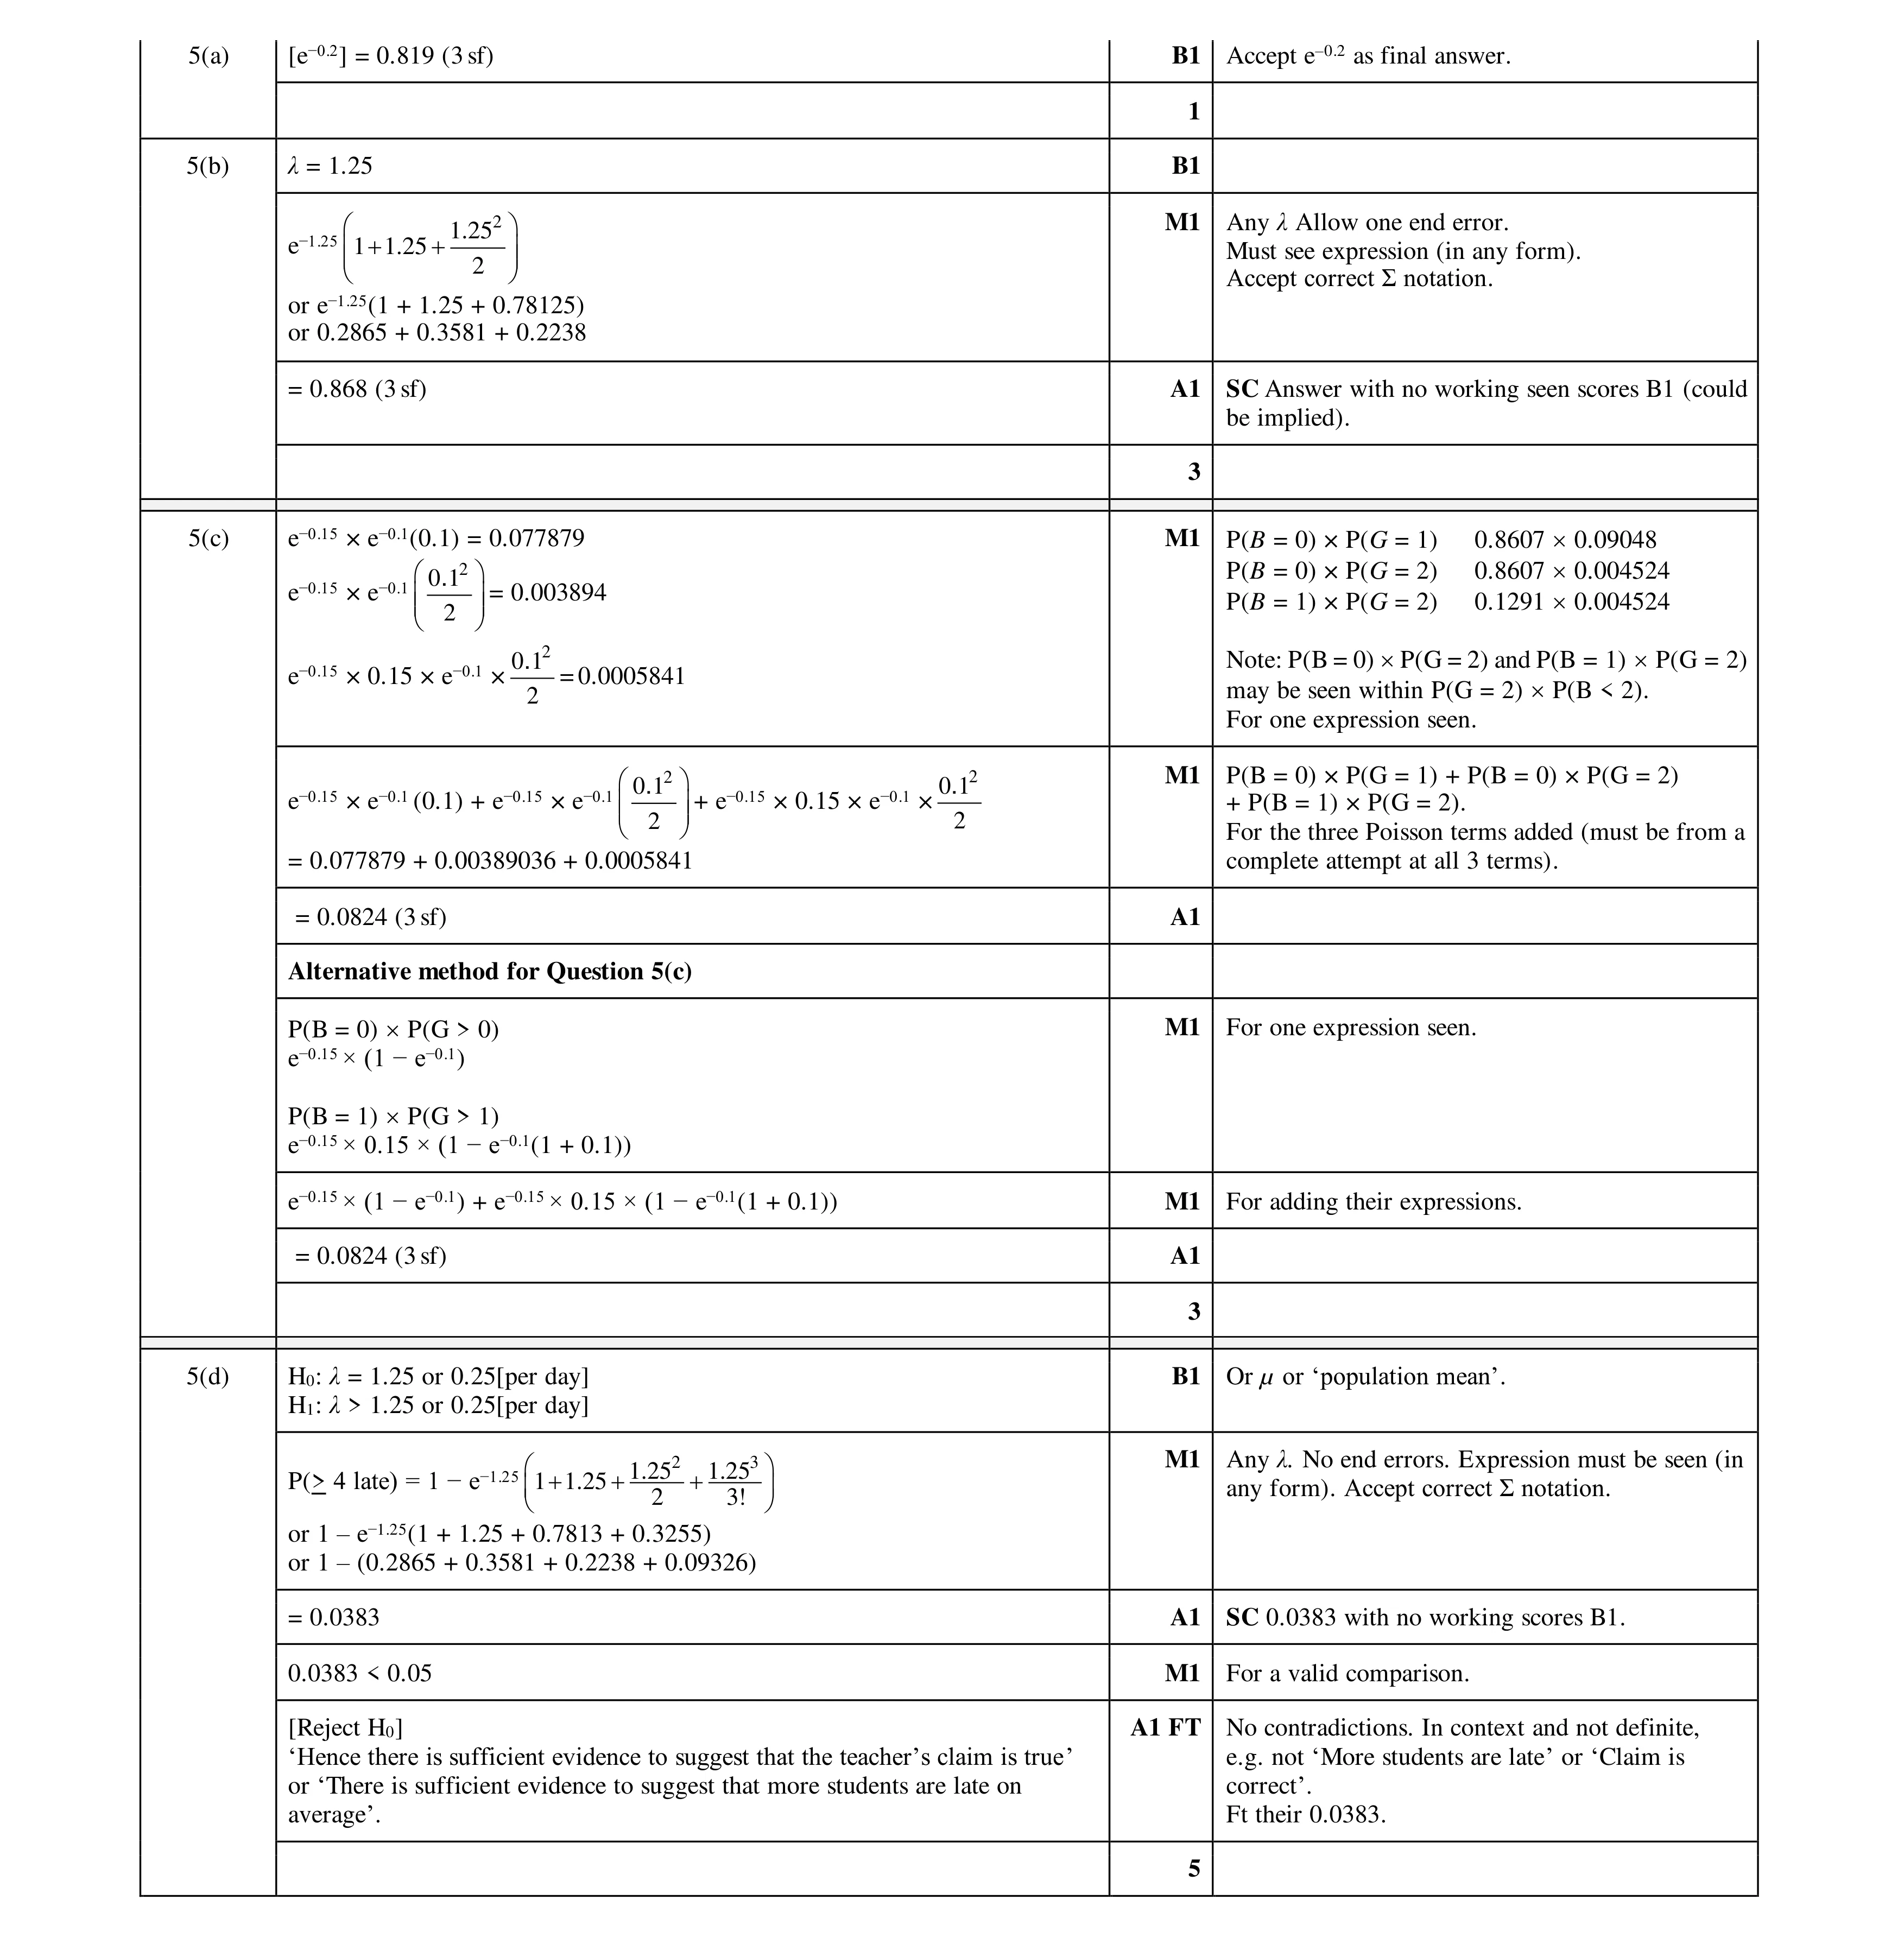 12
12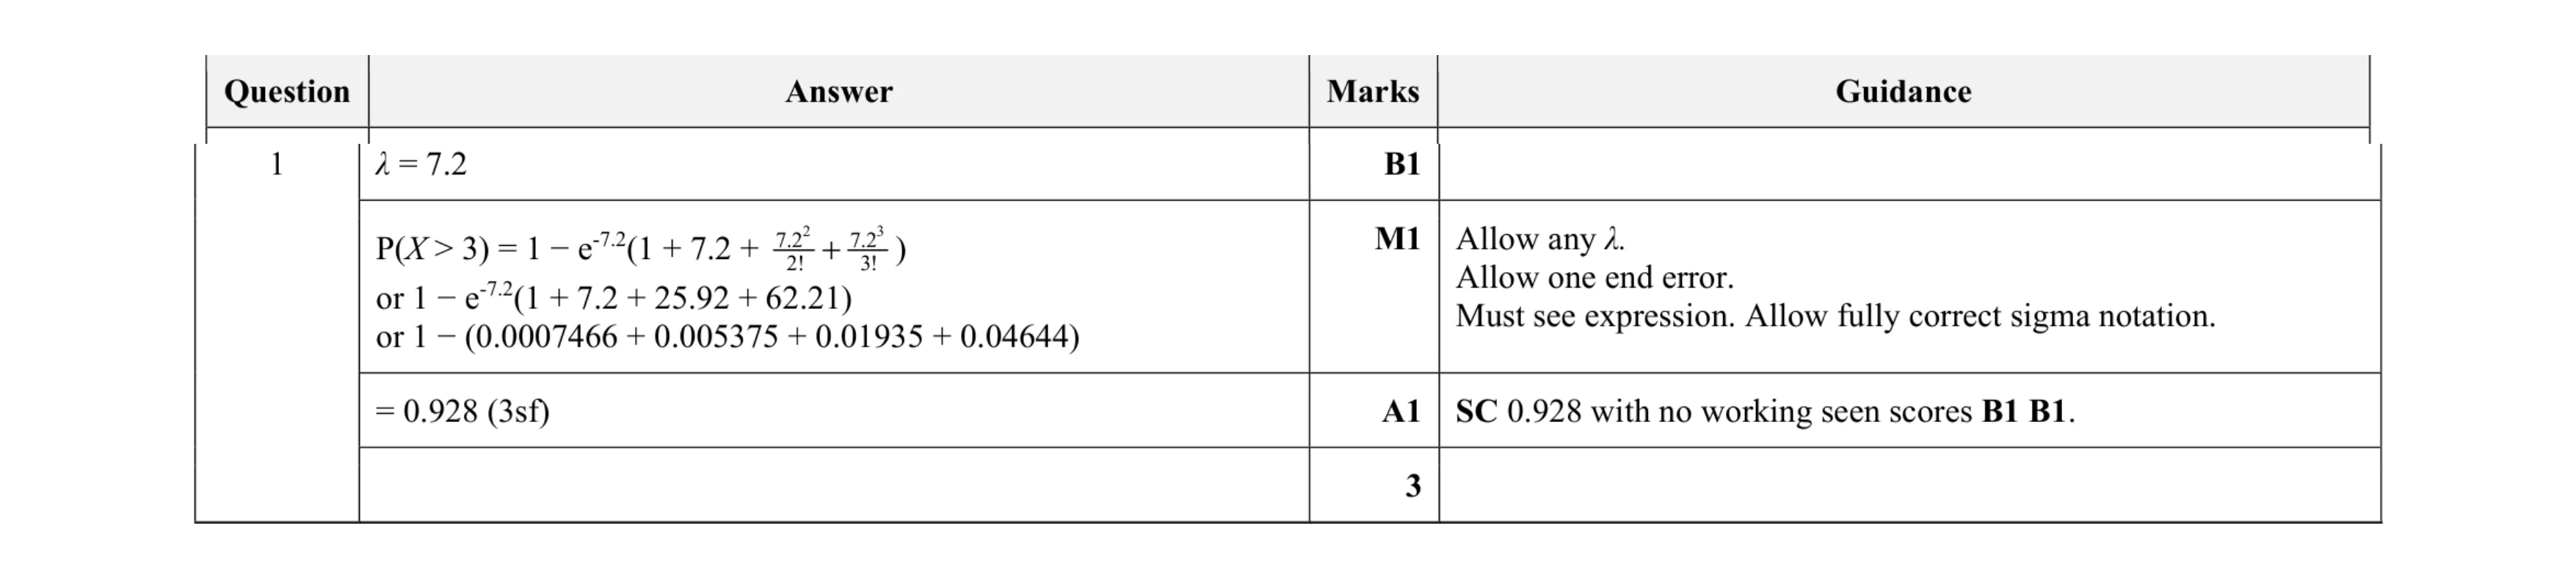 3
3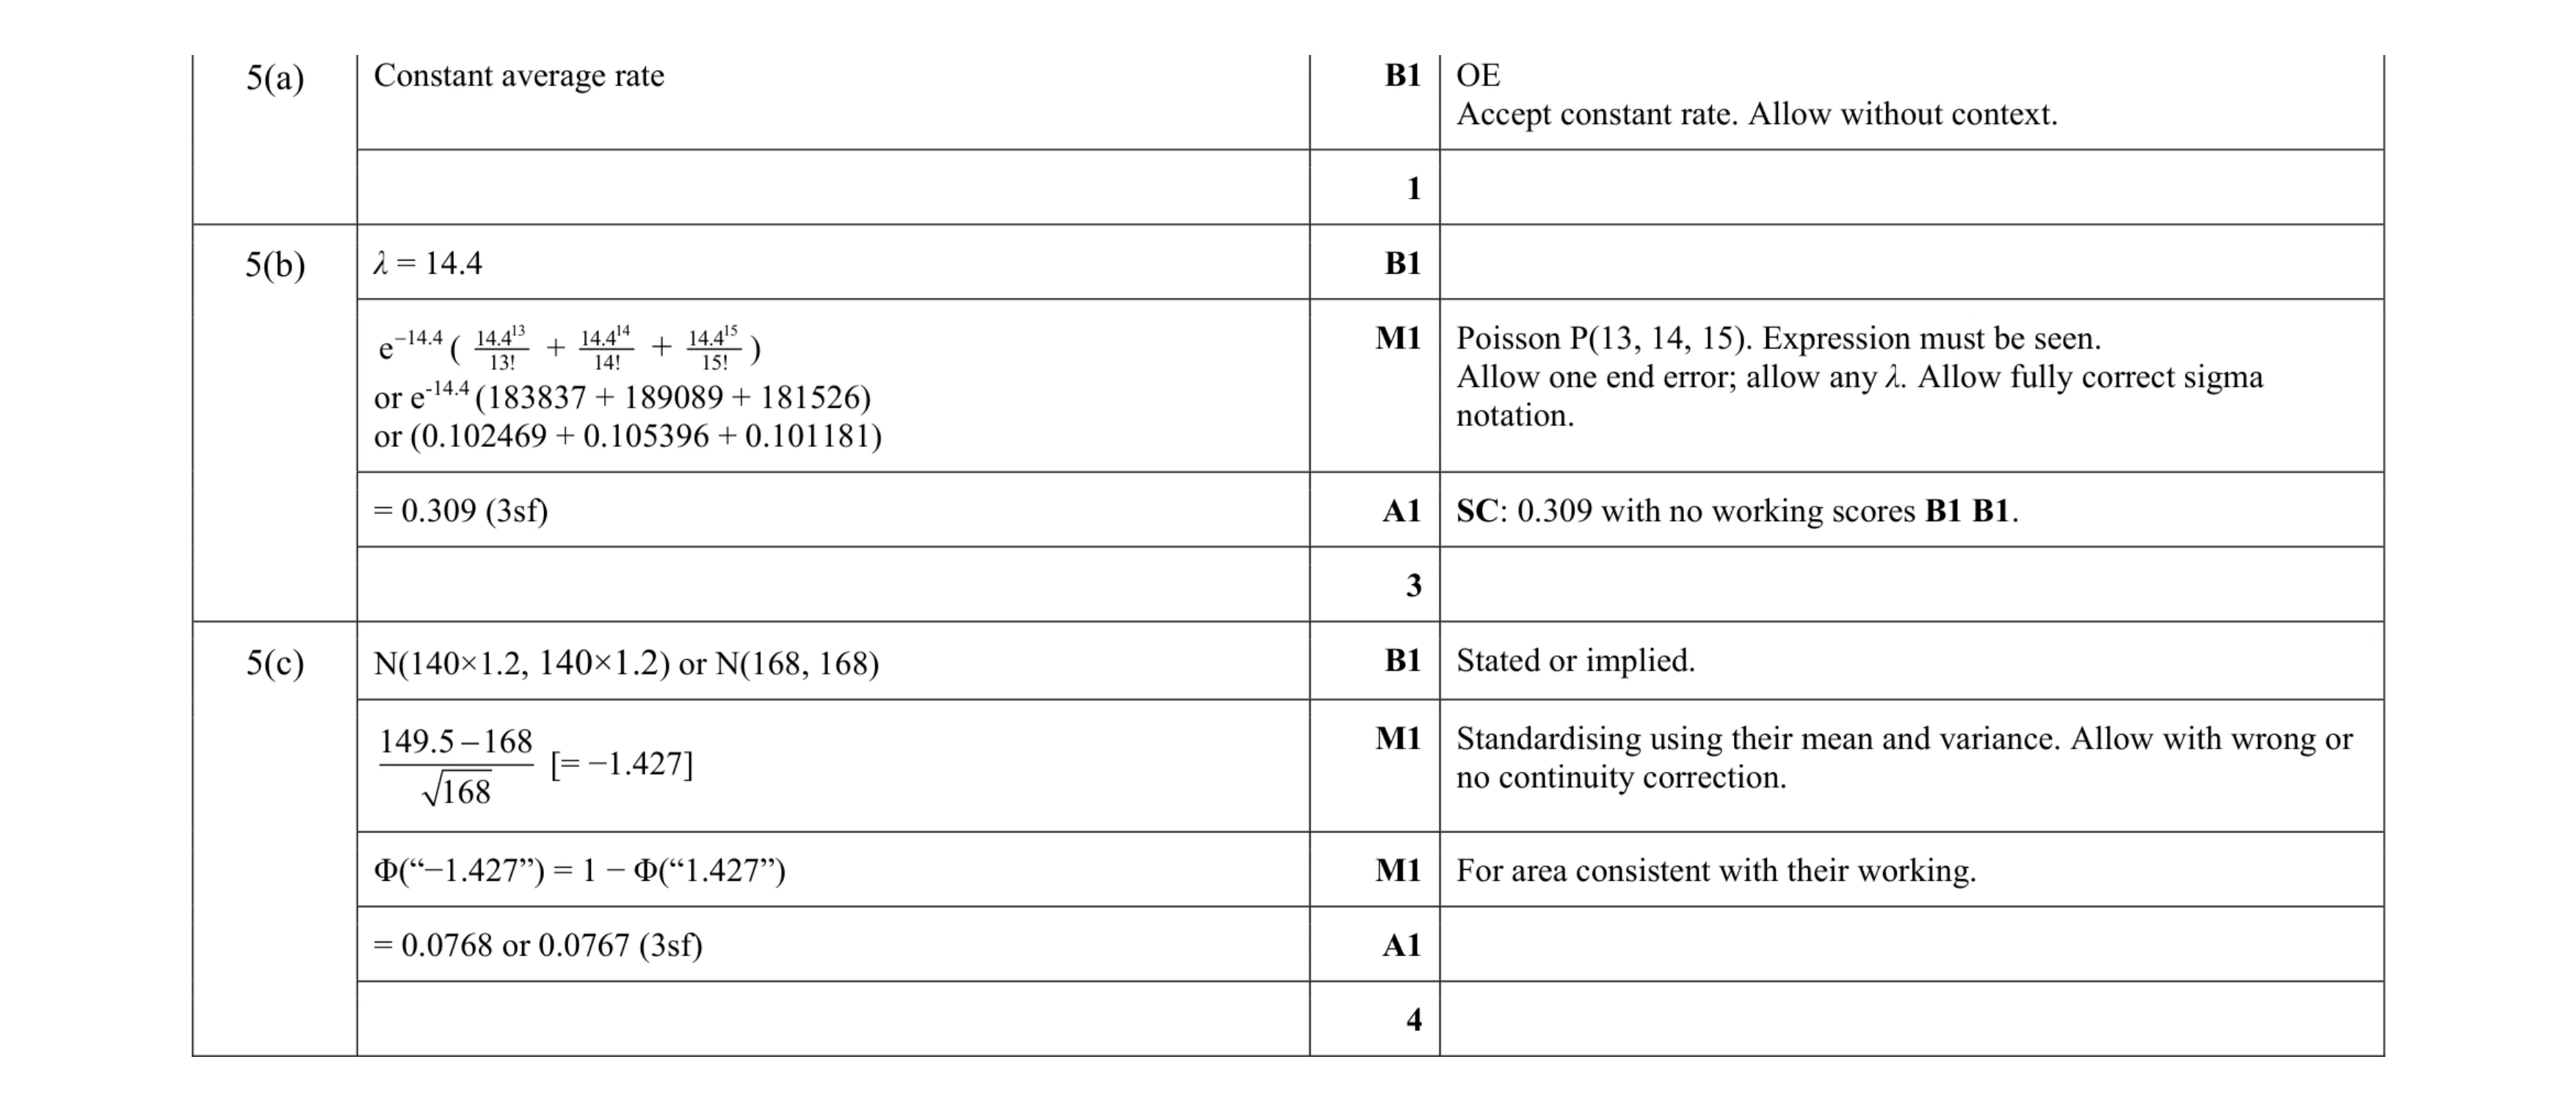 8
8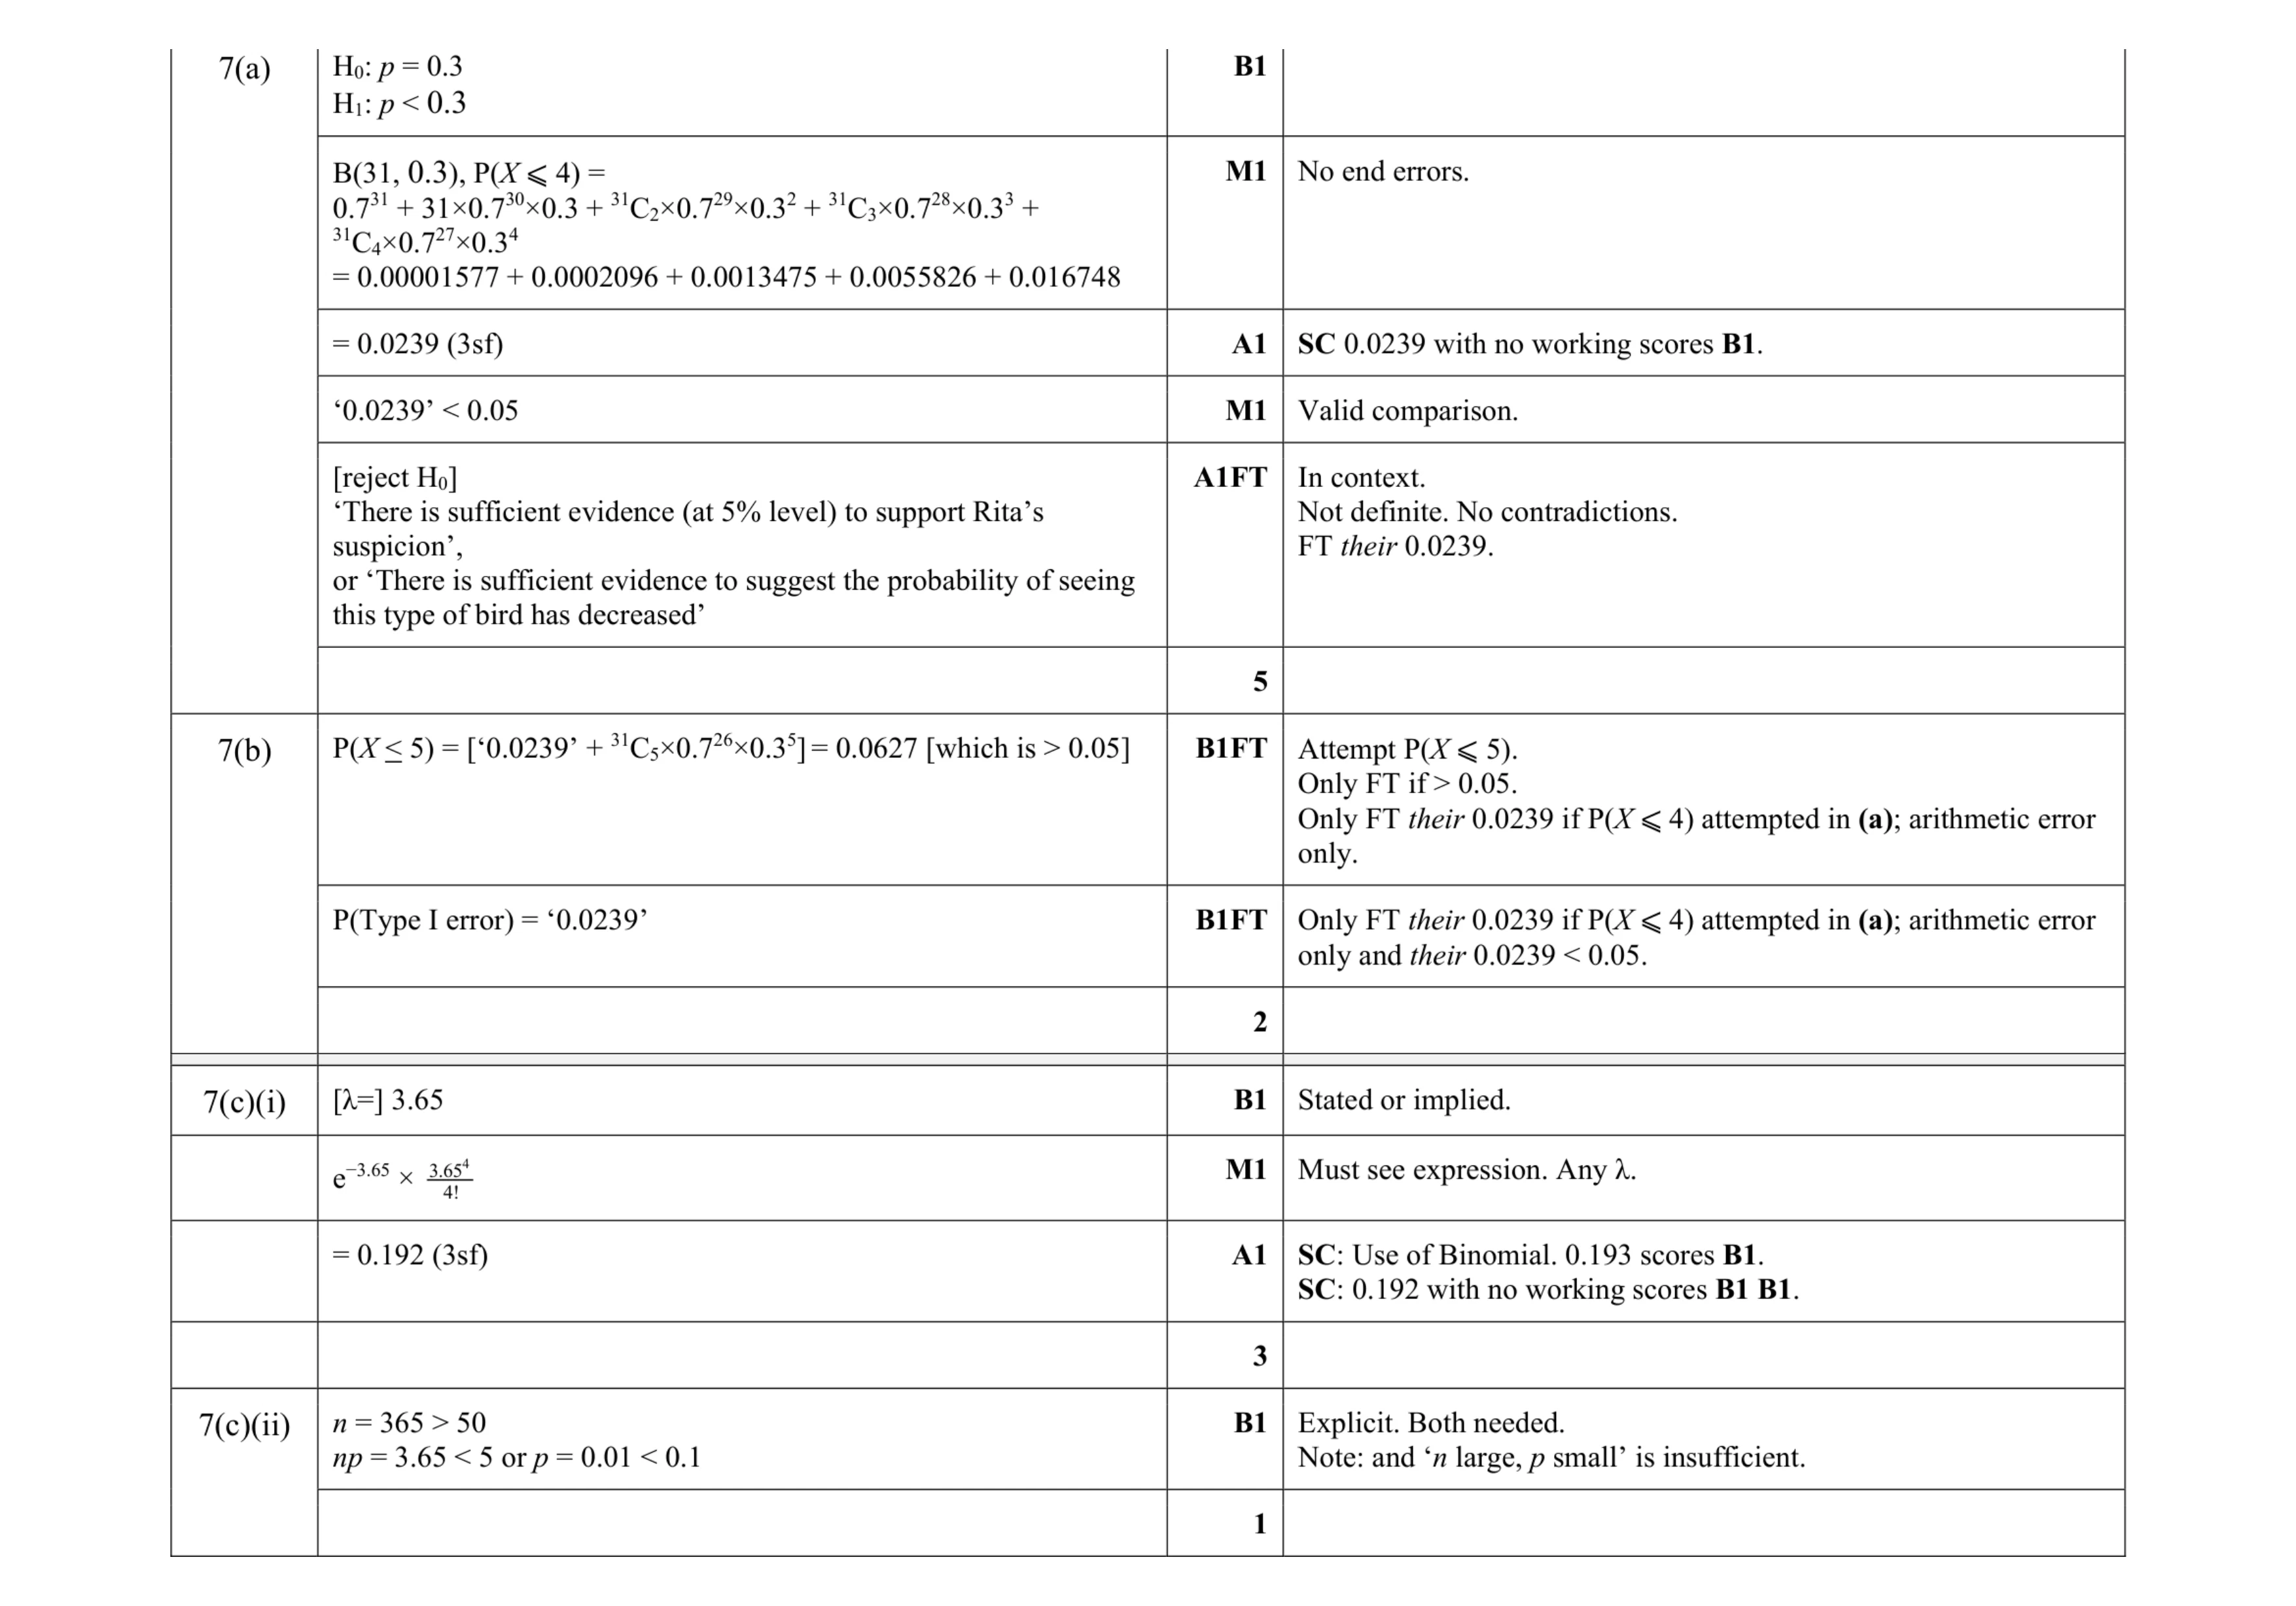 11
11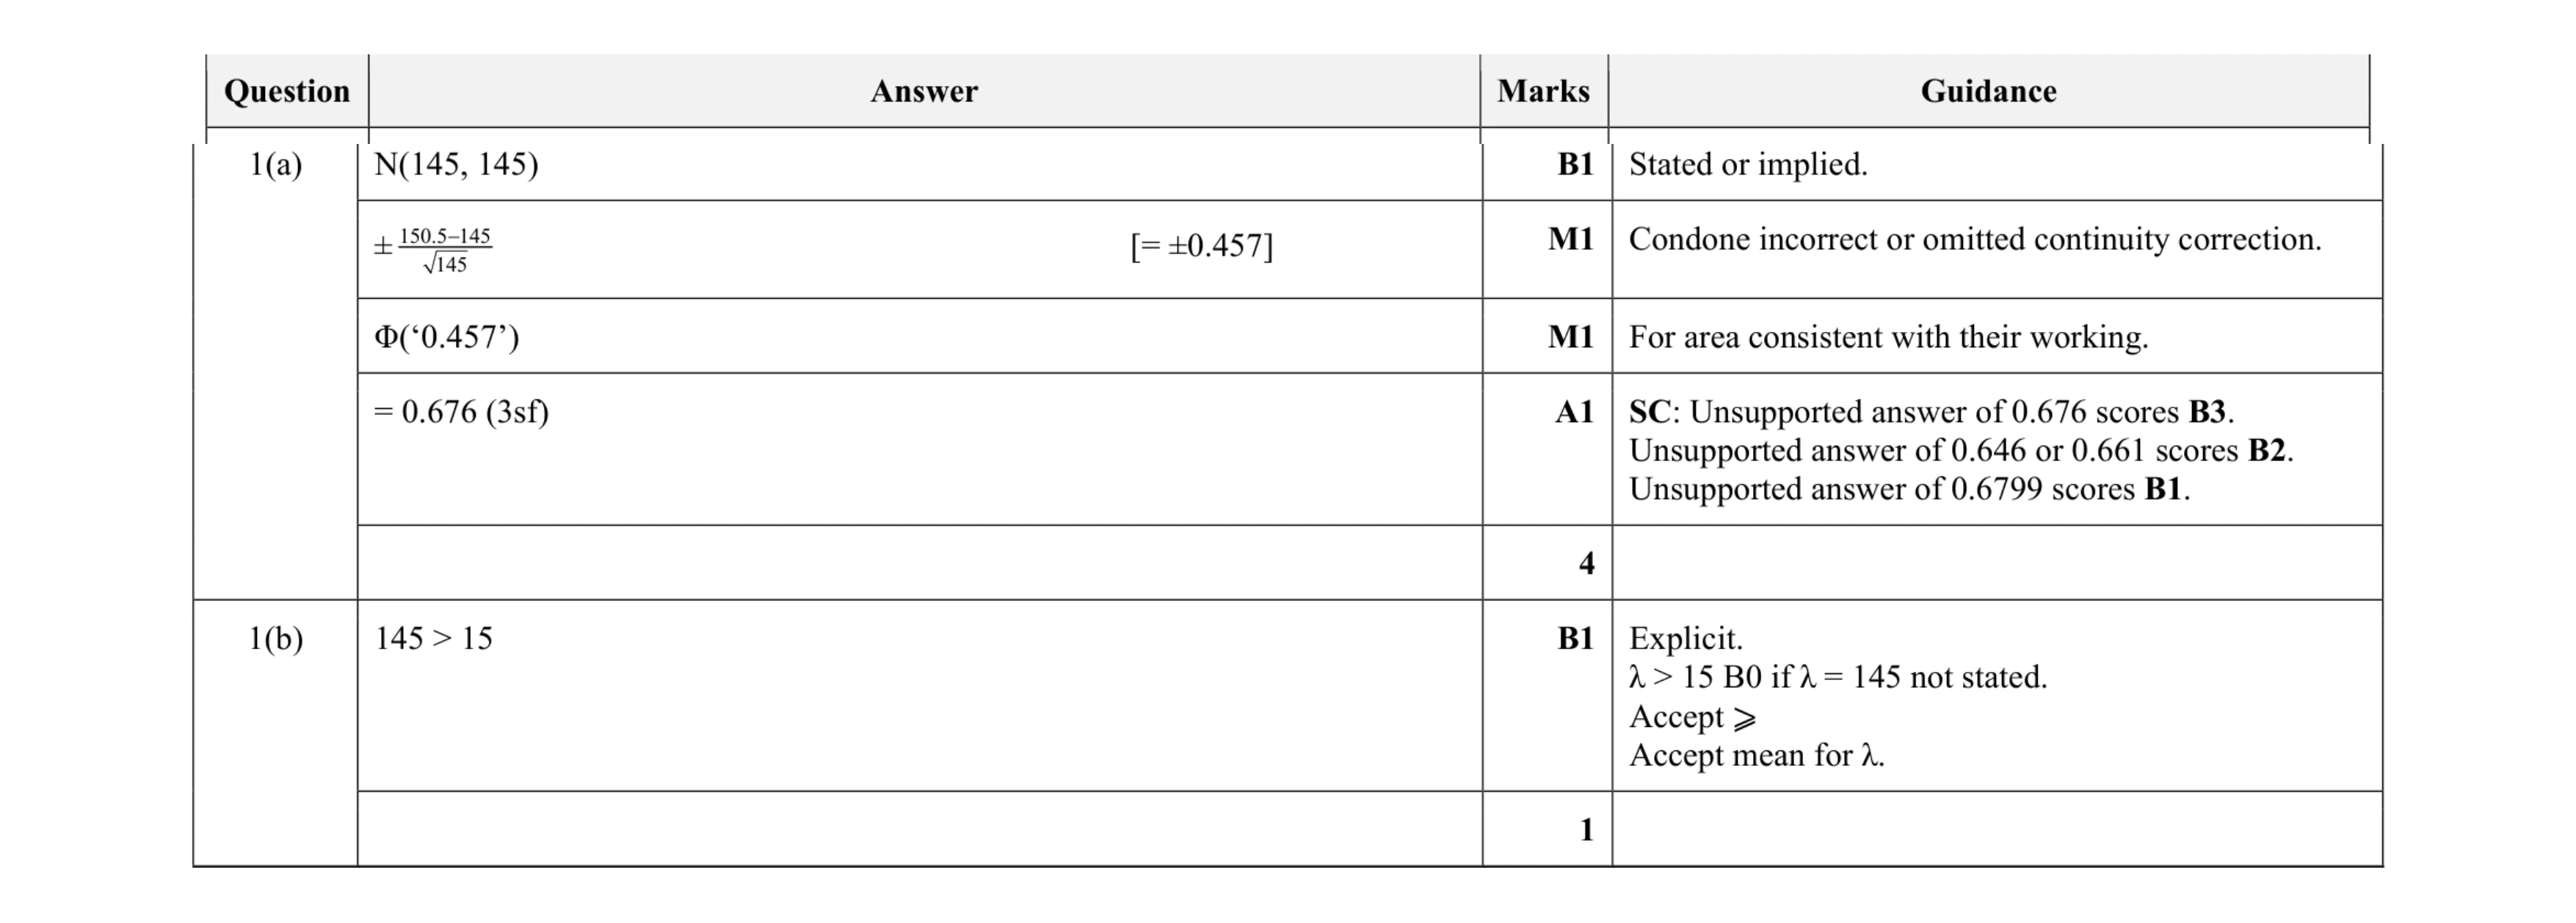 5
5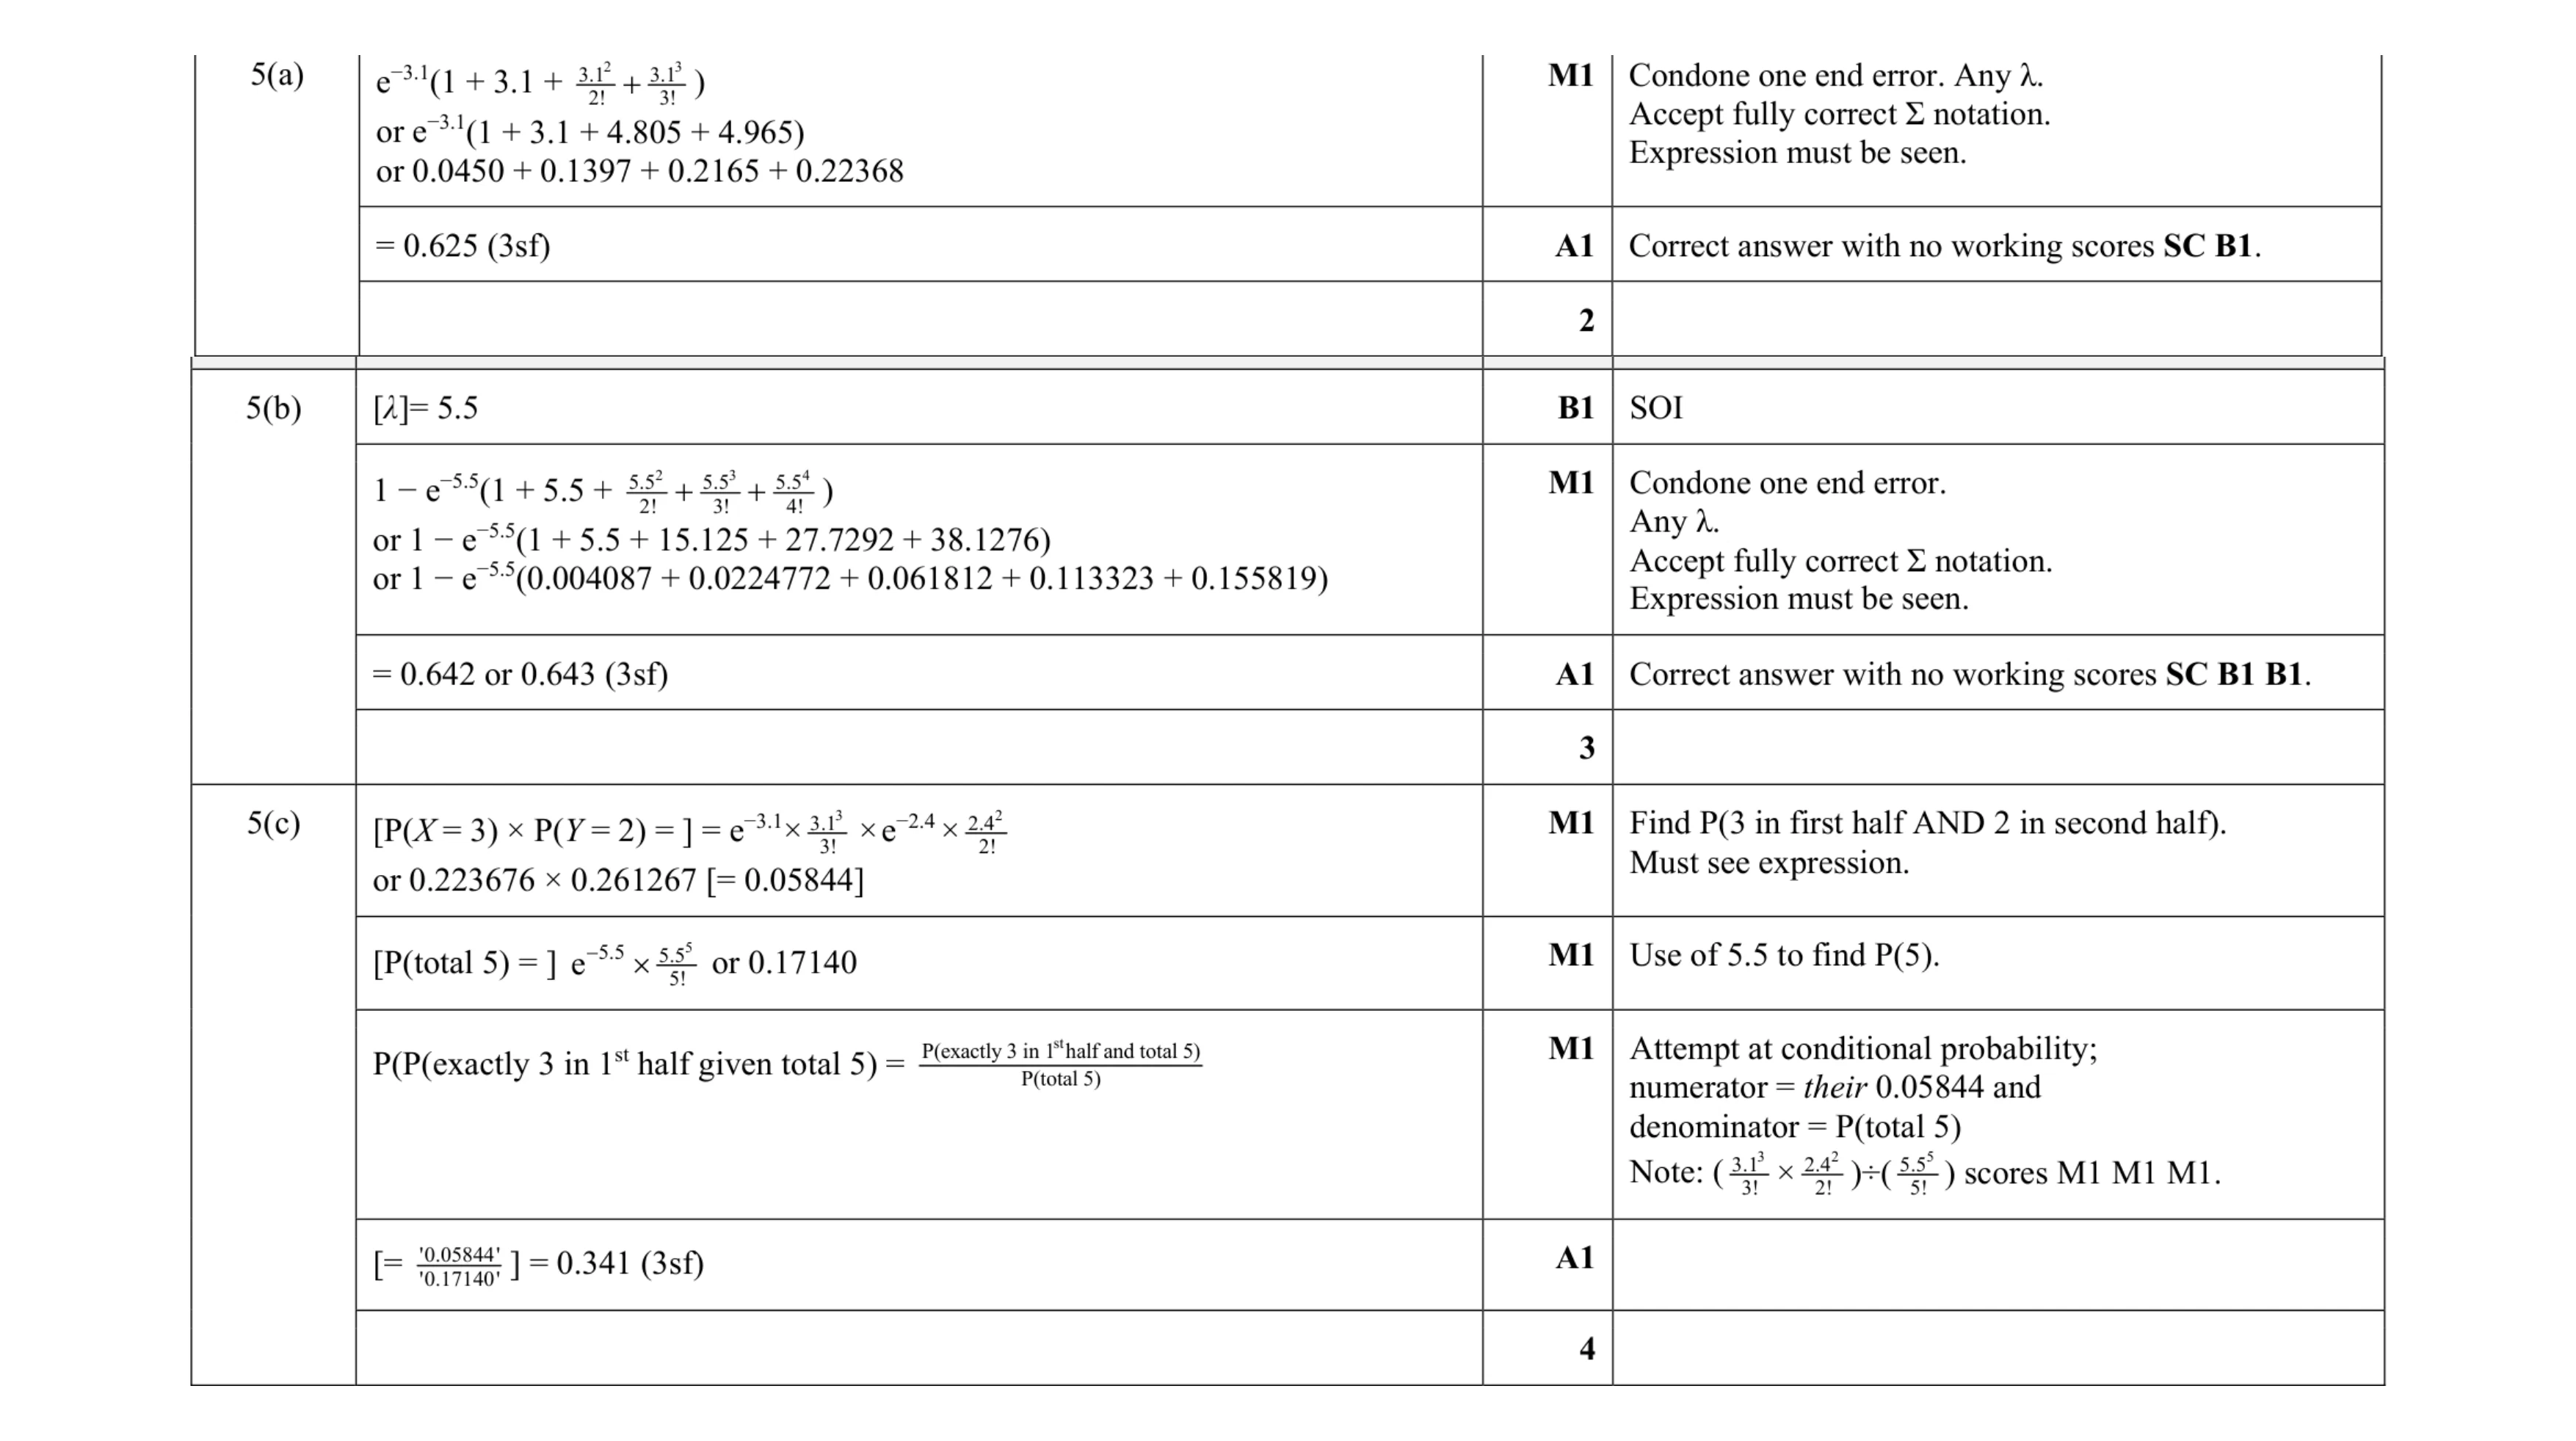 9
9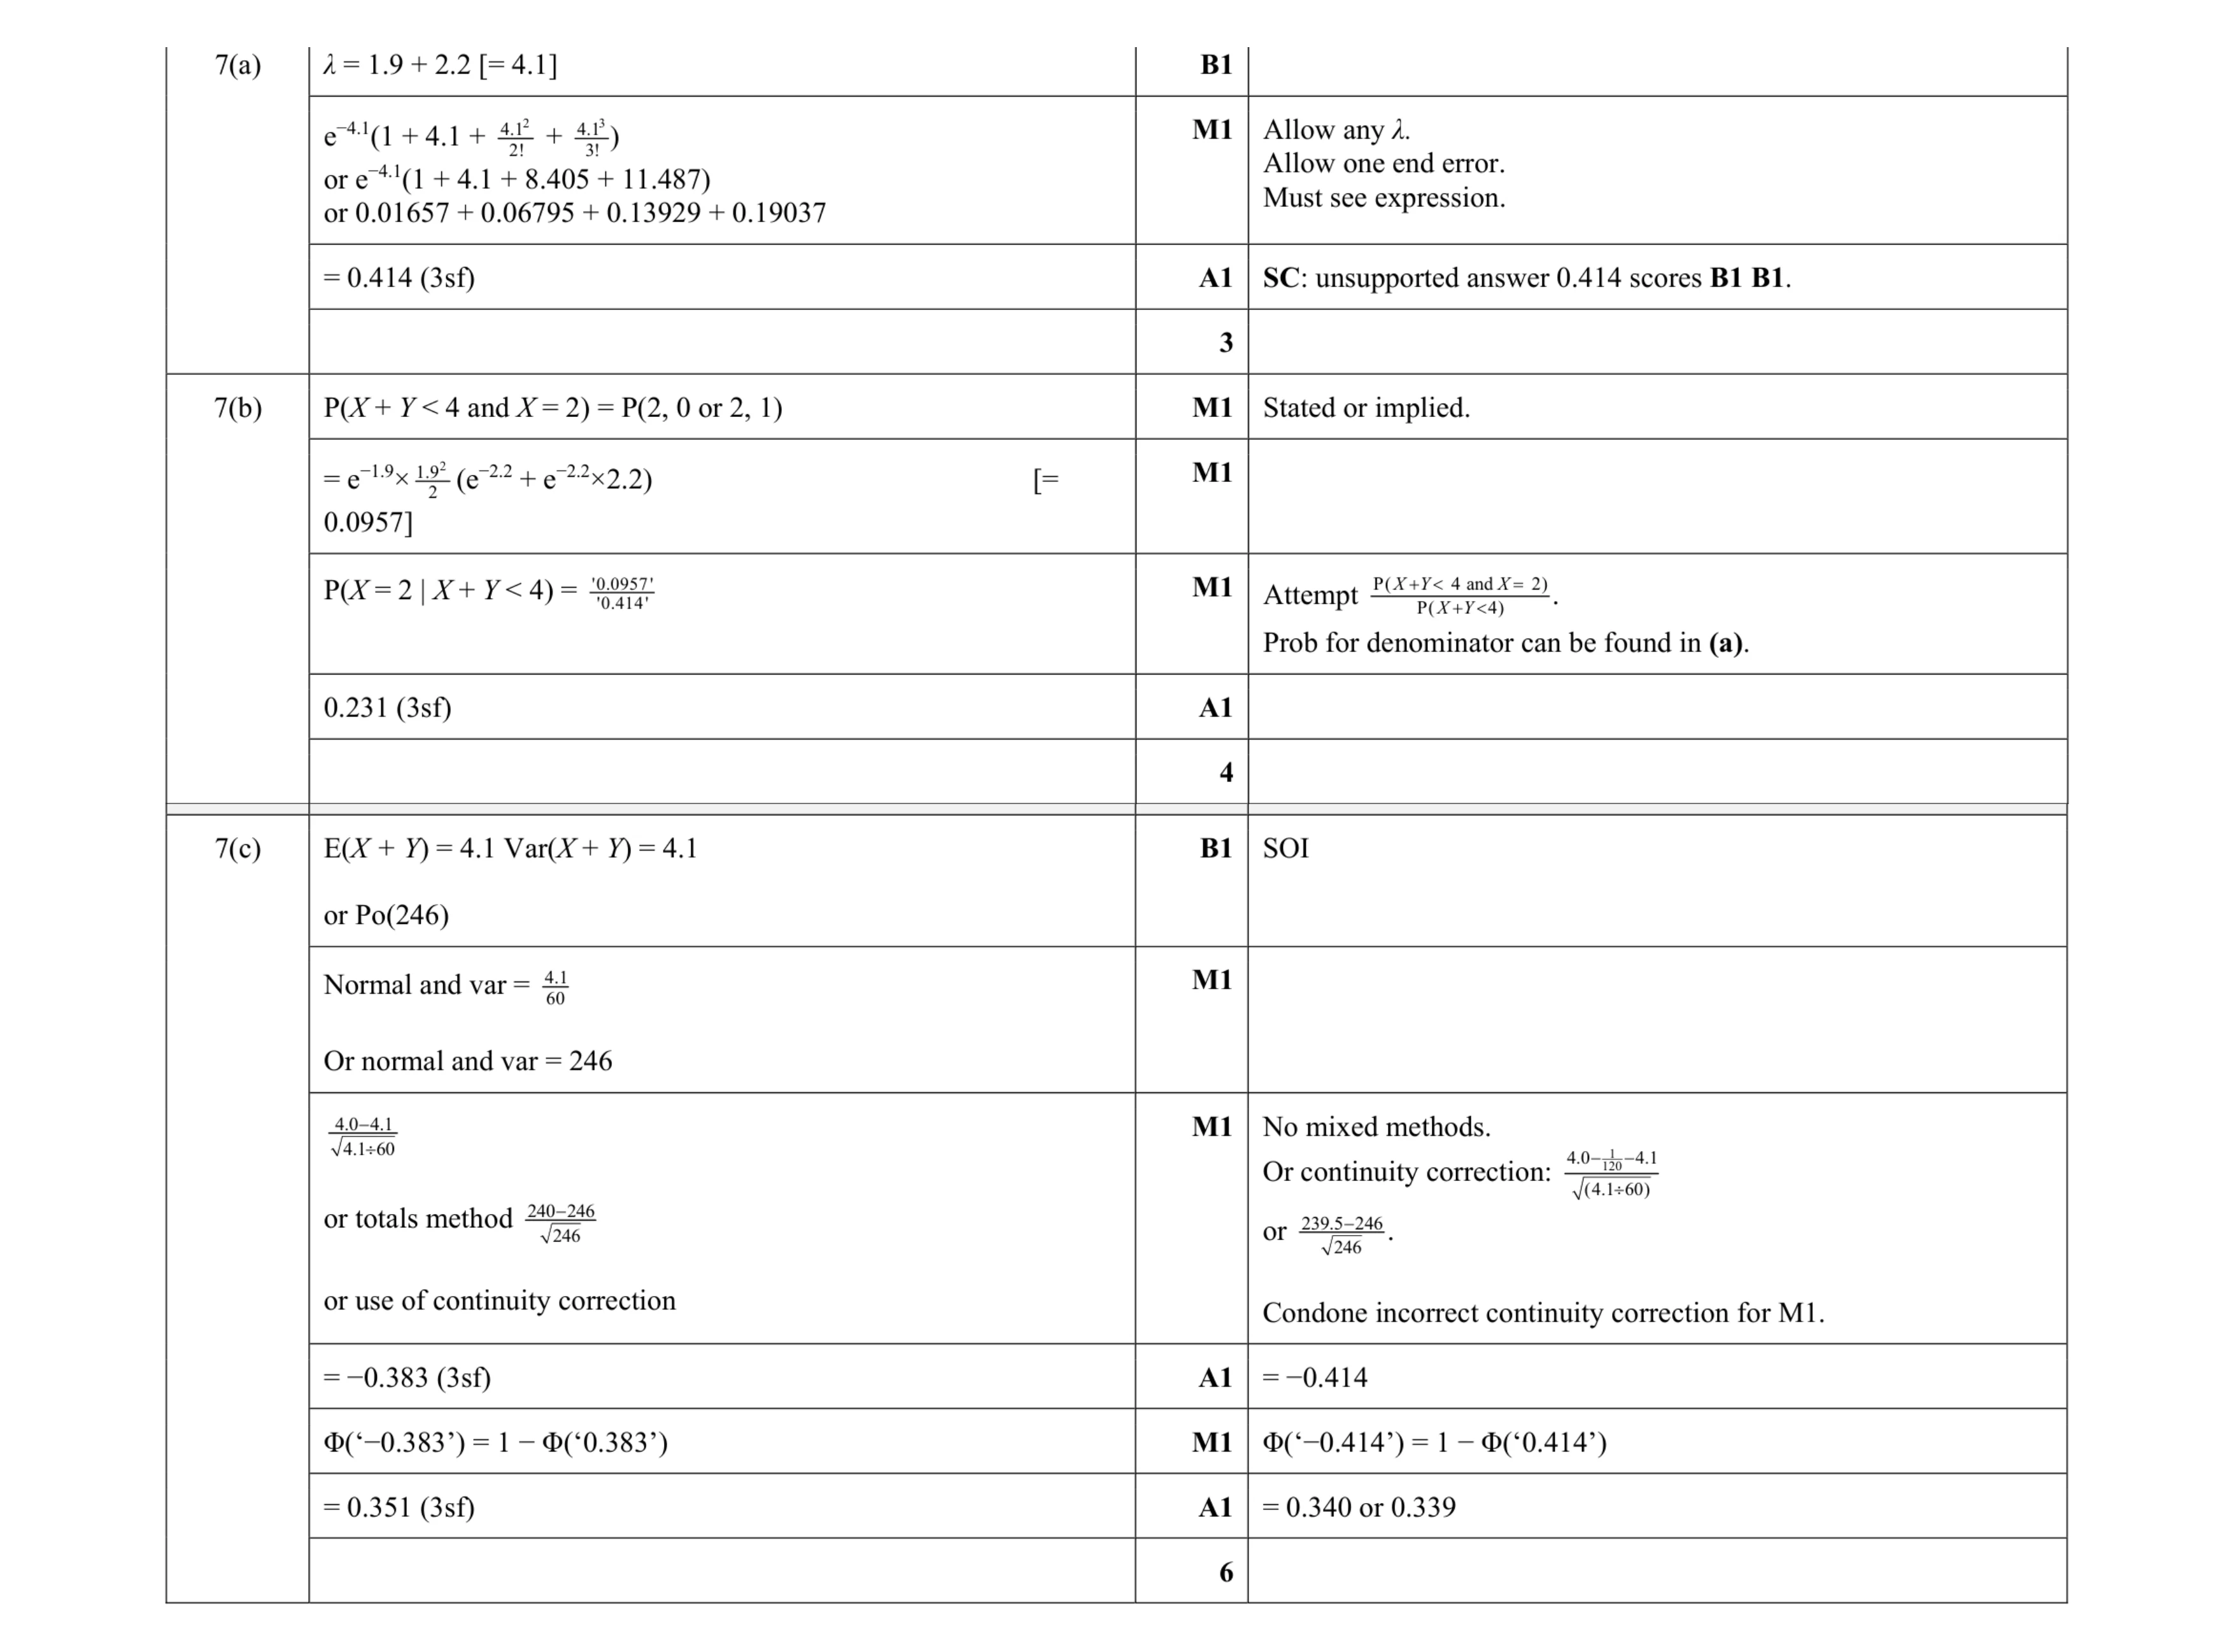 13
13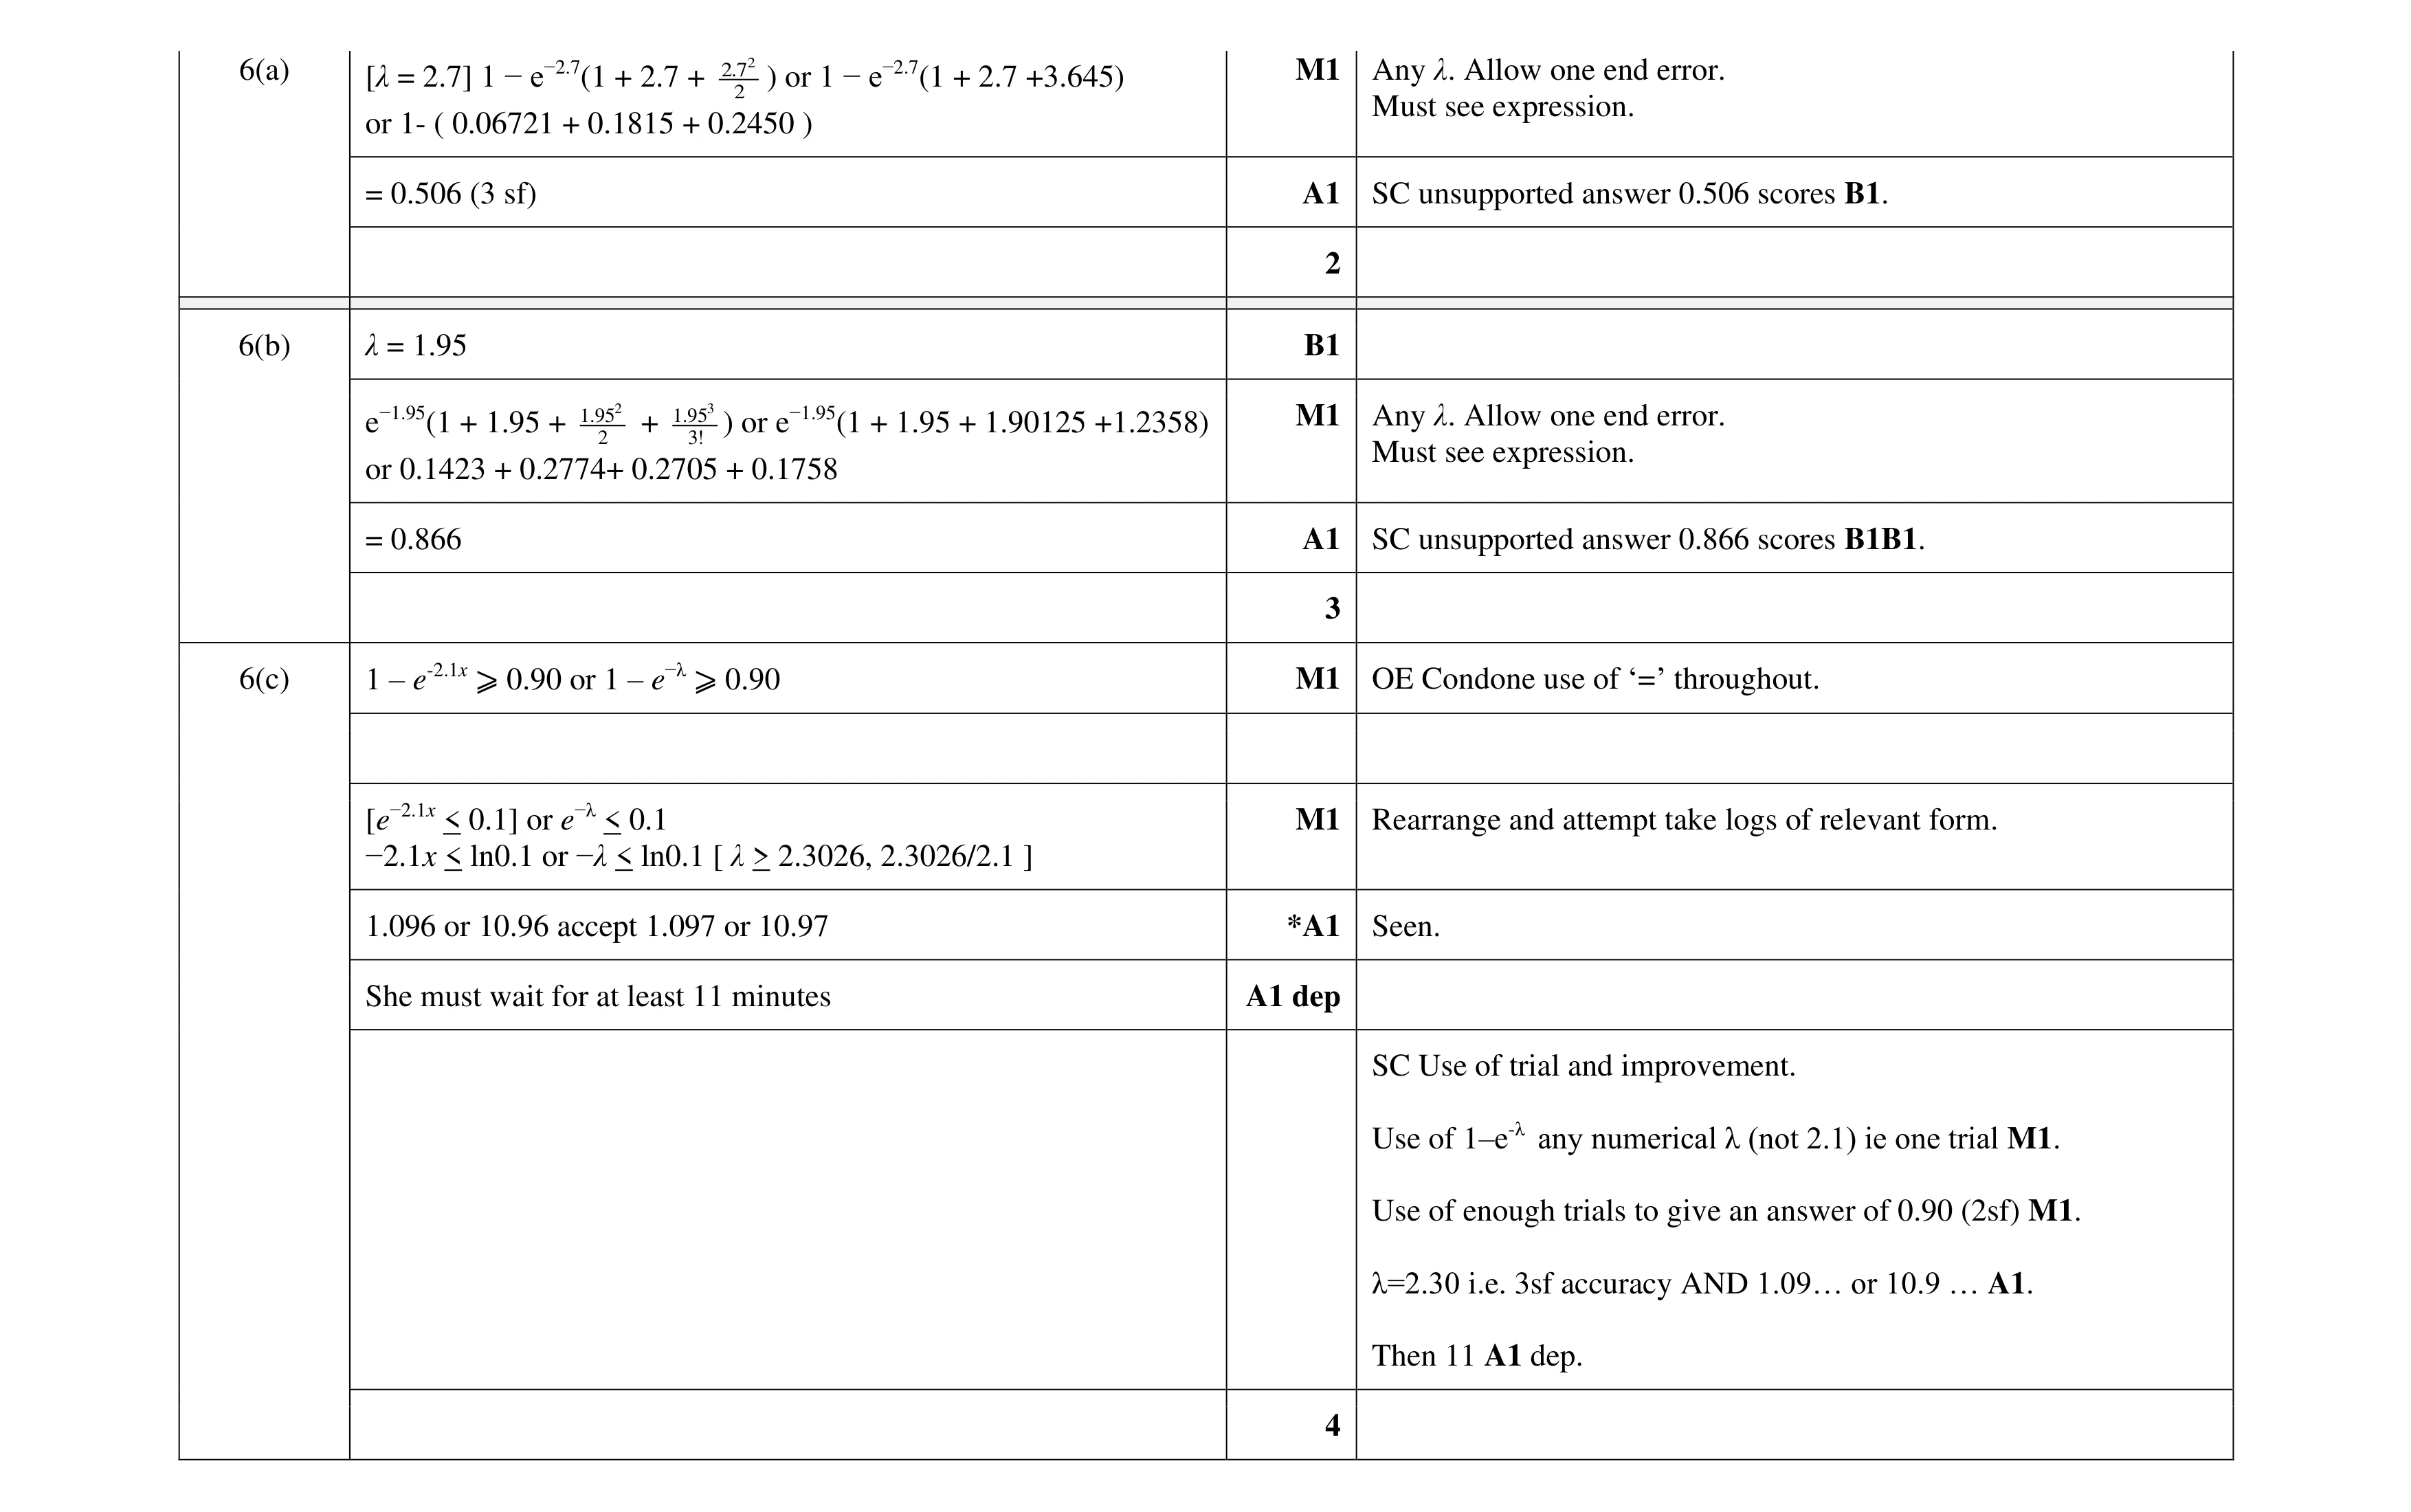 9
9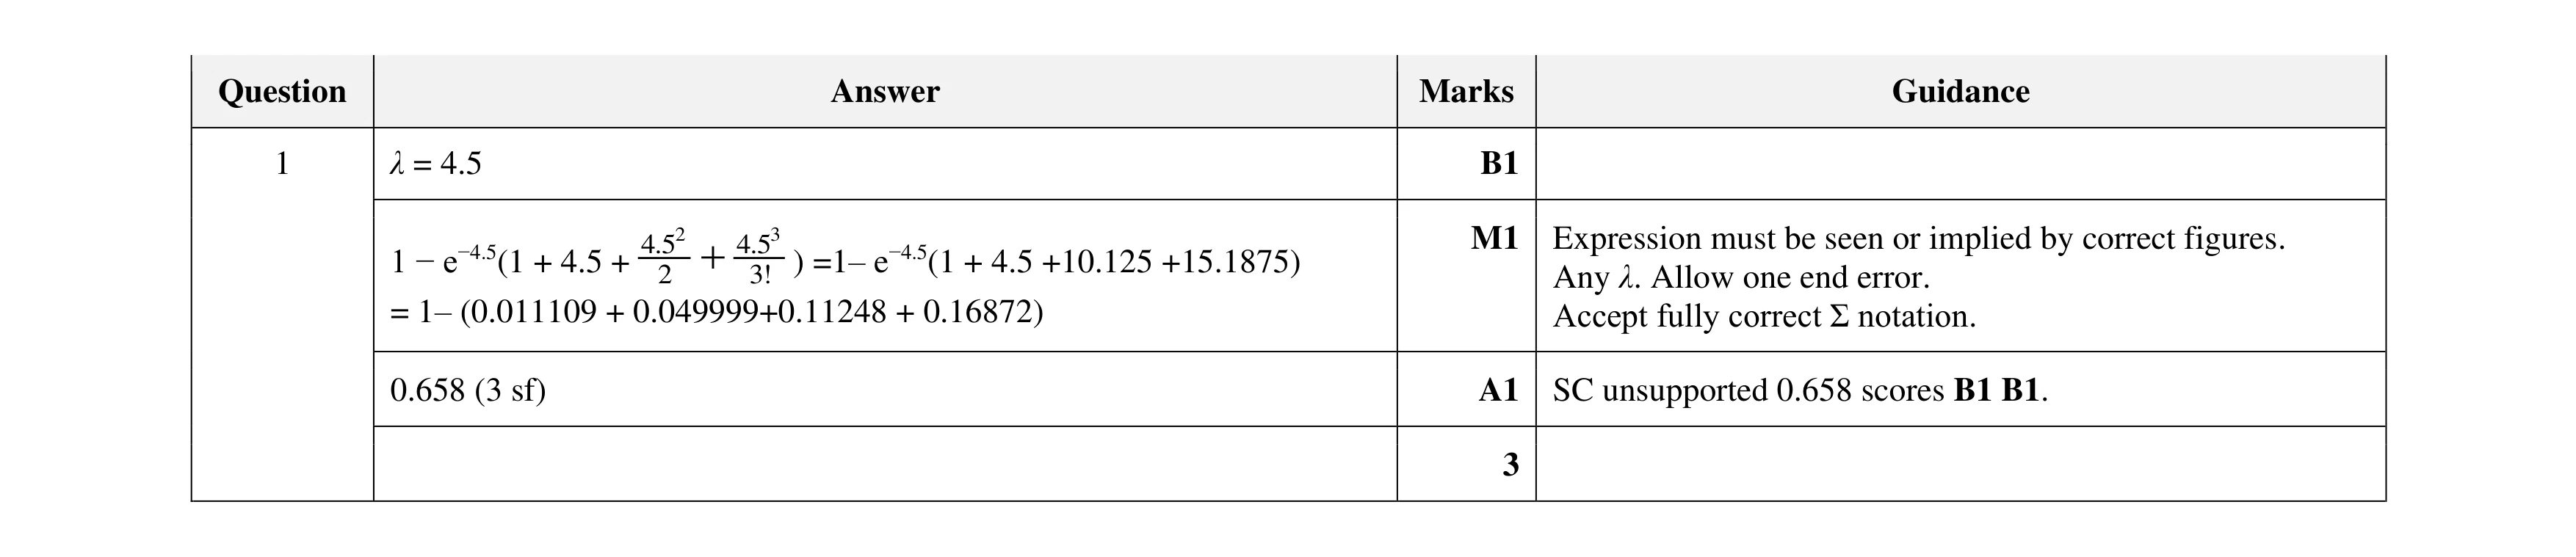 3
3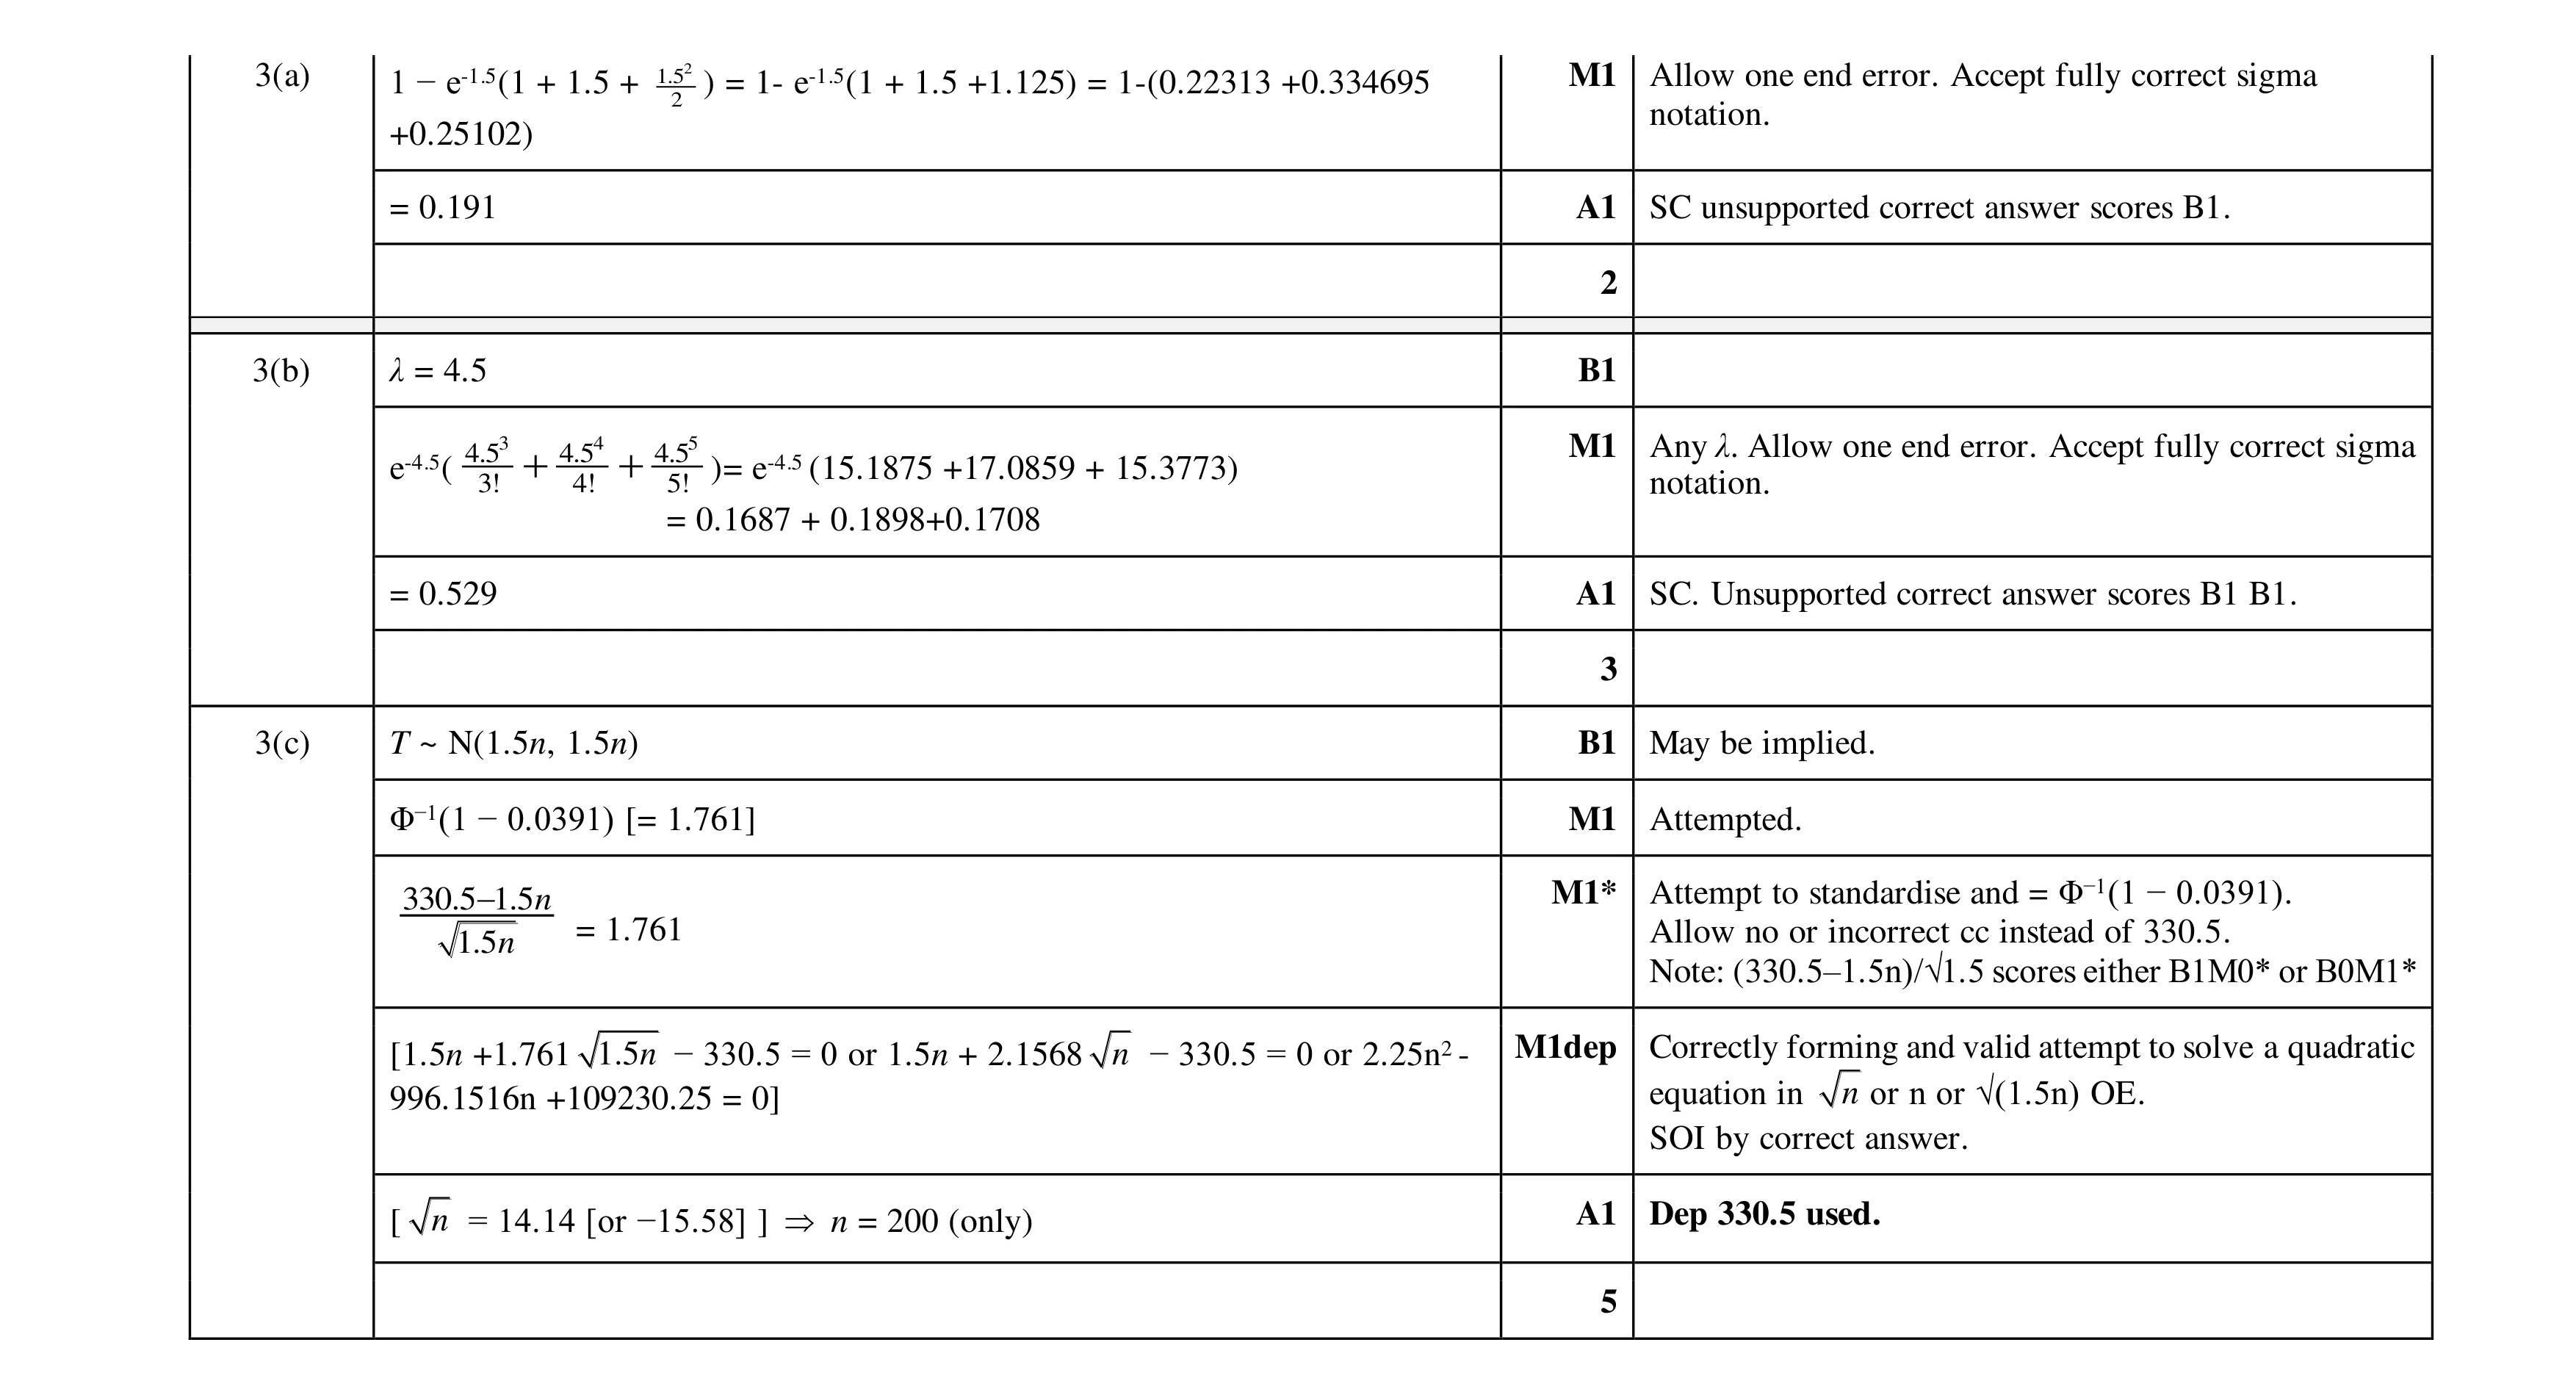 10
10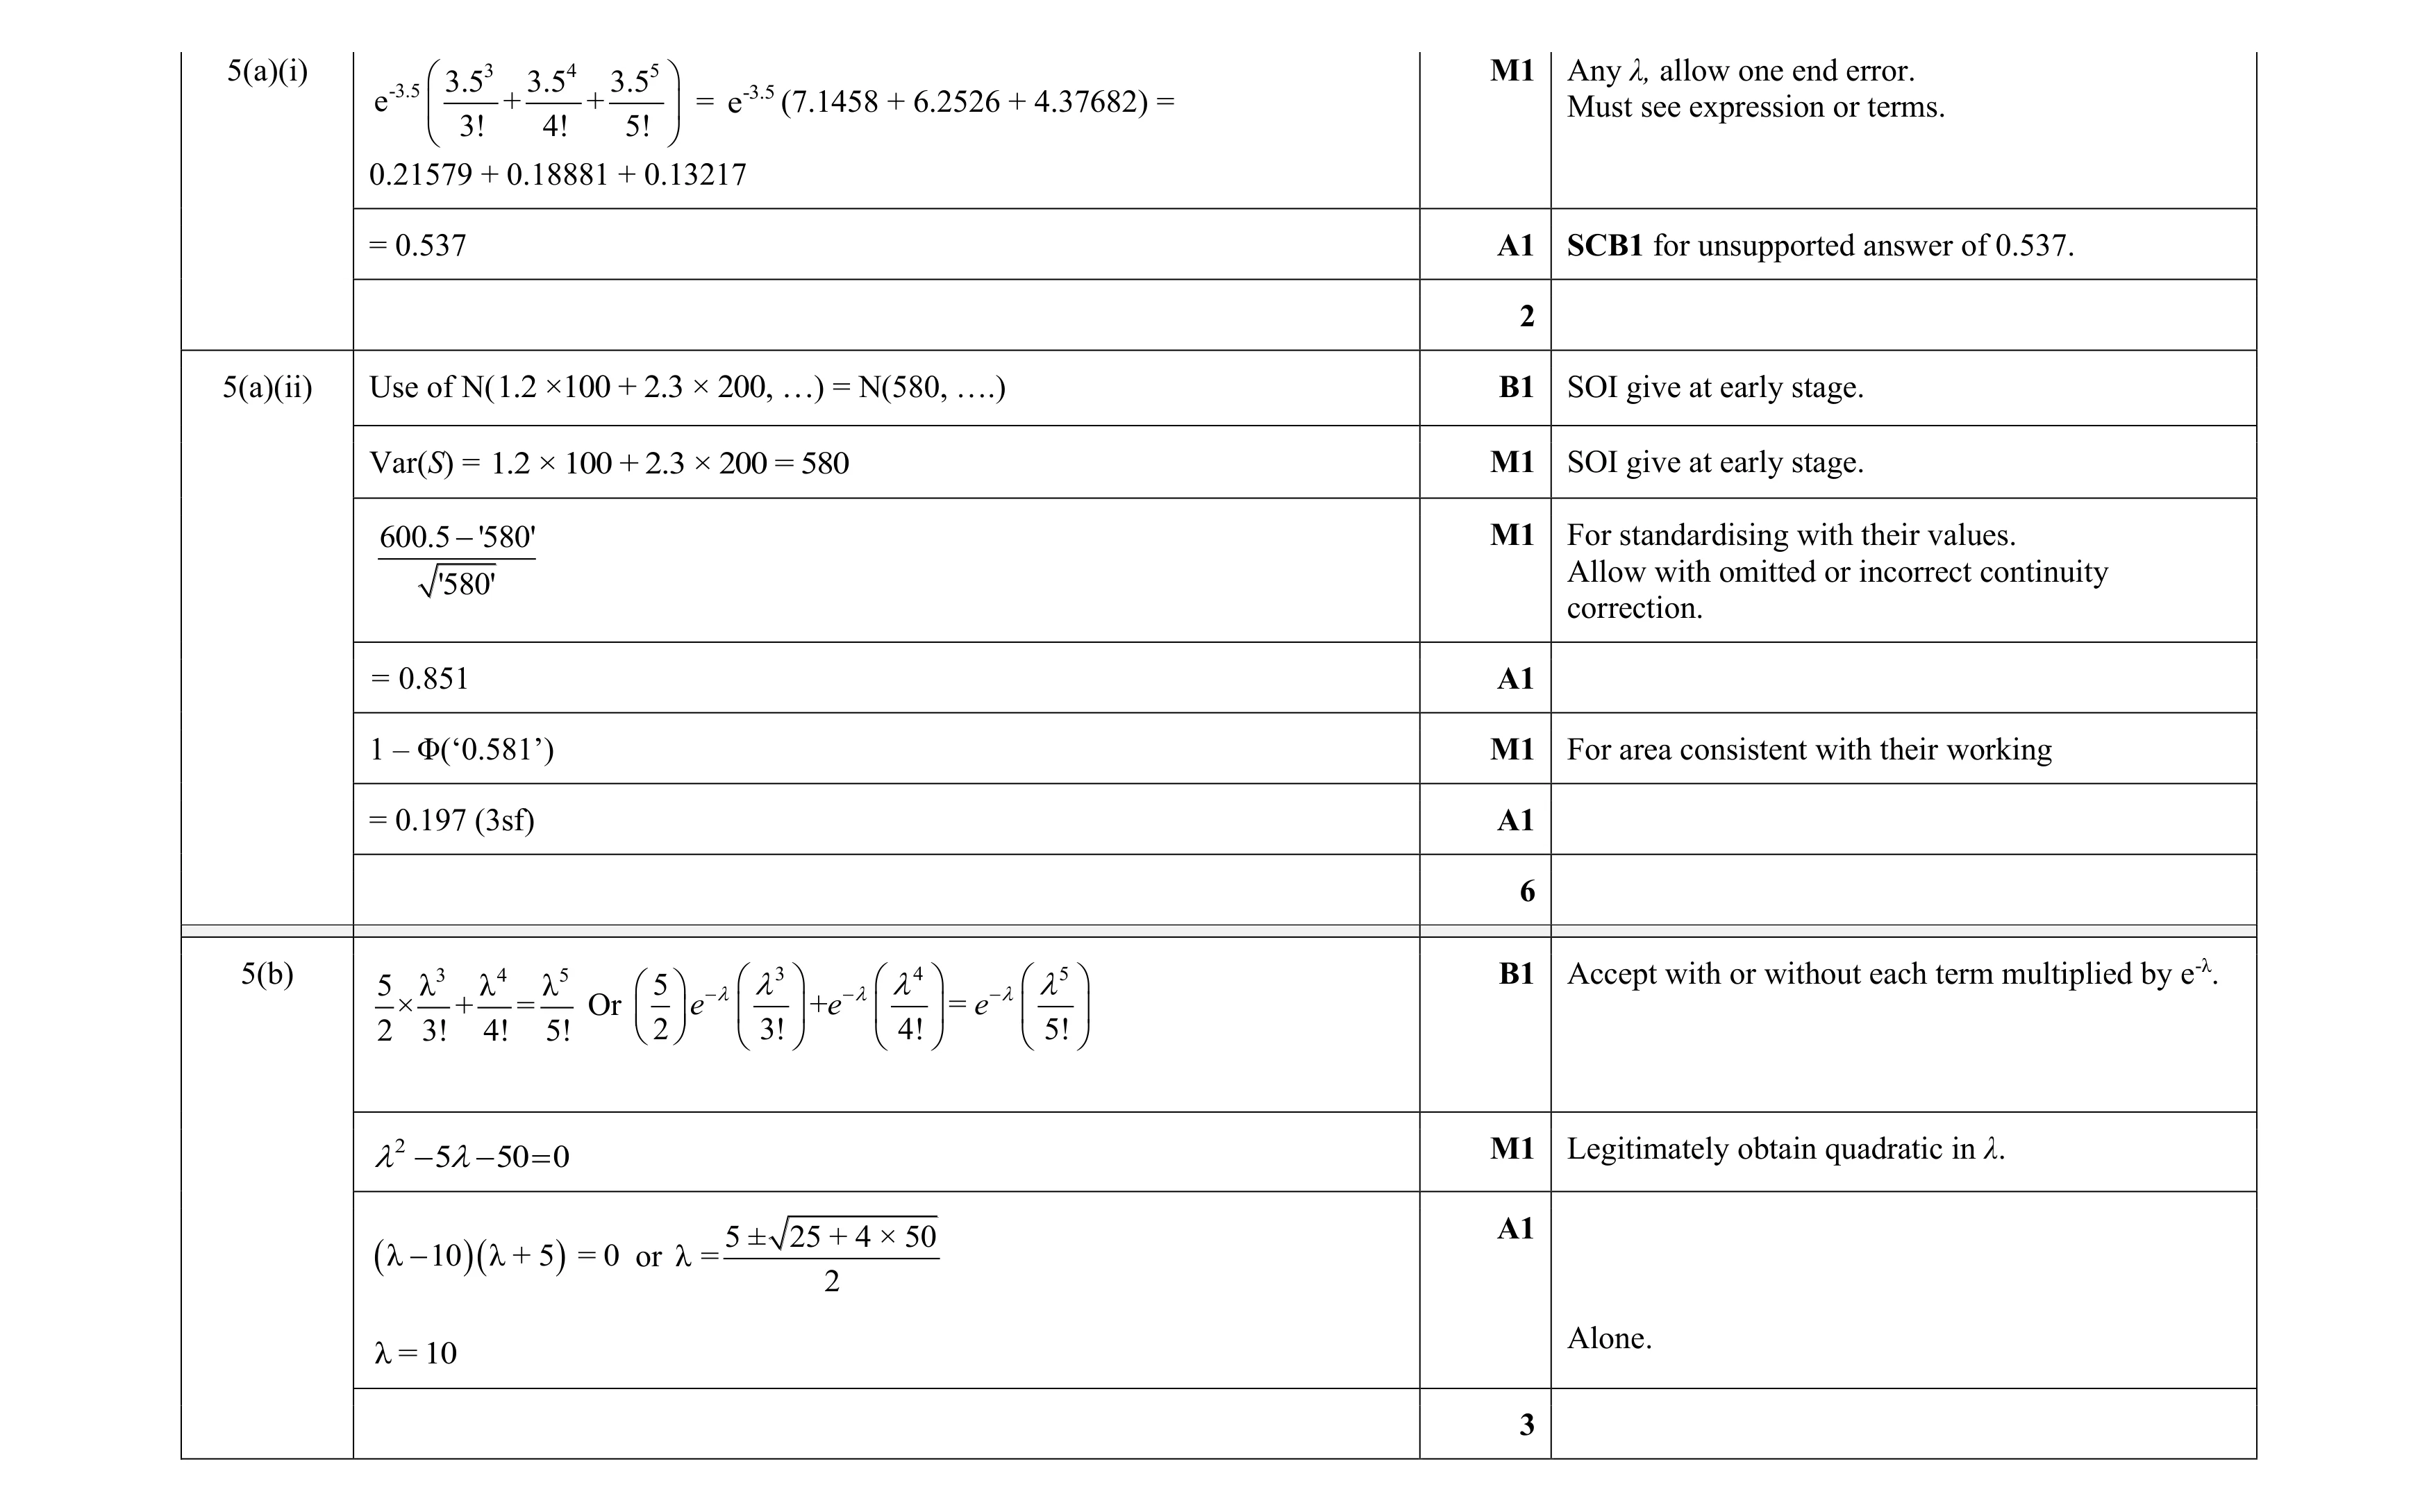 11
11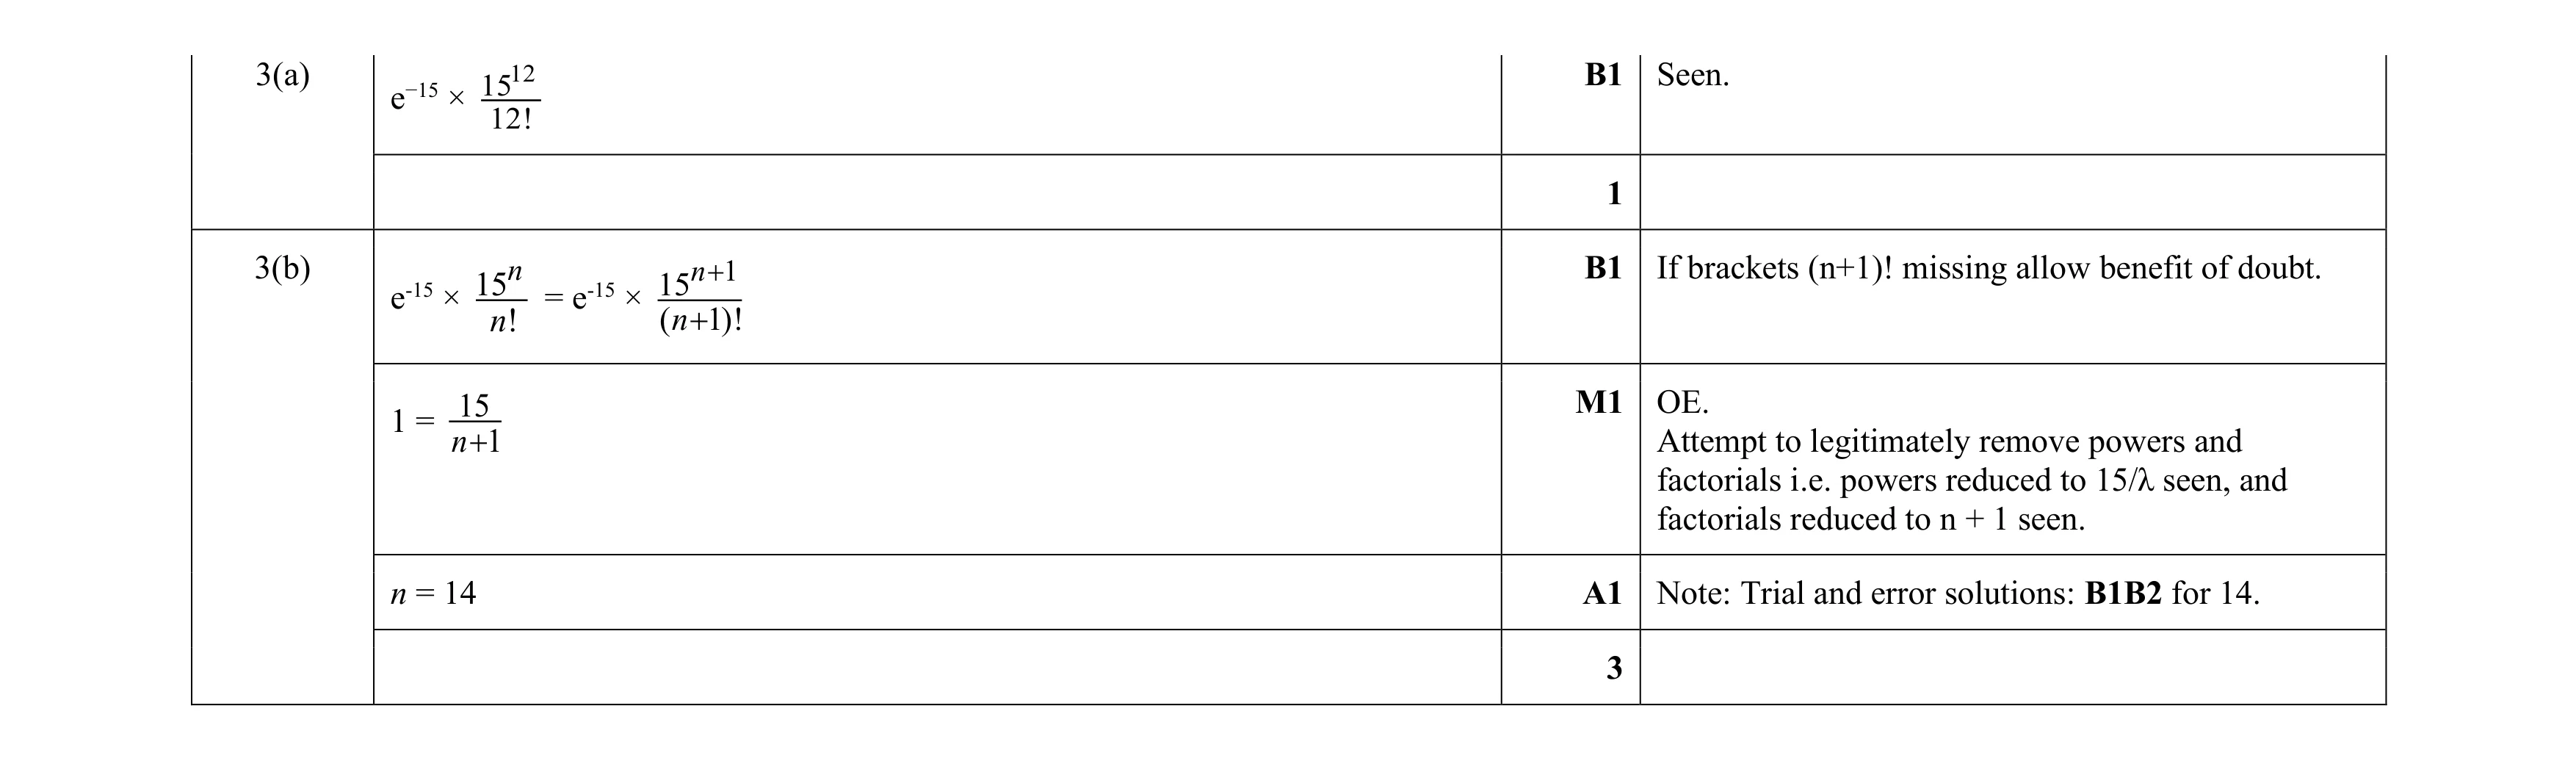 4
4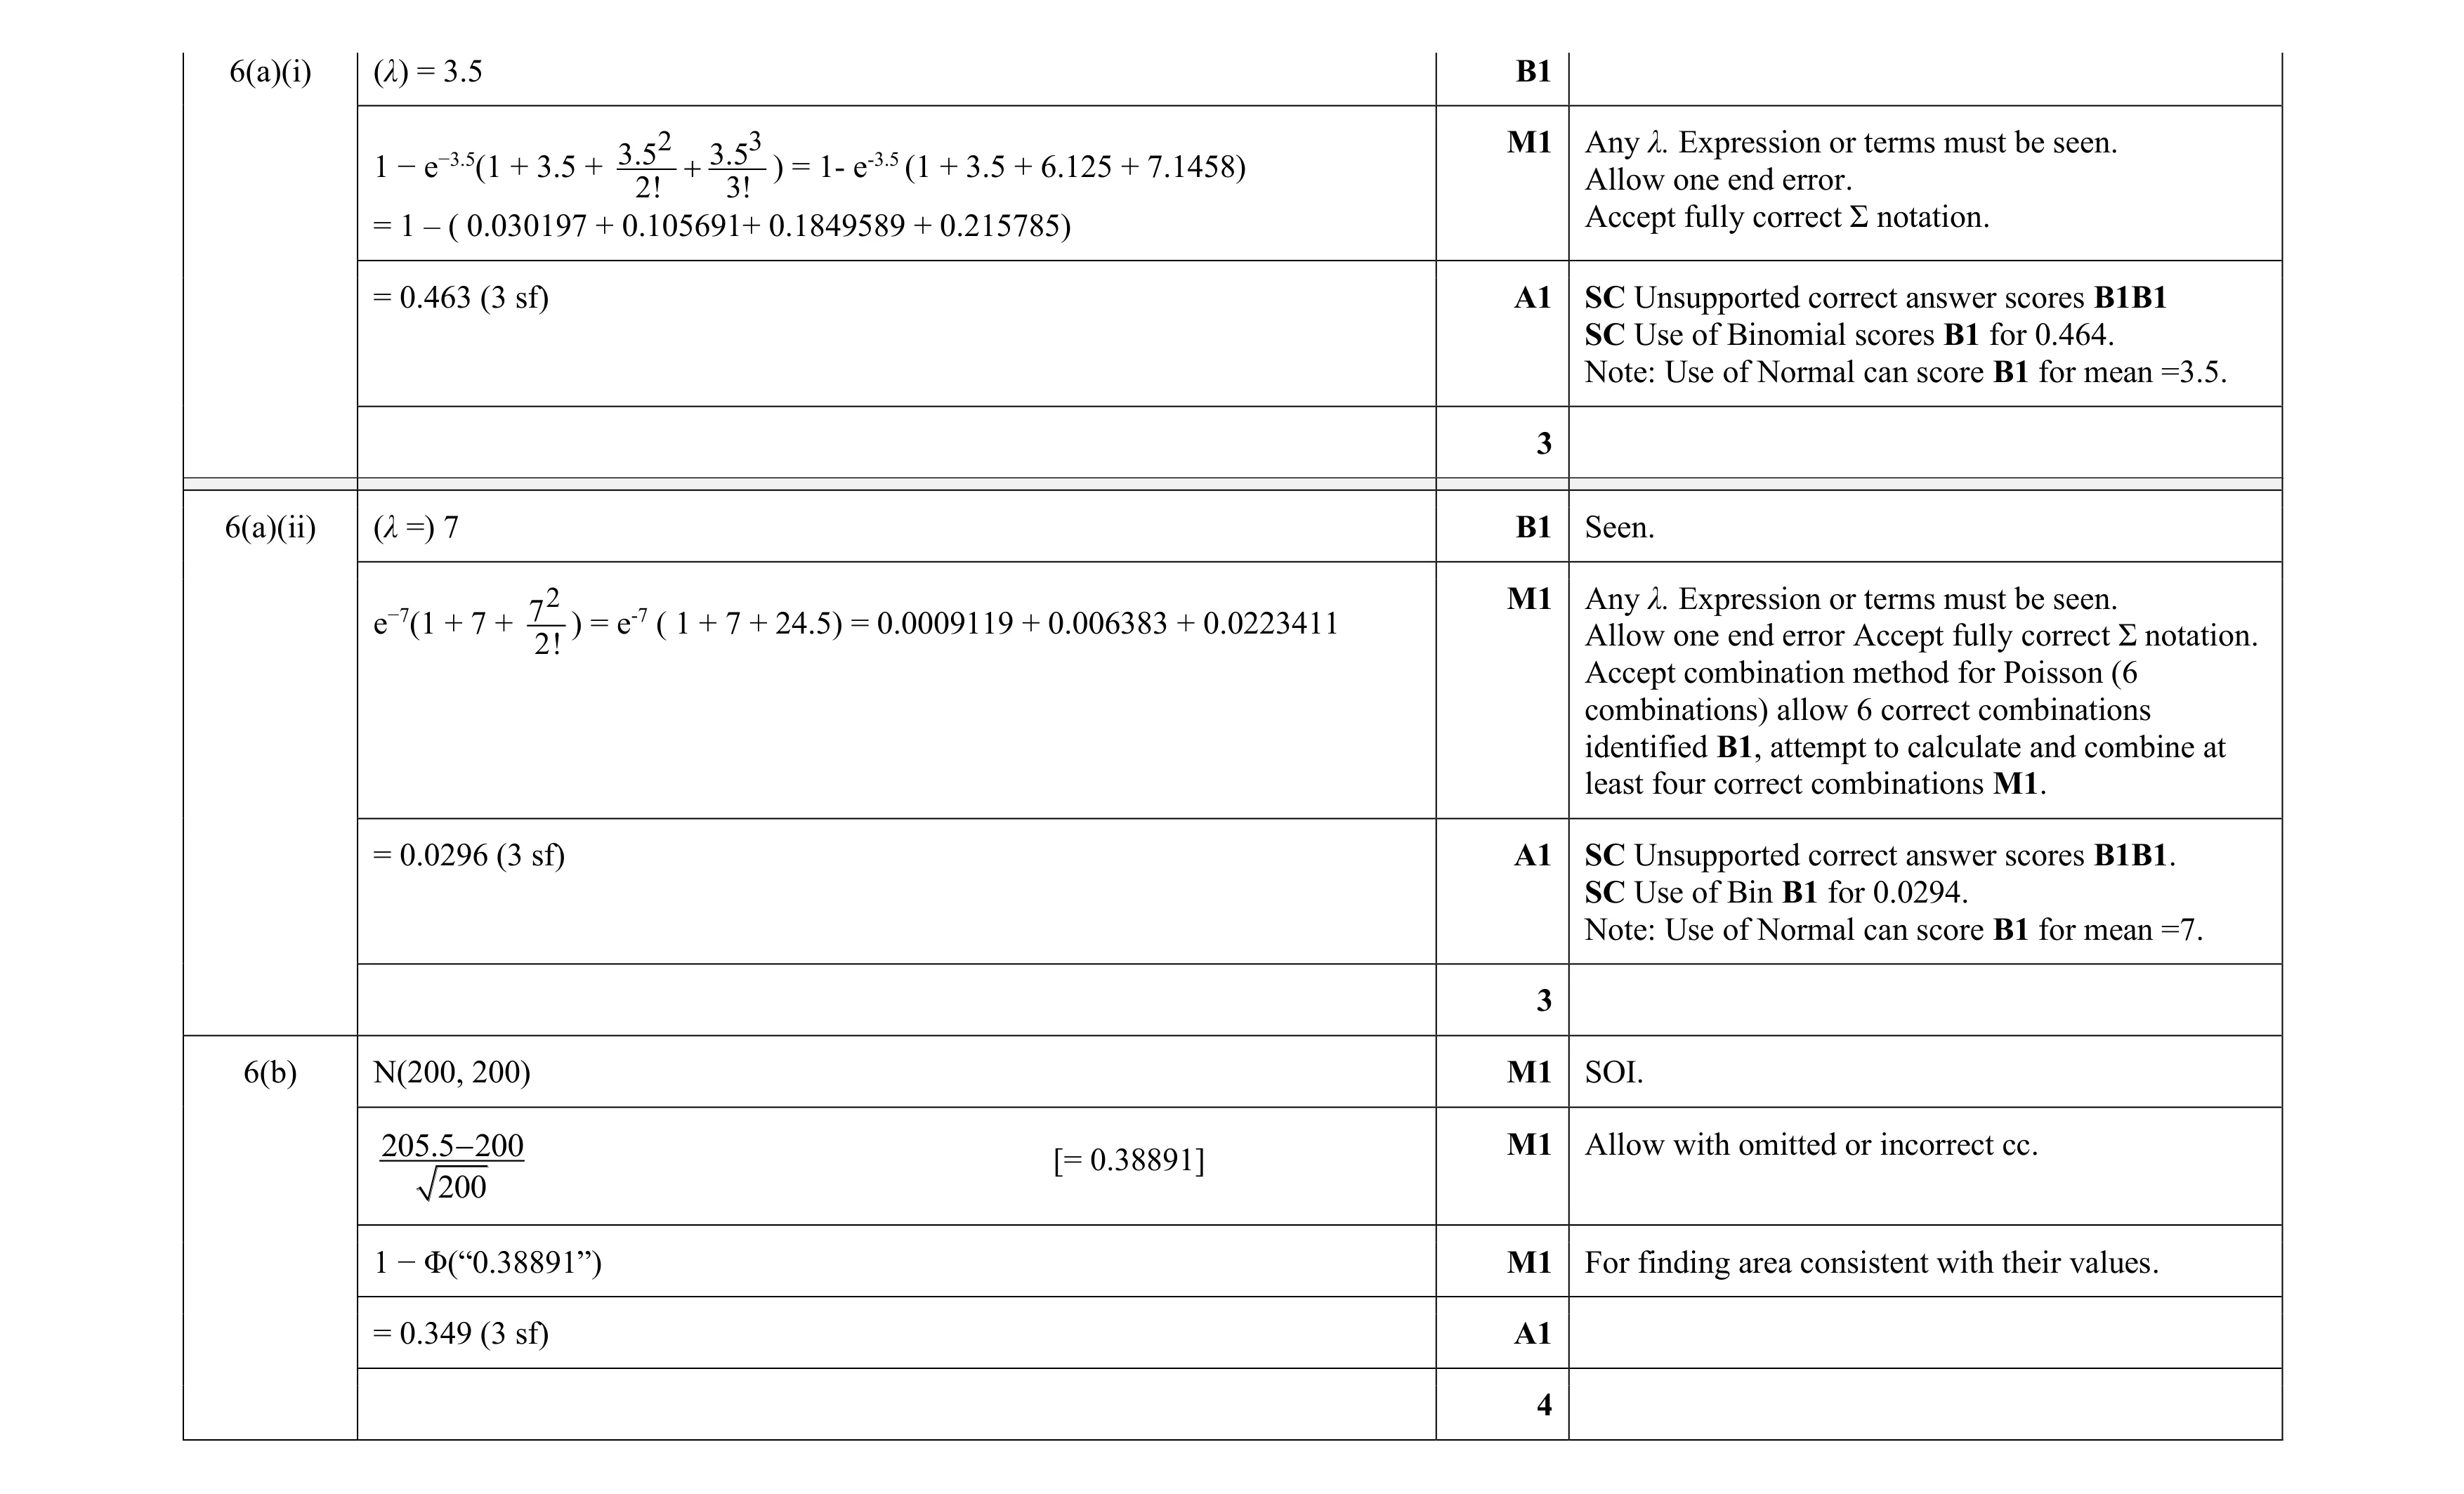 10
10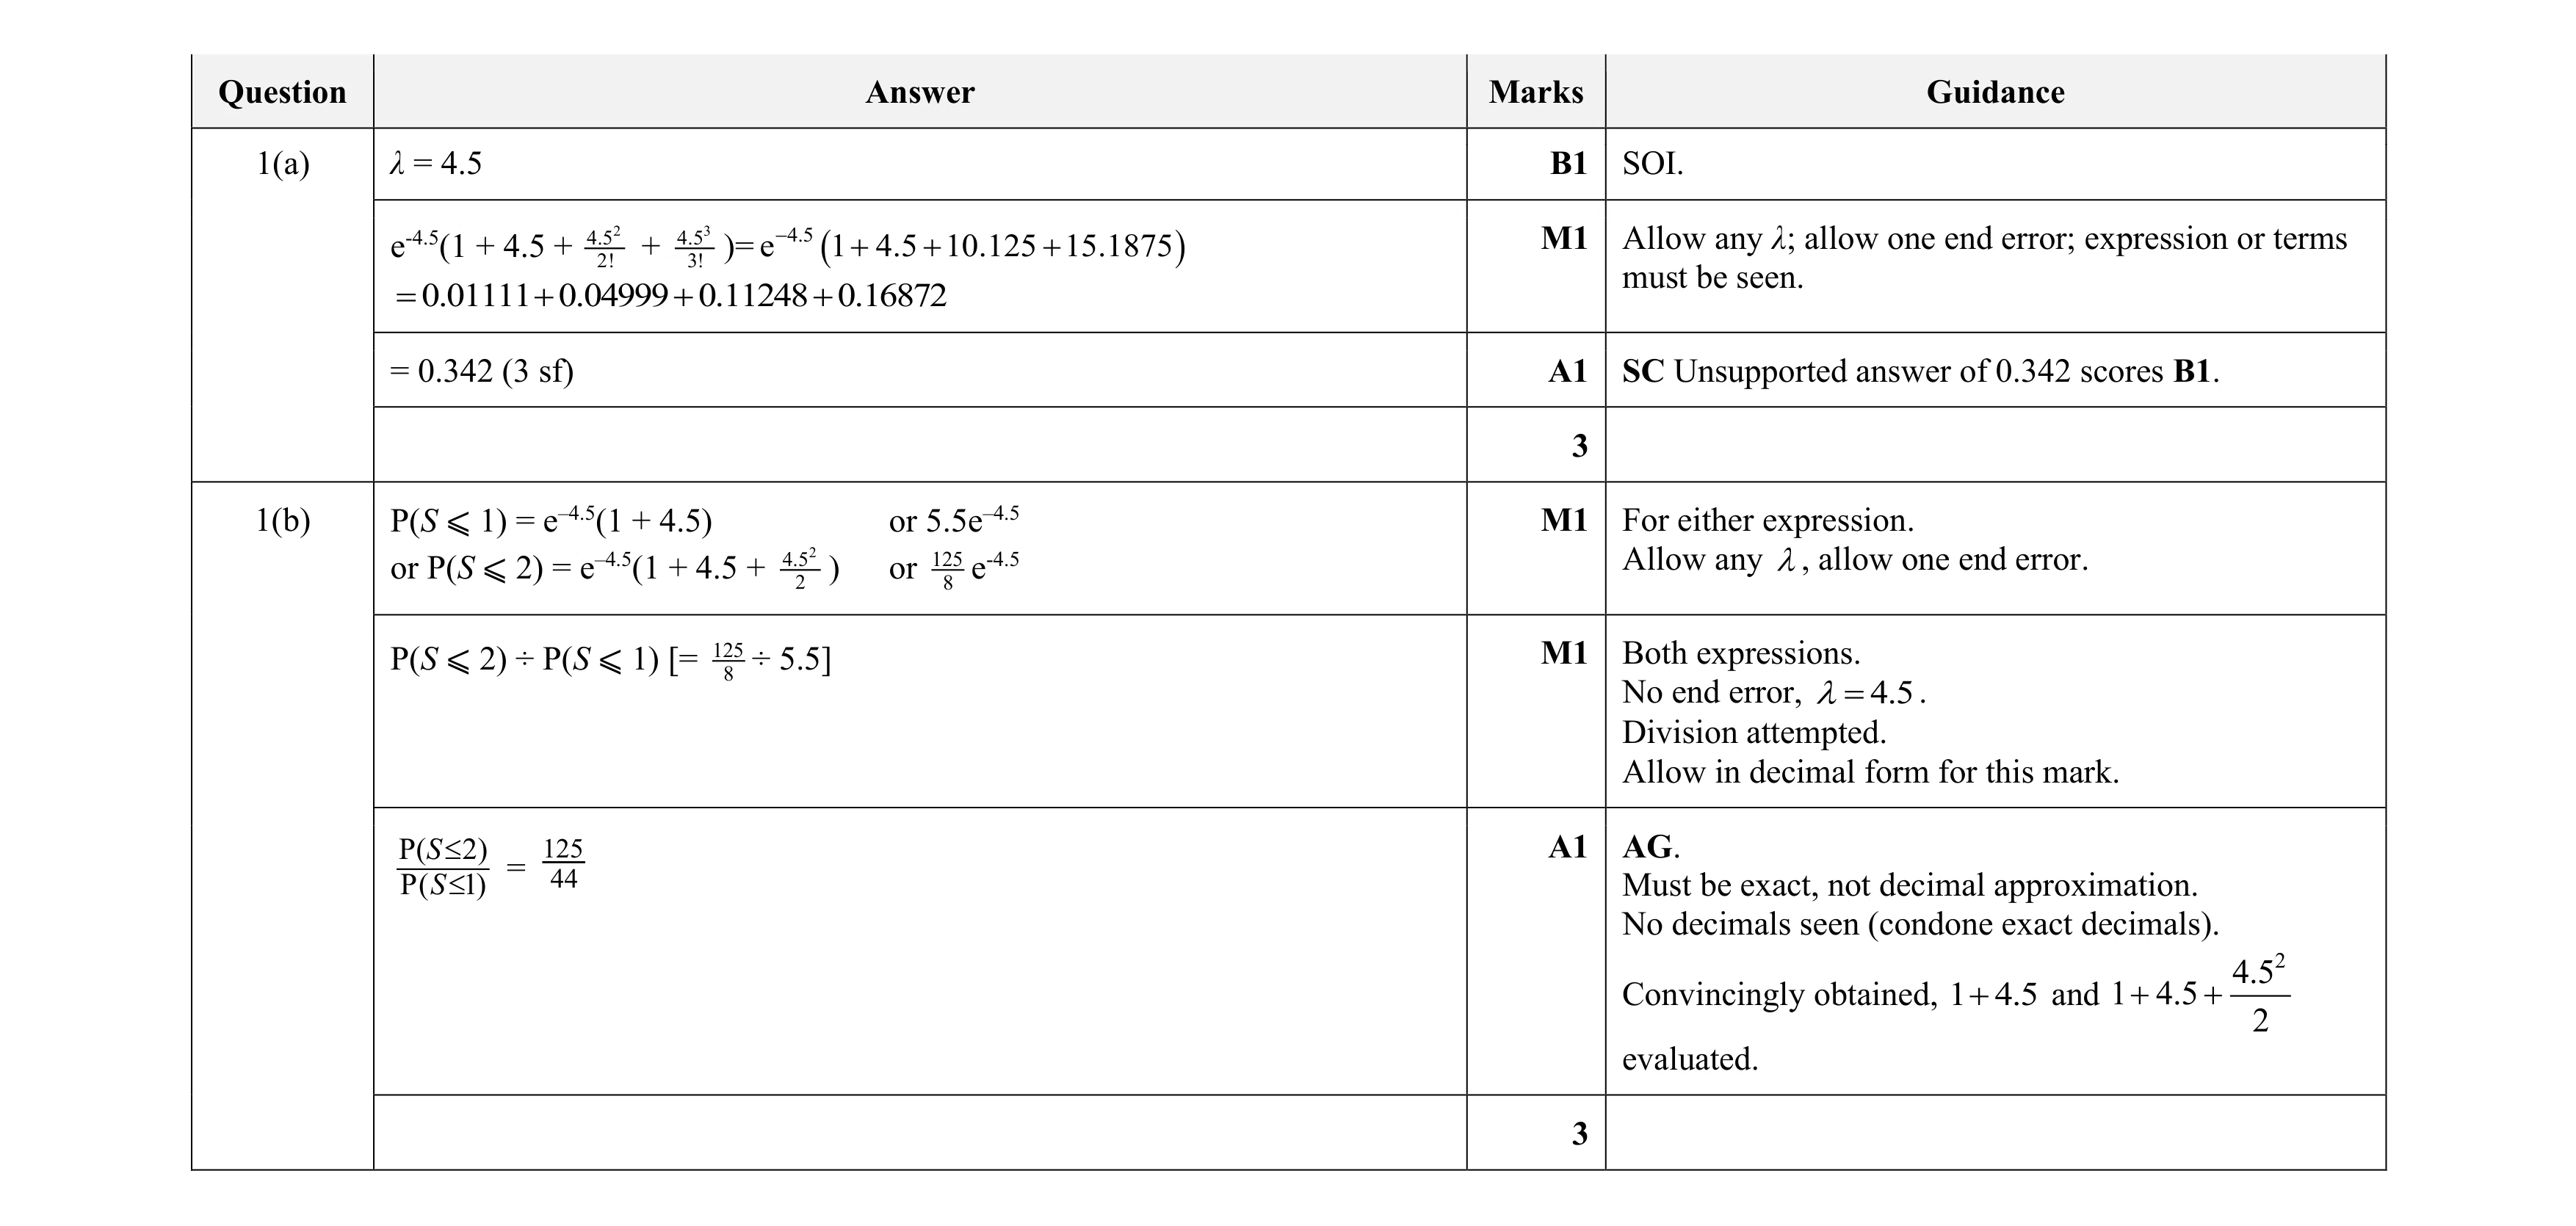 6
6