Cambridge A Level Mathematics 9709 — 2023 May/June Paper 6 · Variant 1
9709/61/M/J/23 · 6 questions · 50 marks · ≈56 min
The question paper and its mark scheme, free to read here and free to download. This is Cambridge’s own paper, exactly as it was sat.
Question paper12 pages

Mark scheme12 pages
Answers below. Sit the paper first if you are practising.
Questions as text
Q1 · In a certain country, 20540 adults out of a population of 6012300 have a degree in…
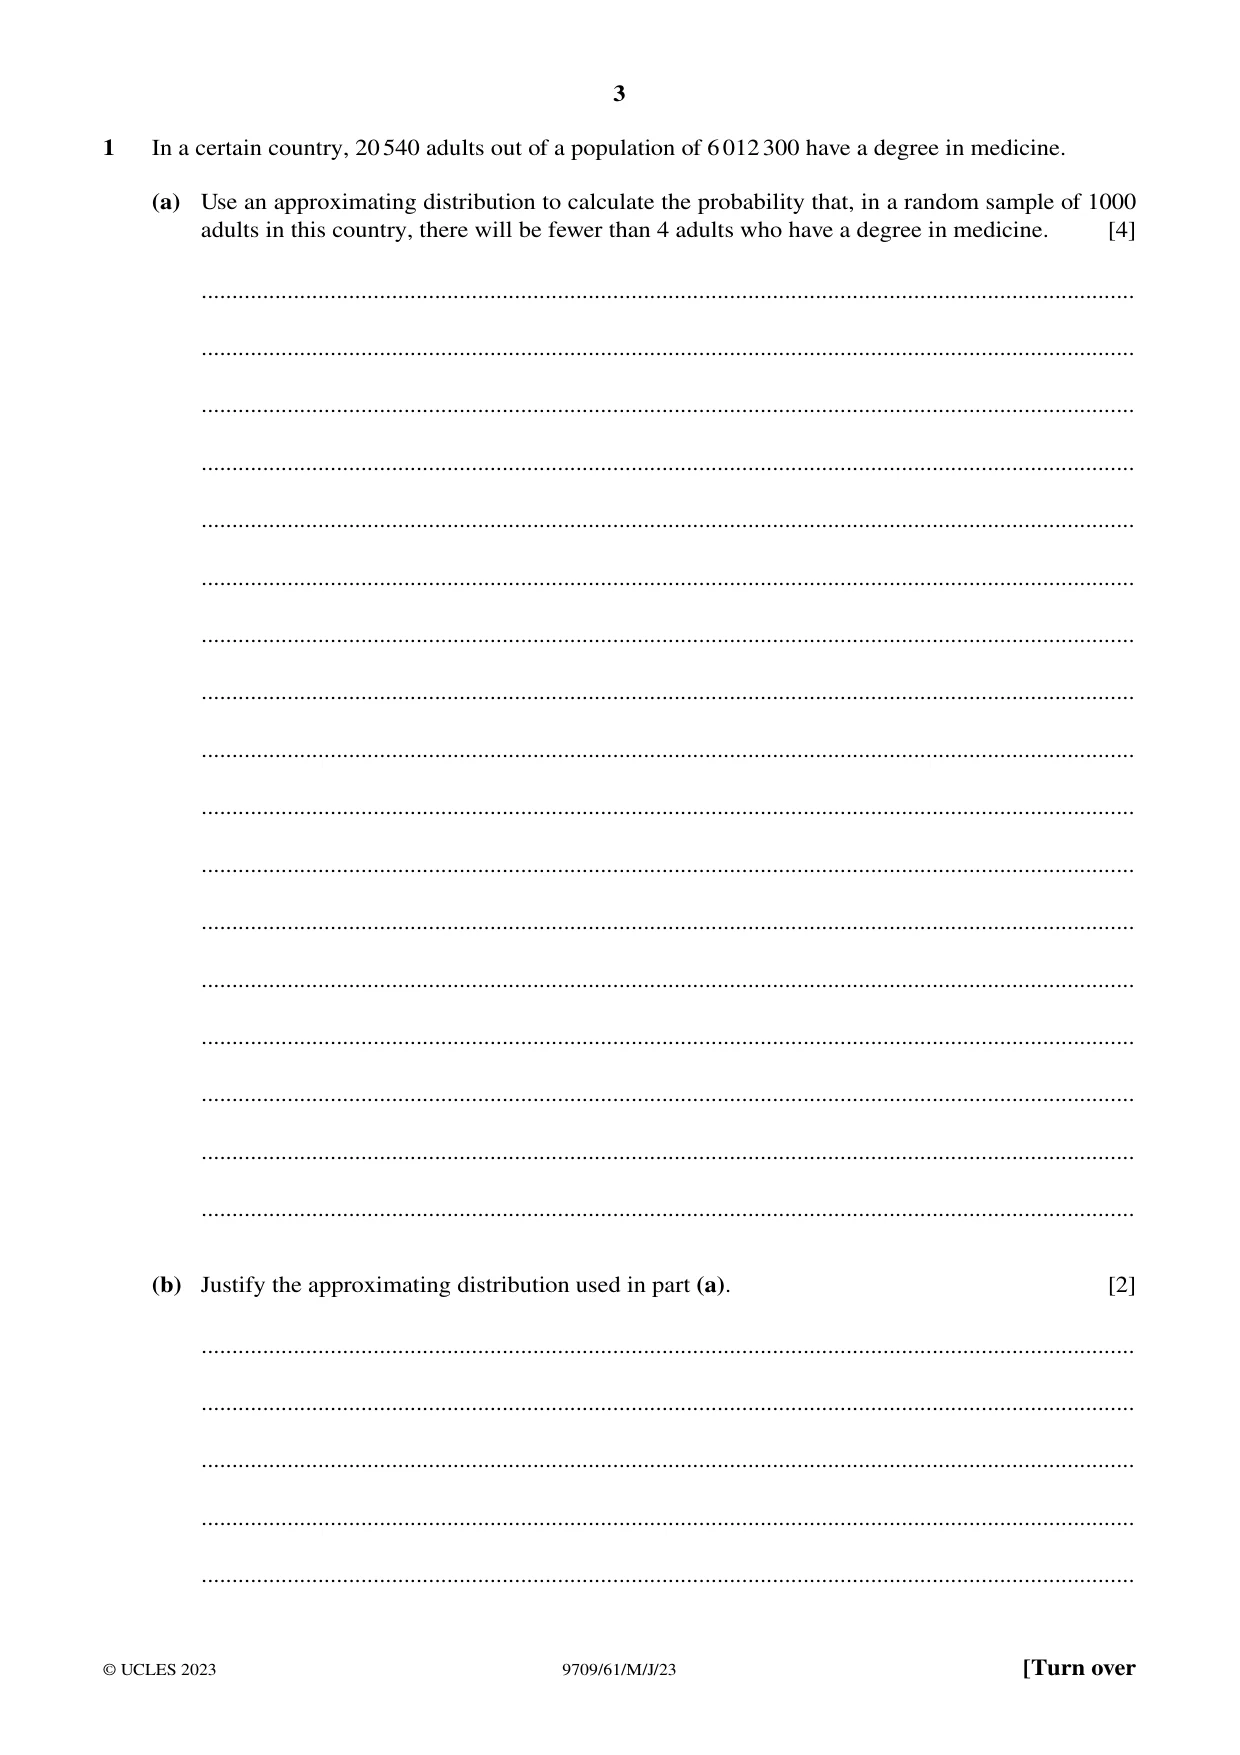
1 In a certain country, 20540 adults out of a population of 6012300 have a degree in medicine. (a) Use an approximating distribution to calculate the probability that, in a random sample of 1000 adults in this country, there will be fewer than 4 adults who have a degree in medicine. [4] ........................................................................................................................................................ ........................................................................................................................................................ ........................................................................................................................................................ ........................................................................................................................................................ ........................................................................................................................................................ ........................................................................................................................................................ ........................................................................................................................................................ ........................................................................................................................................................ ........................................................................................................................................................ ........................................................................................................................................................ ........................................................................................................................................................ ........................................................................................................................................................ ........................................................................................................................................................ ........................................................................................................................................................ ........................................................................................................................................................ ........................................................................................................................................................ ........................................................................................................................................................ (b) Justify the approximating distribution used in part (a). [2] ........................................................................................................................................................ ........................................................................................................................................................ ........................................................................................................................................................ ........................................................................................................................................................ ........................................................................................................................................................
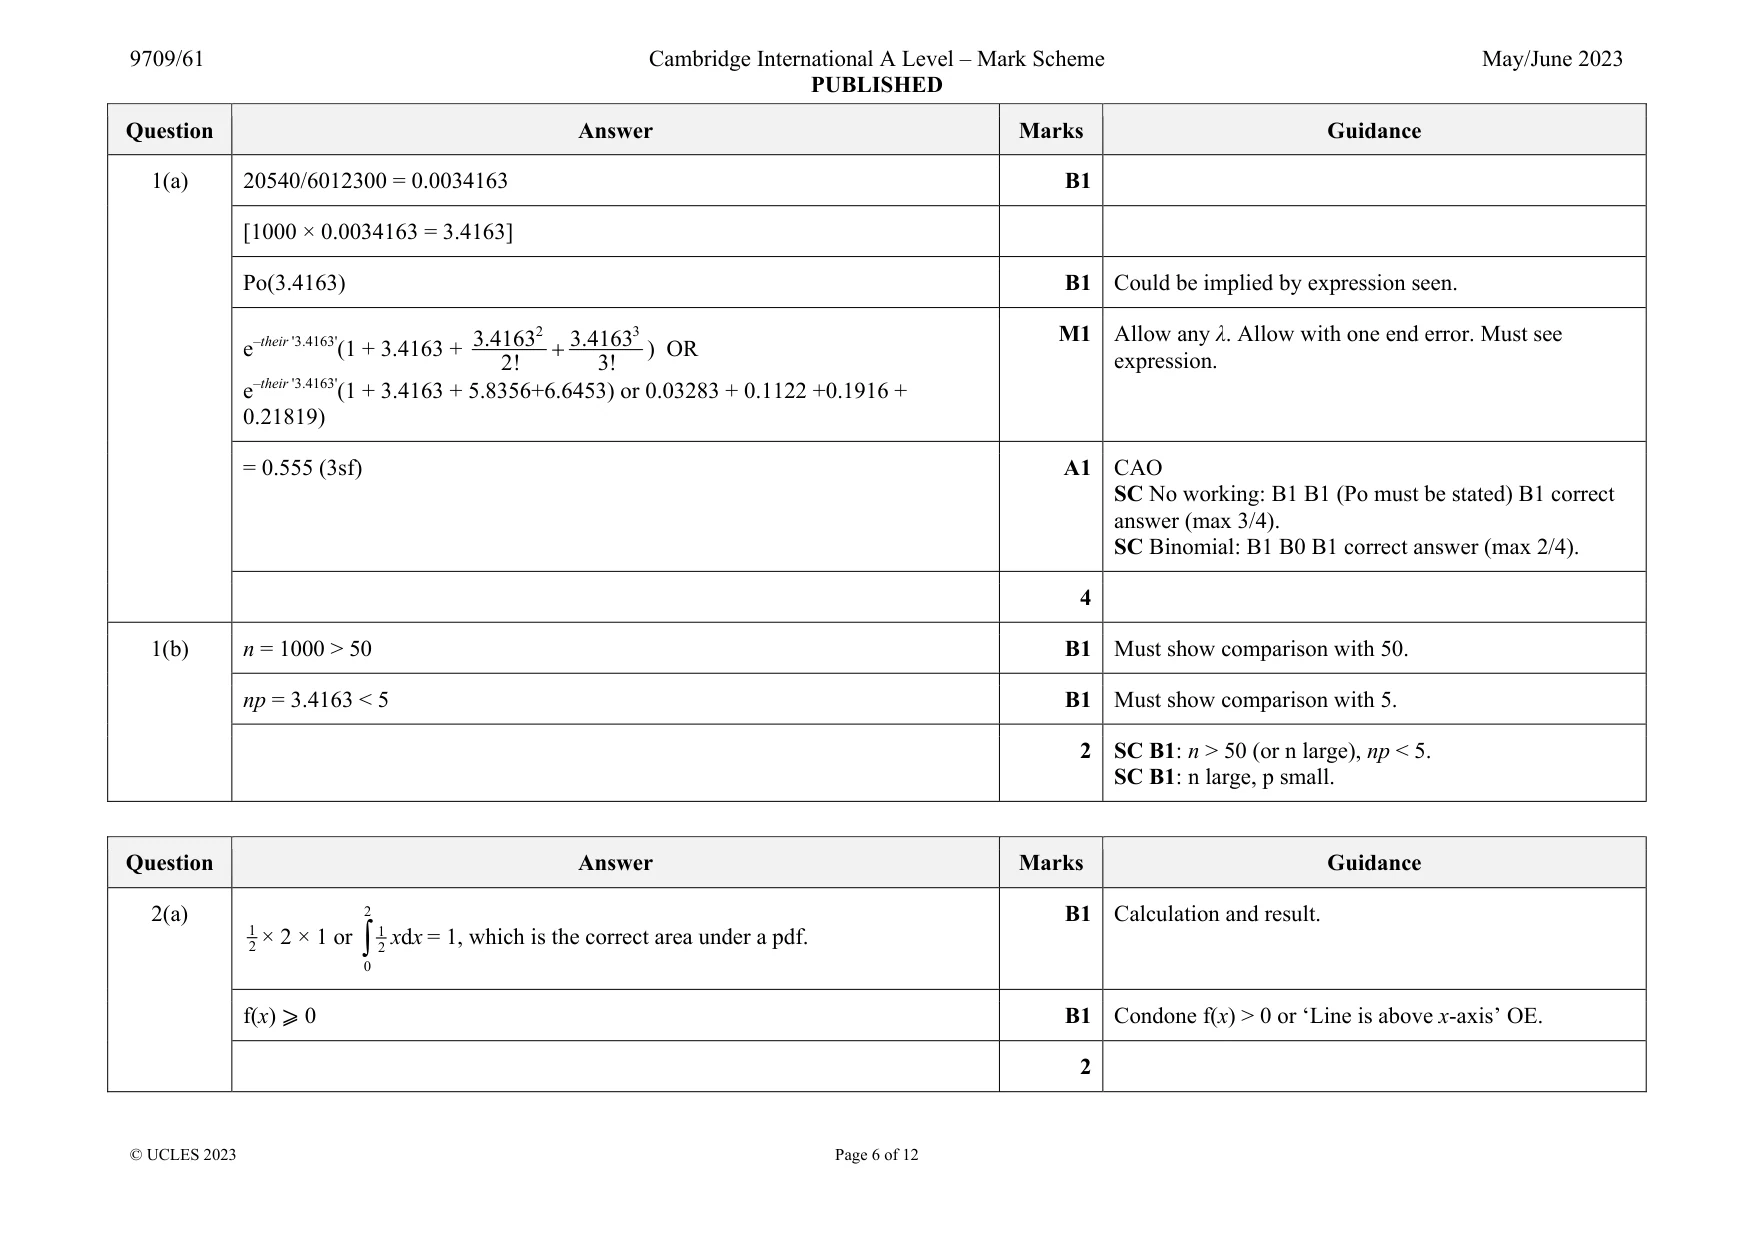
Mark scheme: 1(a) 20540/6012300 = 0.0034163 B1 [1000 × 0.0034163 = 3.4163] Po(3.4163) B1 Could be implied by expression seen. e–their '3.4163'(1 + 3.4163 + 2 3 3.4163 3.4163 2! 3! ) OR e–their '3.4163'(1 + 3.4163 + 5.8356+6.6453) or 0.03283 + 0.1122 +0.1916 + 0.21819) M1 Allow any λ. Allow with one end error. Must see expression. = 0.555 (3sf) A1 CAO SC No working: B1 B1 (Po must be stated) B1 correct answer (max 3/4). SC Binomial: B1 B0 B1 correct answer (max 2/4). 4 1(b) n = 1000 > 50 B1 Must show comparison with 50. np = 3.4163 < 5 B1 Must show comparison with 5. 2 SC B1: n > 50 (or n large), np < 5. SC B1: n large, p small.
Q3 · In the past, the annual amount of wheat produced per farm by a large number of similar…
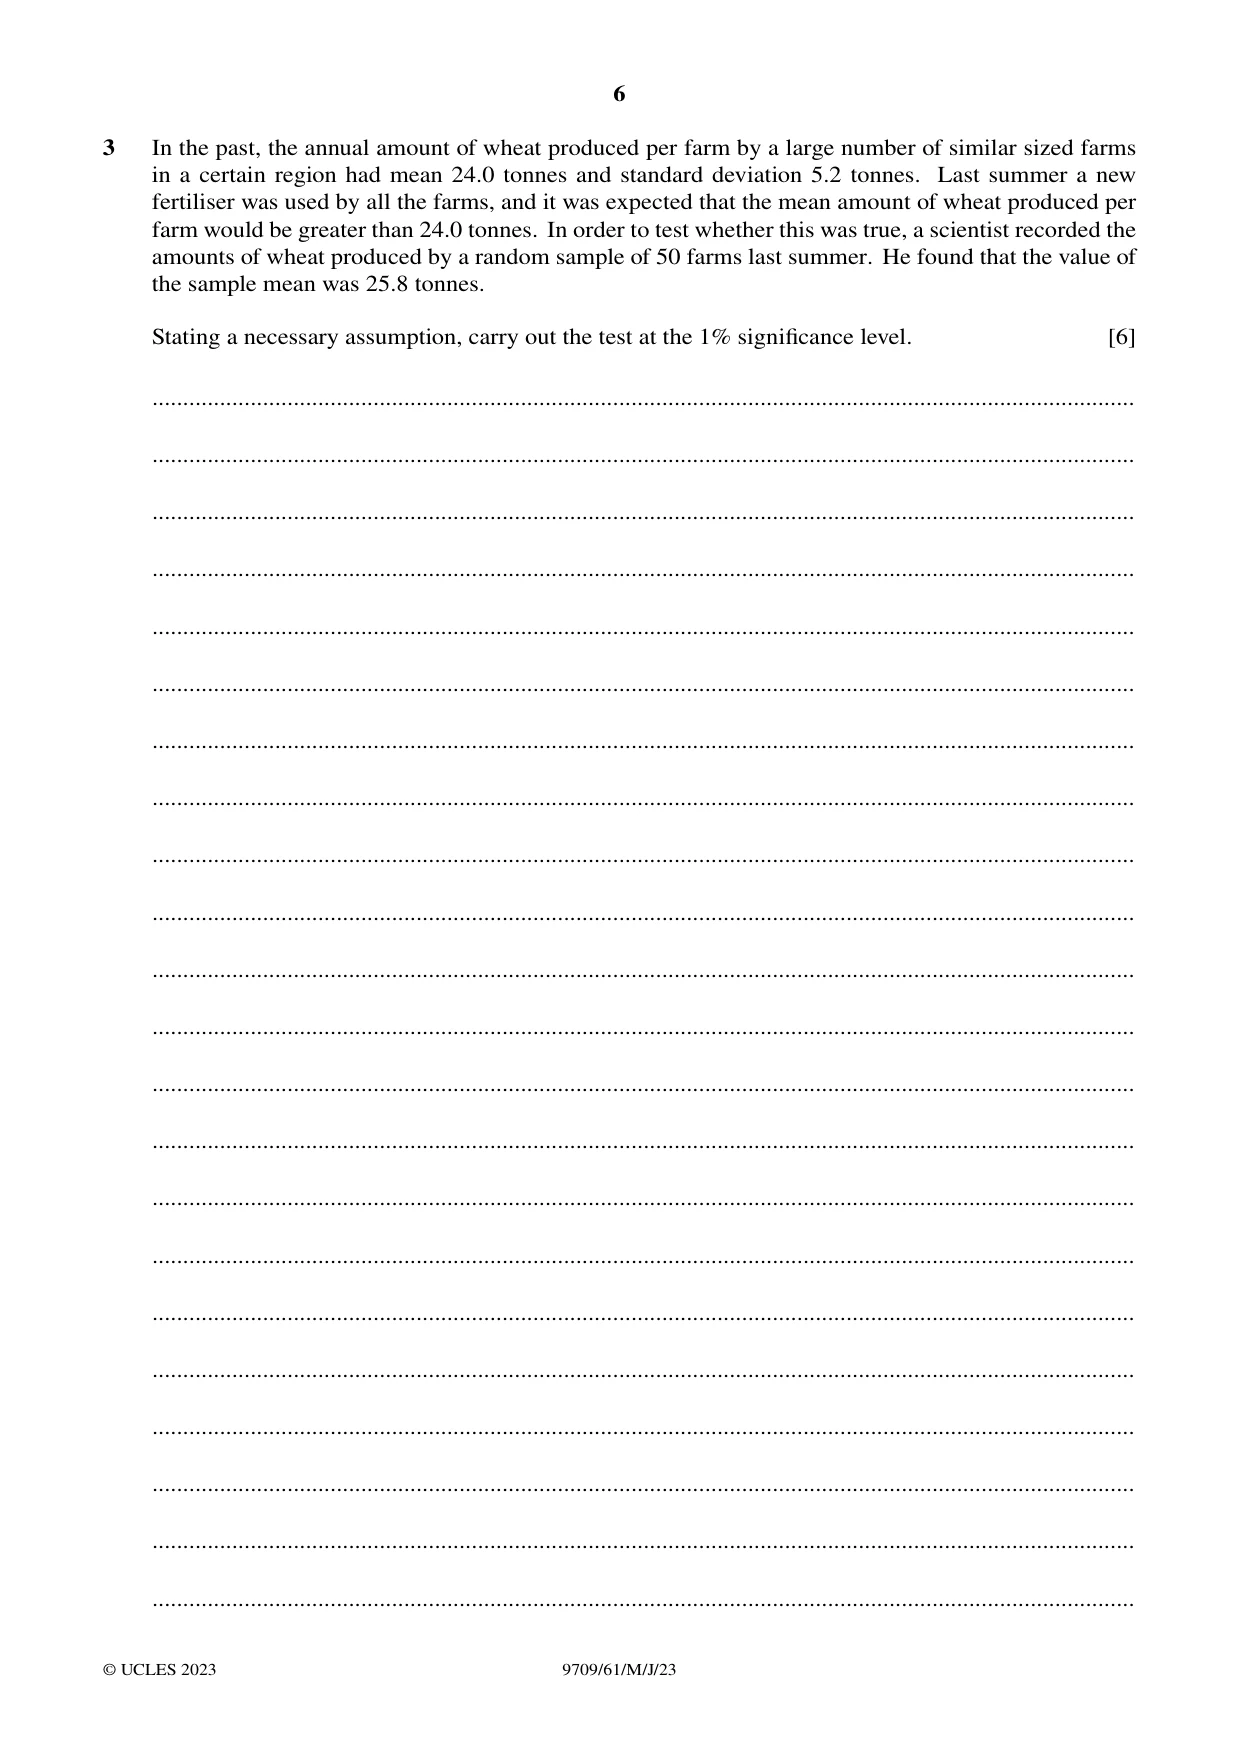
3 In the past, the annual amount of wheat produced per farm by a large number of similar sized farms in a certain region had mean 24.0 tonnes and standard deviation 5.2 tonnes. Last summer a new fertiliser was used by all the farms, and it was expected that the mean amount of wheat produced per farm would be greater than 24.0 tonnes. In order to test whether this was true, a scientist recorded the amounts of wheat produced by a random sample of 50 farms last summer. He found that the value of the sample mean was 25.8 tonnes. Stating a necessary assumption, carry out the test at the 1% significance level. [6] ................................................................................................................................................................ ................................................................................................................................................................ ................................................................................................................................................................ ................................................................................................................................................................ ................................................................................................................................................................ ................................................................................................................................................................ ................................................................................................................................................................ ................................................................................................................................................................ ................................................................................................................................................................ ................................................................................................................................................................ ................................................................................................................................................................ ................................................................................................................................................................ ................................................................................................................................................................ ................................................................................................................................................................ ................................................................................................................................................................ ................................................................................................................................................................ ................................................................................................................................................................ ................................................................................................................................................................ ................................................................................................................................................................ ................................................................................................................................................................ ................................................................................................................................................................ ................................................................................................................................................................
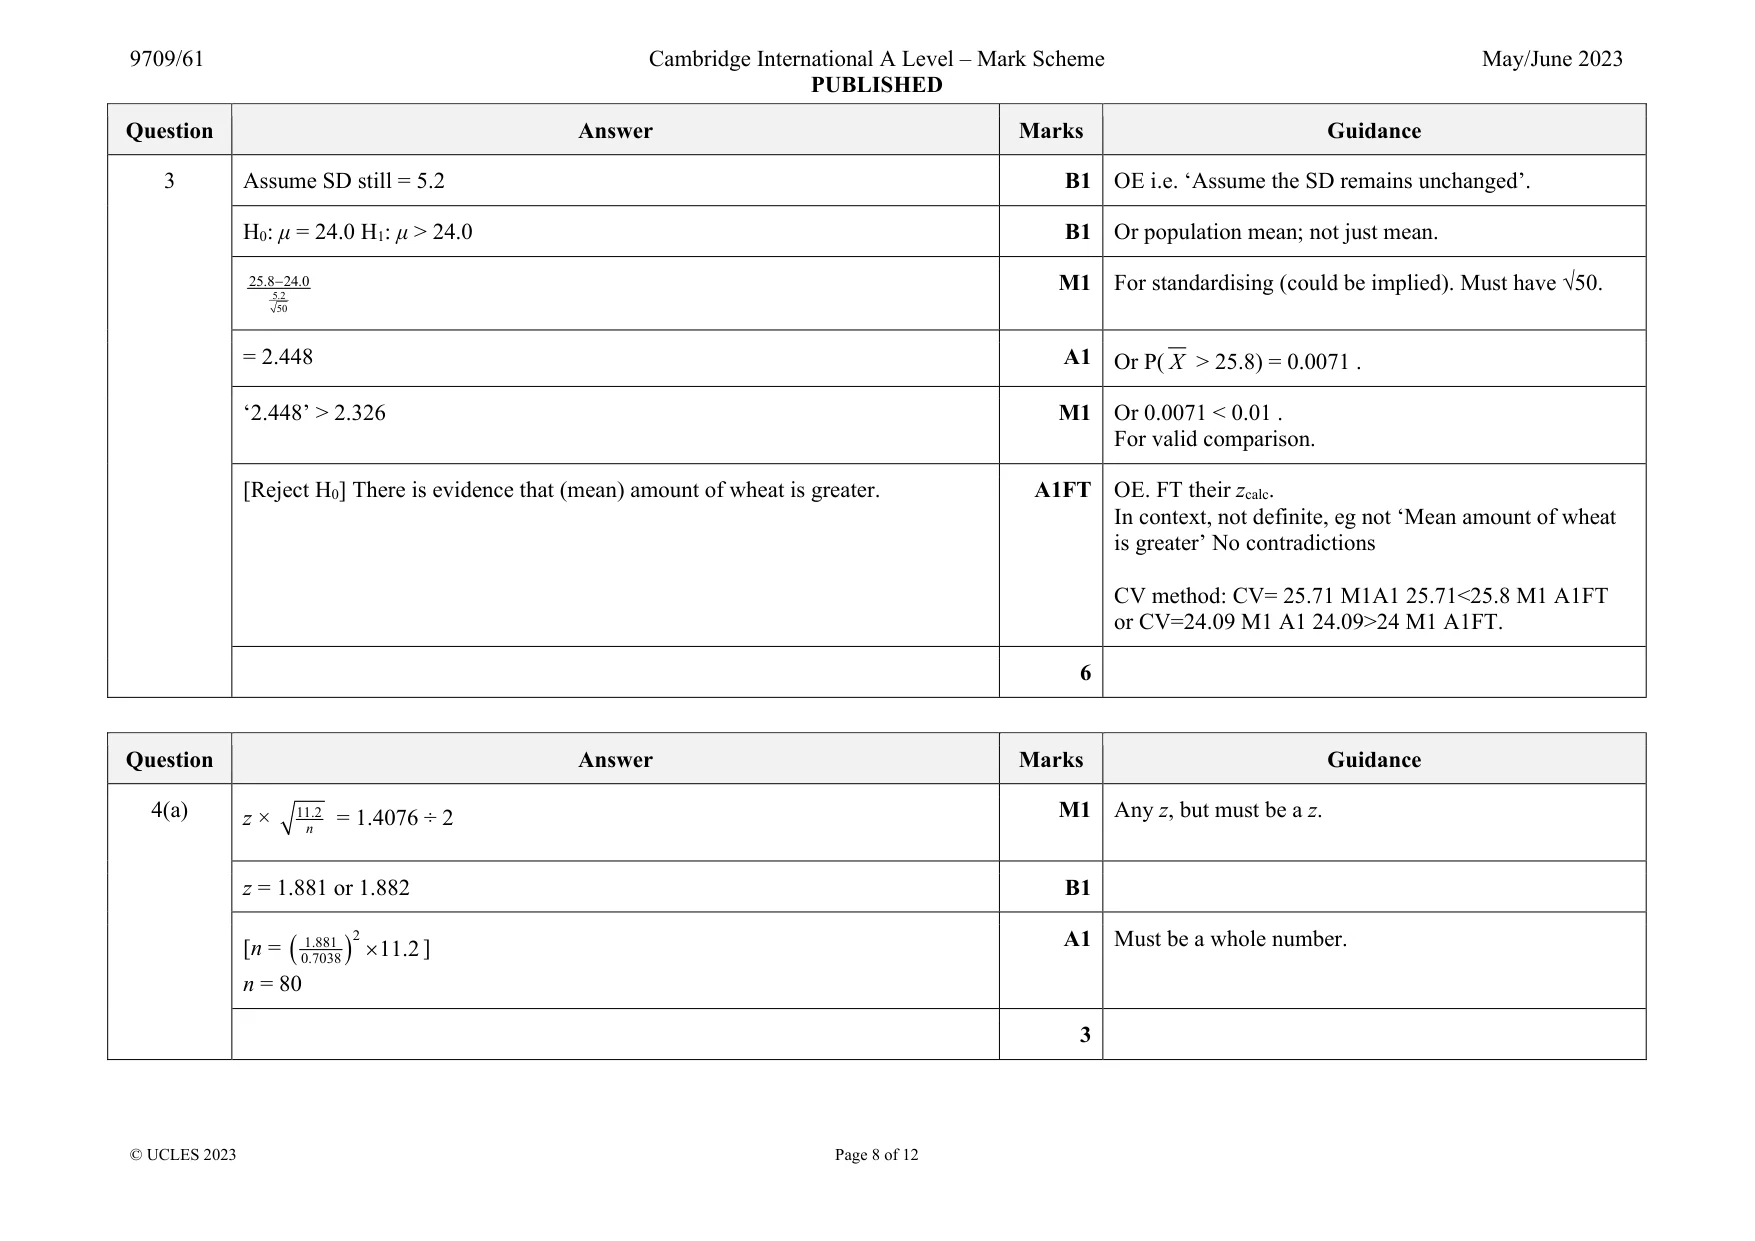
Mark scheme: 3 Assume SD still = 5.2 B1 OE i.e. ‘Assume the SD remains unchanged’. H0: μ = 24.0 H1: μ > 24.0 B1 Or population mean; not just mean. 5.2 50 25.8 24.0 M1 For standardising (could be implied). Must have √50. = 2.448 A1 Or P( X > 25.8) = 0.0071 . ‘2.448’ > 2.326 M1 Or 0.0071 < 0.01 . For valid comparison. [Reject H0] There is evidence that (mean) amount of wheat is greater. A1FT OE. FT their zcalc. In context, not definite, eg not ‘Mean amount of wheat is greater’ No contradictions CV method: CV= 25.71 M1A1 25.71<25.8 M1 A1FT or CV=24.09 M1 A1 24.09>24 M1 A1FT. 6
Q4 · A certain train journey takes place every day throughout the year
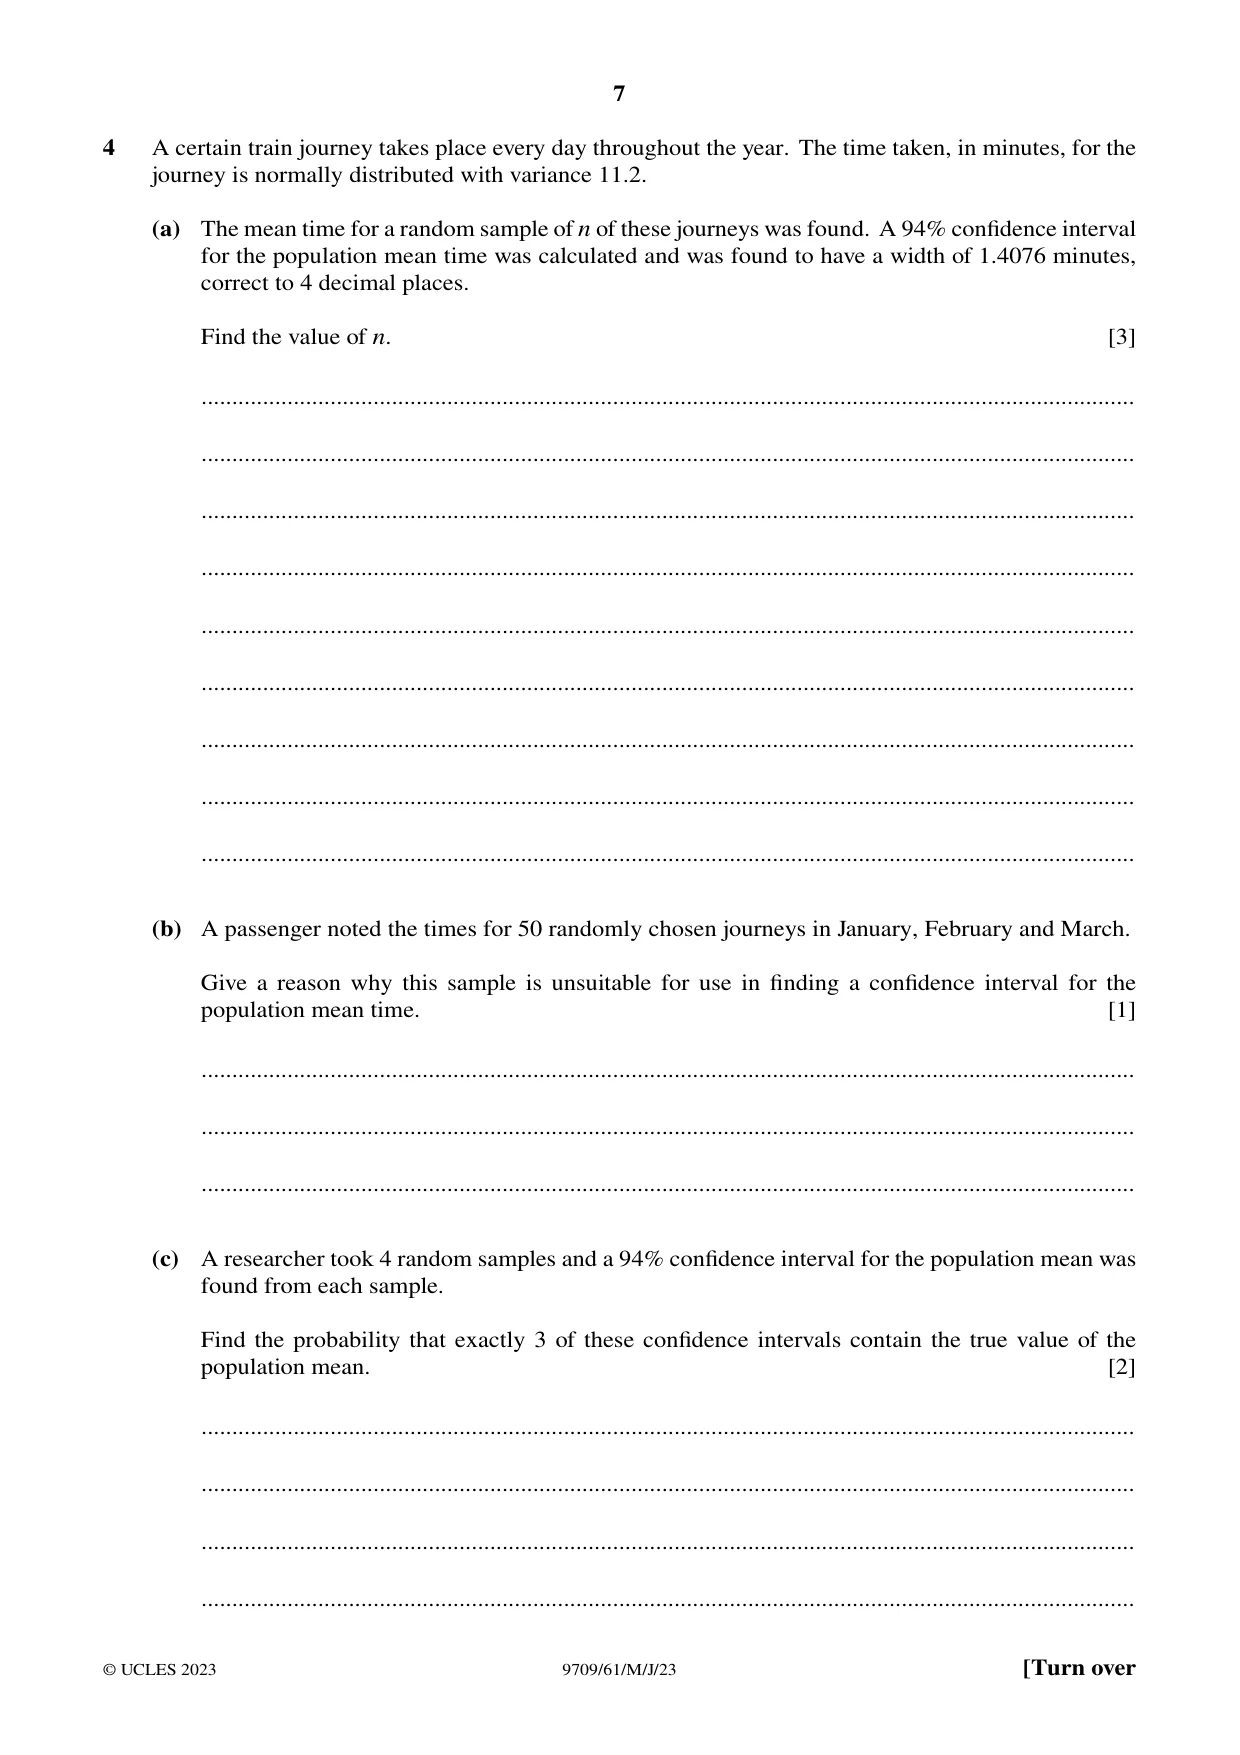
4 A certain train journey takes place every day throughout the year. The time taken, in minutes, for the journey is normally distributed with variance 11.2. (a) The mean time for a random sample of n of these journeys was found. A 94% confidence interval for the population mean time was calculated and was found to have a width of 1.4076 minutes, correct to 4 decimal places. Find the value of n. [3] ........................................................................................................................................................ ........................................................................................................................................................ ........................................................................................................................................................ ........................................................................................................................................................ ........................................................................................................................................................ ........................................................................................................................................................ ........................................................................................................................................................ ........................................................................................................................................................ ........................................................................................................................................................ (b) A passenger noted the times for 50 randomly chosen journeys in January, February and March. Give a reason why this sample is unsuitable for use in finding a confidence interval for the population mean time. [1] ........................................................................................................................................................ ........................................................................................................................................................ ........................................................................................................................................................ (c) A researcher took 4 random samples and a 94% confidence interval for the population mean was found from each sample. Find the probability that exactly 3 of these confidence intervals contain the true value of the population mean. [2] ........................................................................................................................................................ ........................................................................................................................................................ ........................................................................................................................................................ ........................................................................................................................................................
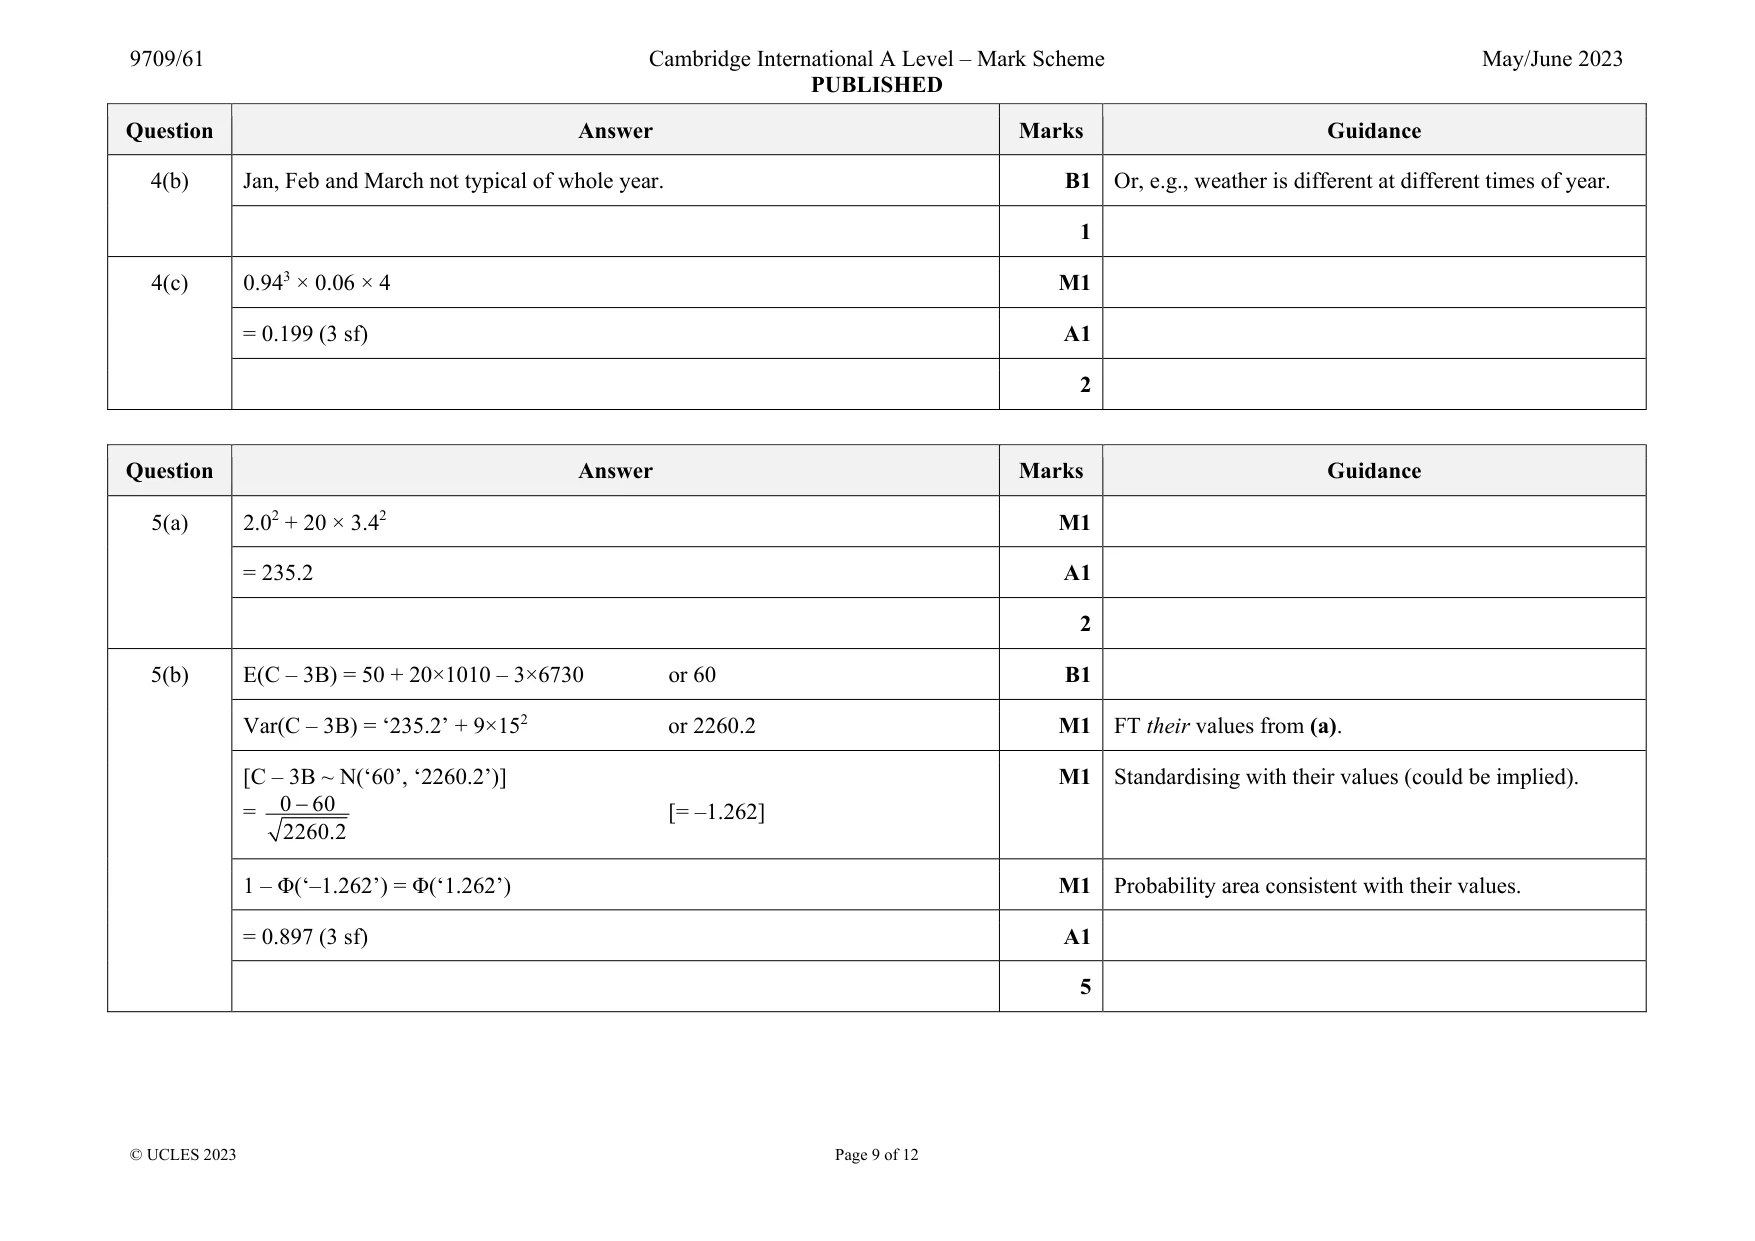
Mark scheme: 4(a) z × 11.2 n = 1.4076 ÷ 2 z = 1.881 or 1.882 B1 [n = 2 1.881 0.7038 11.2 ] n = 80 A1 Must be a whole number. 3 Question Answer Marks Guidance 4(b) Jan, Feb and March not typical of whole year. B1 Or, e.g., weather is different at different times of year. 1 4(c) 0.943 × 0.06 × 4 M1 = 0.199 (3 sf) A1 2
Q5 · Large packets of rice are packed in cartons, each containing 20 randomly chosen packets
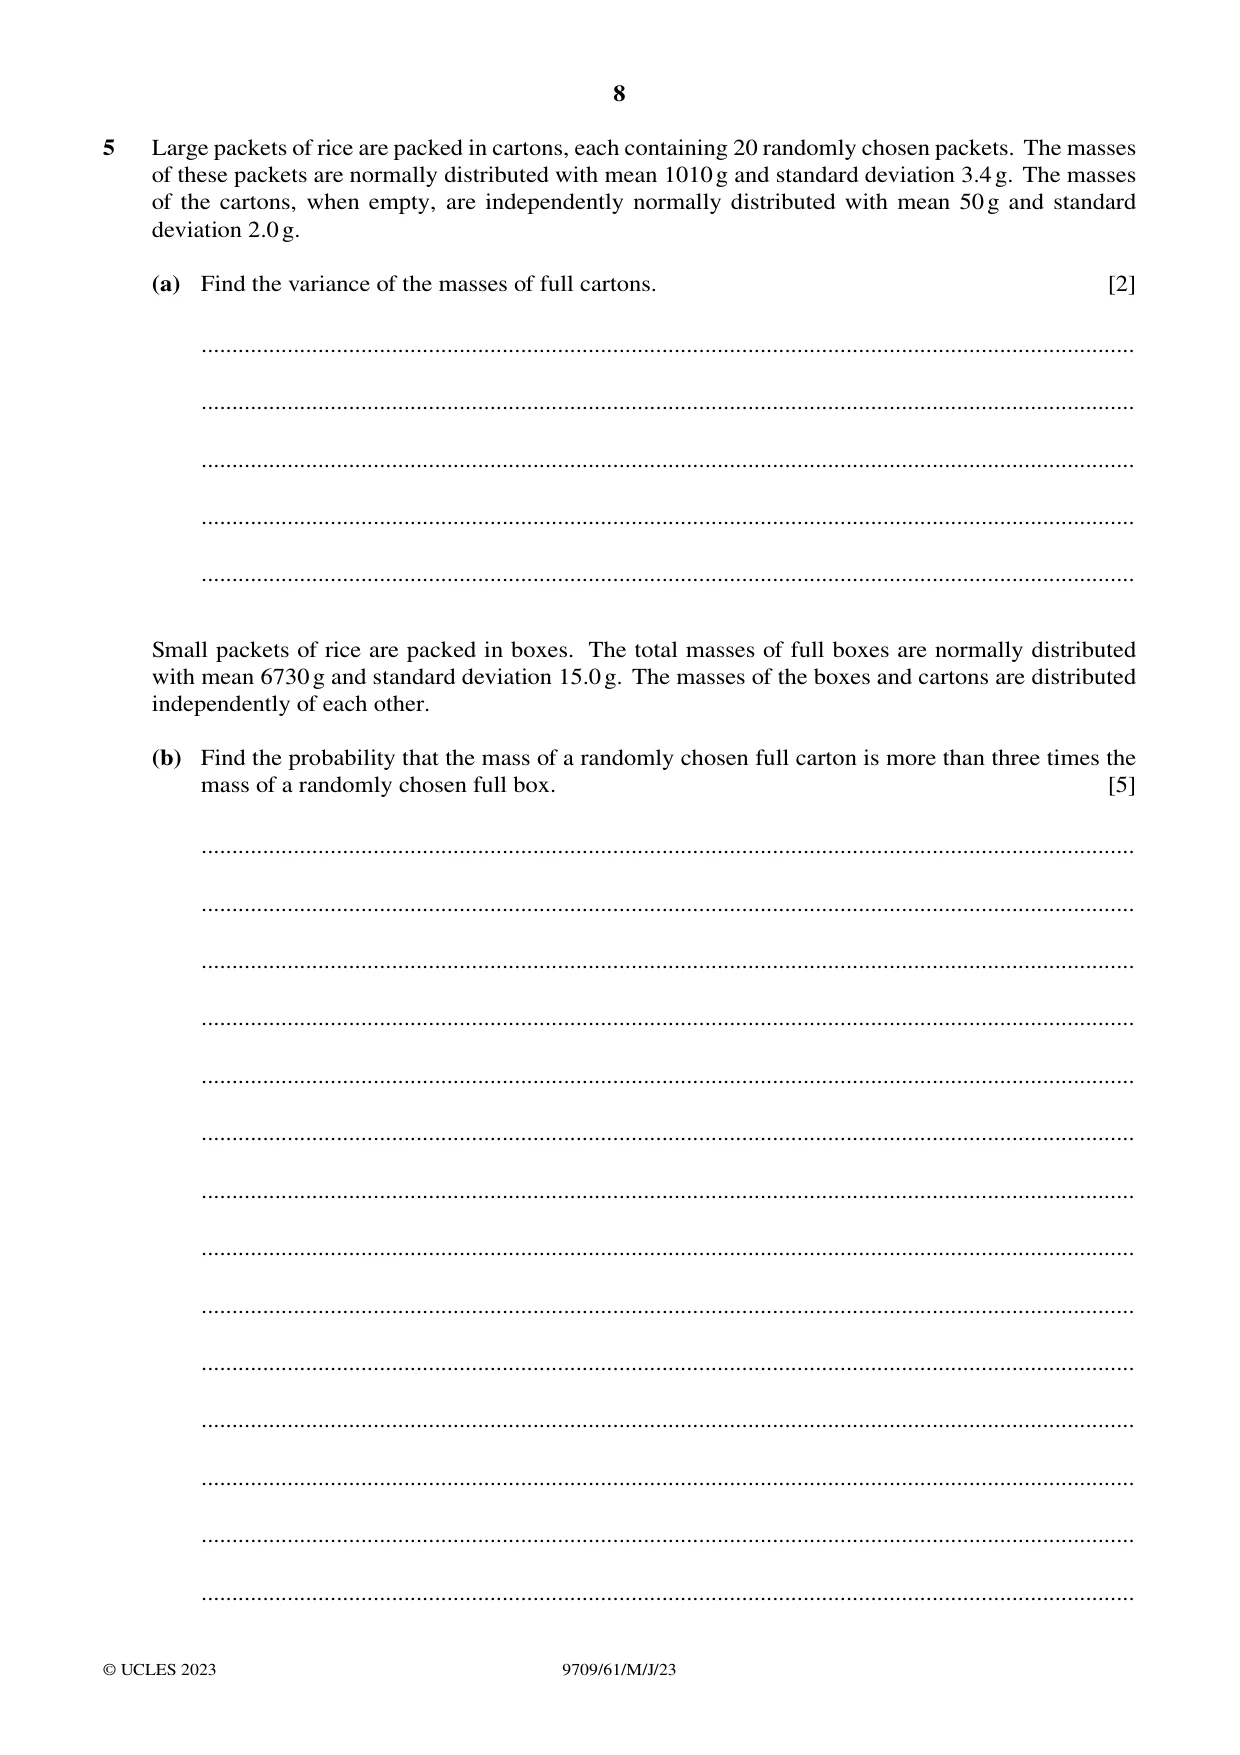
5 Large packets of rice are packed in cartons, each containing 20 randomly chosen packets. The masses of these packets are normally distributed with mean 1010g and standard deviation 3.4g. The masses of the cartons, when empty, are independently normally distributed with mean 50g and standard deviation 2.0g. (a) Find the variance of the masses of full cartons. [2] ........................................................................................................................................................ ........................................................................................................................................................ ........................................................................................................................................................ ........................................................................................................................................................ ........................................................................................................................................................ Small packets of rice are packed in boxes. The total masses of full boxes are normally distributed with mean 6730g and standard deviation 15.0g. The masses of the boxes and cartons are distributed independently of each other. (b) Find the probability that the mass of a randomly chosen full carton is more than three times the mass of a randomly chosen full box. [5] ........................................................................................................................................................ ........................................................................................................................................................ ........................................................................................................................................................ ........................................................................................................................................................ ........................................................................................................................................................ ........................................................................................................................................................ ........................................................................................................................................................ ........................................................................................................................................................ ........................................................................................................................................................ ........................................................................................................................................................ ........................................................................................................................................................ ........................................................................................................................................................ ........................................................................................................................................................ ........................................................................................................................................................
Mark scheme: 5(a) M1 = 235.2 A1 2 5(b) E(C – 3B) = 50 + 20×1010 – 3×6730 or 60 B1 Var(C – 3B) = ‘235.2’ + 9×152 or 2260.2 M1 FT their values from (a). [C – 3B ~ N(‘60’, ‘2260.2’)] = 0 60 2260.2 [= –1.262] M1 Standardising with their values (could be implied). 1 – Φ(‘–1.262’) = Φ(‘1.262’) M1 Probability area consistent with their values. = 0.897 (3 sf) A1 5
Q6 · A sample of 5 randomly selected values of a variable X is as follows: 1 2 6 1 a where a >…
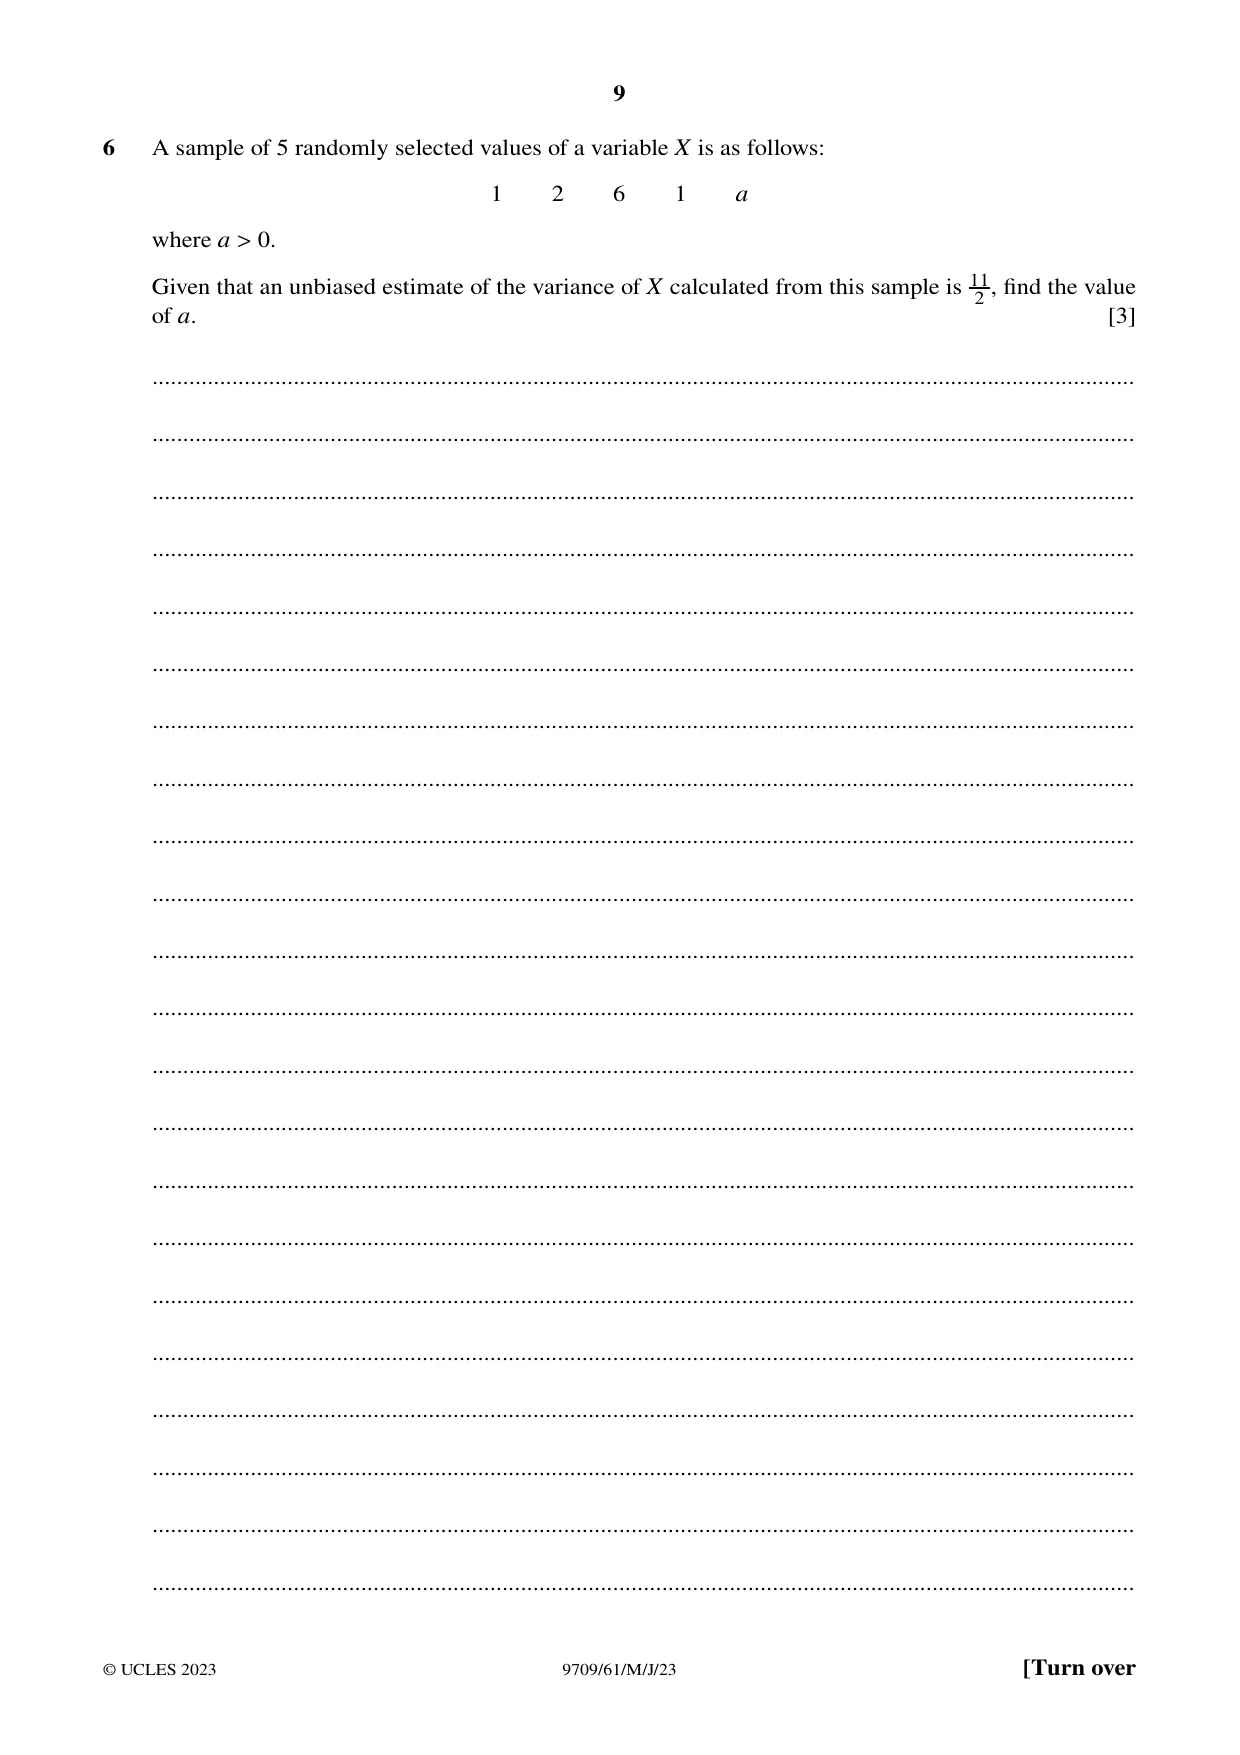
6 A sample of 5 randomly selected values of a variable X is as follows: 1 2 6 1 a where a > 0. Given that an unbiased estimate of the variance of X calculated from this sample is 11 , find the value 2 of a. [3] ................................................................................................................................................................ ................................................................................................................................................................ ................................................................................................................................................................ ................................................................................................................................................................ ................................................................................................................................................................ ................................................................................................................................................................ ................................................................................................................................................................ ................................................................................................................................................................ ................................................................................................................................................................ ................................................................................................................................................................ ................................................................................................................................................................ ................................................................................................................................................................ ................................................................................................................................................................ ................................................................................................................................................................ ................................................................................................................................................................ ................................................................................................................................................................ ................................................................................................................................................................ ................................................................................................................................................................ ................................................................................................................................................................ ................................................................................................................................................................ ................................................................................................................................................................ ................................................................................................................................................................
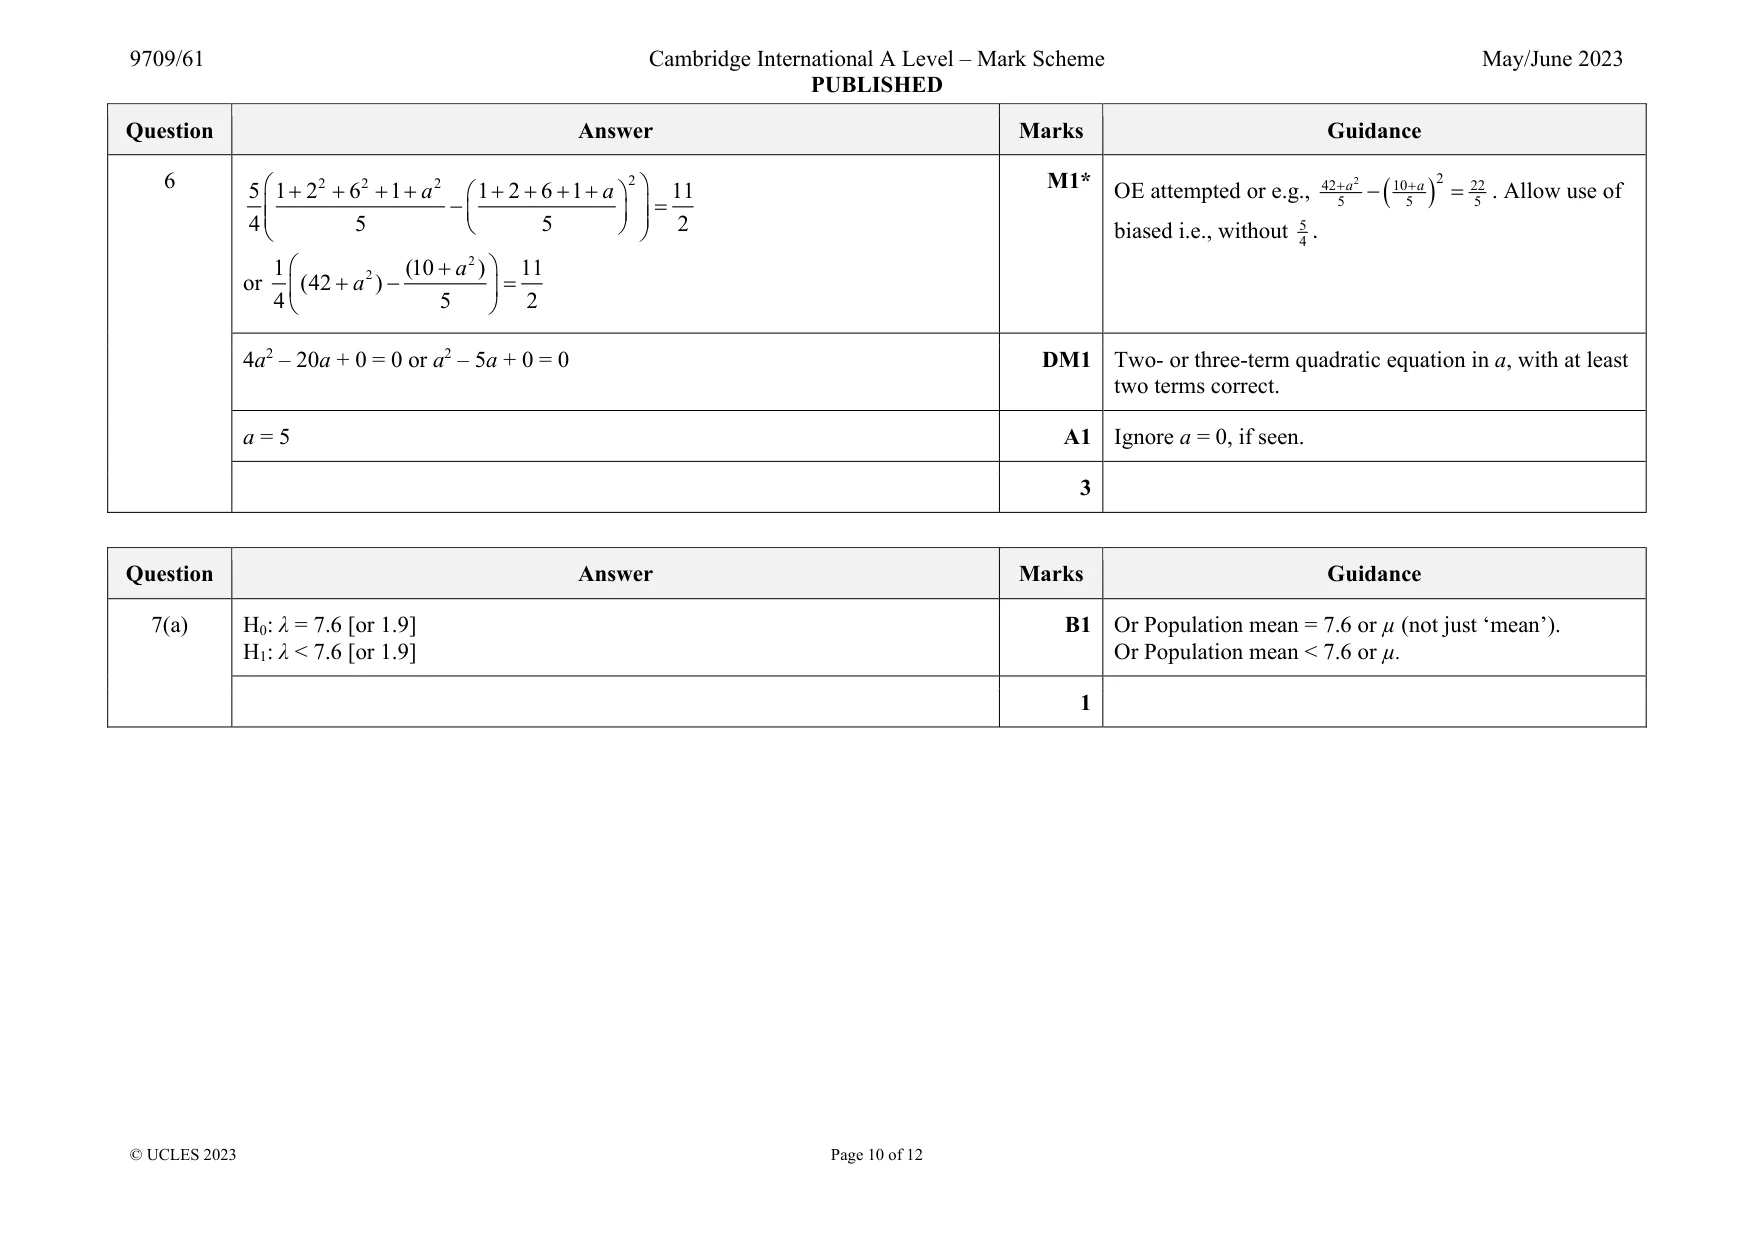
Mark scheme: 6 2 2 2 2 5 1 2 6 1 1 2 6 1 11 4 5 5 2 a a or 2 2 1 (10 ) 11 (42 ) 4 5 2 a a M1* OE attempted or e.g., 2 2 42 10 22 5 5 5 a a . Allow use of biased i.e., without 5 4 . 4a2 – 20a + 0 = 0 or a2 – 5a + 0 = 0 DM1 Two- or three-term quadratic equation in a, with at least two terms correct. a = 5 A1 Ignore a = 0, if seen. 3
Q7 · The number of accidents per week at a certain factory has a Poisson distribution
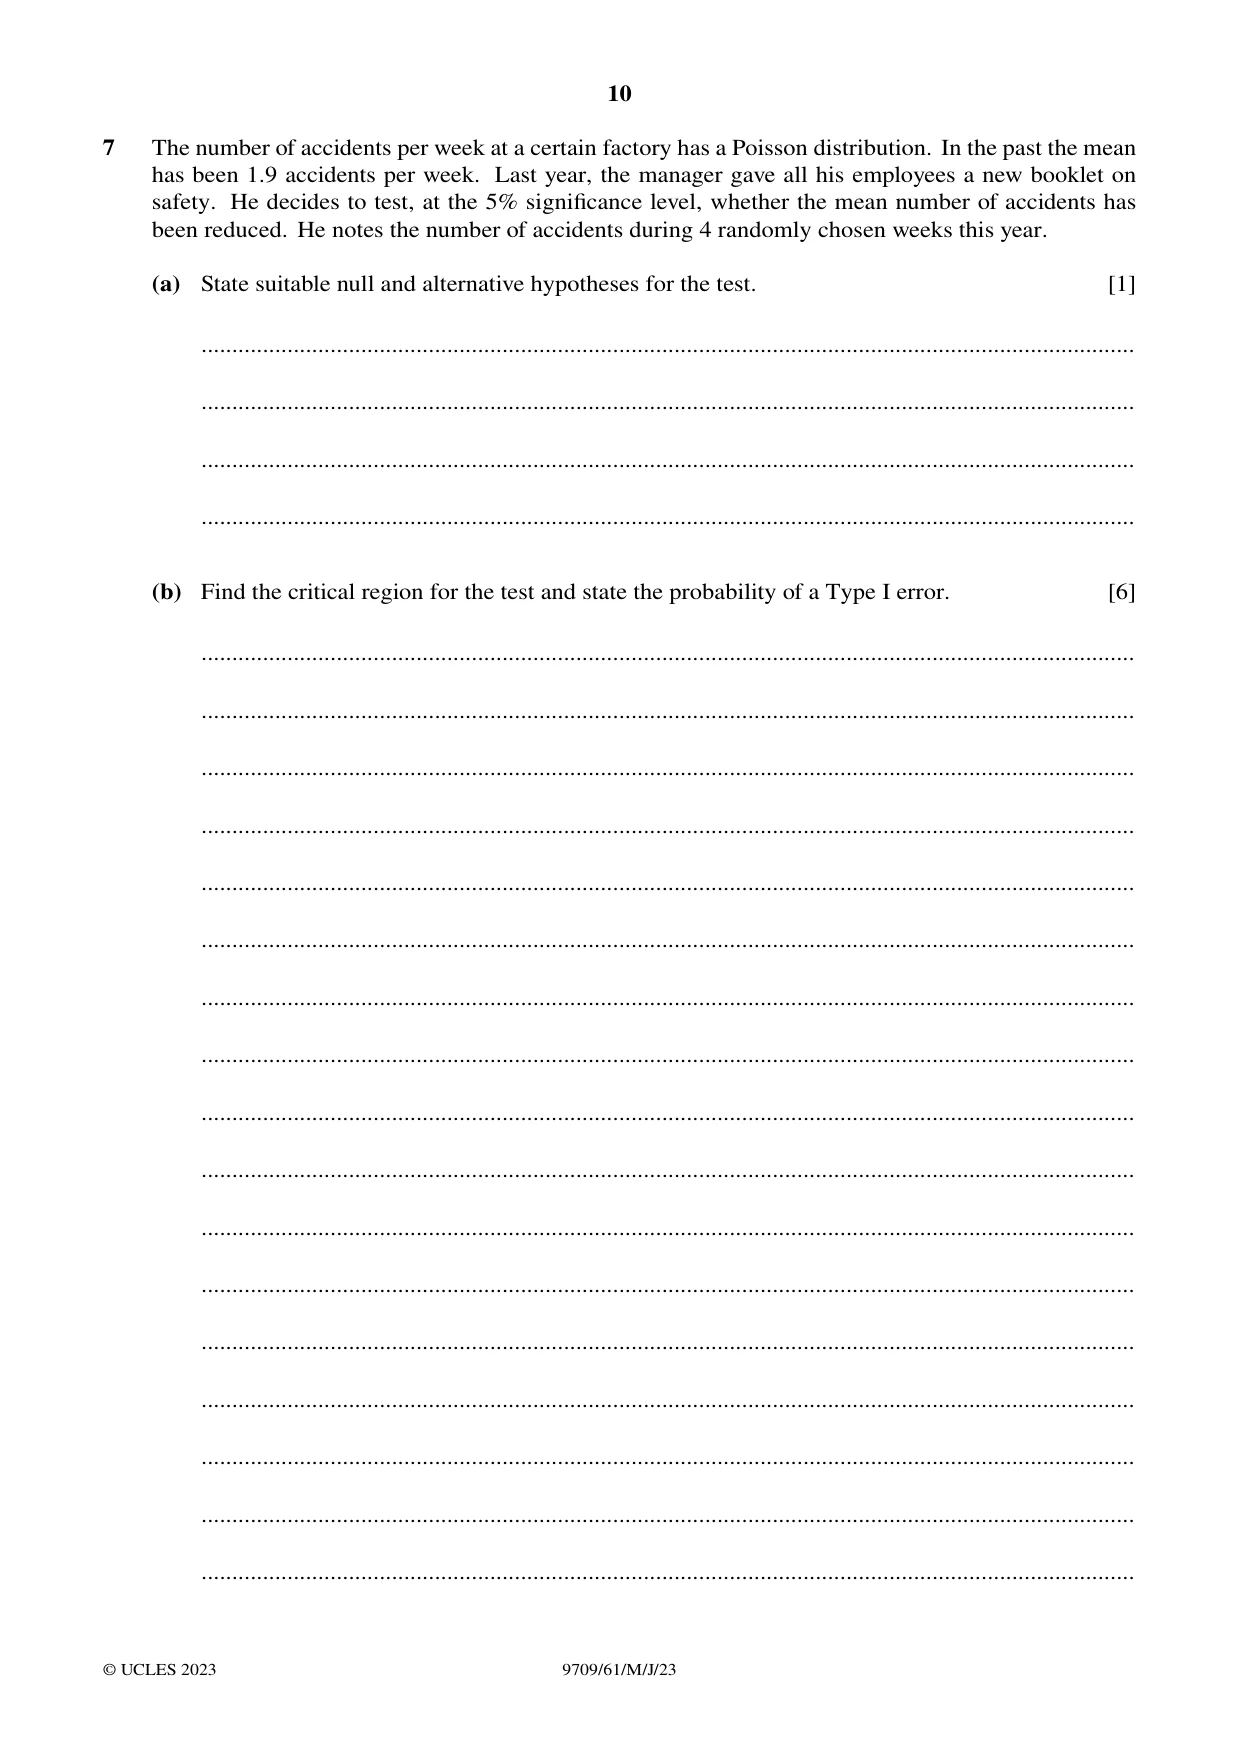
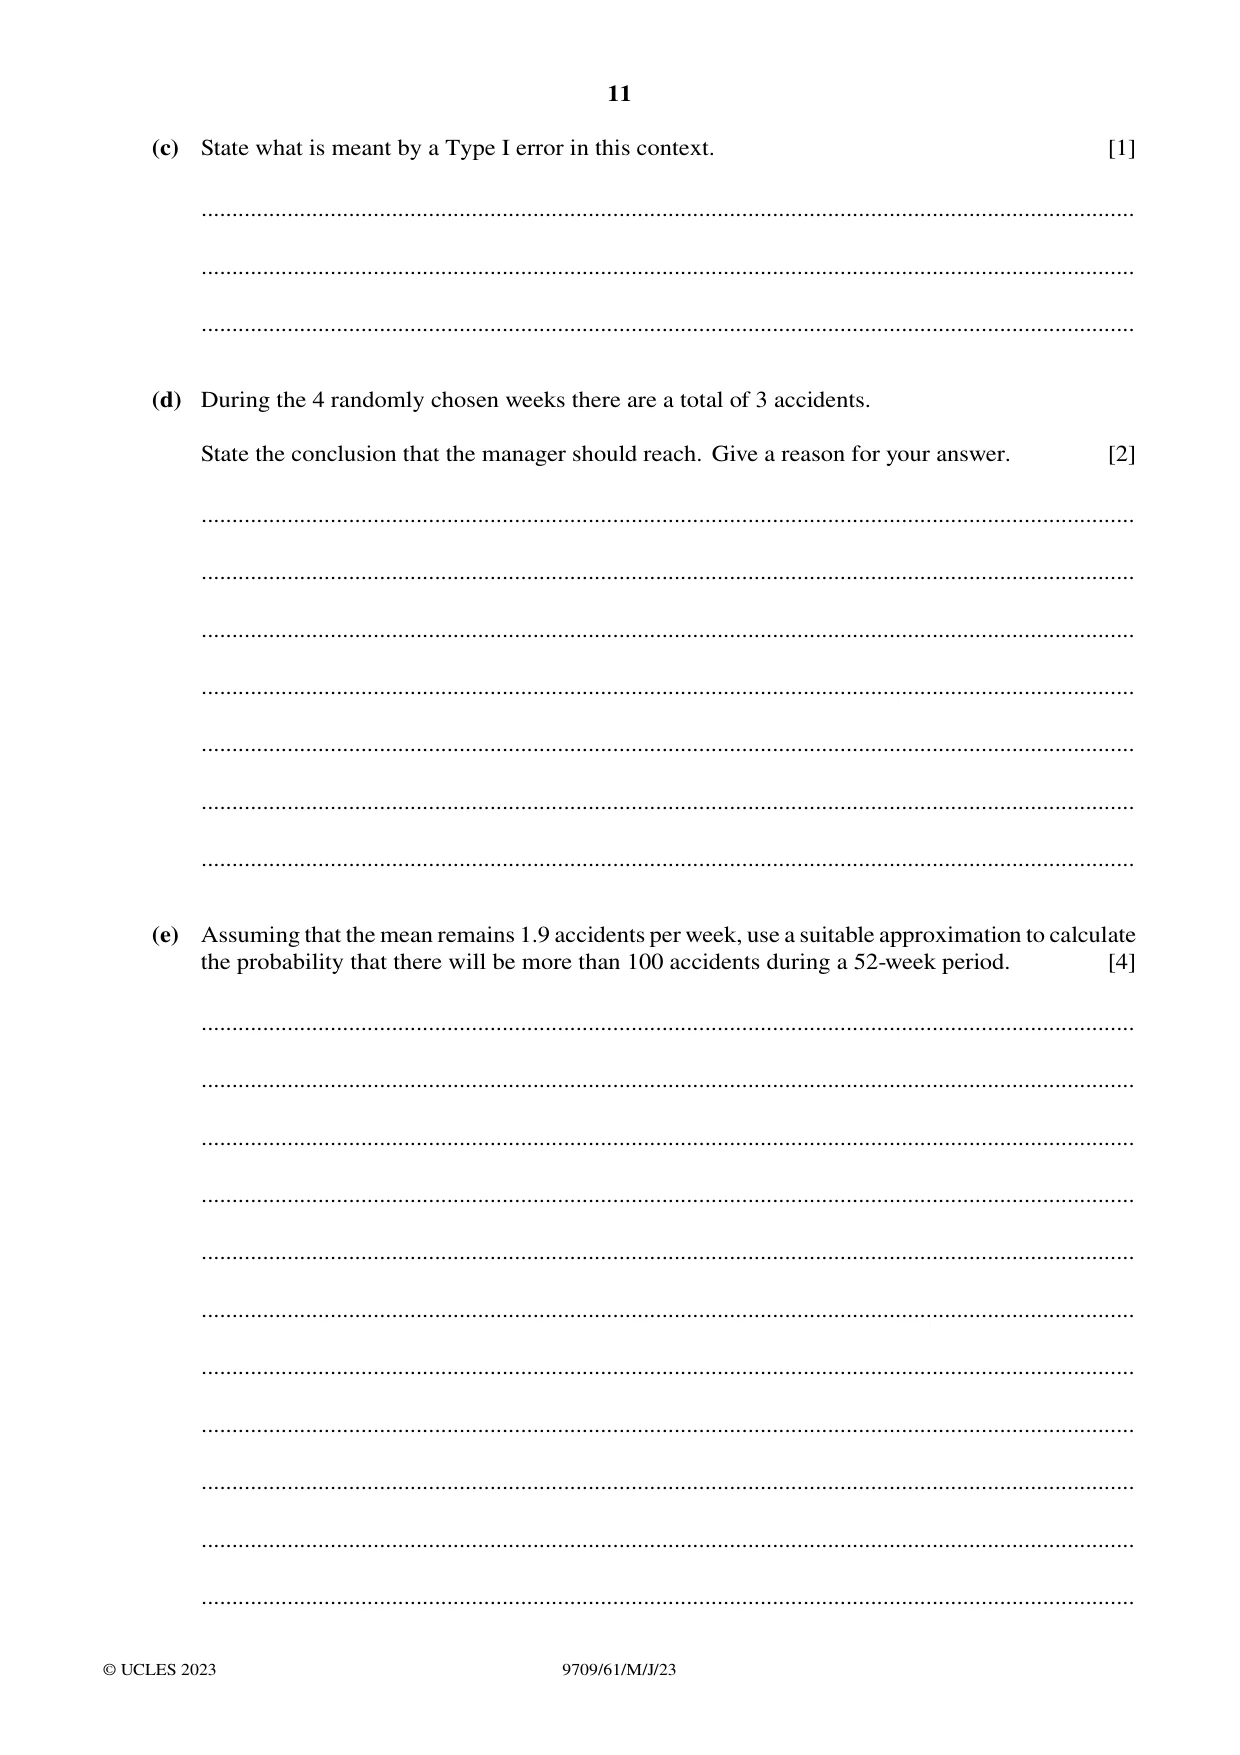
7 The number of accidents per week at a certain factory has a Poisson distribution. In the past the mean has been 1.9 accidents per week. Last year, the manager gave all his employees a new booklet on safety. He decides to test, at the 5% significance level, whether the mean number of accidents has been reduced. He notes the number of accidents during 4 randomly chosen weeks this year. (a) State suitable null and alternative hypotheses for the test. [1] ........................................................................................................................................................ ........................................................................................................................................................ ........................................................................................................................................................ ........................................................................................................................................................ (b) Find the critical region for the test and state the probability of a Type I error. [6] ........................................................................................................................................................ ........................................................................................................................................................ ........................................................................................................................................................ ........................................................................................................................................................ ........................................................................................................................................................ ........................................................................................................................................................ ........................................................................................................................................................ ........................................................................................................................................................ ........................................................................................................................................................ ........................................................................................................................................................ ........................................................................................................................................................ ........................................................................................................................................................ ........................................................................................................................................................ ........................................................................................................................................................ ........................................................................................................................................................ ........................................................................................................................................................ ........................................................................................................................................................ (c) State what is meant by a Type I error in this context. [1] ........................................................................................................................................................ ........................................................................................................................................................ ........................................................................................................................................................ (d) During the 4 randomly chosen weeks there are a total of 3 accidents. State the conclusion that the manager should reach. Give a reason for your answer. [2] ........................................................................................................................................................ ........................................................................................................................................................ ........................................................................................................................................................ ........................................................................................................................................................ ........................................................................................................................................................ ........................................................................................................................................................ ........................................................................................................................................................ (e) Assuming that the mean remains 1.9 accidents per week, use a suitable approximation to calculate the probability that there will be more than 100 accidents during a 52-week period. [4] ........................................................................................................................................................ ........................................................................................................................................................ ........................................................................................................................................................ ........................................................................................................................................................ ........................................................................................................................................................ ........................................................................................................................................................ ........................................................................................................................................................ ........................................................................................................................................................ ........................................................................................................................................................ ........................................................................................................................................................ ........................................................................................................................................................
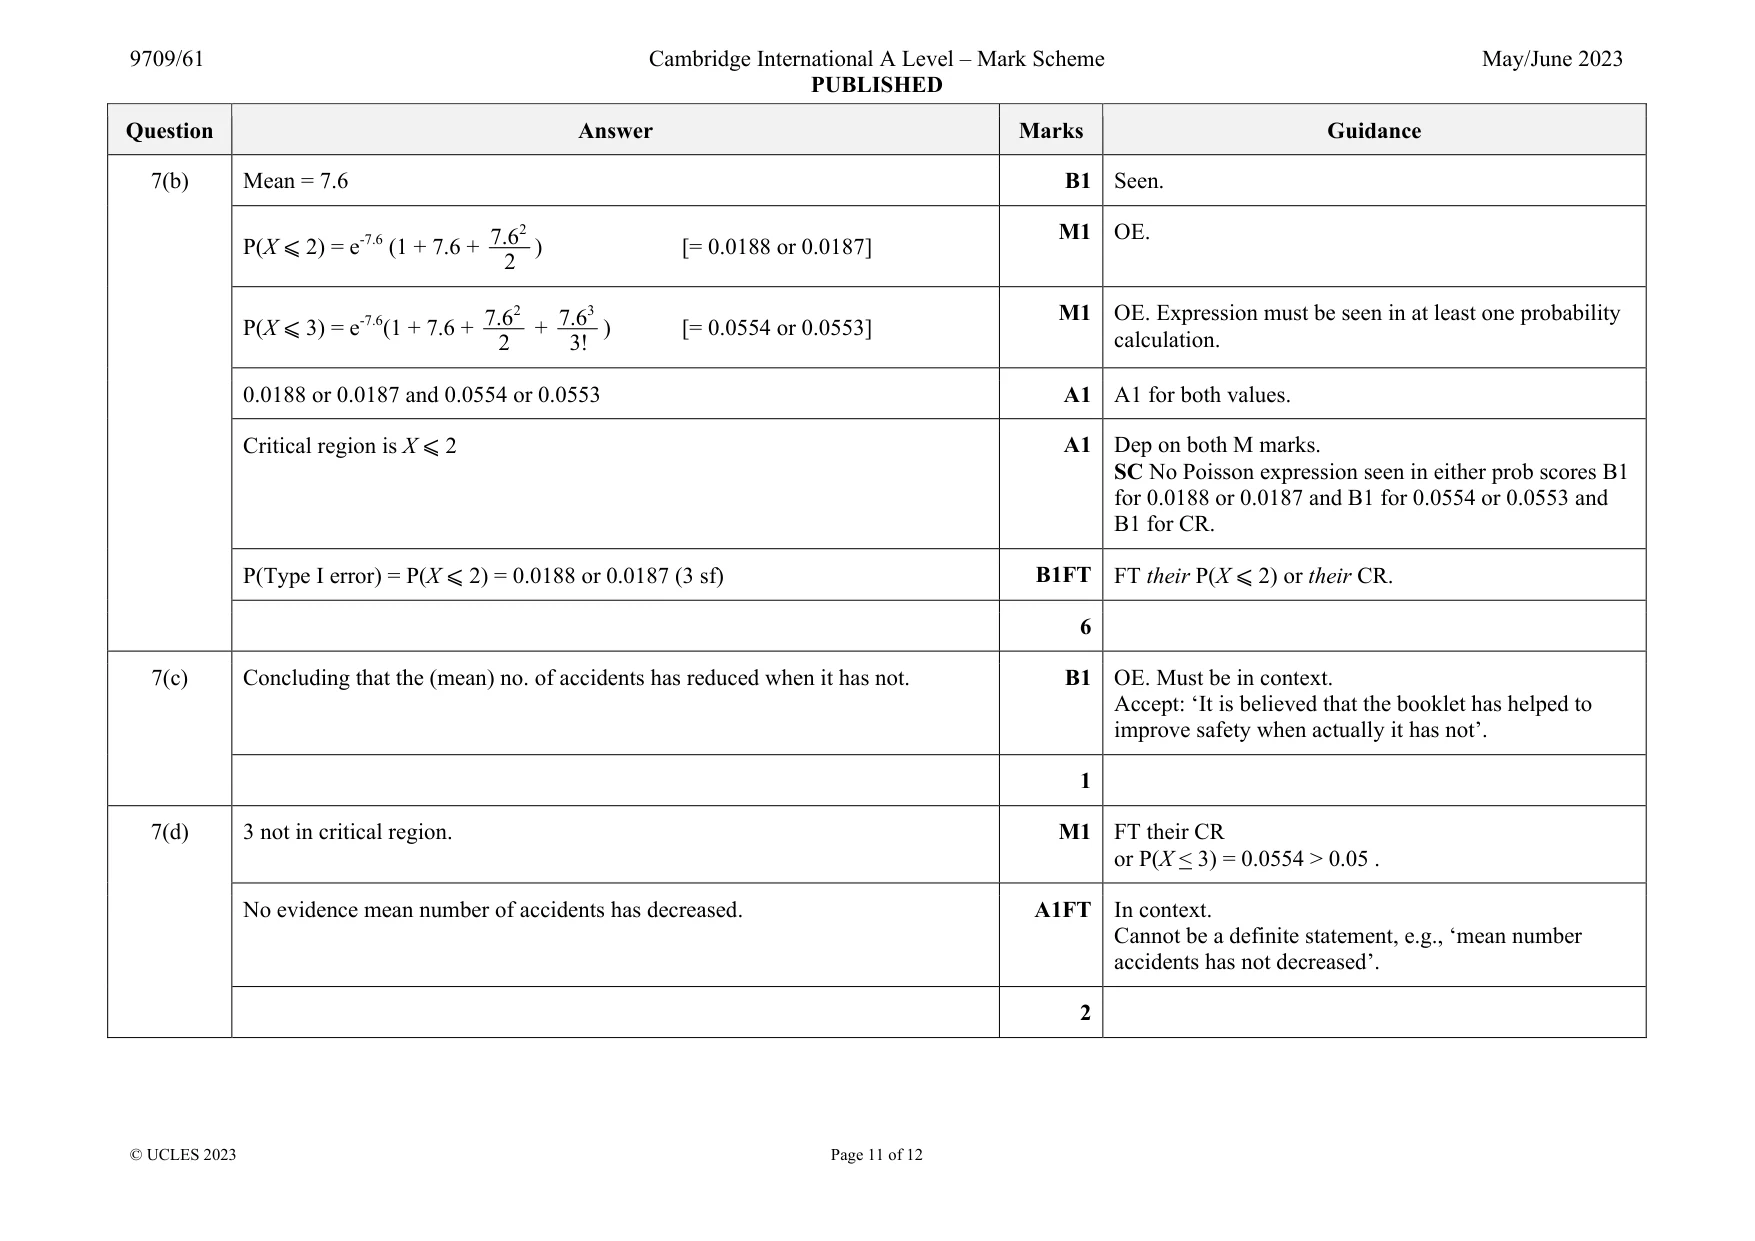
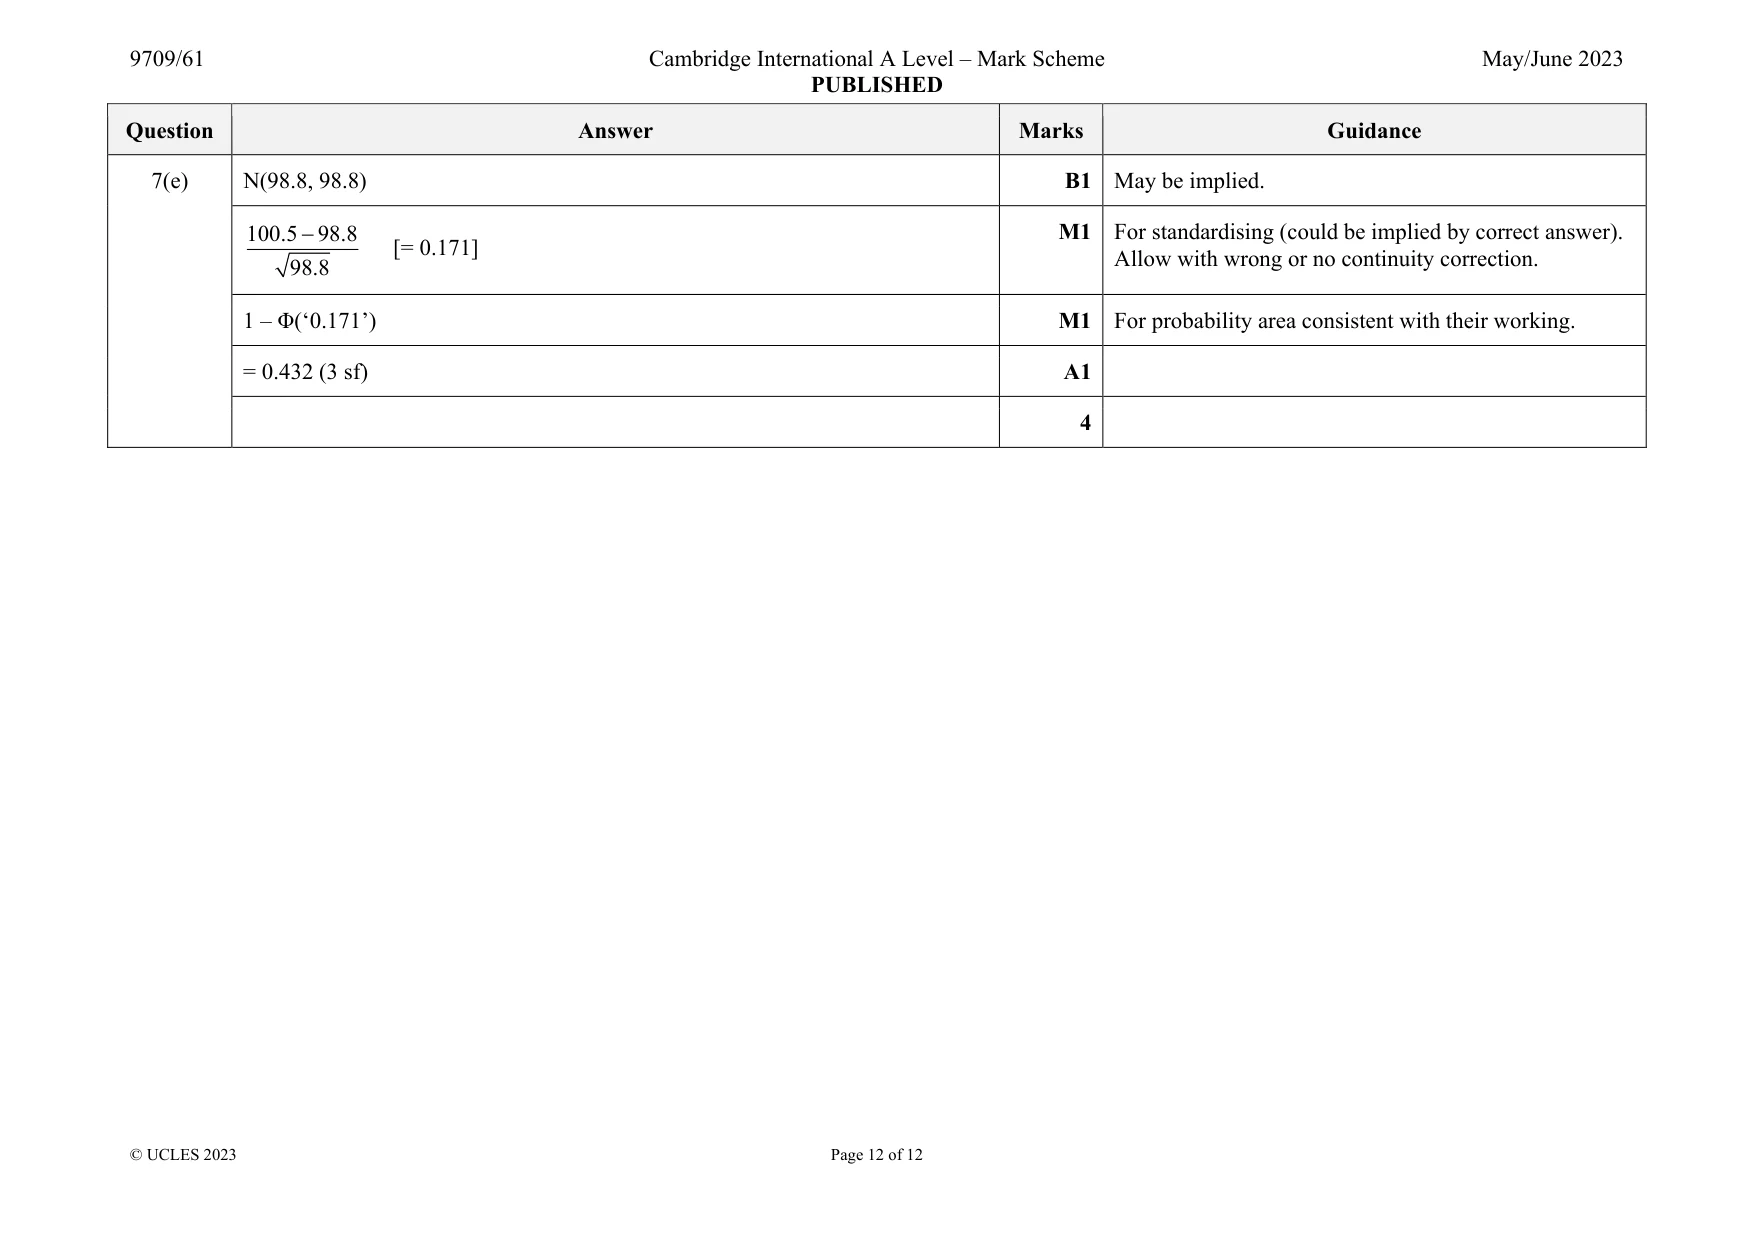
Mark scheme: 7(a) H0: λ = 7.6 [or 1.9] H1: λ < 7.6 [or 1.9] B1 Or Population mean = 7.6 or µ (not just ‘mean’). Or Population mean < 7.6 or µ. 1 Question Answer Marks Guidance 7(b) Mean = 7.6 B1 Seen. P(X ⩽ 2) = e-7.6 (1 + 7.6 + 2 7.6 2 ) [= 0.0188 or 0.0187] M1 OE. P(X ⩽ 3) = e-7.6(1 + 7.6 + 2 7.6 2 + 3 7.6 3! ) [= 0.0554 or 0.0553] M1 OE. Expression must be seen in at least one probability calculation. 0.0188 or 0.0187 and 0.0554 or 0.0553 A1 A1 for both values. Critical region is X ⩽ 2 A1 Dep on both M marks. SC No Poisson expression seen in either prob scores B1 for 0.0188 or 0.0187 and B1 for 0.0554 or 0.0553 and B1 for CR. P(Type I error) = P(X ⩽ 2) = 0.0188 or 0.0187 (3 sf) B1FT FT their P(X ⩽ 2) or their CR. 6 7(c) Concluding that the (mean) no. of accidents has reduced when it has not. B1 OE. Must be in context. Accept: ‘It is believed that the booklet has helped to improve safety when actually it has not’. 1 7(d) 3 not in critical region. M1 FT their CR or P(X < 3) = 0.0554 > 0.05 . No evidence mean number of accidents has decreased. A1FT In context. Cannot be a definite statement, e.g., ‘mean number accidents has not decreased’. 2 Question Answer Marks Guidance 7(e) N(98.8, 98.8) B1 May be implied. 100.5 98.8 98.8 [= 0.171] M1 For standardising (could be implied by correct answer). Allow with wrong or no continuity correction. 1 – Φ(‘0.171’) M1 For probability area consistent with their working. = 0.432 (3 sf) A1 4
What was in this paper
The subtopics covered by these 6 questions, and how many questions each got. Open one in a new tab to see every Cambridge question on it.
What you needed in this session
Cambridge’s own grade thresholds for 2023 May/June, Paper 6 · Variant 1. A higher threshold means an easier paper — the bar moves with how the cohort did.