Cambridge A Level Mathematics 9709 — 2020 Oct/Nov Paper 6 · Variant 3
9709/63/O/N/20 · 4 questions · 50 marks · ≈56 min
The question paper and its mark scheme, free to read here and free to download. This is Cambridge’s own paper, exactly as it was sat.
Question paper12 pages

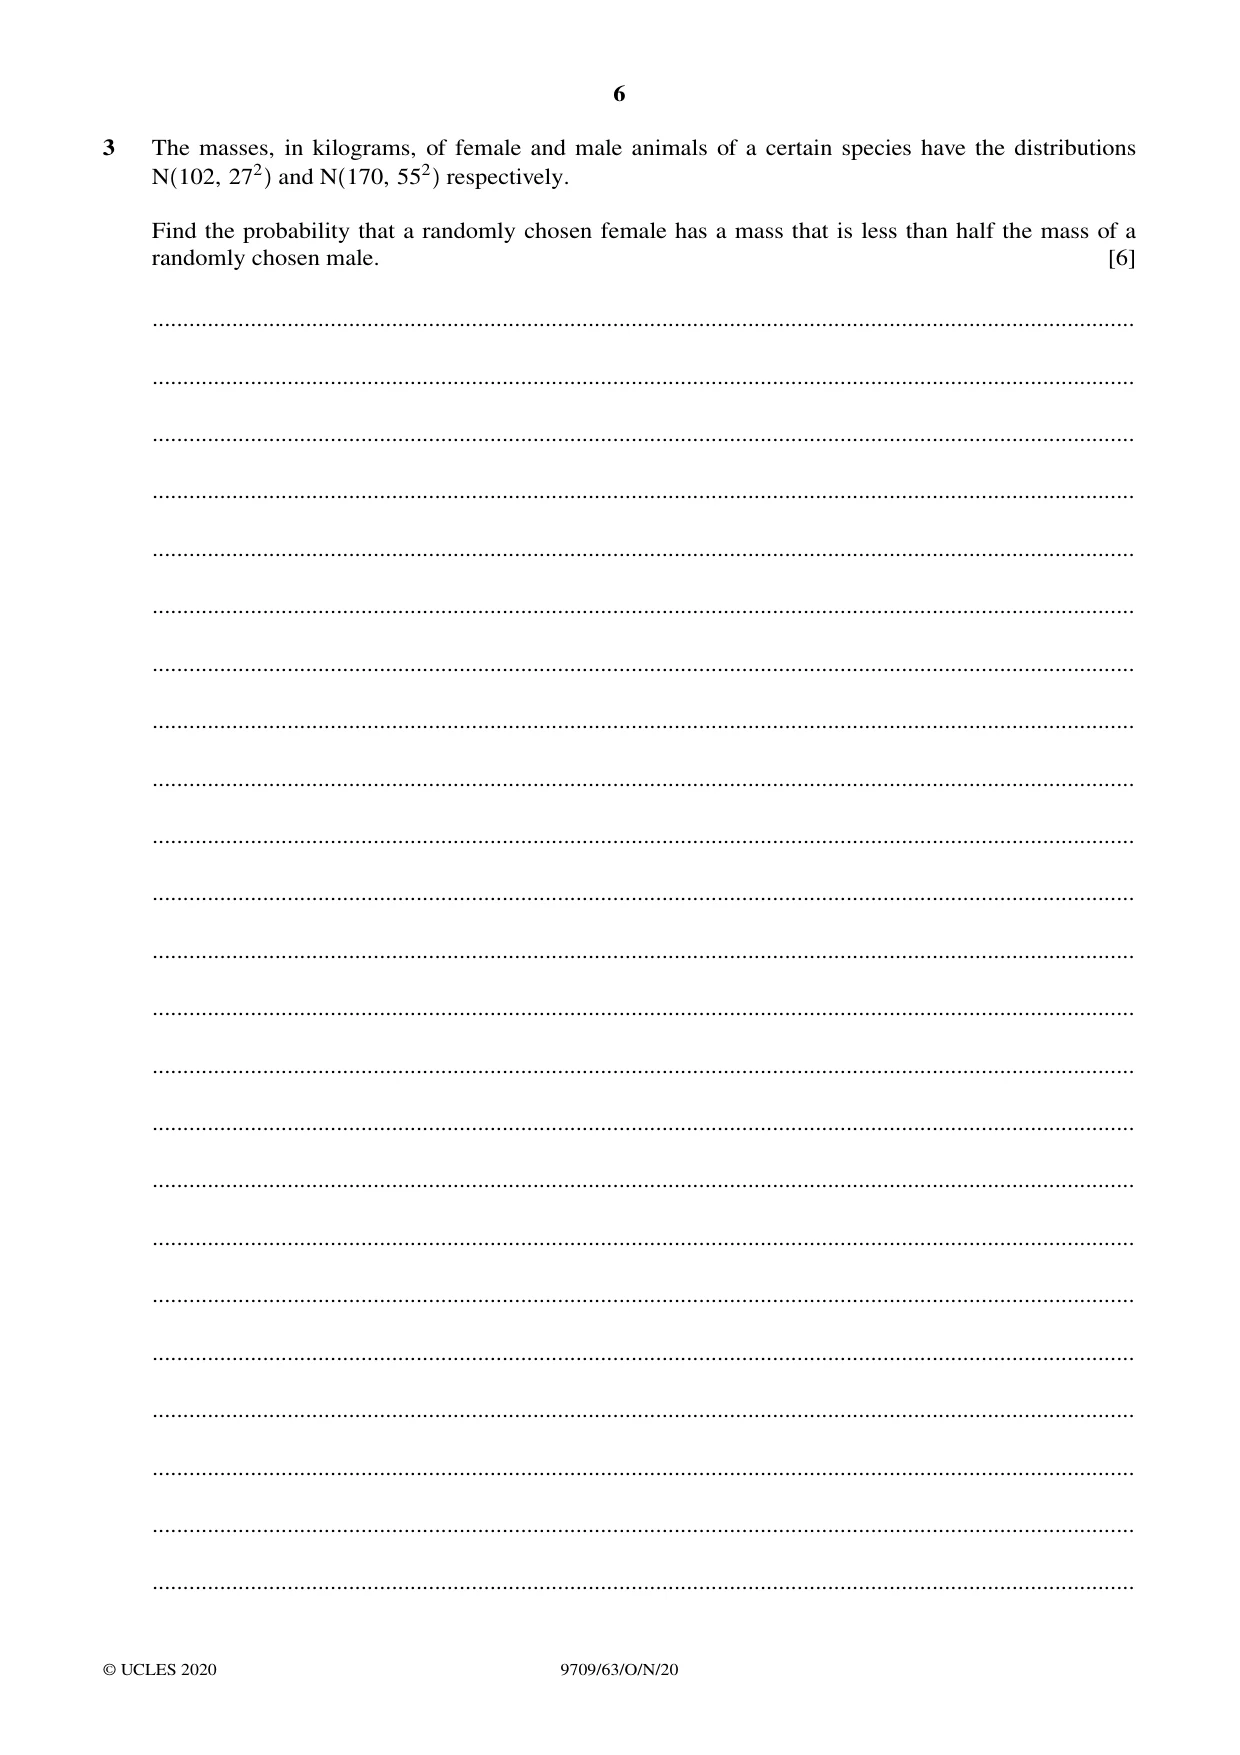
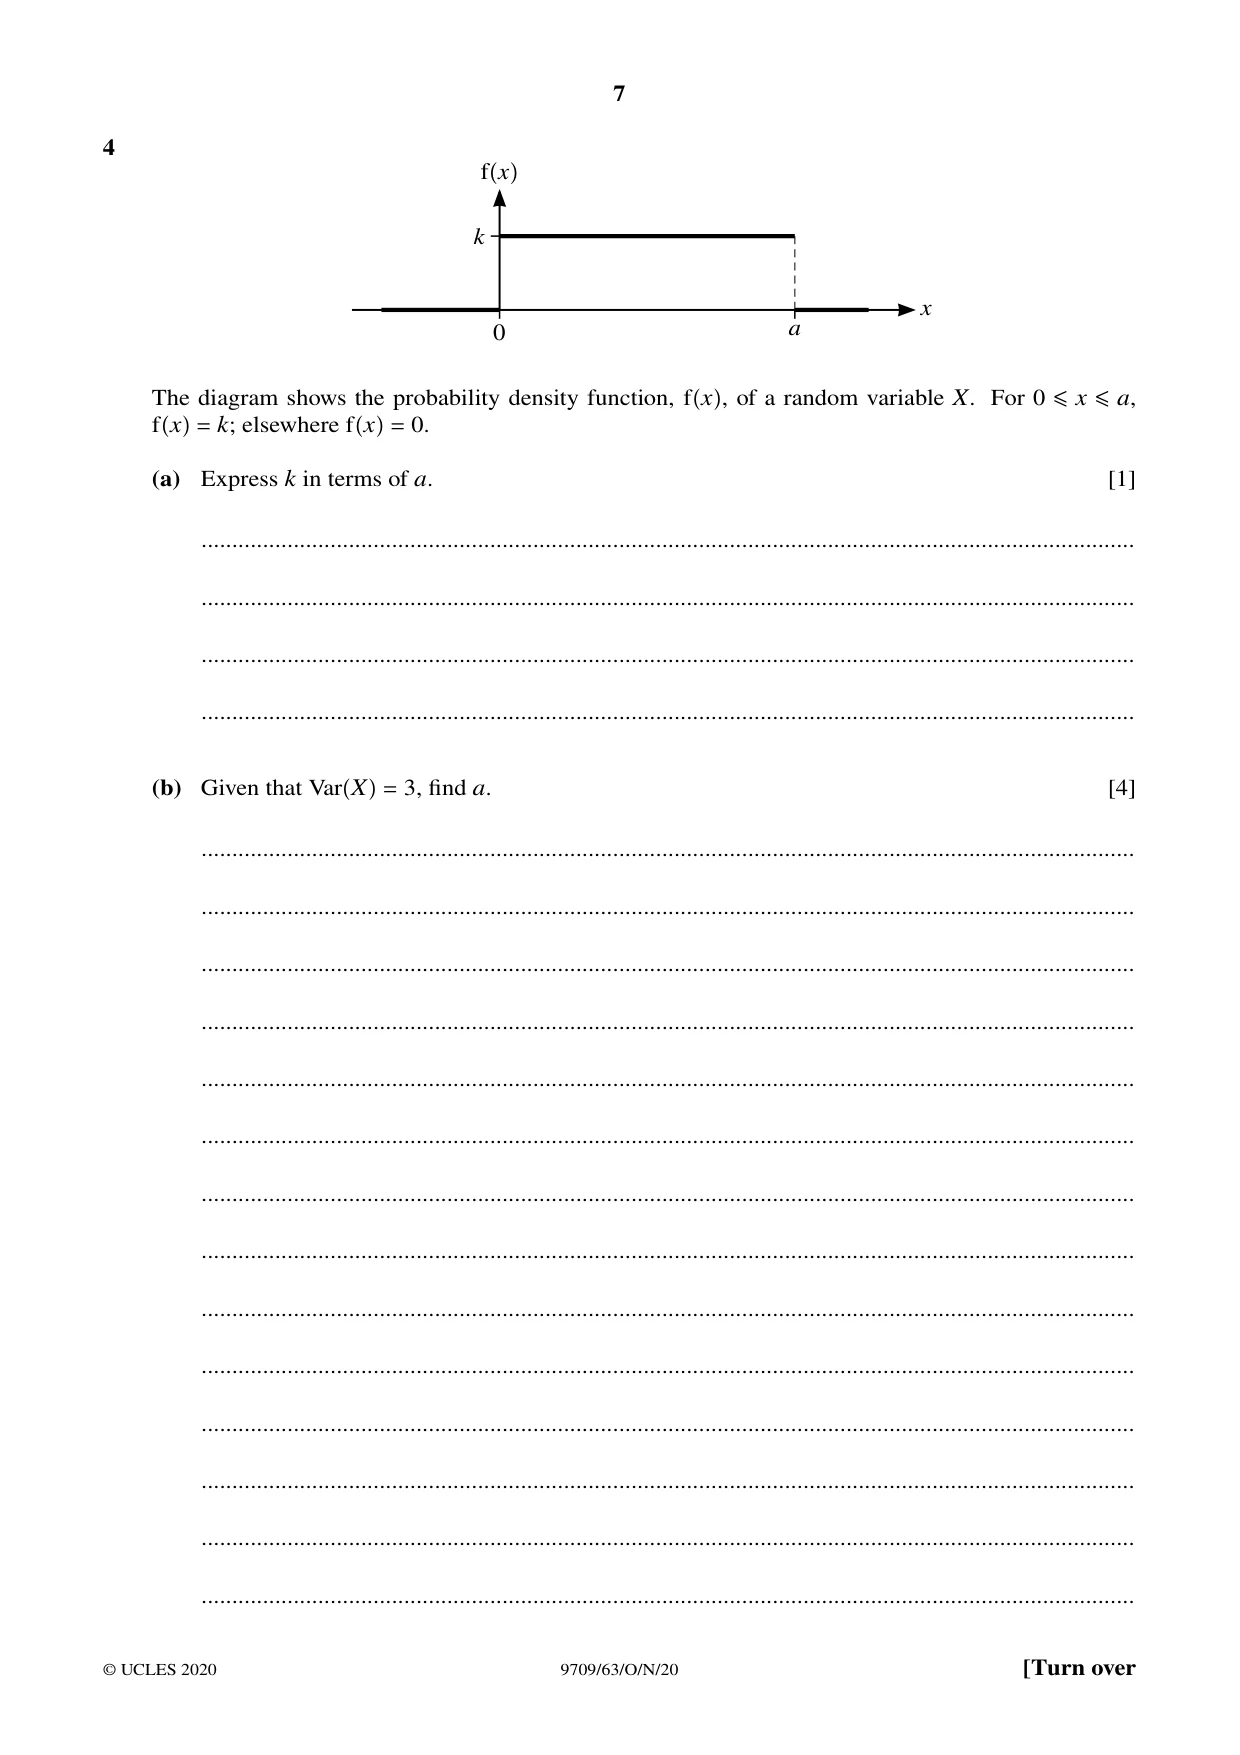
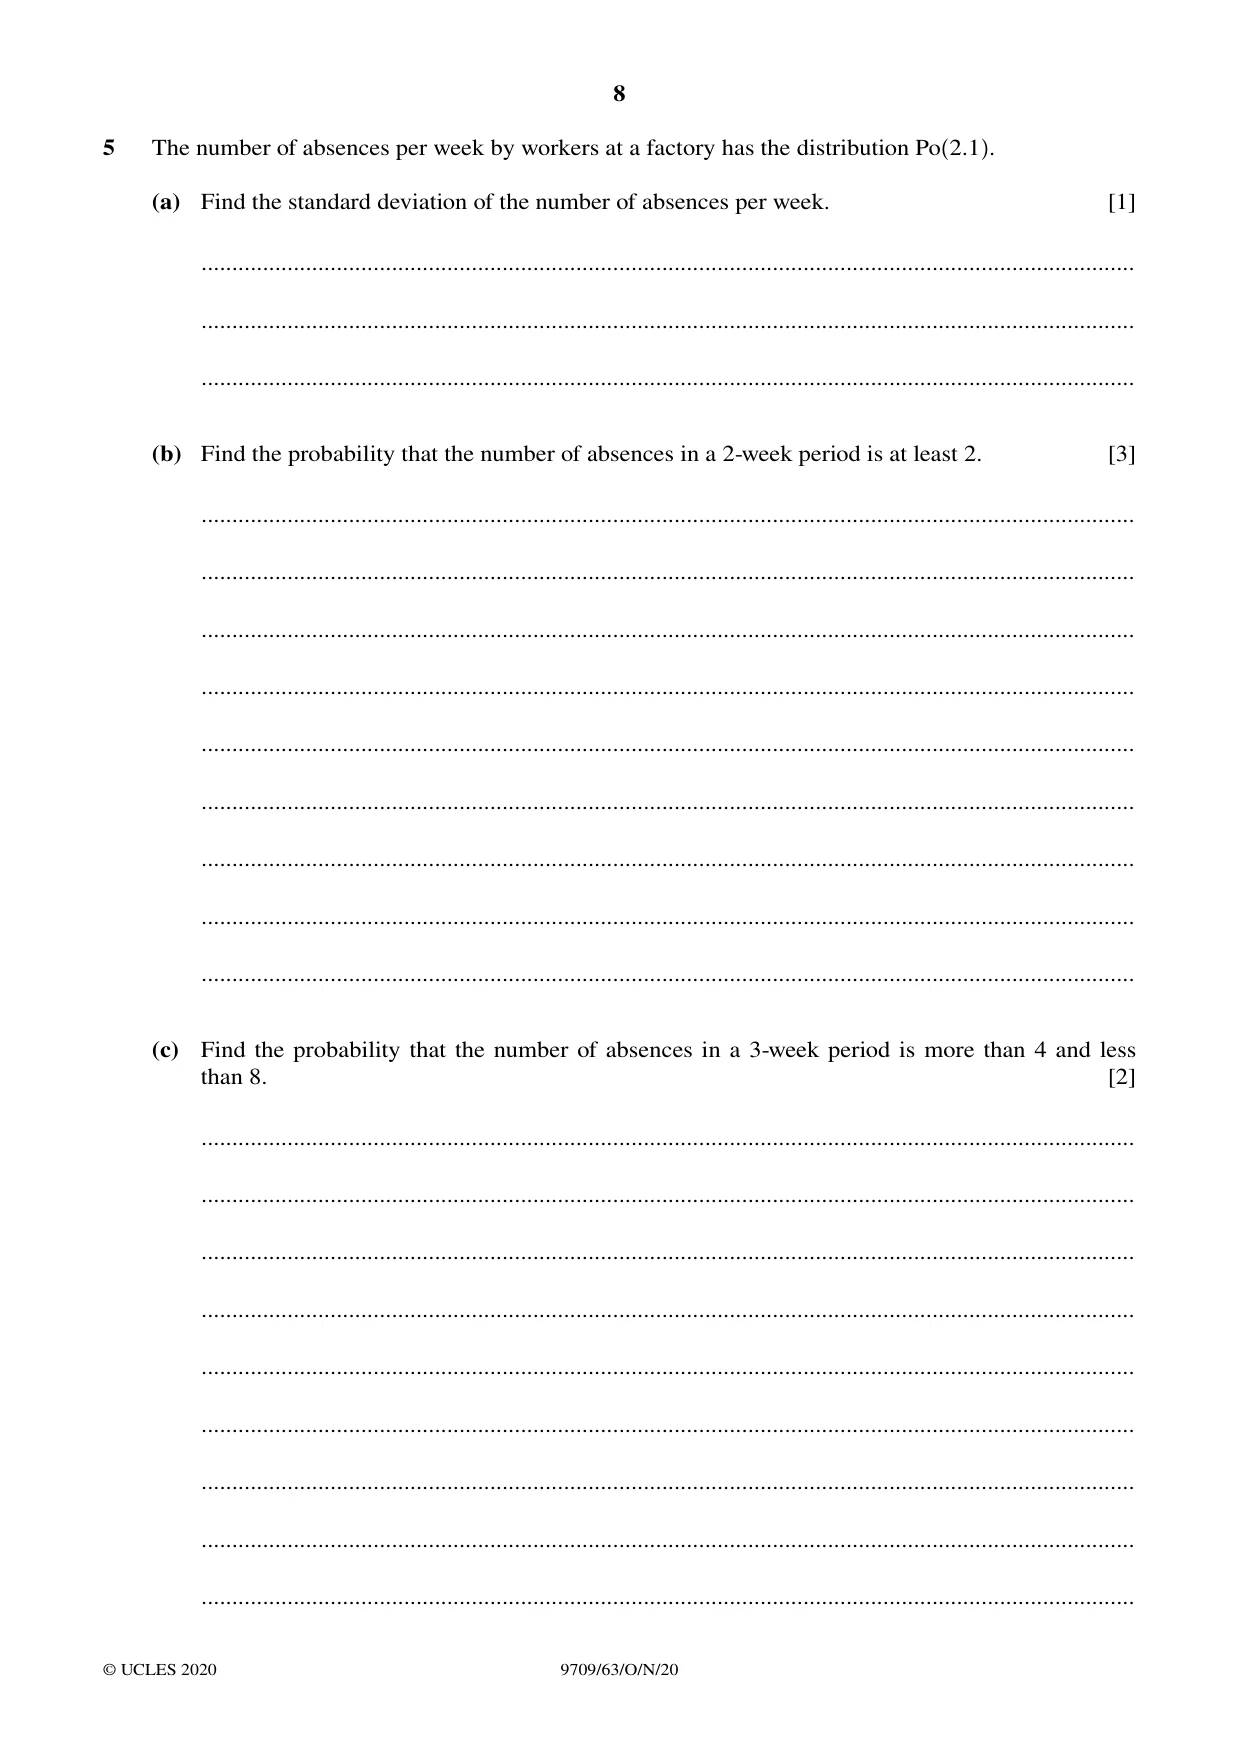
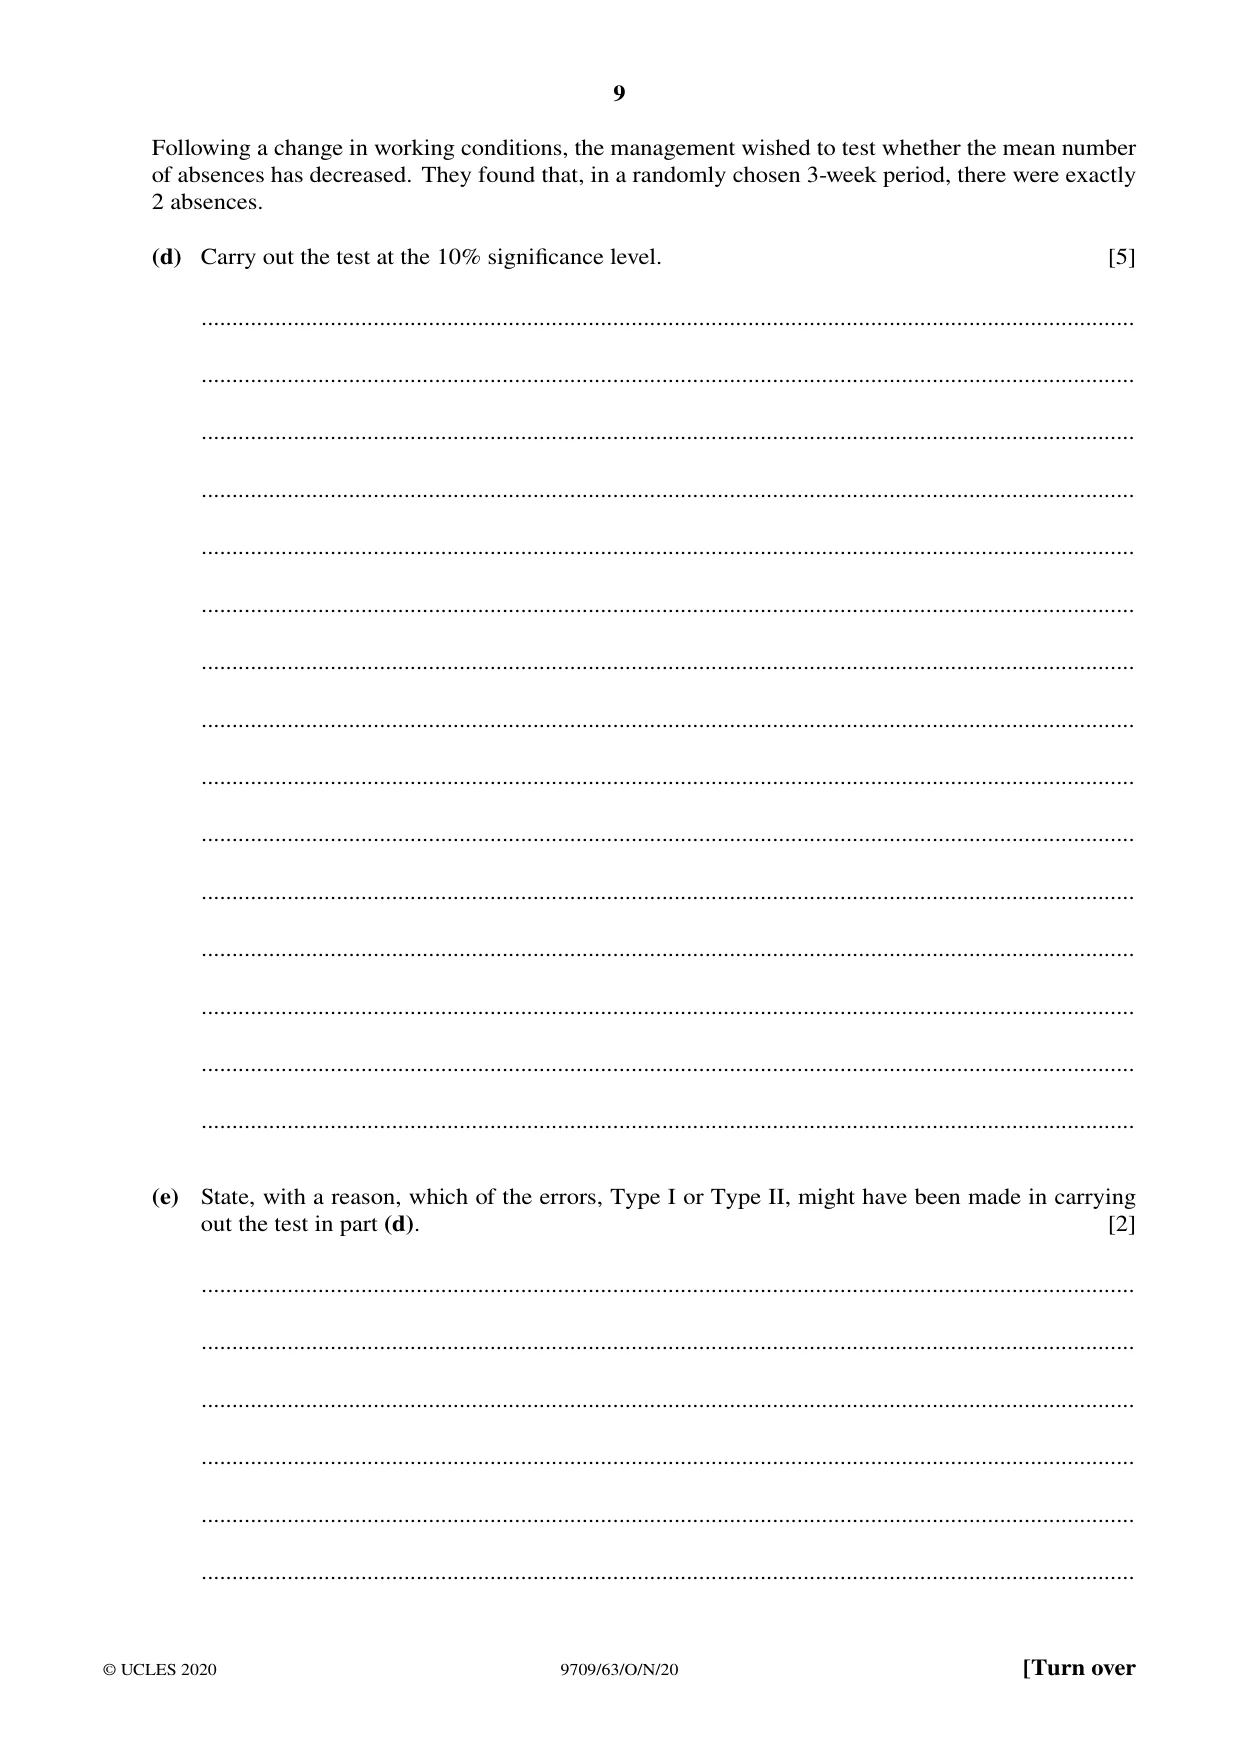
Mark scheme13 pages
Answers below. Sit the paper first if you are practising.
Questions as text
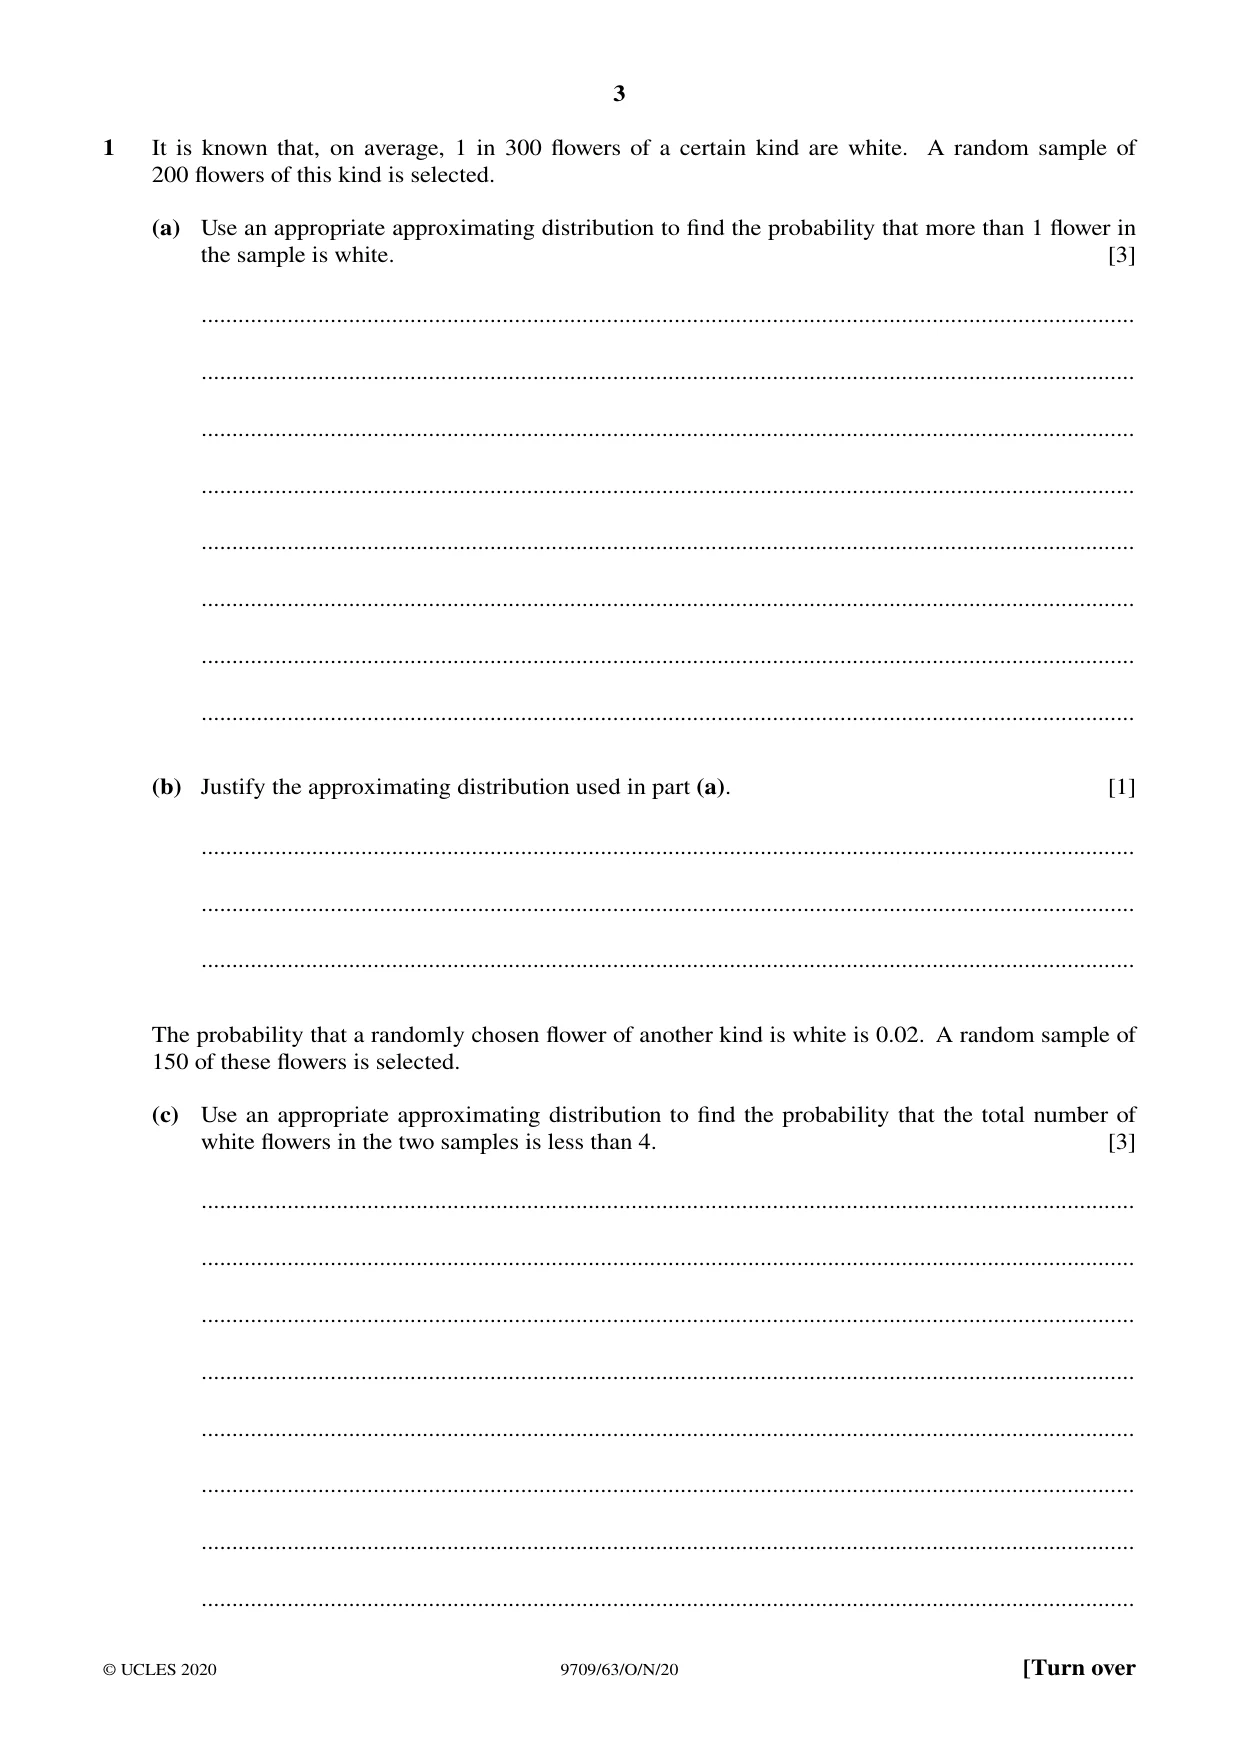
Q1 · It is known that, on average, 1 in 300 flowers of a certain kind are white
1 It is known that, on average, 1 in 300 flowers of a certain kind are white. A random sample of 200 flowers of this kind is selected. (a) Use an appropriate approximating distribution to find the probability that more than 1 flower in the sample is white. [3] ........................................................................................................................................................ ........................................................................................................................................................ ........................................................................................................................................................ ........................................................................................................................................................ ........................................................................................................................................................ ........................................................................................................................................................ ........................................................................................................................................................ ........................................................................................................................................................ (b) Justify the approximating distribution used in part (a). [1] ........................................................................................................................................................ ........................................................................................................................................................ ........................................................................................................................................................ The probability that a randomly chosen flower of another kind is white is 0.02. A random sample of 150 of these flowers is selected. (c) Use an appropriate approximating distribution to find the probability that the total number of white flowers in the two samples is less than 4. [3] ........................................................................................................................................................ ........................................................................................................................................................ ........................................................................................................................................................ ........................................................................................................................................................ ........................................................................................................................................................ ........................................................................................................................................................ ........................................................................................................................................................ ........................................................................................................................................................
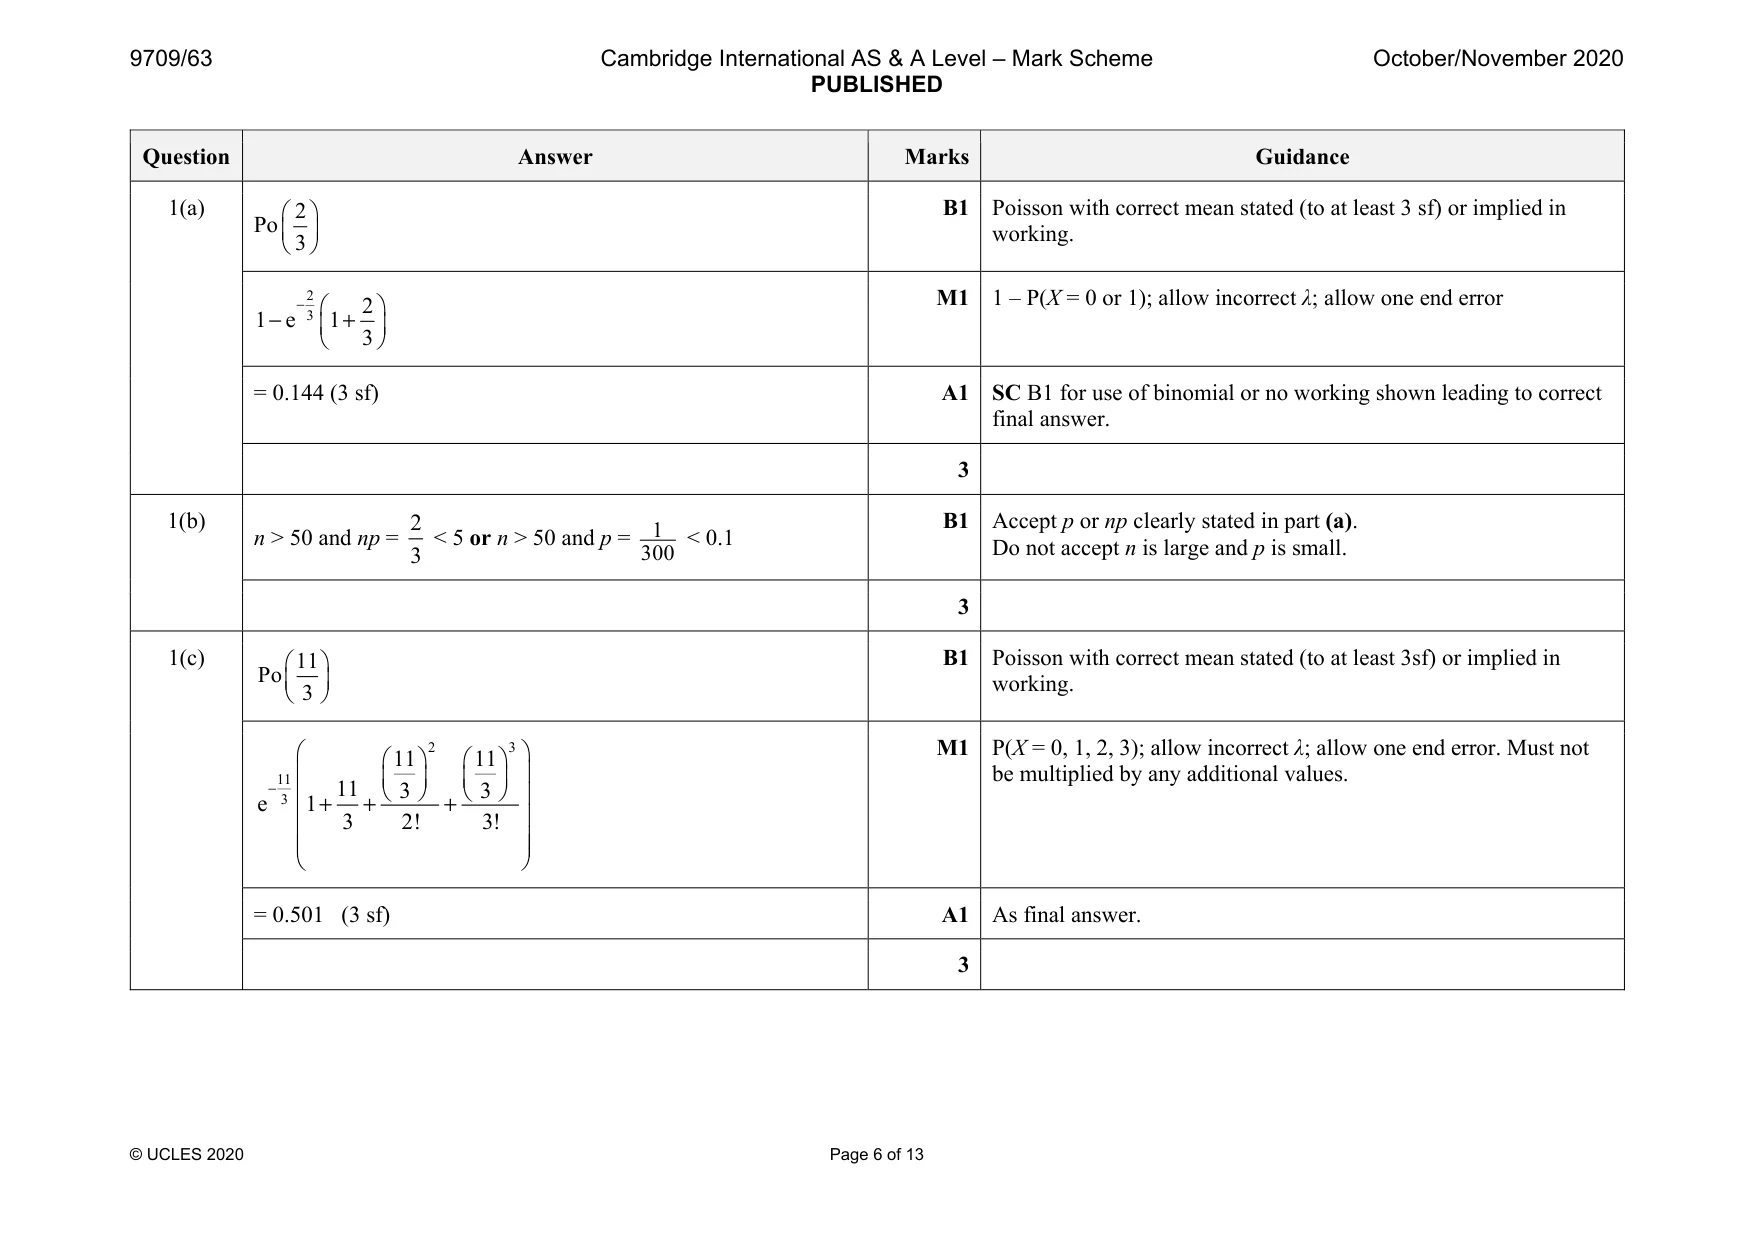
Mark scheme: 1(a) Po 2 3 B1 Poisson with correct mean stated (to at least 3 sf) or implied in working. 2 3 2 1 e 1 3 − − + M1 1 – P(X = 0 or 1); allow incorrect λ; allow one end error = 0.144 (3 sf) A1 SC B1 for use of binomial or no working shown leading to correct final answer. 3 1(b) n > 50 and np = 2 3 < 5 or n > 50 and p = 1 300 < 0.1 B1 Accept p or np clearly stated in part (a). Do not accept n is large and p is small. 3 1(c) 11 Po 3 B1 Poisson with correct mean stated (to at least 3sf) or implied in working. 2 3 11 3 11 11 11 3 3 e 1 3 2! 3! − + + + M1 P(X = 0, 1, 2, 3); allow incorrect λ; allow one end error. Must not be multiplied by any additional values. = 0.501 (3 sf) A1 As final answer. 3
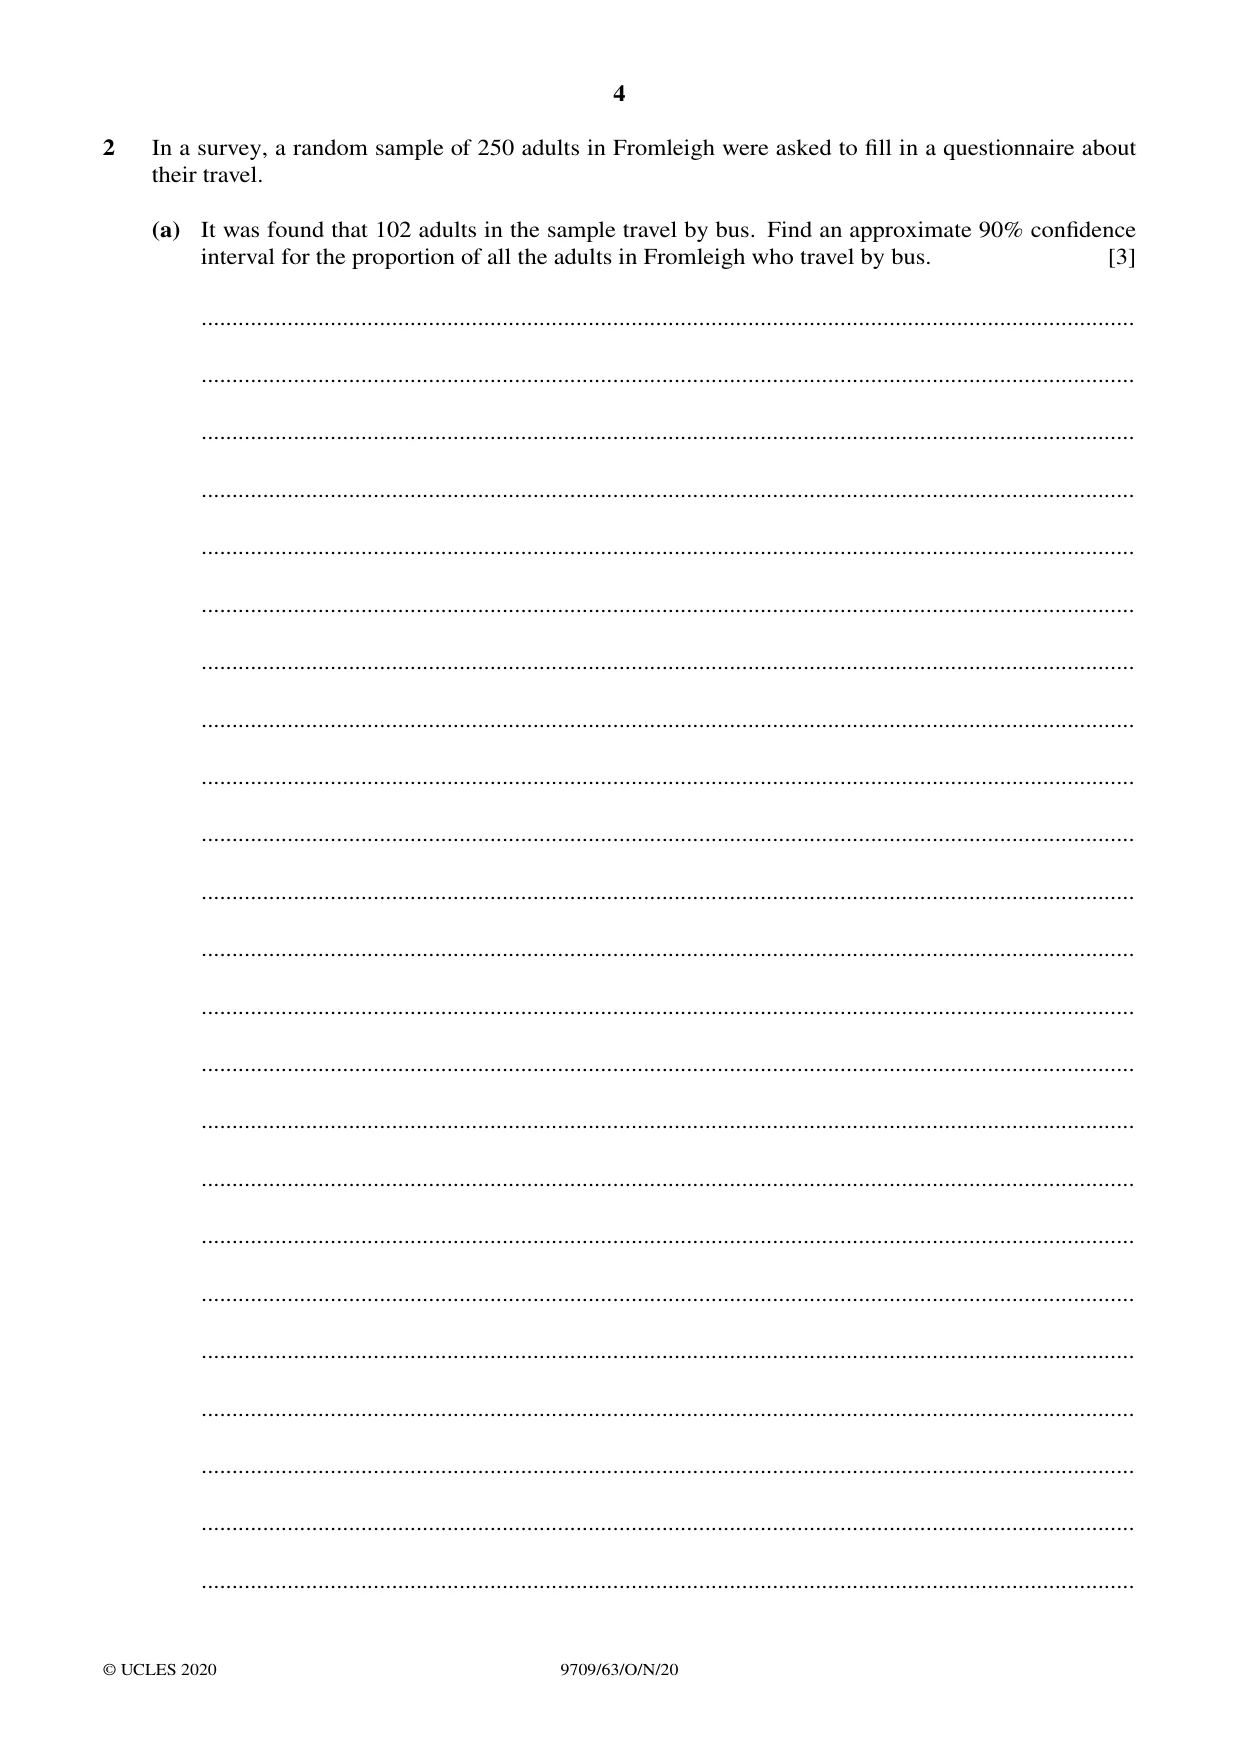
Q2 · In a survey, a random sample of 250 adults in Fromleigh were asked to fill in a…
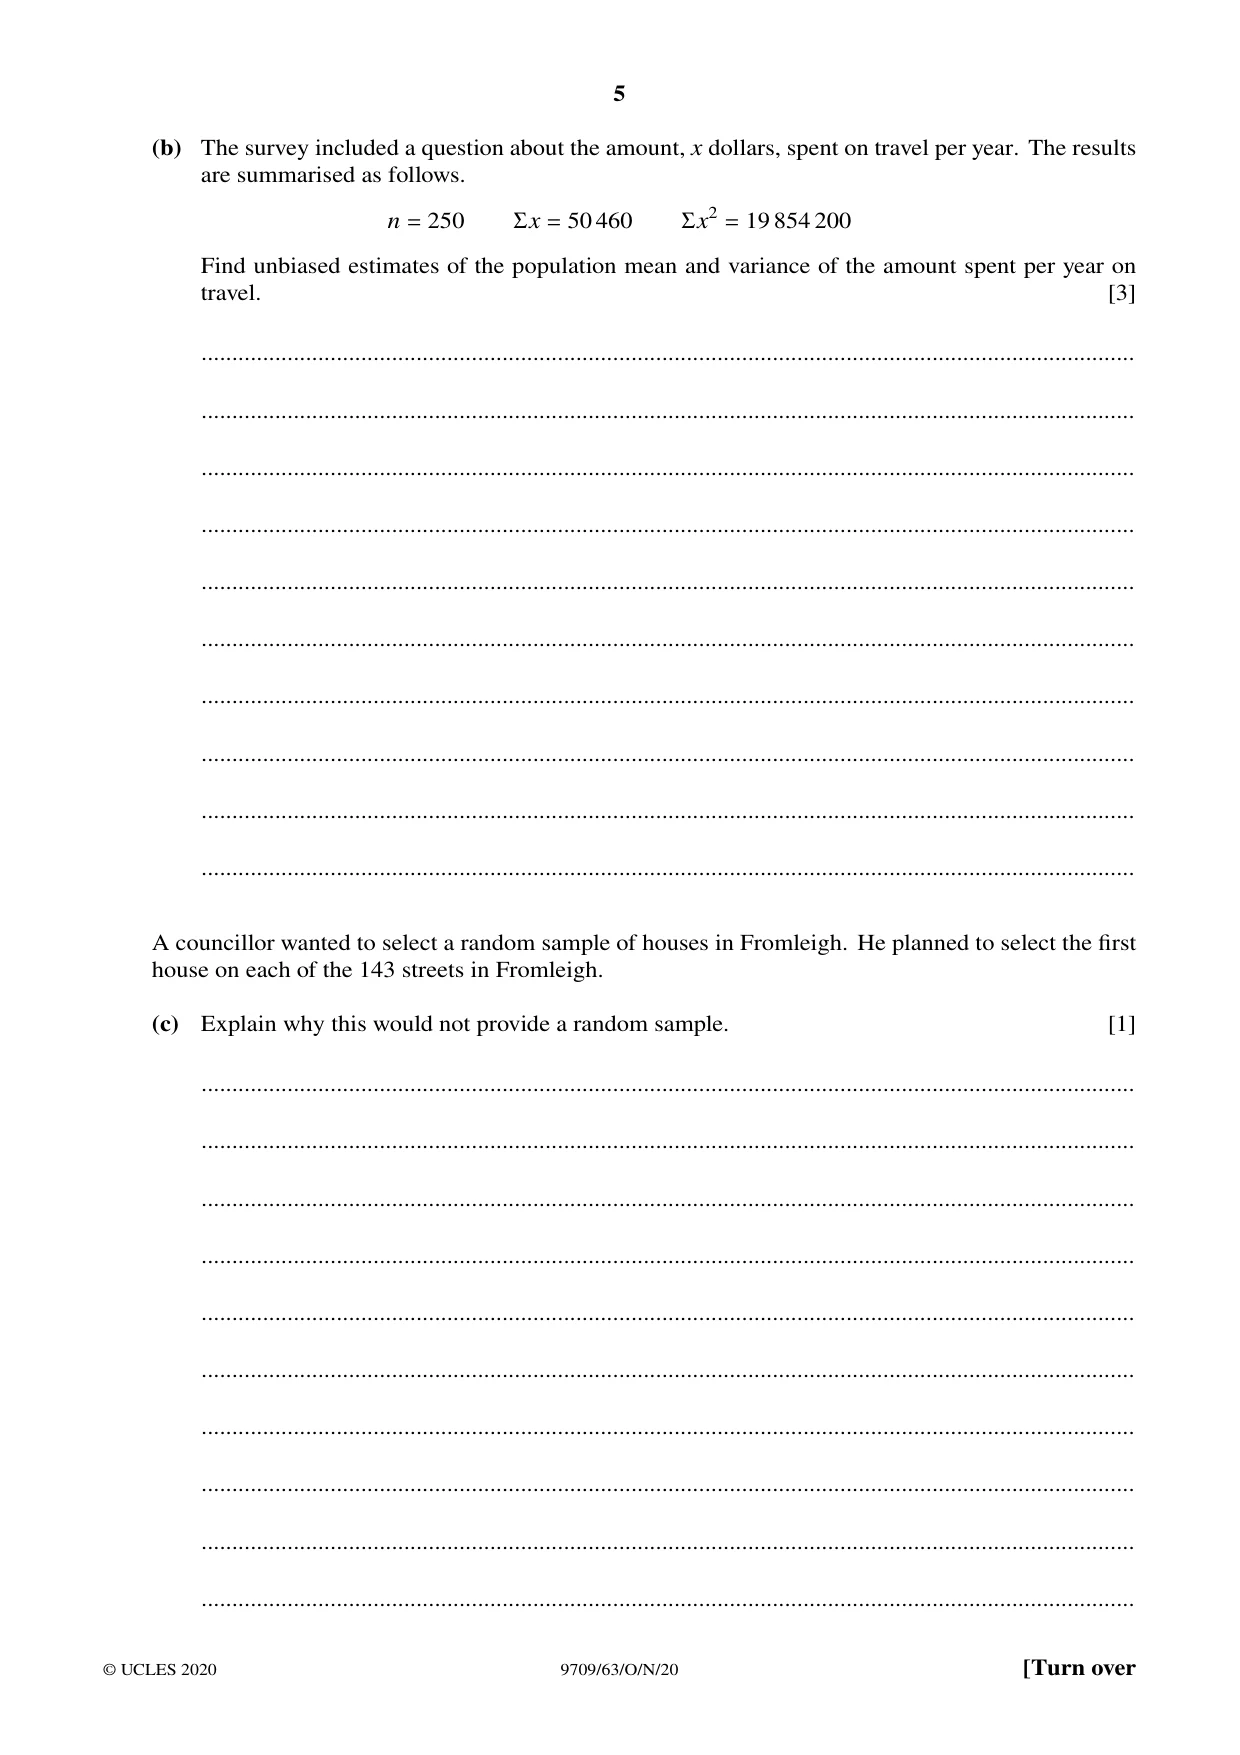
2 In a survey, a random sample of 250 adults in Fromleigh were asked to fill in a questionnaire about their travel. (a) It was found that 102 adults in the sample travel by bus. Find an approximate 90% confidence interval for the proportion of all the adults in Fromleigh who travel by bus. [3] ........................................................................................................................................................ ........................................................................................................................................................ ........................................................................................................................................................ ........................................................................................................................................................ ........................................................................................................................................................ ........................................................................................................................................................ ........................................................................................................................................................ ........................................................................................................................................................ ........................................................................................................................................................ ........................................................................................................................................................ ........................................................................................................................................................ ........................................................................................................................................................ ........................................................................................................................................................ ........................................................................................................................................................ ........................................................................................................................................................ ........................................................................................................................................................ ........................................................................................................................................................ ........................................................................................................................................................ ........................................................................................................................................................ ........................................................................................................................................................ ........................................................................................................................................................ ........................................................................................................................................................ ........................................................................................................................................................ (b) The survey included a question about the amount, x dollars, spent on travel per year. The results are summarised as follows. n = 250 Σx = 50 460 Σx2 = 19 854 200 Find unbiased estimates of the population mean and variance of the amount spent per year on travel. [3] ........................................................................................................................................................ ........................................................................................................................................................ ........................................................................................................................................................ ........................................................................................................................................................ ........................................................................................................................................................ ........................................................................................................................................................ ........................................................................................................................................................ ........................................................................................................................................................ ........................................................................................................................................................ ........................................................................................................................................................ A councillor wanted to select a random sample of houses in Fromleigh. He planned to select the first house on each of the 143 streets in Fromleigh. (c) Explain why this would not provide a random sample. [1] ........................................................................................................................................................ ........................................................................................................................................................ ........................................................................................................................................................ ........................................................................................................................................................ ........................................................................................................................................................ ........................................................................................................................................................ ........................................................................................................................................................ ........................................................................................................................................................ ........................................................................................................................................................ ........................................................................................................................................................
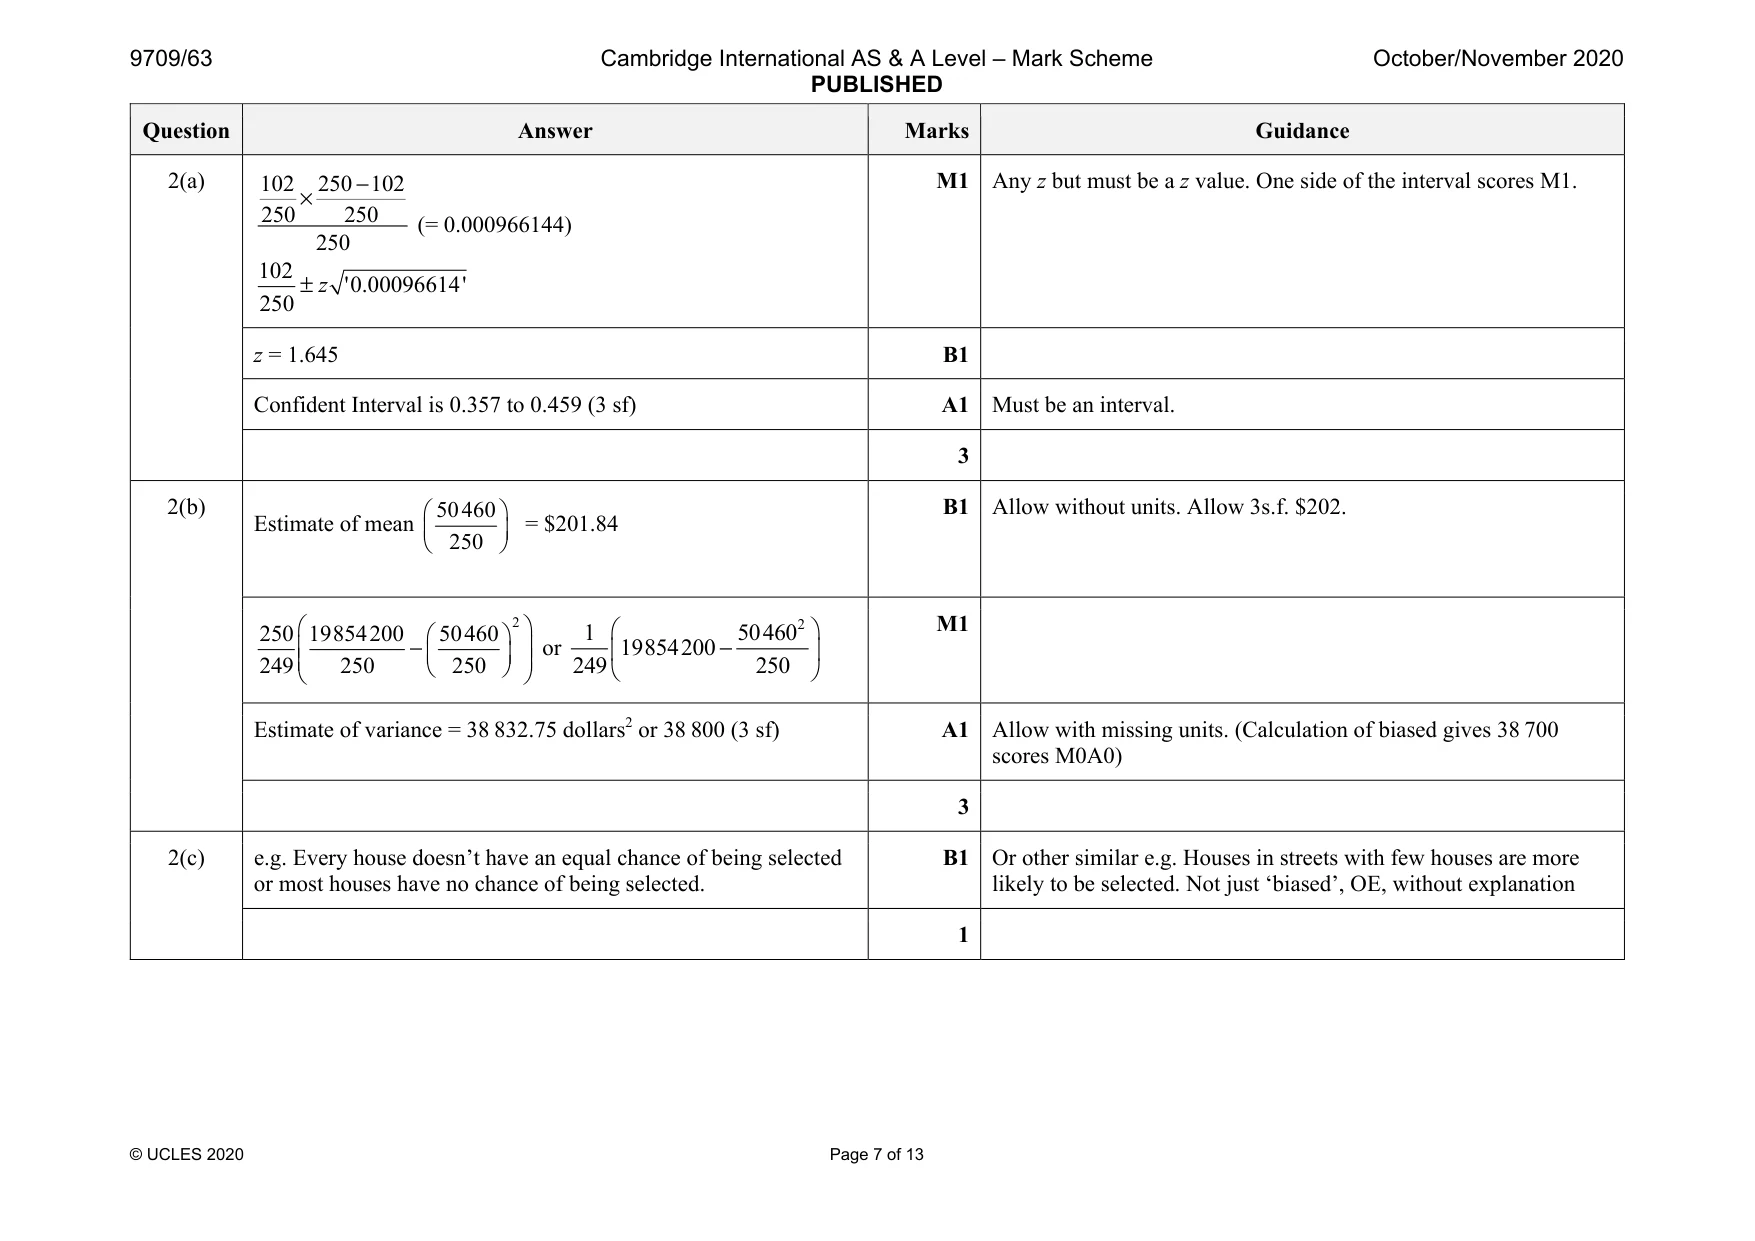
Mark scheme: 2(a) 102 250 102 250 250 250 − × (= 0.000966144) 102 '0.00096614' 250 z ± M1 Any z but must be a z value. One side of the interval scores M1. z = 1.645 B1 Confident Interval is 0.357 to 0.459 (3 sf) A1 Must be an interval. 3 2(b) Estimate of mean 50460 250 = $201.84 B1 Allow without units. Allow 3s.f. $202. 2 250 19854200 50460 249 250 250 − or 2 1 50460 19854200 249 250 − M1 Estimate of variance = 38 832.75 dollars2 or 38 800 (3 sf) A1 Allow with missing units. (Calculation of biased gives 38 700 scores M0A0) 3 2(c) e.g. Every house doesn’t have an equal chance of being selected or most houses have no chance of being selected. B1 Or other similar e.g. Houses in streets with few houses are more likely to be selected. Not just ‘biased’, OE, without explanation 1
Q5 · The number of absences per week by workers at a factory has the distribution Po 2.1
5 The number of absences per week by workers at a factory has the distribution Po 2.1 . (a) Find the standard deviation of the number of absences per week. [1] ........................................................................................................................................................ ........................................................................................................................................................ ........................................................................................................................................................ (b) Find the probability that the number of absences in a 2-week period is at least 2. [3] ........................................................................................................................................................ ........................................................................................................................................................ ........................................................................................................................................................ ........................................................................................................................................................ ........................................................................................................................................................ ........................................................................................................................................................ ........................................................................................................................................................ ........................................................................................................................................................ ........................................................................................................................................................ (c) Find the probability that the number of absences in a 3-week period is more than 4 and less than 8. [2] ........................................................................................................................................................ ........................................................................................................................................................ ........................................................................................................................................................ ........................................................................................................................................................ ........................................................................................................................................................ ........................................................................................................................................................ ........................................................................................................................................................ ........................................................................................................................................................ ........................................................................................................................................................ Following a change in working conditions, the management wished to test whether the mean number of absences has decreased. They found that, in a randomly chosen 3-week period, there were exactly 2 absences. (d) Carry out the test at the 10% significance level. [5] ........................................................................................................................................................ ........................................................................................................................................................ ........................................................................................................................................................ ........................................................................................................................................................ ........................................................................................................................................................ ........................................................................................................................................................ ........................................................................................................................................................ ........................................................................................................................................................ ........................................................................................................................................................ ........................................................................................................................................................ ........................................................................................................................................................ ........................................................................................................................................................ ........................................................................................................................................................ ........................................................................................................................................................ ........................................................................................................................................................ (e) State, with a reason, which of the errors, Type I or Type II, might have been made in carrying out the test in part (d). [2] ........................................................................................................................................................ ........................................................................................................................................................ ........................................................................................................................................................ ........................................................................................................................................................ ........................................................................................................................................................ ........................................................................................................................................................
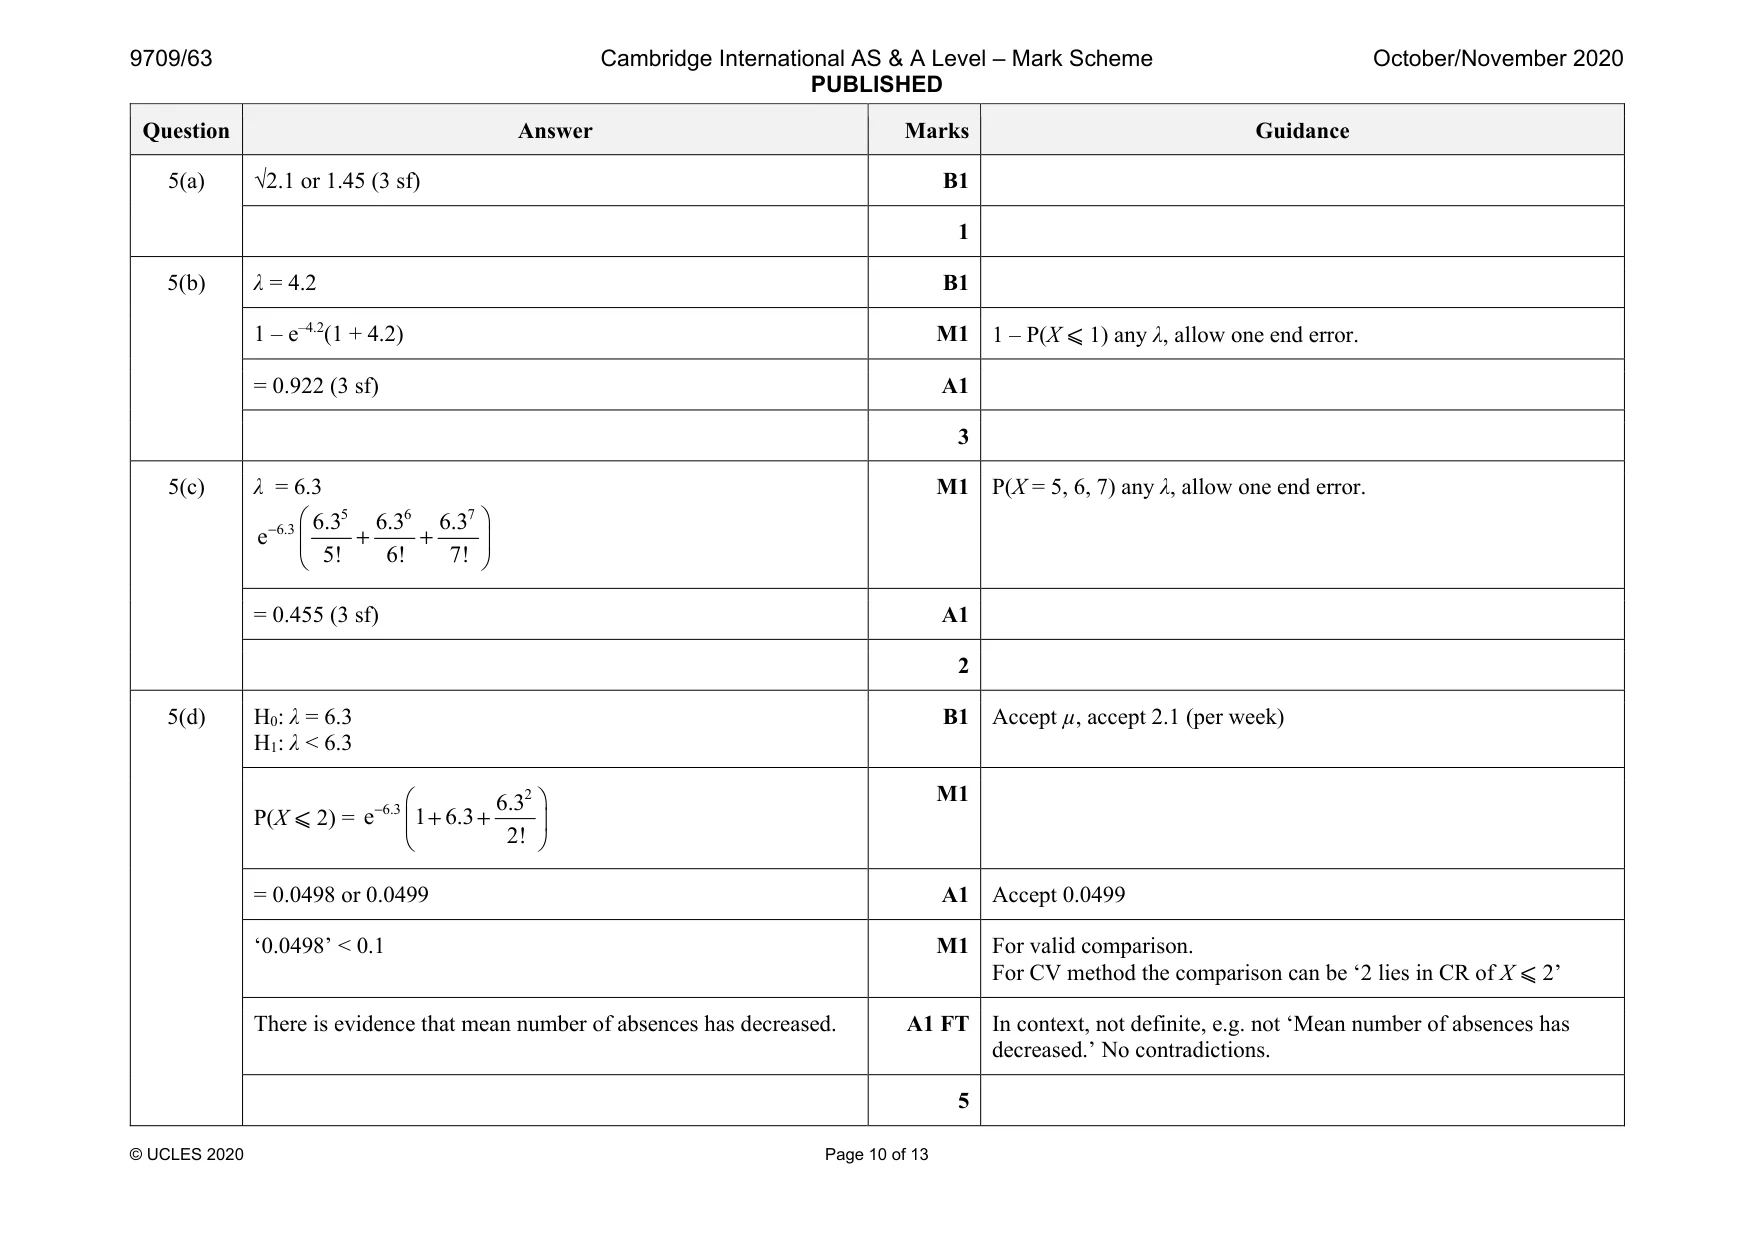
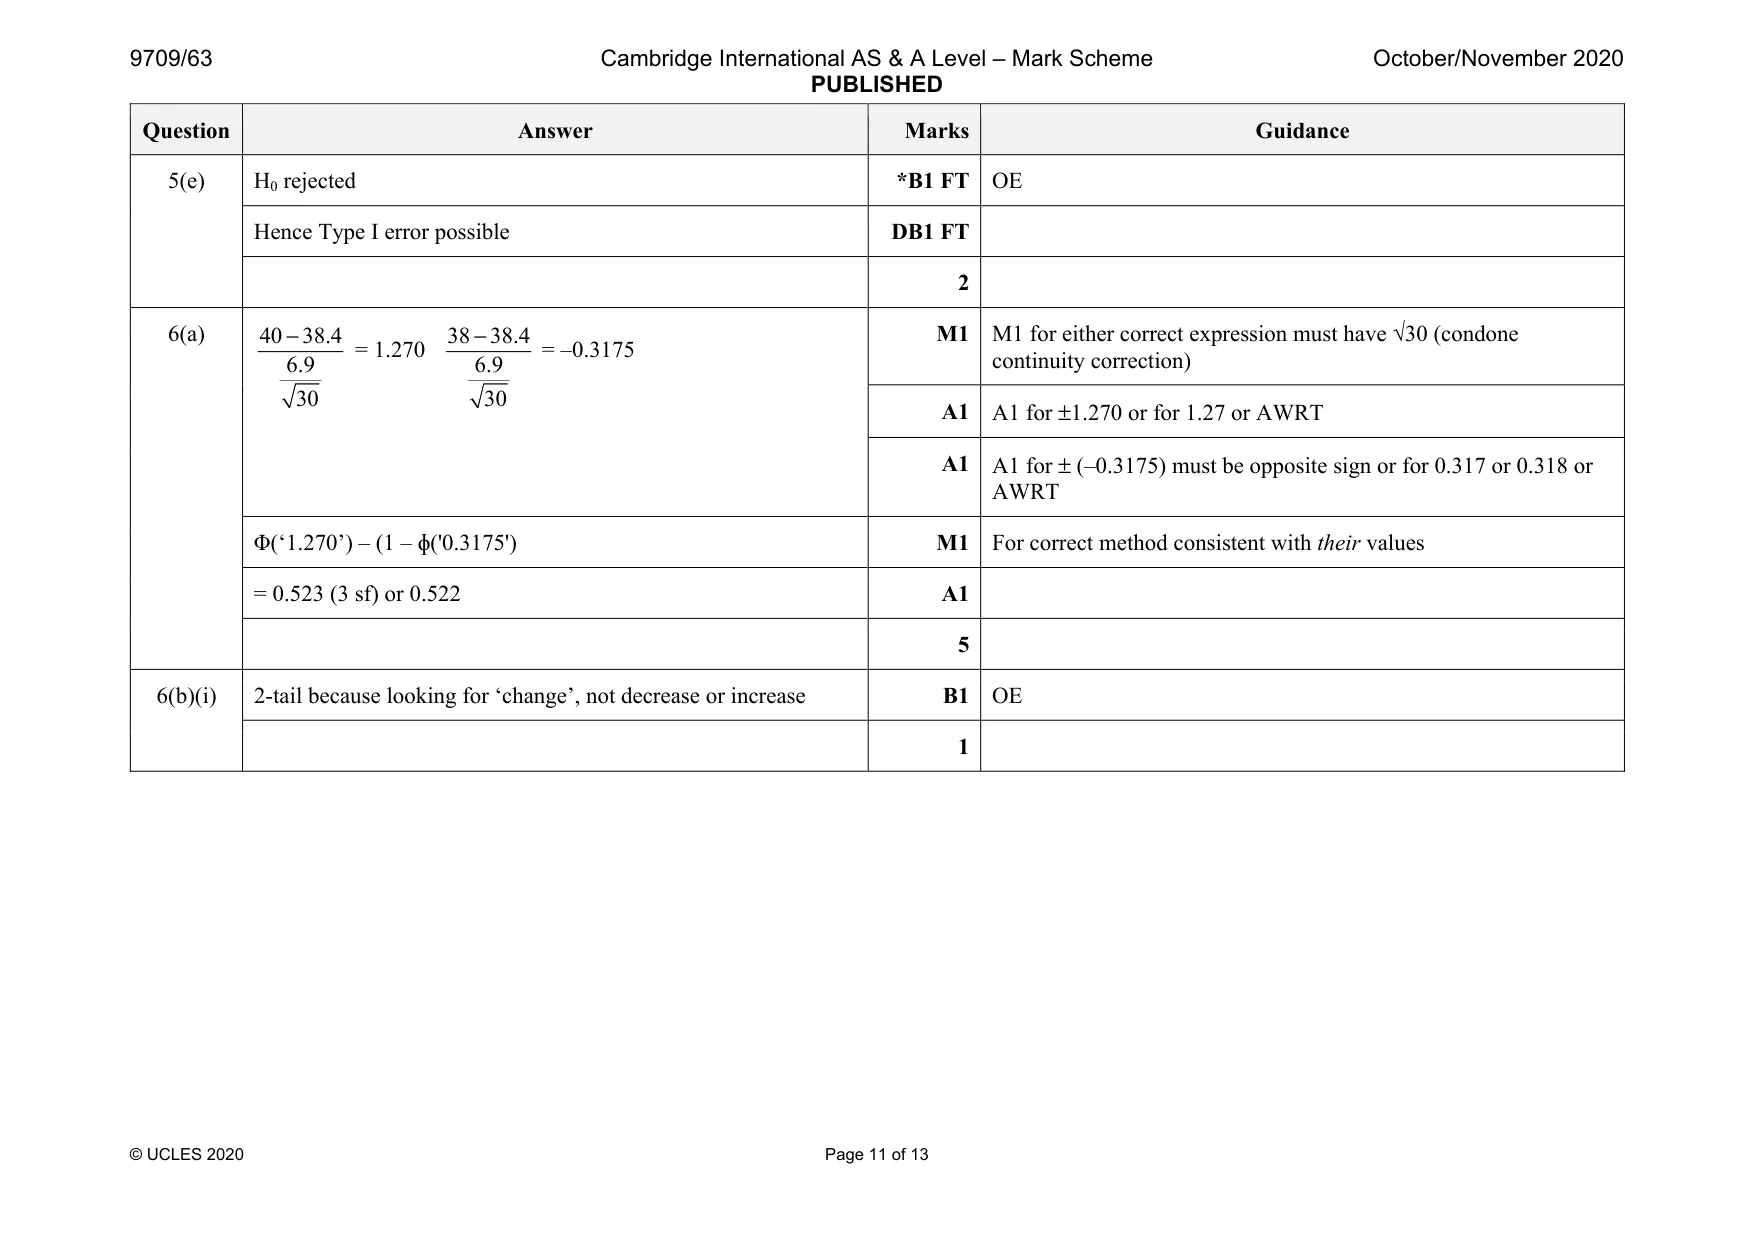
Mark scheme: 5(a) √2.1 or 1.45 (3 sf) B1 1 5(b) λ = 4.2 B1 1 – e–4.2(1 + 4.2) M1 1 – P(X ⩽ 1) any λ, allow one end error. = 0.922 (3 sf) A1 3 5(c) λ = 6.3 5 6 7 6.3 6.3 6.3 6.3 e 5! 6! 7! − + + M1 P(X = 5, 6, 7) any λ, allow one end error. = 0.455 (3 sf) A1 2 5(d) H0: λ = 6.3 H1: λ < 6.3 B1 Accept µ, accept 2.1 (per week) P(X ⩽ 2) = 2 6.3 6.3 e 1 6.3 2! − + + M1 = 0.0498 or 0.0499 A1 Accept 0.0499 ‘0.0498’ < 0.1 M1 For valid comparison. For CV method the comparison can be ‘2 lies in CR of X ⩽ 2’ There is evidence that mean number of absences has decreased. A1 FT In context, not definite, e.g. not ‘Mean number of absences has decreased.’ No contradictions. 5 Question Answer Marks Guidance 5(e) H0 rejected *B1 FT OE Hence Type I error possible DB1 FT 2
Q6 · The time, in minutes, for Anjan’s journey to work on Mondays has mean 38.4 and standard…
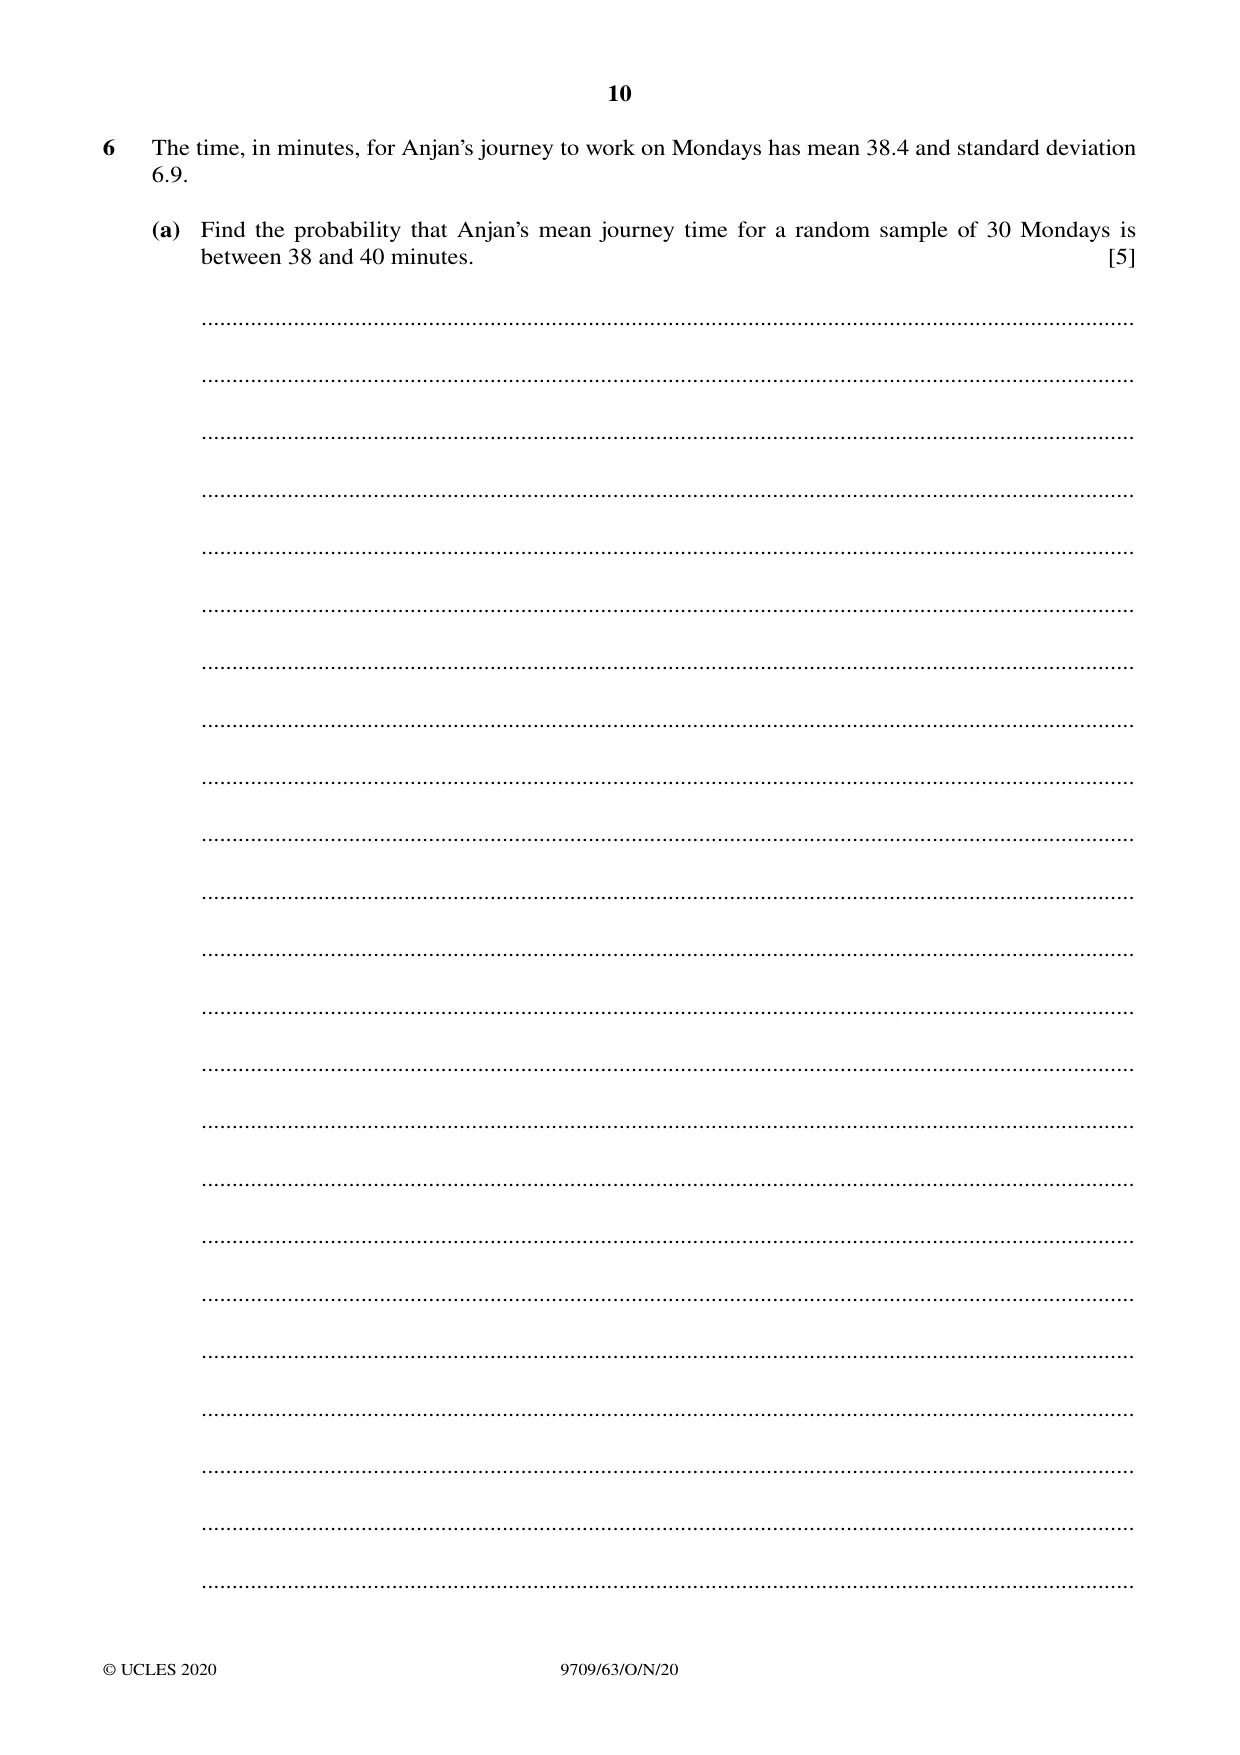
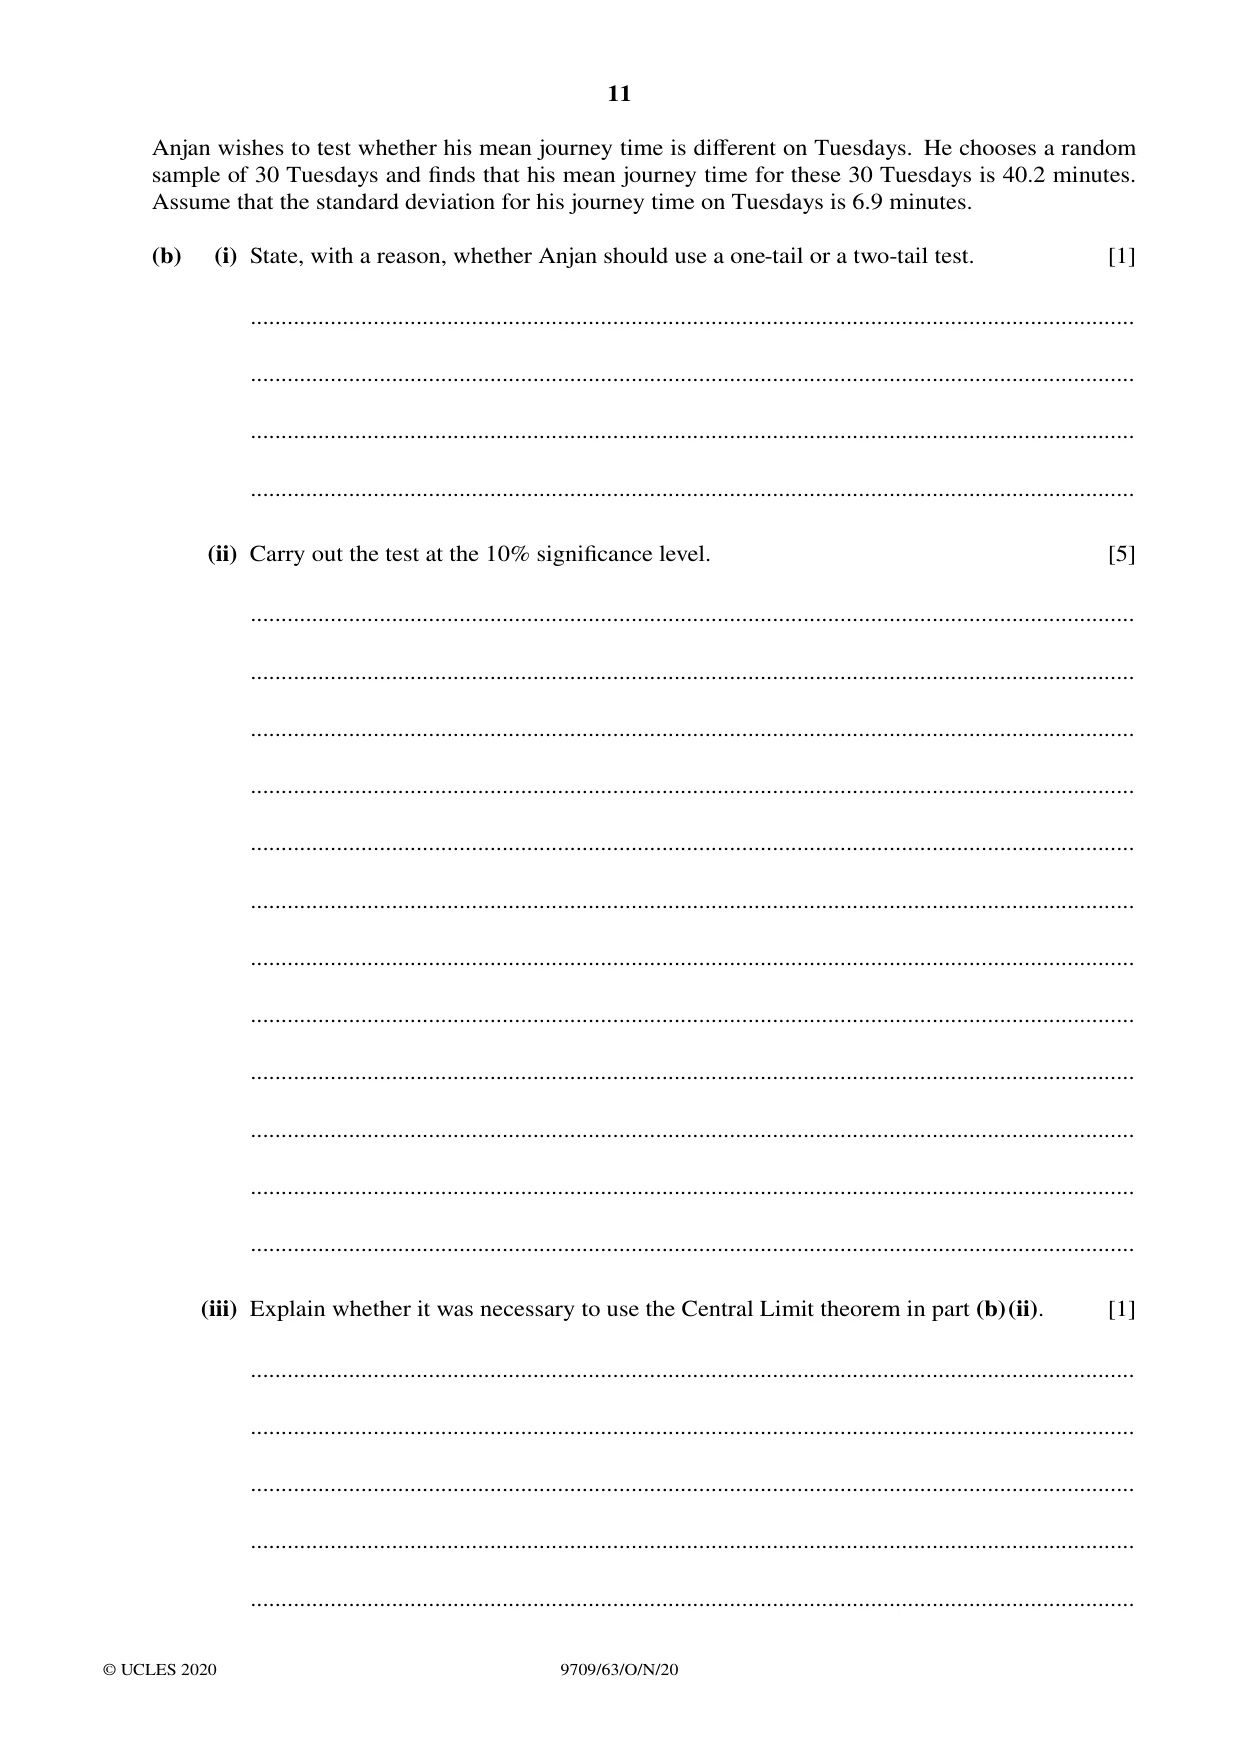
6 The time, in minutes, for Anjan’s journey to work on Mondays has mean 38.4 and standard deviation 6.9. (a) Find the probability that Anjan’s mean journey time for a random sample of 30 Mondays is between 38 and 40 minutes. [5] ........................................................................................................................................................ ........................................................................................................................................................ ........................................................................................................................................................ ........................................................................................................................................................ ........................................................................................................................................................ ........................................................................................................................................................ ........................................................................................................................................................ ........................................................................................................................................................ ........................................................................................................................................................ ........................................................................................................................................................ ........................................................................................................................................................ ........................................................................................................................................................ ........................................................................................................................................................ ........................................................................................................................................................ ........................................................................................................................................................ ........................................................................................................................................................ ........................................................................................................................................................ ........................................................................................................................................................ ........................................................................................................................................................ ........................................................................................................................................................ ........................................................................................................................................................ ........................................................................................................................................................ ........................................................................................................................................................ Anjan wishes to test whether his mean journey time is different on Tuesdays. He chooses a random sample of 30 Tuesdays and finds that his mean journey time for these 30 Tuesdays is 40.2 minutes. Assume that the standard deviation for his journey time on Tuesdays is 6.9 minutes. (b) (i) State, with a reason, whether Anjan should use a one-tail or a two-tail test. [1] ................................................................................................................................................ ................................................................................................................................................ ................................................................................................................................................ ................................................................................................................................................ (ii) Carry out the test at the 10% significance level. [5] ................................................................................................................................................ ................................................................................................................................................ ................................................................................................................................................ ................................................................................................................................................ ................................................................................................................................................ ................................................................................................................................................ ................................................................................................................................................ ................................................................................................................................................ ................................................................................................................................................ ................................................................................................................................................ ................................................................................................................................................ ................................................................................................................................................ (iii) Explain whether it was necessary to use the Central Limit theorem in part (b)(ii). [1] ................................................................................................................................................ ................................................................................................................................................ ................................................................................................................................................ ................................................................................................................................................ ................................................................................................................................................
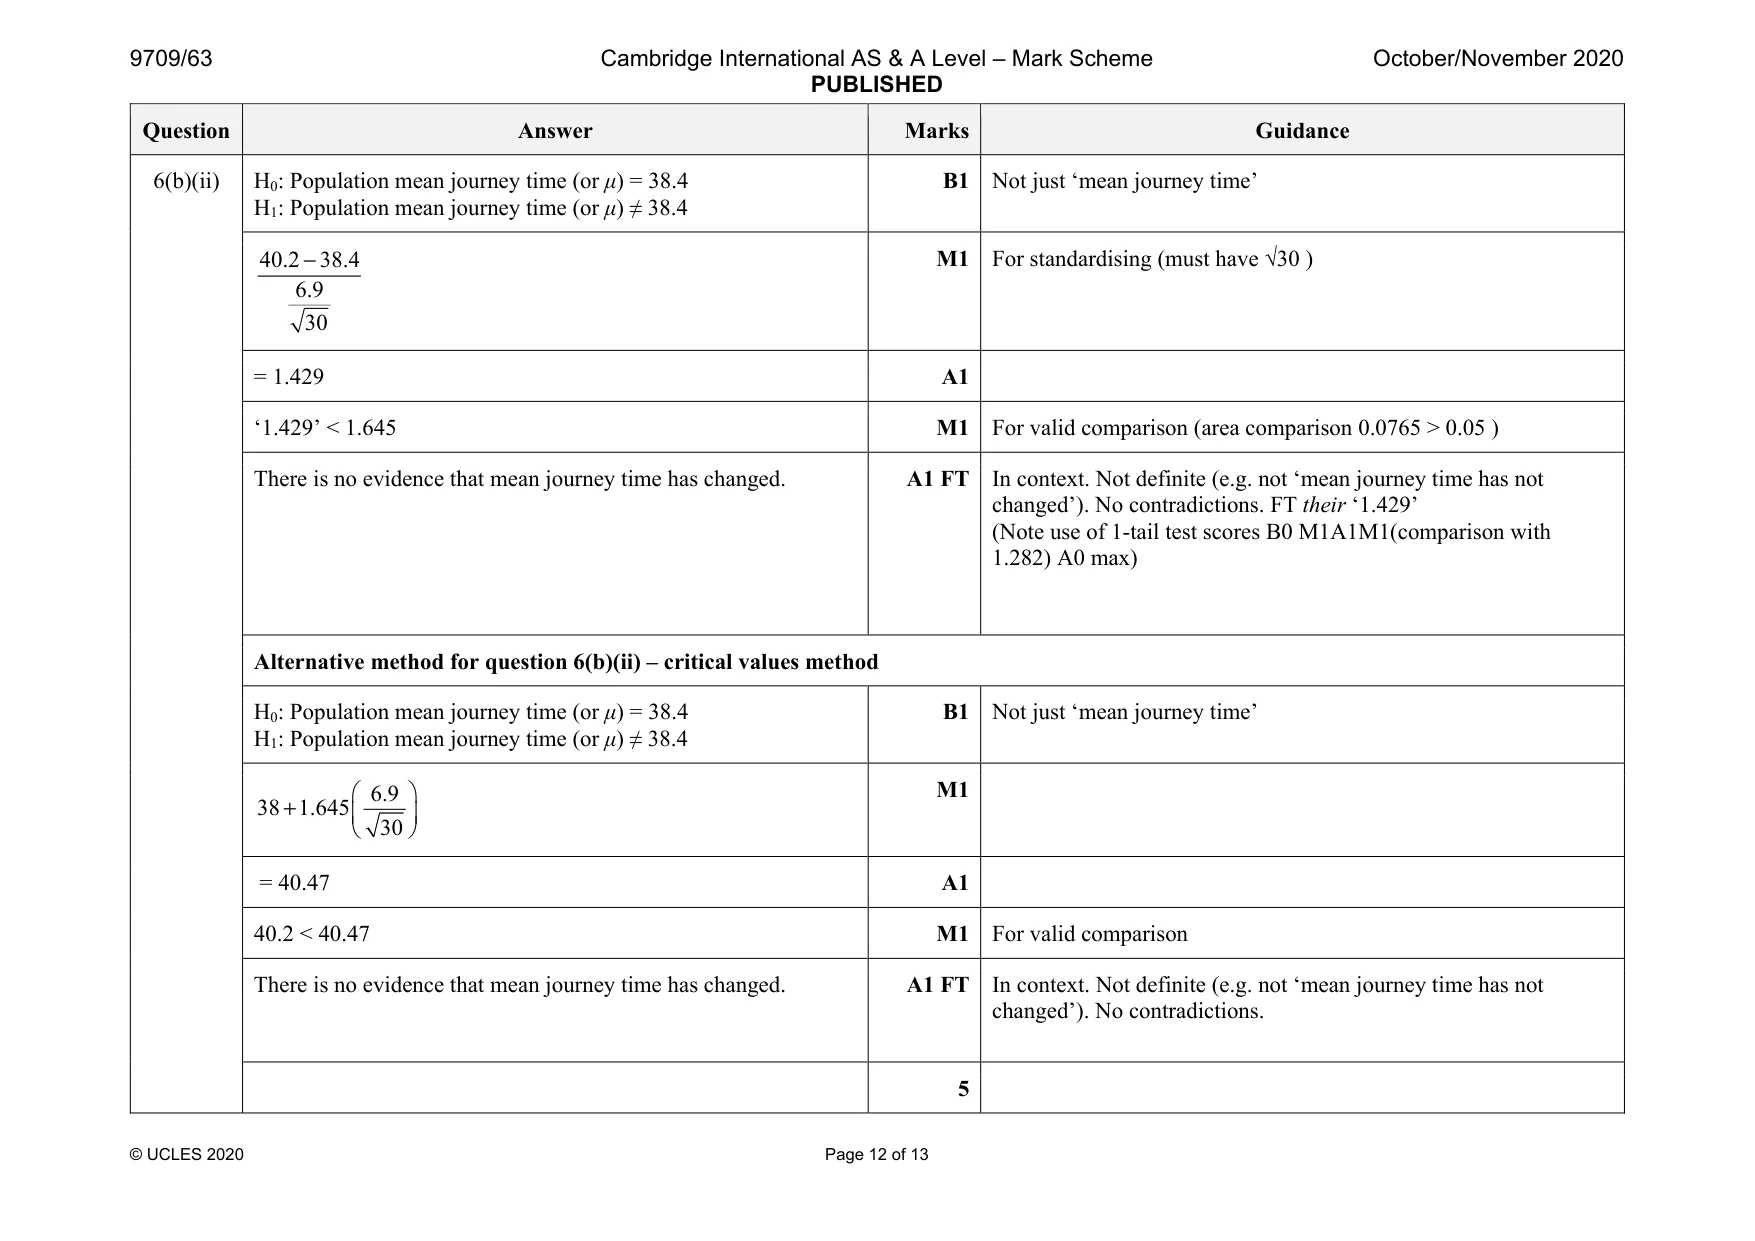
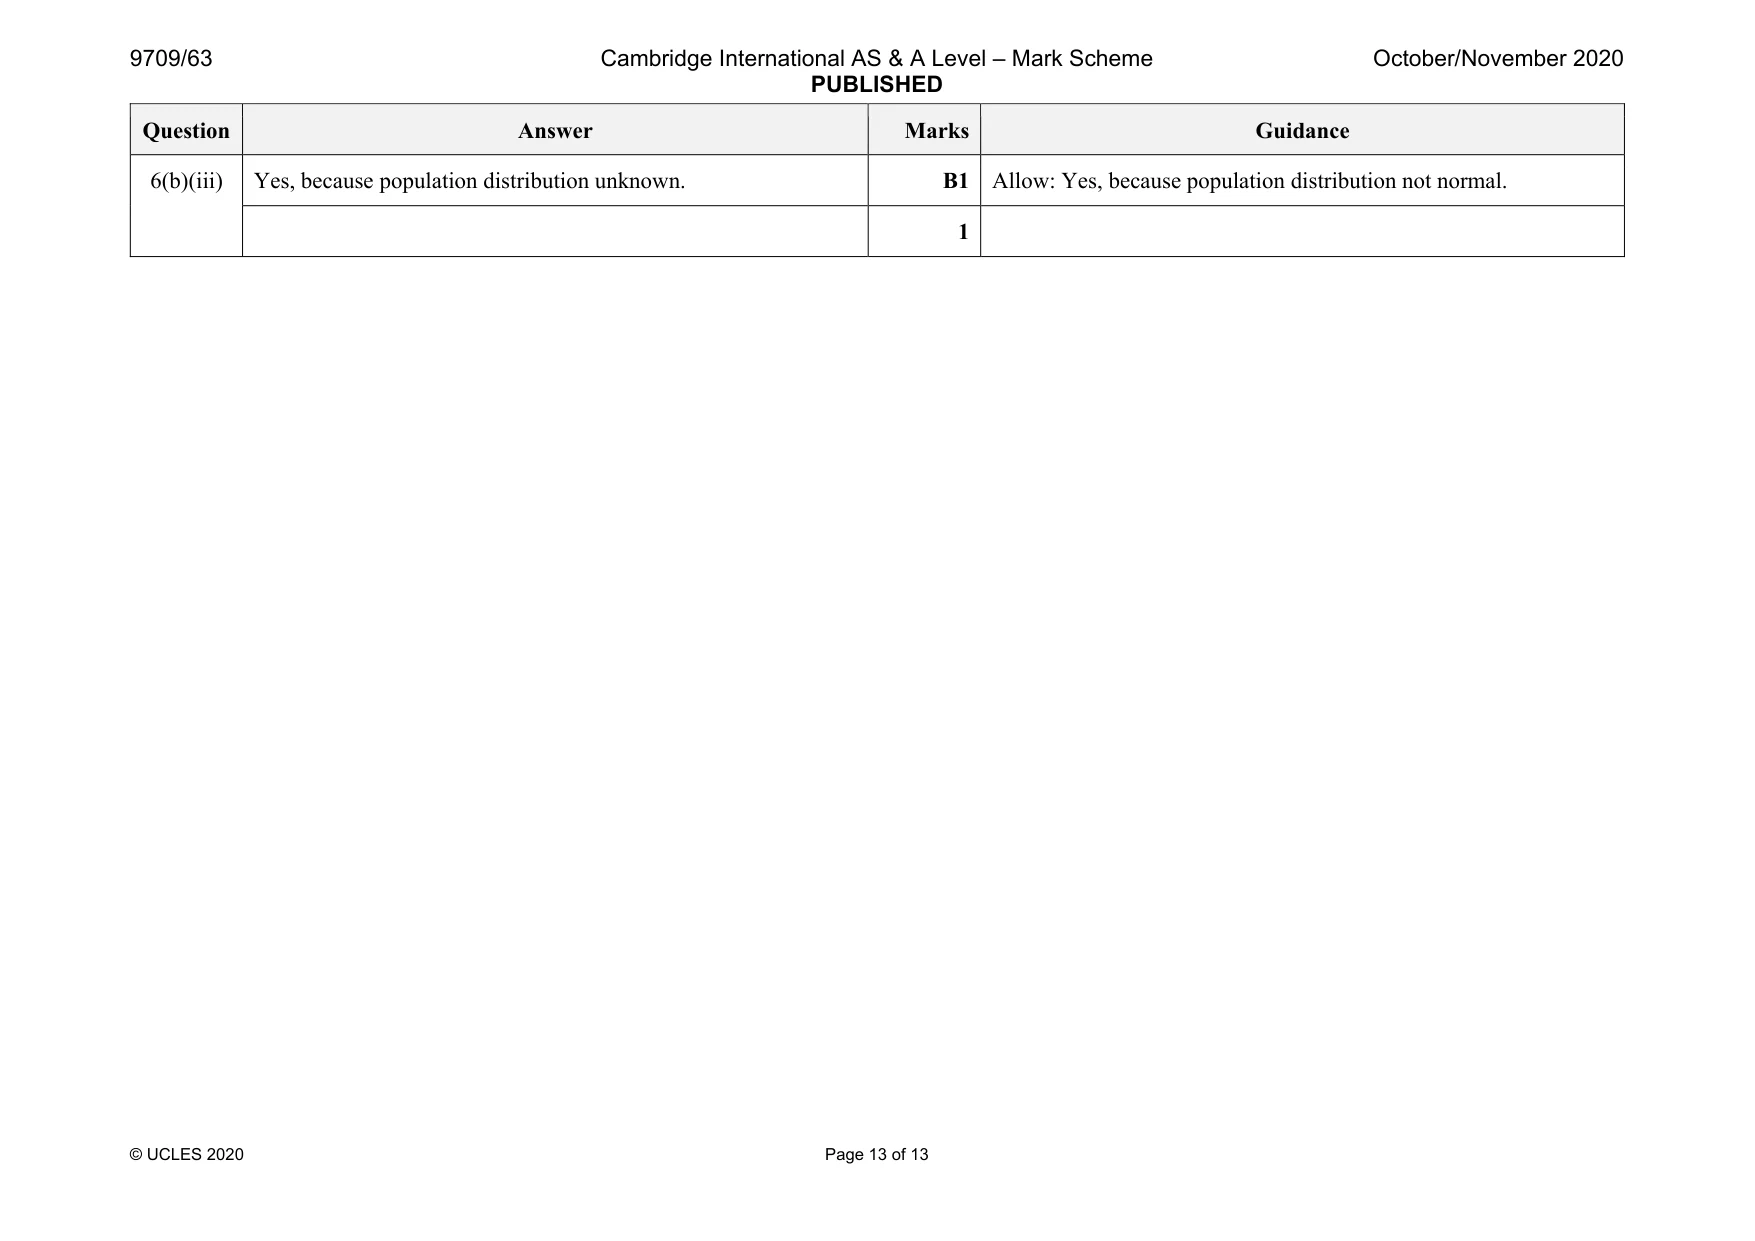
Mark scheme: 6(a) 40 38.4 6.9 30 − = 1.270 38 38.4 6.9 30 − = –0.3175 M1 M1 for either correct expression must have √30 (condone continuity correction) A1 A1 for ±1.270 or for 1.27 or AWRT A1 A1 for ± (–0.3175) must be opposite sign or for 0.317 or 0.318 or AWRT Φ(‘1.270’) – (1 – ɸ('0.3175') M1 For correct method consistent with their values = 0.523 (3 sf) or 0.522 A1 5 6(b)(i) 2-tail because looking for ‘change’, not decrease or increase B1 OE 1 Question Answer Marks Guidance 6(b)(ii) H0: Population mean journey time (or μ) = 38.4 H1: Population mean journey time (or μ) ≠ 38.4 B1 Not just ‘mean journey time’ 40.2 38.4 6.9 30 − M1 For standardising (must have √30 ) = 1.429 A1 ‘1.429’ < 1.645 M1 For valid comparison (area comparison 0.0765 > 0.05 ) There is no evidence that mean journey time has changed. A1 FT In context. Not definite (e.g. not ‘mean journey time has not changed’). No contradictions. FT their ‘1.429’ (Note use of 1-tail test scores B0 M1A1M1(comparison with 1.282) A0 max) Alternative method for question 6(b)(ii) – critical values method H0: Population mean journey time (or μ) = 38.4 H1: Population mean journey time (or μ) ≠ 38.4 B1 Not just ‘mean journey time’ 6.9 38 1.645 30 + M1 = 40.47 A1 40.2 < 40.47 M1 For valid comparison There is no evidence that mean journey time has changed. A1 FT In context. Not definite (e.g. not ‘mean journey time has not changed’). No contradictions. 5 Question Answer Marks Guidance 6(b)(iii) Yes, because population distribution unknown. B1 Allow: Yes, because population distribution not normal. 1
What was in this paper
The subtopics covered by these 4 questions, and how many questions each got. Open one in a new tab to see every Cambridge question on it.
What you needed in this session
Cambridge’s own grade thresholds for 2020 Oct/Nov, Paper 6 · Variant 3. A higher threshold means an easier paper — the bar moves with how the cohort did.