Cambridge A Level Marine Science 9693 — 2015 Oct/Nov Paper 4 · Variant 1
9693/41/O/N/15 · 50 marks · ≈56 min
The question paper and its mark scheme, free to read here and free to download. This is Cambridge’s own paper, exactly as it was sat.
Question paper12 pages




Mark scheme
No mark scheme is in the library for this paper.
Paper as text
Question paper, page 1
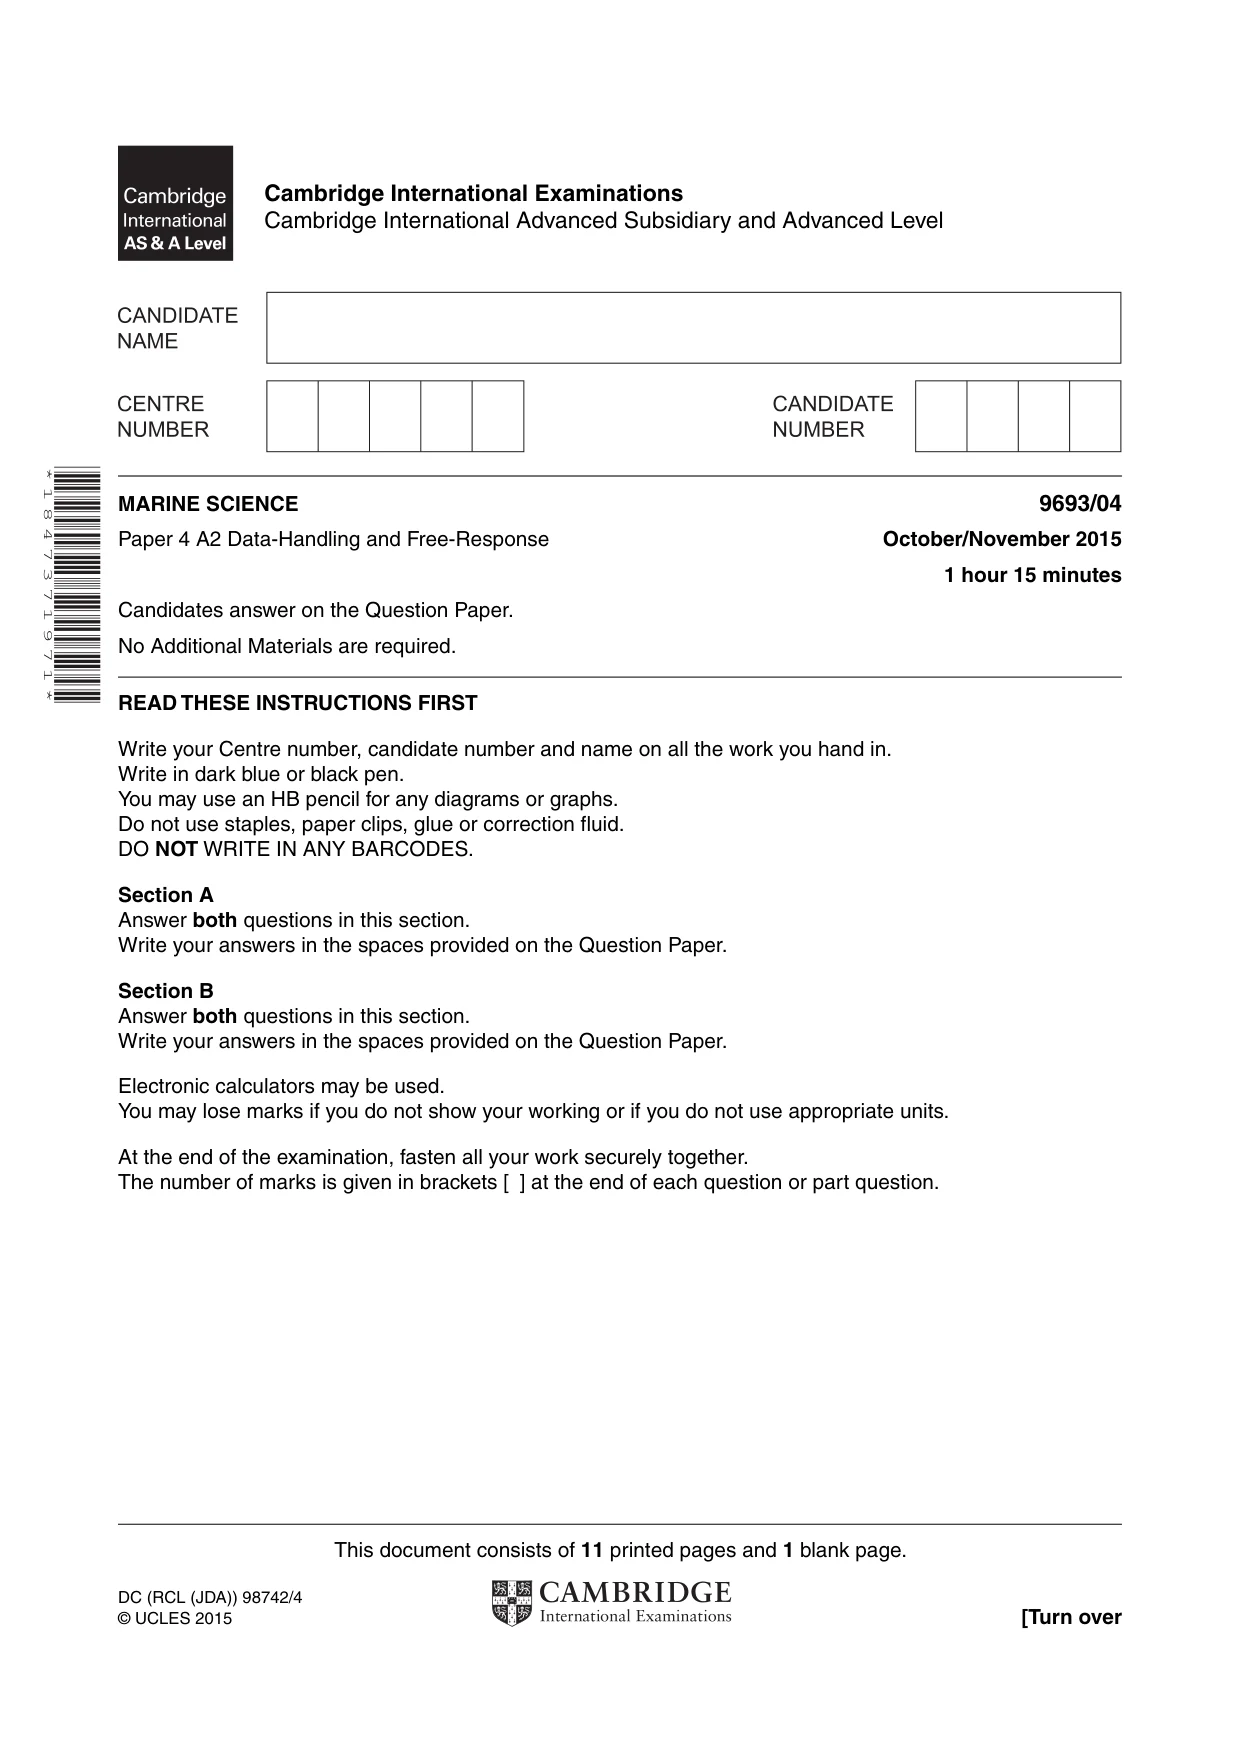
This document consists of 11 printed pages and 1 blank page. DC (RCL (JDA)) 98742/4 © UCLES 2015 [Turn over Cambridge International Examinations Cambridge International Advanced Subsidiary and Advanced Level * 1 8 4 7 3 7 1 9 7 1 * MARINE SCIENCE 9693/04 Paper 4 A2 Data-Handling and Free-Response October/November 2015 1 hour 15 minutes Candidates answer on the Question Paper. No Additional Materials are required. READ THESE INSTRUCTIONS FIRST Write your Centre number, candidate number and name on all the work you hand in. Write in dark blue or black pen. You may use an HB pencil for any diagrams or graphs. Do not use staples, paper clips, glue or correction fluid. DO NOT WRITE IN ANY BARCODES. Section A Answer both questions in this section. Write your answers in the spaces provided on the Question Paper. Section B Answer both questions in this section. Write your answers in the spaces provided on the Question Paper. Electronic calculators may be used. You may lose marks if you do not show your working or if you do not use appropriate units. At the end of the examination, fasten all your work securely together. The number of marks is given in brackets [ ] at the end of each question or part question.
Question paper, page 2
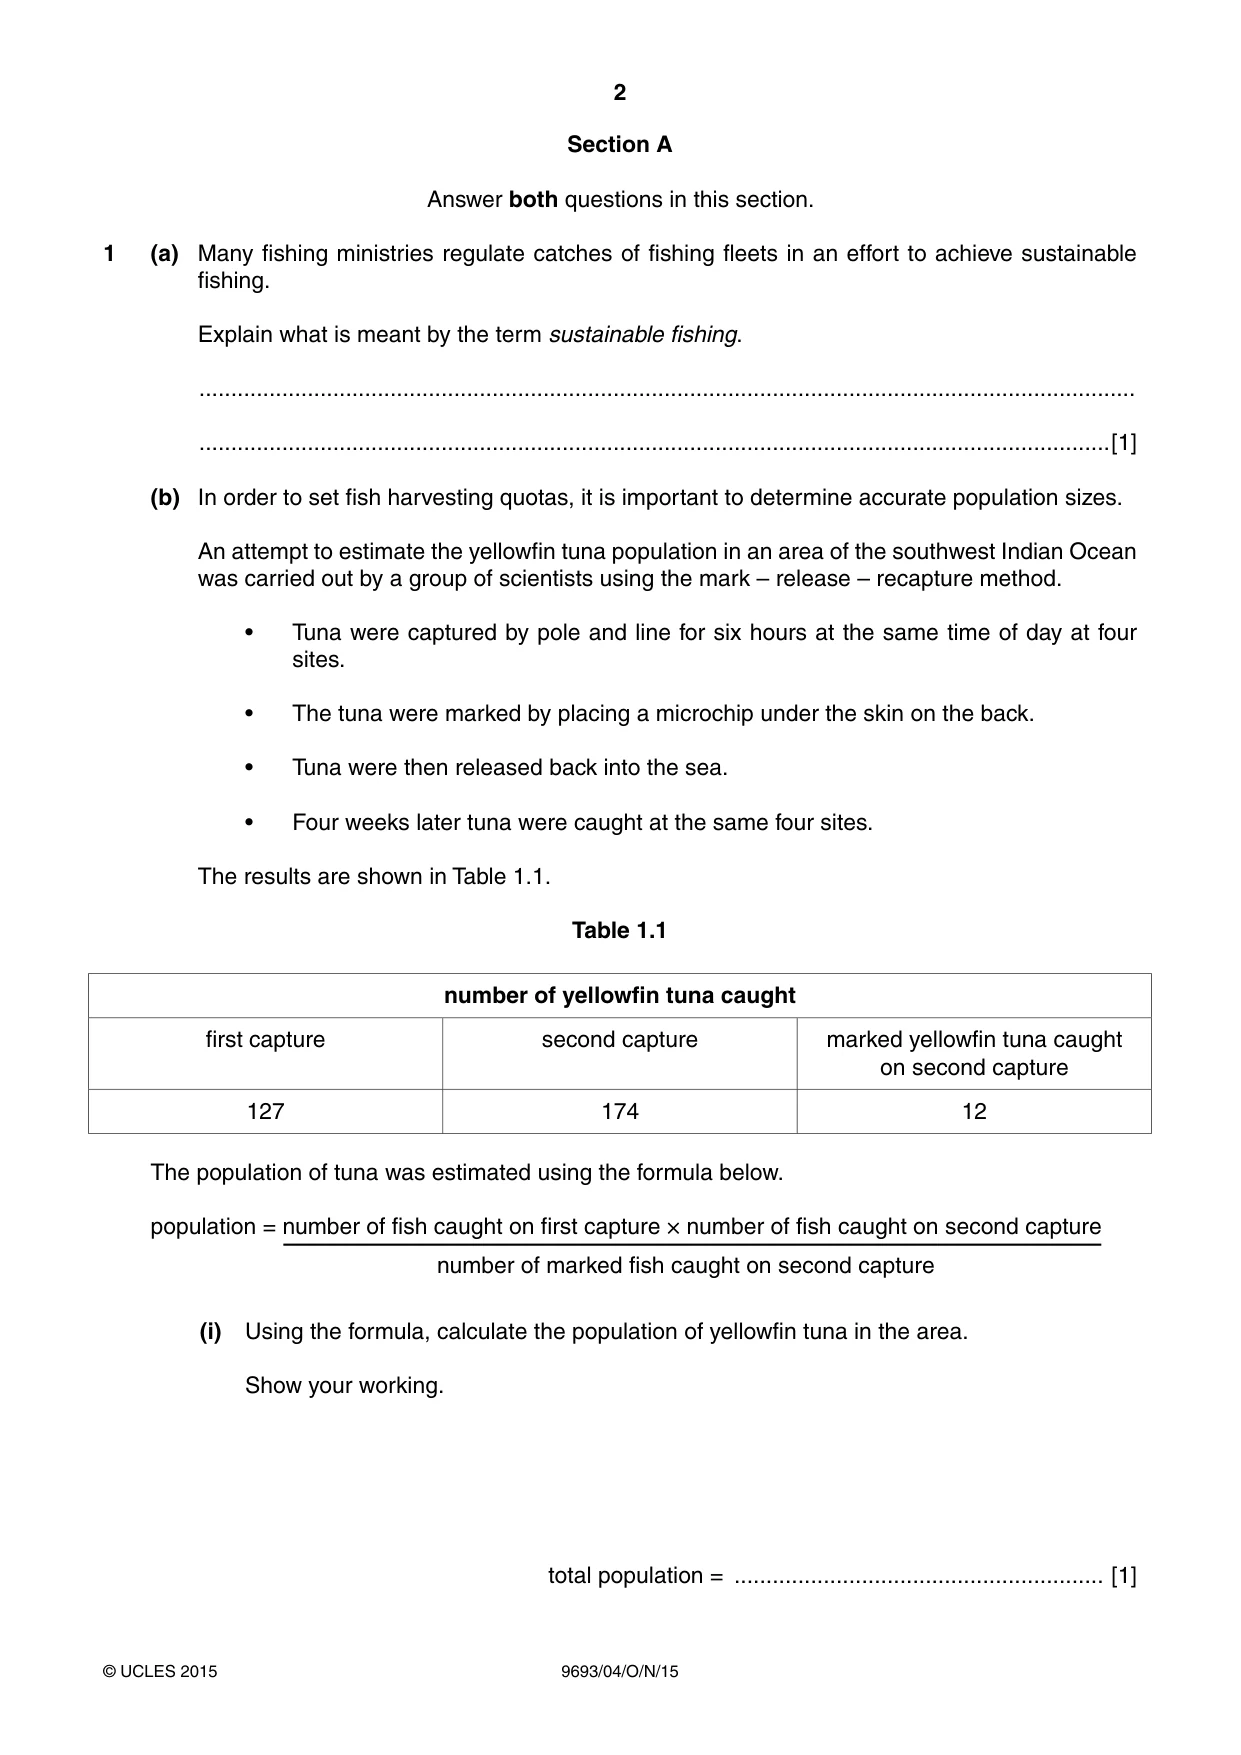
2 9693/04/O/N/15 © UCLES 2015 Section A Answer both questions in this section. 1 (a) Many fishing ministries regulate catches of fishing fleets in an effort to achieve sustainable fishing. Explain what is meant by the term sustainable fishing. … …[1] (b) In order to set fish harvesting quotas, it is important to determine accurate population sizes. An attempt to estimate the yellowfin tuna population in an area of the southwest Indian Ocean was carried out by a group of scientists using the mark – release – recapture method. • Tuna were captured by pole and line for six hours at the same time of day at four sites. • The tuna were marked by placing a microchip under the skin on the back. • Tuna were then released back into the sea. • Four weeks later tuna were caught at the same four sites. The results are shown in Table 1.1. Table 1.1 number of yellowfin tuna caught first capture second capture marked yellowfin tuna caught on second capture 127 174 12 The population of tuna was estimated using the formula below. population = number of fish caught on first capture × number of fish caught on second capture number of marked fish caught on second capture (i) Using the formula, calculate the population of yellowfin tuna in the area. Show your working. total population = … [1]
Question paper, page 3
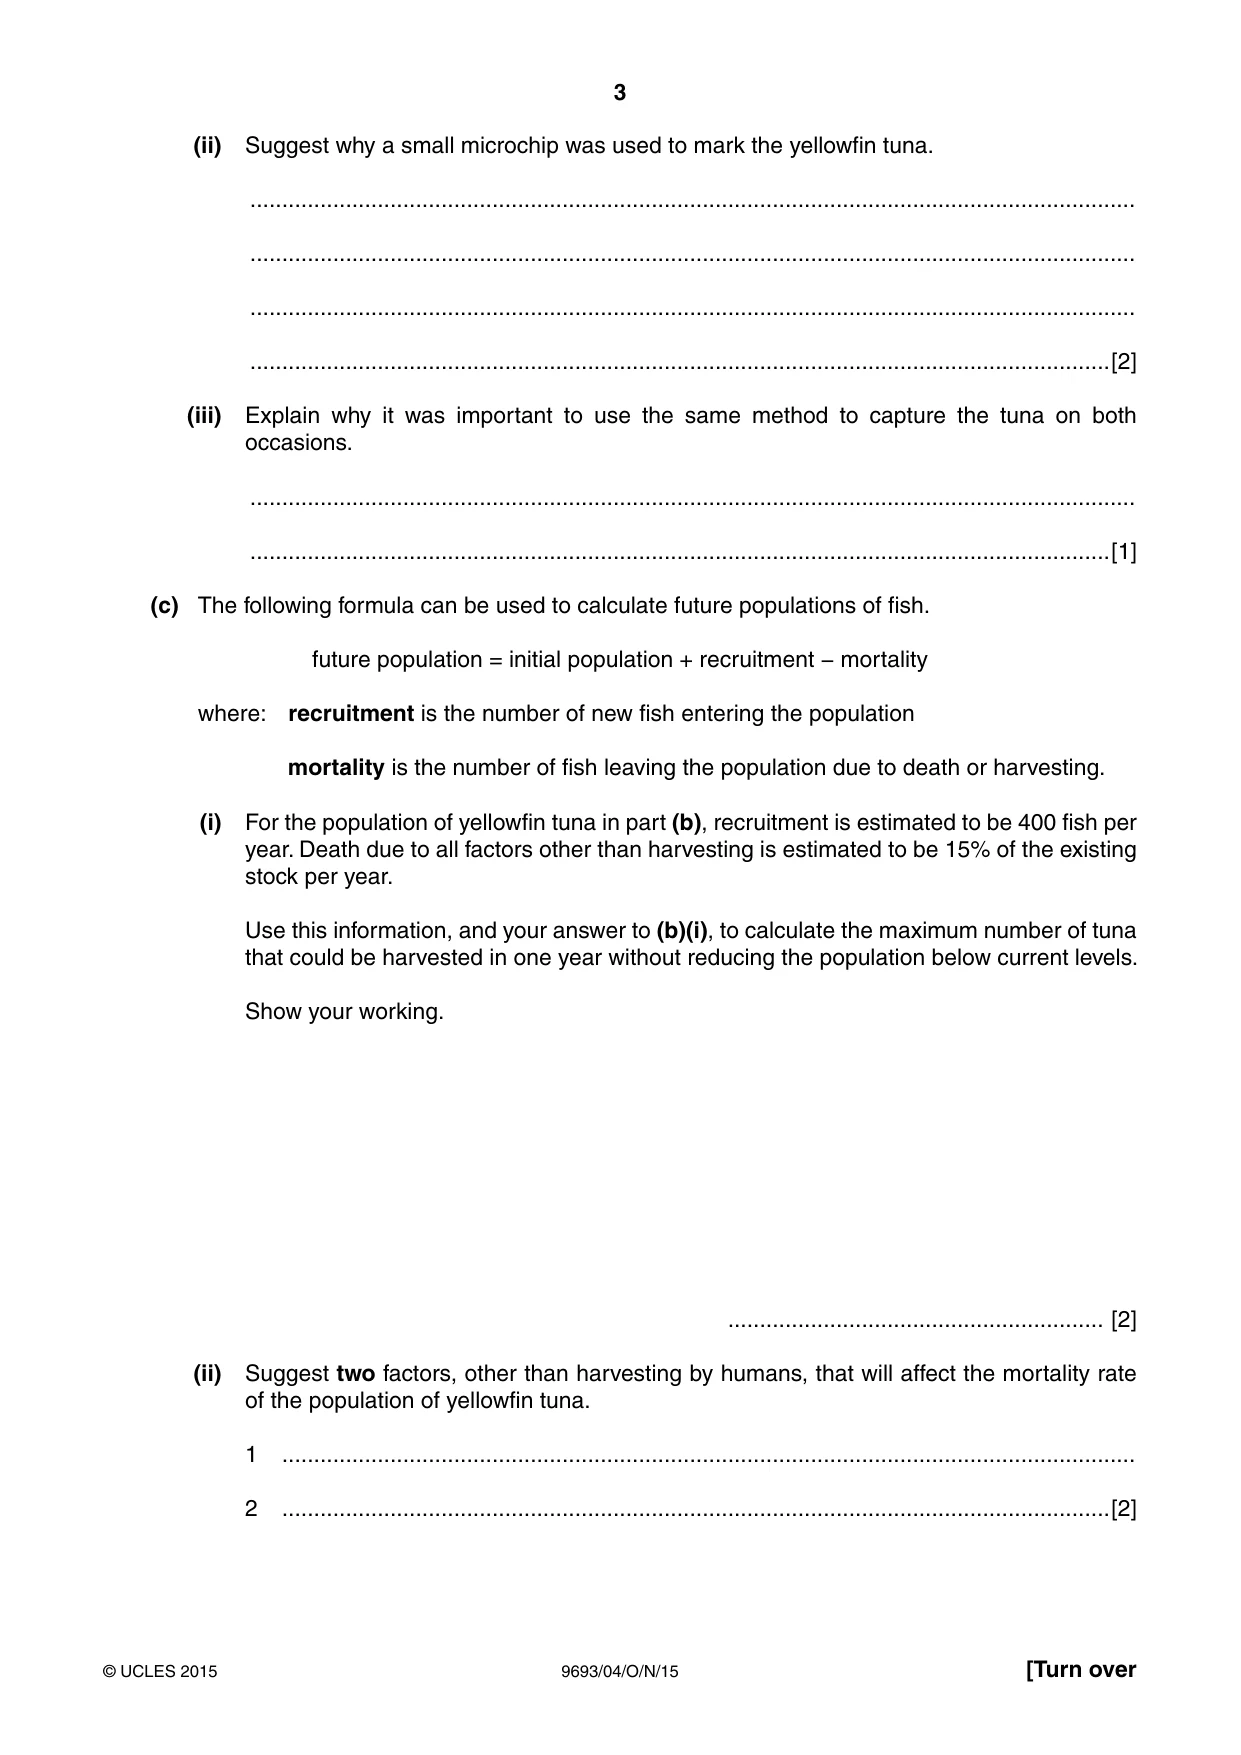
3 9693/04/O/N/15 © UCLES 2015 [Turn over (ii) Suggest why a small microchip was used to mark the yellowfin tuna. … … … …[2] (iii) Explain why it was important to use the same method to capture the tuna on both occasions. … …[1] (c) The following formula can be used to calculate future populations of fish. future population = initial population + recruitment − mortality where: recruitment is the number of new fish entering the population mortality is the number of fish leaving the population due to death or harvesting. (i) For the population of yellowfin tuna in part (b), recruitment is estimated to be 400 fish per year. Death due to all factors other than harvesting is estimated to be 15% of the existing stock per year. Use this information, and your answer to (b)(i), to calculate the maximum number of tuna that could be harvested in one year without reducing the population below current levels. Show your working. … [2] (ii) Suggest two factors, other than harvesting by humans, that will affect the mortality rate of the population of yellowfin tuna. 1 … 2 …[2]
Question paper, page 4
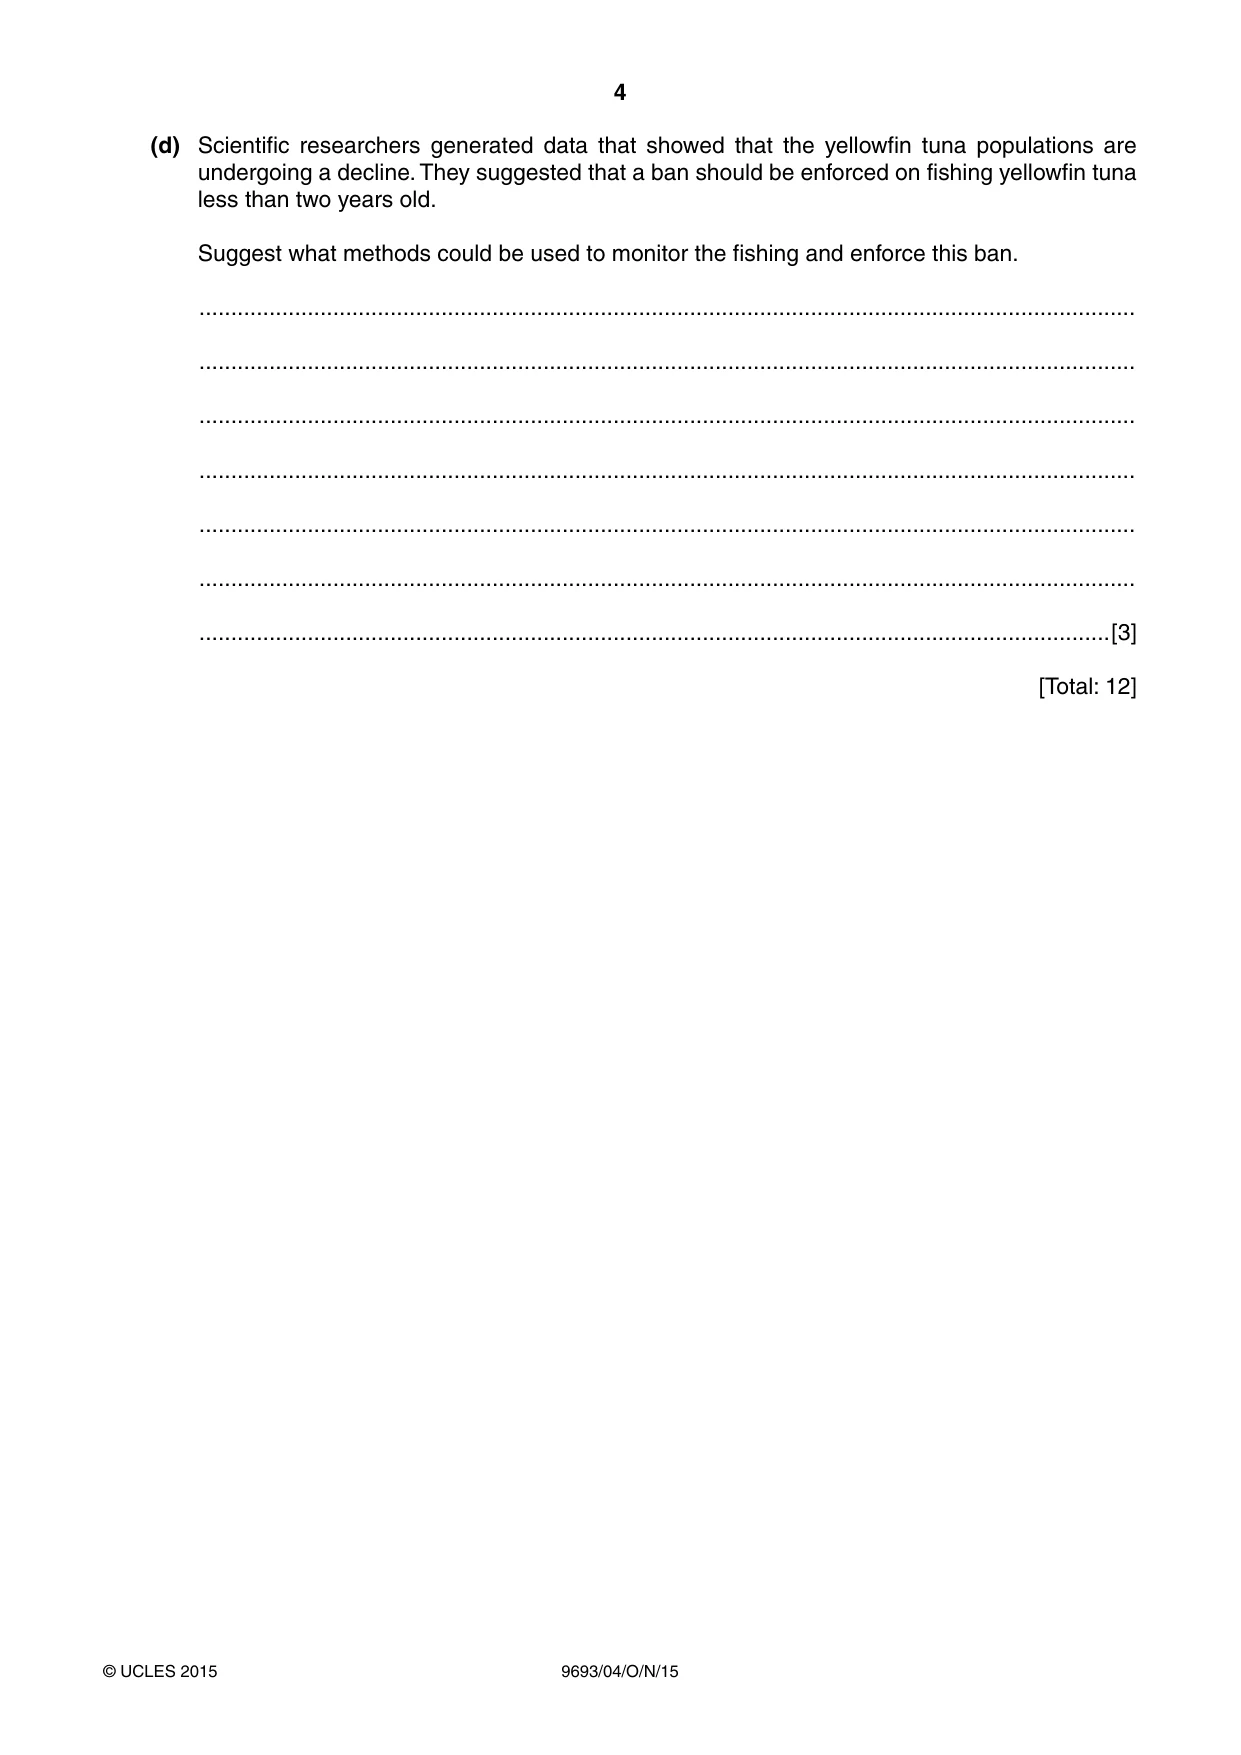
4 9693/04/O/N/15 © UCLES 2015 (d) Scientific researchers generated data that showed that the yellowfin tuna populations are undergoing a decline. They suggested that a ban should be enforced on fishing yellowfin tuna less than two years old. Suggest what methods could be used to monitor the fishing and enforce this ban. … … … … … … …[3] [Total: 12]
Question paper, page 5
5 9693/04/O/N/15 © UCLES 2015 [Turn over Question 2 starts on page 6
Question paper, page 6
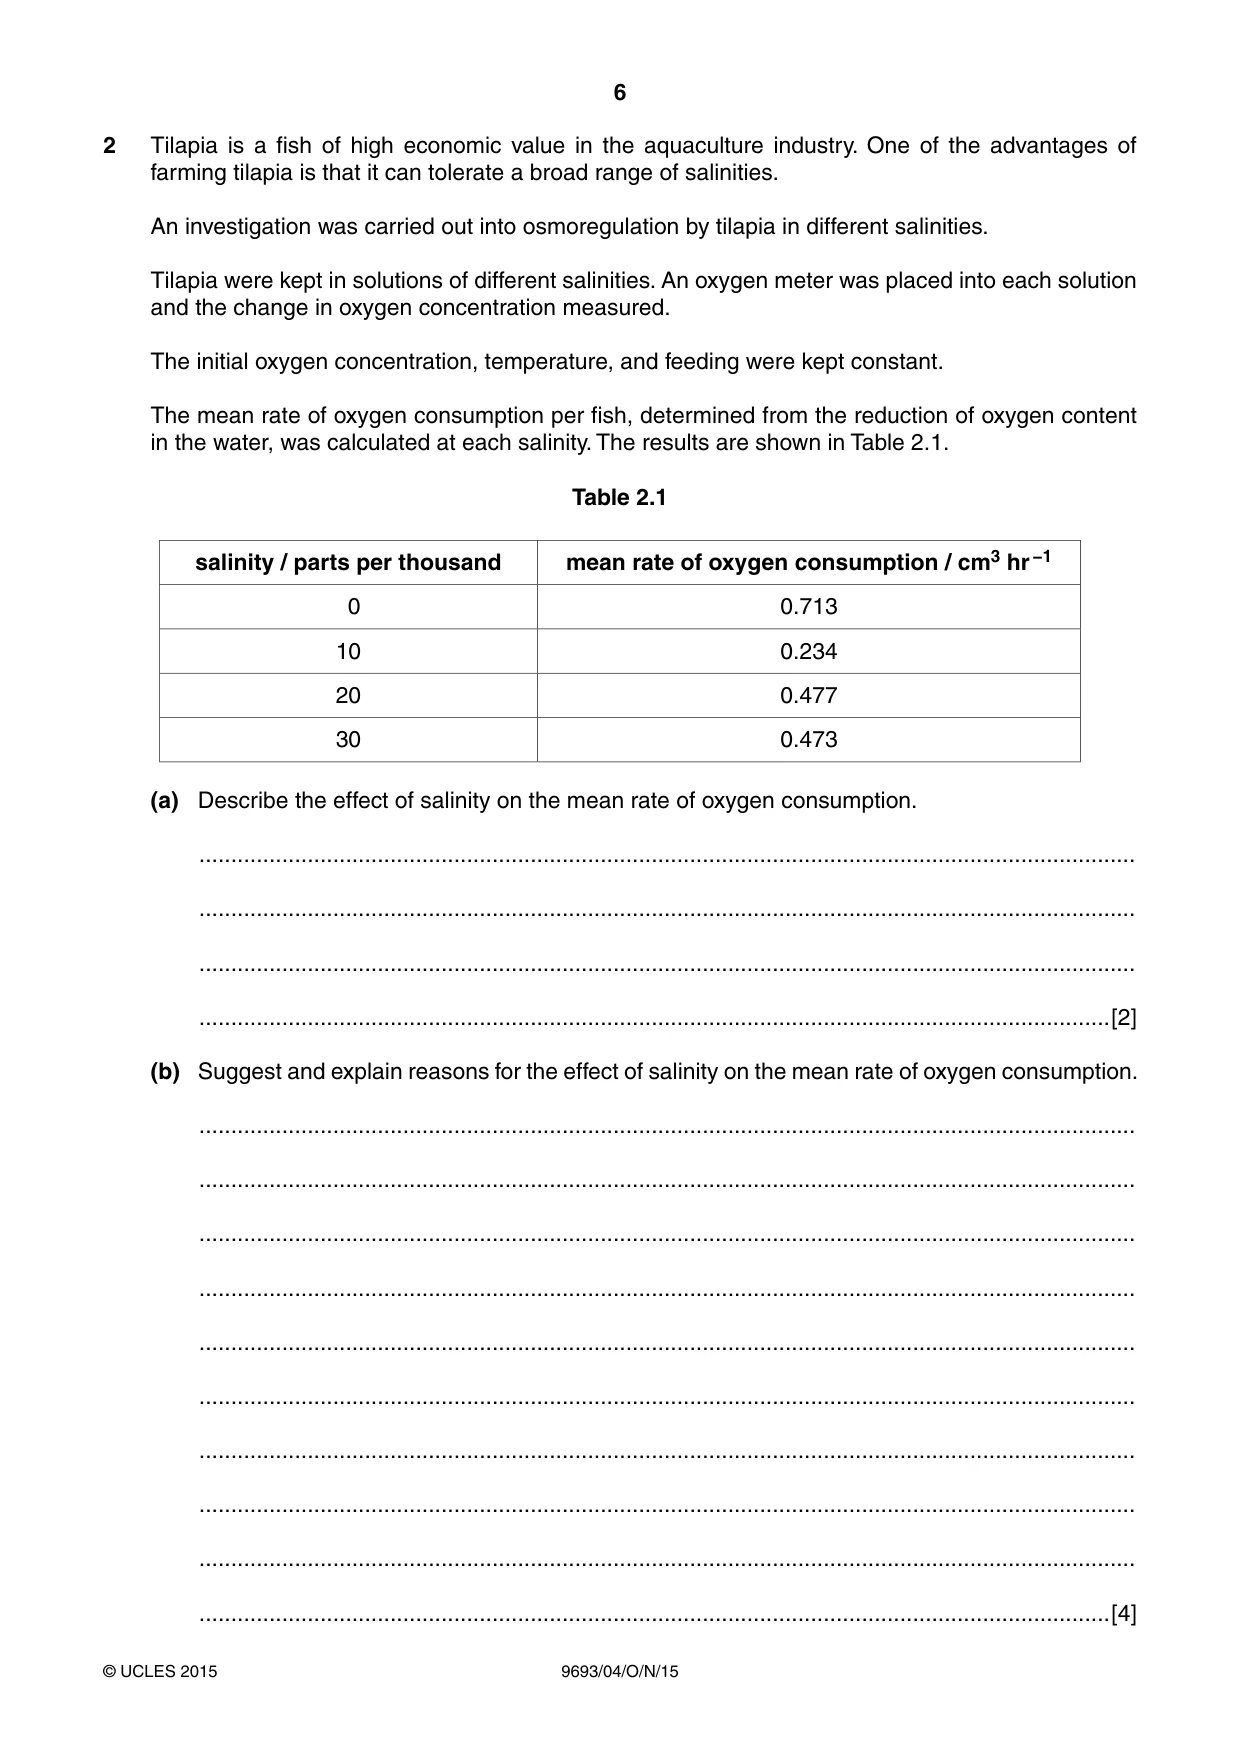
6 9693/04/O/N/15 © UCLES 2015 2 Tilapia is a fish of high economic value in the aquaculture industry. One of the advantages of farming tilapia is that it can tolerate a broad range of salinities. An investigation was carried out into osmoregulation by tilapia in different salinities. Tilapia were kept in solutions of different salinities. An oxygen meter was placed into each solution and the change in oxygen concentration measured. The initial oxygen concentration, temperature, and feeding were kept constant. The mean rate of oxygen consumption per fish, determined from the reduction of oxygen content in the water, was calculated at each salinity. The results are shown in Table 2.1. Table 2.1 salinity / parts per thousand mean rate of oxygen consumption / cm3 hr −1 0 0.713 10 0.234 20 0.477 30 0.473 (a) Describe the effect of salinity on the mean rate of oxygen consumption. … … … …[2] (b) Suggest and explain reasons for the effect of salinity on the mean rate of oxygen consumption. … … … … … … … … … …[4]
Question paper, page 7
7 9693/04/O/N/15 © UCLES 2015 [Turn over (c) When raising fish by aquaculture it is important to supply the correct amount of food. Explain how the data in Table 2.1 could be used to determine the amount of food needed for tilapia in different salinities. … … … …[2] [Total: 8]
Question paper, page 8
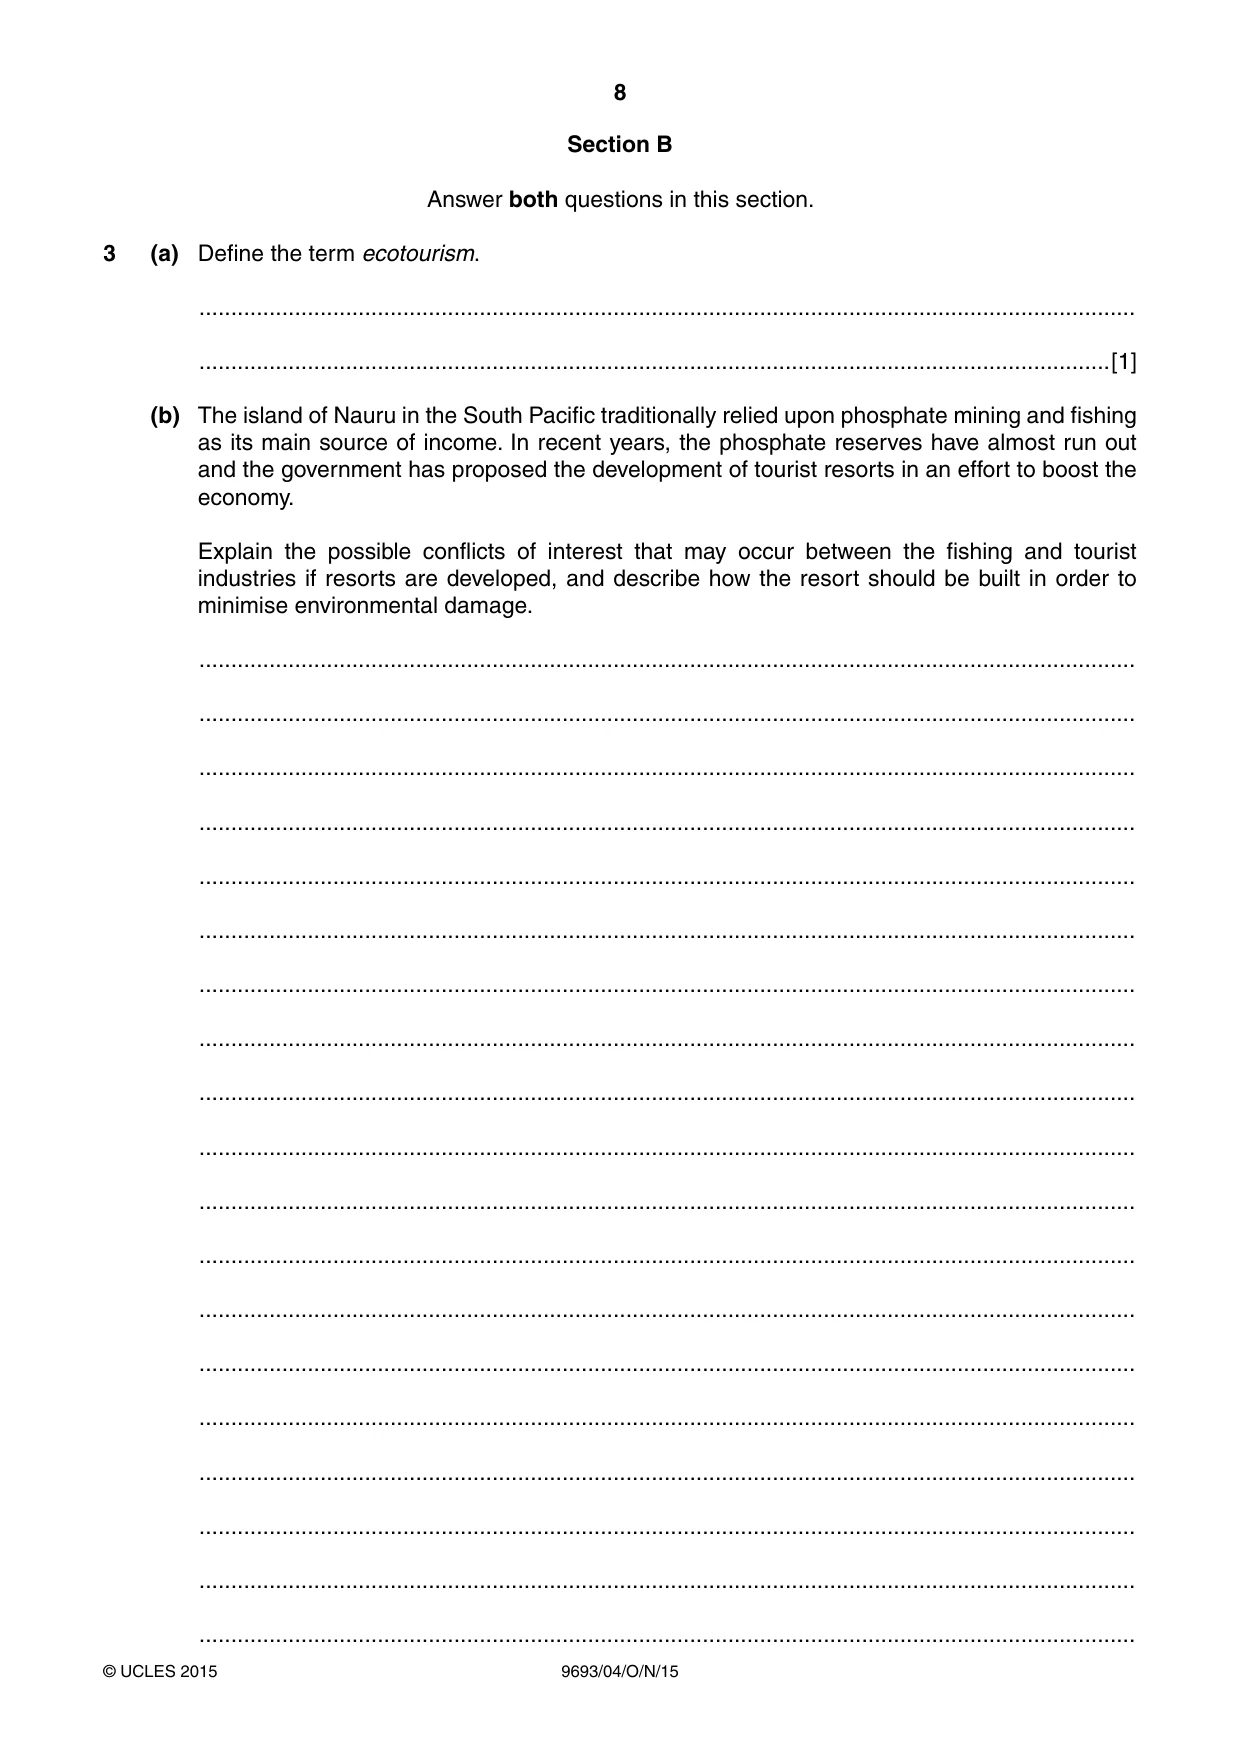
8 9693/04/O/N/15 © UCLES 2015 Section B Answer both questions in this section. 3 (a) Define the term ecotourism. … …[1] (b) The island of Nauru in the South Pacific traditionally relied upon phosphate mining and fishing as its main source of income. In recent years, the phosphate reserves have almost run out and the government has proposed the development of tourist resorts in an effort to boost the economy. Explain the possible conflicts of interest that may occur between the fishing and tourist industries if resorts are developed, and describe how the resort should be built in order to minimise environmental damage. … … … … … … … … … … … … … … … … … … …
Question paper, page 9
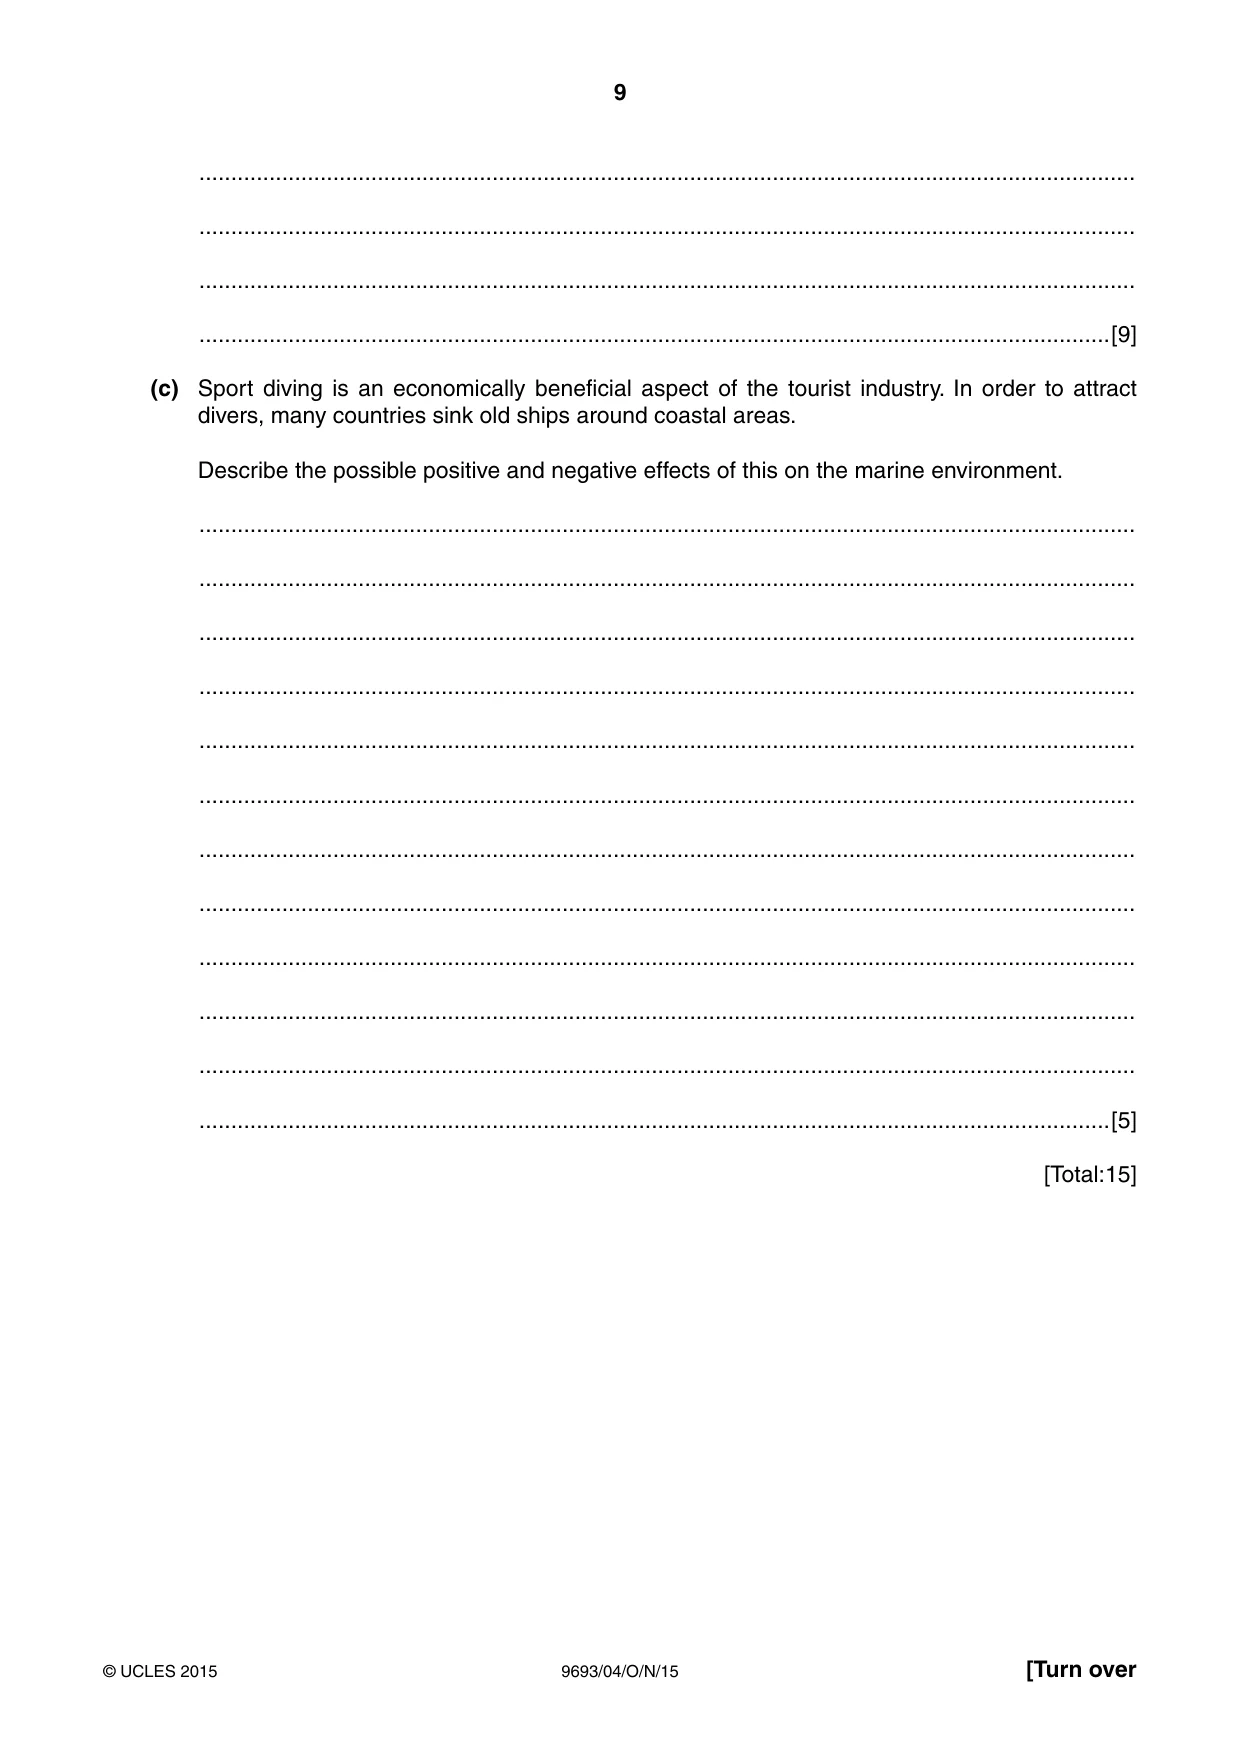
9 9693/04/O/N/15 © UCLES 2015 [Turn over … … … …[9] (c) Sport diving is an economically beneficial aspect of the tourist industry. In order to attract divers, many countries sink old ships around coastal areas. Describe the possible positive and negative effects of this on the marine environment. … … … … … … … … … … … …[5] [Total:15]
Question paper, page 10
10 9693/04/O/N/15 © UCLES 2015 4 (a) Discuss and evaluate the evidence that global warming is occurring and that human activity is contributing to this process. … … … … … … … … … … … … … … … … … … … … … … … …[9]
Question paper, page 11
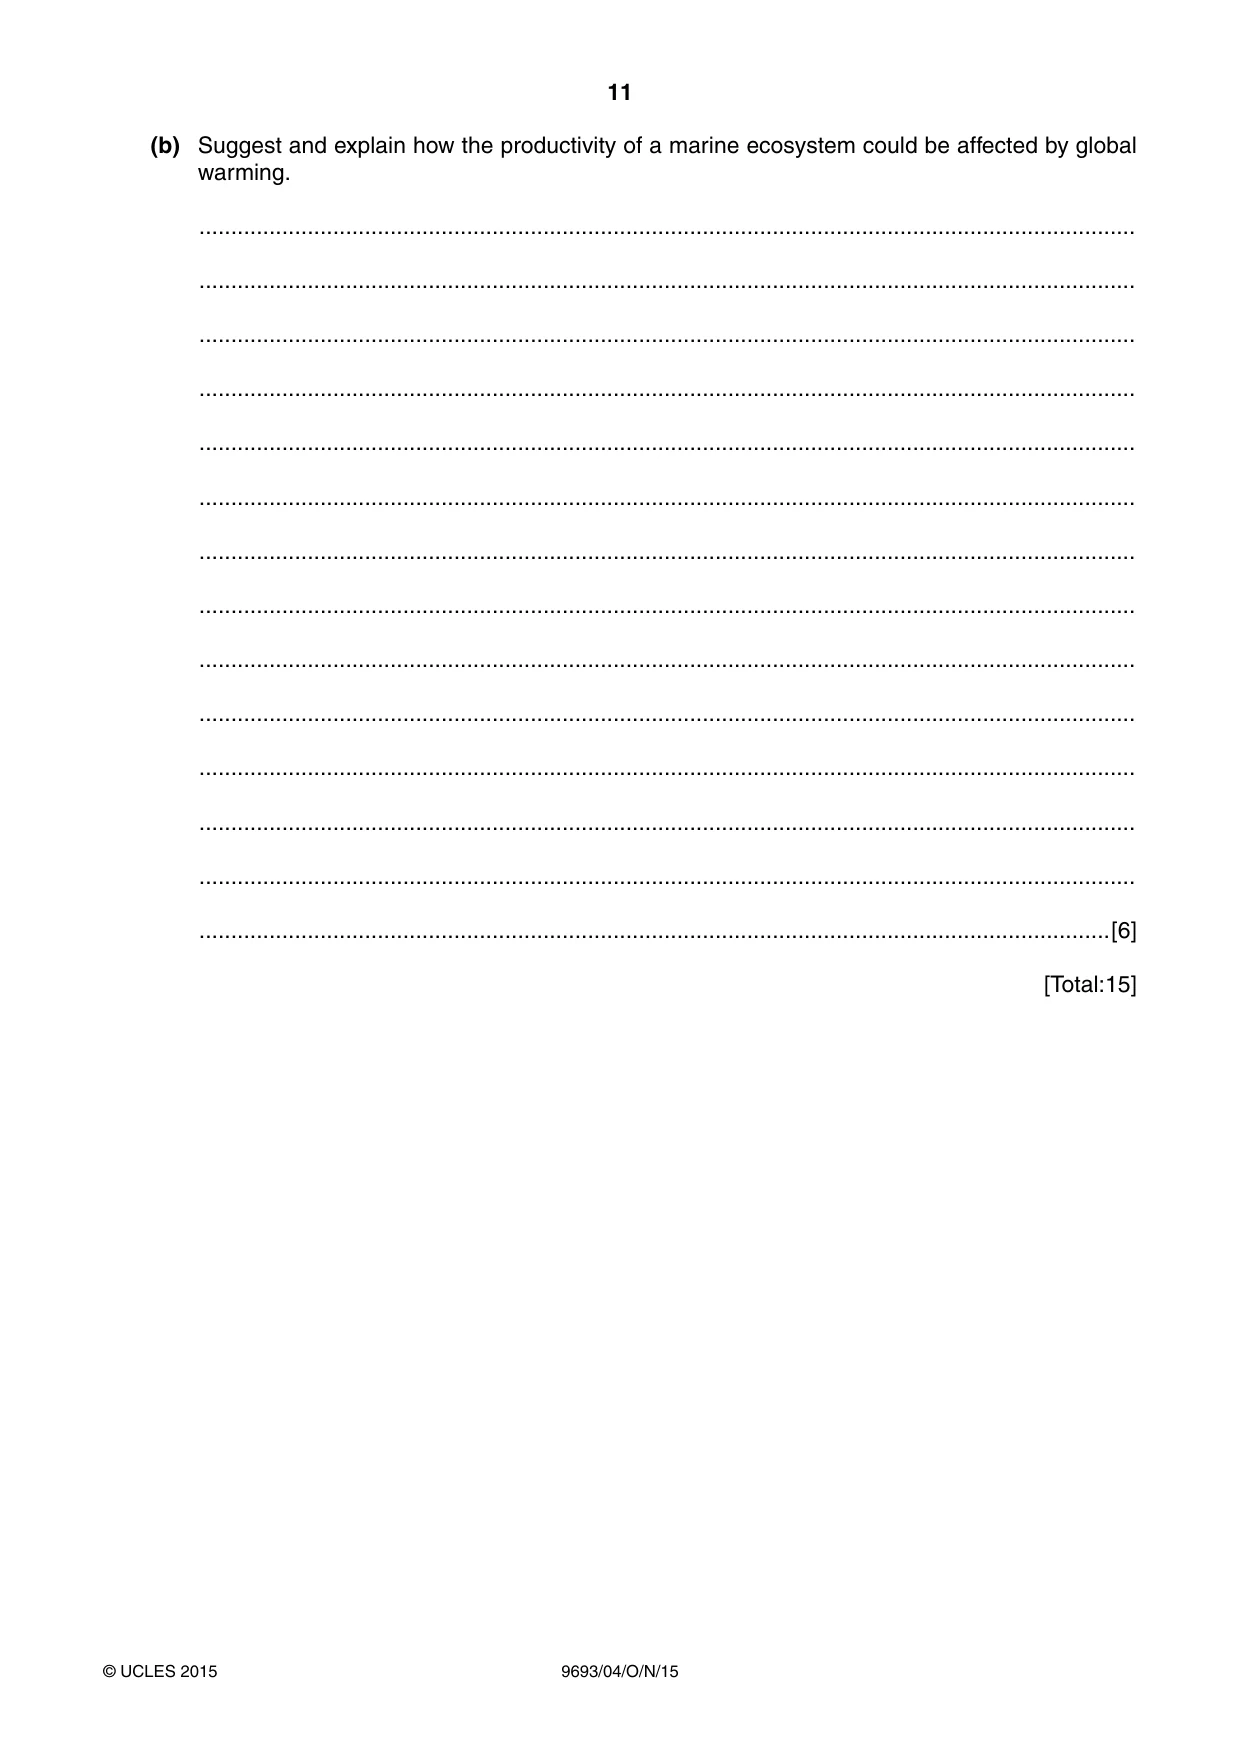
11 9693/04/O/N/15 © UCLES 2015 (b) Suggest and explain how the productivity of a marine ecosystem could be affected by global warming. … … … … … … … … … … … … … …[6] [Total:15]
Question paper, page 12
12 9693/04/O/N/15 © UCLES 2015 Permission to reproduce items where third-party owned material protected by copyright is included has been sought and cleared where possible. Every reasonable effort has been made by the publisher (UCLES) to trace copyright holders, but if any items requiring clearance have unwittingly been included, the publisher will be pleased to make amends at the earliest possible opportunity. To avoid the issue of disclosure of answer-related information to candidates, all copyright acknowledgements are reproduced online in the Cambridge International Examinations Copyright Acknowledgements Booklet. This is produced for each series of examinations and is freely available to download at www.cie.org.uk after the live examination series. Cambridge International Examinations is part of the Cambridge Assessment Group. Cambridge Assessment is the brand name of University of Cambridge Local Examinations Syndicate (UCLES), which is itself a department of the University of Cambridge. BLANK PAGE
What you needed in this session
Cambridge’s own grade thresholds for 2015 Oct/Nov, Paper 4 · Variant 1. A higher threshold means an easier paper — the bar moves with how the cohort did.