Cambridge A Level Geography 9696 — 2022 May/June Paper 1 · Variant 3
9696/13/M/J/22 · 60 marks · ≈68 min
The question paper and its mark scheme, free to read here and free to download. This is Cambridge’s own paper, exactly as it was sat.
Question paper4 pages

Mark scheme15 pages
Answers below. Sit the paper first if you are practising.
Paper as text
Question paper, page 1
This document has 4 pages. Any blank pages are indicated. [Turn over DC (LE) 313972 © UCLES 2022 * 9 7 5 7 7 4 3 3 7 7 * Cambridge International AS & A Level GEOGRAPHY 9696/13 Paper 1 Core Physical Geography May/June 2022 1 hour 30 minutes You must answer on the enclosed answer booklet. You will need: Answer booklet (enclosed) Insert (enclosed) INSTRUCTIONS ● Answer four questions in total: Section A: answer all questions. Section B: answer one question. ● Follow the instructions on the front cover of the answer booklet. If you need additional answer paper, ask the invigilator for a continuation booklet. ● Sketch maps and diagrams should be drawn whenever they serve to illustrate an answer. INFORMATION ● The total mark for this paper is 60. ● The number of marks for each question or part question is shown in brackets [ ]. ● The insert contains all the resources referred to in the questions.
Question paper, page 2
2 9696/13/M/J/22 © UCLES 2022 Section A Answer all questions in this section. All questions are worth 10 marks. Hydrology and fluvial geomorphology 1 Fig. 1.1 and Fig. 1.2 show the annual hydrographs for two rivers. (a) (i) State the highest value of 5-year average discharge for River Fitzroy shown in Fig. 1.1. [1] (ii) Calculate the range of 5-year average discharge for River Tym shown in Fig. 1.2. Show your working. [2] (b) Compare the trends of average monthly discharge shown in Fig. 1.1 and Fig. 1.2. [3] (c) Suggest two reasons for the differences in the annual hydrographs shown in Fig. 1.1 and Fig. 1.2. [4] Atmosphere and weather 2 Fig. 2.1 shows the Earth’s global energy budget. (a) Calculate the difference between incoming (shortwave) solar radiation and outgoing longwave radiation at the Equator. Show your working. [2] (b) Describe the pattern of outgoing longwave radiation shown in Fig. 2.1. [3] (c) With reference to Fig. 2.1, explain why there is excess energy at lower latitudes. [5] Rocks and weathering 3 Fig. 3.1 is a photograph which shows a weathered rock. (a) Name the main type of physical weathering shown in Fig. 3.1. [1] (b) Draw a labelled diagram(s) to explain how the rock shown in Fig. 3.1 was weathered. [4] (c) Explain why climate is important in determining the rate of weathering. [5]
Question paper, page 3
3 9696/13/M/J/22 © UCLES 2022 Section B Answer one question from this section. All questions are worth 30 marks. Hydrology and fluvial geomorphology 4 (a) (i) Define the hydrological terms stemflow and throughflow. [4] (ii) Briefly explain how underground water may form springs. [3] (b) Describe and explain how a meander forms. [8] (c) With the aid of examples, discuss the view that sediment size is the most important influence on deposition in a river. [15] Atmosphere and weather 5 (a) (i) Define the atmospheric terms convection and wind belts. [4] (ii) Briefly describe how solar radiation may be reflected. [3] (b) Explain how human activity can affect the temperature of an urban area. [8] (c) With the aid of examples, assess the extent to which human activity is the main cause of global warming. [15] Rocks and weathering 6 (a) (i) Define the tectonic terms ocean trench and sea floor spreading. [4] (ii) Briefly describe the processes occurring at a conservative plate boundary. [3] (b) Explain why slope processes occur at different rates. [8] (c) ‘Mass movements can never be effectively reduced.’ With the aid of one or more examples, how far do you agree? [15]
Question paper, page 4
4 9696/13/M/J/22 © UCLES 2022 The boundaries and names shown, the designations used and the presentation of material on any maps contained in this question paper/insert do not imply official endorsement or acceptance by Cambridge Assessment International Education concerning the legal status of any country, territory, or area or any of its authorities, or of the delimitation of its frontiers or boundaries. Permission to reproduce items where third-party owned material protected by copyright is included has been sought and cleared where possible. Every reasonable effort has been made by the publisher (UCLES) to trace copyright holders, but if any items requiring clearance have unwittingly been included, the publisher will be pleased to make amends at the earliest possible opportunity. To avoid the issue of disclosure of answer-related information to candidates, all copyright acknowledgements are reproduced online in the Cambridge Assessment International Education Copyright Acknowledgements Booklet. This is produced for each series of examinations and is freely available to download at www.cambridgeinternational.org after the live examination series. Cambridge Assessment International Education is part of Cambridge Assessment. Cambridge Assessment is the brand name of the University of Cambridge Local Examinations Syndicate (UCLES), which is a department of the University of Cambridge. BLANK PAGE
Mark scheme, page 1
This document consists of 15 printed pages. © UCLES 2022 [Turn over Cambridge International AS & A Level GEOGRAPHY 9696/13 Paper 1 Core Physical Geography May/June 2022 MARK SCHEME Maximum Mark: 60 Published This mark scheme is published as an aid to teachers and candidates, to indicate the requirements of the examination. It shows the basis on which Examiners were instructed to award marks. It does not indicate the details of the discussions that took place at an Examiners’ meeting before marking began, which would have considered the acceptability of alternative answers. Mark schemes should be read in conjunction with the question paper and the Principal Examiner Report for Teachers. Cambridge International will not enter into discussions about these mark schemes. Cambridge International is publishing the mark schemes for the May/June 2022 series for most Cambridge IGCSE, Cambridge International A and AS Level and Cambridge Pre-U components, and some Cambridge O Level components.
Mark scheme, page 2
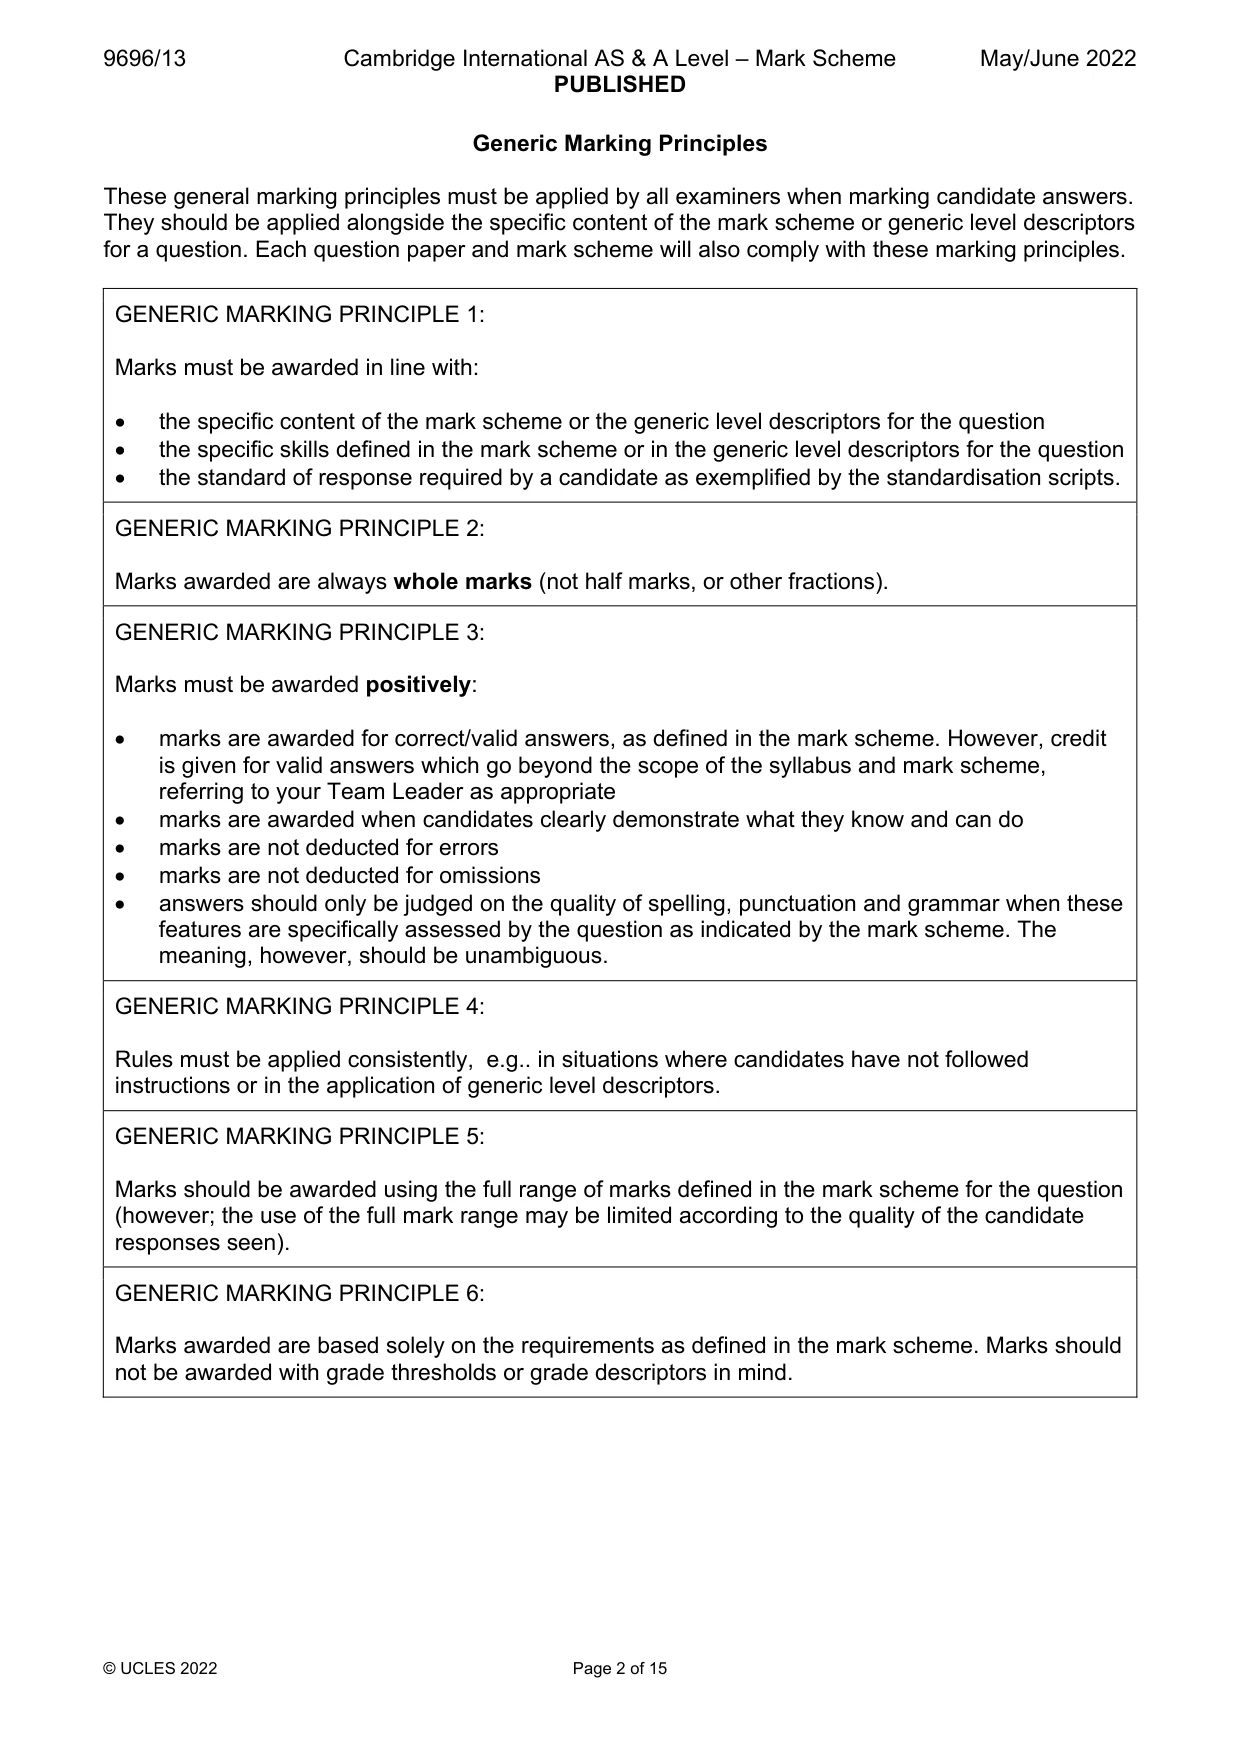
9696/13 Cambridge International AS & A Level – Mark Scheme PUBLISHED May/June 2022 © UCLES 2022 Page 2 of 15 Generic Marking Principles These general marking principles must be applied by all examiners when marking candidate answers. They should be applied alongside the specific content of the mark scheme or generic level descriptors for a question. Each question paper and mark scheme will also comply with these marking principles. GENERIC MARKING PRINCIPLE 1: Marks must be awarded in line with: the specific content of the mark scheme or the generic level descriptors for the question the specific skills defined in the mark scheme or in the generic level descriptors for the question the standard of response required by a candidate as exemplified by the standardisation scripts. GENERIC MARKING PRINCIPLE 2: Marks awarded are always whole marks (not half marks, or other fractions). GENERIC MARKING PRINCIPLE 3: Marks must be awarded positively: marks are awarded for correct/valid answers, as defined in the mark scheme. However, credit is given for valid answers which go beyond the scope of the syllabus and mark scheme, referring to your Team Leader as appropriate marks are awarded when candidates clearly demonstrate what they know and can do marks are not deducted for errors marks are not deducted for omissions answers should only be judged on the quality of spelling, punctuation and grammar when these features are specifically assessed by the question as indicated by the mark scheme. The meaning, however, should be unambiguous. GENERIC MARKING PRINCIPLE 4: Rules must be applied consistently, e.g.. in situations where candidates have not followed instructions or in the application of generic level descriptors. GENERIC MARKING PRINCIPLE 5: Marks should be awarded using the full range of marks defined in the mark scheme for the question (however; the use of the full mark range may be limited according to the quality of the candidate responses seen). GENERIC MARKING PRINCIPLE 6: Marks awarded are based solely on the requirements as defined in the mark scheme. Marks should not be awarded with grade thresholds or grade descriptors in mind.
Mark scheme, page 3
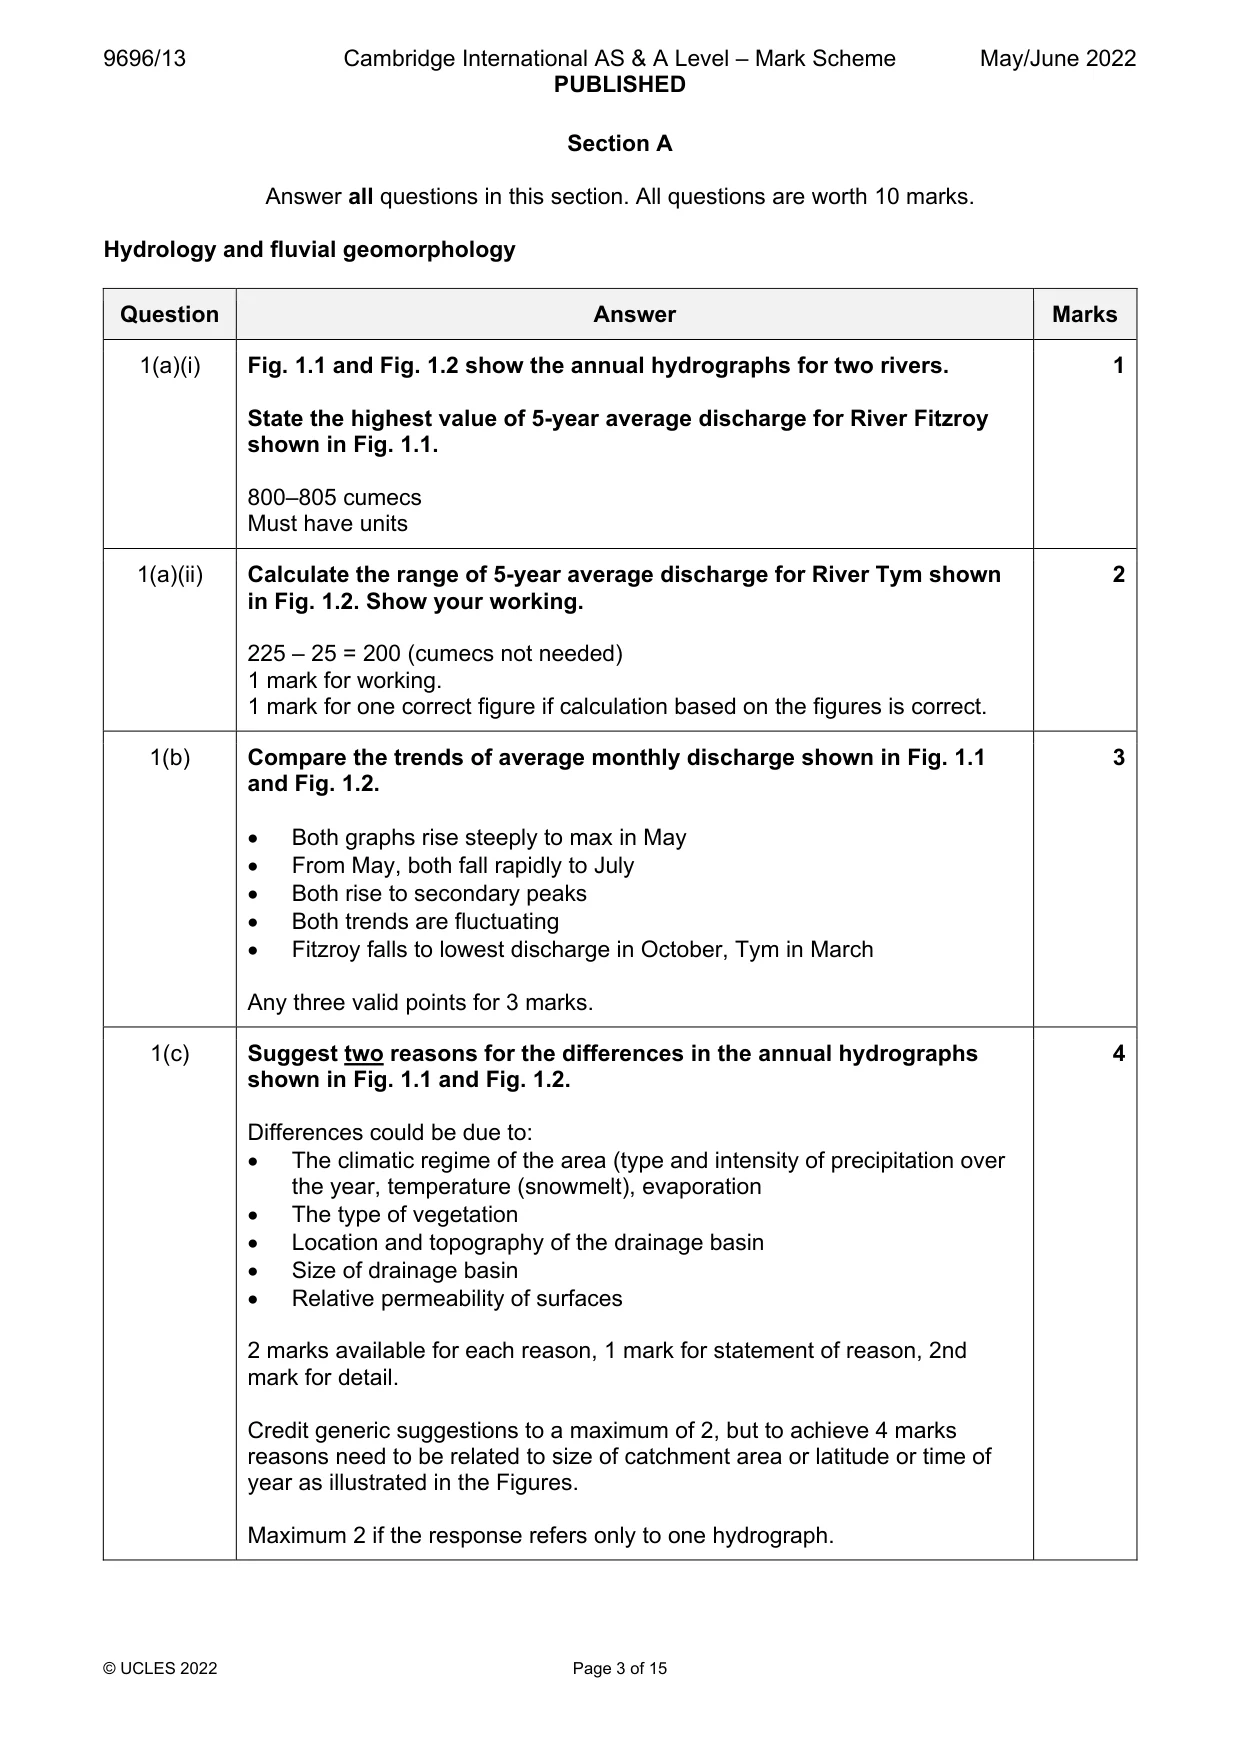
9696/13 Cambridge International AS & A Level – Mark Scheme PUBLISHED May/June 2022 © UCLES 2022 Page 3 of 15 Section A Answer all questions in this section. All questions are worth 10 marks. Hydrology and fluvial geomorphology Question Answer Marks 1(a)(i) Fig. 1.1 and Fig. 1.2 show the annual hydrographs for two rivers. State the highest value of 5-year average discharge for River Fitzroy shown in Fig. 1.1. 800–805 cumecs Must have units 1 1(a)(ii) Calculate the range of 5-year average discharge for River Tym shown in Fig. 1.2. Show your working. 225 – 25 = 200 (cumecs not needed) 1 mark for working. 1 mark for one correct figure if calculation based on the figures is correct. 2 1(b) Compare the trends of average monthly discharge shown in Fig. 1.1 and Fig. 1.2. Both graphs rise steeply to max in May From May, both fall rapidly to July Both rise to secondary peaks Both trends are fluctuating Fitzroy falls to lowest discharge in October, Tym in March Any three valid points for 3 marks. 3 1(c) Suggest two reasons for the differences in the annual hydrographs shown in Fig. 1.1 and Fig. 1.2. Differences could be due to: The climatic regime of the area (type and intensity of precipitation over the year, temperature (snowmelt), evaporation The type of vegetation Location and topography of the drainage basin Size of drainage basin Relative permeability of surfaces 2 marks available for each reason, 1 mark for statement of reason, 2nd mark for detail. Credit generic suggestions to a maximum of 2, but to achieve 4 marks reasons need to be related to size of catchment area or latitude or time of year as illustrated in the Figures. Maximum 2 if the response refers only to one hydrograph. 4
Mark scheme, page 4
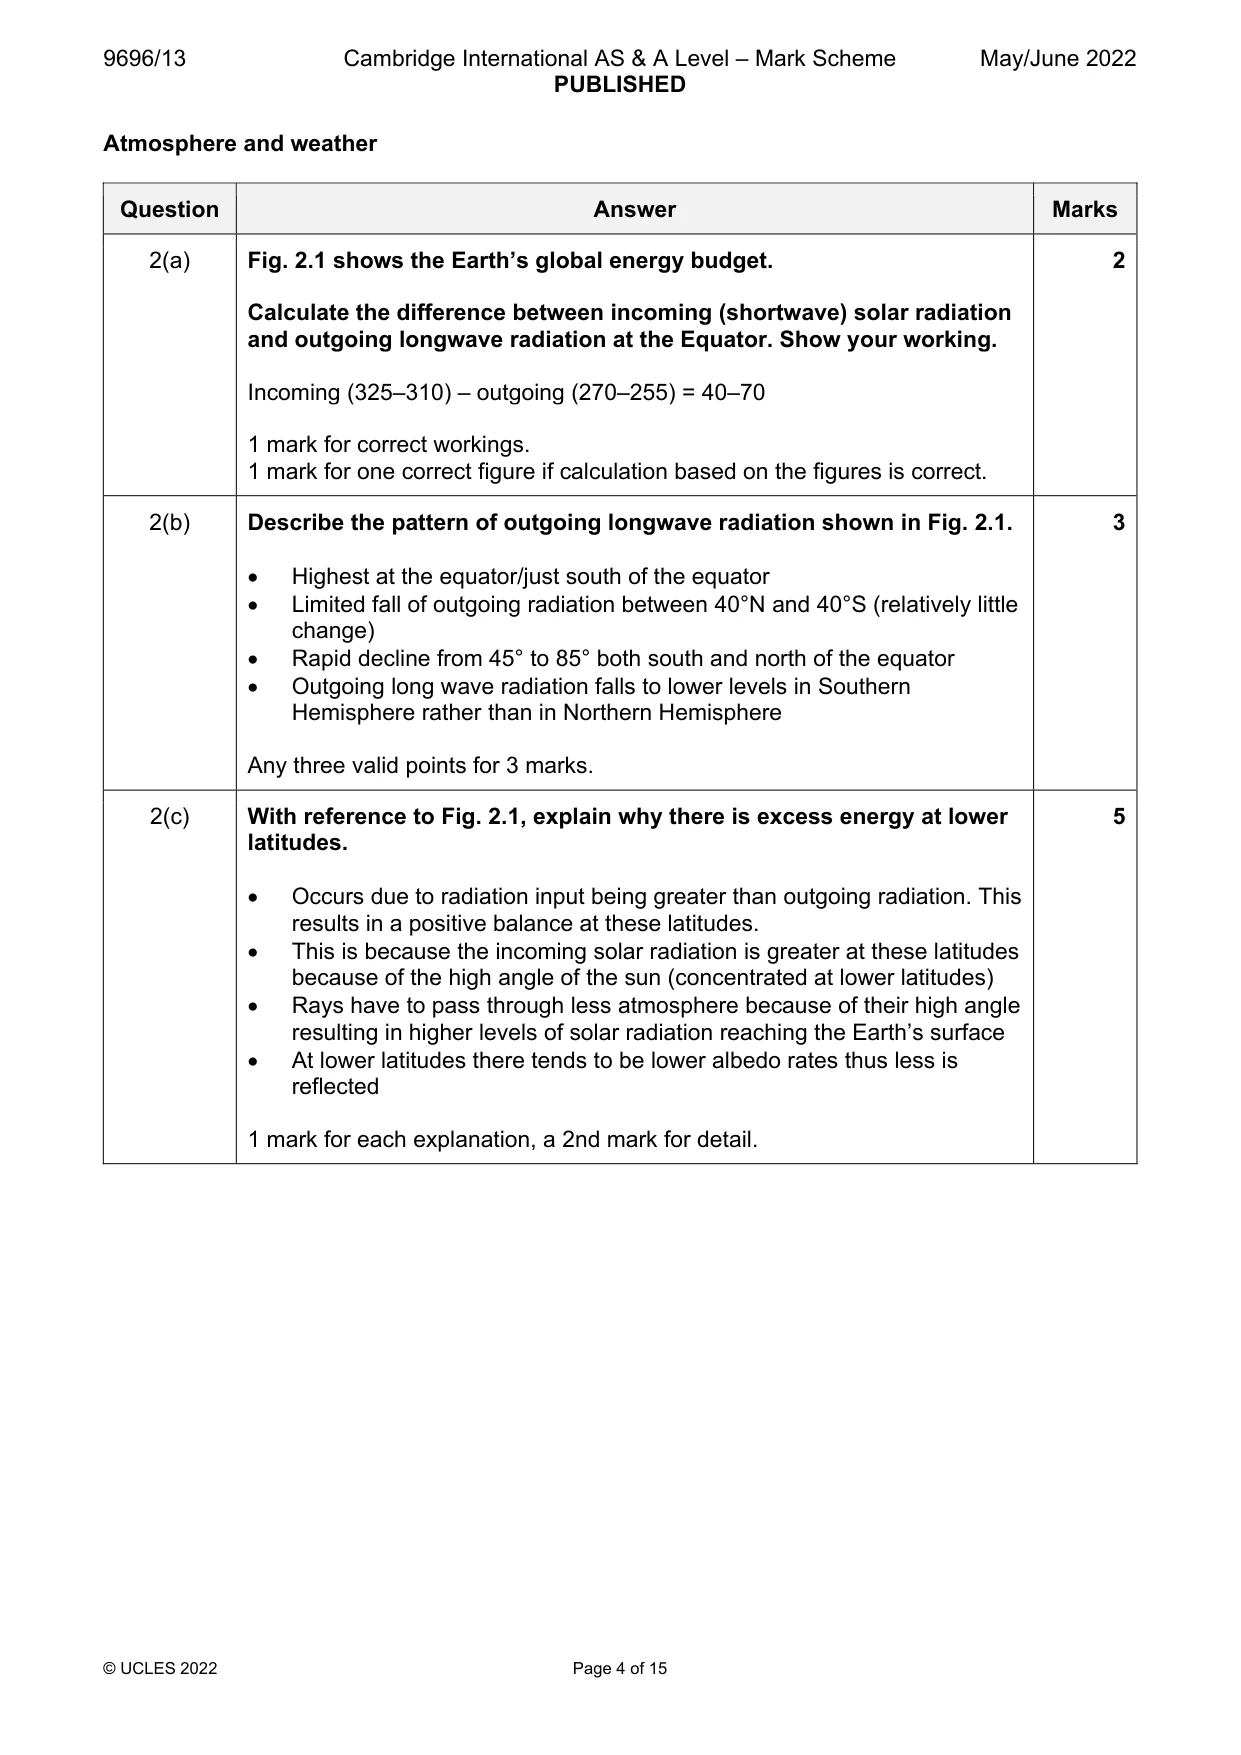
9696/13 Cambridge International AS & A Level – Mark Scheme PUBLISHED May/June 2022 © UCLES 2022 Page 4 of 15 Atmosphere and weather Question Answer Marks 2(a) Fig. 2.1 shows the Earth’s global energy budget. Calculate the difference between incoming (shortwave) solar radiation and outgoing longwave radiation at the Equator. Show your working. Incoming (325–310) – outgoing (270–255) = 40–70 1 mark for correct workings. 1 mark for one correct figure if calculation based on the figures is correct. 2 2(b) Describe the pattern of outgoing longwave radiation shown in Fig. 2.1. Highest at the equator/just south of the equator Limited fall of outgoing radiation between 40°N and 40°S (relatively little change) Rapid decline from 45° to 85° both south and north of the equator Outgoing long wave radiation falls to lower levels in Southern Hemisphere rather than in Northern Hemisphere Any three valid points for 3 marks. 3 2(c) With reference to Fig. 2.1, explain why there is excess energy at lower latitudes. Occurs due to radiation input being greater than outgoing radiation. This results in a positive balance at these latitudes. This is because the incoming solar radiation is greater at these latitudes because of the high angle of the sun (concentrated at lower latitudes) Rays have to pass through less atmosphere because of their high angle resulting in higher levels of solar radiation reaching the Earth’s surface At lower latitudes there tends to be lower albedo rates thus less is reflected 1 mark for each explanation, a 2nd mark for detail. 5
Mark scheme, page 5
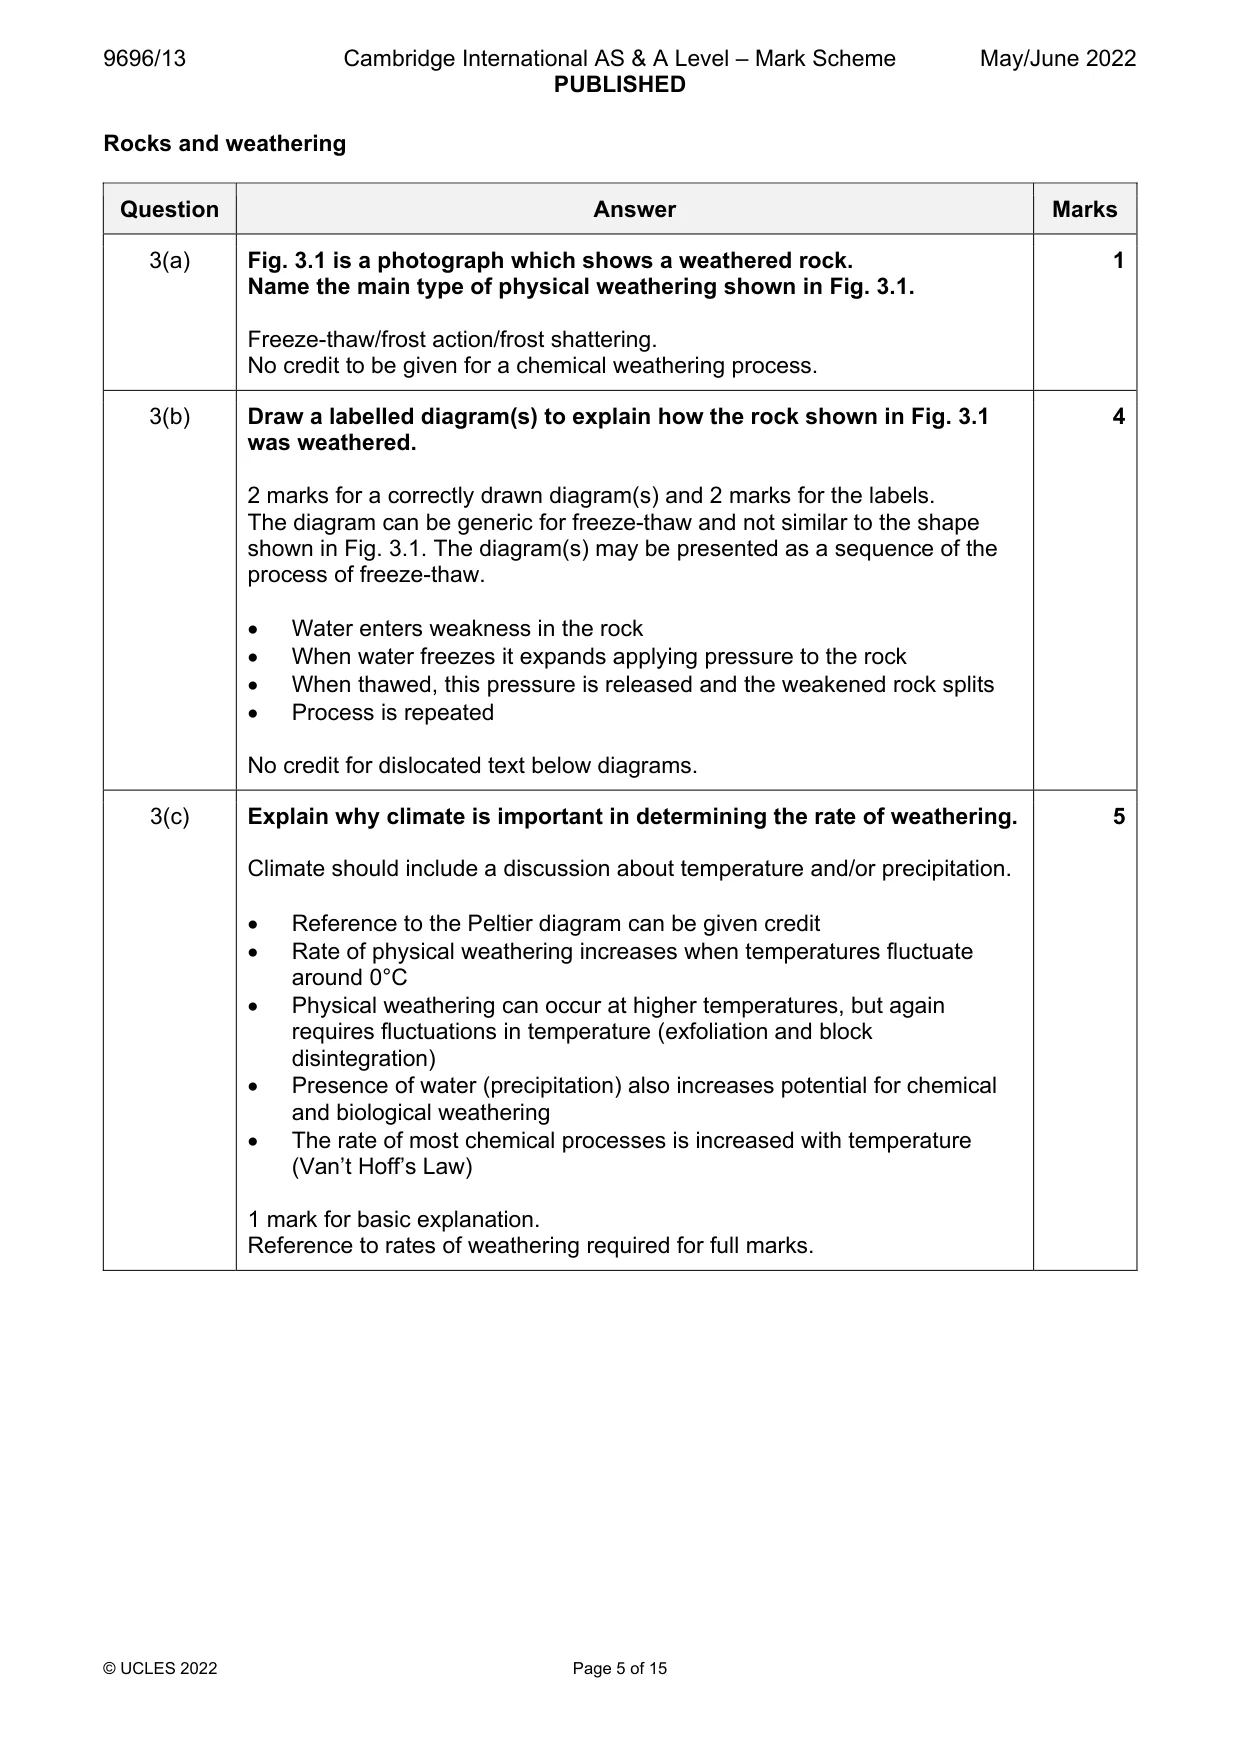
9696/13 Cambridge International AS & A Level – Mark Scheme PUBLISHED May/June 2022 © UCLES 2022 Page 5 of 15 Rocks and weathering Question Answer Marks 3(a) Fig. 3.1 is a photograph which shows a weathered rock. Name the main type of physical weathering shown in Fig. 3.1. Freeze-thaw/frost action/frost shattering. No credit to be given for a chemical weathering process. 1 3(b) Draw a labelled diagram(s) to explain how the rock shown in Fig. 3.1 was weathered. 2 marks for a correctly drawn diagram(s) and 2 marks for the labels. The diagram can be generic for freeze-thaw and not similar to the shape shown in Fig. 3.1. The diagram(s) may be presented as a sequence of the process of freeze-thaw. Water enters weakness in the rock When water freezes it expands applying pressure to the rock When thawed, this pressure is released and the weakened rock splits Process is repeated No credit for dislocated text below diagrams. 4 3(c) Explain why climate is important in determining the rate of weathering. Climate should include a discussion about temperature and/or precipitation. Reference to the Peltier diagram can be given credit Rate of physical weathering increases when temperatures fluctuate around 0°C Physical weathering can occur at higher temperatures, but again requires fluctuations in temperature (exfoliation and block disintegration) Presence of water (precipitation) also increases potential for chemical and biological weathering The rate of most chemical processes is increased with temperature (Van’t Hoff’s Law) 1 mark for basic explanation. Reference to rates of weathering required for full marks. 5
Mark scheme, page 6
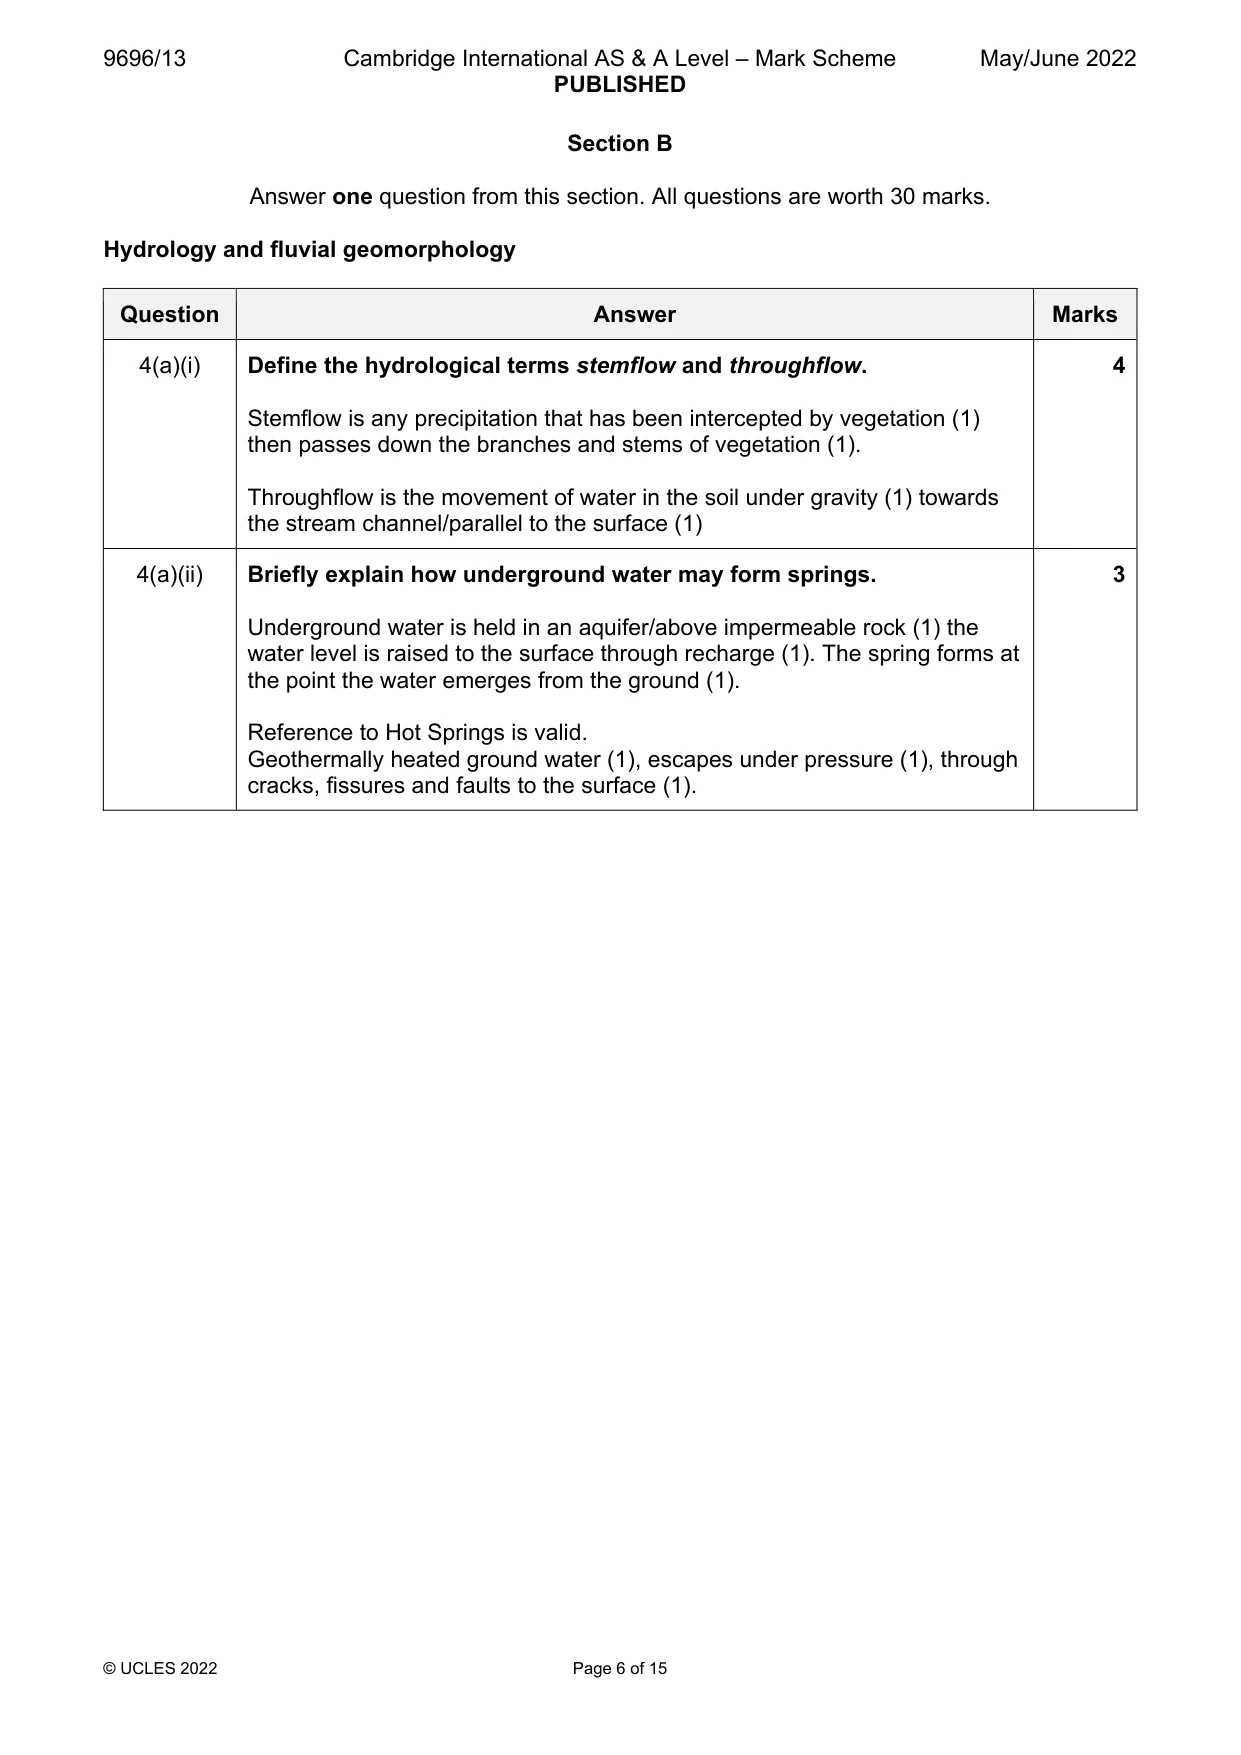
9696/13 Cambridge International AS & A Level – Mark Scheme PUBLISHED May/June 2022 © UCLES 2022 Page 6 of 15 Section B Answer one question from this section. All questions are worth 30 marks. Hydrology and fluvial geomorphology Question Answer Marks 4(a)(i) Define the hydrological terms stemflow and throughflow. Stemflow is any precipitation that has been intercepted by vegetation (1) then passes down the branches and stems of vegetation (1). Throughflow is the movement of water in the soil under gravity (1) towards the stream channel/parallel to the surface (1) 4 4(a)(ii) Briefly explain how underground water may form springs. Underground water is held in an aquifer/above impermeable rock (1) the water level is raised to the surface through recharge (1). The spring forms at the point the water emerges from the ground (1). Reference to Hot Springs is valid. Geothermally heated ground water (1), escapes under pressure (1), through cracks, fissures and faults to the surface (1). 3
Mark scheme, page 7
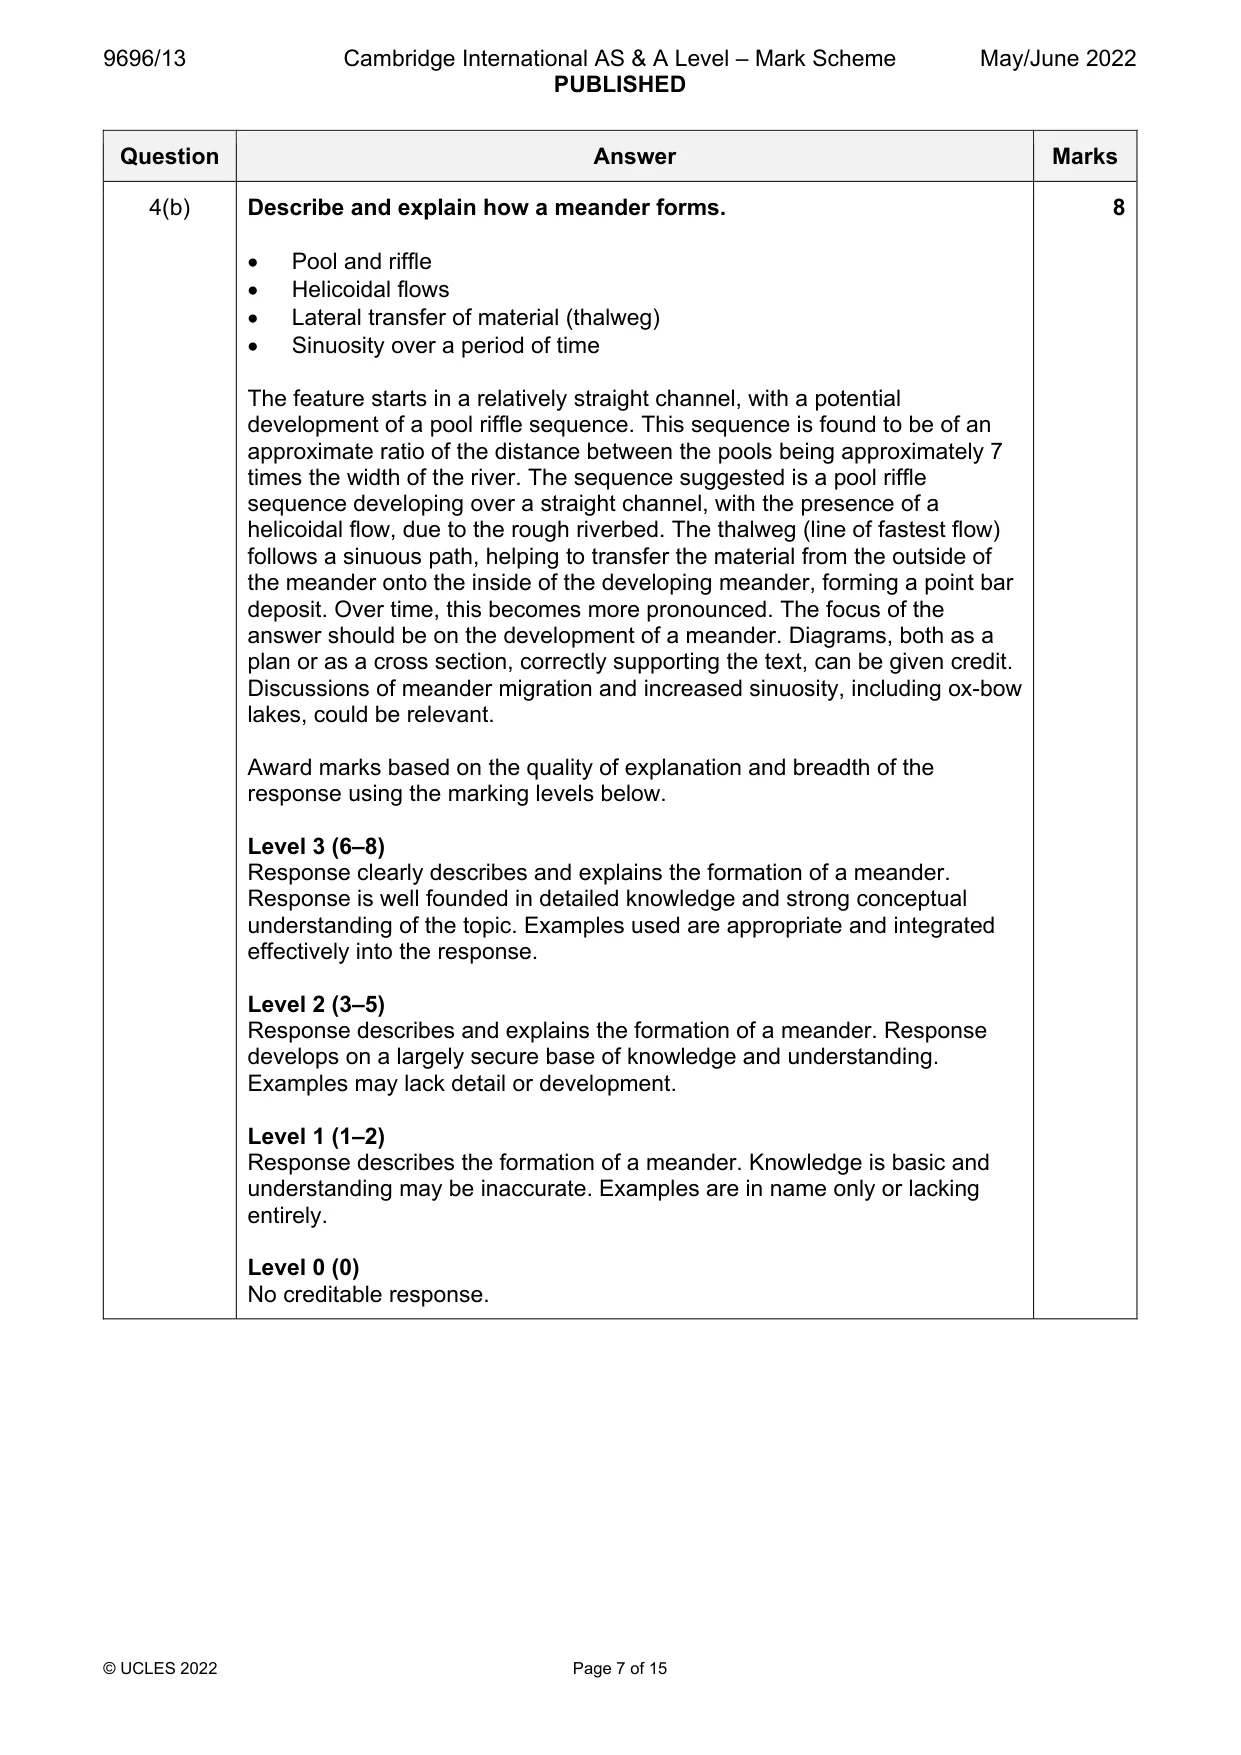
9696/13 Cambridge International AS & A Level – Mark Scheme PUBLISHED May/June 2022 © UCLES 2022 Page 7 of 15 Question Answer Marks 4(b) Describe and explain how a meander forms. Pool and riffle Helicoidal flows Lateral transfer of material (thalweg) Sinuosity over a period of time The feature starts in a relatively straight channel, with a potential development of a pool riffle sequence. This sequence is found to be of an approximate ratio of the distance between the pools being approximately 7 times the width of the river. The sequence suggested is a pool riffle sequence developing over a straight channel, with the presence of a helicoidal flow, due to the rough riverbed. The thalweg (line of fastest flow) follows a sinuous path, helping to transfer the material from the outside of the meander onto the inside of the developing meander, forming a point bar deposit. Over time, this becomes more pronounced. The focus of the answer should be on the development of a meander. Diagrams, both as a plan or as a cross section, correctly supporting the text, can be given credit. Discussions of meander migration and increased sinuosity, including ox-bow lakes, could be relevant. Award marks based on the quality of explanation and breadth of the response using the marking levels below. Level 3 (6–8) Response clearly describes and explains the formation of a meander. Response is well founded in detailed knowledge and strong conceptual understanding of the topic. Examples used are appropriate and integrated effectively into the response. Level 2 (3–5) Response describes and explains the formation of a meander. Response develops on a largely secure base of knowledge and understanding. Examples may lack detail or development. Level 1 (1–2) Response describes the formation of a meander. Knowledge is basic and understanding may be inaccurate. Examples are in name only or lacking entirely. Level 0 (0) No creditable response. 8
Mark scheme, page 8
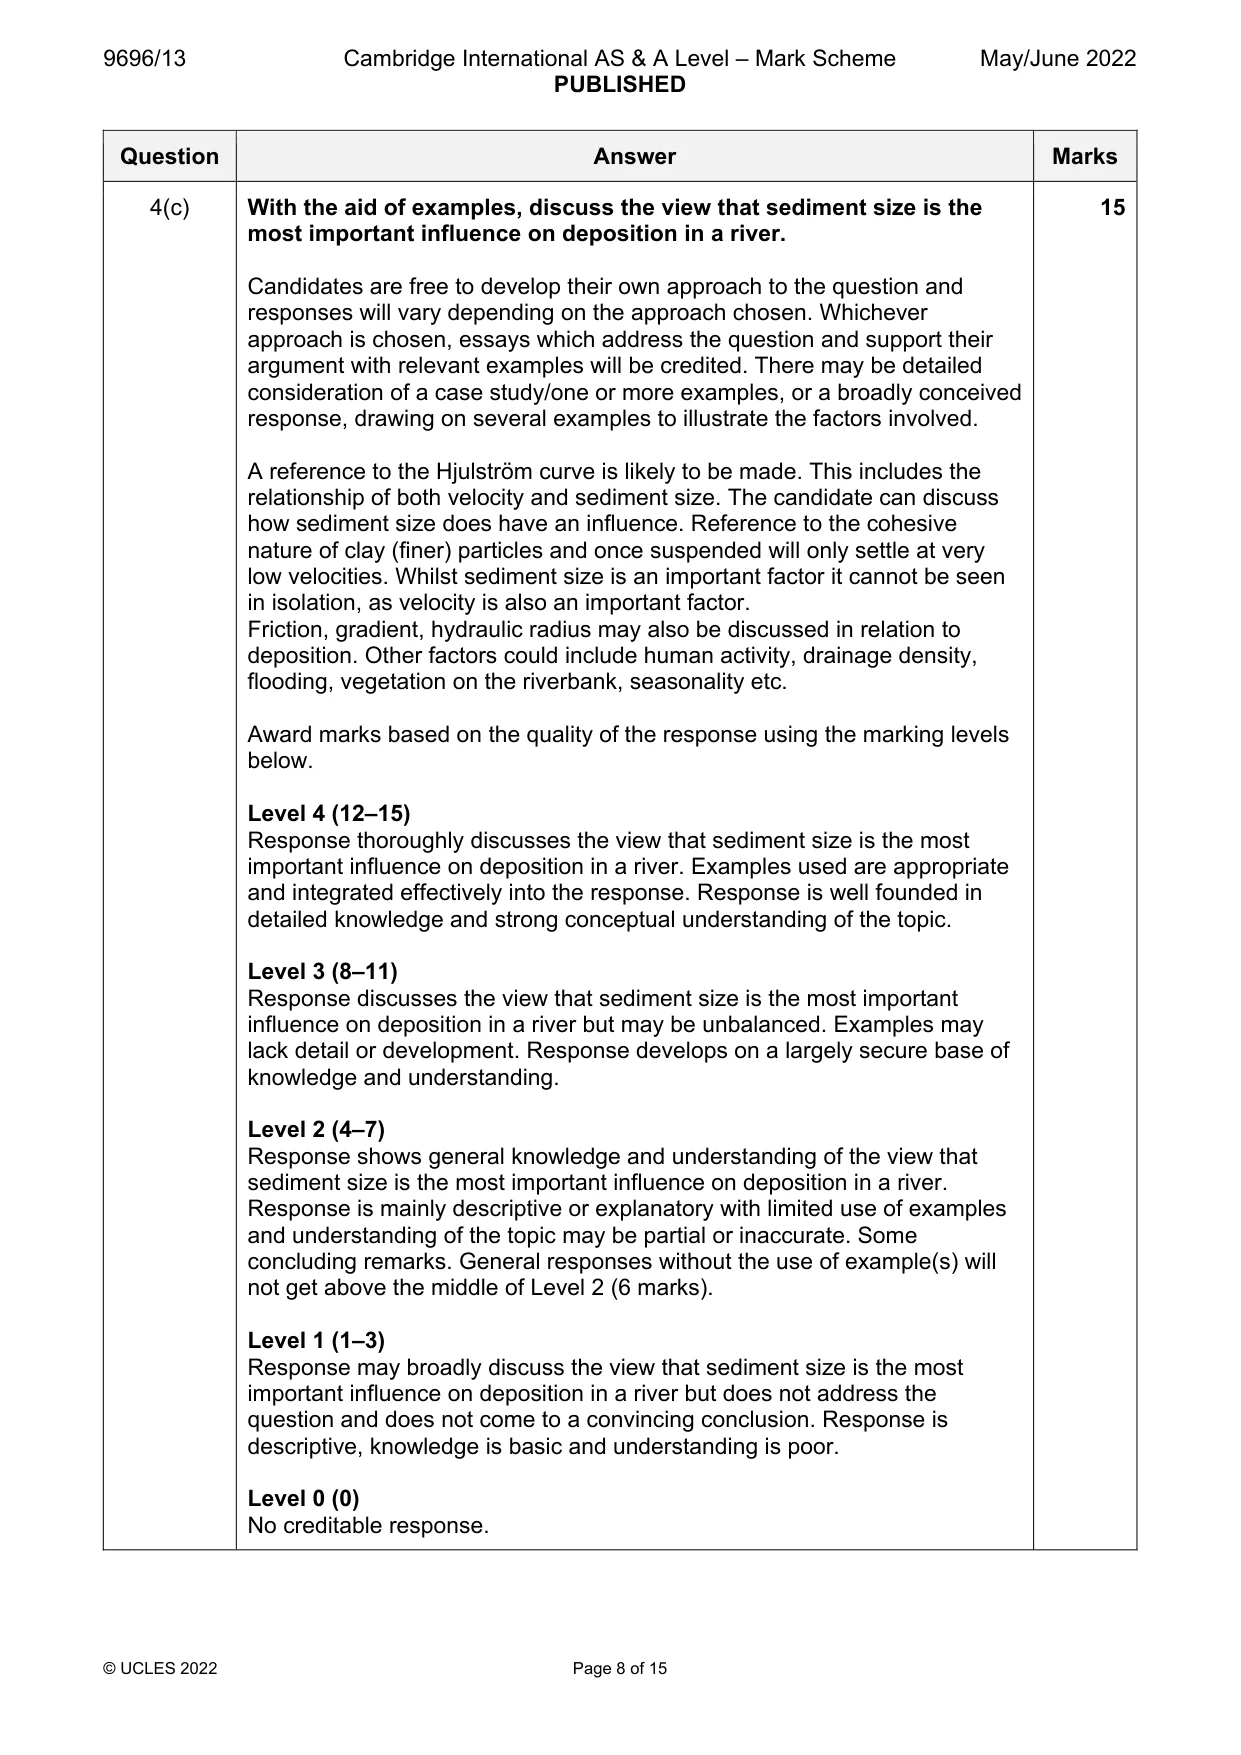
9696/13 Cambridge International AS & A Level – Mark Scheme PUBLISHED May/June 2022 © UCLES 2022 Page 8 of 15 Question Answer Marks 4(c) With the aid of examples, discuss the view that sediment size is the most important influence on deposition in a river. Candidates are free to develop their own approach to the question and responses will vary depending on the approach chosen. Whichever approach is chosen, essays which address the question and support their argument with relevant examples will be credited. There may be detailed consideration of a case study/one or more examples, or a broadly conceived response, drawing on several examples to illustrate the factors involved. A reference to the Hjulström curve is likely to be made. This includes the relationship of both velocity and sediment size. The candidate can discuss how sediment size does have an influence. Reference to the cohesive nature of clay (finer) particles and once suspended will only settle at very low velocities. Whilst sediment size is an important factor it cannot be seen in isolation, as velocity is also an important factor. Friction, gradient, hydraulic radius may also be discussed in relation to deposition. Other factors could include human activity, drainage density, flooding, vegetation on the riverbank, seasonality etc. Award marks based on the quality of the response using the marking levels below. Level 4 (12–15) Response thoroughly discusses the view that sediment size is the most important influence on deposition in a river. Examples used are appropriate and integrated effectively into the response. Response is well founded in detailed knowledge and strong conceptual understanding of the topic. Level 3 (8–11) Response discusses the view that sediment size is the most important influence on deposition in a river but may be unbalanced. Examples may lack detail or development. Response develops on a largely secure base of knowledge and understanding. Level 2 (4–7) Response shows general knowledge and understanding of the view that sediment size is the most important influence on deposition in a river. Response is mainly descriptive or explanatory with limited use of examples and understanding of the topic may be partial or inaccurate. Some concluding remarks. General responses without the use of example(s) will not get above the middle of Level 2 (6 marks). Level 1 (1–3) Response may broadly discuss the view that sediment size is the most important influence on deposition in a river but does not address the question and does not come to a convincing conclusion. Response is descriptive, knowledge is basic and understanding is poor. Level 0 (0) No creditable response. 15
Mark scheme, page 9
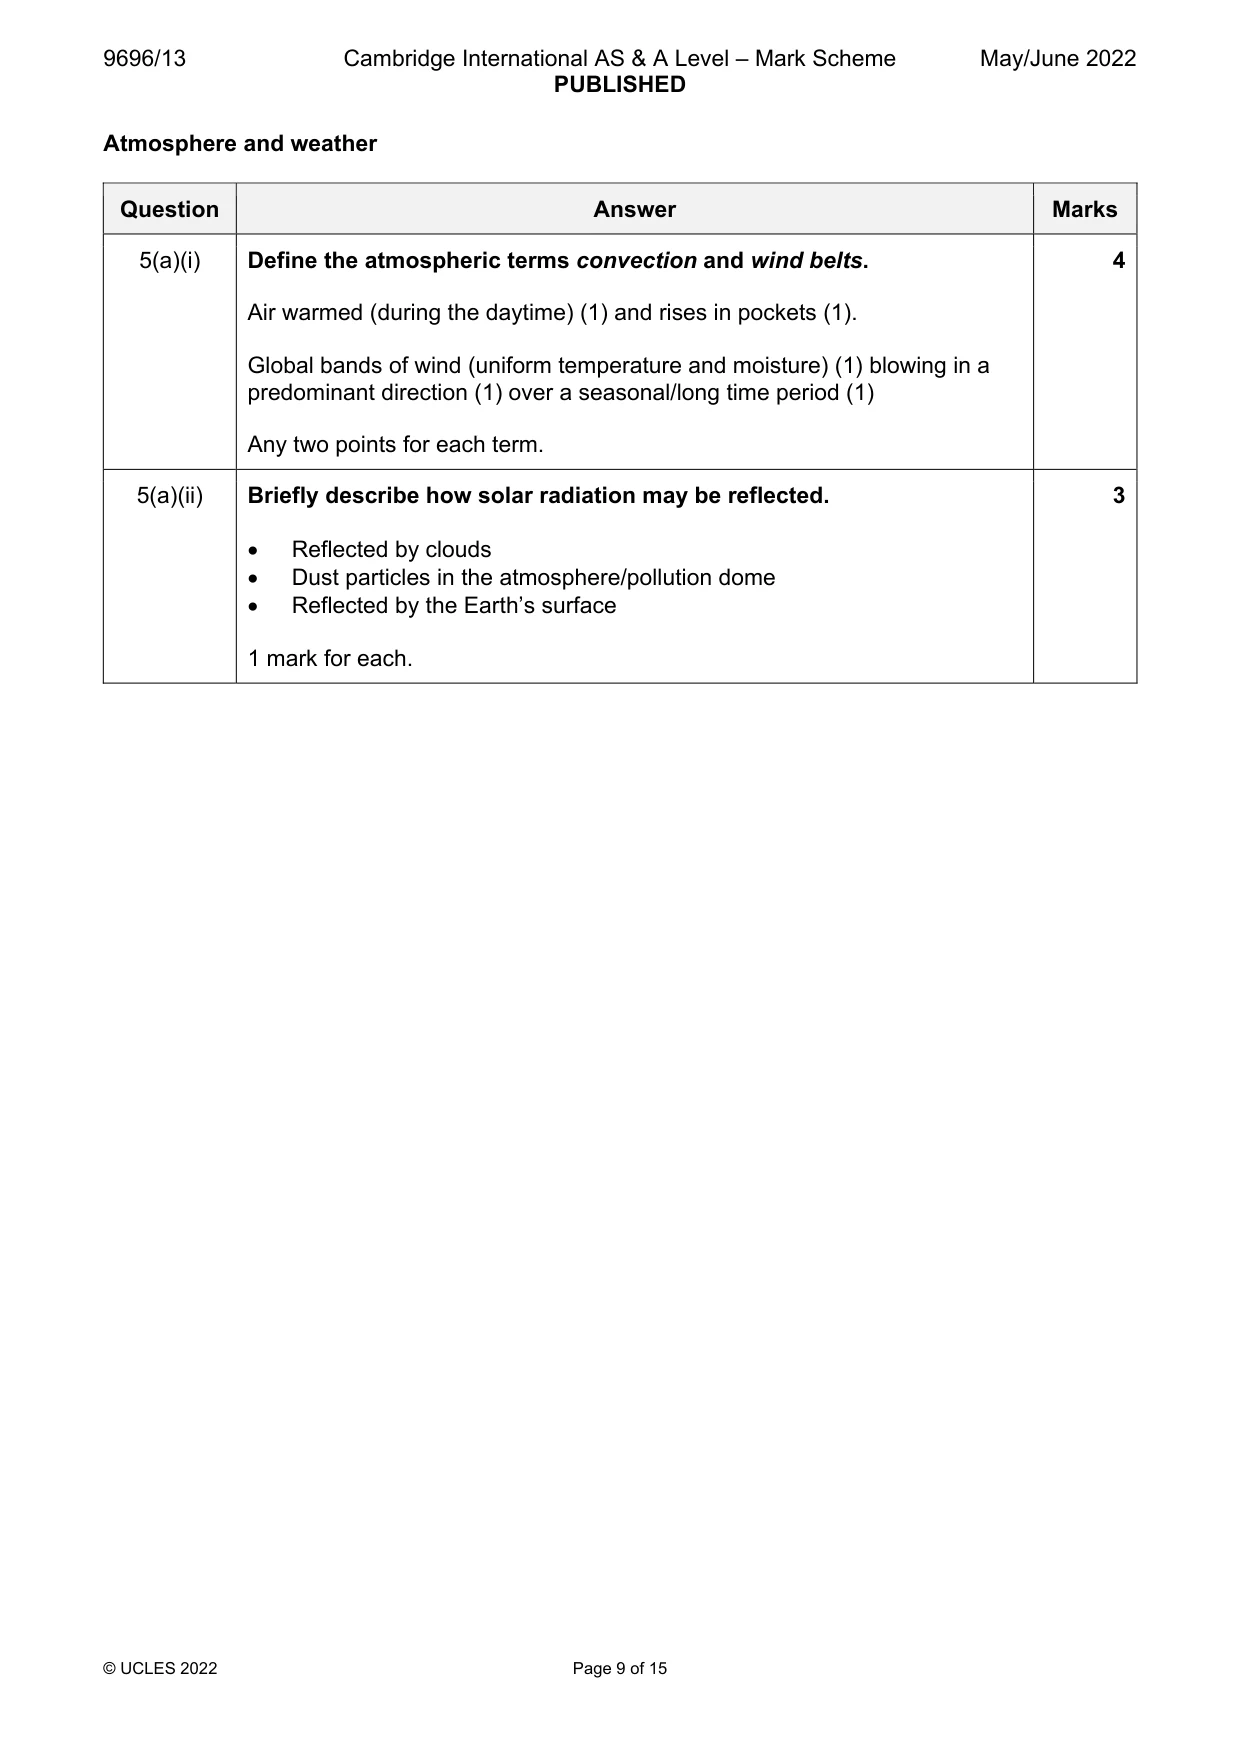
9696/13 Cambridge International AS & A Level – Mark Scheme PUBLISHED May/June 2022 © UCLES 2022 Page 9 of 15 Atmosphere and weather Question Answer Marks 5(a)(i) Define the atmospheric terms convection and wind belts. Air warmed (during the daytime) (1) and rises in pockets (1). Global bands of wind (uniform temperature and moisture) (1) blowing in a predominant direction (1) over a seasonal/long time period (1) Any two points for each term. 4 5(a)(ii) Briefly describe how solar radiation may be reflected. Reflected by clouds Dust particles in the atmosphere/pollution dome Reflected by the Earth’s surface 1 mark for each. 3
Mark scheme, page 10
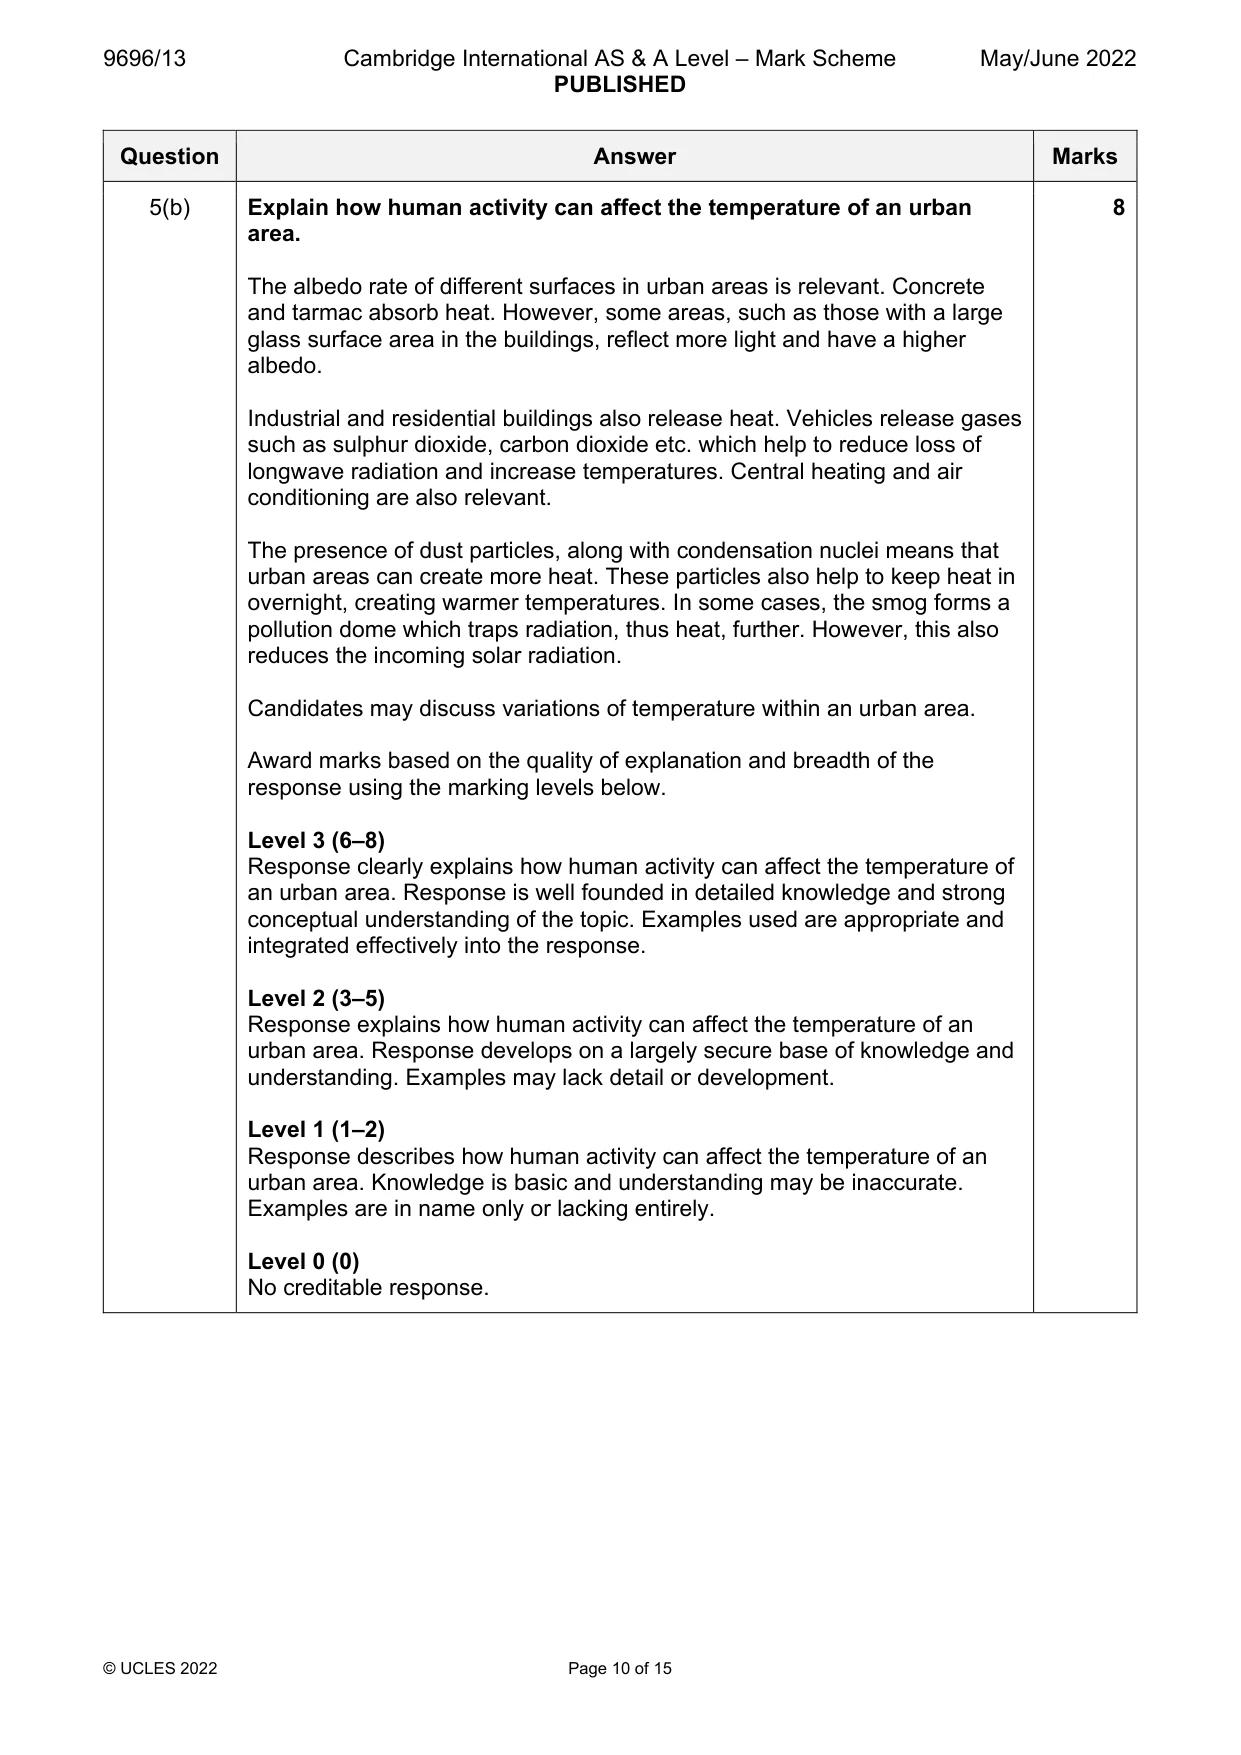
9696/13 Cambridge International AS & A Level – Mark Scheme PUBLISHED May/June 2022 © UCLES 2022 Page 10 of 15 Question Answer Marks 5(b) Explain how human activity can affect the temperature of an urban area. The albedo rate of different surfaces in urban areas is relevant. Concrete and tarmac absorb heat. However, some areas, such as those with a large glass surface area in the buildings, reflect more light and have a higher albedo. Industrial and residential buildings also release heat. Vehicles release gases such as sulphur dioxide, carbon dioxide etc. which help to reduce loss of longwave radiation and increase temperatures. Central heating and air conditioning are also relevant. The presence of dust particles, along with condensation nuclei means that urban areas can create more heat. These particles also help to keep heat in overnight, creating warmer temperatures. In some cases, the smog forms a pollution dome which traps radiation, thus heat, further. However, this also reduces the incoming solar radiation. Candidates may discuss variations of temperature within an urban area. Award marks based on the quality of explanation and breadth of the response using the marking levels below. Level 3 (6–8) Response clearly explains how human activity can affect the temperature of an urban area. Response is well founded in detailed knowledge and strong conceptual understanding of the topic. Examples used are appropriate and integrated effectively into the response. Level 2 (3–5) Response explains how human activity can affect the temperature of an urban area. Response develops on a largely secure base of knowledge and understanding. Examples may lack detail or development. Level 1 (1–2) Response describes how human activity can affect the temperature of an urban area. Knowledge is basic and understanding may be inaccurate. Examples are in name only or lacking entirely. Level 0 (0) No creditable response. 8
Mark scheme, page 11
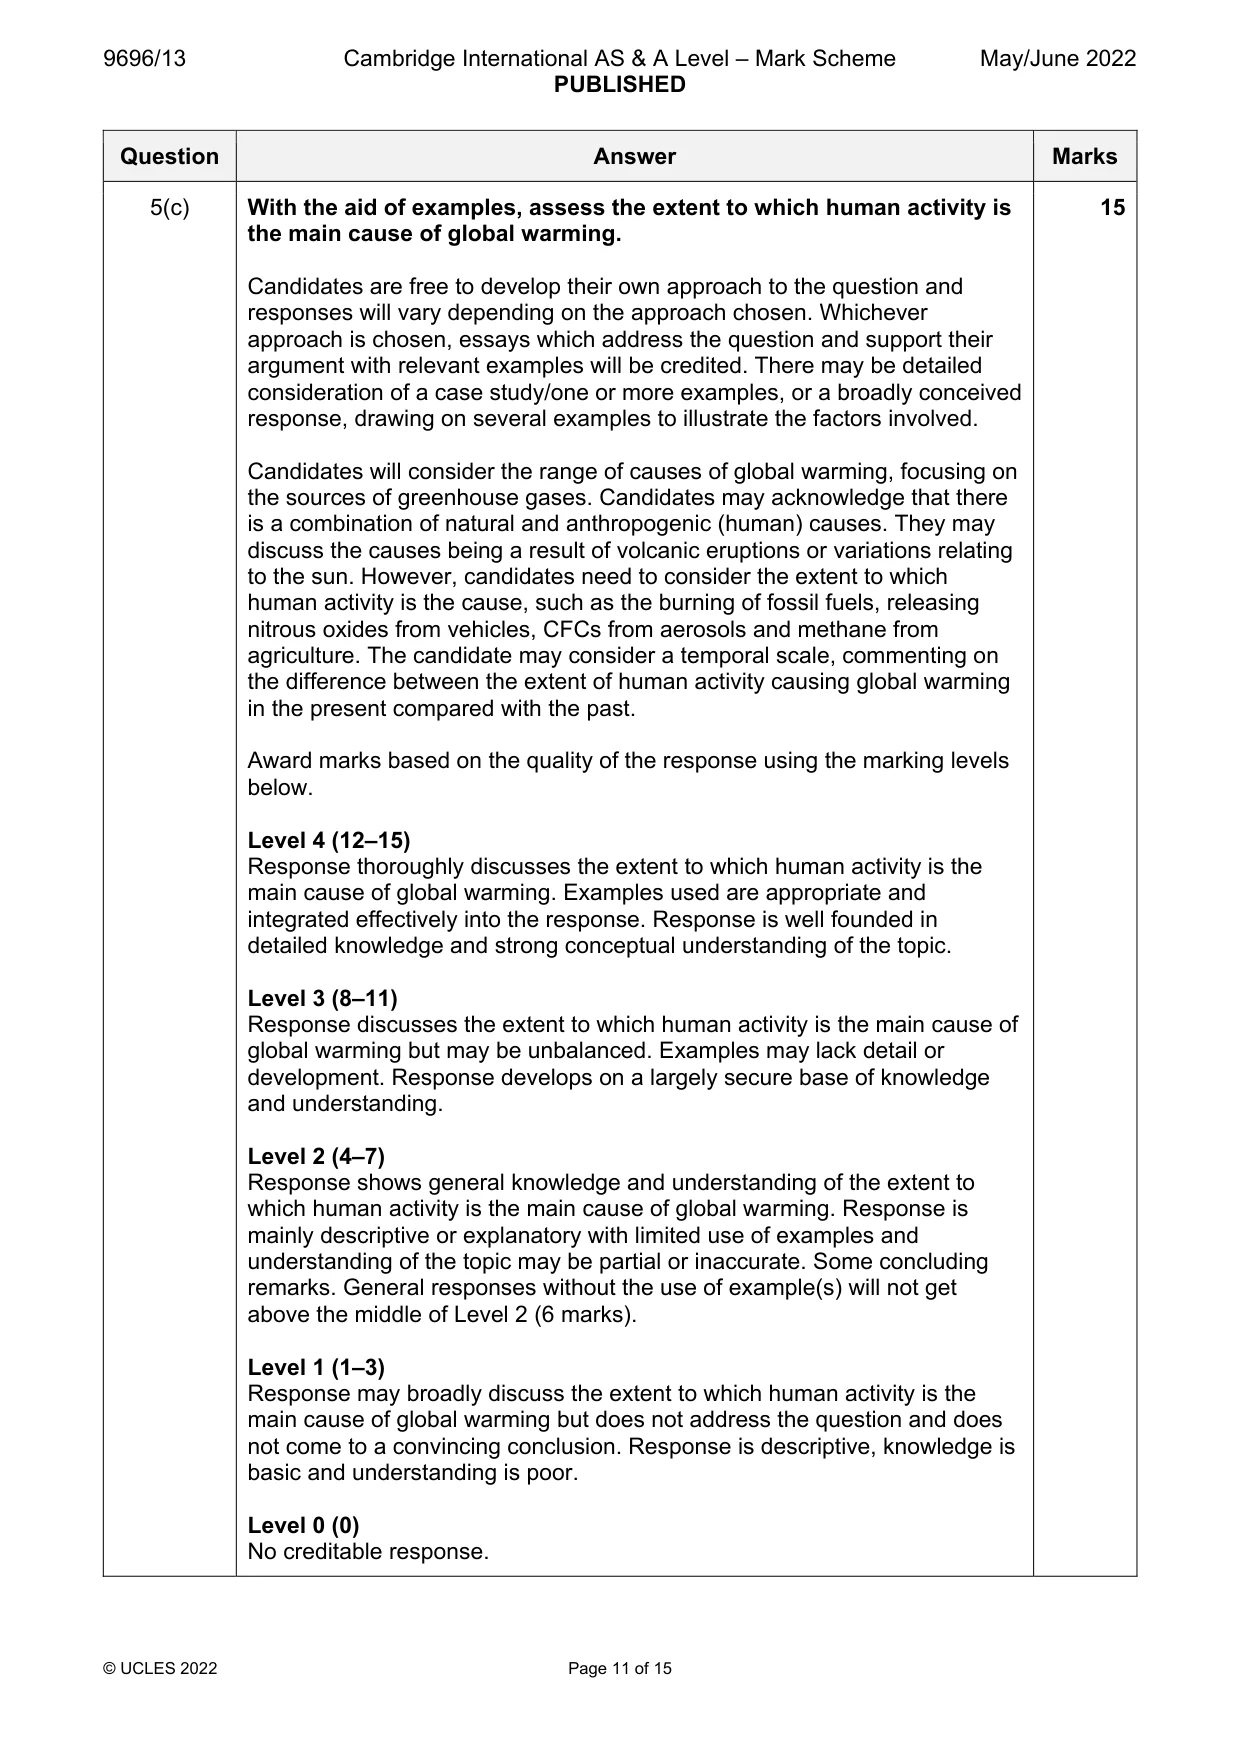
9696/13 Cambridge International AS & A Level – Mark Scheme PUBLISHED May/June 2022 © UCLES 2022 Page 11 of 15 Question Answer Marks 5(c) With the aid of examples, assess the extent to which human activity is the main cause of global warming. Candidates are free to develop their own approach to the question and responses will vary depending on the approach chosen. Whichever approach is chosen, essays which address the question and support their argument with relevant examples will be credited. There may be detailed consideration of a case study/one or more examples, or a broadly conceived response, drawing on several examples to illustrate the factors involved. Candidates will consider the range of causes of global warming, focusing on the sources of greenhouse gases. Candidates may acknowledge that there is a combination of natural and anthropogenic (human) causes. They may discuss the causes being a result of volcanic eruptions or variations relating to the sun. However, candidates need to consider the extent to which human activity is the cause, such as the burning of fossil fuels, releasing nitrous oxides from vehicles, CFCs from aerosols and methane from agriculture. The candidate may consider a temporal scale, commenting on the difference between the extent of human activity causing global warming in the present compared with the past. Award marks based on the quality of the response using the marking levels below. Level 4 (12–15) Response thoroughly discusses the extent to which human activity is the main cause of global warming. Examples used are appropriate and integrated effectively into the response. Response is well founded in detailed knowledge and strong conceptual understanding of the topic. Level 3 (8–11) Response discusses the extent to which human activity is the main cause of global warming but may be unbalanced. Examples may lack detail or development. Response develops on a largely secure base of knowledge and understanding. Level 2 (4–7) Response shows general knowledge and understanding of the extent to which human activity is the main cause of global warming. Response is mainly descriptive or explanatory with limited use of examples and understanding of the topic may be partial or inaccurate. Some concluding remarks. General responses without the use of example(s) will not get above the middle of Level 2 (6 marks). Level 1 (1–3) Response may broadly discuss the extent to which human activity is the main cause of global warming but does not address the question and does not come to a convincing conclusion. Response is descriptive, knowledge is basic and understanding is poor. Level 0 (0) No creditable response. 15
Mark scheme, page 12
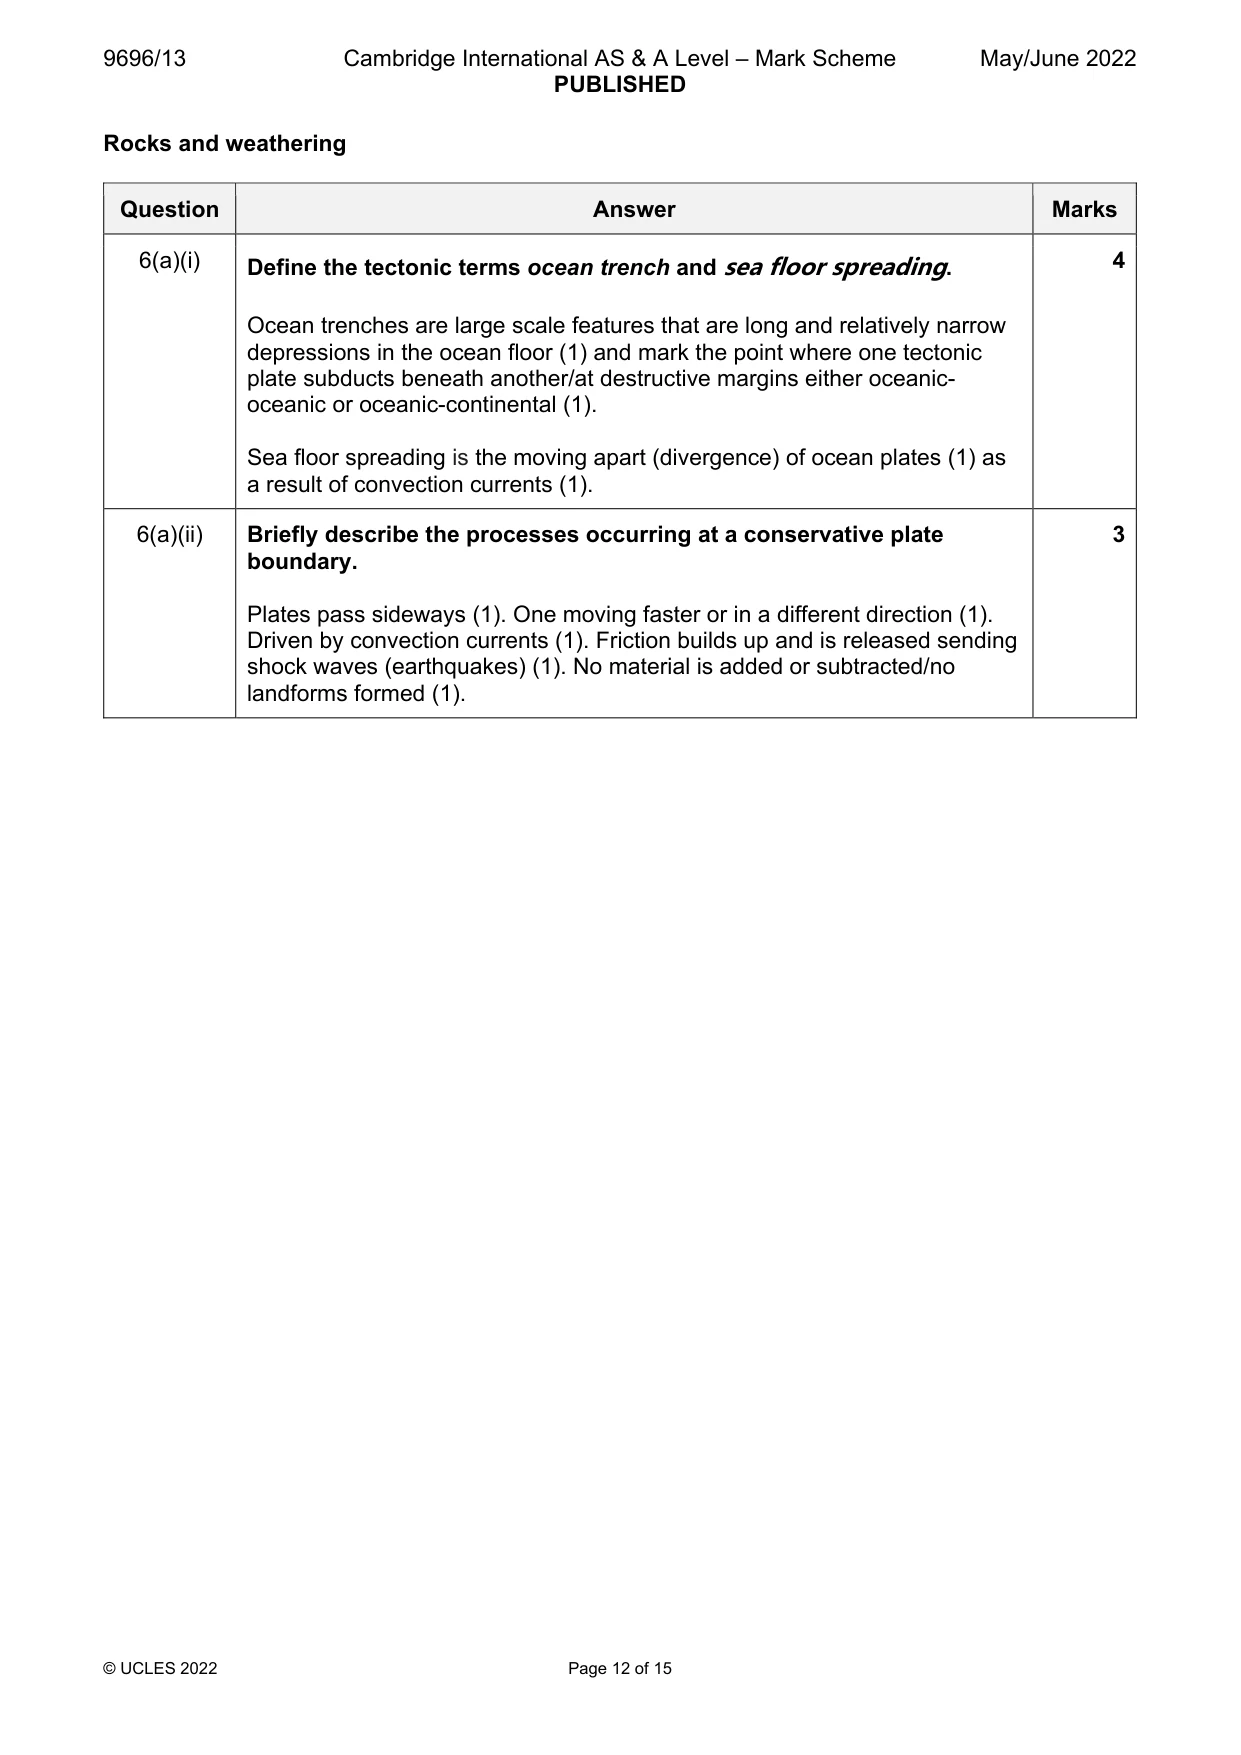
9696/13 Cambridge International AS & A Level – Mark Scheme PUBLISHED May/June 2022 © UCLES 2022 Page 12 of 15 Rocks and weathering Question Answer Marks 6(a)(i) Define the tectonic terms ocean trench and sea floor spreading. Ocean trenches are large scale features that are long and relatively narrow depressions in the ocean floor (1) and mark the point where one tectonic plate subducts beneath another/at destructive margins either oceanic- oceanic or oceanic-continental (1). Sea floor spreading is the moving apart (divergence) of ocean plates (1) as a result of convection currents (1). 4 6(a)(ii) Briefly describe the processes occurring at a conservative plate boundary. Plates pass sideways (1). One moving faster or in a different direction (1). Driven by convection currents (1). Friction builds up and is released sending shock waves (earthquakes) (1). No material is added or subtracted/no landforms formed (1). 3
Mark scheme, page 13
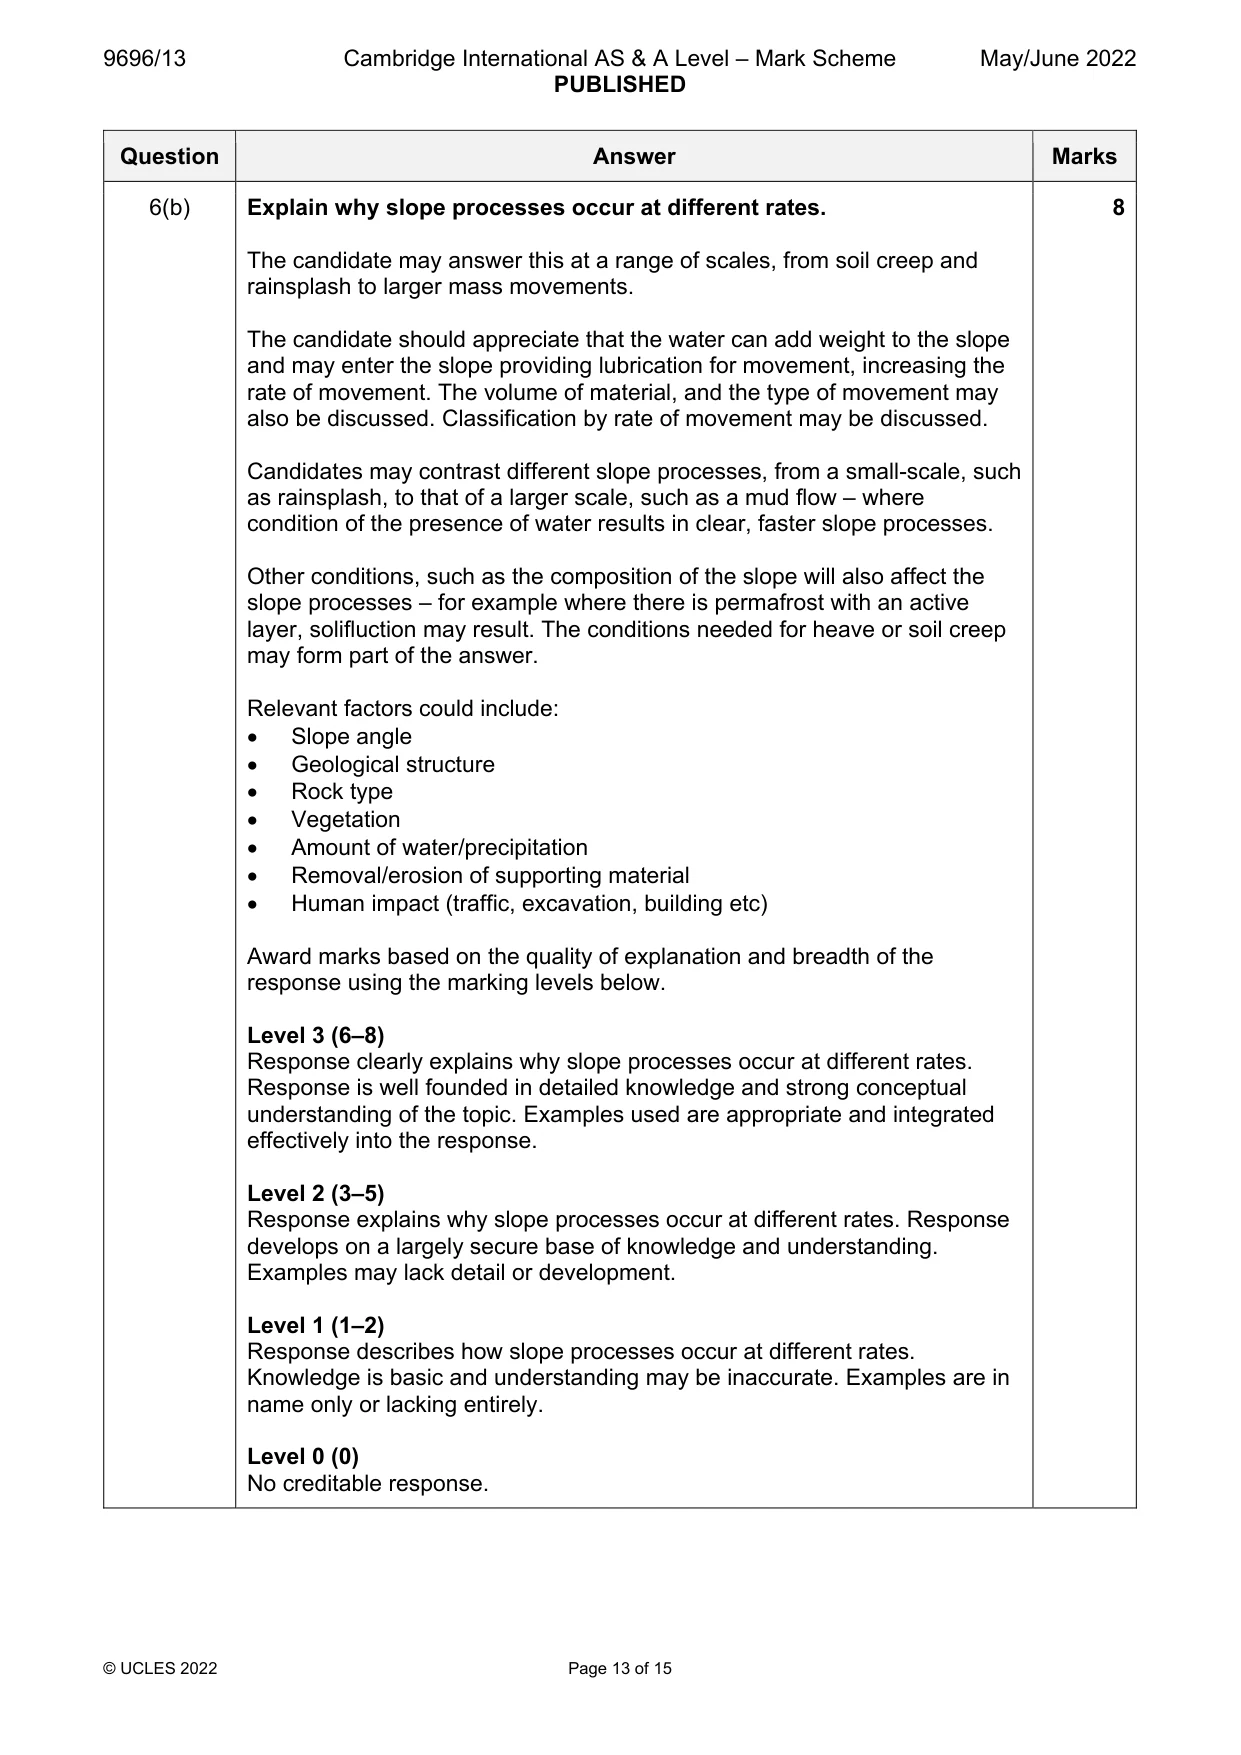
9696/13 Cambridge International AS & A Level – Mark Scheme PUBLISHED May/June 2022 © UCLES 2022 Page 13 of 15 Question Answer Marks 6(b) Explain why slope processes occur at different rates. The candidate may answer this at a range of scales, from soil creep and rainsplash to larger mass movements. The candidate should appreciate that the water can add weight to the slope and may enter the slope providing lubrication for movement, increasing the rate of movement. The volume of material, and the type of movement may also be discussed. Classification by rate of movement may be discussed. Candidates may contrast different slope processes, from a small-scale, such as rainsplash, to that of a larger scale, such as a mud flow – where condition of the presence of water results in clear, faster slope processes. Other conditions, such as the composition of the slope will also affect the slope processes – for example where there is permafrost with an active layer, solifluction may result. The conditions needed for heave or soil creep may form part of the answer. Relevant factors could include: Slope angle Geological structure Rock type Vegetation Amount of water/precipitation Removal/erosion of supporting material Human impact (traffic, excavation, building etc) Award marks based on the quality of explanation and breadth of the response using the marking levels below. Level 3 (6–8) Response clearly explains why slope processes occur at different rates. Response is well founded in detailed knowledge and strong conceptual understanding of the topic. Examples used are appropriate and integrated effectively into the response. Level 2 (3–5) Response explains why slope processes occur at different rates. Response develops on a largely secure base of knowledge and understanding. Examples may lack detail or development. Level 1 (1–2) Response describes how slope processes occur at different rates. Knowledge is basic and understanding may be inaccurate. Examples are in name only or lacking entirely. Level 0 (0) No creditable response. 8
Mark scheme, page 14
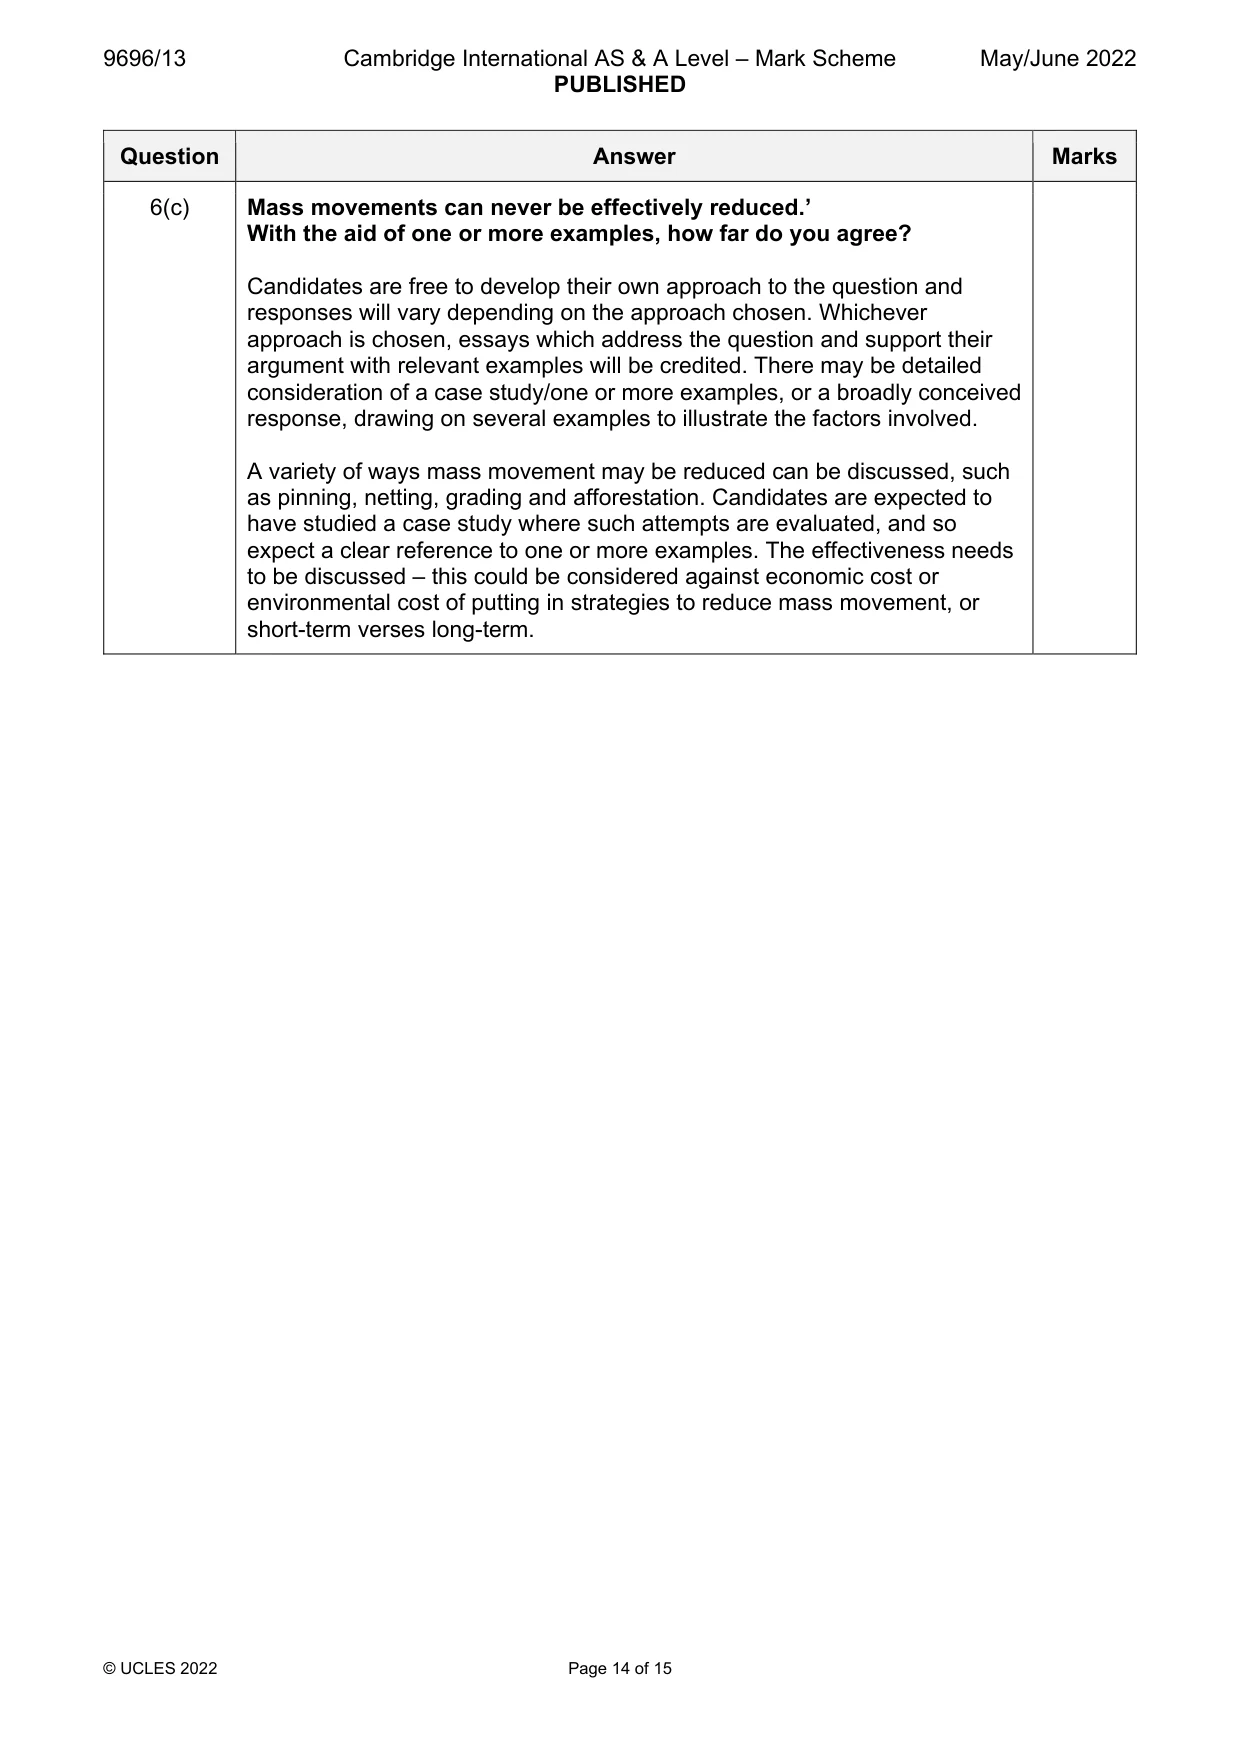
9696/13 Cambridge International AS & A Level – Mark Scheme PUBLISHED May/June 2022 © UCLES 2022 Page 14 of 15 Question Answer Marks 6(c) Mass movements can never be effectively reduced.’ With the aid of one or more examples, how far do you agree? Candidates are free to develop their own approach to the question and responses will vary depending on the approach chosen. Whichever approach is chosen, essays which address the question and support their argument with relevant examples will be credited. There may be detailed consideration of a case study/one or more examples, or a broadly conceived response, drawing on several examples to illustrate the factors involved. A variety of ways mass movement may be reduced can be discussed, such as pinning, netting, grading and afforestation. Candidates are expected to have studied a case study where such attempts are evaluated, and so expect a clear reference to one or more examples. The effectiveness needs to be discussed – this could be considered against economic cost or environmental cost of putting in strategies to reduce mass movement, or short-term verses long-term.
Mark scheme, page 15
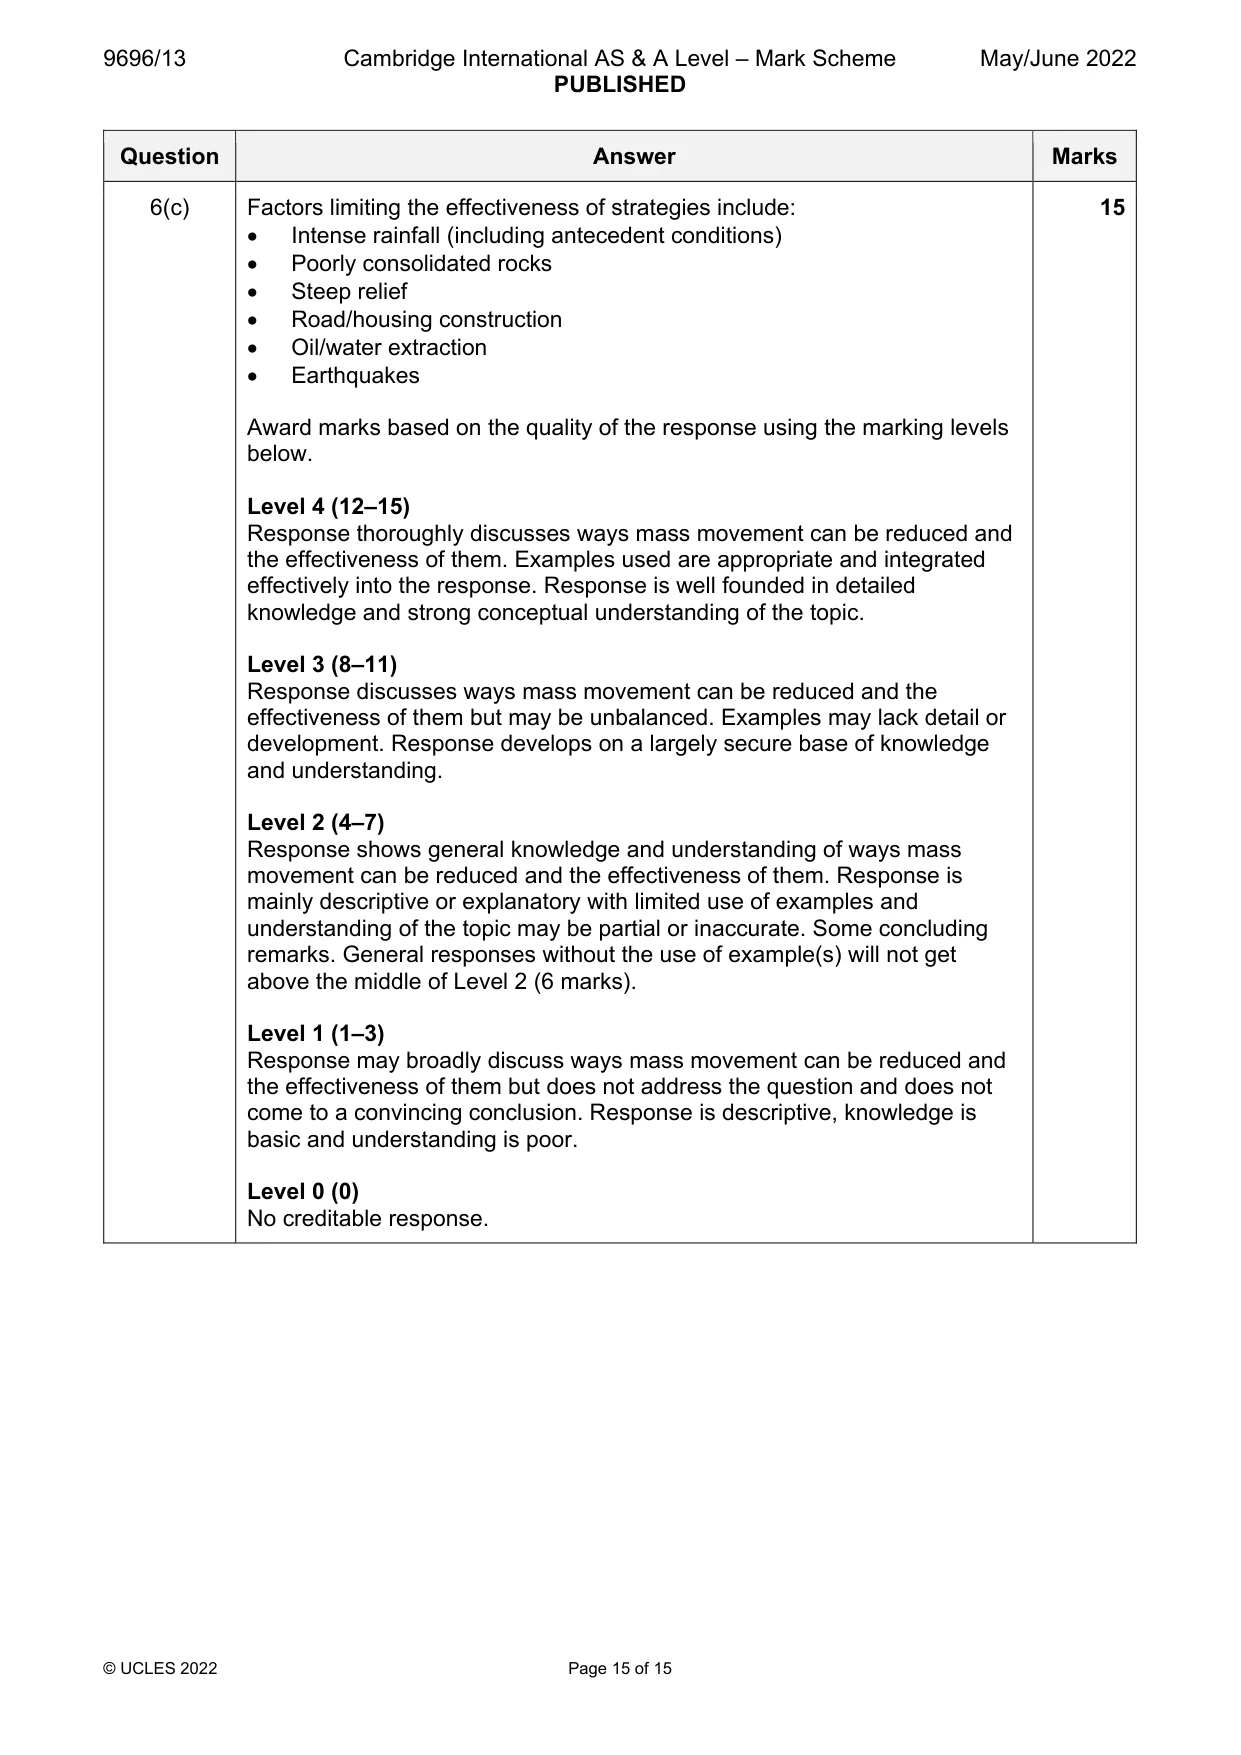
9696/13 Cambridge International AS & A Level – Mark Scheme PUBLISHED May/June 2022 © UCLES 2022 Page 15 of 15 Question Answer Marks 6(c) Factors limiting the effectiveness of strategies include: Intense rainfall (including antecedent conditions) Poorly consolidated rocks Steep relief Road/housing construction Oil/water extraction Earthquakes Award marks based on the quality of the response using the marking levels below. Level 4 (12–15) Response thoroughly discusses ways mass movement can be reduced and the effectiveness of them. Examples used are appropriate and integrated effectively into the response. Response is well founded in detailed knowledge and strong conceptual understanding of the topic. Level 3 (8–11) Response discusses ways mass movement can be reduced and the effectiveness of them but may be unbalanced. Examples may lack detail or development. Response develops on a largely secure base of knowledge and understanding. Level 2 (4–7) Response shows general knowledge and understanding of ways mass movement can be reduced and the effectiveness of them. Response is mainly descriptive or explanatory with limited use of examples and understanding of the topic may be partial or inaccurate. Some concluding remarks. General responses without the use of example(s) will not get above the middle of Level 2 (6 marks). Level 1 (1–3) Response may broadly discuss ways mass movement can be reduced and the effectiveness of them but does not address the question and does not come to a convincing conclusion. Response is descriptive, knowledge is basic and understanding is poor. Level 0 (0) No creditable response. 15
What you needed in this session
Cambridge’s own grade thresholds for 2022 May/June, Paper 1 · Variant 3. A higher threshold means an easier paper — the bar moves with how the cohort did.