Cambridge A Level Geography 9696 — 2025 Oct/Nov Paper 1 · Variant 1
9696/11/O/N/25 · 60 marks · ≈68 min
The question paper and its mark scheme, free to read here and free to download. This is Cambridge’s own paper, exactly as it was sat.
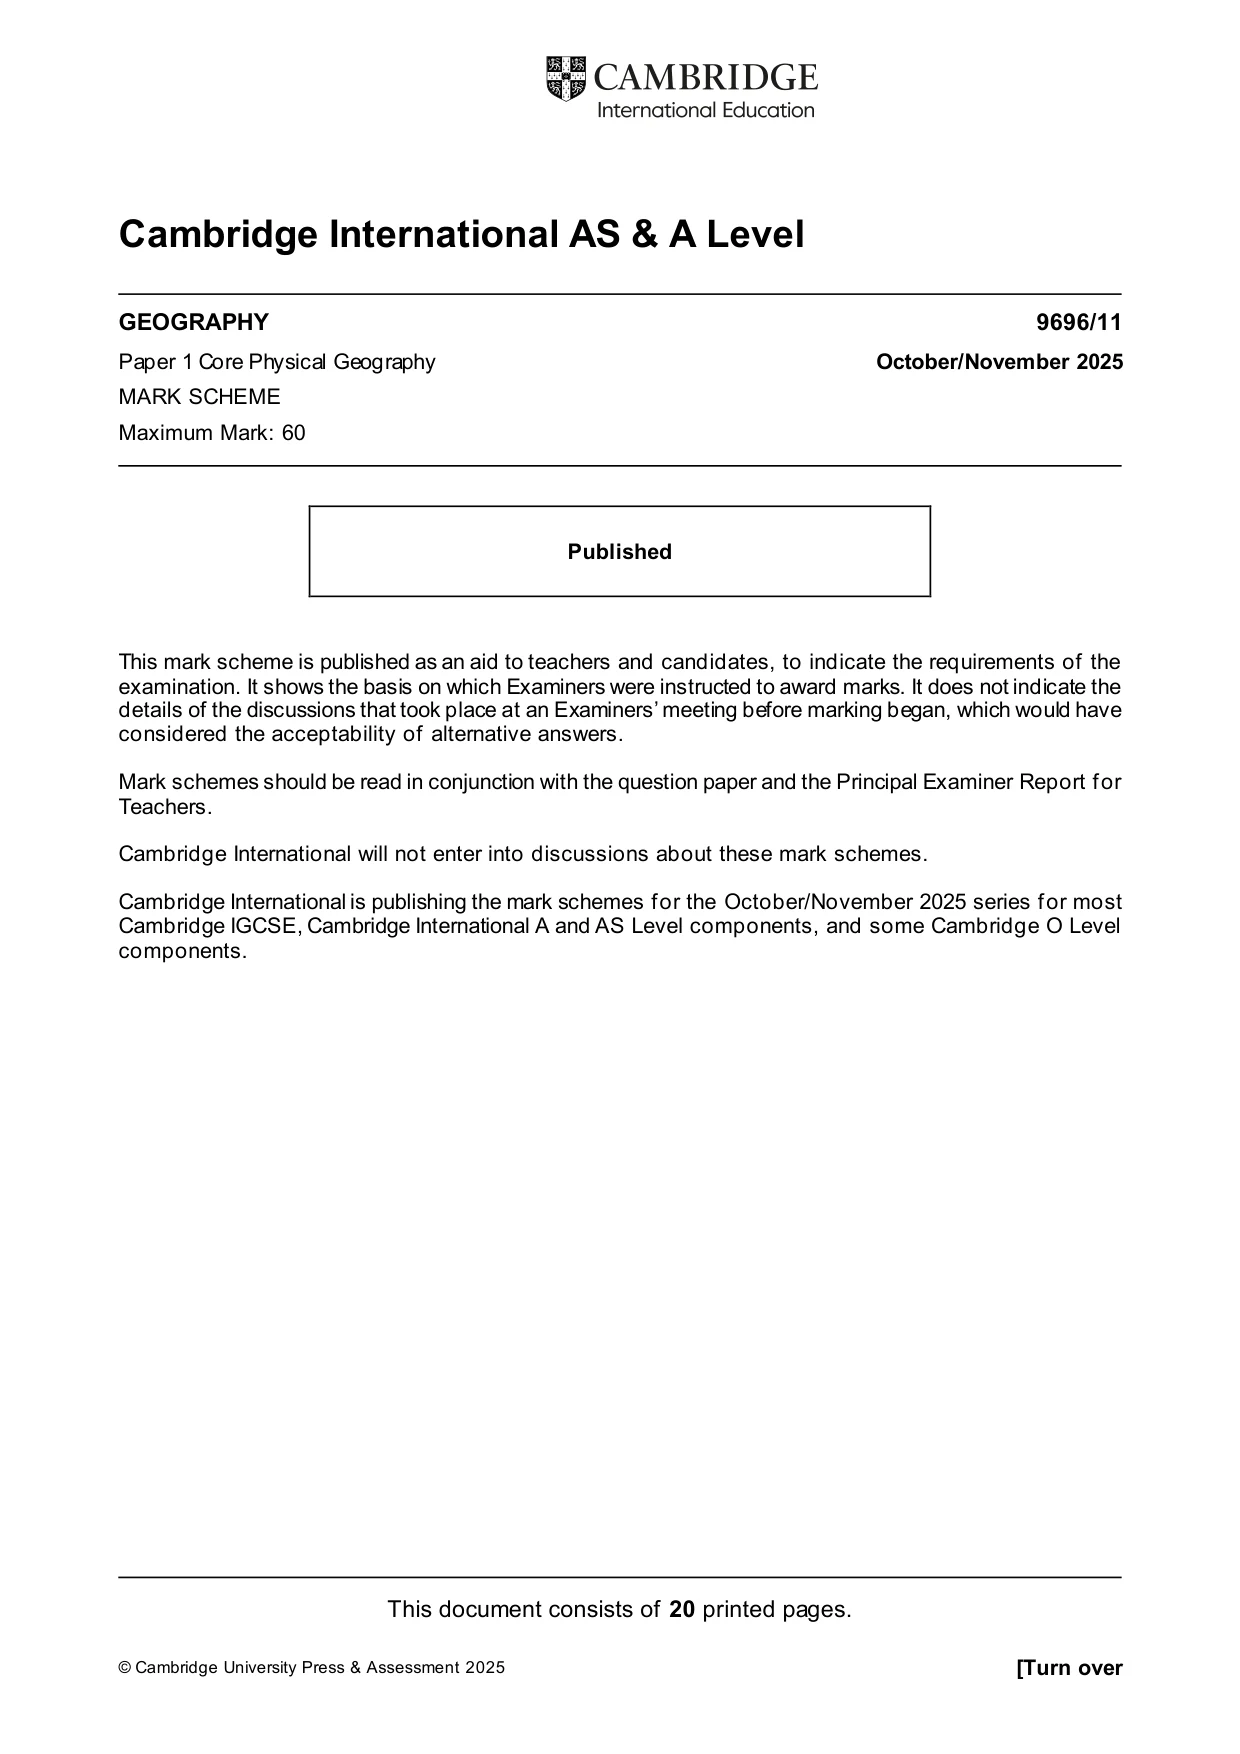
Question paper4 pages
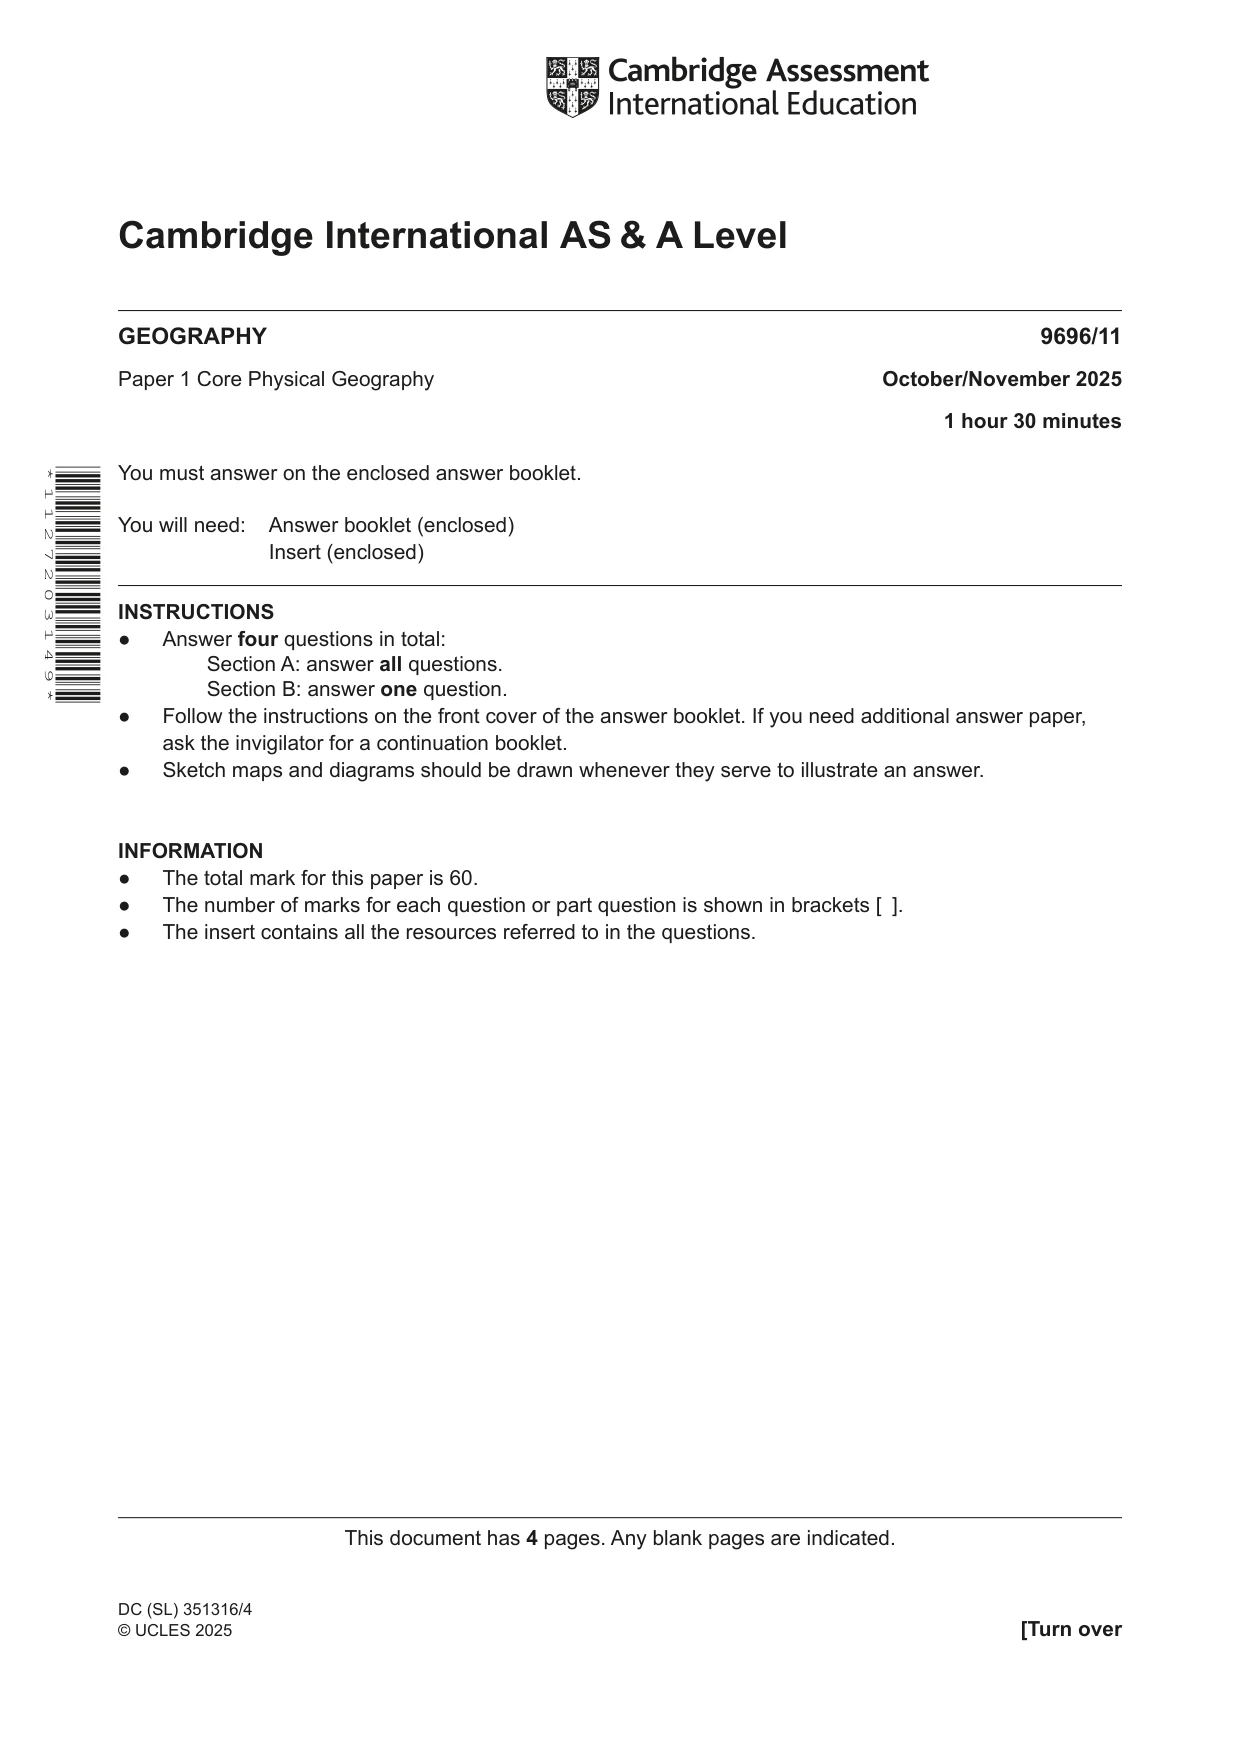
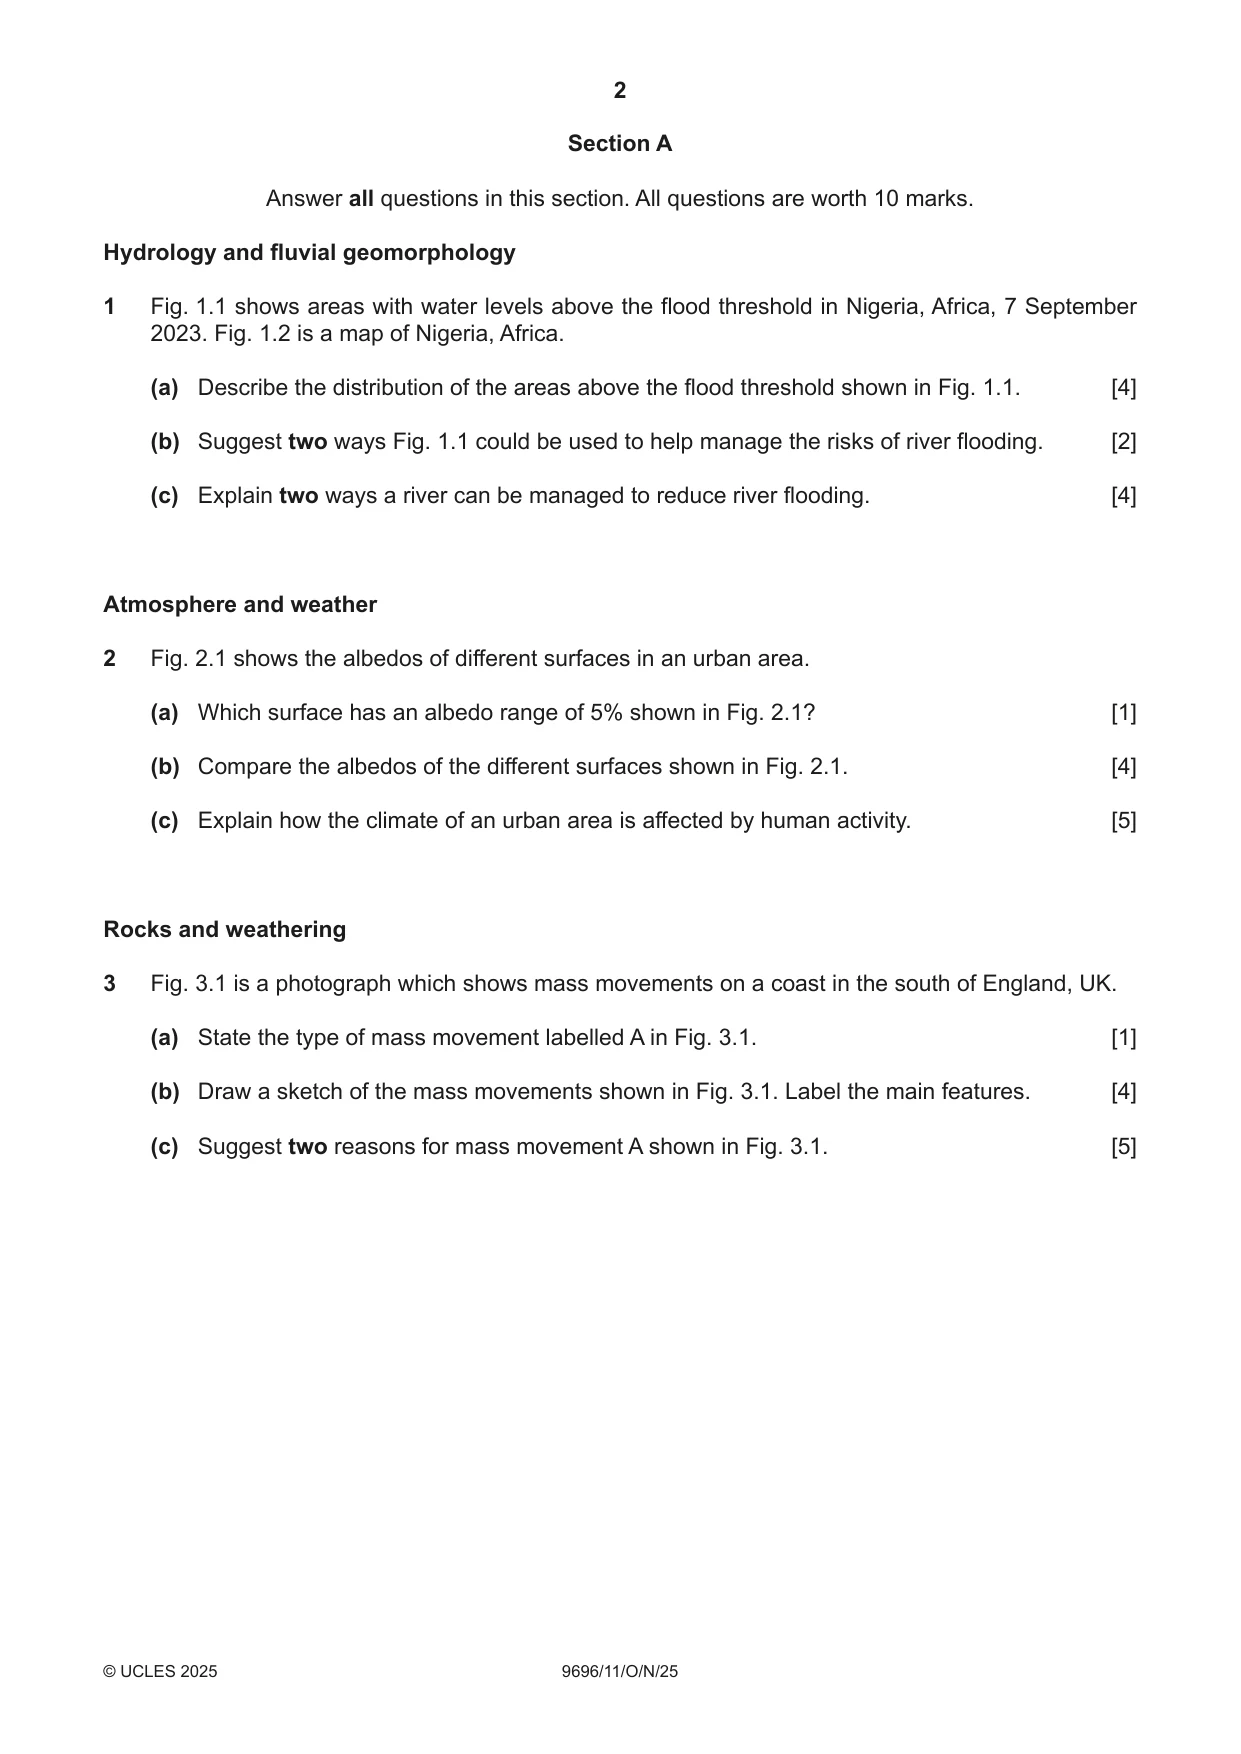
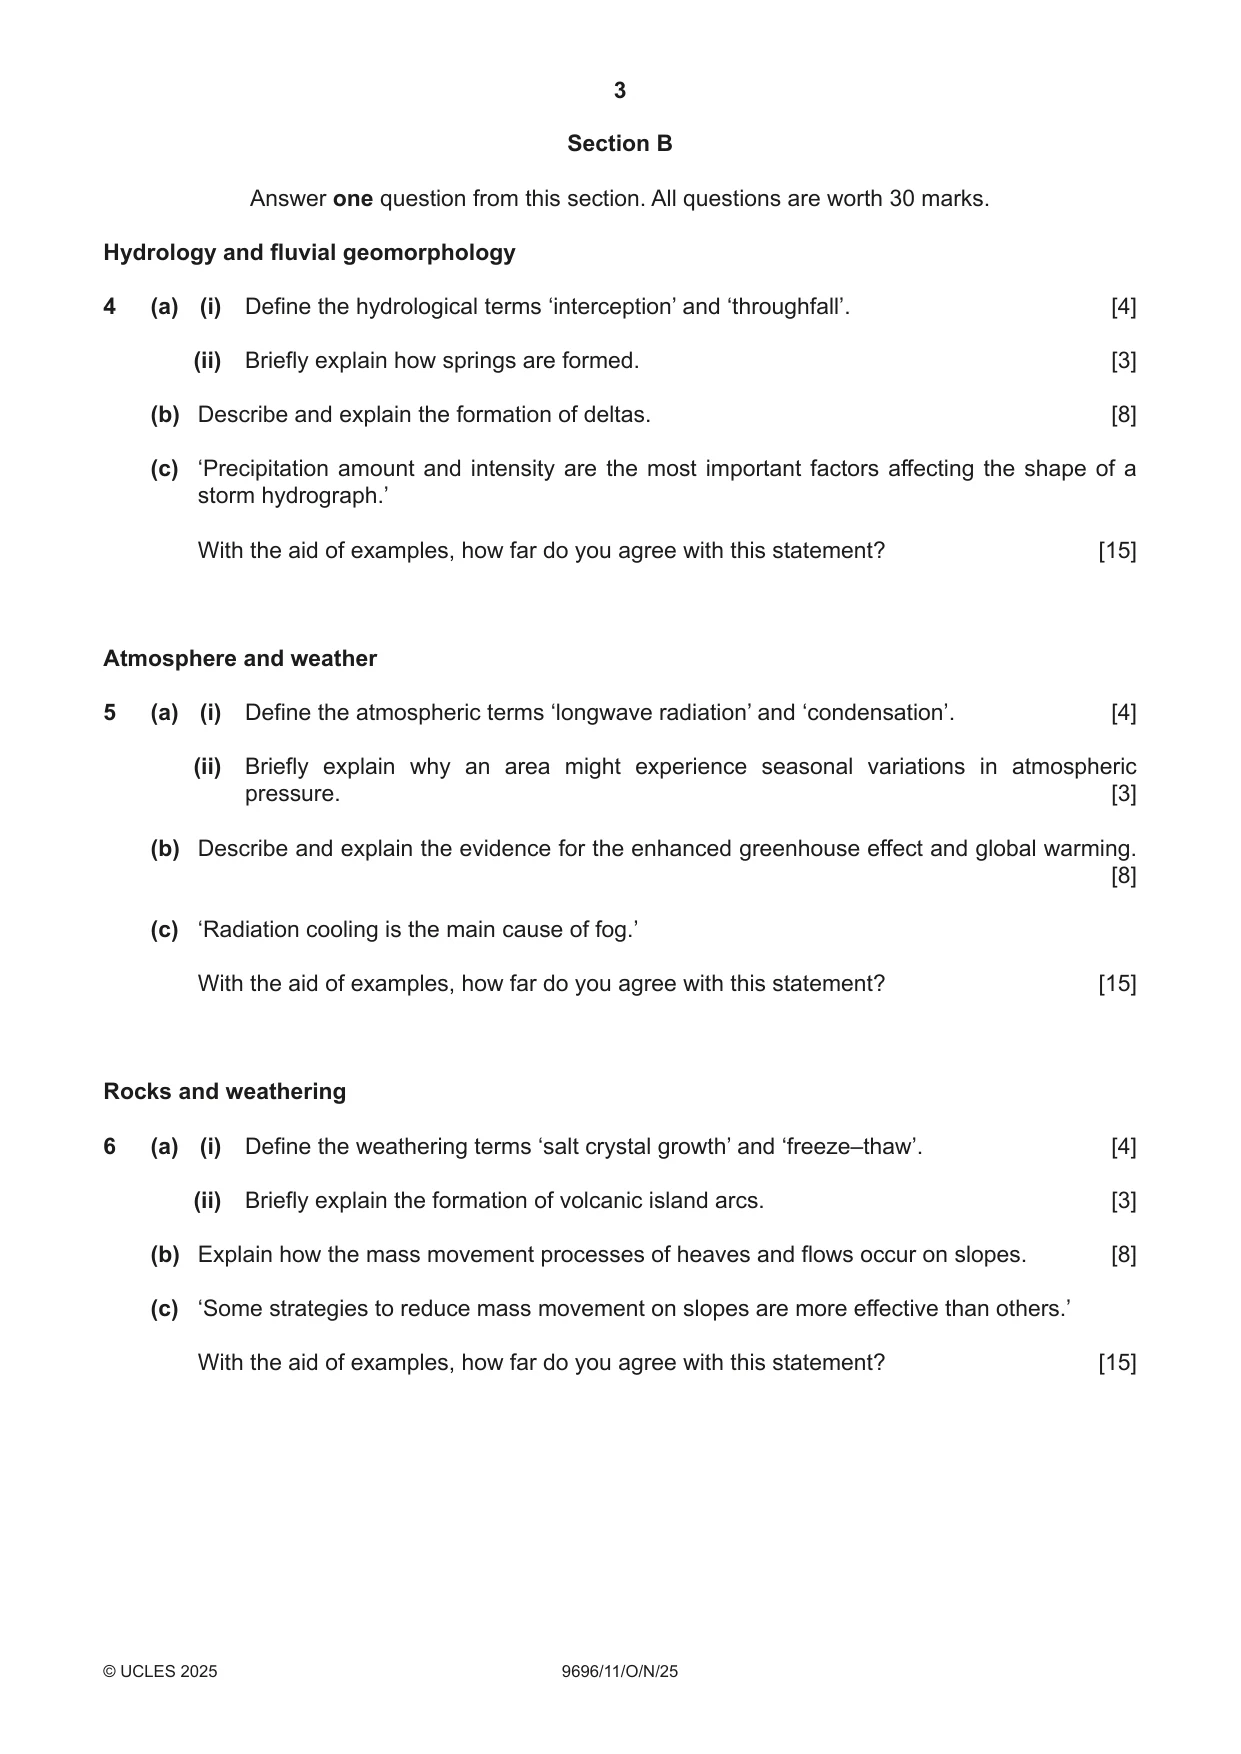

Mark scheme20 pages
Answers below. Sit the paper first if you are practising.



Paper as text
Question paper, page 1
This document has 4 pages. Any blank pages are indicated. [Turn over Cambridge International AS & A Level GEOGRAPHY 9696/11 Paper 1 Core Physical Geography October/November 2025 1 hour 30 minutes You must answer on the enclosed answer booklet. You will need: Answer booklet (enclosed) Insert (enclosed) INSTRUCTIONS ● Answer four questions in total: Section A: answer all questions. Section B: answer one question. ● Follow the instructions on the front cover of the answer booklet. If you need additional answer paper, ask the invigilator for a continuation booklet. ● Sketch maps and diagrams should be drawn whenever they serve to illustrate an answer. INFORMATION ● The total mark for this paper is 60. ● The number of marks for each question or part question is shown in brackets [ ]. ● The insert contains all the resources referred to in the questions. DC (SL) 351316/4 © UCLES 2025 * 1 1 2 7 2 0 3 1 4 9 *
Question paper, page 2
2 9696/11/O/N/25 © UCLES 2025 Section A Answer all questions in this section. All questions are worth 10 marks. Hydrology and fluvial geomorphology 1 Fig. 1.1 shows areas with water levels above the flood threshold in Nigeria, Africa, 7 September 2023. Fig. 1.2 is a map of Nigeria, Africa. (a) Describe the distribution of the areas above the flood threshold shown in Fig. 1.1. [4] (b) Suggest two ways Fig. 1.1 could be used to help manage the risks of river flooding. [2] (c) Explain two ways a river can be managed to reduce river flooding. [4] Atmosphere and weather 2 Fig. 2.1 shows the albedos of different surfaces in an urban area. (a) Which surface has an albedo range of 5% shown in Fig. 2.1? [1] (b) Compare the albedos of the different surfaces shown in Fig. 2.1. [4] (c) Explain how the climate of an urban area is affected by human activity. [5] Rocks and weathering 3 Fig. 3.1 is a photograph which shows mass movements on a coast in the south of England, UK. (a) State the type of mass movement labelled A in Fig. 3.1. [1] (b) Draw a sketch of the mass movements shown in Fig. 3.1. Label the main features. [4] (c) Suggest two reasons for mass movement A shown in Fig. 3.1. [5]
Question paper, page 3
3 9696/11/O/N/25 © UCLES 2025 Section B Answer one question from this section. All questions are worth 30 marks. Hydrology and fluvial geomorphology 4 (a) (i) Define the hydrological terms ‘interception’ and ‘throughfall’. [4] (ii) Briefly explain how springs are formed. [3] (b) Describe and explain the formation of deltas. [8] (c) ‘Precipitation amount and intensity are the most important factors affecting the shape of a storm hydrograph.’ With the aid of examples, how far do you agree with this statement? [15] Atmosphere and weather 5 (a) (i) Define the atmospheric terms ‘longwave radiation’ and ‘condensation’. [4] (ii) Briefly explain why an area might experience seasonal variations in atmospheric pressure. [3] (b) Describe and explain the evidence for the enhanced greenhouse effect and global warming. [8] (c) ‘Radiation cooling is the main cause of fog.’ With the aid of examples, how far do you agree with this statement? [15] Rocks and weathering 6 (a) (i) Define the weathering terms ‘salt crystal growth’ and ‘freeze–thaw’. [4] (ii) Briefly explain the formation of volcanic island arcs. [3] (b) Explain how the mass movement processes of heaves and flows occur on slopes. [8] (c) ‘Some strategies to reduce mass movement on slopes are more effective than others.’ With the aid of examples, how far do you agree with this statement? [15]
Question paper, page 4
4 9696/11/O/N/25 © UCLES 2025 The boundaries and names shown, the designations used and the presentation of material on any maps contained in this question paper/insert do not imply official endorsement or acceptance by Cambridge Assessment International Education concerning the legal status of any country, territory, or area or any of its authorities, or of the delimitation of its frontiers or boundaries. Permission to reproduce items where third-party owned material protected by copyright is included has been sought and cleared where possible. Every reasonable effort has been made by the publisher (UCLES) to trace copyright holders, but if any items requiring clearance have unwittingly been included, the publisher will be pleased to make amends at the earliest possible opportunity. To avoid the issue of disclosure of answer-related information to candidates, all copyright acknowledgements are reproduced online in the Cambridge Assessment International Education Copyright Acknowledgements Booklet. This is produced for each series of examinations and is freely available to download at www.cambridgeinternational.org after the live examination series. Cambridge Assessment International Education is part of Cambridge Assessment. Cambridge Assessment is the brand name of the University of Cambridge Local Examinations Syndicate (UCLES), which is a department of the University of Cambridge. BLANK PAGE
Mark scheme, page 1
This document consists of 20 printed pages. © Cambridge University Press & Assessment 2025 [Turn over Cambridge International AS & A Level GEOGRAPHY 9696/11 Paper 1 Core Physical Geography October/November 2025 MARK SCHEME Maximum Mark: 60 Published This mark scheme is published as an aid to teachers and candidates, to indicate the requirements of the examination. It shows the basis on which Examiners were instructed to award marks. It does not indicate the details of the discussions that took place at an Examiners’ meeting before marking began, which would have considered the acceptability of alternative answers. Mark schemes should be read in conjunction with the question paper and the Principal Examiner Report for Teachers. Cambridge International will not enter into discussions about these mark schemes. Cambridge International is publishing the mark schemes for the October/November 2025 series for most Cambridge IGCSE, Cambridge International A and AS Level components, and some Cambridge O Level components.
Mark scheme, page 2
9696/11 Cambridge International AS & A Level – Mark Scheme PUBLISHED October/November 2025 © Cambridge University Press & Assessment 2025 Page 2 of 20 Generic Marking Principles These general marking principles must be applied by all examiners when marking candidate answers. They should be applied alongside the specific content of the mark scheme or generic level descriptions for a question. Each question paper and mark scheme will also comply with these marking principles. GENERIC MARKING PRINCIPLE 1: Marks must be awarded in line with: • the specific content of the mark scheme or the generic level descriptors for the question • the specific skills defined in the mark scheme or in the generic level descriptors for the question • the standard of response required by a candidate as exemplified by the standardisation scripts. GENERIC MARKING PRINCIPLE 2: Marks awarded are always whole marks (not half marks, or other fractions). GENERIC MARKING PRINCIPLE 3: Marks must be awarded positively: • marks are awarded for correct/valid answers, as defined in the mark scheme. However, credit is given for valid answers which go beyond the scope of the syllabus and mark scheme, referring to your Team Leader as appropriate • marks are awarded when candidates clearly demonstrate what they know and can do • marks are not deducted for errors • marks are not deducted for omissions • answers should only be judged on the quality of spelling, punctuation and grammar when these features are specifically assessed by the question as indicated by the mark scheme. The meaning, however, should be unambiguous. GENERIC MARKING PRINCIPLE 4: Rules must be applied consistently, e.g. in situations where candidates have not followed instructions or in the application of generic level descriptors. GENERIC MARKING PRINCIPLE 5: Marks should be awarded using the full range of marks defined in the mark scheme for the question (however; the use of the full mark range may be limited according to the quality of the candidate responses seen). GENERIC MARKING PRINCIPLE 6: Marks awarded are based solely on the requirements as defined in the mark scheme. Marks should not be awarded with grade thresholds or grade descriptors in mind.
Mark scheme, page 3
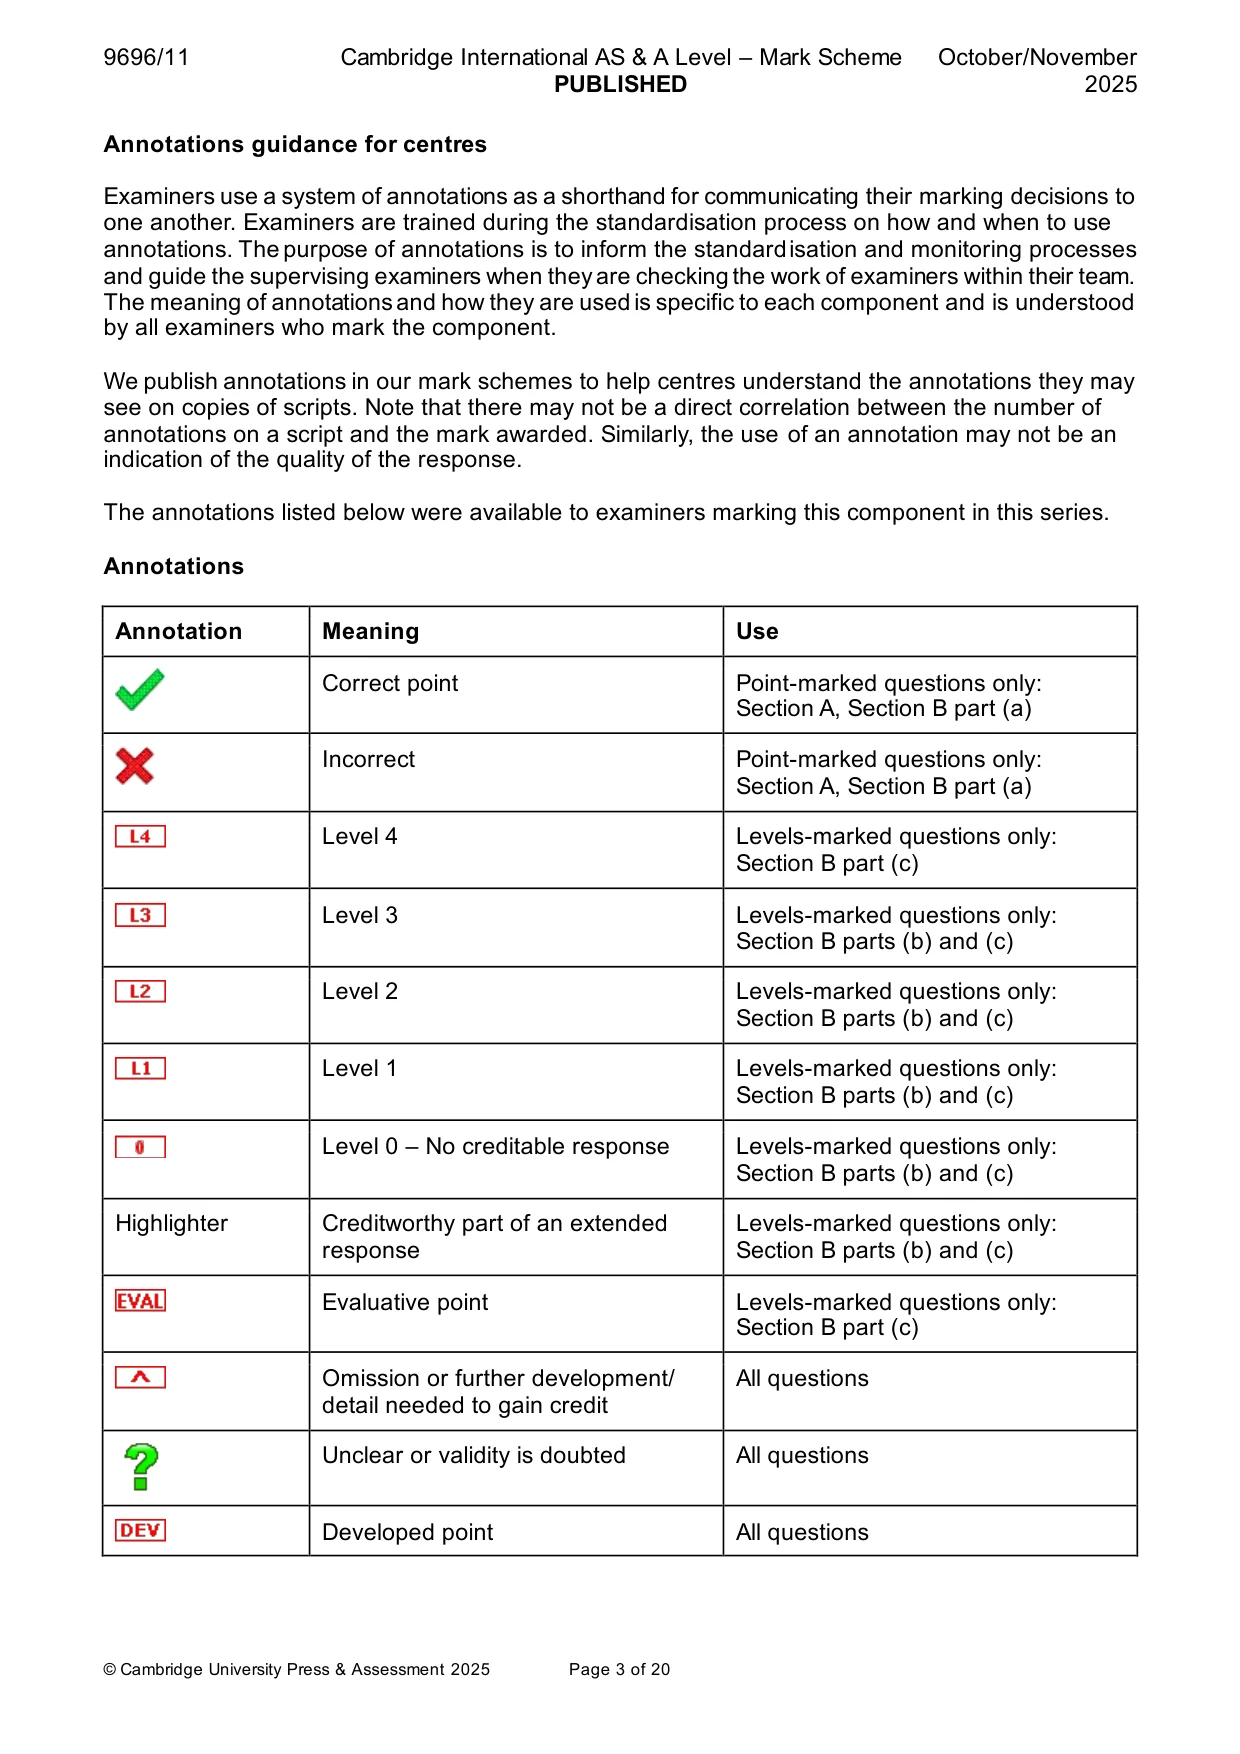
9696/11 Cambridge International AS & A Level – Mark Scheme PUBLISHED October/November 2025 © Cambridge University Press & Assessment 2025 Page 3 of 20 Annotations guidance for centres Examiners use a system of annotations as a shorthand for communicating their marking decisions to one another. Examiners are trained during the standardisation process on how and when to use annotations. The purpose of annotations is to inform the standardisation and monitoring processes and guide the supervising examiners when they are checking the work of examiners within their team. The meaning of annotations and how they are used is specific to each component and is understood by all examiners who mark the component. We publish annotations in our mark schemes to help centres understand the annotations they may see on copies of scripts. Note that there may not be a direct correlation between the number of annotations on a script and the mark awarded. Similarly, the use of an annotation may not be an indication of the quality of the response. The annotations listed below were available to examiners marking this component in this series. Annotations Annotation Meaning Use Correct point Point-marked questions only: Section A, Section B part (a) Incorrect Point-marked questions only: Section A, Section B part (a) Level 4 Levels-marked questions only: Section B part (c) Level 3 Levels-marked questions only: Section B parts (b) and (c) Level 2 Levels-marked questions only: Section B parts (b) and (c) Level 1 Levels-marked questions only: Section B parts (b) and (c) Level 0 – No creditable response Levels-marked questions only: Section B parts (b) and (c) Highlighter Creditworthy part of an extended response Levels-marked questions only: Section B parts (b) and (c) Evaluative point Levels-marked questions only: Section B part (c) Omission or further development/ detail needed to gain credit All questions Unclear or validity is doubted All questions Developed point All questions
Mark scheme, page 4
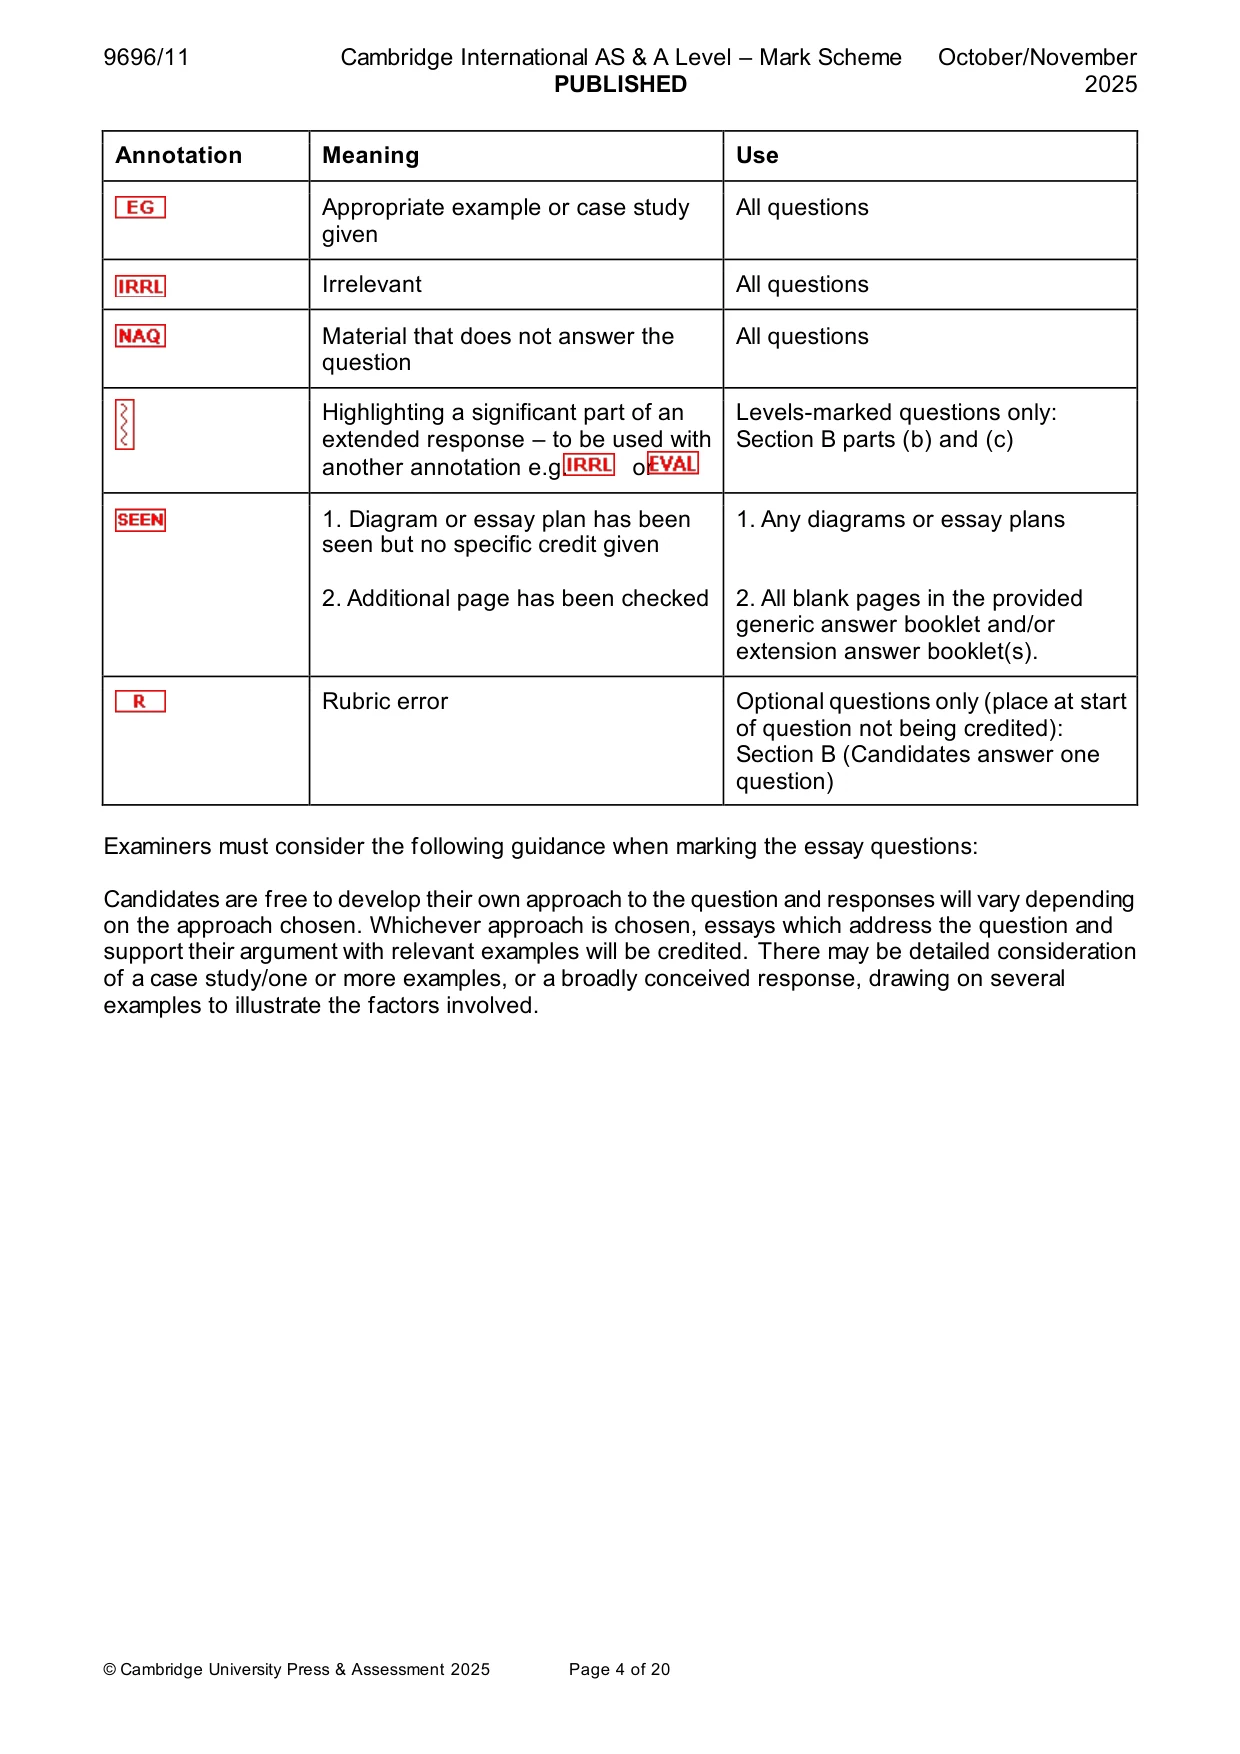
9696/11 Cambridge International AS & A Level – Mark Scheme PUBLISHED October/November 2025 © Cambridge University Press & Assessment 2025 Page 4 of 20 Annotation Meaning Use Appropriate example or case study given All questions Irrelevant All questions Material that does not answer the question All questions Highlighting a significant part of an extended response – to be used with another annotation e.g. or Levels-marked questions only: Section B parts (b) and (c) 1. Diagram or essay plan has been seen but no specific credit given 2. Additional page has been checked 1. Any diagrams or essay plans 2. All blank pages in the provided generic answer booklet and/or extension answer booklet(s). Rubric error Optional questions only (place at start of question not being credited): Section B (Candidates answer one question) Examiners must consider the following guidance when marking the essay questions: Candidates are free to develop their own approach to the question and responses will vary depending on the approach chosen. Whichever approach is chosen, essays which address the question and support their argument with relevant examples will be credited. There may be detailed consideration of a case study/one or more examples, or a broadly conceived response, drawing on several examples to illustrate the factors involved.
Mark scheme, page 5
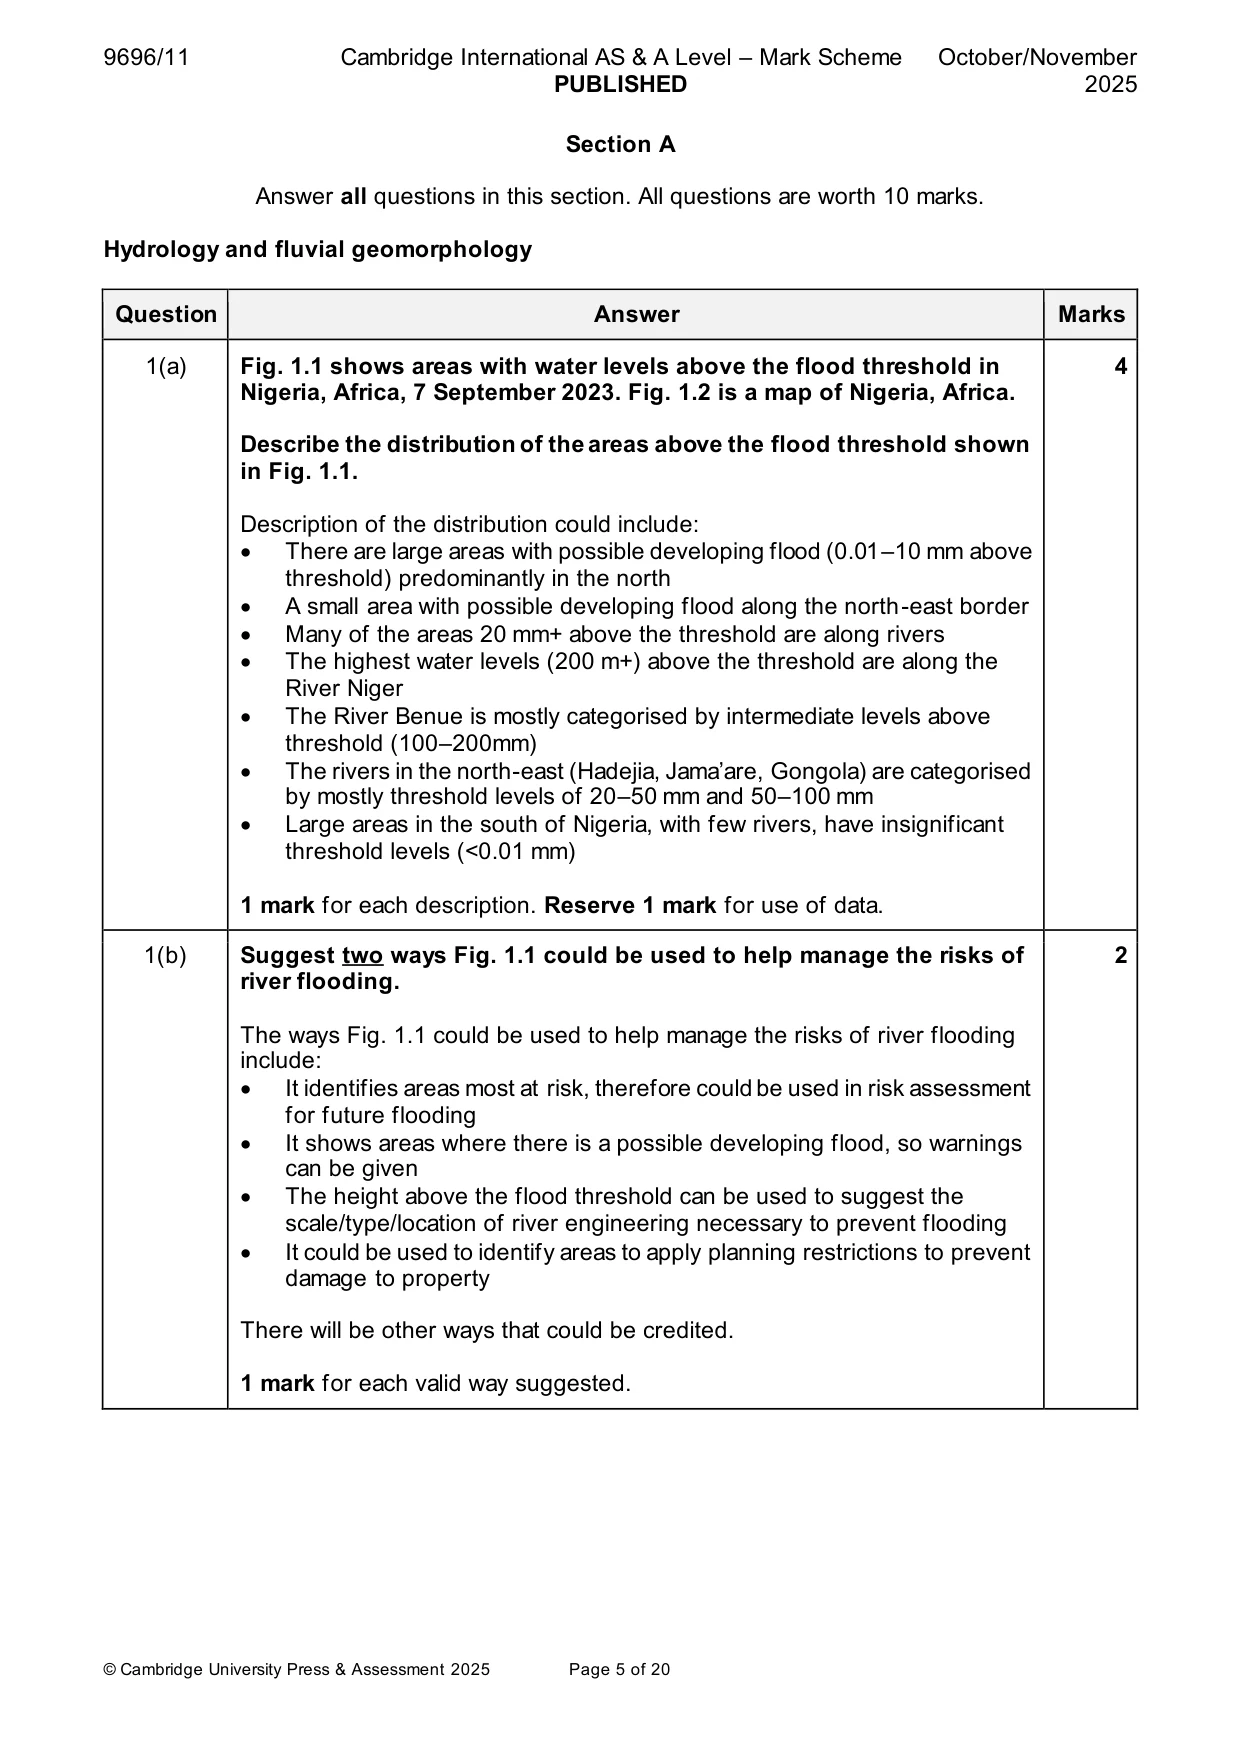
9696/11 Cambridge International AS & A Level – Mark Scheme PUBLISHED October/November 2025 © Cambridge University Press & Assessment 2025 Page 5 of 20 Section A Answer all questions in this section. All questions are worth 10 marks. Hydrology and fluvial geomorphology Question Answer Marks 1(a) Fig. 1.1 shows areas with water levels above the flood threshold in Nigeria, Africa, 7 September 2023. Fig. 1.2 is a map of Nigeria, Africa. Describe the distribution of the areas above the flood threshold shown in Fig. 1.1. Description of the distribution could include: • There are large areas with possible developing flood (0.01–10 mm above threshold) predominantly in the north • A small area with possible developing flood along the north-east border • Many of the areas 20 mm+ above the threshold are along rivers • The highest water levels (200 m+) above the threshold are along the River Niger • The River Benue is mostly categorised by intermediate levels above threshold (100–200mm) • The rivers in the north-east (Hadejia, Jama’are, Gongola) are categorised by mostly threshold levels of 20–50 mm and 50–100 mm • Large areas in the south of Nigeria, with few rivers, have insignificant threshold levels (<0.01 mm) 1 mark for each description. Reserve 1 mark for use of data. 4 1(b) Suggest two ways Fig. 1.1 could be used to help manage the risks of river flooding. The ways Fig. 1.1 could be used to help manage the risks of river flooding include: • It identifies areas most at risk, therefore could be used in risk assessment for future flooding • It shows areas where there is a possible developing flood, so warnings can be given • The height above the flood threshold can be used to suggest the scale/type/location of river engineering necessary to prevent flooding • It could be used to identify areas to apply planning restrictions to prevent damage to property There will be other ways that could be credited. 1 mark for each valid way suggested. 2
Mark scheme, page 6
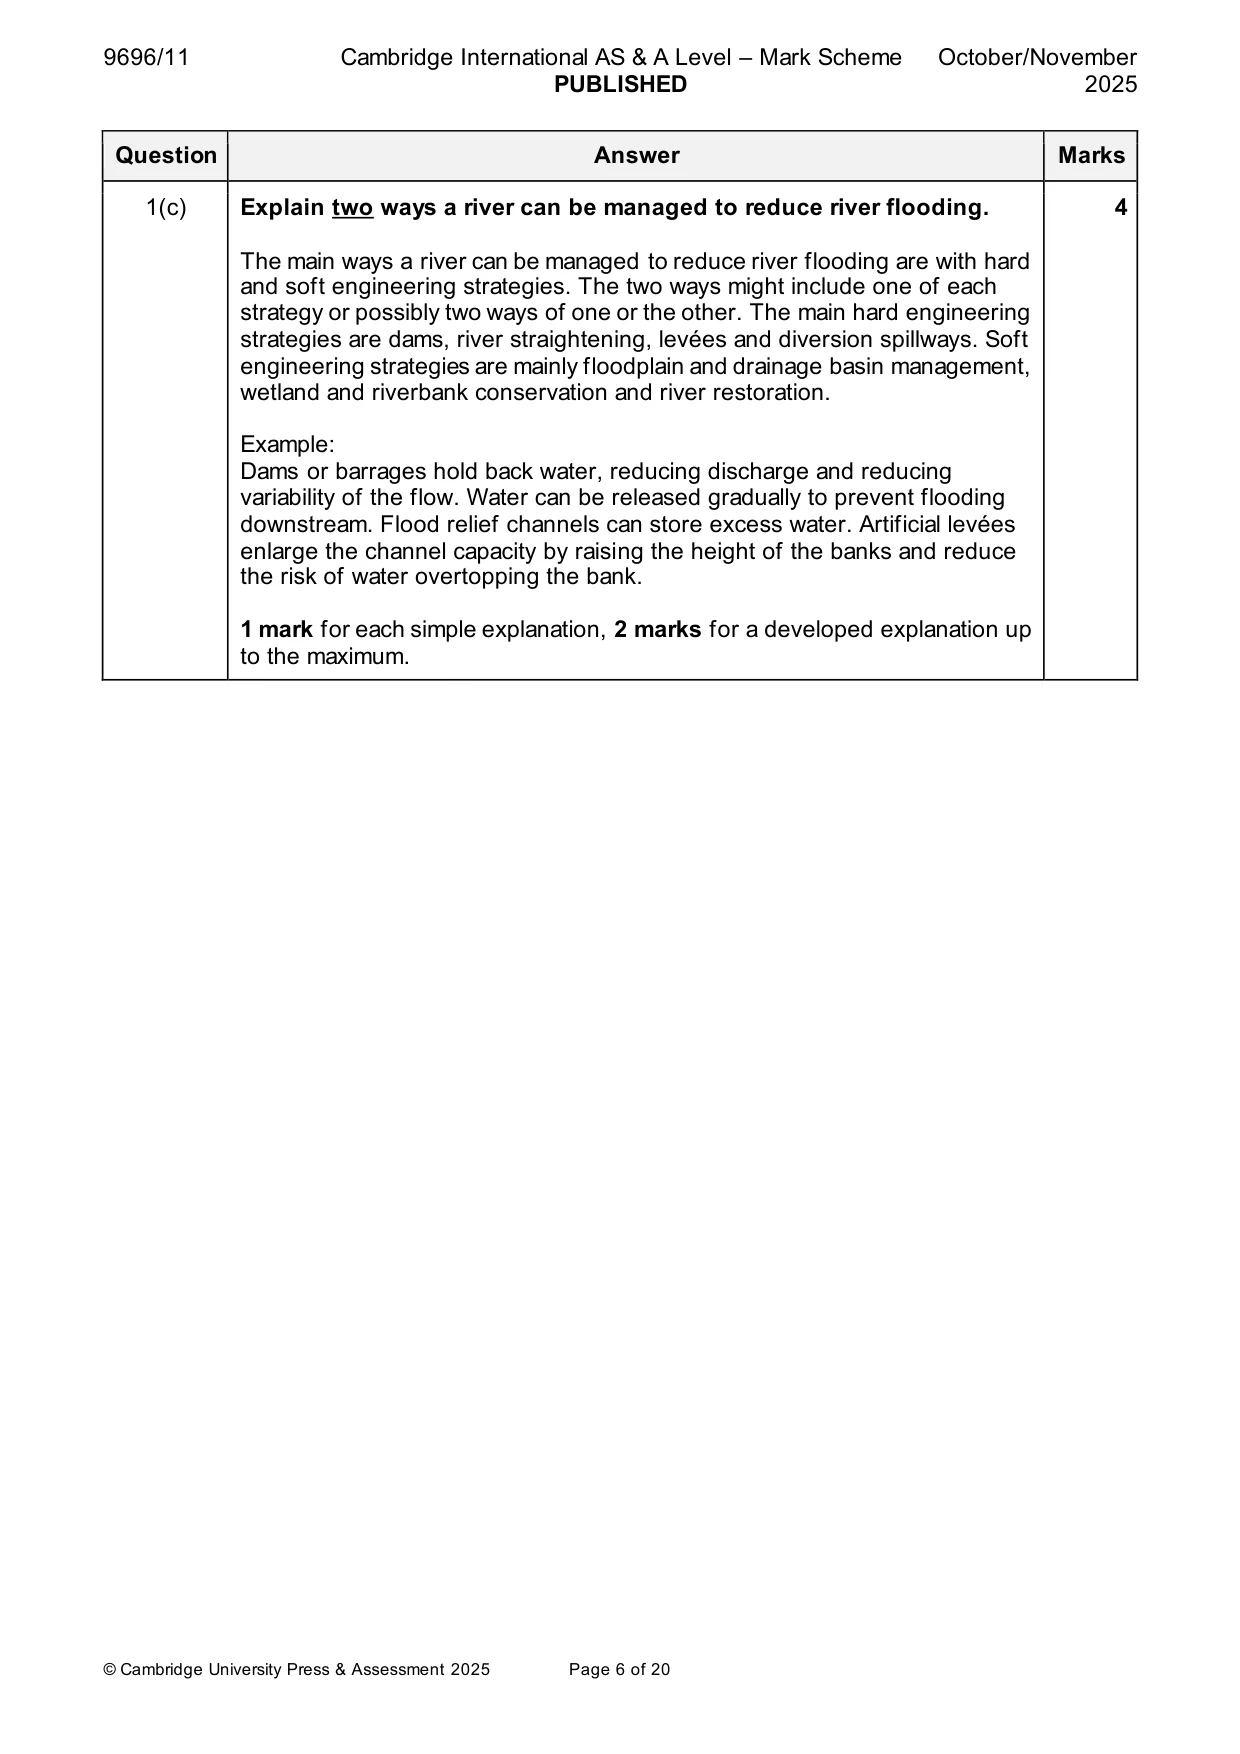
9696/11 Cambridge International AS & A Level – Mark Scheme PUBLISHED October/November 2025 © Cambridge University Press & Assessment 2025 Page 6 of 20 Question Answer Marks 1(c) Explain two ways a river can be managed to reduce river flooding. The main ways a river can be managed to reduce river flooding are with hard and soft engineering strategies. The two ways might include one of each strategy or possibly two ways of one or the other. The main hard engineering strategies are dams, river straightening, levées and diversion spillways. Soft engineering strategies are mainly floodplain and drainage basin management, wetland and riverbank conservation and river restoration. Example: Dams or barrages hold back water, reducing discharge and reducing variability of the flow. Water can be released gradually to prevent flooding downstream. Flood relief channels can store excess water. Artificial levées enlarge the channel capacity by raising the height of the banks and reduce the risk of water overtopping the bank. 1 mark for each simple explanation, 2 marks for a developed explanation up to the maximum. 4
Mark scheme, page 7
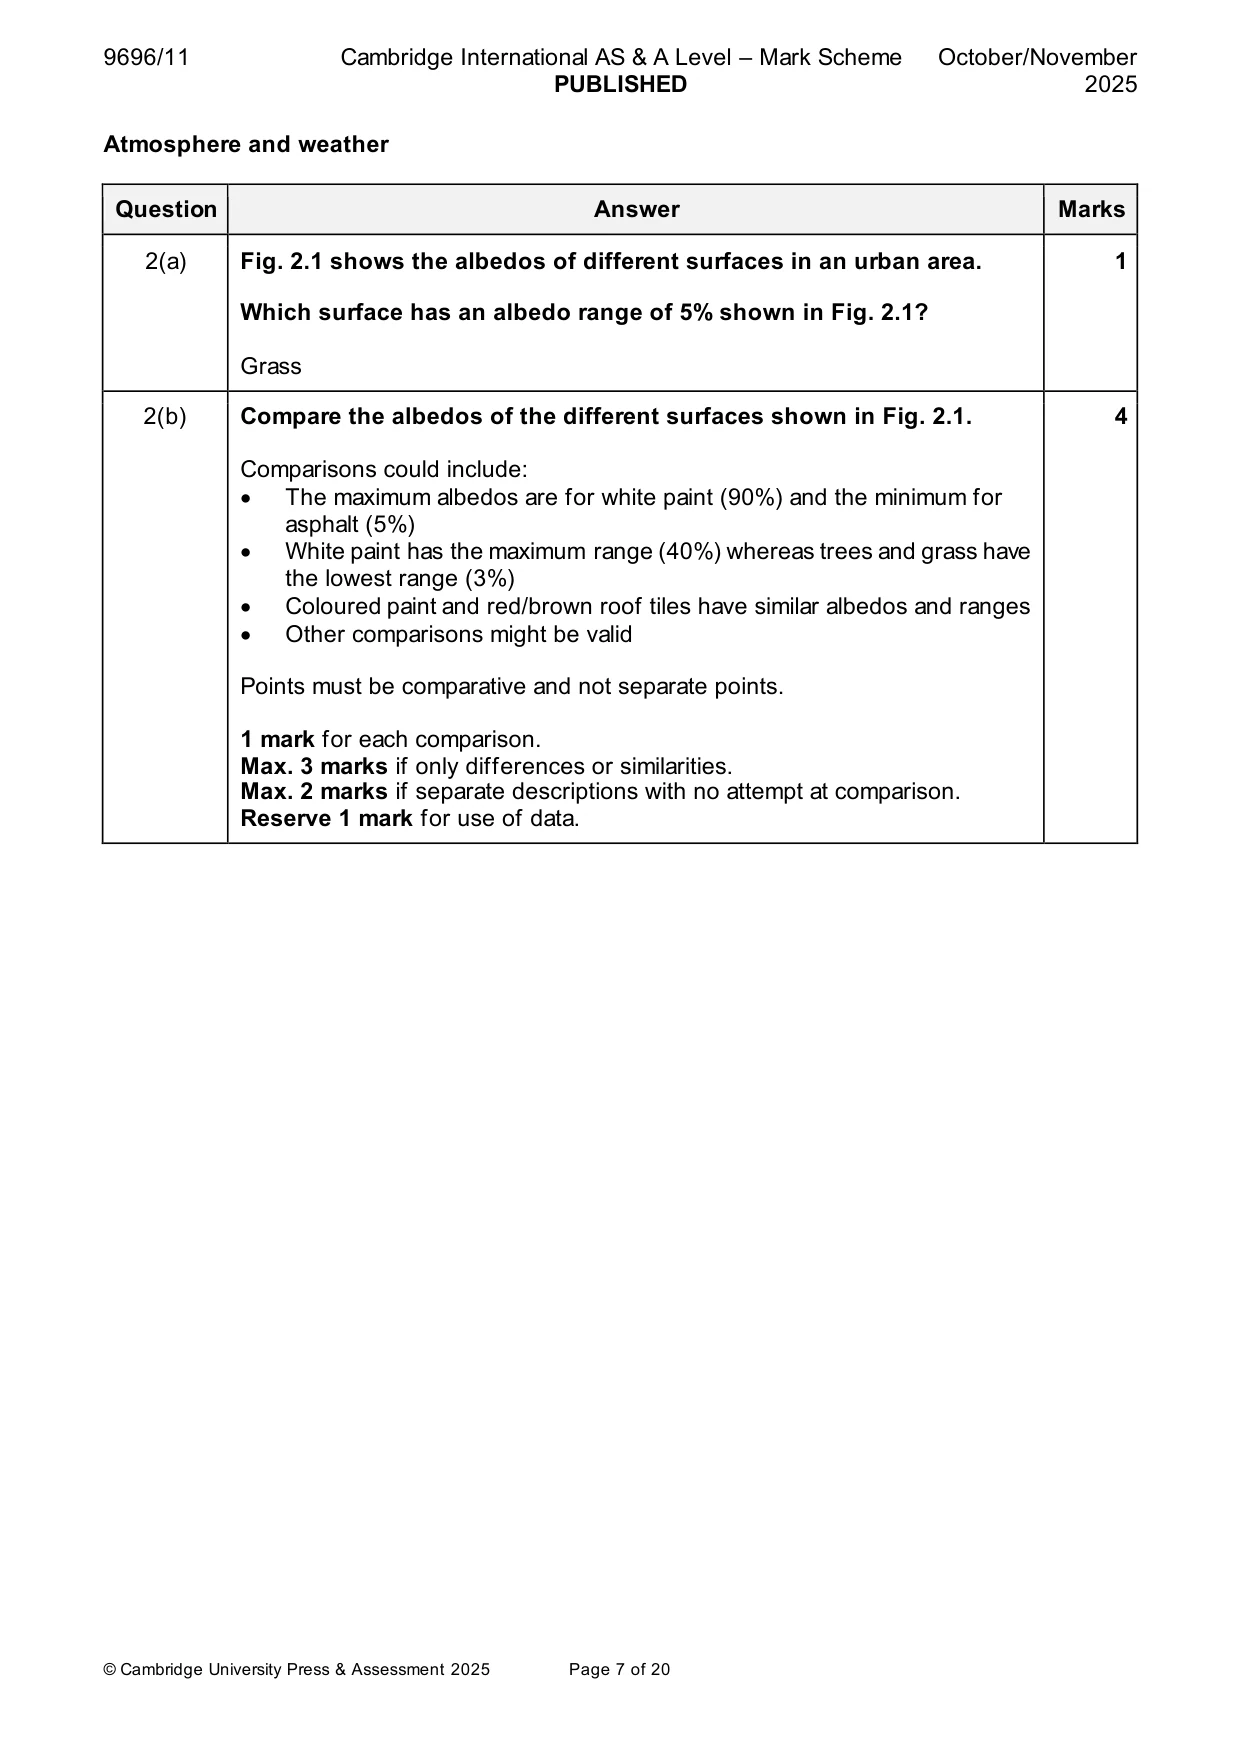
9696/11 Cambridge International AS & A Level – Mark Scheme PUBLISHED October/November 2025 © Cambridge University Press & Assessment 2025 Page 7 of 20 Atmosphere and weather Question Answer Marks 2(a) Fig. 2.1 shows the albedos of different surfaces in an urban area. Which surface has an albedo range of 5% shown in Fig. 2.1? Grass 1 2(b) Compare the albedos of the different surfaces shown in Fig. 2.1. Comparisons could include: • The maximum albedos are for white paint (90%) and the minimum for asphalt (5%) • White paint has the maximum range (40%) whereas trees and grass have the lowest range (3%) • Coloured paint and red/brown roof tiles have similar albedos and ranges • Other comparisons might be valid Points must be comparative and not separate points. 1 mark for each comparison. Max. 3 marks if only differences or similarities. Max. 2 marks if separate descriptions with no attempt at comparison. Reserve 1 mark for use of data. 4
Mark scheme, page 8
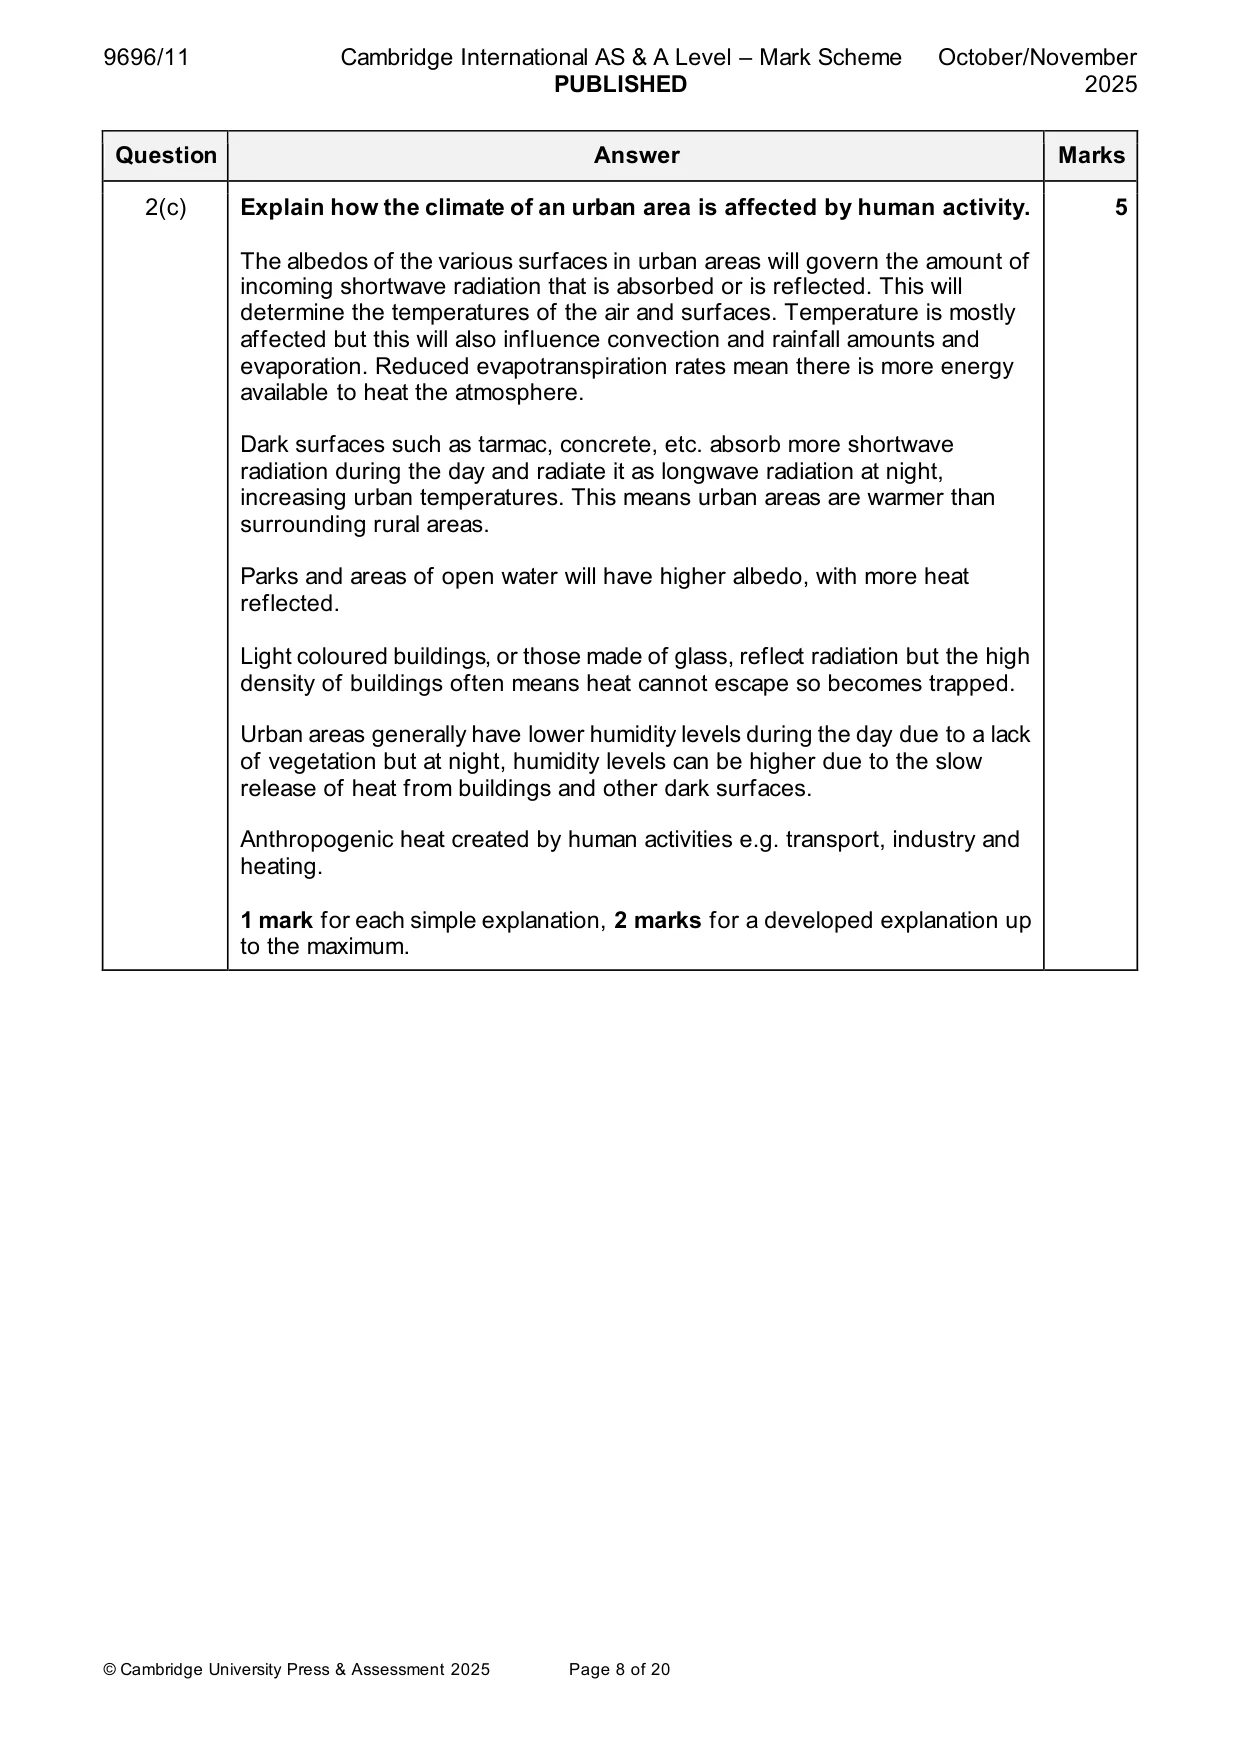
9696/11 Cambridge International AS & A Level – Mark Scheme PUBLISHED October/November 2025 © Cambridge University Press & Assessment 2025 Page 8 of 20 Question Answer Marks 2(c) Explain how the climate of an urban area is affected by human activity. The albedos of the various surfaces in urban areas will govern the amount of incoming shortwave radiation that is absorbed or is reflected. This will determine the temperatures of the air and surfaces. Temperature is mostly affected but this will also influence convection and rainfall amounts and evaporation. Reduced evapotranspiration rates mean there is more energy available to heat the atmosphere. Dark surfaces such as tarmac, concrete, etc. absorb more shortwave radiation during the day and radiate it as longwave radiation at night, increasing urban temperatures. This means urban areas are warmer than surrounding rural areas. Parks and areas of open water will have higher albedo, with more heat reflected. Light coloured buildings, or those made of glass, reflect radiation but the high density of buildings often means heat cannot escape so becomes trapped. Urban areas generally have lower humidity levels during the day due to a lack of vegetation but at night, humidity levels can be higher due to the slow release of heat from buildings and other dark surfaces. Anthropogenic heat created by human activities e.g. transport, industry and heating. 1 mark for each simple explanation, 2 marks for a developed explanation up to the maximum. 5
Mark scheme, page 9
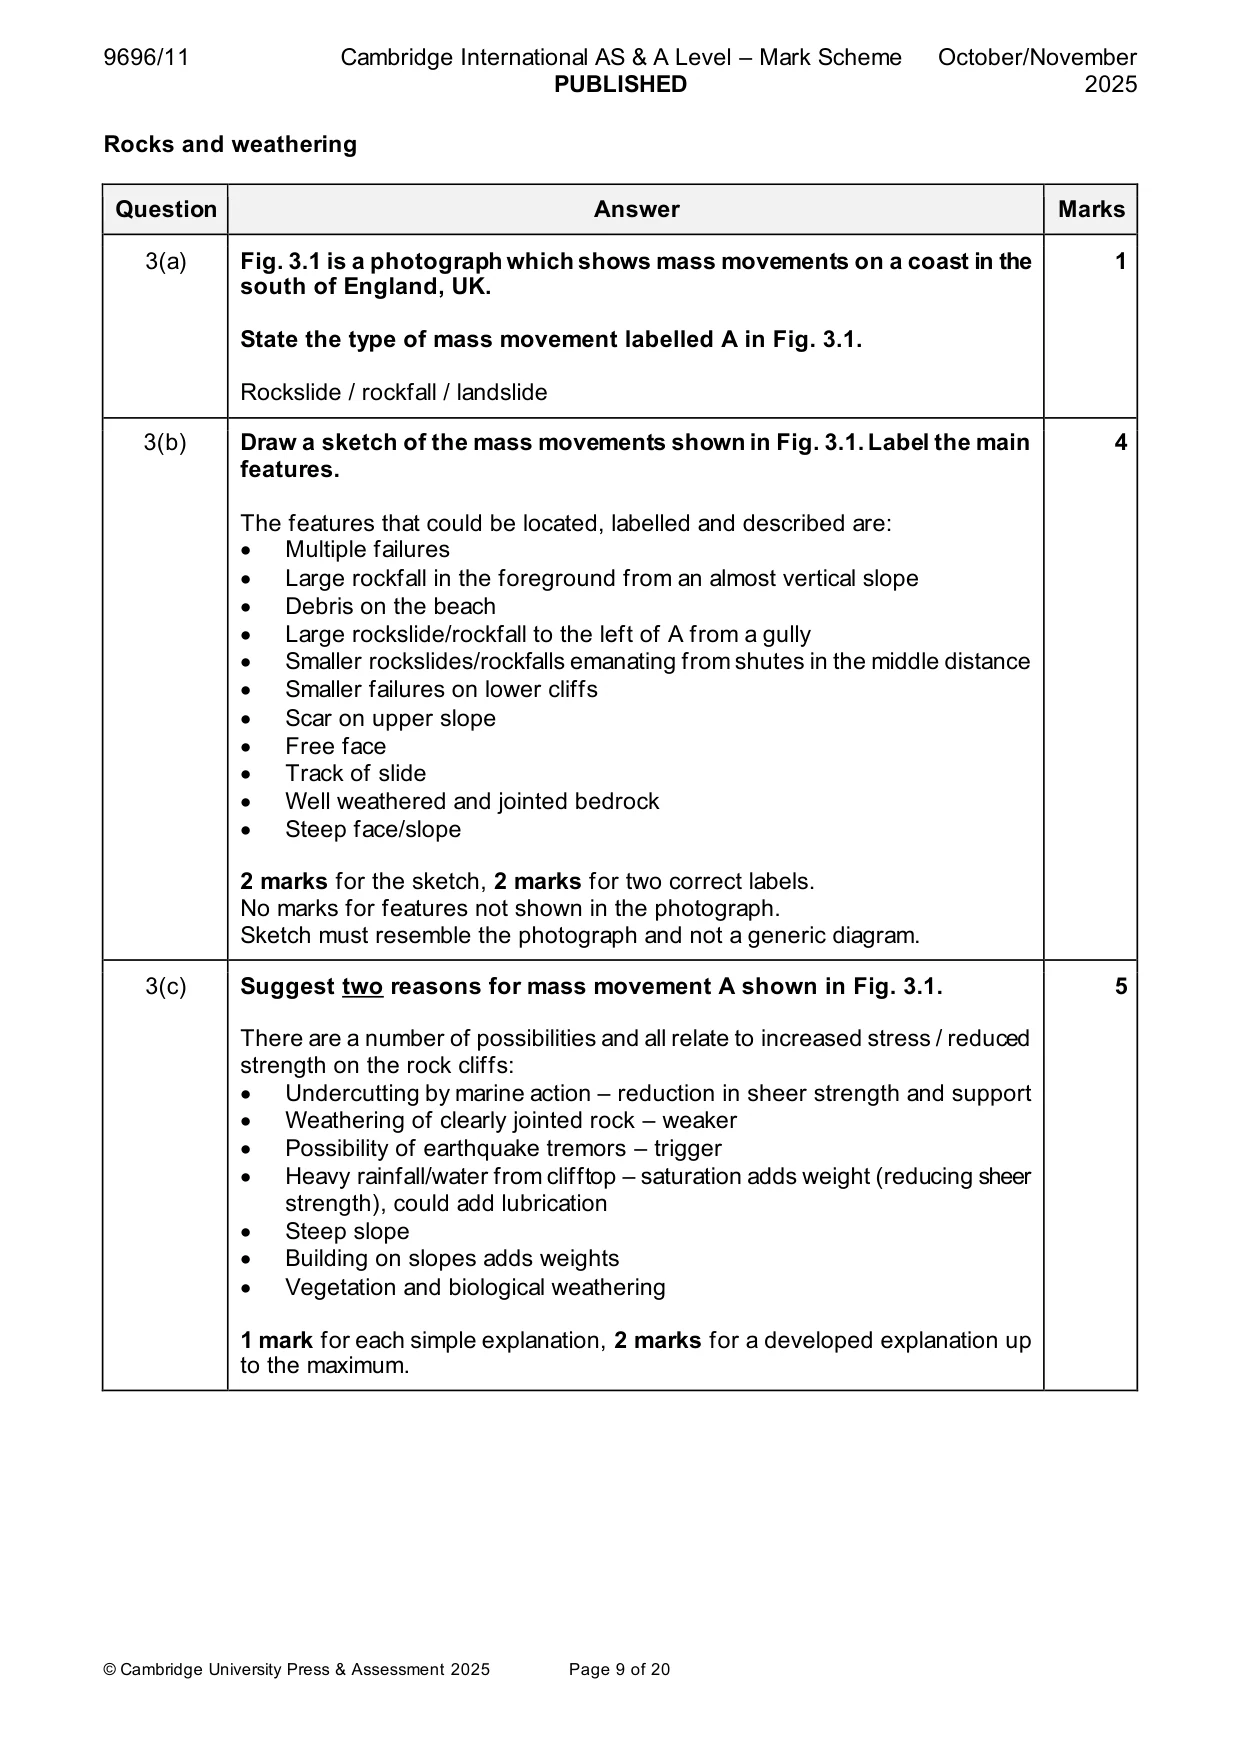
9696/11 Cambridge International AS & A Level – Mark Scheme PUBLISHED October/November 2025 © Cambridge University Press & Assessment 2025 Page 9 of 20 Rocks and weathering Question Answer Marks 3(a) Fig. 3.1 is a photograph which shows mass movements on a coast in the south of England, UK. State the type of mass movement labelled A in Fig. 3.1. Rockslide / rockfall / landslide 1 3(b) Draw a sketch of the mass movements shown in Fig. 3.1. Label the main features. The features that could be located, labelled and described are: • Multiple failures • Large rockfall in the foreground from an almost vertical slope • Debris on the beach • Large rockslide/rockfall to the left of A from a gully • Smaller rockslides/rockfalls emanating from shutes in the middle distance • Smaller failures on lower cliffs • Scar on upper slope • Free face • Track of slide • Well weathered and jointed bedrock • Steep face/slope 2 marks for the sketch, 2 marks for two correct labels. No marks for features not shown in the photograph. Sketch must resemble the photograph and not a generic diagram. 4 3(c) Suggest two reasons for mass movement A shown in Fig. 3.1. There are a number of possibilities and all relate to increased stress / reduced strength on the rock cliffs: • Undercutting by marine action – reduction in sheer strength and support • Weathering of clearly jointed rock – weaker • Possibility of earthquake tremors – trigger • Heavy rainfall/water from clifftop – saturation adds weight (reducing sheer strength), could add lubrication • Steep slope • Building on slopes adds weights • Vegetation and biological weathering 1 mark for each simple explanation, 2 marks for a developed explanation up to the maximum. 5
Mark scheme, page 10
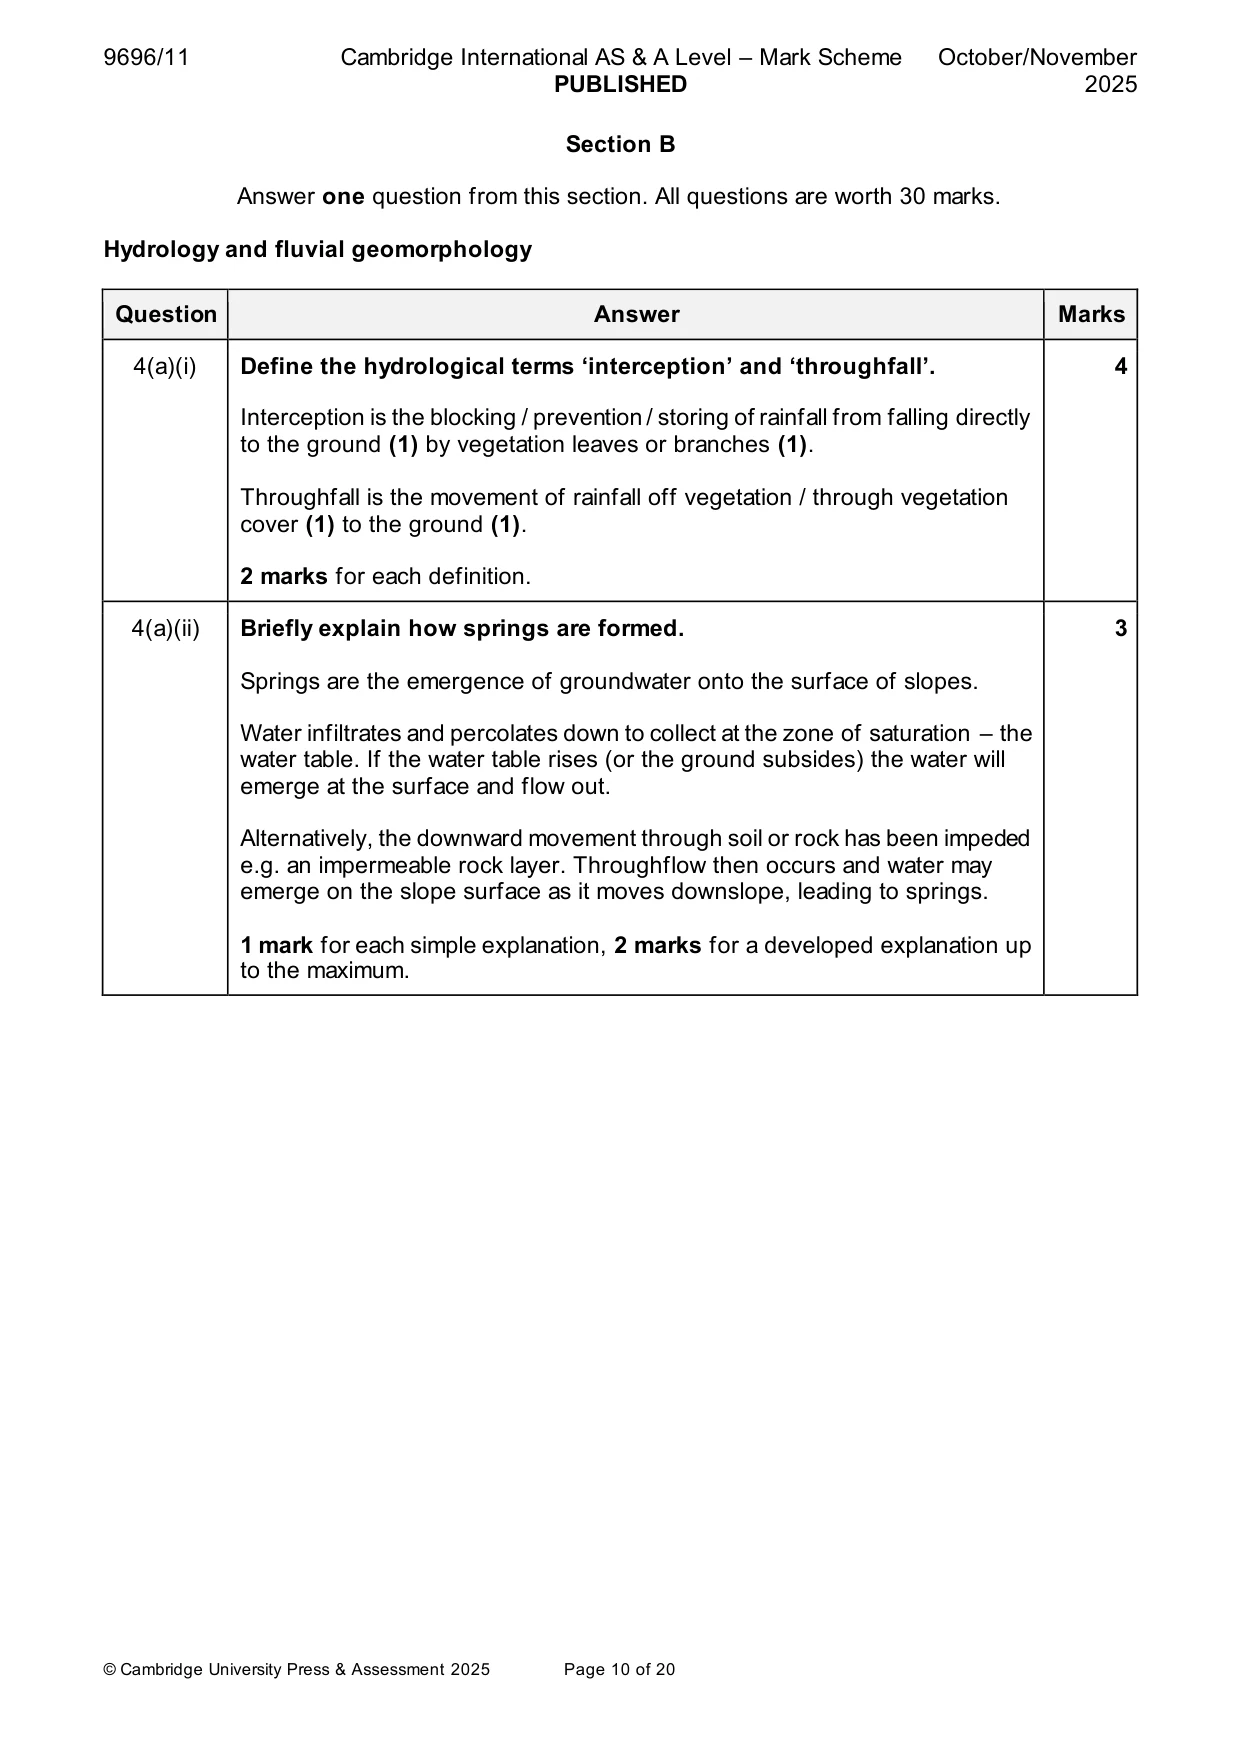
9696/11 Cambridge International AS & A Level – Mark Scheme PUBLISHED October/November 2025 © Cambridge University Press & Assessment 2025 Page 10 of 20 Section B Answer one question from this section. All questions are worth 30 marks. Hydrology and fluvial geomorphology Question Answer Marks 4(a)(i) Define the hydrological terms ‘interception’ and ‘throughfall’. Interception is the blocking / prevention / storing of rainfall from falling directly to the ground (1) by vegetation leaves or branches (1). Throughfall is the movement of rainfall off vegetation / through vegetation cover (1) to the ground (1). 2 marks for each definition. 4 4(a)(ii) Briefly explain how springs are formed. Springs are the emergence of groundwater onto the surface of slopes. Water infiltrates and percolates down to collect at the zone of saturation – the water table. If the water table rises (or the ground subsides) the water will emerge at the surface and flow out. Alternatively, the downward movement through soil or rock has been impeded e.g. an impermeable rock layer. Throughflow then occurs and water may emerge on the slope surface as it moves downslope, leading to springs. 1 mark for each simple explanation, 2 marks for a developed explanation up to the maximum. 3
Mark scheme, page 11
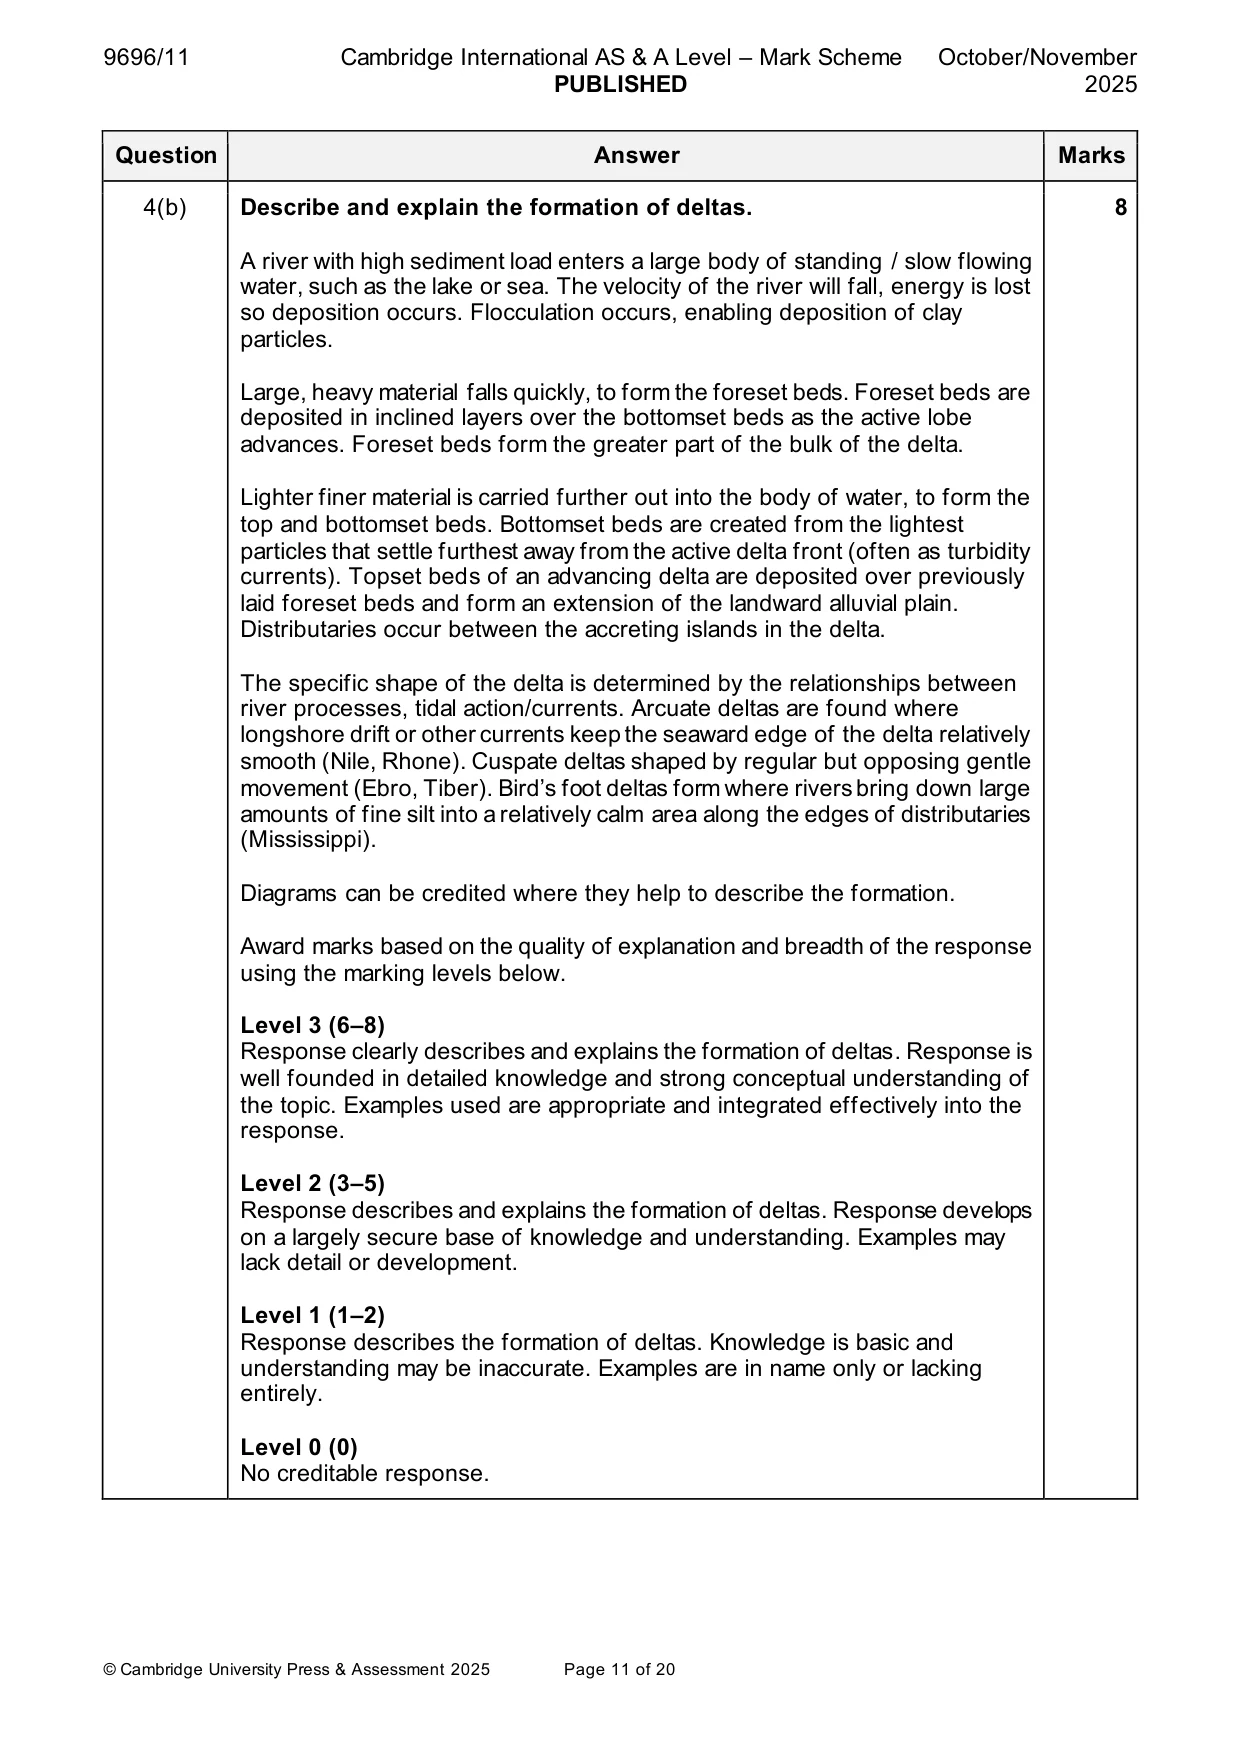
9696/11 Cambridge International AS & A Level – Mark Scheme PUBLISHED October/November 2025 © Cambridge University Press & Assessment 2025 Page 11 of 20 Question Answer Marks 4(b) Describe and explain the formation of deltas. A river with high sediment load enters a large body of standing / slow flowing water, such as the lake or sea. The velocity of the river will fall, energy is lost so deposition occurs. Flocculation occurs, enabling deposition of clay particles. Large, heavy material falls quickly, to form the foreset beds. Foreset beds are deposited in inclined layers over the bottomset beds as the active lobe advances. Foreset beds form the greater part of the bulk of the delta. Lighter finer material is carried further out into the body of water, to form the top and bottomset beds. Bottomset beds are created from the lightest particles that settle furthest away from the active delta front (often as turbidity currents). Topset beds of an advancing delta are deposited over previously laid foreset beds and form an extension of the landward alluvial plain. Distributaries occur between the accreting islands in the delta. The specific shape of the delta is determined by the relationships between river processes, tidal action/currents. Arcuate deltas are found where longshore drift or other currents keep the seaward edge of the delta relatively smooth (Nile, Rhone). Cuspate deltas shaped by regular but opposing gentle movement (Ebro, Tiber). Bird’s foot deltas form where rivers bring down large amounts of fine silt into a relatively calm area along the edges of distributaries (Mississippi). Diagrams can be credited where they help to describe the formation. Award marks based on the quality of explanation and breadth of the response using the marking levels below. Level 3 (6–8) Response clearly describes and explains the formation of deltas. Response is well founded in detailed knowledge and strong conceptual understanding of the topic. Examples used are appropriate and integrated effectively into the response. Level 2 (3–5) Response describes and explains the formation of deltas. Response develops on a largely secure base of knowledge and understanding. Examples may lack detail or development. Level 1 (1–2) Response describes the formation of deltas. Knowledge is basic and understanding may be inaccurate. Examples are in name only or lacking entirely. Level 0 (0) No creditable response. 8
Mark scheme, page 12
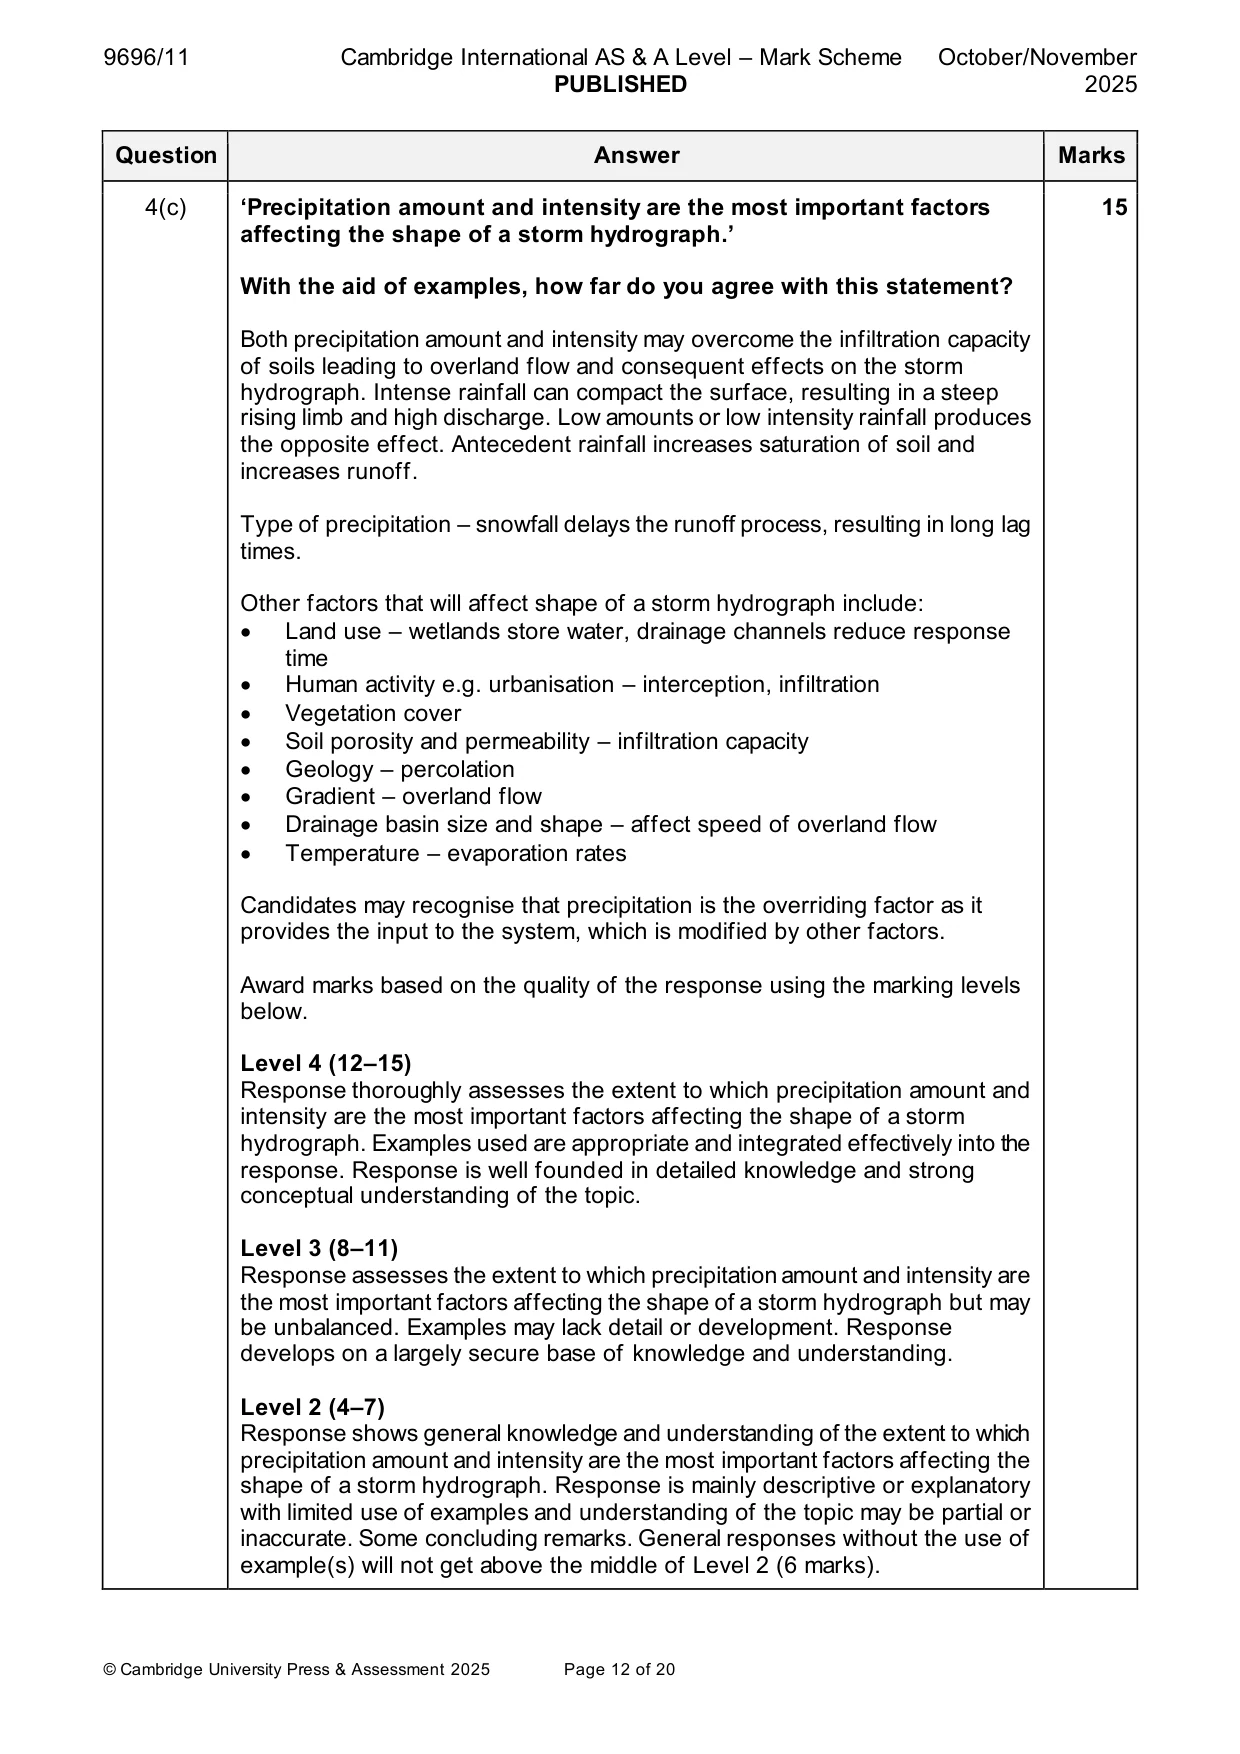
9696/11 Cambridge International AS & A Level – Mark Scheme PUBLISHED October/November 2025 © Cambridge University Press & Assessment 2025 Page 12 of 20 Question Answer Marks 4(c) ‘Precipitation amount and intensity are the most important factors affecting the shape of a storm hydrograph.’ With the aid of examples, how far do you agree with this statement? Both precipitation amount and intensity may overcome the infiltration capacity of soils leading to overland flow and consequent effects on the storm hydrograph. Intense rainfall can compact the surface, resulting in a steep rising limb and high discharge. Low amounts or low intensity rainfall produces the opposite effect. Antecedent rainfall increases saturation of soil and increases runoff. Type of precipitation – snowfall delays the runoff process, resulting in long lag times. Other factors that will affect shape of a storm hydrograph include: • Land use – wetlands store water, drainage channels reduce response time • Human activity e.g. urbanisation – interception, infiltration • Vegetation cover • Soil porosity and permeability – infiltration capacity • Geology – percolation • Gradient – overland flow • Drainage basin size and shape – affect speed of overland flow • Temperature – evaporation rates Candidates may recognise that precipitation is the overriding factor as it provides the input to the system, which is modified by other factors. Award marks based on the quality of the response using the marking levels below. Level 4 (12–15) Response thoroughly assesses the extent to which precipitation amount and intensity are the most important factors affecting the shape of a storm hydrograph. Examples used are appropriate and integrated effectively into the response. Response is well founded in detailed knowledge and strong conceptual understanding of the topic. Level 3 (8–11) Response assesses the extent to which precipitation amount and intensity are the most important factors affecting the shape of a storm hydrograph but may be unbalanced. Examples may lack detail or development. Response develops on a largely secure base of knowledge and understanding. Level 2 (4–7) Response shows general knowledge and understanding of the extent to which precipitation amount and intensity are the most important factors affecting the shape of a storm hydrograph. Response is mainly descriptive or explanatory with limited use of examples and understanding of the topic may be partial or inaccurate. Some concluding remarks. General responses without the use of example(s) will not get above the middle of Level 2 (6 marks). 15
Mark scheme, page 13
9696/11 Cambridge International AS & A Level – Mark Scheme PUBLISHED October/November 2025 © Cambridge University Press & Assessment 2025 Page 13 of 20 Question Answer Marks 4(c) Level 1 (1–3) Response may broadly discuss the extent to which precipitation amount and intensity are the most important factors affecting the shape of a storm hydrograph but does not address the question and does not come to a convincing conclusion. Response is descriptive, knowledge is basic and understanding is poor. Level 0 (0) No creditable response.
Mark scheme, page 14
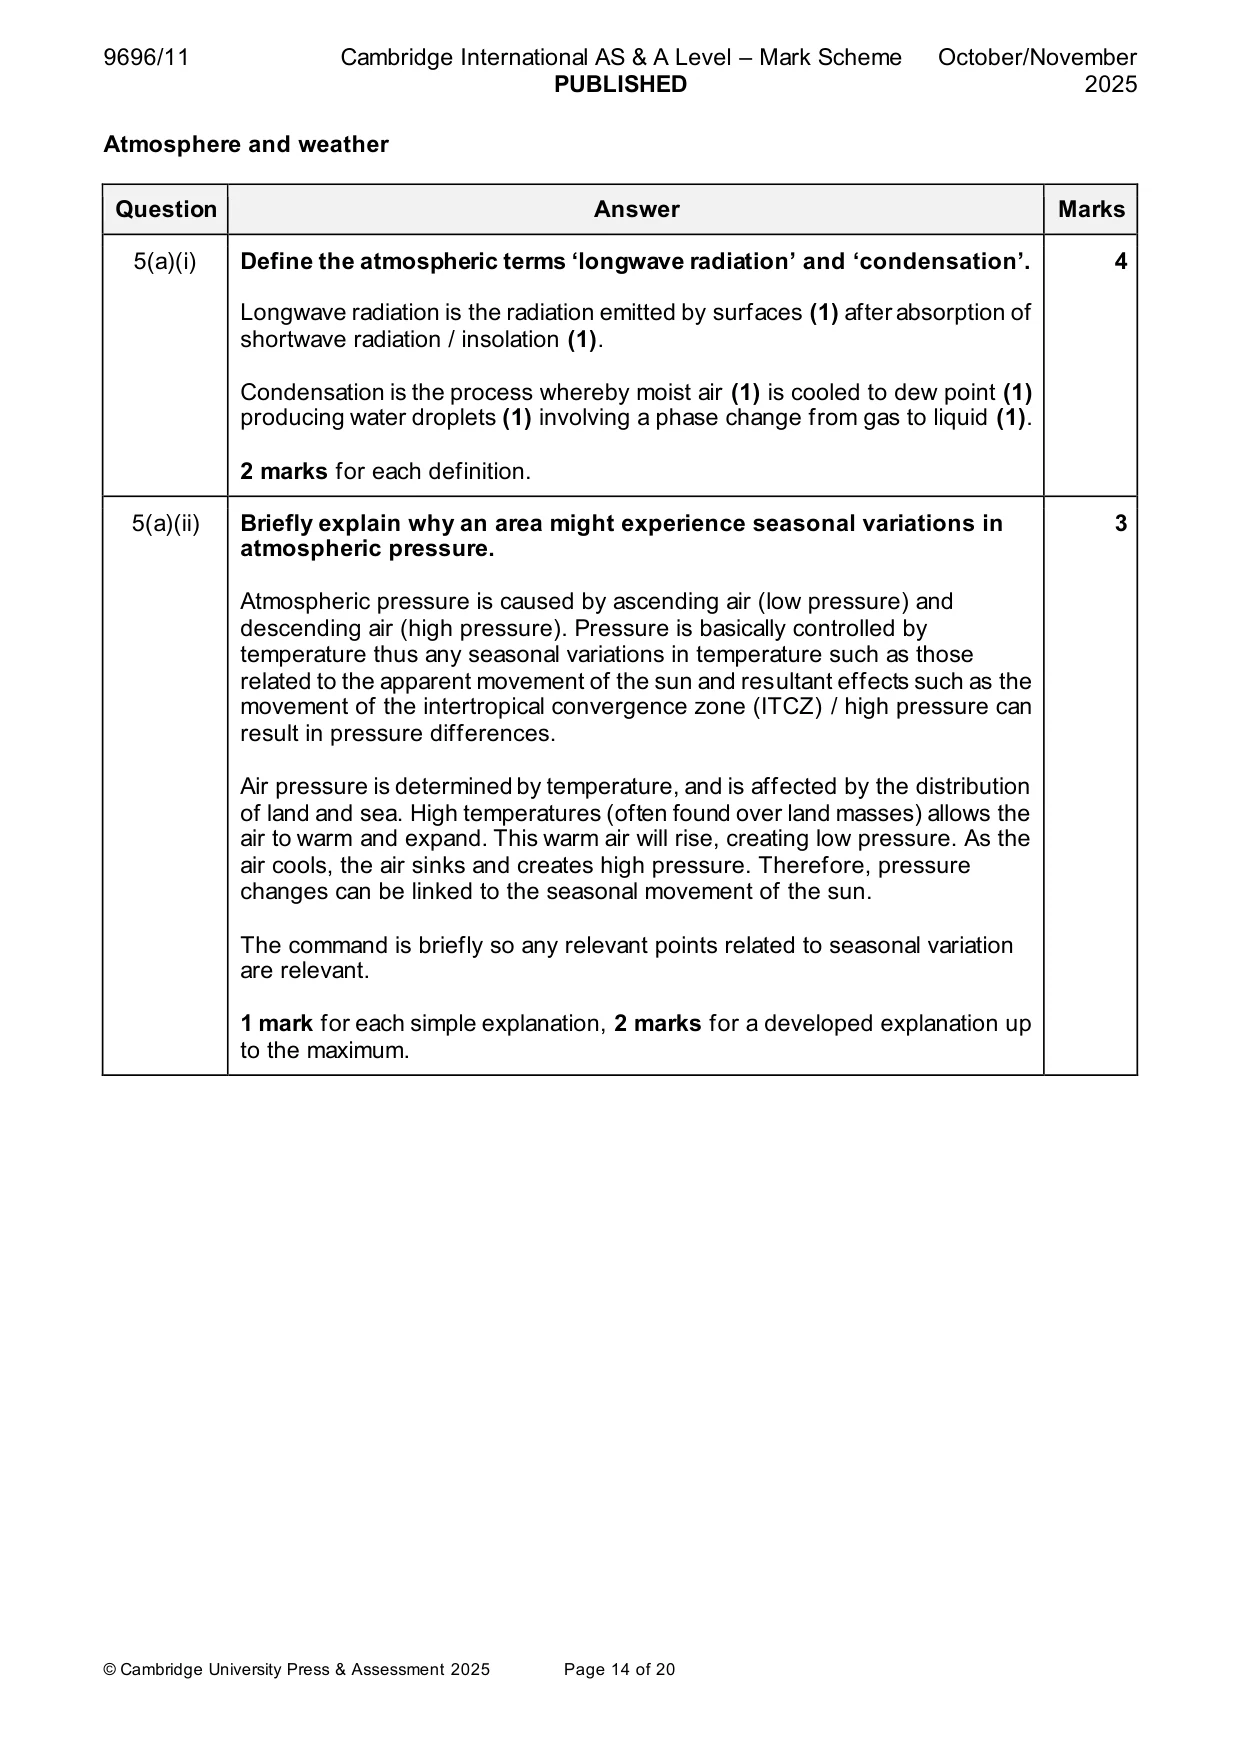
9696/11 Cambridge International AS & A Level – Mark Scheme PUBLISHED October/November 2025 © Cambridge University Press & Assessment 2025 Page 14 of 20 Atmosphere and weather Question Answer Marks 5(a)(i) Define the atmospheric terms ‘longwave radiation’ and ‘condensation’. Longwave radiation is the radiation emitted by surfaces (1) after absorption of shortwave radiation / insolation (1). Condensation is the process whereby moist air (1) is cooled to dew point (1) producing water droplets (1) involving a phase change from gas to liquid (1). 2 marks for each definition. 4 5(a)(ii) Briefly explain why an area might experience seasonal variations in atmospheric pressure. Atmospheric pressure is caused by ascending air (low pressure) and descending air (high pressure). Pressure is basically controlled by temperature thus any seasonal variations in temperature such as those related to the apparent movement of the sun and resultant effects such as the movement of the intertropical convergence zone (ITCZ) / high pressure can result in pressure differences. Air pressure is determined by temperature, and is affected by the distribution of land and sea. High temperatures (often found over land masses) allows the air to warm and expand. This warm air will rise, creating low pressure. As the air cools, the air sinks and creates high pressure. Therefore, pressure changes can be linked to the seasonal movement of the sun. The command is briefly so any relevant points related to seasonal variation are relevant. 1 mark for each simple explanation, 2 marks for a developed explanation up to the maximum. 3
Mark scheme, page 15
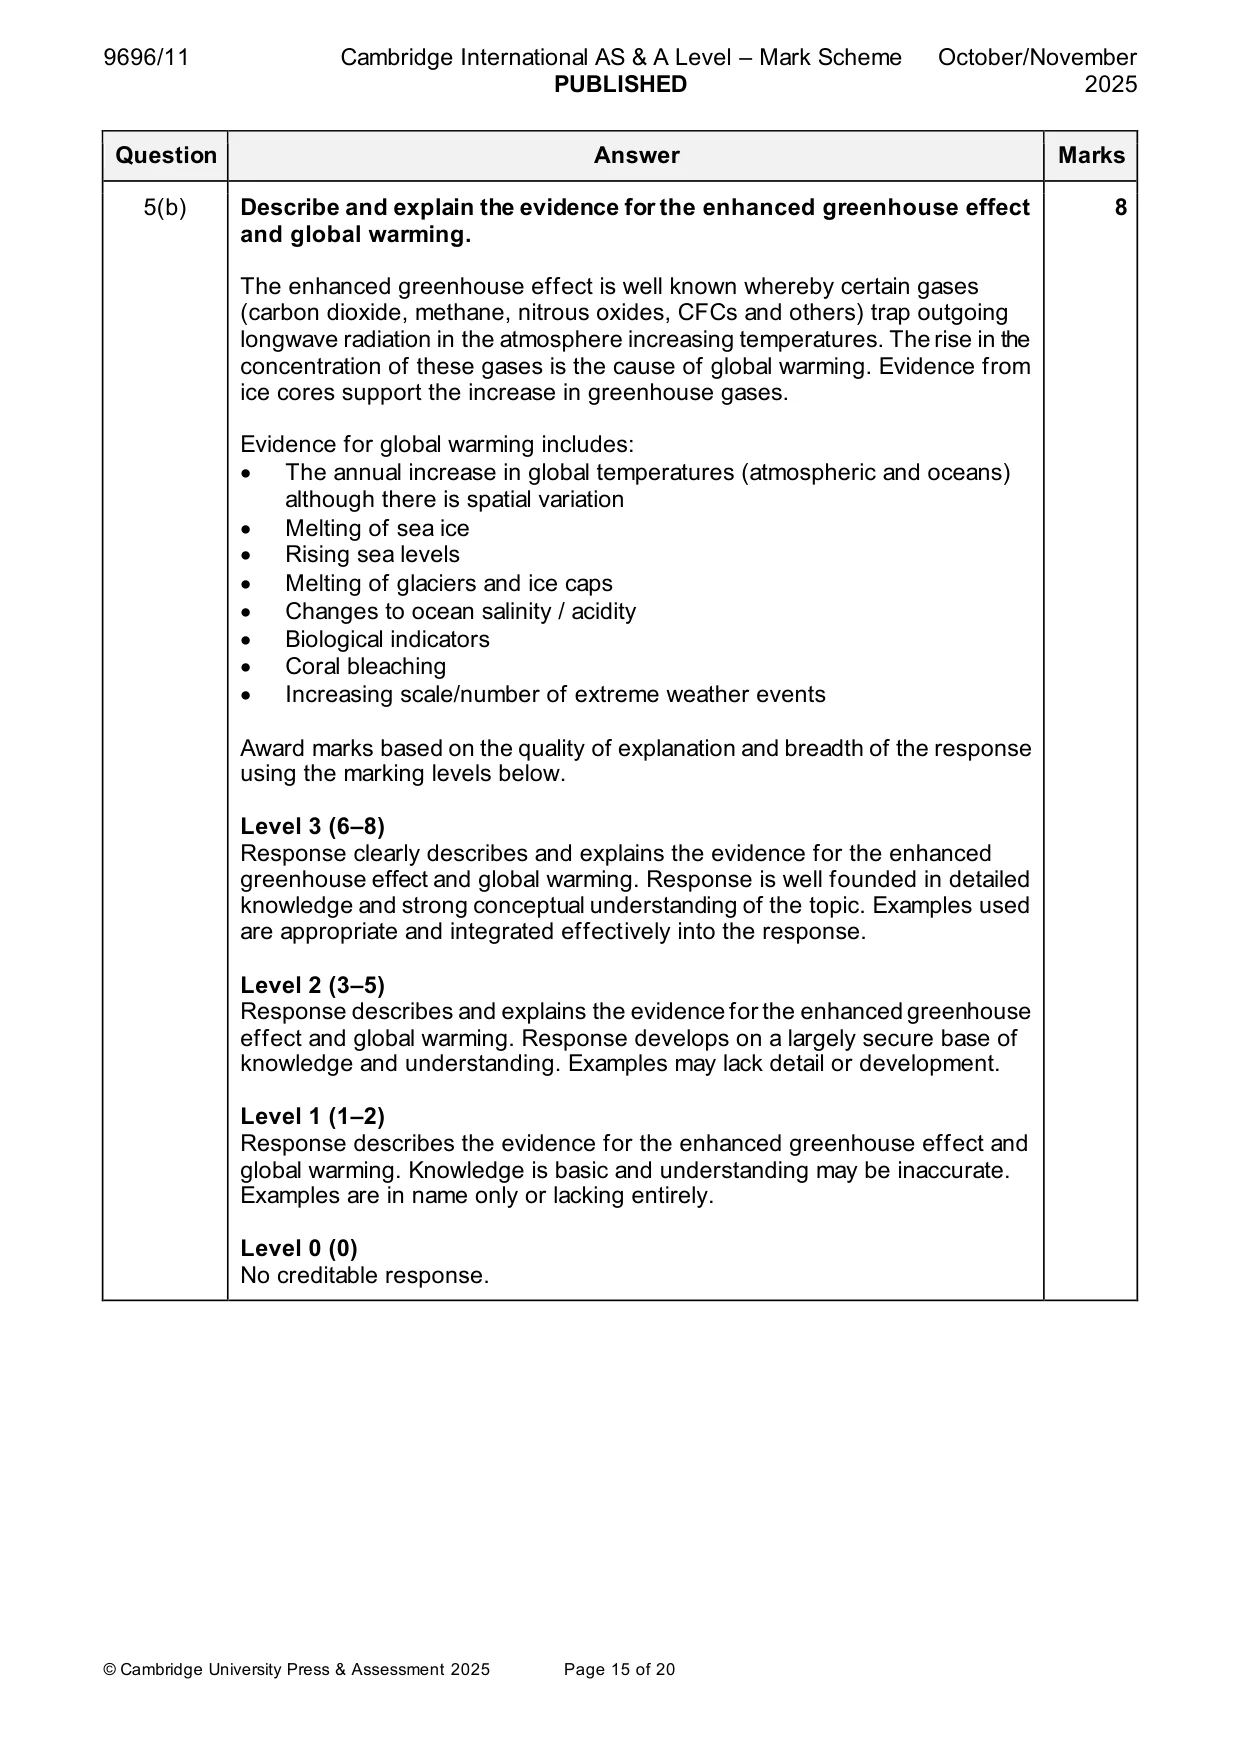
9696/11 Cambridge International AS & A Level – Mark Scheme PUBLISHED October/November 2025 © Cambridge University Press & Assessment 2025 Page 15 of 20 Question Answer Marks 5(b) Describe and explain the evidence for the enhanced greenhouse effect and global warming. The enhanced greenhouse effect is well known whereby certain gases (carbon dioxide, methane, nitrous oxides, CFCs and others) trap outgoing longwave radiation in the atmosphere increasing temperatures. The rise in the concentration of these gases is the cause of global warming. Evidence from ice cores support the increase in greenhouse gases. Evidence for global warming includes: • The annual increase in global temperatures (atmospheric and oceans) although there is spatial variation • Melting of sea ice • Rising sea levels • Melting of glaciers and ice caps • Changes to ocean salinity / acidity • Biological indicators • Coral bleaching • Increasing scale/number of extreme weather events Award marks based on the quality of explanation and breadth of the response using the marking levels below. Level 3 (6–8) Response clearly describes and explains the evidence for the enhanced greenhouse effect and global warming. Response is well founded in detailed knowledge and strong conceptual understanding of the topic. Examples used are appropriate and integrated effectively into the response. Level 2 (3–5) Response describes and explains the evidence for the enhanced greenhouse effect and global warming. Response develops on a largely secure base of knowledge and understanding. Examples may lack detail or development. Level 1 (1–2) Response describes the evidence for the enhanced greenhouse effect and global warming. Knowledge is basic and understanding may be inaccurate. Examples are in name only or lacking entirely. Level 0 (0) No creditable response. 8
Mark scheme, page 16
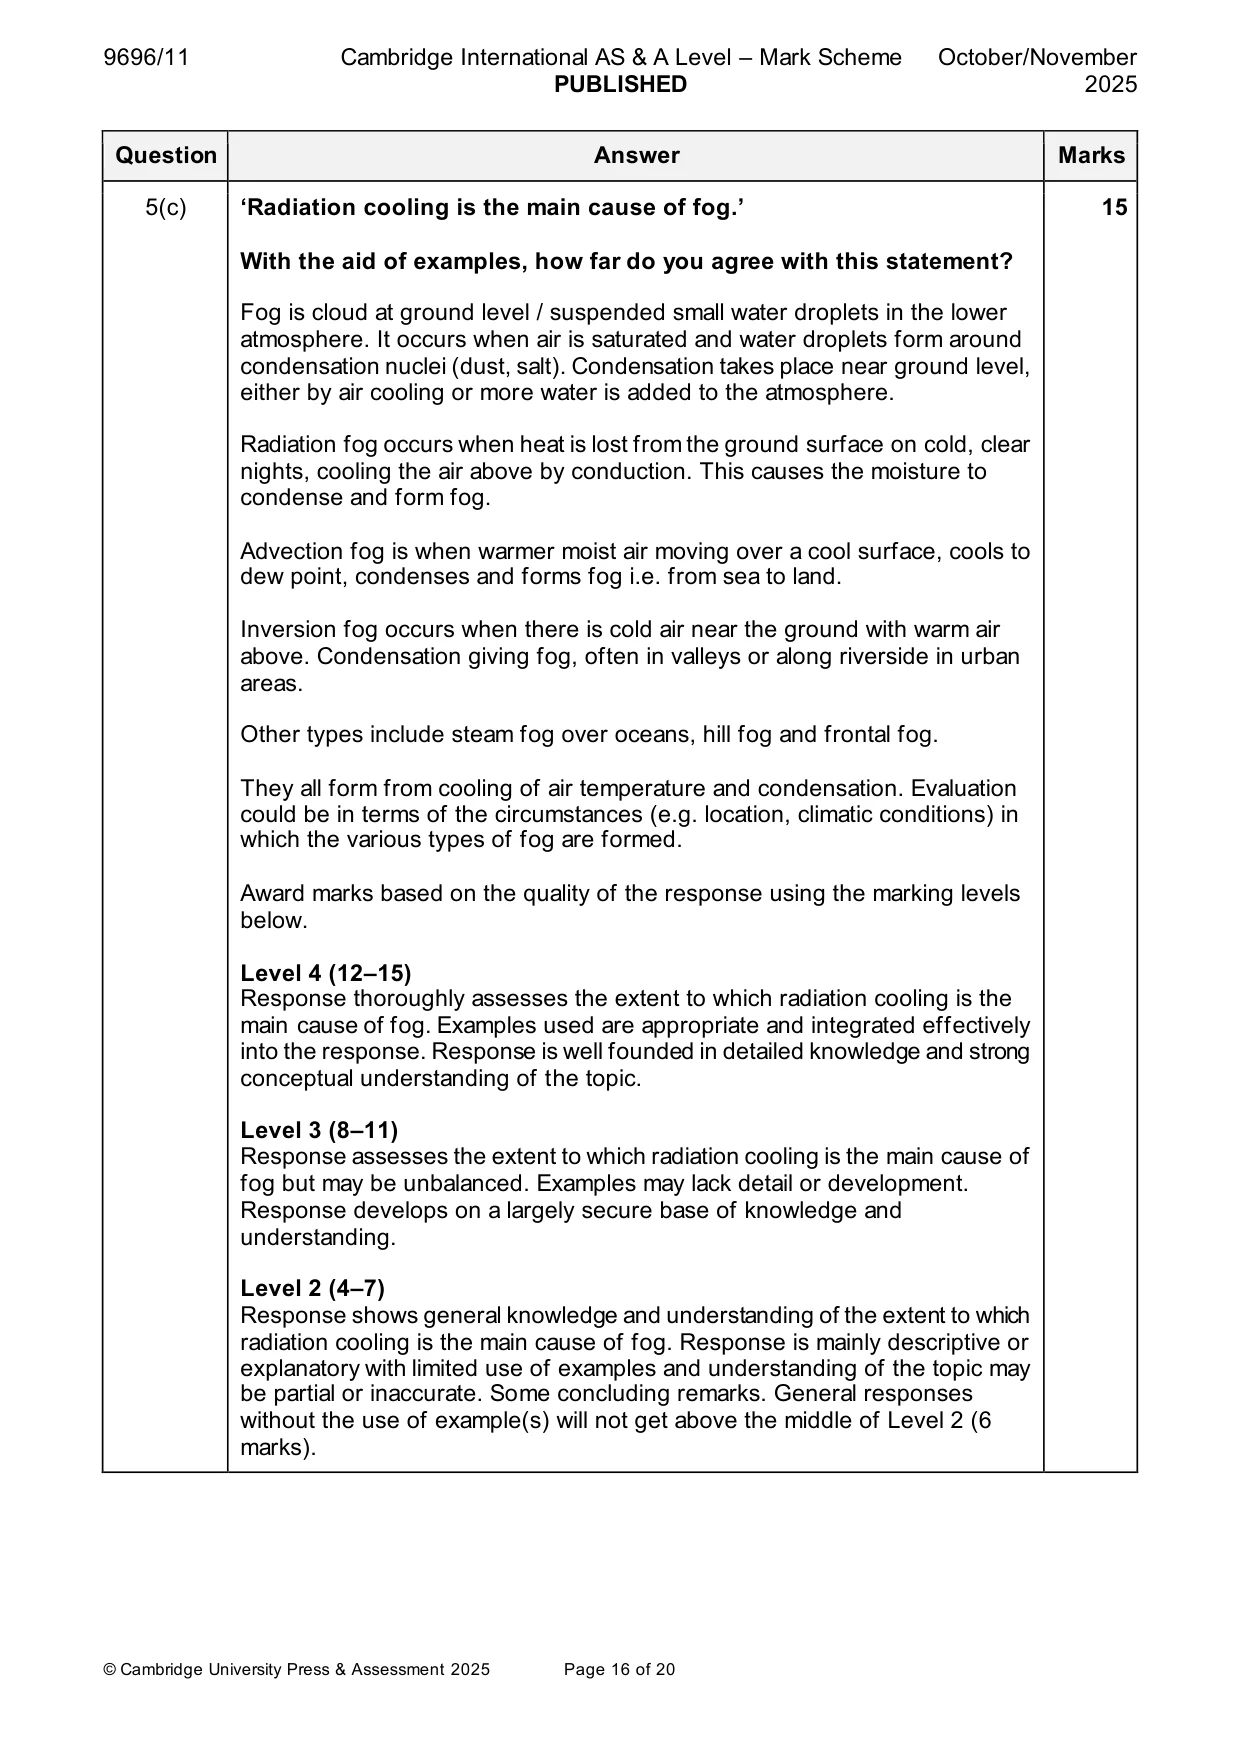
9696/11 Cambridge International AS & A Level – Mark Scheme PUBLISHED October/November 2025 © Cambridge University Press & Assessment 2025 Page 16 of 20 Question Answer Marks 5(c) ‘Radiation cooling is the main cause of fog.’ With the aid of examples, how far do you agree with this statement? Fog is cloud at ground level / suspended small water droplets in the lower atmosphere. It occurs when air is saturated and water droplets form around condensation nuclei (dust, salt). Condensation takes place near ground level, either by air cooling or more water is added to the atmosphere. Radiation fog occurs when heat is lost from the ground surface on cold, clear nights, cooling the air above by conduction. This causes the moisture to condense and form fog. Advection fog is when warmer moist air moving over a cool surface, cools to dew point, condenses and forms fog i.e. from sea to land. Inversion fog occurs when there is cold air near the ground with warm air above. Condensation giving fog, often in valleys or along riverside in urban areas. Other types include steam fog over oceans, hill fog and frontal fog. They all form from cooling of air temperature and condensation. Evaluation could be in terms of the circumstances (e.g. location, climatic conditions) in which the various types of fog are formed. Award marks based on the quality of the response using the marking levels below. Level 4 (12–15) Response thoroughly assesses the extent to which radiation cooling is the main cause of fog. Examples used are appropriate and integrated effectively into the response. Response is well founded in detailed knowledge and strong conceptual understanding of the topic. Level 3 (8–11) Response assesses the extent to which radiation cooling is the main cause of fog but may be unbalanced. Examples may lack detail or development. Response develops on a largely secure base of knowledge and understanding. Level 2 (4–7) Response shows general knowledge and understanding of the extent to which radiation cooling is the main cause of fog. Response is mainly descriptive or explanatory with limited use of examples and understanding of the topic may be partial or inaccurate. Some concluding remarks. General responses without the use of example(s) will not get above the middle of Level 2 (6 marks). 15
Mark scheme, page 17
9696/11 Cambridge International AS & A Level – Mark Scheme PUBLISHED October/November 2025 © Cambridge University Press & Assessment 2025 Page 17 of 20 Question Answer Marks 5(c) Level 1 (1–3) Response may broadly discuss the extent to which radiation cooling is the main cause of fog but does not address the question and does not come to a convincing conclusion. Response is descriptive, knowledge is basic and understanding is poor. Level 0 (0) No creditable response.
Mark scheme, page 18
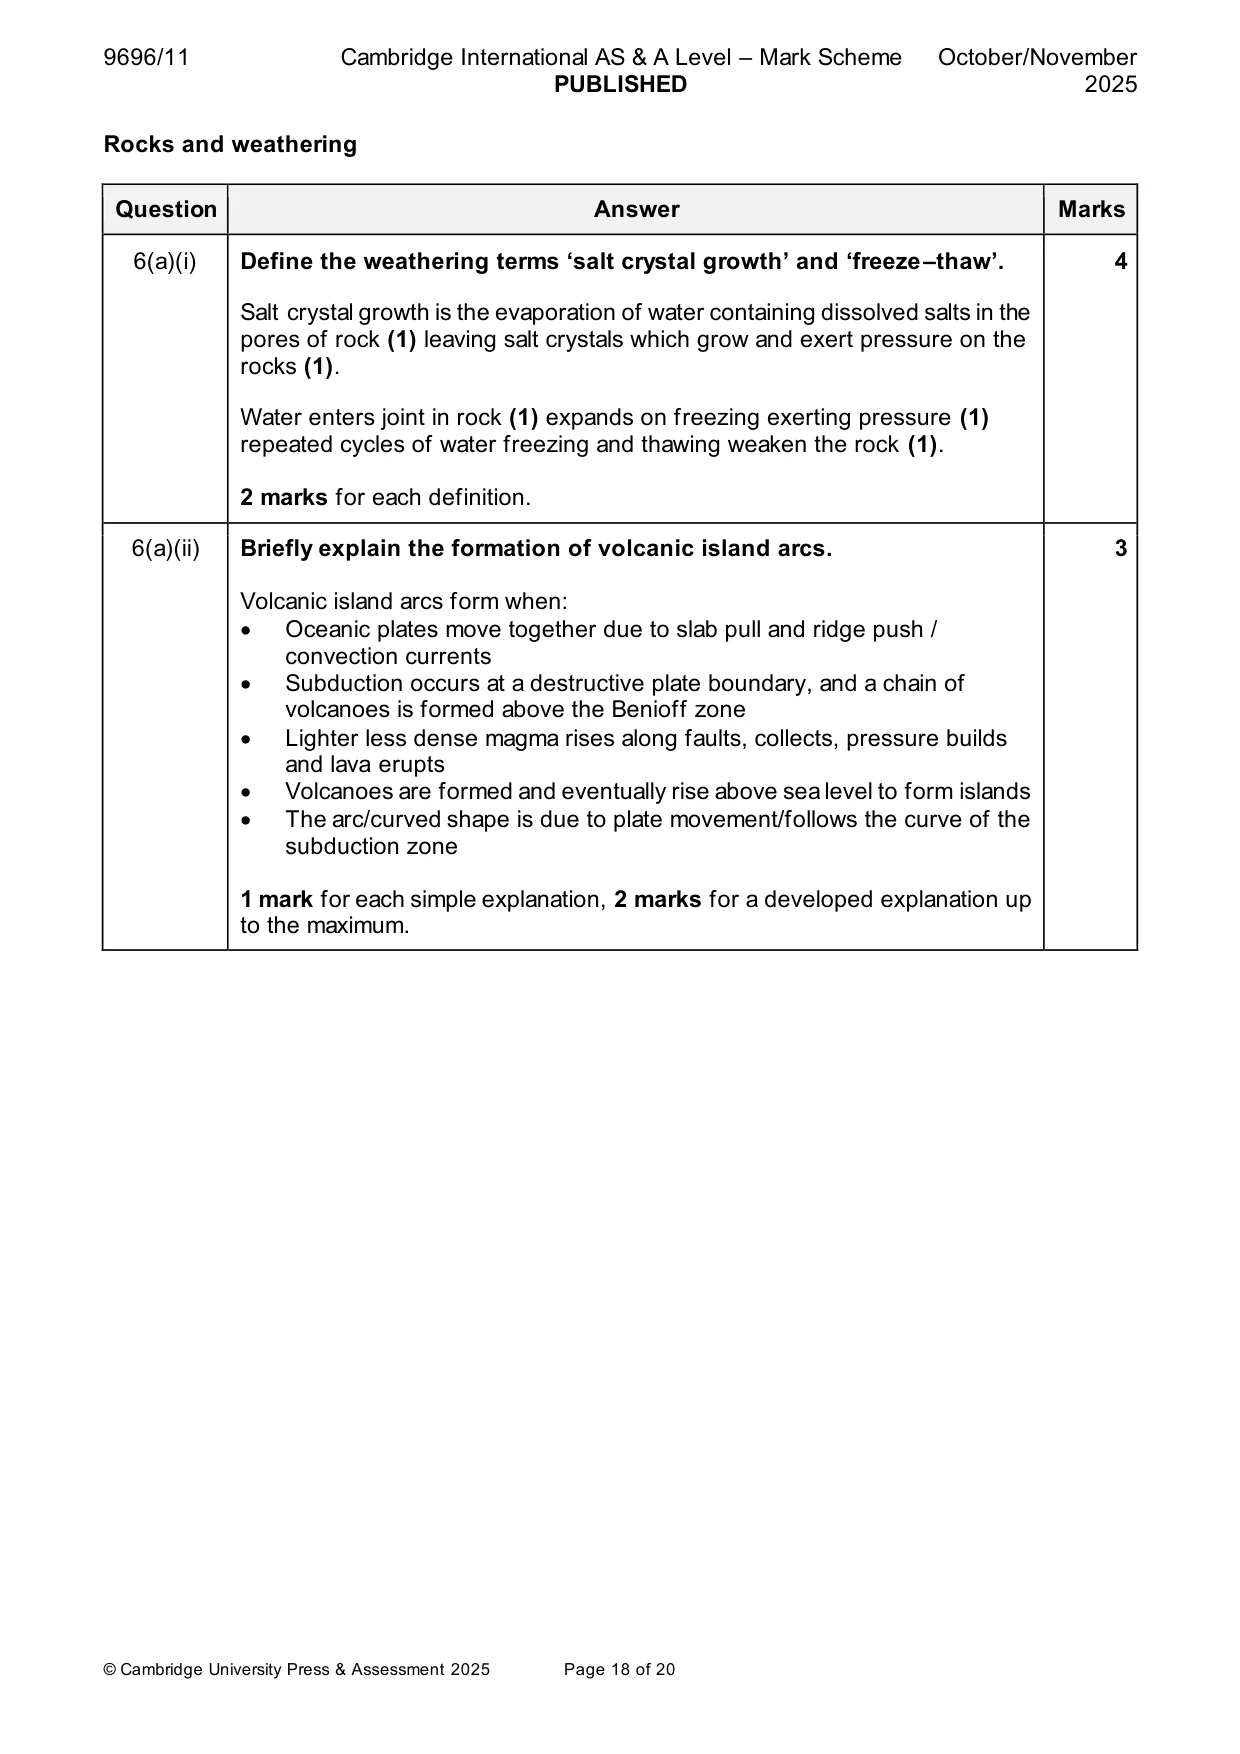
9696/11 Cambridge International AS & A Level – Mark Scheme PUBLISHED October/November 2025 © Cambridge University Press & Assessment 2025 Page 18 of 20 Rocks and weathering Question Answer Marks 6(a)(i) Define the weathering terms ‘salt crystal growth’ and ‘freeze–thaw’. Salt crystal growth is the evaporation of water containing dissolved salts in the pores of rock (1) leaving salt crystals which grow and exert pressure on the rocks (1). Water enters joint in rock (1) expands on freezing exerting pressure (1) repeated cycles of water freezing and thawing weaken the rock (1). 2 marks for each definition. 4 6(a)(ii) Briefly explain the formation of volcanic island arcs. Volcanic island arcs form when: • Oceanic plates move together due to slab pull and ridge push / convection currents • Subduction occurs at a destructive plate boundary, and a chain of volcanoes is formed above the Benioff zone • Lighter less dense magma rises along faults, collects, pressure builds and lava erupts • Volcanoes are formed and eventually rise above sea level to form islands • The arc/curved shape is due to plate movement/follows the curve of the subduction zone 1 mark for each simple explanation, 2 marks for a developed explanation up to the maximum. 3
Mark scheme, page 19
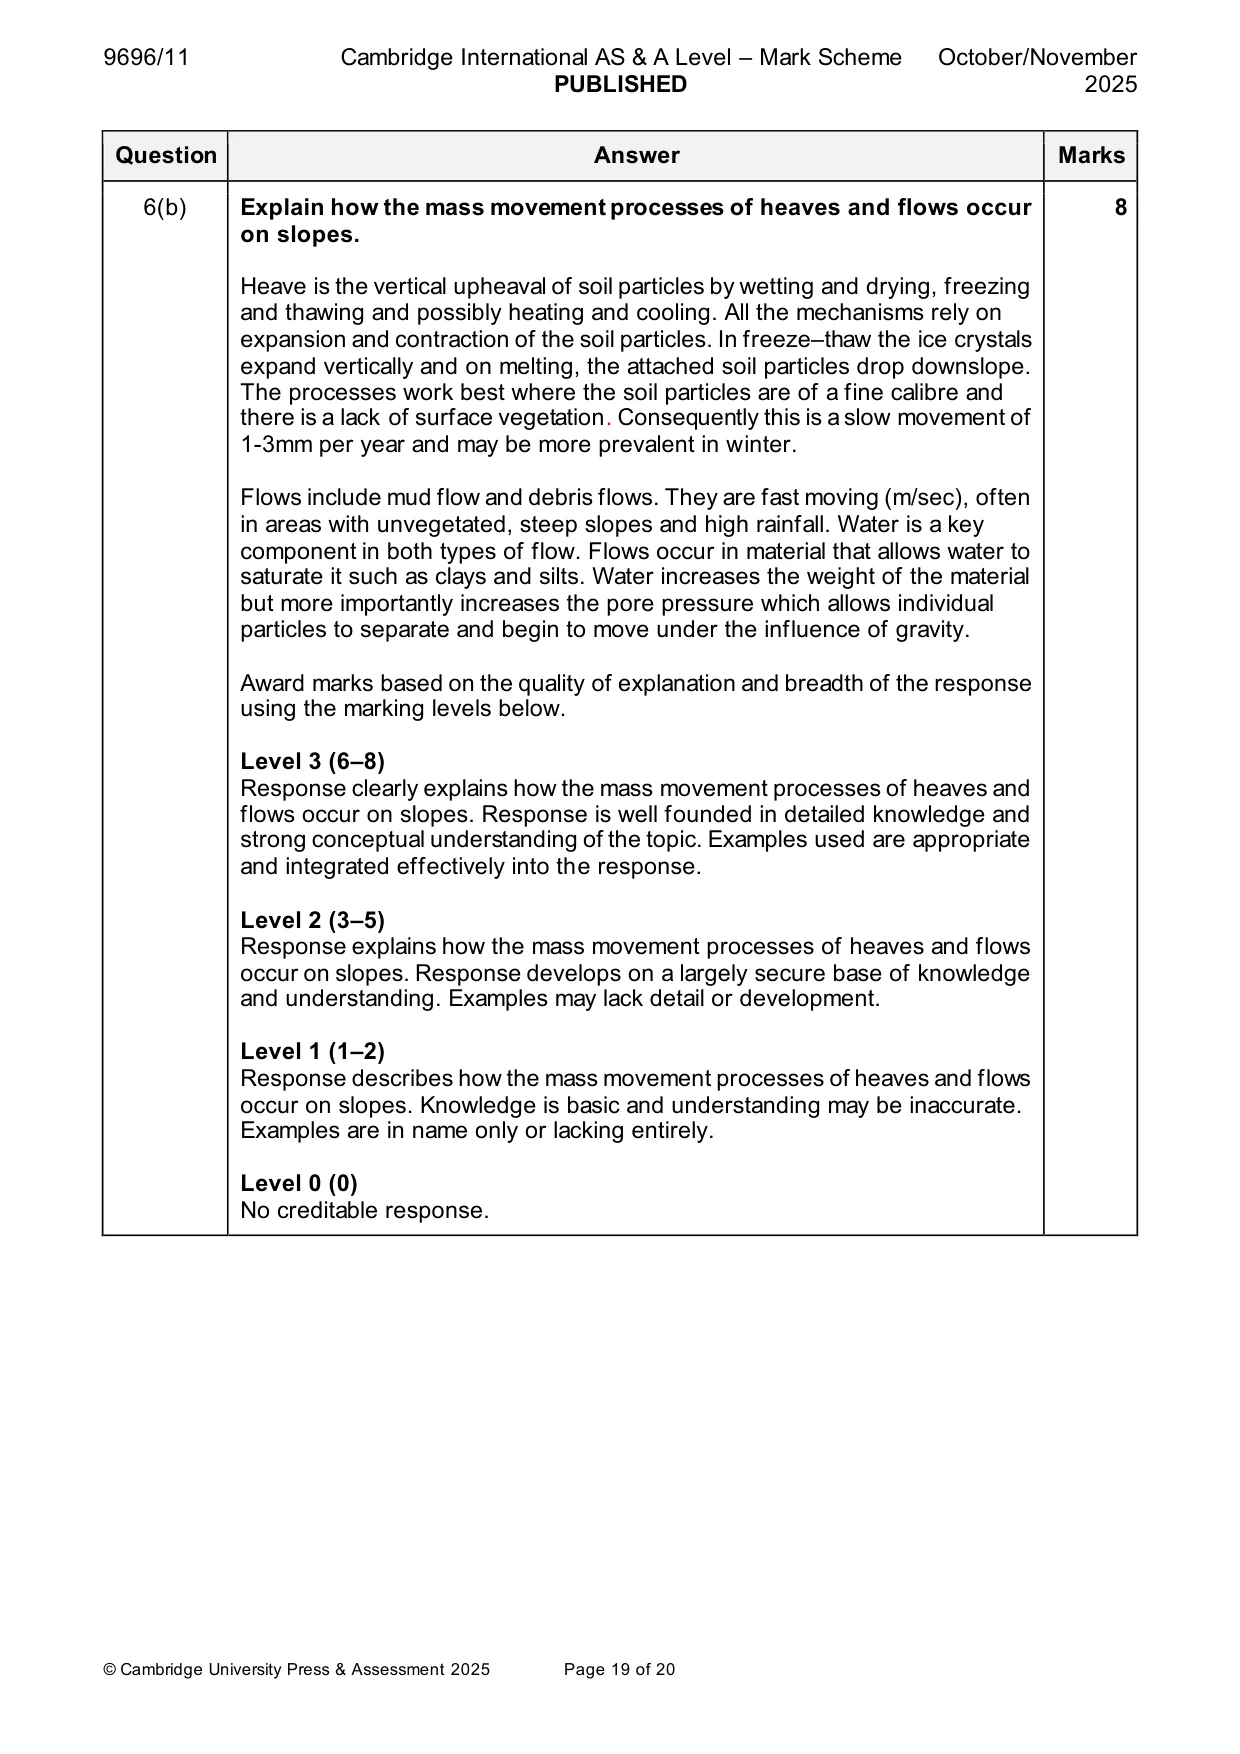
9696/11 Cambridge International AS & A Level – Mark Scheme PUBLISHED October/November 2025 © Cambridge University Press & Assessment 2025 Page 19 of 20 Question Answer Marks 6(b) Explain how the mass movement processes of heaves and flows occur on slopes. Heave is the vertical upheaval of soil particles by wetting and drying, freezing and thawing and possibly heating and cooling. All the mechanisms rely on expansion and contraction of the soil particles. In freeze–thaw the ice crystals expand vertically and on melting, the attached soil particles drop downslope. The processes work best where the soil particles are of a fine calibre and there is a lack of surface vegetation. Consequently this is a slow movement of 1-3mm per year and may be more prevalent in winter. Flows include mud flow and debris flows. They are fast moving (m/sec), often in areas with unvegetated, steep slopes and high rainfall. Water is a key component in both types of flow. Flows occur in material that allows water to saturate it such as clays and silts. Water increases the weight of the material but more importantly increases the pore pressure which allows individual particles to separate and begin to move under the influence of gravity. Award marks based on the quality of explanation and breadth of the response using the marking levels below. Level 3 (6–8) Response clearly explains how the mass movement processes of heaves and flows occur on slopes. Response is well founded in detailed knowledge and strong conceptual understanding of the topic. Examples used are appropriate and integrated effectively into the response. Level 2 (3–5) Response explains how the mass movement processes of heaves and flows occur on slopes. Response develops on a largely secure base of knowledge and understanding. Examples may lack detail or development. Level 1 (1–2) Response describes how the mass movement processes of heaves and flows occur on slopes. Knowledge is basic and understanding may be inaccurate. Examples are in name only or lacking entirely. Level 0 (0) No creditable response. 8
Mark scheme, page 20
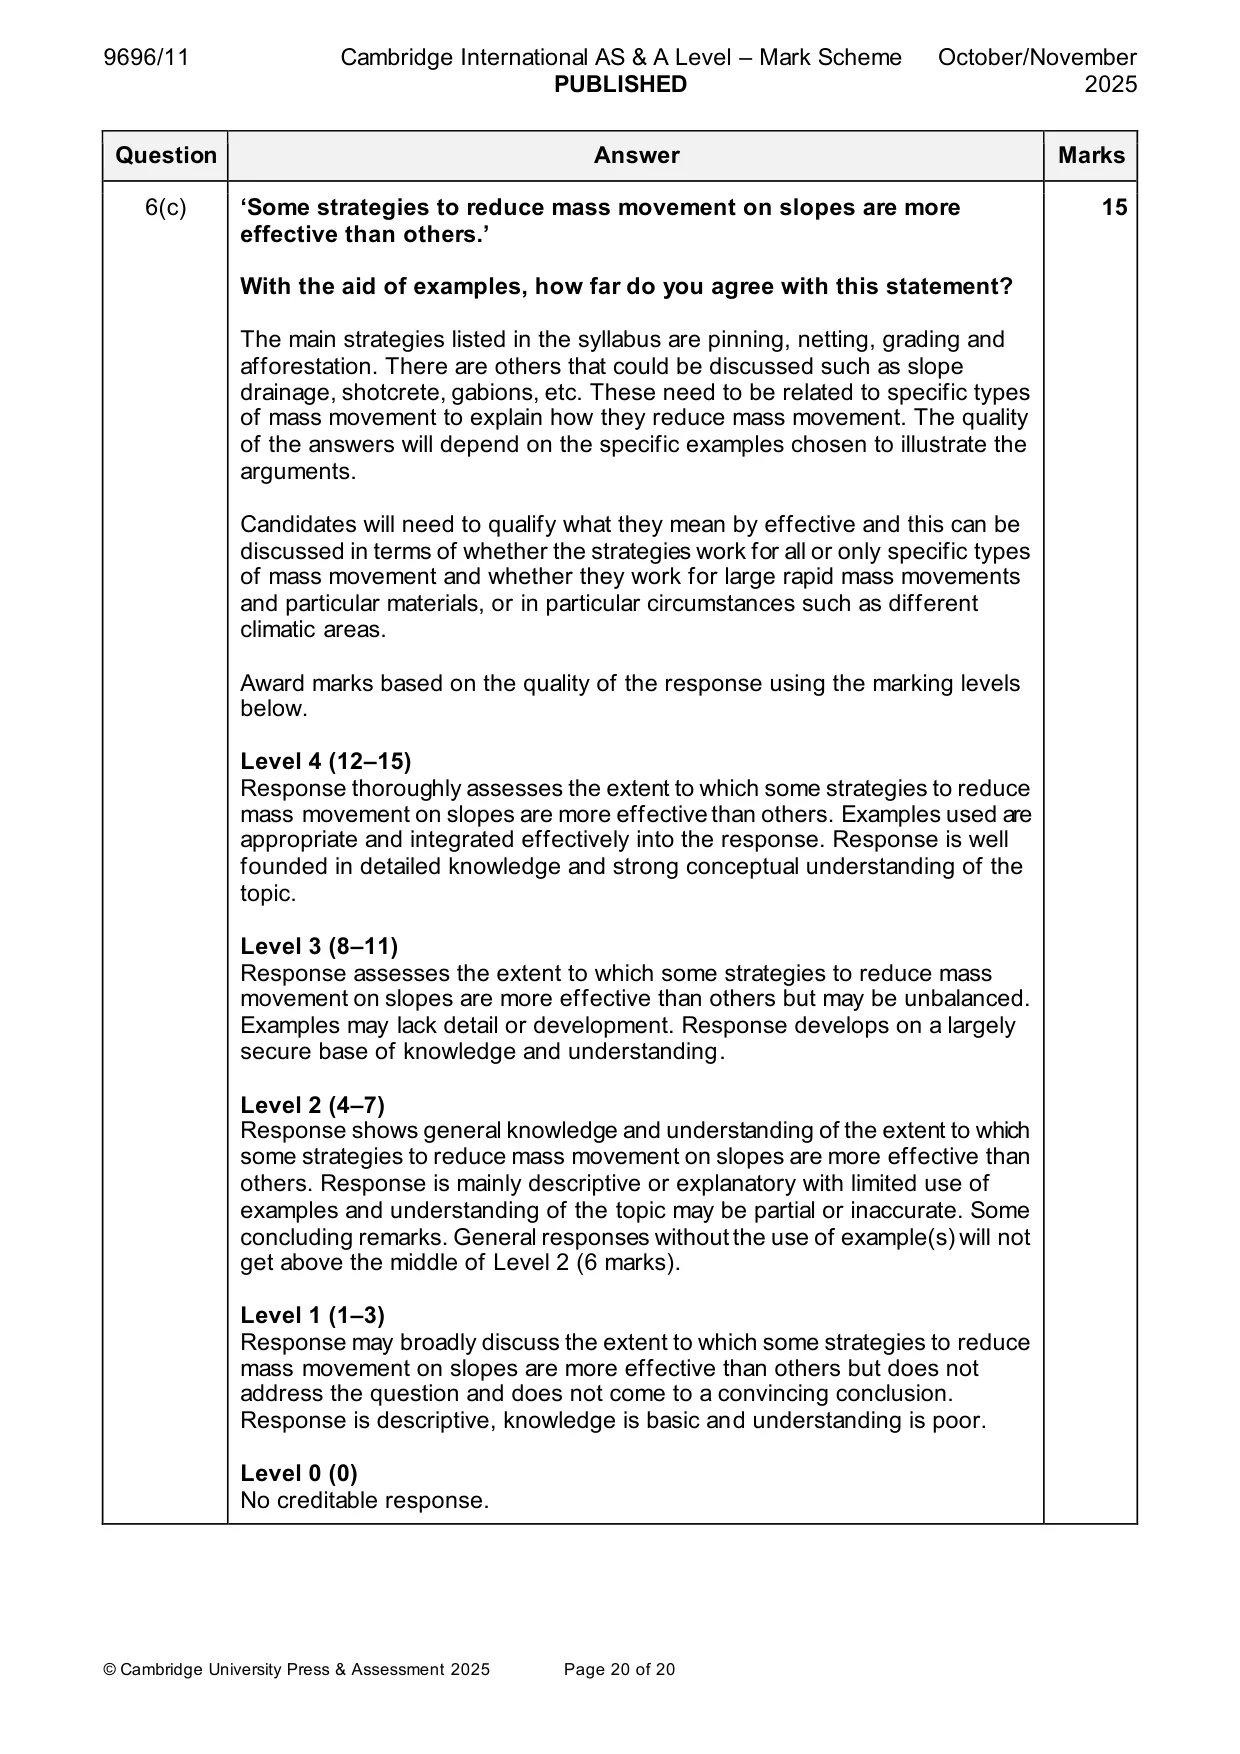
9696/11 Cambridge International AS & A Level – Mark Scheme PUBLISHED October/November 2025 © Cambridge University Press & Assessment 2025 Page 20 of 20 Question Answer Marks 6(c) ‘Some strategies to reduce mass movement on slopes are more effective than others.’ With the aid of examples, how far do you agree with this statement? The main strategies listed in the syllabus are pinning, netting, grading and afforestation. There are others that could be discussed such as slope drainage, shotcrete, gabions, etc. These need to be related to specific types of mass movement to explain how they reduce mass movement. The quality of the answers will depend on the specific examples chosen to illustrate the arguments. Candidates will need to qualify what they mean by effective and this can be discussed in terms of whether the strategies work for all or only specific types of mass movement and whether they work for large rapid mass movements and particular materials, or in particular circumstances such as different climatic areas. Award marks based on the quality of the response using the marking levels below. Level 4 (12–15) Response thoroughly assesses the extent to which some strategies to reduce mass movement on slopes are more effective than others. Examples used are appropriate and integrated effectively into the response. Response is well founded in detailed knowledge and strong conceptual understanding of the topic. Level 3 (8–11) Response assesses the extent to which some strategies to reduce mass movement on slopes are more effective than others but may be unbalanced. Examples may lack detail or development. Response develops on a largely secure base of knowledge and understanding. Level 2 (4–7) Response shows general knowledge and understanding of the extent to which some strategies to reduce mass movement on slopes are more effective than others. Response is mainly descriptive or explanatory with limited use of examples and understanding of the topic may be partial or inaccurate. Some concluding remarks. General responses without the use of example(s) will not get above the middle of Level 2 (6 marks). Level 1 (1–3) Response may broadly discuss the extent to which some strategies to reduce mass movement on slopes are more effective than others but does not address the question and does not come to a convincing conclusion. Response is descriptive, knowledge is basic and understanding is poor. Level 0 (0) No creditable response. 15
What you needed in this session
Cambridge’s own grade thresholds for 2025 Oct/Nov, Paper 1 · Variant 1. A higher threshold means an easier paper — the bar moves with how the cohort did.