Cambridge A Level Geography 9696 — 2022 May/June Paper 1 · Variant 1
9696/11/M/J/22 · 60 marks · ≈68 min
The question paper and its mark scheme, free to read here and free to download. This is Cambridge’s own paper, exactly as it was sat.
Question paper4 pages

Mark scheme16 pages
Answers below. Sit the paper first if you are practising.
Paper as text
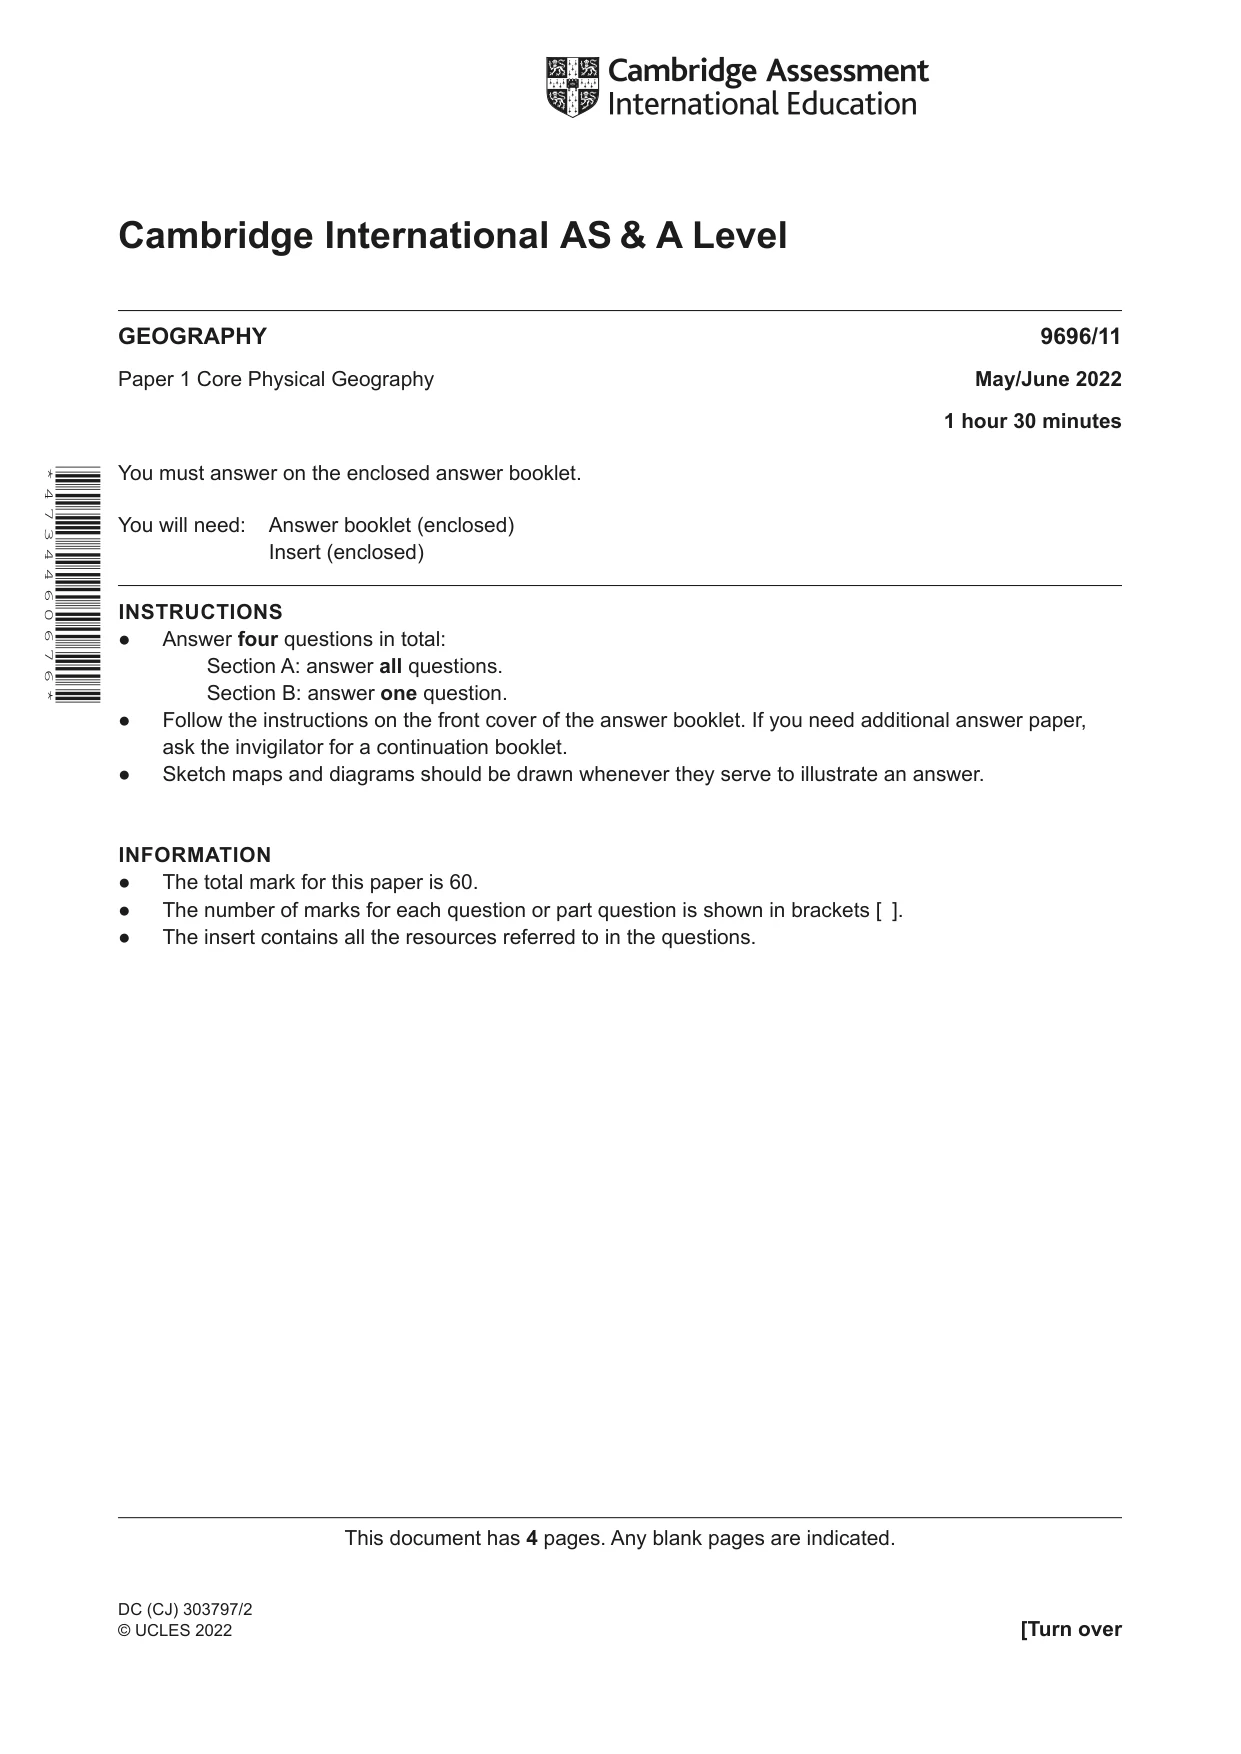
Question paper, page 1
This document has 4 pages. Any blank pages are indicated. [Turn over Cambridge International AS & A Level GEOGRAPHY 9696/11 Paper 1 Core Physical Geography May/June 2022 1 hour 30 minutes You must answer on the enclosed answer booklet. You will need: Answer booklet (enclosed) Insert (enclosed) INSTRUCTIONS ● Answer four questions in total: Section A: answer all questions. Section B: answer one question. ● Follow the instructions on the front cover of the answer booklet. If you need additional answer paper, ask the invigilator for a continuation booklet. ● Sketch maps and diagrams should be drawn whenever they serve to illustrate an answer. INFORMATION ● The total mark for this paper is 60. ● The number of marks for each question or part question is shown in brackets [ ]. ● The insert contains all the resources referred to in the questions. * 4 7 3 4 4 6 0 6 7 6 * DC (CJ) 303797/2 © UCLES 2022
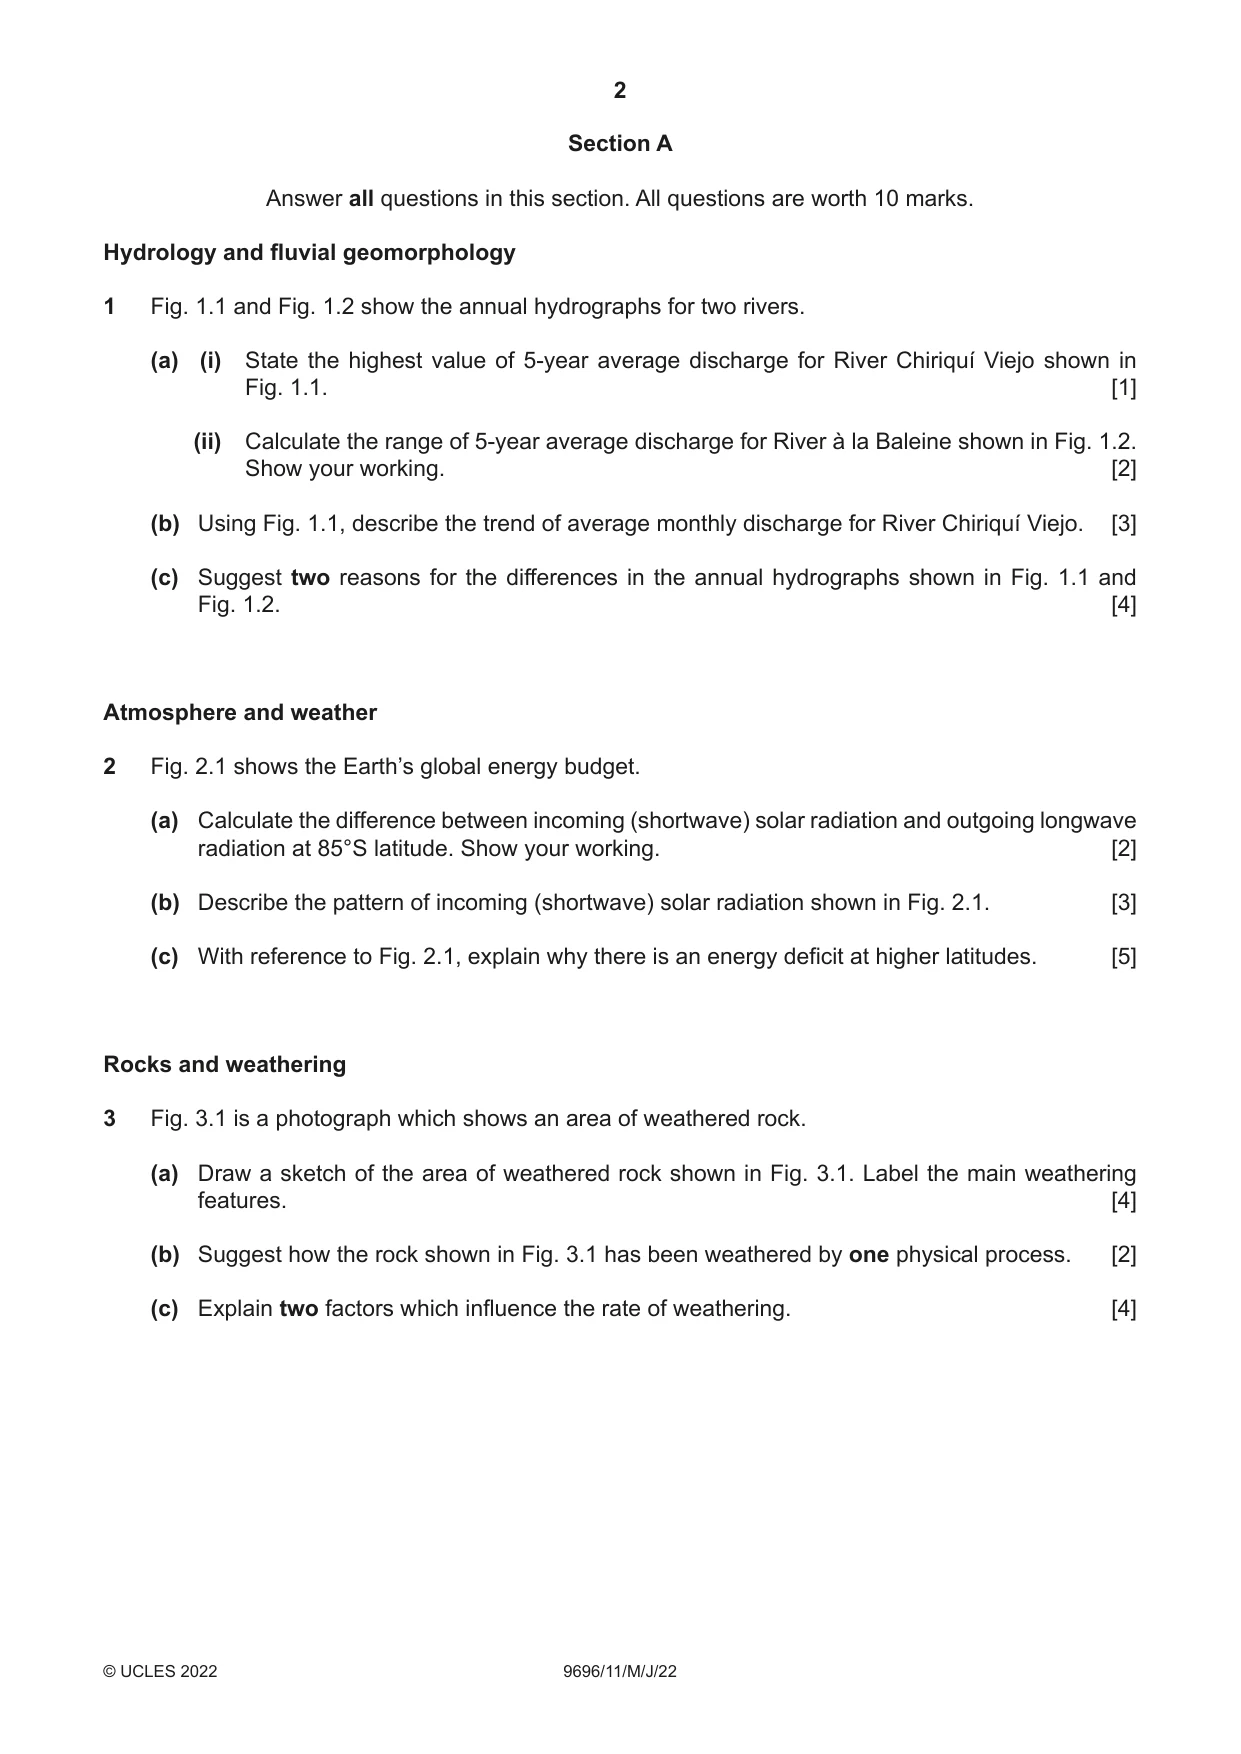
Question paper, page 2
2 9696/11/M/J/22 © UCLES 2022 Section A Answer all questions in this section. All questions are worth 10 marks. Hydrology and fluvial geomorphology 1 Fig. 1.1 and Fig. 1.2 show the annual hydrographs for two rivers. (a) (i) State the highest value of 5-year average discharge for River Chiriquí Viejo shown in Fig. 1.1. [1] (ii) Calculate the range of 5-year average discharge for River à la Baleine shown in Fig. 1.2. Show your working. [2] (b) Using Fig. 1.1, describe the trend of average monthly discharge for River Chiriquí Viejo. [3] (c) Suggest two reasons for the differences in the annual hydrographs shown in Fig. 1.1 and Fig. 1.2. [4] Atmosphere and weather 2 Fig. 2.1 shows the Earth’s global energy budget. (a) Calculate the difference between incoming (shortwave) solar radiation and outgoing longwave radiation at 85°S latitude. Show your working. [2] (b) Describe the pattern of incoming (shortwave) solar radiation shown in Fig. 2.1. [3] (c) With reference to Fig. 2.1, explain why there is an energy deficit at higher latitudes. [5] Rocks and weathering 3 Fig. 3.1 is a photograph which shows an area of weathered rock. (a) Draw a sketch of the area of weathered rock shown in Fig. 3.1. Label the main weathering features. [4] (b) Suggest how the rock shown in Fig. 3.1 has been weathered by one physical process. [2] (c) Explain two factors which influence the rate of weathering. [4]
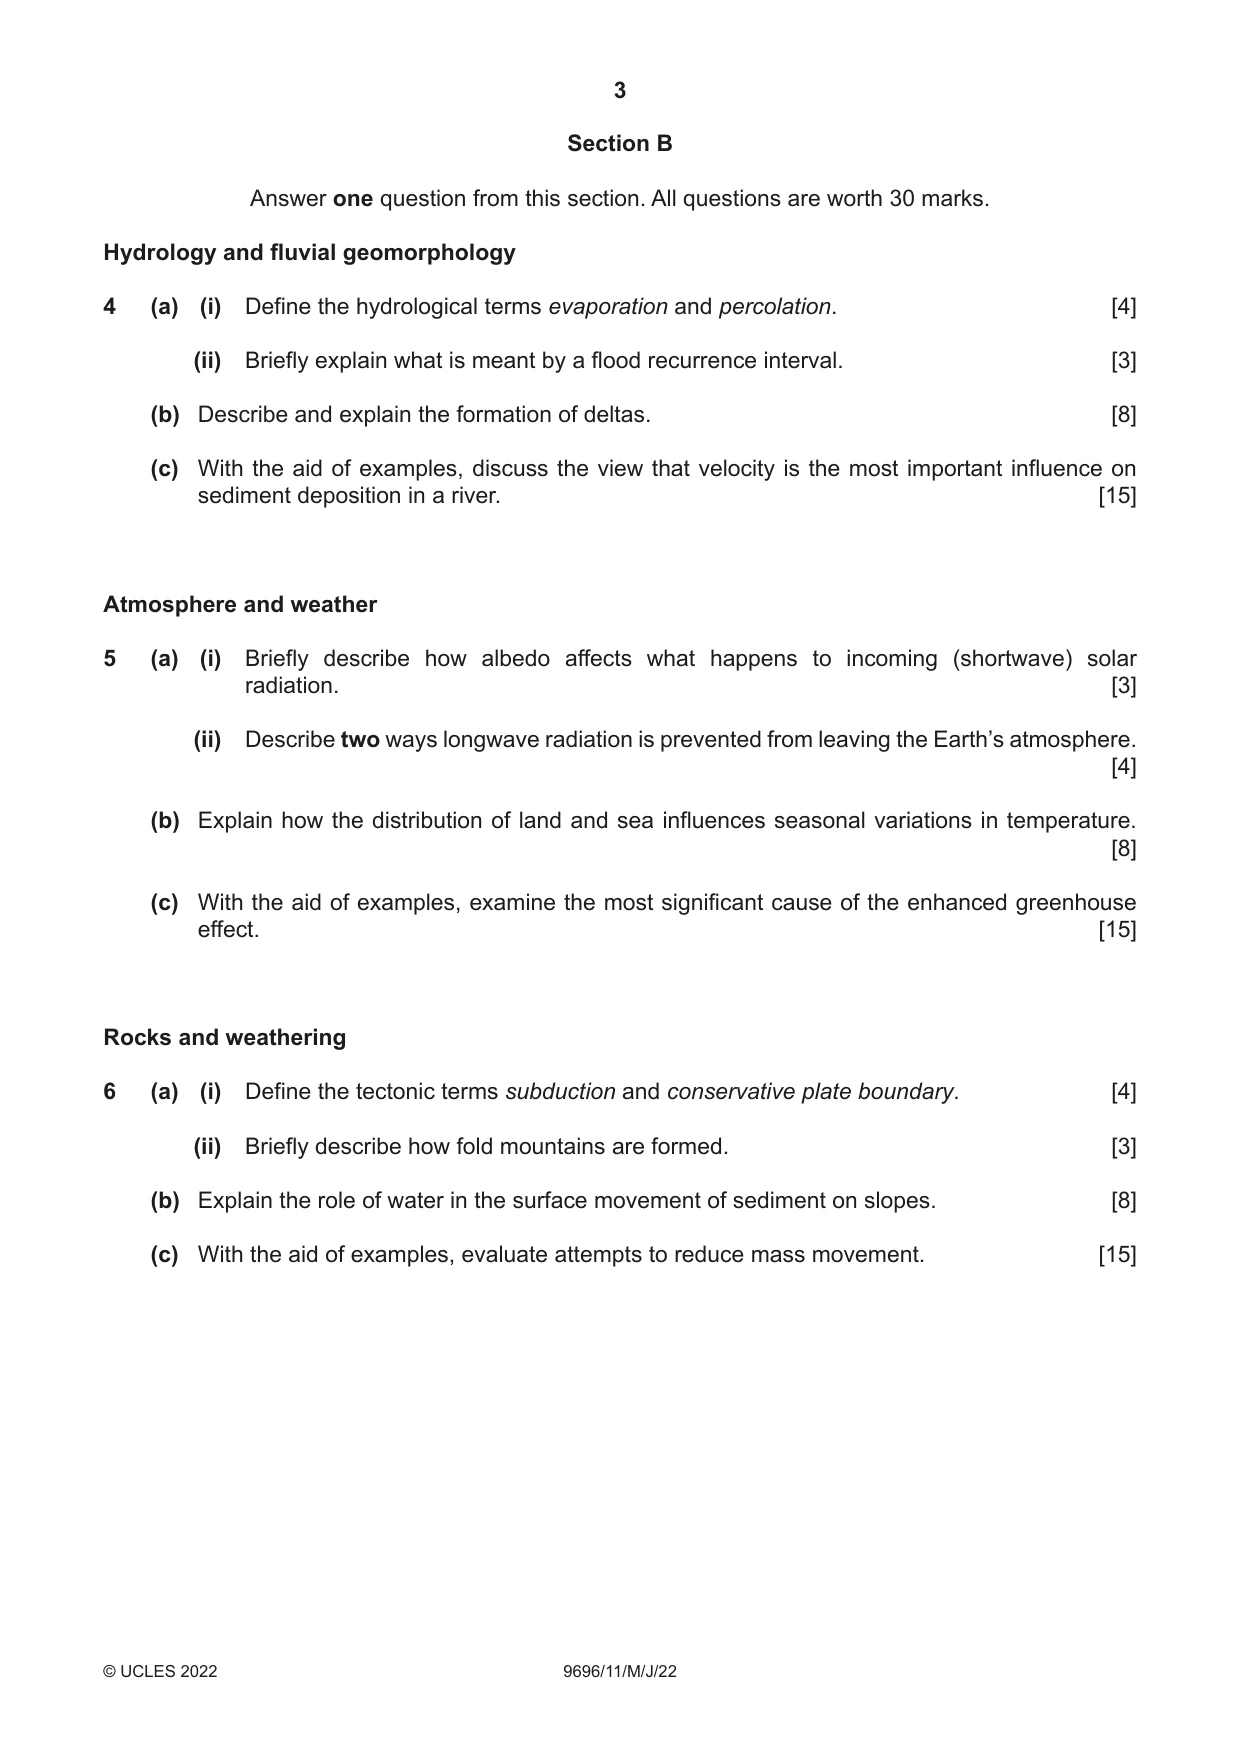
Question paper, page 3
3 9696/11/M/J/22 © UCLES 2022 Section B Answer one question from this section. All questions are worth 30 marks. Hydrology and fluvial geomorphology 4 (a) (i) Define the hydrological terms evaporation and percolation. [4] (ii) Briefly explain what is meant by a flood recurrence interval. [3] (b) Describe and explain the formation of deltas. [8] (c) With the aid of examples, discuss the view that velocity is the most important influence on sediment deposition in a river. [15] Atmosphere and weather 5 (a) (i) Briefly describe how albedo affects what happens to incoming (shortwave) solar radiation. [3] (ii) Describe two ways longwave radiation is prevented from leaving the Earth’s atmosphere. [4] (b) Explain how the distribution of land and sea influences seasonal variations in temperature. [8] (c) With the aid of examples, examine the most significant cause of the enhanced greenhouse effect. [15] Rocks and weathering 6 (a) (i) Define the tectonic terms subduction and conservative plate boundary. [4] (ii) Briefly describe how fold mountains are formed. [3] (b) Explain the role of water in the surface movement of sediment on slopes. [8] (c) With the aid of examples, evaluate attempts to reduce mass movement. [15]
Question paper, page 4
4 9696/11/M/J/22 © UCLES 2022 The boundaries and names shown, the designations used and the presentation of material on any maps contained in this question paper/insert do not imply official endorsement or acceptance by Cambridge Assessment International Education concerning the legal status of any country, territory, or area or any of its authorities, or of the delimitation of its frontiers or boundaries. Permission to reproduce items where third-party owned material protected by copyright is included has been sought and cleared where possible. Every reasonable effort has been made by the publisher (UCLES) to trace copyright holders, but if any items requiring clearance have unwittingly been included, the publisher will be pleased to make amends at the earliest possible opportunity. To avoid the issue of disclosure of answer-related information to candidates, all copyright acknowledgements are reproduced online in the Cambridge Assessment International Education Copyright Acknowledgements Booklet. This is produced for each series of examinations and is freely available to download at www.cambridgeinternational.org after the live examination series. Cambridge Assessment International Education is part of Cambridge Assessment. Cambridge Assessment is the brand name of the University of Cambridge Local Examinations Syndicate (UCLES), which is a department of the University of Cambridge. BLANK PAGE
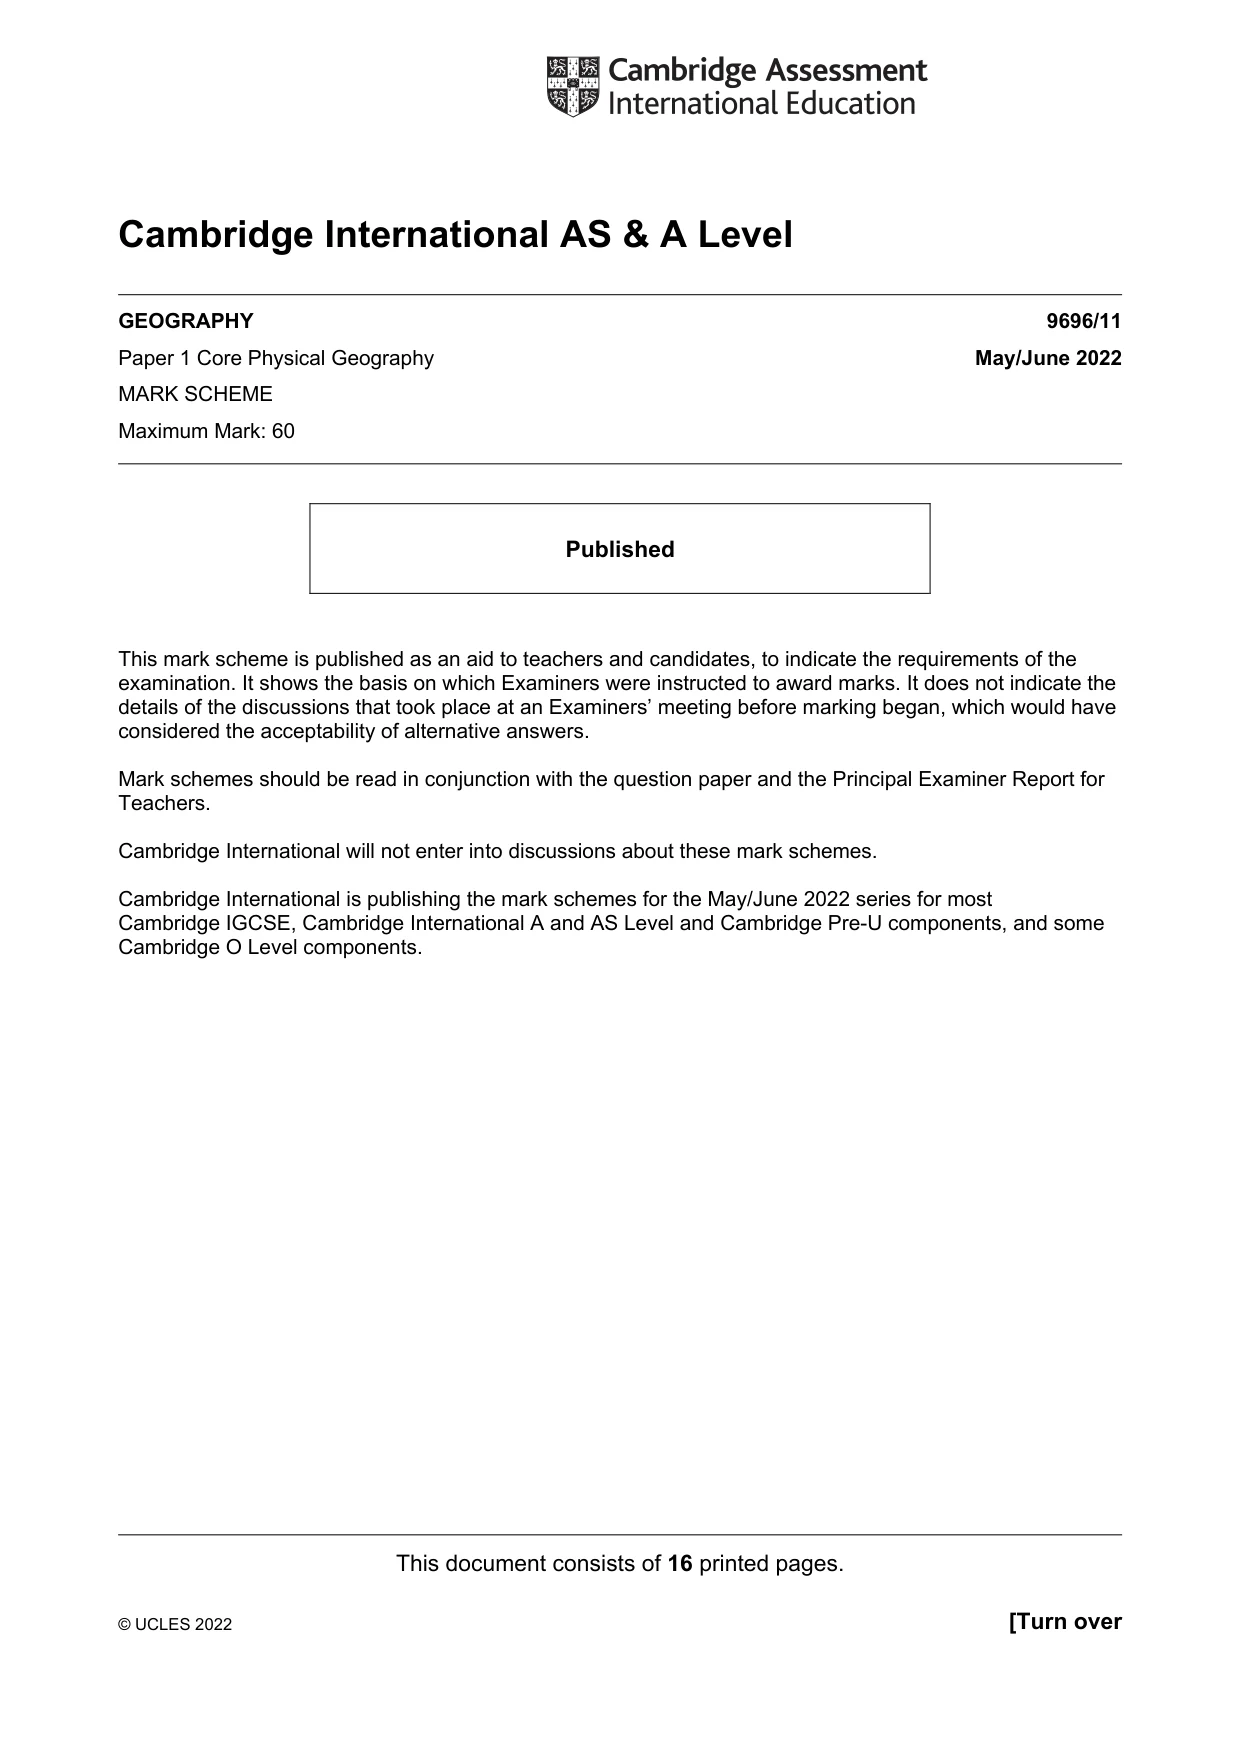
Mark scheme, page 1
This document consists of 16 printed pages. © UCLES 2022 [Turn over Cambridge International AS & A Level GEOGRAPHY 9696/11 Paper 1 Core Physical Geography May/June 2022 MARK SCHEME Maximum Mark: 60 Published This mark scheme is published as an aid to teachers and candidates, to indicate the requirements of the examination. It shows the basis on which Examiners were instructed to award marks. It does not indicate the details of the discussions that took place at an Examiners’ meeting before marking began, which would have considered the acceptability of alternative answers. Mark schemes should be read in conjunction with the question paper and the Principal Examiner Report for Teachers. Cambridge International will not enter into discussions about these mark schemes. Cambridge International is publishing the mark schemes for the May/June 2022 series for most Cambridge IGCSE, Cambridge International A and AS Level and Cambridge Pre-U components, and some Cambridge O Level components.
Mark scheme, page 2
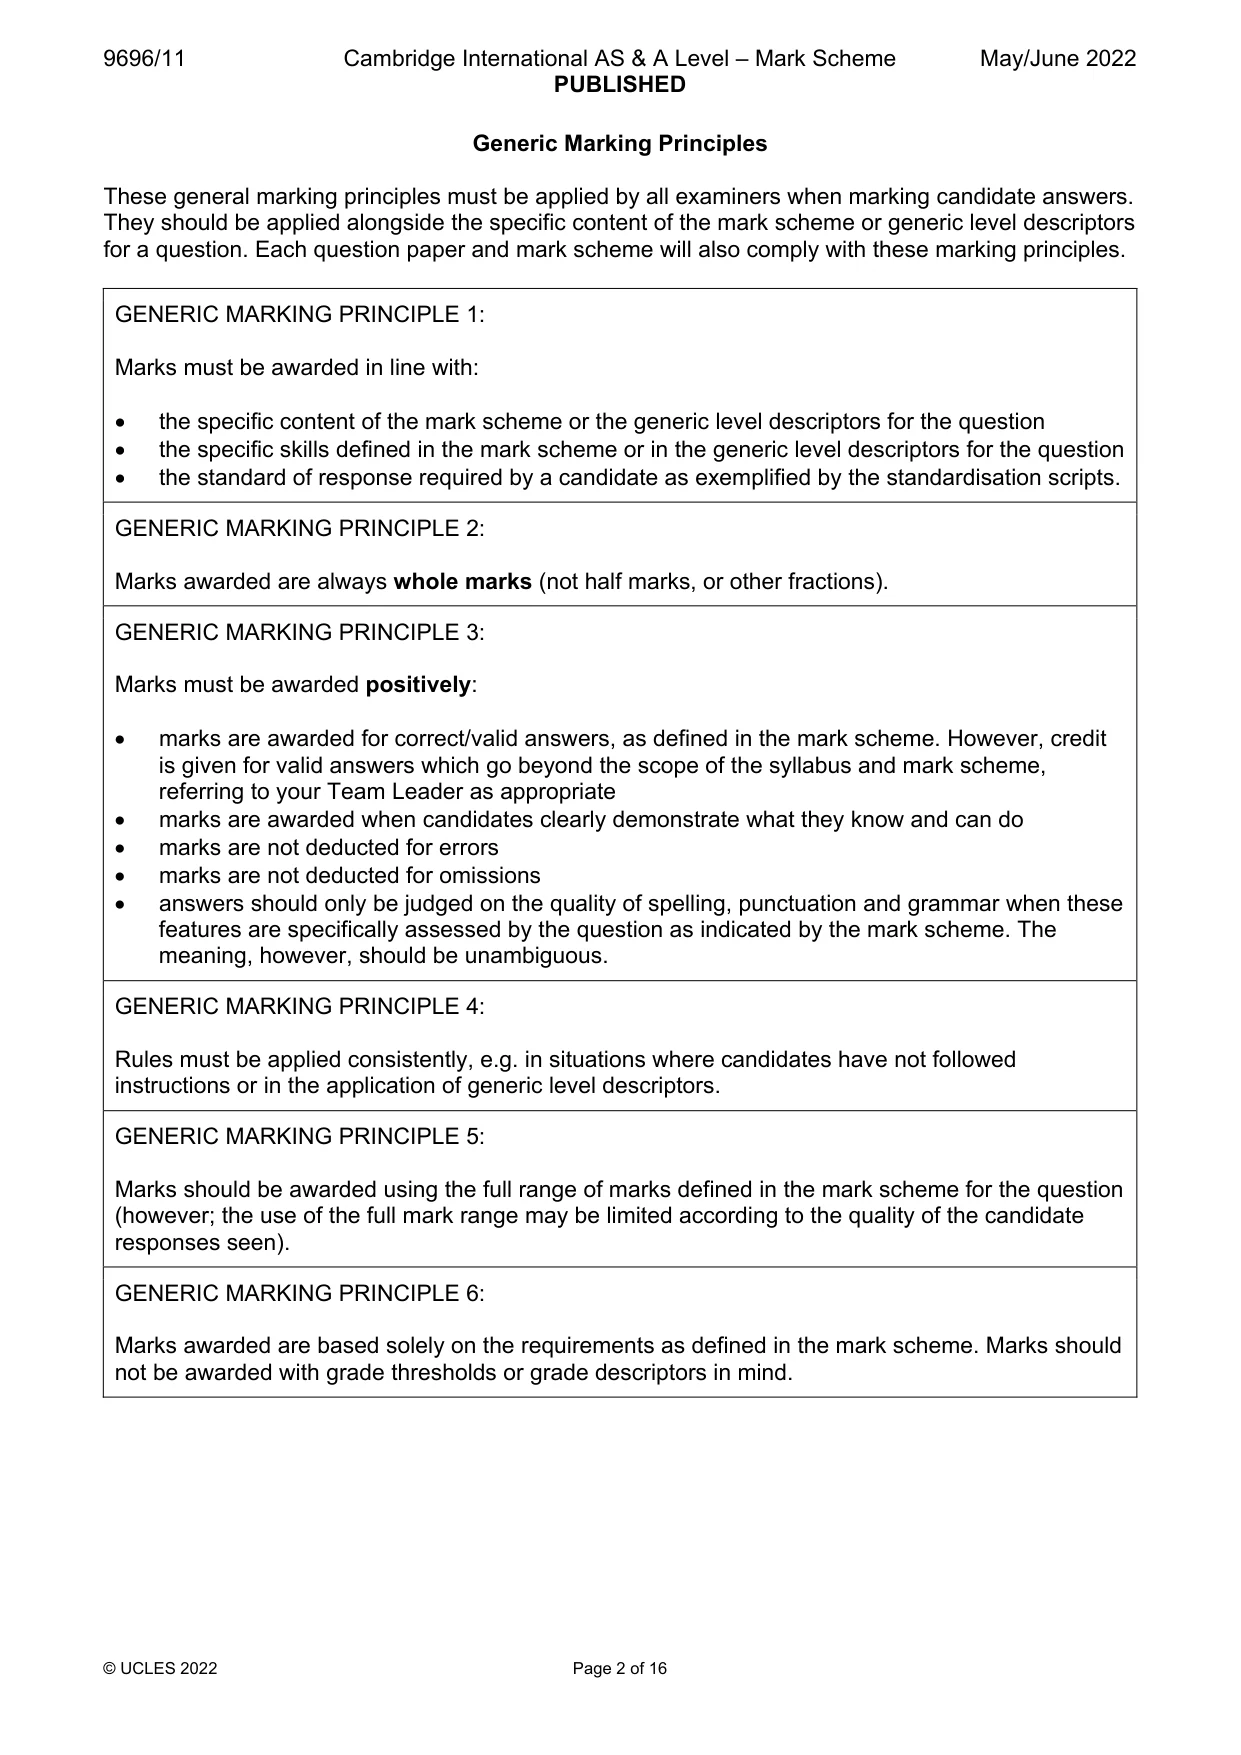
9696/11 Cambridge International AS & A Level – Mark Scheme PUBLISHED May/June 2022 © UCLES 2022 Page 2 of 16 Generic Marking Principles These general marking principles must be applied by all examiners when marking candidate answers. They should be applied alongside the specific content of the mark scheme or generic level descriptors for a question. Each question paper and mark scheme will also comply with these marking principles. GENERIC MARKING PRINCIPLE 1: Marks must be awarded in line with: the specific content of the mark scheme or the generic level descriptors for the question the specific skills defined in the mark scheme or in the generic level descriptors for the question the standard of response required by a candidate as exemplified by the standardisation scripts. GENERIC MARKING PRINCIPLE 2: Marks awarded are always whole marks (not half marks, or other fractions). GENERIC MARKING PRINCIPLE 3: Marks must be awarded positively: marks are awarded for correct/valid answers, as defined in the mark scheme. However, credit is given for valid answers which go beyond the scope of the syllabus and mark scheme, referring to your Team Leader as appropriate marks are awarded when candidates clearly demonstrate what they know and can do marks are not deducted for errors marks are not deducted for omissions answers should only be judged on the quality of spelling, punctuation and grammar when these features are specifically assessed by the question as indicated by the mark scheme. The meaning, however, should be unambiguous. GENERIC MARKING PRINCIPLE 4: Rules must be applied consistently, e.g. in situations where candidates have not followed instructions or in the application of generic level descriptors. GENERIC MARKING PRINCIPLE 5: Marks should be awarded using the full range of marks defined in the mark scheme for the question (however; the use of the full mark range may be limited according to the quality of the candidate responses seen). GENERIC MARKING PRINCIPLE 6: Marks awarded are based solely on the requirements as defined in the mark scheme. Marks should not be awarded with grade thresholds or grade descriptors in mind.
Mark scheme, page 3
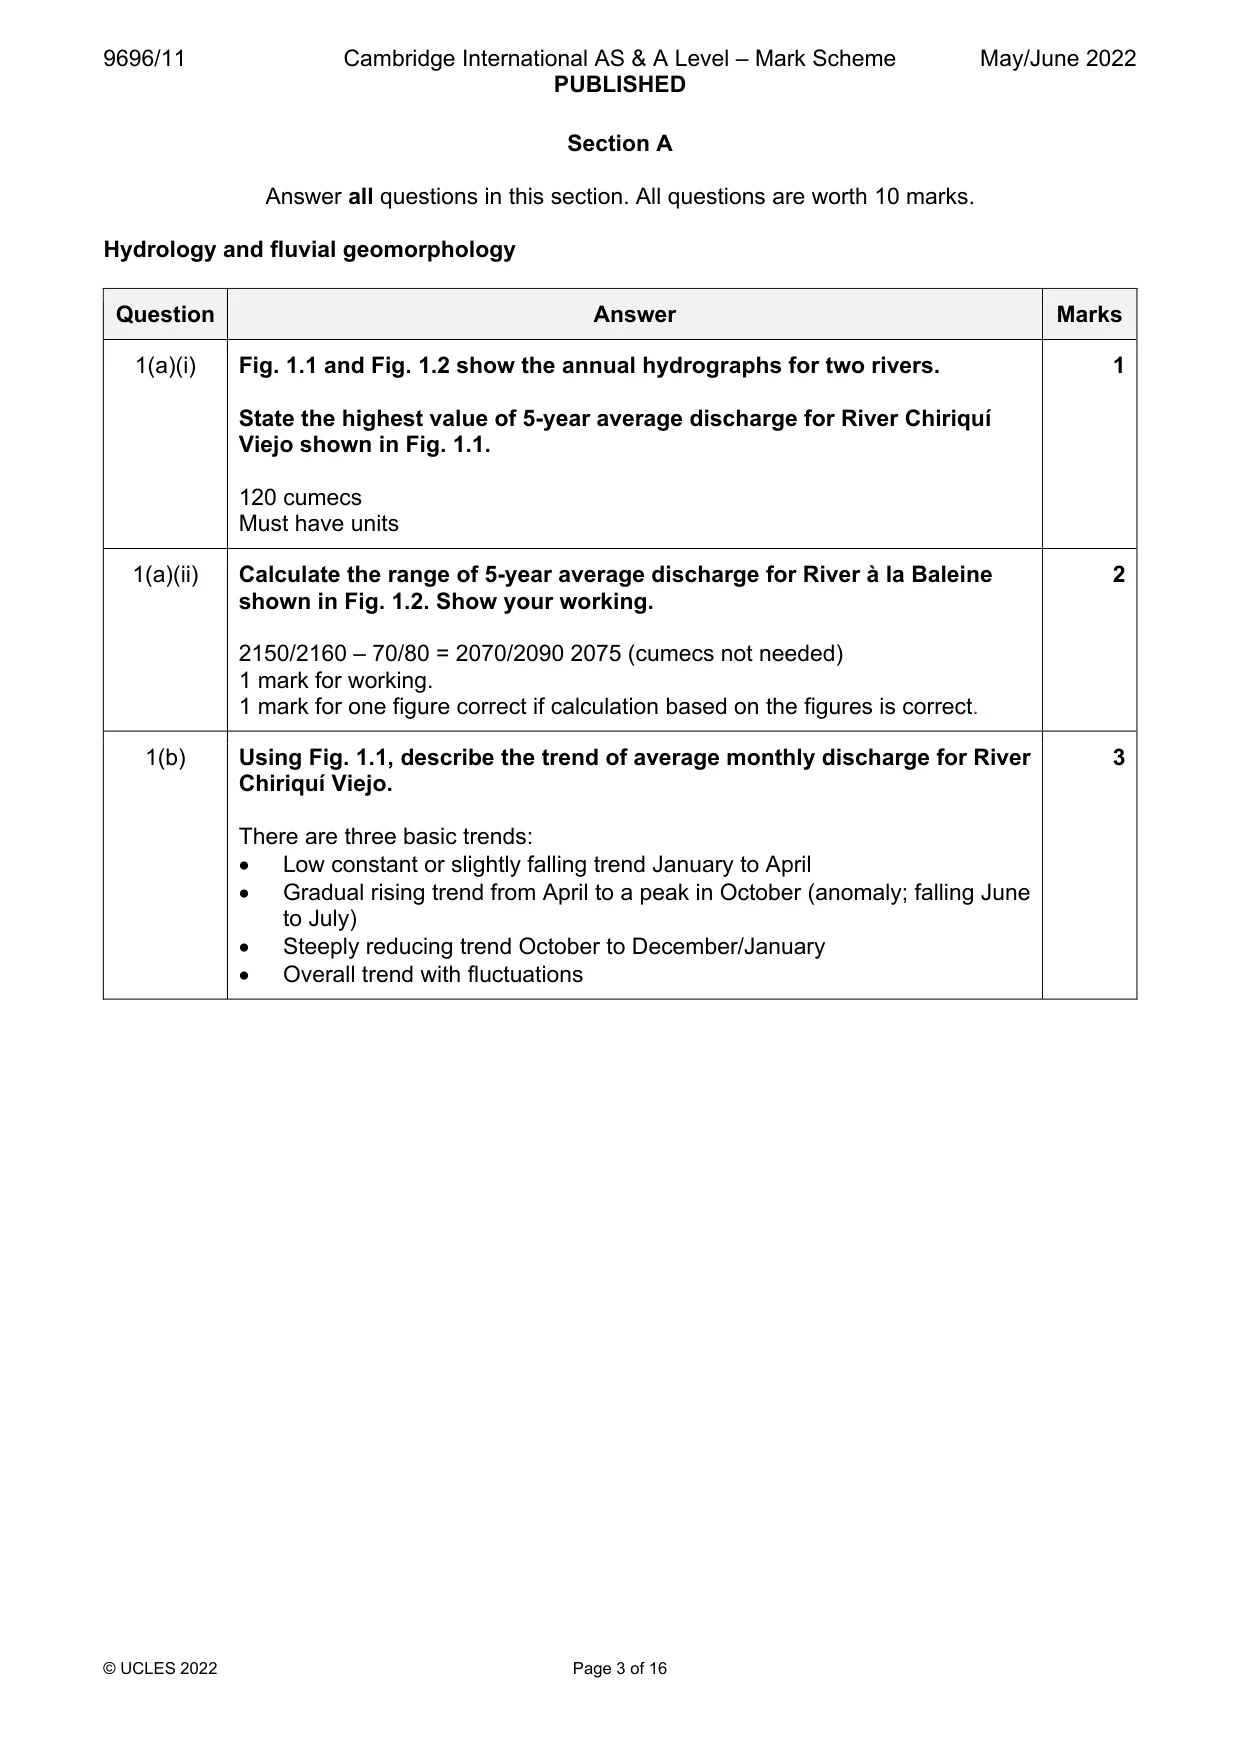
9696/11 Cambridge International AS & A Level – Mark Scheme PUBLISHED May/June 2022 © UCLES 2022 Page 3 of 16 Section A Answer all questions in this section. All questions are worth 10 marks. Hydrology and fluvial geomorphology Question Answer Marks 1(a)(i) Fig. 1.1 and Fig. 1.2 show the annual hydrographs for two rivers. State the highest value of 5-year average discharge for River Chiriquí Viejo shown in Fig. 1.1. 120 cumecs Must have units 1 1(a)(ii) Calculate the range of 5-year average discharge for River à la Baleine shown in Fig. 1.2. Show your working. 2150/2160 – 70/80 = 2070/2090 2075 (cumecs not needed) 1 mark for working. 1 mark for one figure correct if calculation based on the figures is correct. 2 1(b) Using Fig. 1.1, describe the trend of average monthly discharge for River Chiriquí Viejo. There are three basic trends: Low constant or slightly falling trend January to April Gradual rising trend from April to a peak in October (anomaly; falling June to July) Steeply reducing trend October to December/January Overall trend with fluctuations 3
Mark scheme, page 4
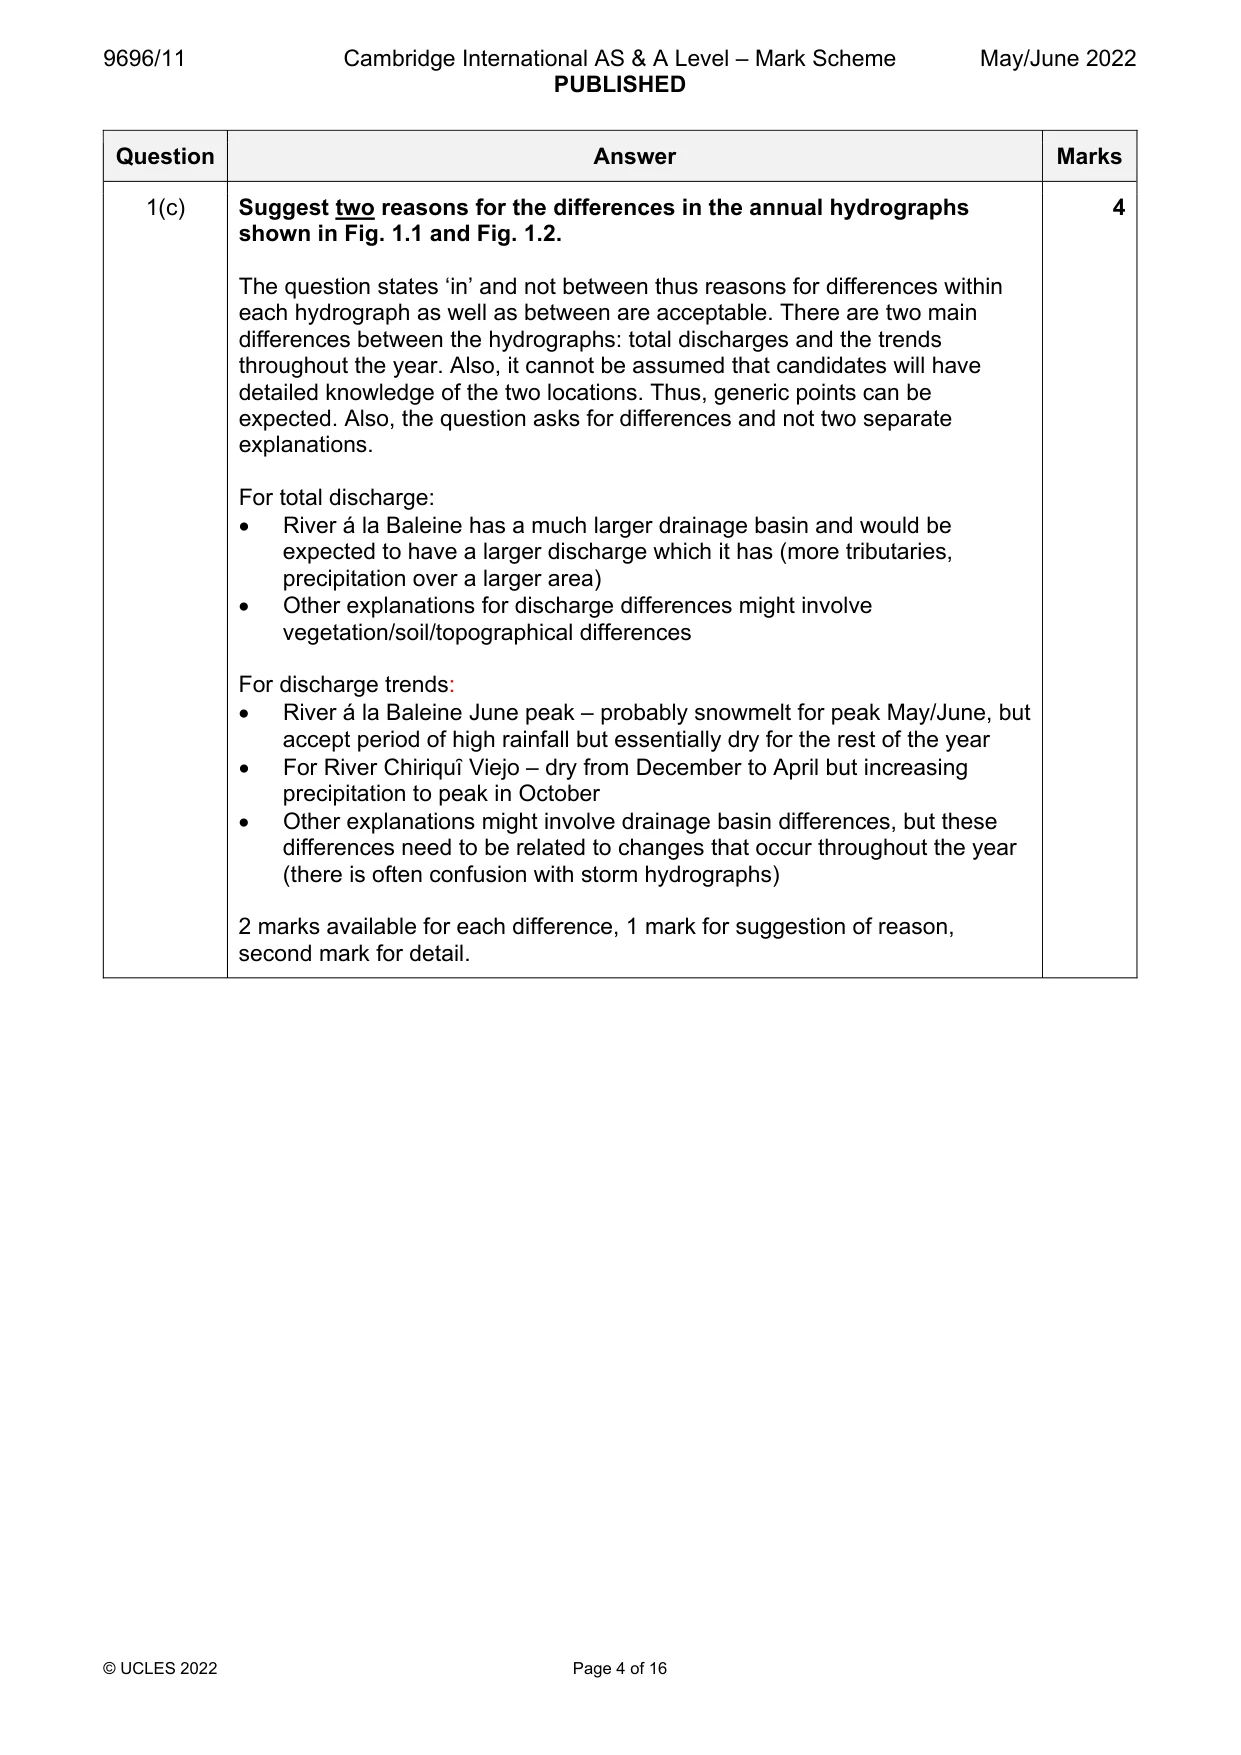
9696/11 Cambridge International AS & A Level – Mark Scheme PUBLISHED May/June 2022 © UCLES 2022 Page 4 of 16 Question Answer Marks 1(c) Suggest two reasons for the differences in the annual hydrographs shown in Fig. 1.1 and Fig. 1.2. The question states ‘in’ and not between thus reasons for differences within each hydrograph as well as between are acceptable. There are two main differences between the hydrographs: total discharges and the trends throughout the year. Also, it cannot be assumed that candidates will have detailed knowledge of the two locations. Thus, generic points can be expected. Also, the question asks for differences and not two separate explanations. For total discharge: River á la Baleine has a much larger drainage basin and would be expected to have a larger discharge which it has (more tributaries, precipitation over a larger area) Other explanations for discharge differences might involve vegetation/soil/topographical differences For discharge trends: River á la Baleine June peak – probably snowmelt for peak May/June, but accept period of high rainfall but essentially dry for the rest of the year For River Chiriquȋ Viejo – dry from December to April but increasing precipitation to peak in October Other explanations might involve drainage basin differences, but these differences need to be related to changes that occur throughout the year (there is often confusion with storm hydrographs) 2 marks available for each difference, 1 mark for suggestion of reason, second mark for detail. 4
Mark scheme, page 5
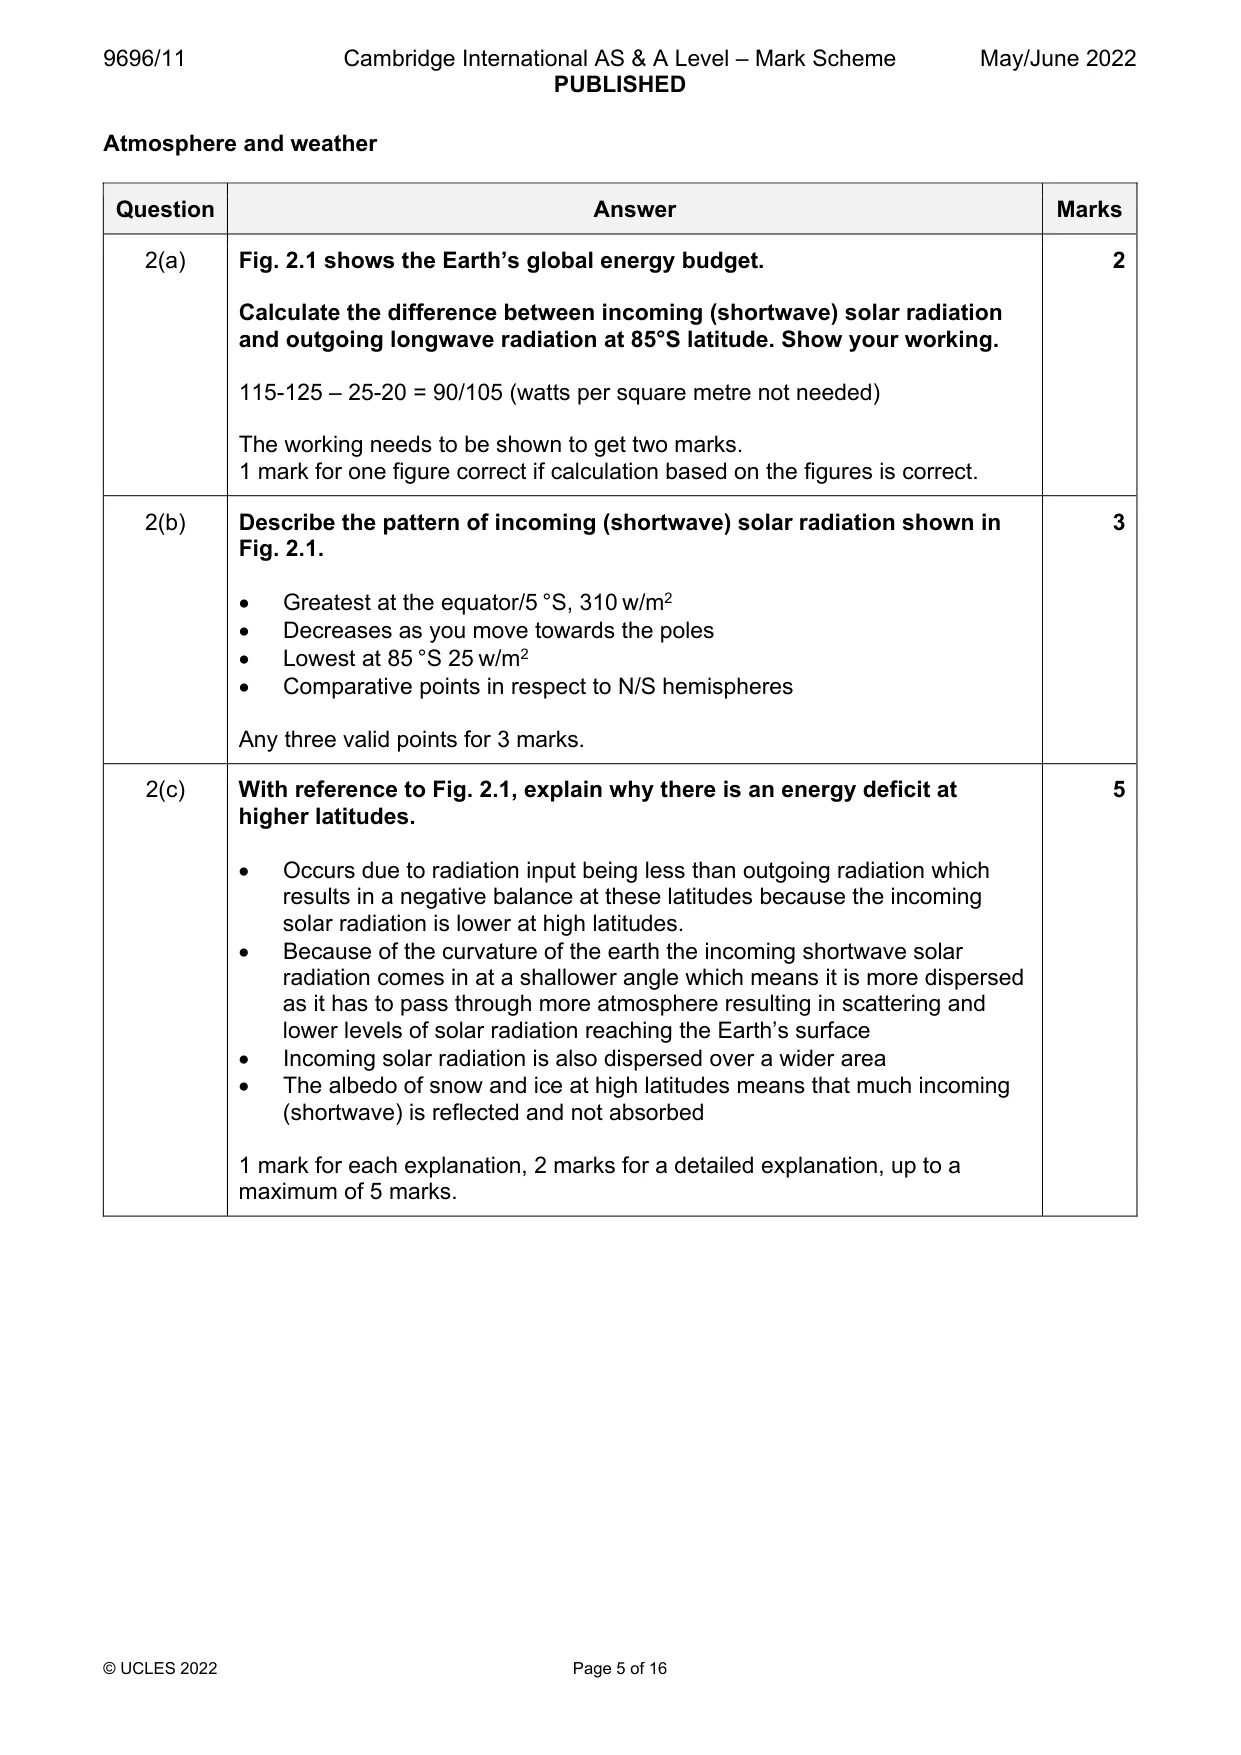
9696/11 Cambridge International AS & A Level – Mark Scheme PUBLISHED May/June 2022 © UCLES 2022 Page 5 of 16 Atmosphere and weather Question Answer Marks 2(a) Fig. 2.1 shows the Earth’s global energy budget. Calculate the difference between incoming (shortwave) solar radiation and outgoing longwave radiation at 85°S latitude. Show your working. 115-125 – 25-20 = 90/105 (watts per square metre not needed) The working needs to be shown to get two marks. 1 mark for one figure correct if calculation based on the figures is correct. 2 2(b) Describe the pattern of incoming (shortwave) solar radiation shown in Fig. 2.1. Greatest at the equator/5 °S, 310 w/m2 Decreases as you move towards the poles Lowest at 85 °S 25 w/m2 Comparative points in respect to N/S hemispheres Any three valid points for 3 marks. 3 2(c) With reference to Fig. 2.1, explain why there is an energy deficit at higher latitudes. Occurs due to radiation input being less than outgoing radiation which results in a negative balance at these latitudes because the incoming solar radiation is lower at high latitudes. Because of the curvature of the earth the incoming shortwave solar radiation comes in at a shallower angle which means it is more dispersed as it has to pass through more atmosphere resulting in scattering and lower levels of solar radiation reaching the Earth’s surface Incoming solar radiation is also dispersed over a wider area The albedo of snow and ice at high latitudes means that much incoming (shortwave) is reflected and not absorbed 1 mark for each explanation, 2 marks for a detailed explanation, up to a maximum of 5 marks. 5
Mark scheme, page 6
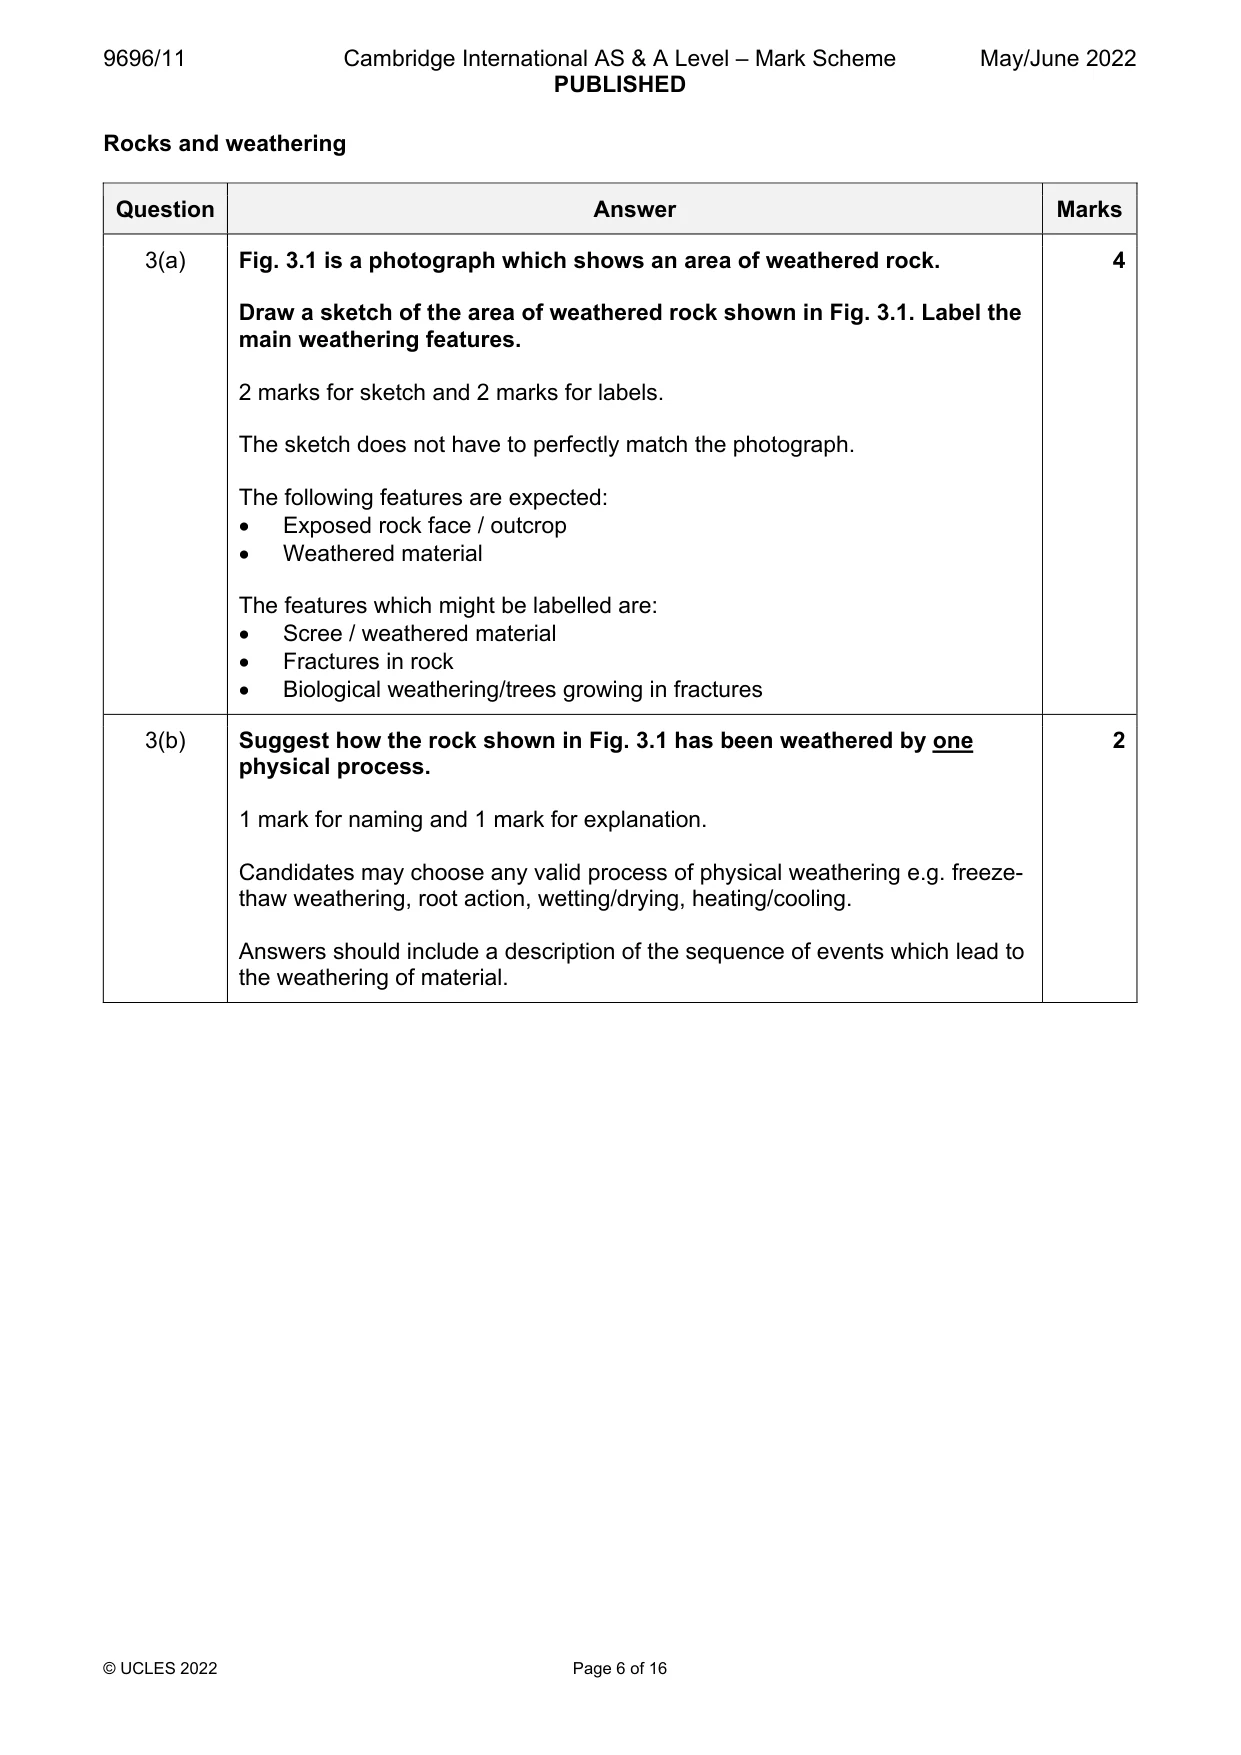
9696/11 Cambridge International AS & A Level – Mark Scheme PUBLISHED May/June 2022 © UCLES 2022 Page 6 of 16 Rocks and weathering Question Answer Marks 3(a) Fig. 3.1 is a photograph which shows an area of weathered rock. Draw a sketch of the area of weathered rock shown in Fig. 3.1. Label the main weathering features. 2 marks for sketch and 2 marks for labels. The sketch does not have to perfectly match the photograph. The following features are expected: Exposed rock face / outcrop Weathered material The features which might be labelled are: Scree / weathered material Fractures in rock Biological weathering/trees growing in fractures 4 3(b) Suggest how the rock shown in Fig. 3.1 has been weathered by one physical process. 1 mark for naming and 1 mark for explanation. Candidates may choose any valid process of physical weathering e.g. freeze- thaw weathering, root action, wetting/drying, heating/cooling. Answers should include a description of the sequence of events which lead to the weathering of material. 2
Mark scheme, page 7
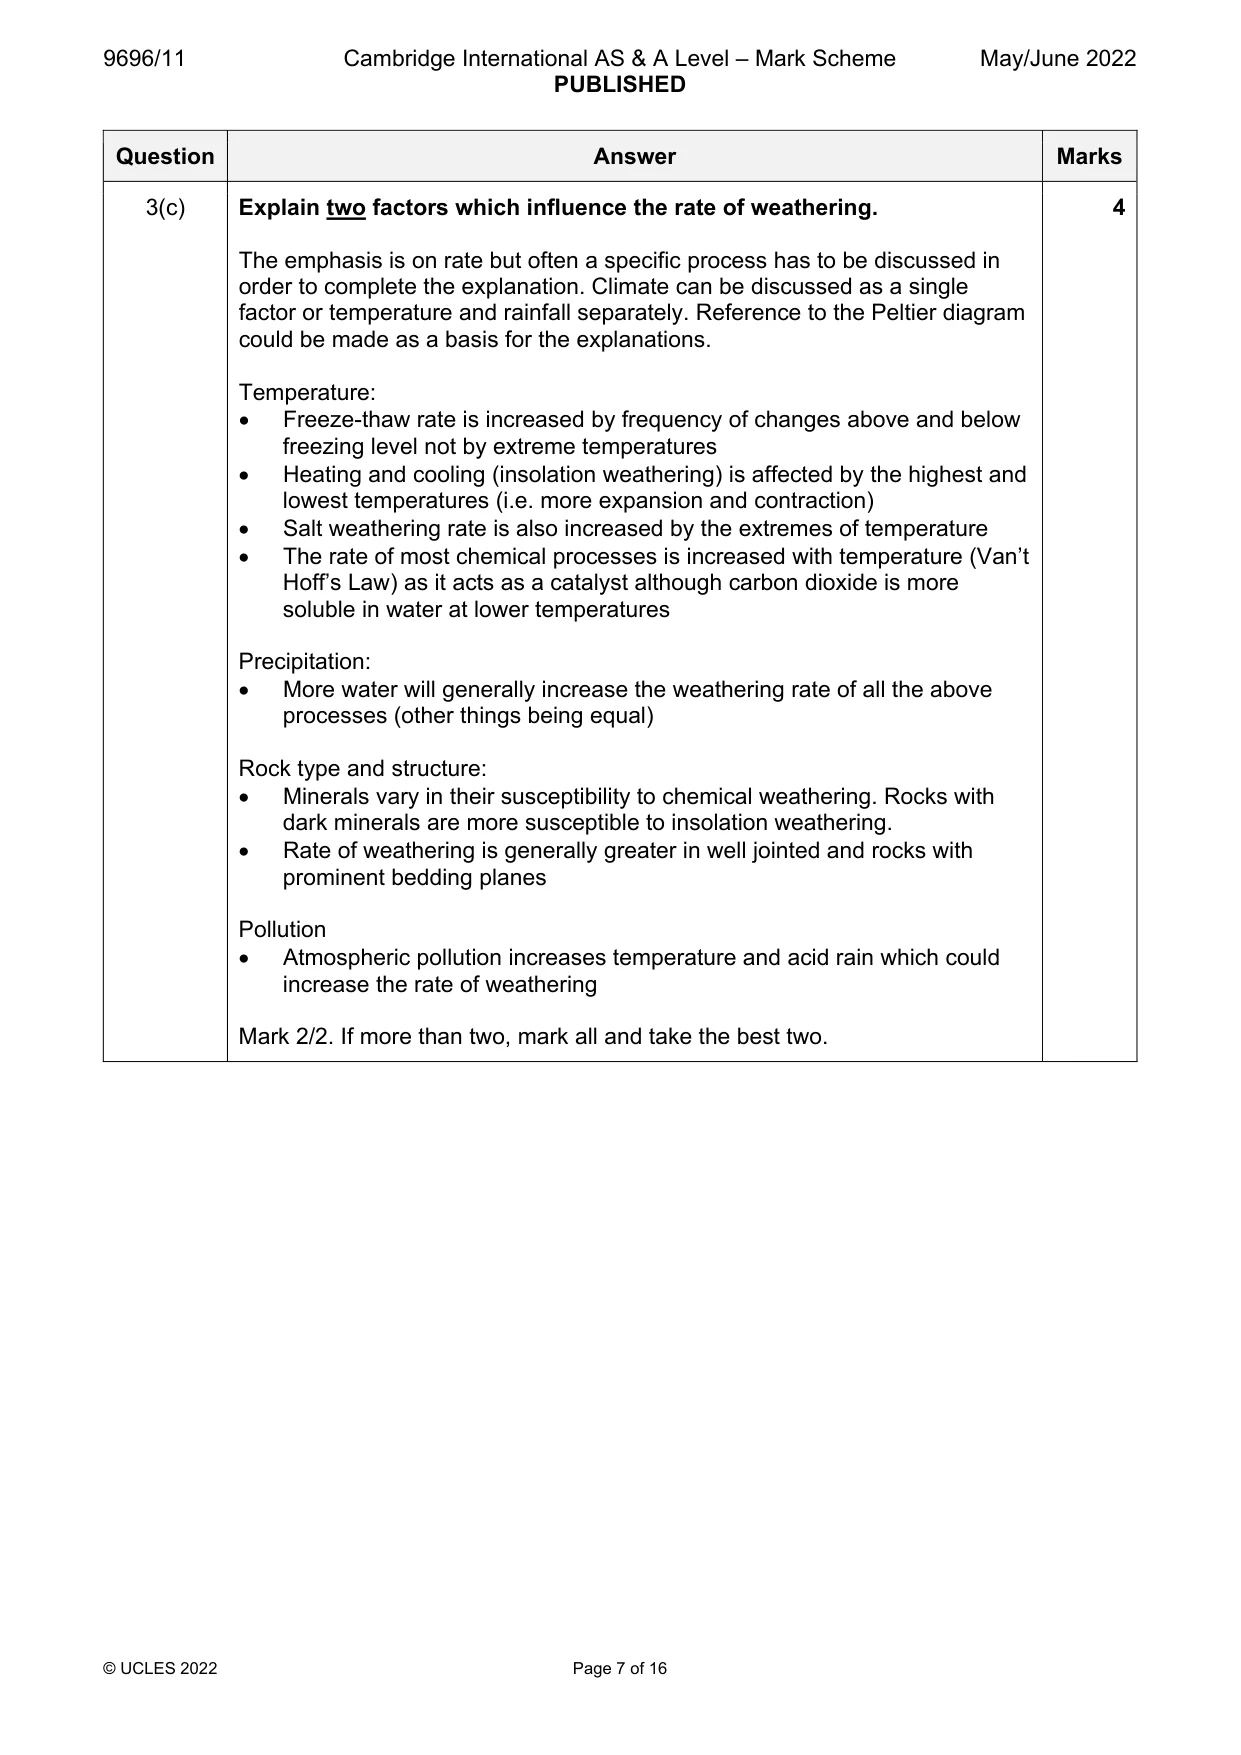
9696/11 Cambridge International AS & A Level – Mark Scheme PUBLISHED May/June 2022 © UCLES 2022 Page 7 of 16 Question Answer Marks 3(c) Explain two factors which influence the rate of weathering. The emphasis is on rate but often a specific process has to be discussed in order to complete the explanation. Climate can be discussed as a single factor or temperature and rainfall separately. Reference to the Peltier diagram could be made as a basis for the explanations. Temperature: Freeze-thaw rate is increased by frequency of changes above and below freezing level not by extreme temperatures Heating and cooling (insolation weathering) is affected by the highest and lowest temperatures (i.e. more expansion and contraction) Salt weathering rate is also increased by the extremes of temperature The rate of most chemical processes is increased with temperature (Van’t Hoff’s Law) as it acts as a catalyst although carbon dioxide is more soluble in water at lower temperatures Precipitation: More water will generally increase the weathering rate of all the above processes (other things being equal) Rock type and structure: Minerals vary in their susceptibility to chemical weathering. Rocks with dark minerals are more susceptible to insolation weathering. Rate of weathering is generally greater in well jointed and rocks with prominent bedding planes Pollution Atmospheric pollution increases temperature and acid rain which could increase the rate of weathering Mark 2/2. If more than two, mark all and take the best two. 4
Mark scheme, page 8
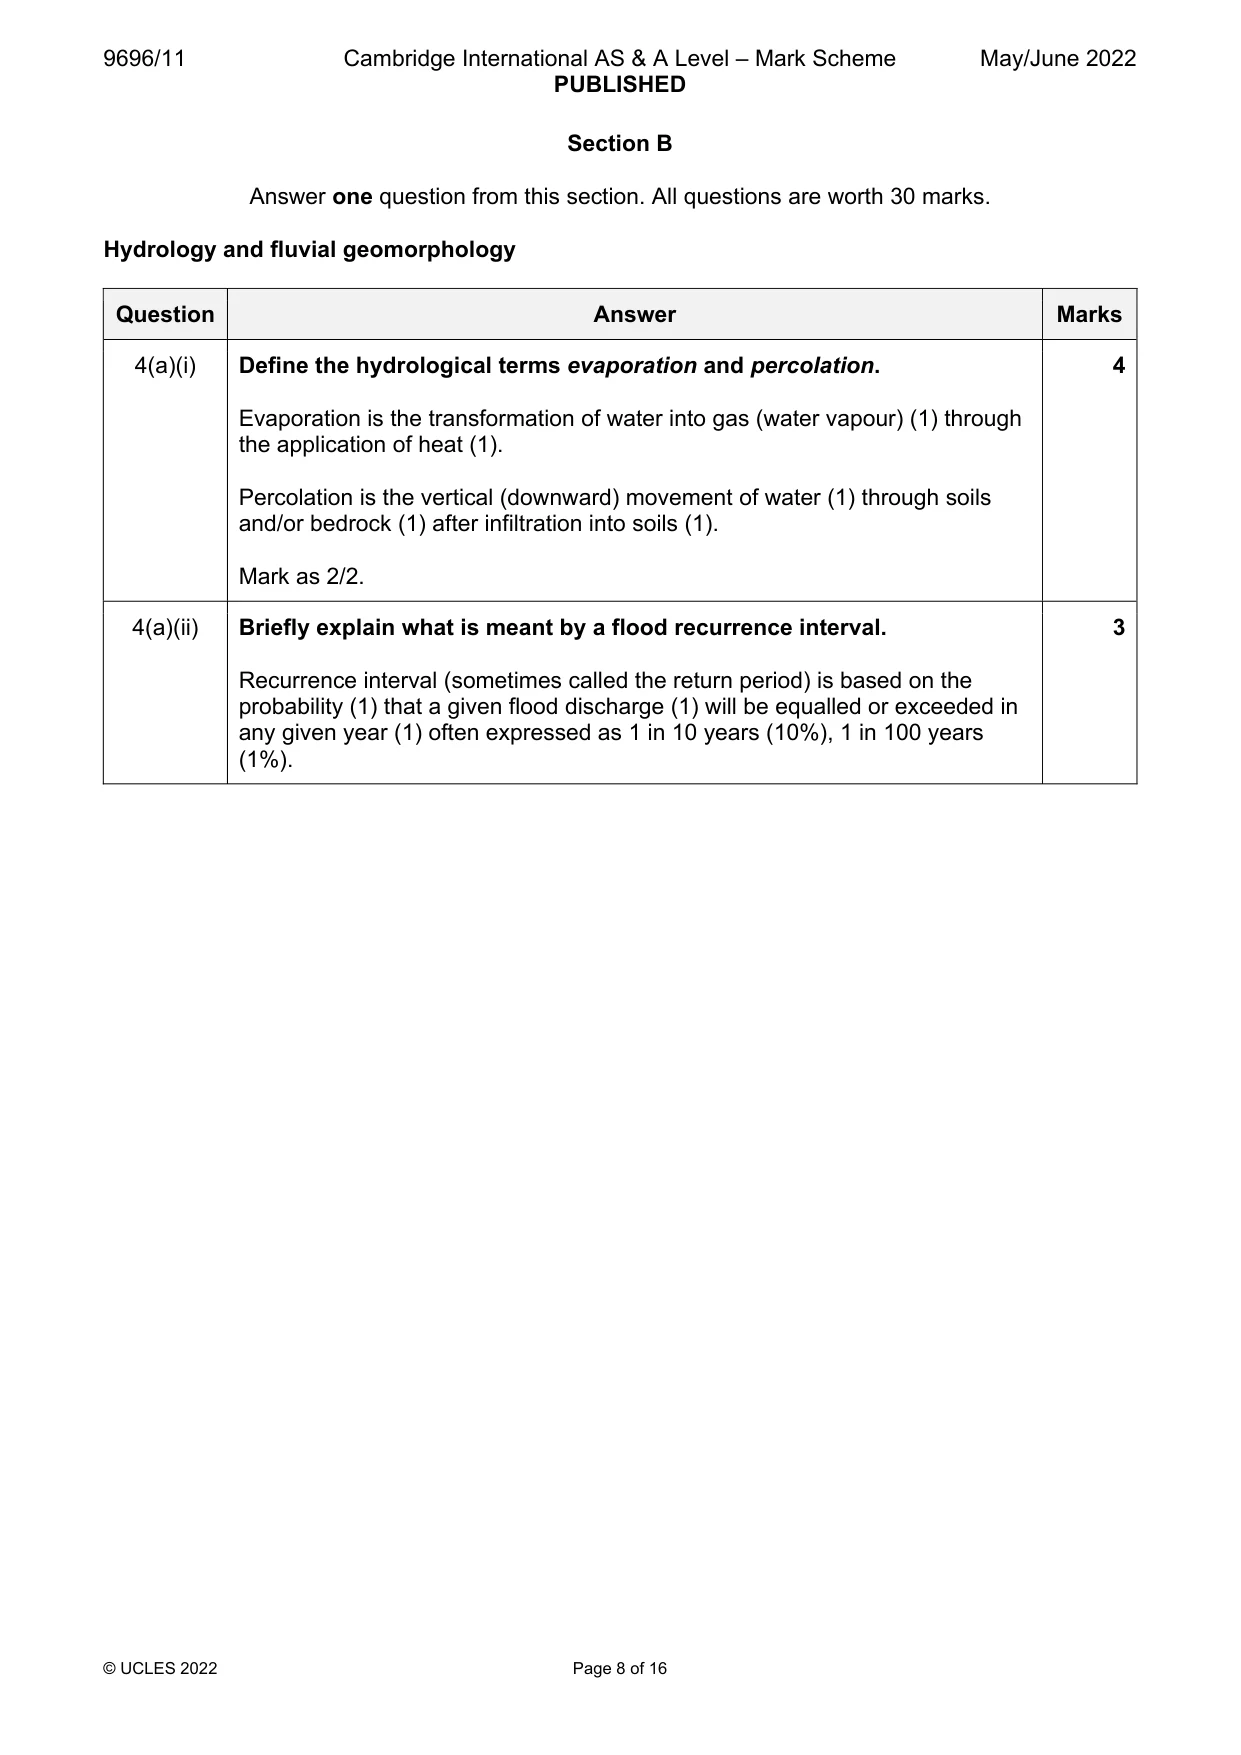
9696/11 Cambridge International AS & A Level – Mark Scheme PUBLISHED May/June 2022 © UCLES 2022 Page 8 of 16 Section B Answer one question from this section. All questions are worth 30 marks. Hydrology and fluvial geomorphology Question Answer Marks 4(a)(i) Define the hydrological terms evaporation and percolation. Evaporation is the transformation of water into gas (water vapour) (1) through the application of heat (1). Percolation is the vertical (downward) movement of water (1) through soils and/or bedrock (1) after infiltration into soils (1). Mark as 2/2. 4 4(a)(ii) Briefly explain what is meant by a flood recurrence interval. Recurrence interval (sometimes called the return period) is based on the probability (1) that a given flood discharge (1) will be equalled or exceeded in any given year (1) often expressed as 1 in 10 years (10%), 1 in 100 years (1%). 3
Mark scheme, page 9
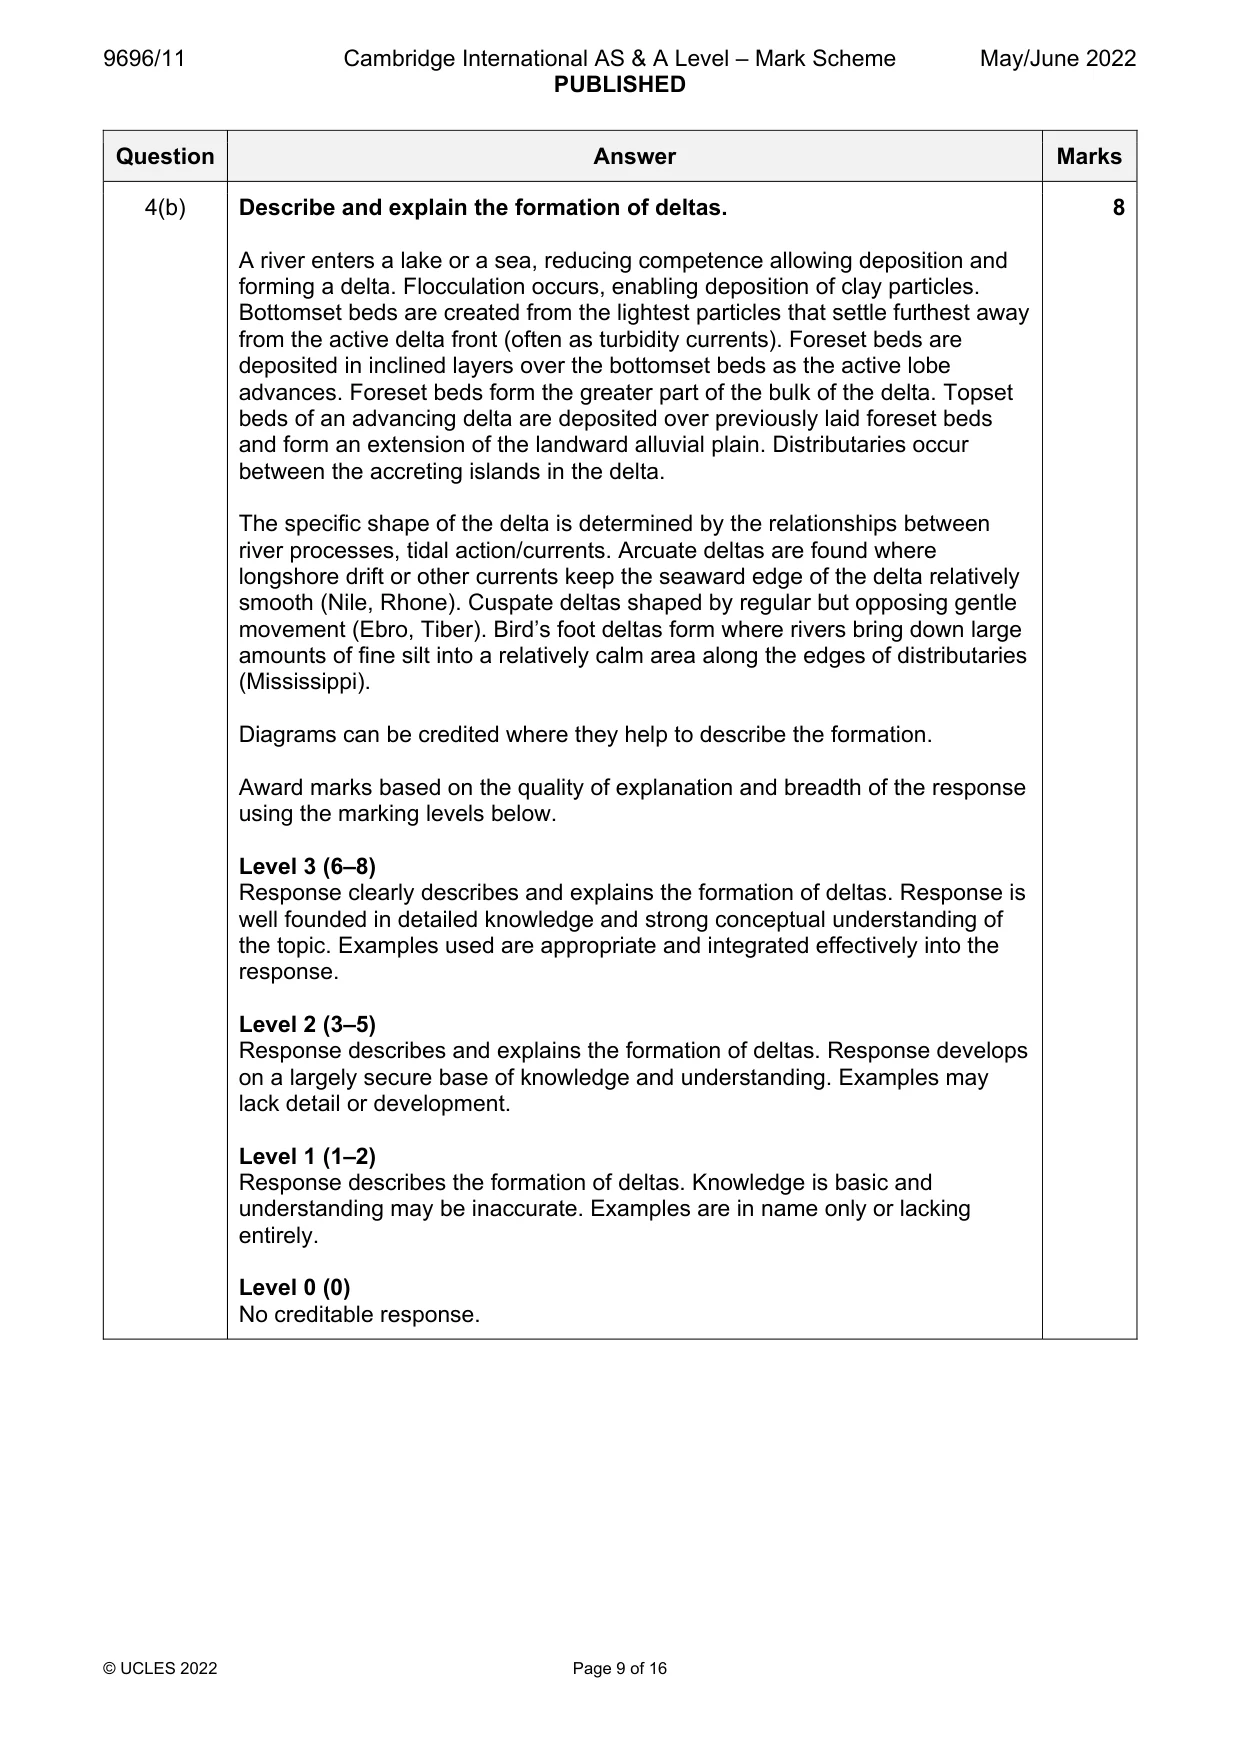
9696/11 Cambridge International AS & A Level – Mark Scheme PUBLISHED May/June 2022 © UCLES 2022 Page 9 of 16 Question Answer Marks 4(b) Describe and explain the formation of deltas. A river enters a lake or a sea, reducing competence allowing deposition and forming a delta. Flocculation occurs, enabling deposition of clay particles. Bottomset beds are created from the lightest particles that settle furthest away from the active delta front (often as turbidity currents). Foreset beds are deposited in inclined layers over the bottomset beds as the active lobe advances. Foreset beds form the greater part of the bulk of the delta. Topset beds of an advancing delta are deposited over previously laid foreset beds and form an extension of the landward alluvial plain. Distributaries occur between the accreting islands in the delta. The specific shape of the delta is determined by the relationships between river processes, tidal action/currents. Arcuate deltas are found where longshore drift or other currents keep the seaward edge of the delta relatively smooth (Nile, Rhone). Cuspate deltas shaped by regular but opposing gentle movement (Ebro, Tiber). Bird’s foot deltas form where rivers bring down large amounts of fine silt into a relatively calm area along the edges of distributaries (Mississippi). Diagrams can be credited where they help to describe the formation. Award marks based on the quality of explanation and breadth of the response using the marking levels below. Level 3 (6–8) Response clearly describes and explains the formation of deltas. Response is well founded in detailed knowledge and strong conceptual understanding of the topic. Examples used are appropriate and integrated effectively into the response. Level 2 (3–5) Response describes and explains the formation of deltas. Response develops on a largely secure base of knowledge and understanding. Examples may lack detail or development. Level 1 (1–2) Response describes the formation of deltas. Knowledge is basic and understanding may be inaccurate. Examples are in name only or lacking entirely. Level 0 (0) No creditable response. 8
Mark scheme, page 10
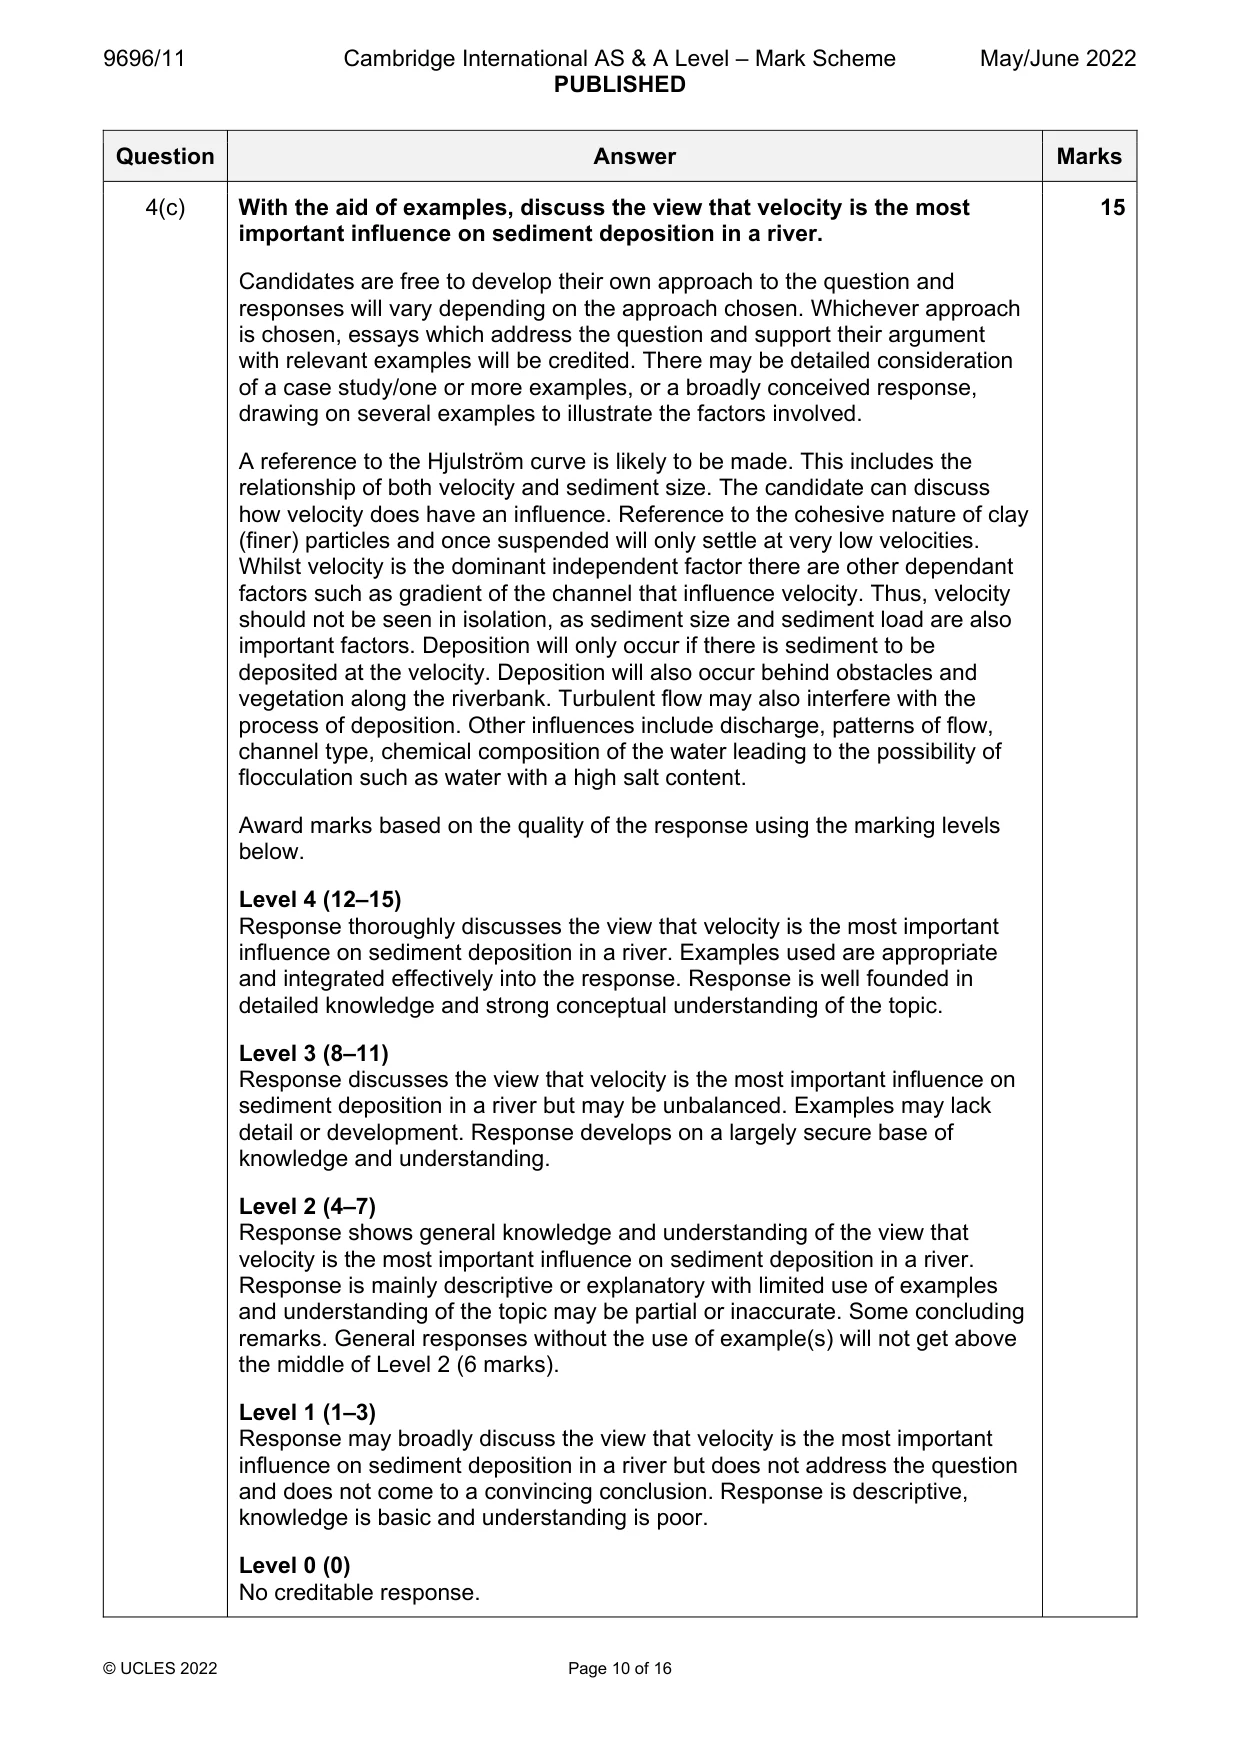
9696/11 Cambridge International AS & A Level – Mark Scheme PUBLISHED May/June 2022 © UCLES 2022 Page 10 of 16 Question Answer Marks 4(c) With the aid of examples, discuss the view that velocity is the most important influence on sediment deposition in a river. Candidates are free to develop their own approach to the question and responses will vary depending on the approach chosen. Whichever approach is chosen, essays which address the question and support their argument with relevant examples will be credited. There may be detailed consideration of a case study/one or more examples, or a broadly conceived response, drawing on several examples to illustrate the factors involved. A reference to the Hjulström curve is likely to be made. This includes the relationship of both velocity and sediment size. The candidate can discuss how velocity does have an influence. Reference to the cohesive nature of clay (finer) particles and once suspended will only settle at very low velocities. Whilst velocity is the dominant independent factor there are other dependant factors such as gradient of the channel that influence velocity. Thus, velocity should not be seen in isolation, as sediment size and sediment load are also important factors. Deposition will only occur if there is sediment to be deposited at the velocity. Deposition will also occur behind obstacles and vegetation along the riverbank. Turbulent flow may also interfere with the process of deposition. Other influences include discharge, patterns of flow, channel type, chemical composition of the water leading to the possibility of flocculation such as water with a high salt content. Award marks based on the quality of the response using the marking levels below. Level 4 (12–15) Response thoroughly discusses the view that velocity is the most important influence on sediment deposition in a river. Examples used are appropriate and integrated effectively into the response. Response is well founded in detailed knowledge and strong conceptual understanding of the topic. Level 3 (8–11) Response discusses the view that velocity is the most important influence on sediment deposition in a river but may be unbalanced. Examples may lack detail or development. Response develops on a largely secure base of knowledge and understanding. Level 2 (4–7) Response shows general knowledge and understanding of the view that velocity is the most important influence on sediment deposition in a river. Response is mainly descriptive or explanatory with limited use of examples and understanding of the topic may be partial or inaccurate. Some concluding remarks. General responses without the use of example(s) will not get above the middle of Level 2 (6 marks). Level 1 (1–3) Response may broadly discuss the view that velocity is the most important influence on sediment deposition in a river but does not address the question and does not come to a convincing conclusion. Response is descriptive, knowledge is basic and understanding is poor. Level 0 (0) No creditable response. 15
Mark scheme, page 11
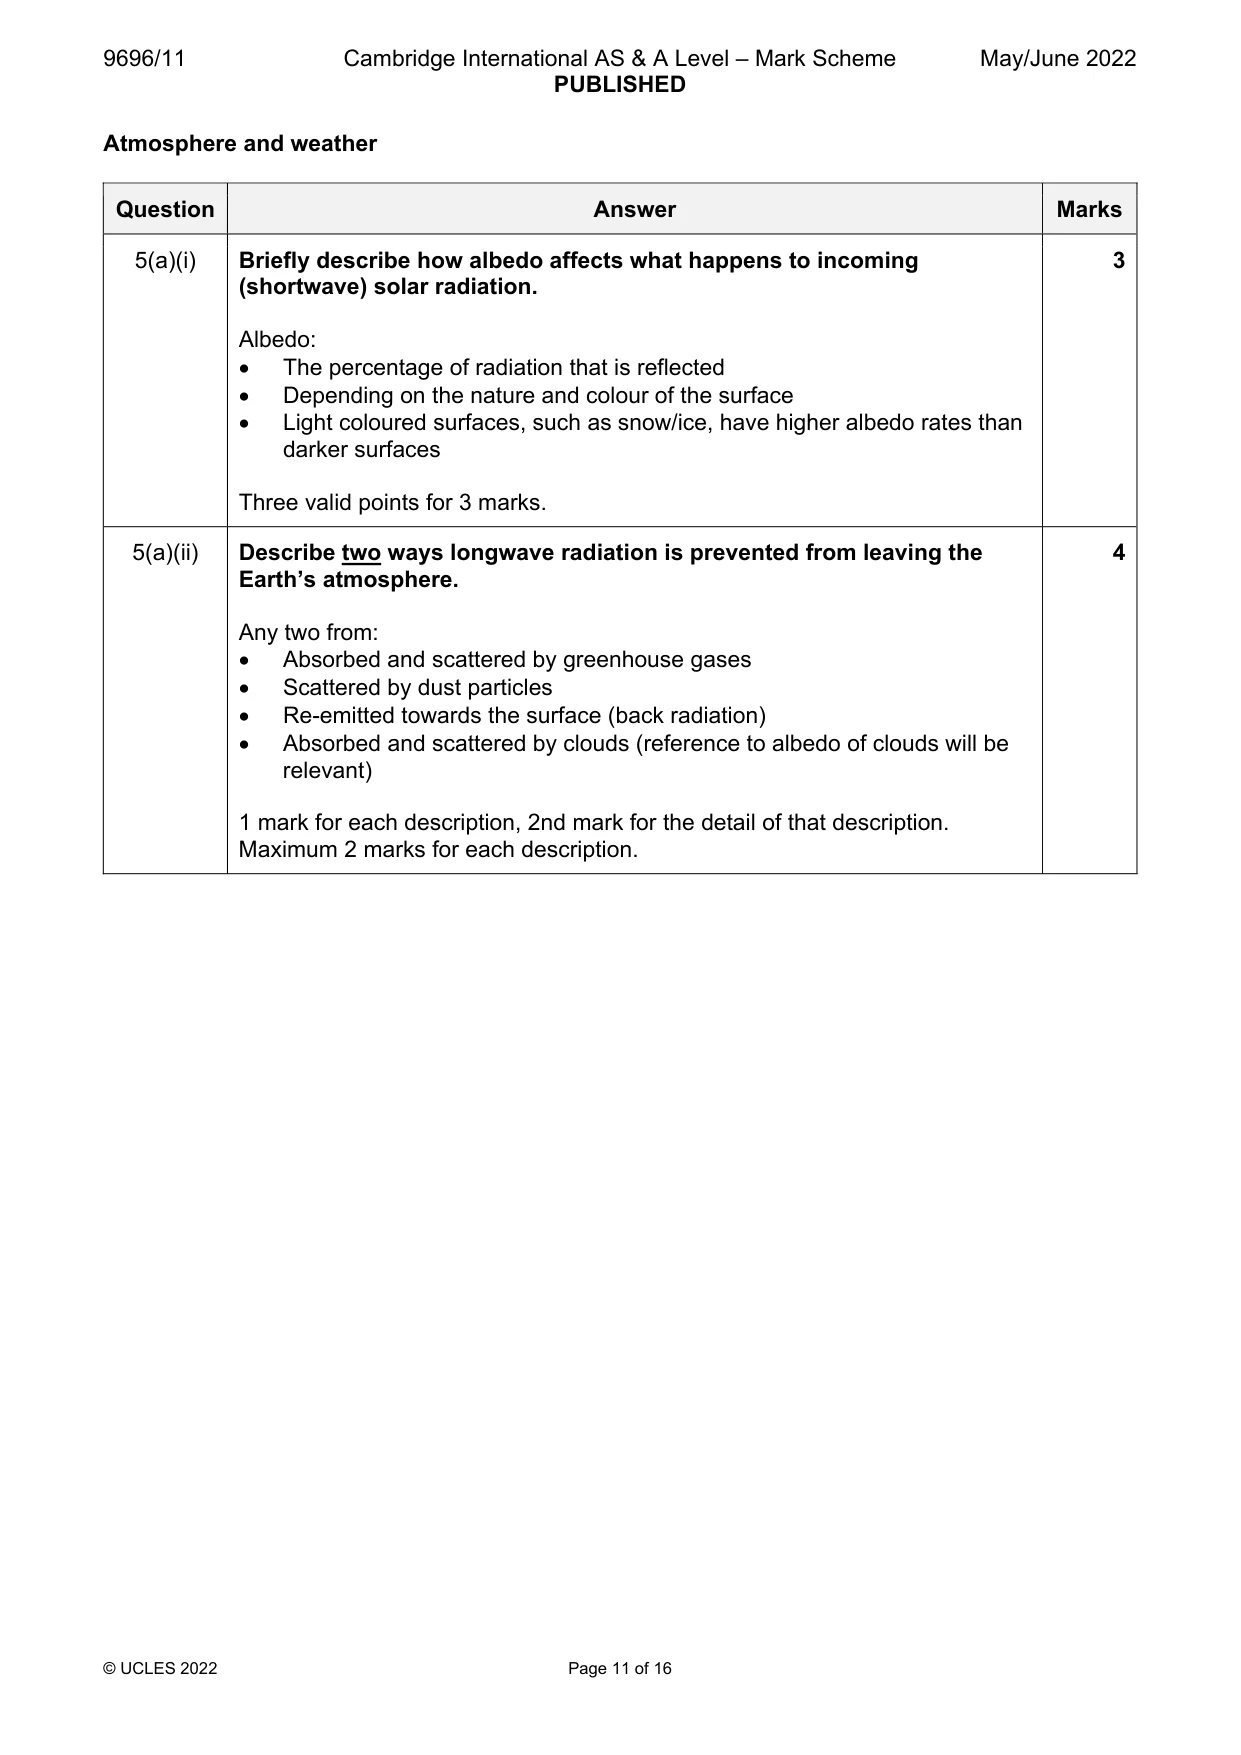
9696/11 Cambridge International AS & A Level – Mark Scheme PUBLISHED May/June 2022 © UCLES 2022 Page 11 of 16 Atmosphere and weather Question Answer Marks 5(a)(i) Briefly describe how albedo affects what happens to incoming (shortwave) solar radiation. Albedo: The percentage of radiation that is reflected Depending on the nature and colour of the surface Light coloured surfaces, such as snow/ice, have higher albedo rates than darker surfaces Three valid points for 3 marks. 3 5(a)(ii) Describe two ways longwave radiation is prevented from leaving the Earth’s atmosphere. Any two from: Absorbed and scattered by greenhouse gases Scattered by dust particles Re-emitted towards the surface (back radiation) Absorbed and scattered by clouds (reference to albedo of clouds will be relevant) 1 mark for each description, 2nd mark for the detail of that description. Maximum 2 marks for each description. 4
Mark scheme, page 12
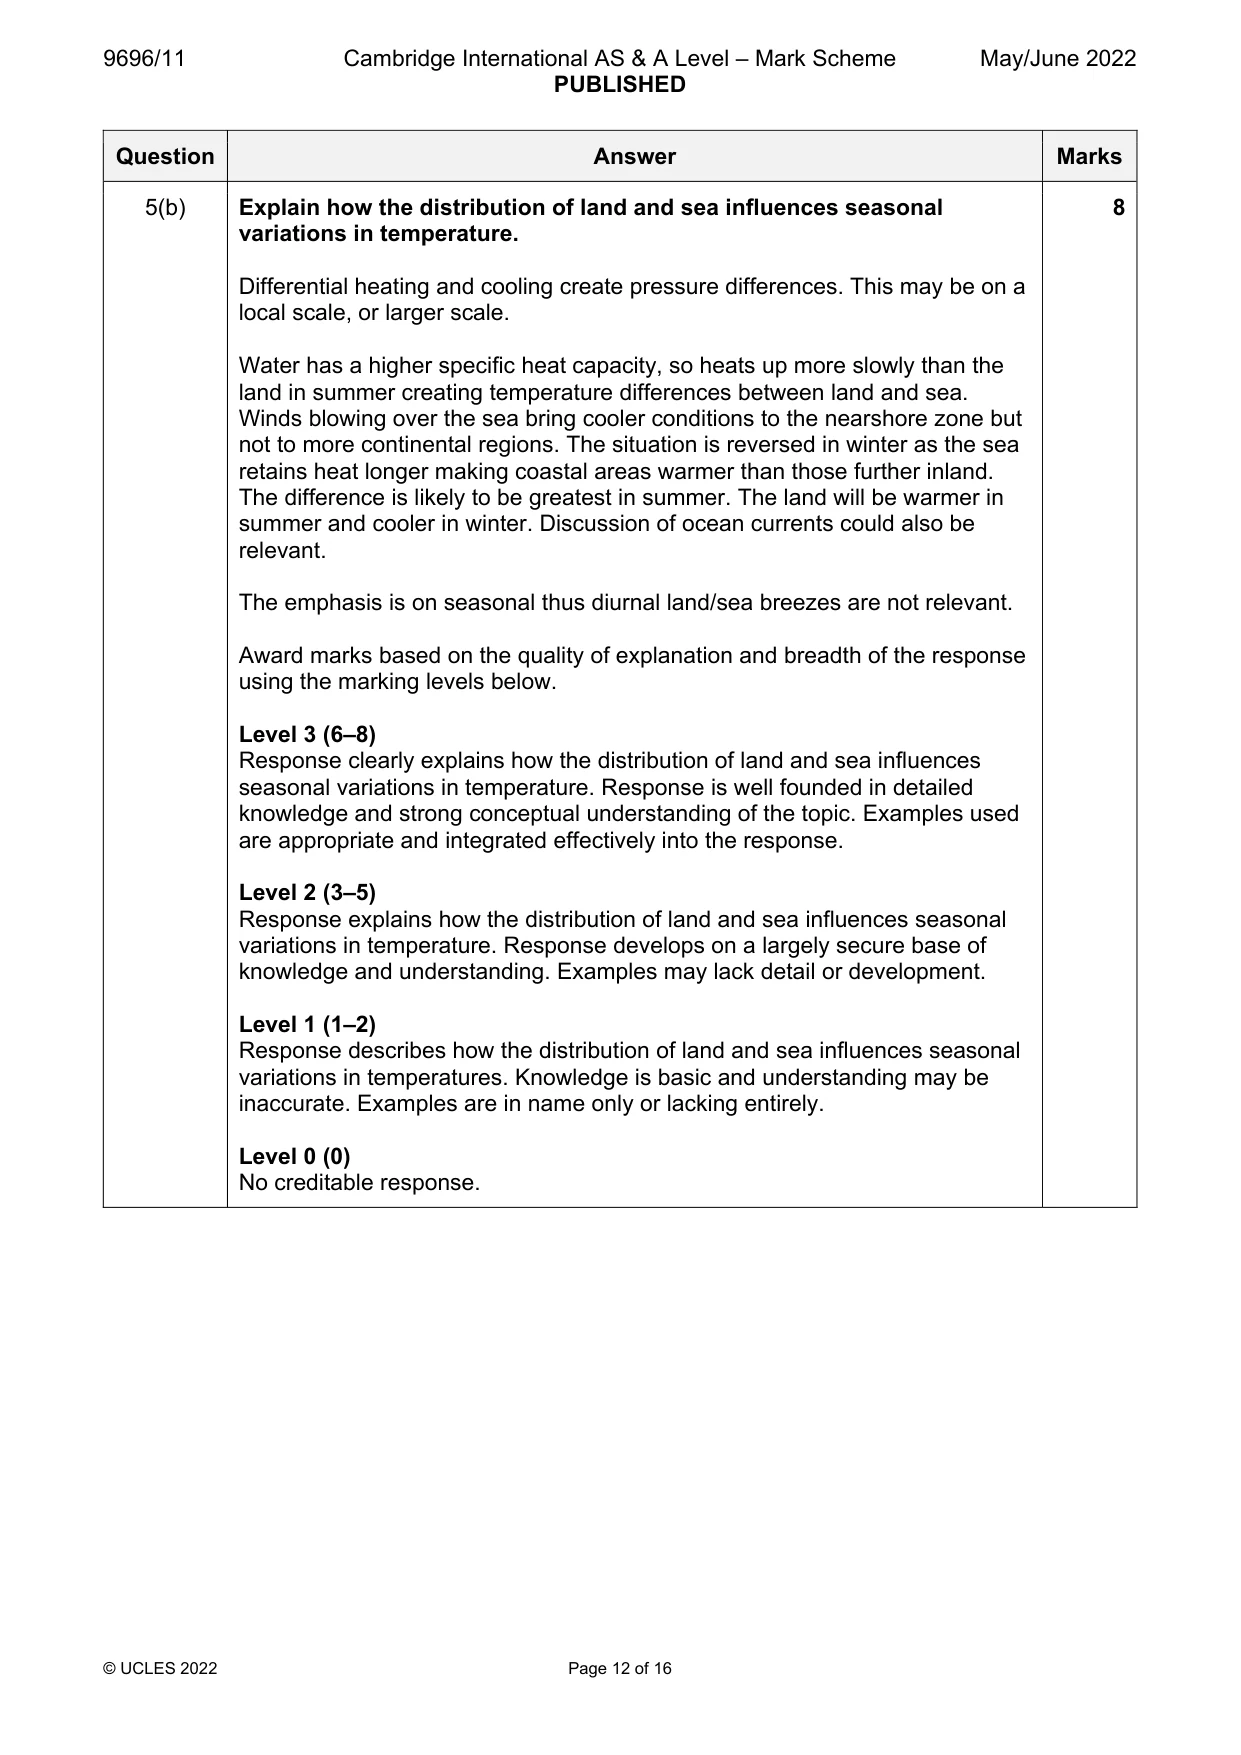
9696/11 Cambridge International AS & A Level – Mark Scheme PUBLISHED May/June 2022 © UCLES 2022 Page 12 of 16 Question Answer Marks 5(b) Explain how the distribution of land and sea influences seasonal variations in temperature. Differential heating and cooling create pressure differences. This may be on a local scale, or larger scale. Water has a higher specific heat capacity, so heats up more slowly than the land in summer creating temperature differences between land and sea. Winds blowing over the sea bring cooler conditions to the nearshore zone but not to more continental regions. The situation is reversed in winter as the sea retains heat longer making coastal areas warmer than those further inland. The difference is likely to be greatest in summer. The land will be warmer in summer and cooler in winter. Discussion of ocean currents could also be relevant. The emphasis is on seasonal thus diurnal land/sea breezes are not relevant. Award marks based on the quality of explanation and breadth of the response using the marking levels below. Level 3 (6–8) Response clearly explains how the distribution of land and sea influences seasonal variations in temperature. Response is well founded in detailed knowledge and strong conceptual understanding of the topic. Examples used are appropriate and integrated effectively into the response. Level 2 (3–5) Response explains how the distribution of land and sea influences seasonal variations in temperature. Response develops on a largely secure base of knowledge and understanding. Examples may lack detail or development. Level 1 (1–2) Response describes how the distribution of land and sea influences seasonal variations in temperatures. Knowledge is basic and understanding may be inaccurate. Examples are in name only or lacking entirely. Level 0 (0) No creditable response. 8
Mark scheme, page 13
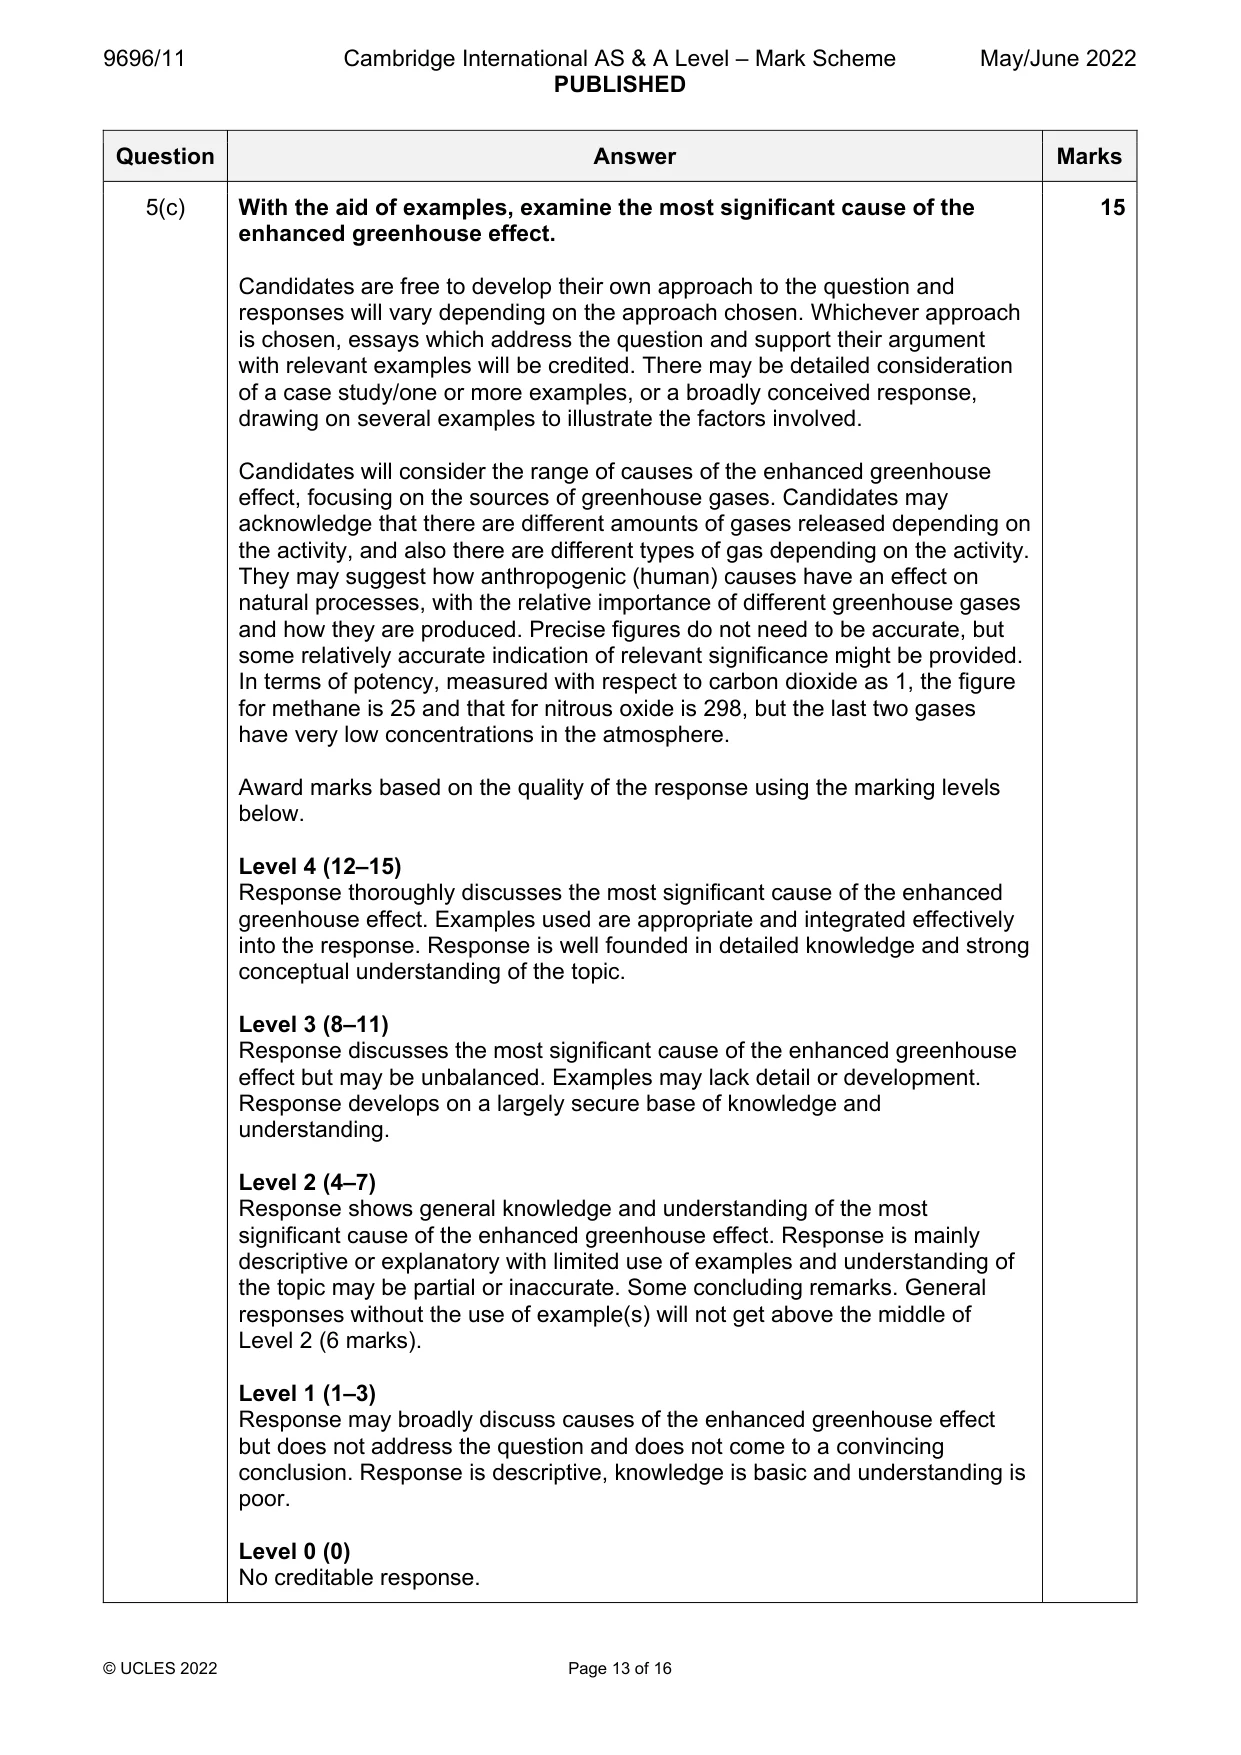
9696/11 Cambridge International AS & A Level – Mark Scheme PUBLISHED May/June 2022 © UCLES 2022 Page 13 of 16 Question Answer Marks 5(c) With the aid of examples, examine the most significant cause of the enhanced greenhouse effect. Candidates are free to develop their own approach to the question and responses will vary depending on the approach chosen. Whichever approach is chosen, essays which address the question and support their argument with relevant examples will be credited. There may be detailed consideration of a case study/one or more examples, or a broadly conceived response, drawing on several examples to illustrate the factors involved. Candidates will consider the range of causes of the enhanced greenhouse effect, focusing on the sources of greenhouse gases. Candidates may acknowledge that there are different amounts of gases released depending on the activity, and also there are different types of gas depending on the activity. They may suggest how anthropogenic (human) causes have an effect on natural processes, with the relative importance of different greenhouse gases and how they are produced. Precise figures do not need to be accurate, but some relatively accurate indication of relevant significance might be provided. In terms of potency, measured with respect to carbon dioxide as 1, the figure for methane is 25 and that for nitrous oxide is 298, but the last two gases have very low concentrations in the atmosphere. Award marks based on the quality of the response using the marking levels below. Level 4 (12–15) Response thoroughly discusses the most significant cause of the enhanced greenhouse effect. Examples used are appropriate and integrated effectively into the response. Response is well founded in detailed knowledge and strong conceptual understanding of the topic. Level 3 (8–11) Response discusses the most significant cause of the enhanced greenhouse effect but may be unbalanced. Examples may lack detail or development. Response develops on a largely secure base of knowledge and understanding. Level 2 (4–7) Response shows general knowledge and understanding of the most significant cause of the enhanced greenhouse effect. Response is mainly descriptive or explanatory with limited use of examples and understanding of the topic may be partial or inaccurate. Some concluding remarks. General responses without the use of example(s) will not get above the middle of Level 2 (6 marks). Level 1 (1–3) Response may broadly discuss causes of the enhanced greenhouse effect but does not address the question and does not come to a convincing conclusion. Response is descriptive, knowledge is basic and understanding is poor. Level 0 (0) No creditable response. 15
Mark scheme, page 14
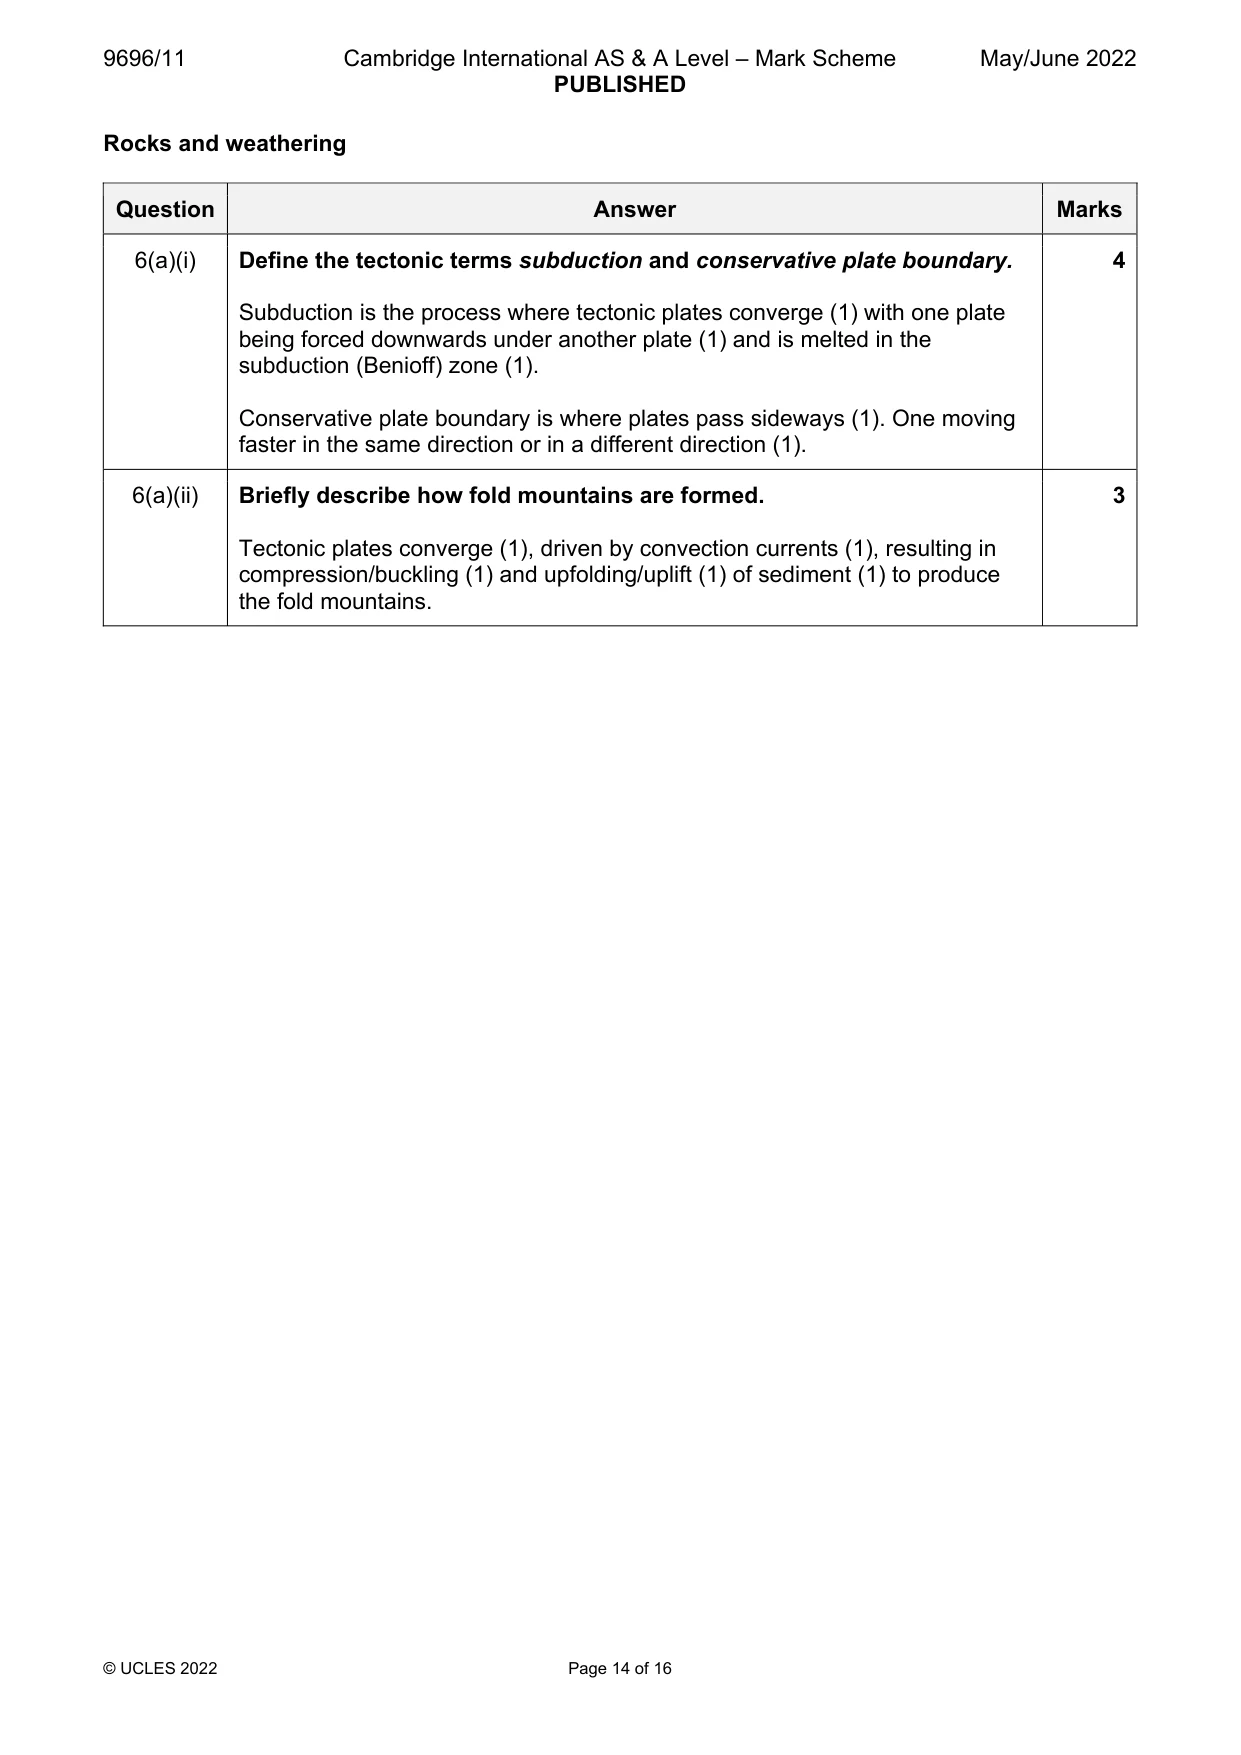
9696/11 Cambridge International AS & A Level – Mark Scheme PUBLISHED May/June 2022 © UCLES 2022 Page 14 of 16 Rocks and weathering Question Answer Marks 6(a)(i) Define the tectonic terms subduction and conservative plate boundary. Subduction is the process where tectonic plates converge (1) with one plate being forced downwards under another plate (1) and is melted in the subduction (Benioff) zone (1). Conservative plate boundary is where plates pass sideways (1). One moving faster in the same direction or in a different direction (1). 4 6(a)(ii) Briefly describe how fold mountains are formed. Tectonic plates converge (1), driven by convection currents (1), resulting in compression/buckling (1) and upfolding/uplift (1) of sediment (1) to produce the fold mountains. 3
Mark scheme, page 15
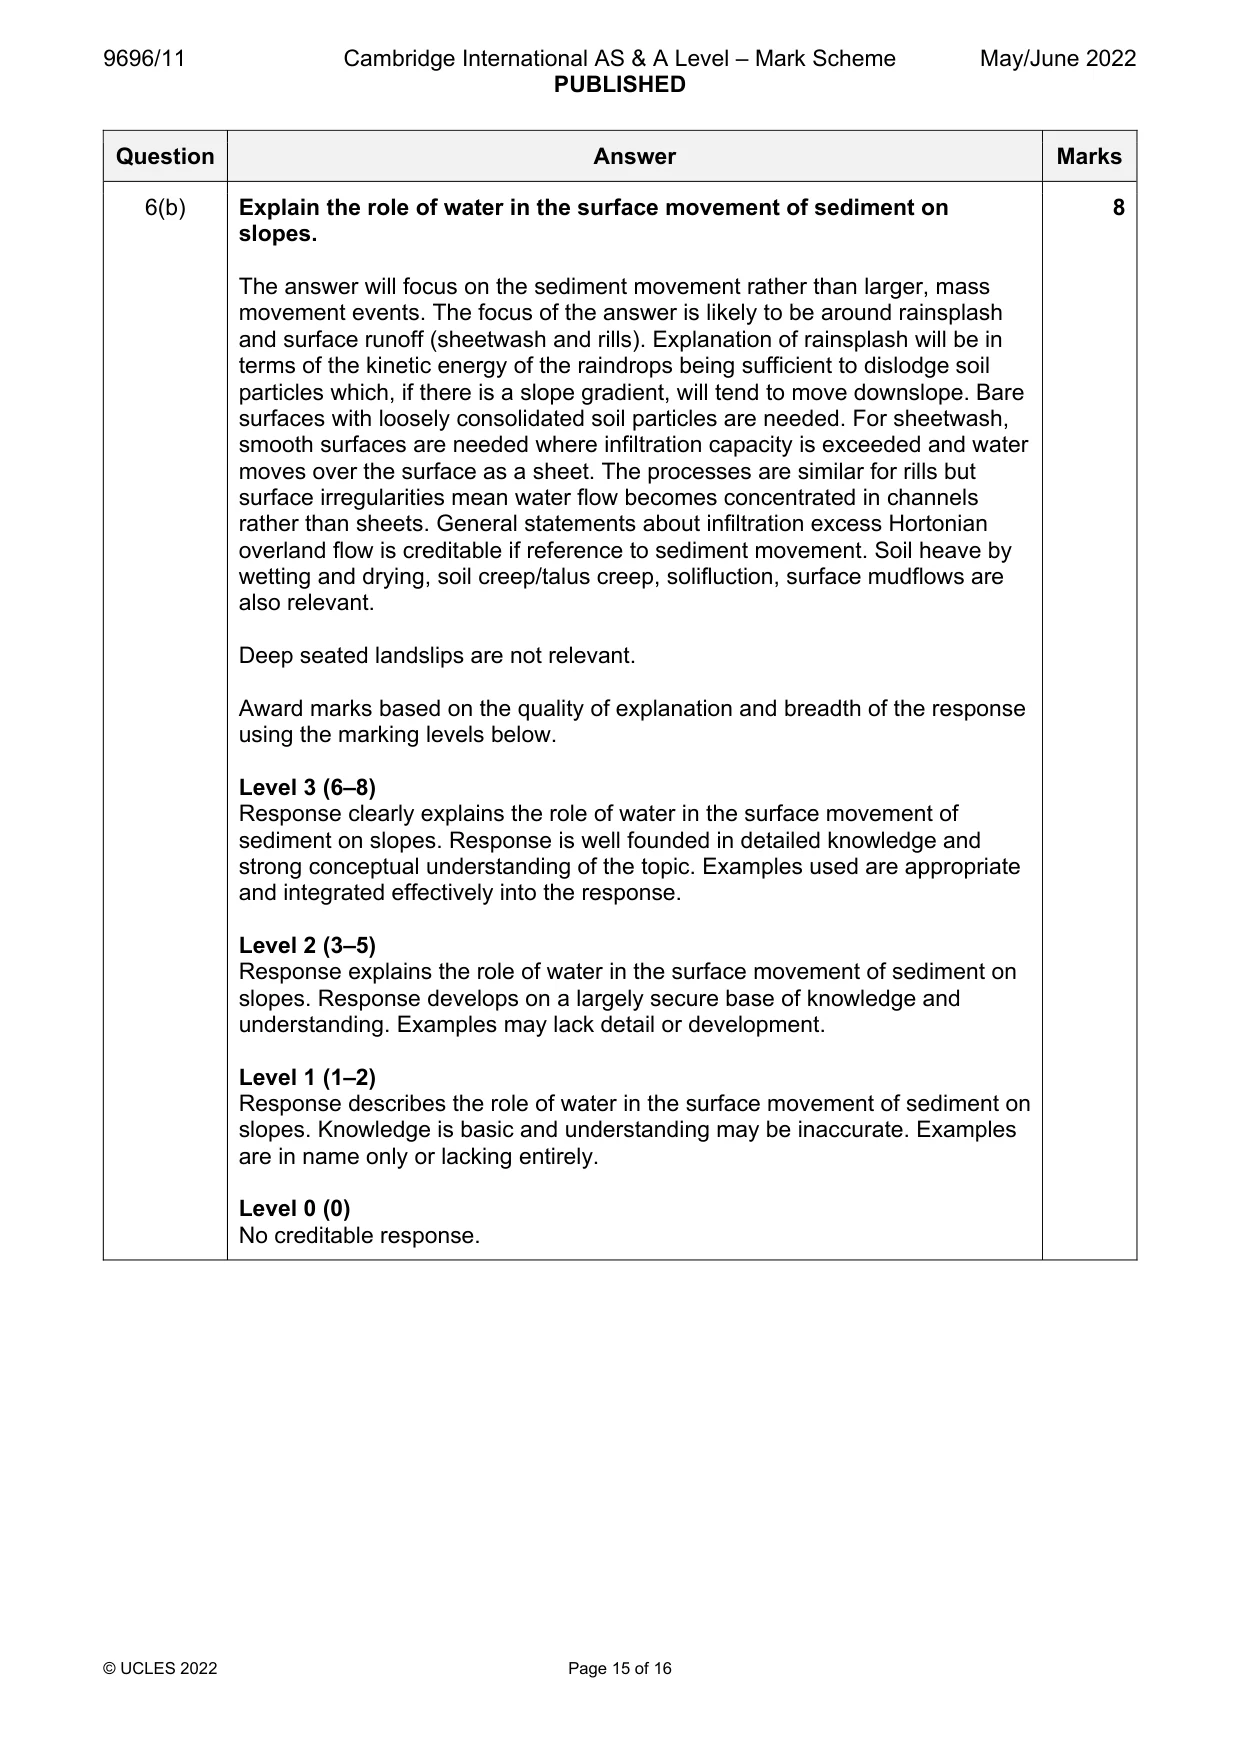
9696/11 Cambridge International AS & A Level – Mark Scheme PUBLISHED May/June 2022 © UCLES 2022 Page 15 of 16 Question Answer Marks 6(b) Explain the role of water in the surface movement of sediment on slopes. The answer will focus on the sediment movement rather than larger, mass movement events. The focus of the answer is likely to be around rainsplash and surface runoff (sheetwash and rills). Explanation of rainsplash will be in terms of the kinetic energy of the raindrops being sufficient to dislodge soil particles which, if there is a slope gradient, will tend to move downslope. Bare surfaces with loosely consolidated soil particles are needed. For sheetwash, smooth surfaces are needed where infiltration capacity is exceeded and water moves over the surface as a sheet. The processes are similar for rills but surface irregularities mean water flow becomes concentrated in channels rather than sheets. General statements about infiltration excess Hortonian overland flow is creditable if reference to sediment movement. Soil heave by wetting and drying, soil creep/talus creep, solifluction, surface mudflows are also relevant. Deep seated landslips are not relevant. Award marks based on the quality of explanation and breadth of the response using the marking levels below. Level 3 (6–8) Response clearly explains the role of water in the surface movement of sediment on slopes. Response is well founded in detailed knowledge and strong conceptual understanding of the topic. Examples used are appropriate and integrated effectively into the response. Level 2 (3–5) Response explains the role of water in the surface movement of sediment on slopes. Response develops on a largely secure base of knowledge and understanding. Examples may lack detail or development. Level 1 (1–2) Response describes the role of water in the surface movement of sediment on slopes. Knowledge is basic and understanding may be inaccurate. Examples are in name only or lacking entirely. Level 0 (0) No creditable response. 8
Mark scheme, page 16
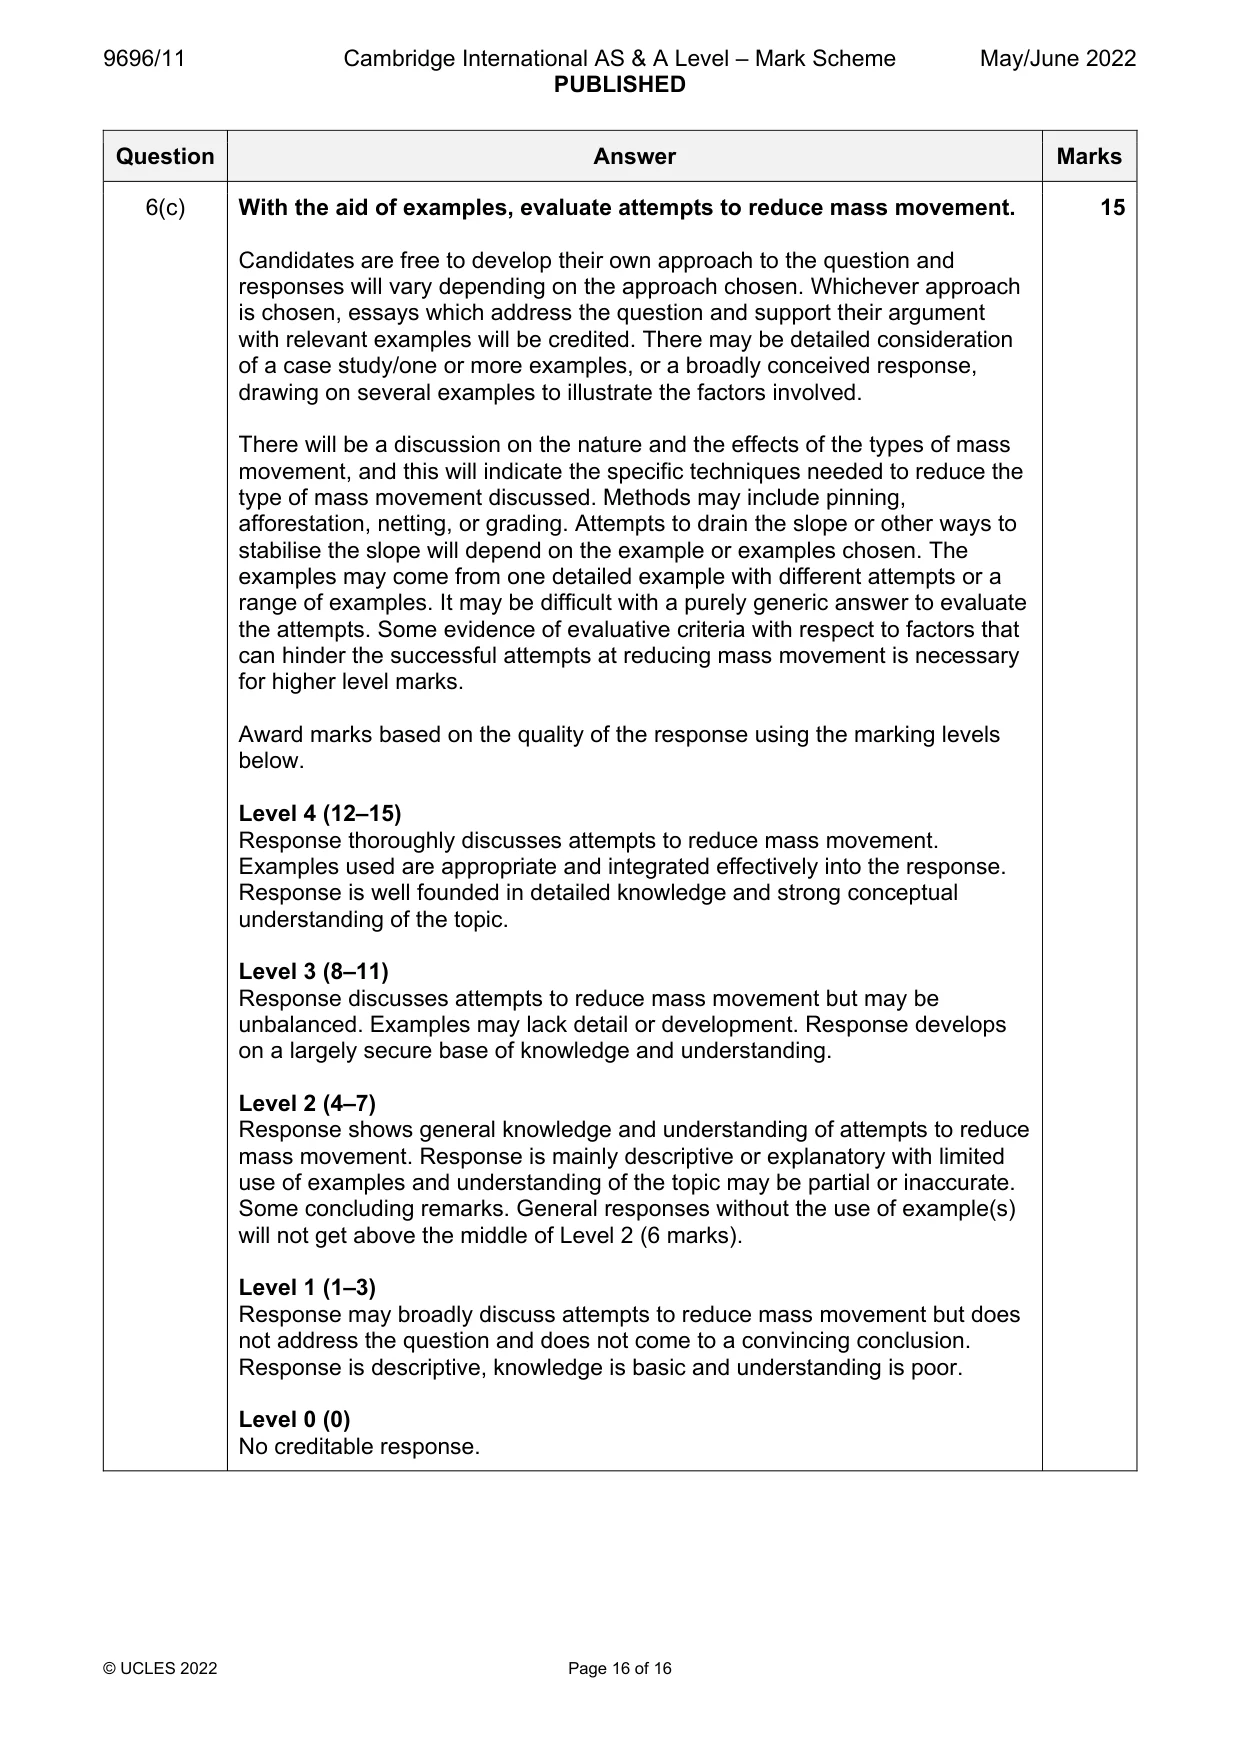
9696/11 Cambridge International AS & A Level – Mark Scheme PUBLISHED May/June 2022 © UCLES 2022 Page 16 of 16 Question Answer Marks 6(c) With the aid of examples, evaluate attempts to reduce mass movement. Candidates are free to develop their own approach to the question and responses will vary depending on the approach chosen. Whichever approach is chosen, essays which address the question and support their argument with relevant examples will be credited. There may be detailed consideration of a case study/one or more examples, or a broadly conceived response, drawing on several examples to illustrate the factors involved. There will be a discussion on the nature and the effects of the types of mass movement, and this will indicate the specific techniques needed to reduce the type of mass movement discussed. Methods may include pinning, afforestation, netting, or grading. Attempts to drain the slope or other ways to stabilise the slope will depend on the example or examples chosen. The examples may come from one detailed example with different attempts or a range of examples. It may be difficult with a purely generic answer to evaluate the attempts. Some evidence of evaluative criteria with respect to factors that can hinder the successful attempts at reducing mass movement is necessary for higher level marks. Award marks based on the quality of the response using the marking levels below. Level 4 (12–15) Response thoroughly discusses attempts to reduce mass movement. Examples used are appropriate and integrated effectively into the response. Response is well founded in detailed knowledge and strong conceptual understanding of the topic. Level 3 (8–11) Response discusses attempts to reduce mass movement but may be unbalanced. Examples may lack detail or development. Response develops on a largely secure base of knowledge and understanding. Level 2 (4–7) Response shows general knowledge and understanding of attempts to reduce mass movement. Response is mainly descriptive or explanatory with limited use of examples and understanding of the topic may be partial or inaccurate. Some concluding remarks. General responses without the use of example(s) will not get above the middle of Level 2 (6 marks). Level 1 (1–3) Response may broadly discuss attempts to reduce mass movement but does not address the question and does not come to a convincing conclusion. Response is descriptive, knowledge is basic and understanding is poor. Level 0 (0) No creditable response. 15
What you needed in this session
Cambridge’s own grade thresholds for 2022 May/June, Paper 1 · Variant 1. A higher threshold means an easier paper — the bar moves with how the cohort did.