Cambridge A Level Environmental Management (AS only) 8291 — 2021 May/June Paper 1 · Variant 1
8291/11/M/J/21 · 80 marks · ≈90 min
The question paper and its mark scheme, free to read here and free to download. This is Cambridge’s own paper, exactly as it was sat.
Question paper12 pages
Mark scheme18 pages
Answers below. Sit the paper first if you are practising.
Paper as text
Question paper, page 1
This document has 12 pages. Cambridge International AS Level DC (ST/CT) 201620/3 © UCLES 2021 [Turn over ENVIRONMENTAL MANAGEMENT 8291/11 Paper 1 Lithosphere and Atmosphere May/June 2021 1 hour 30 minutes You must answer Section A on the question paper and Section B on the answer booklet/paper you have been given. You will need: Answer booklet/paper INSTRUCTIONS ● Section A: answer all questions. Write your answer to each question in the space provided on the question paper. ● Section B: answer one question. Write your answer on the separate answer booklet/paper provided. ● Use a black or dark blue pen. You may use an HB pencil for any diagrams or graphs. ● Write your name, centre number and candidate number in the boxes at the top of the page. ● Do not use an erasable pen or correction fluid. ● Do not write on any bar codes. ● You may use a calculator. ● You should show all your working and use appropriate units. ● At the end of the examination, fasten all your work together. Do not use staples, paper clips or glue. INFORMATION ● The total mark for this paper is 80. ● The number of marks for each question or part question is shown in brackets [ ]. * 2 7 4 6 7 3 4 0 0 4 * For Examiner’s use Section A 1 2 Section B Total
Question paper, page 2
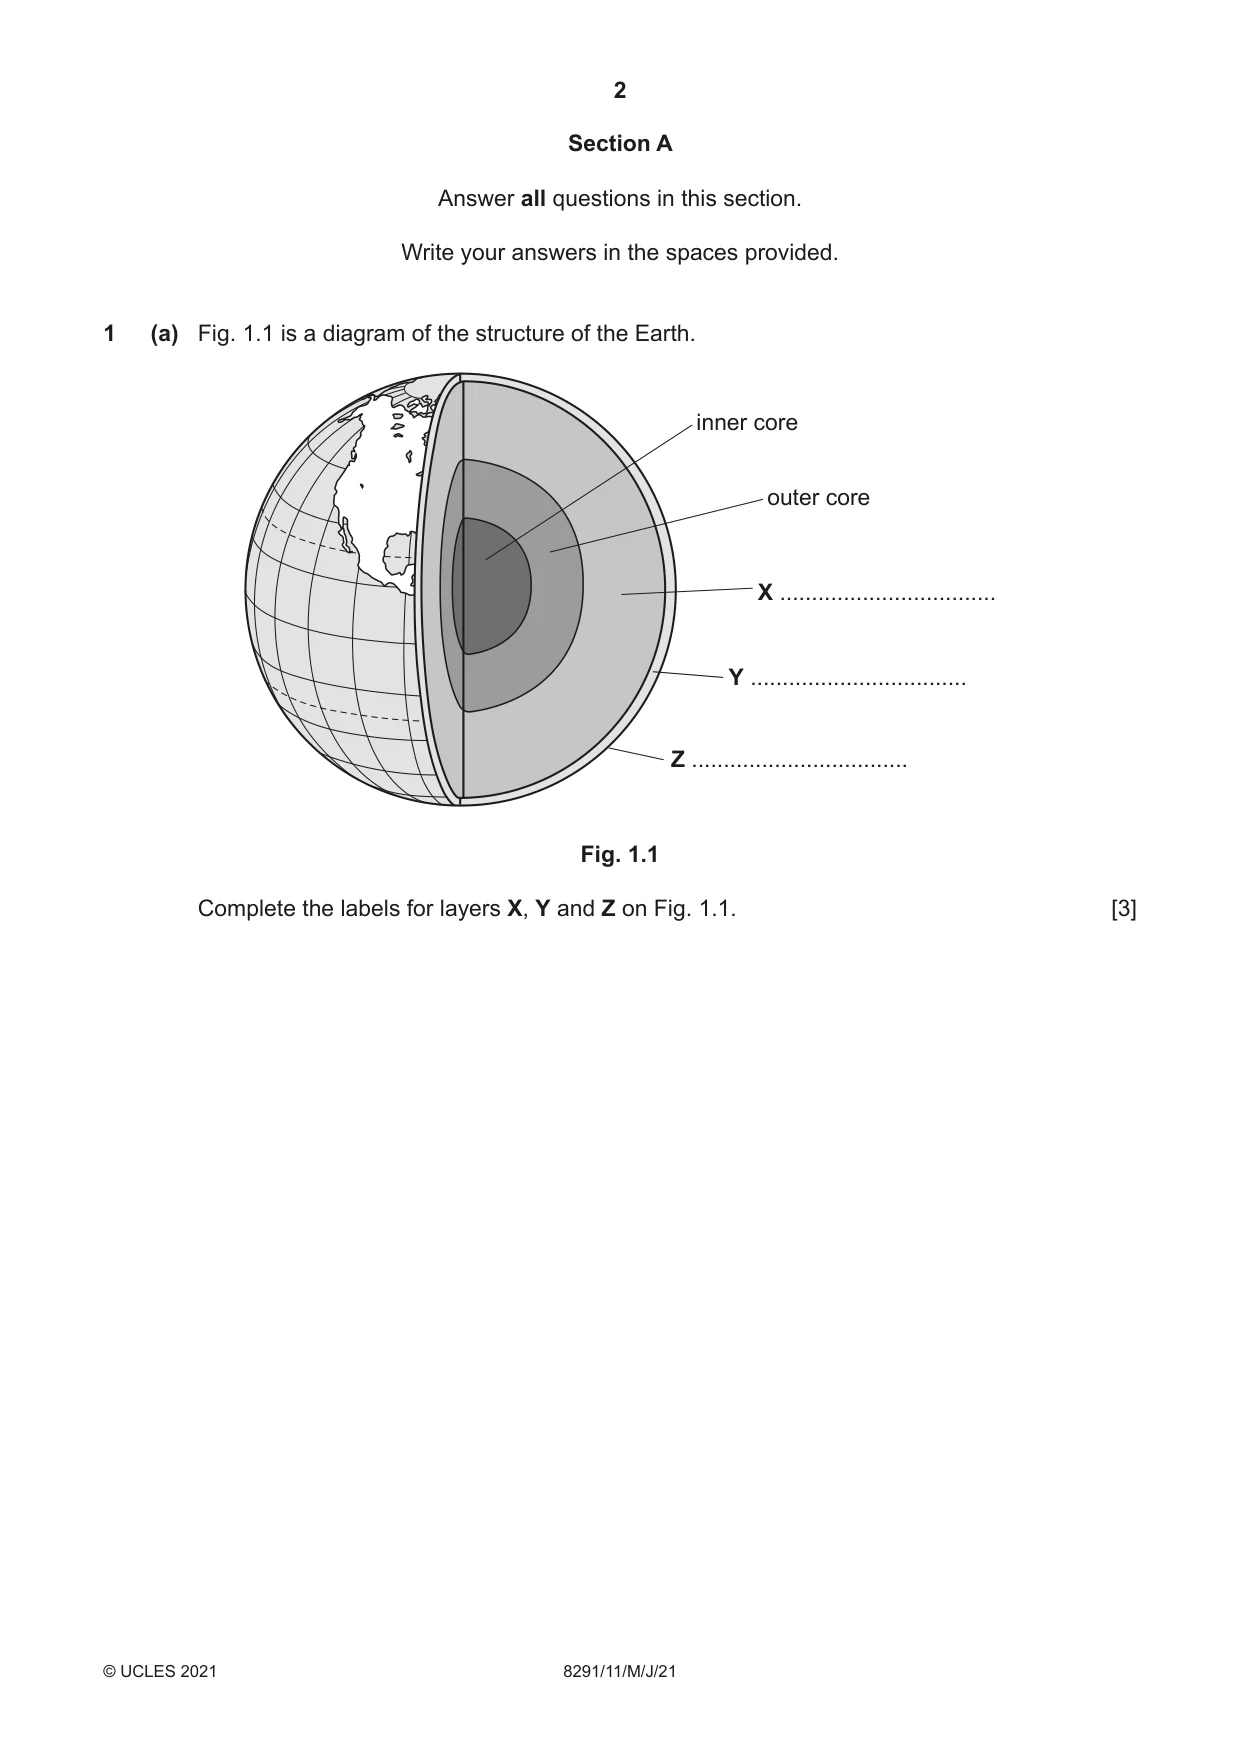
2 8291/11/M/J/21 © UCLES 2021 Section A Answer all questions in this section. Write your answers in the spaces provided. 1 (a) Fig. 1.1 is a diagram of the structure of the Earth. inner core X … Y … Z … outer core Fig. 1.1 Complete the labels for layers X, Y and Z on Fig. 1.1. [3]
Question paper, page 3
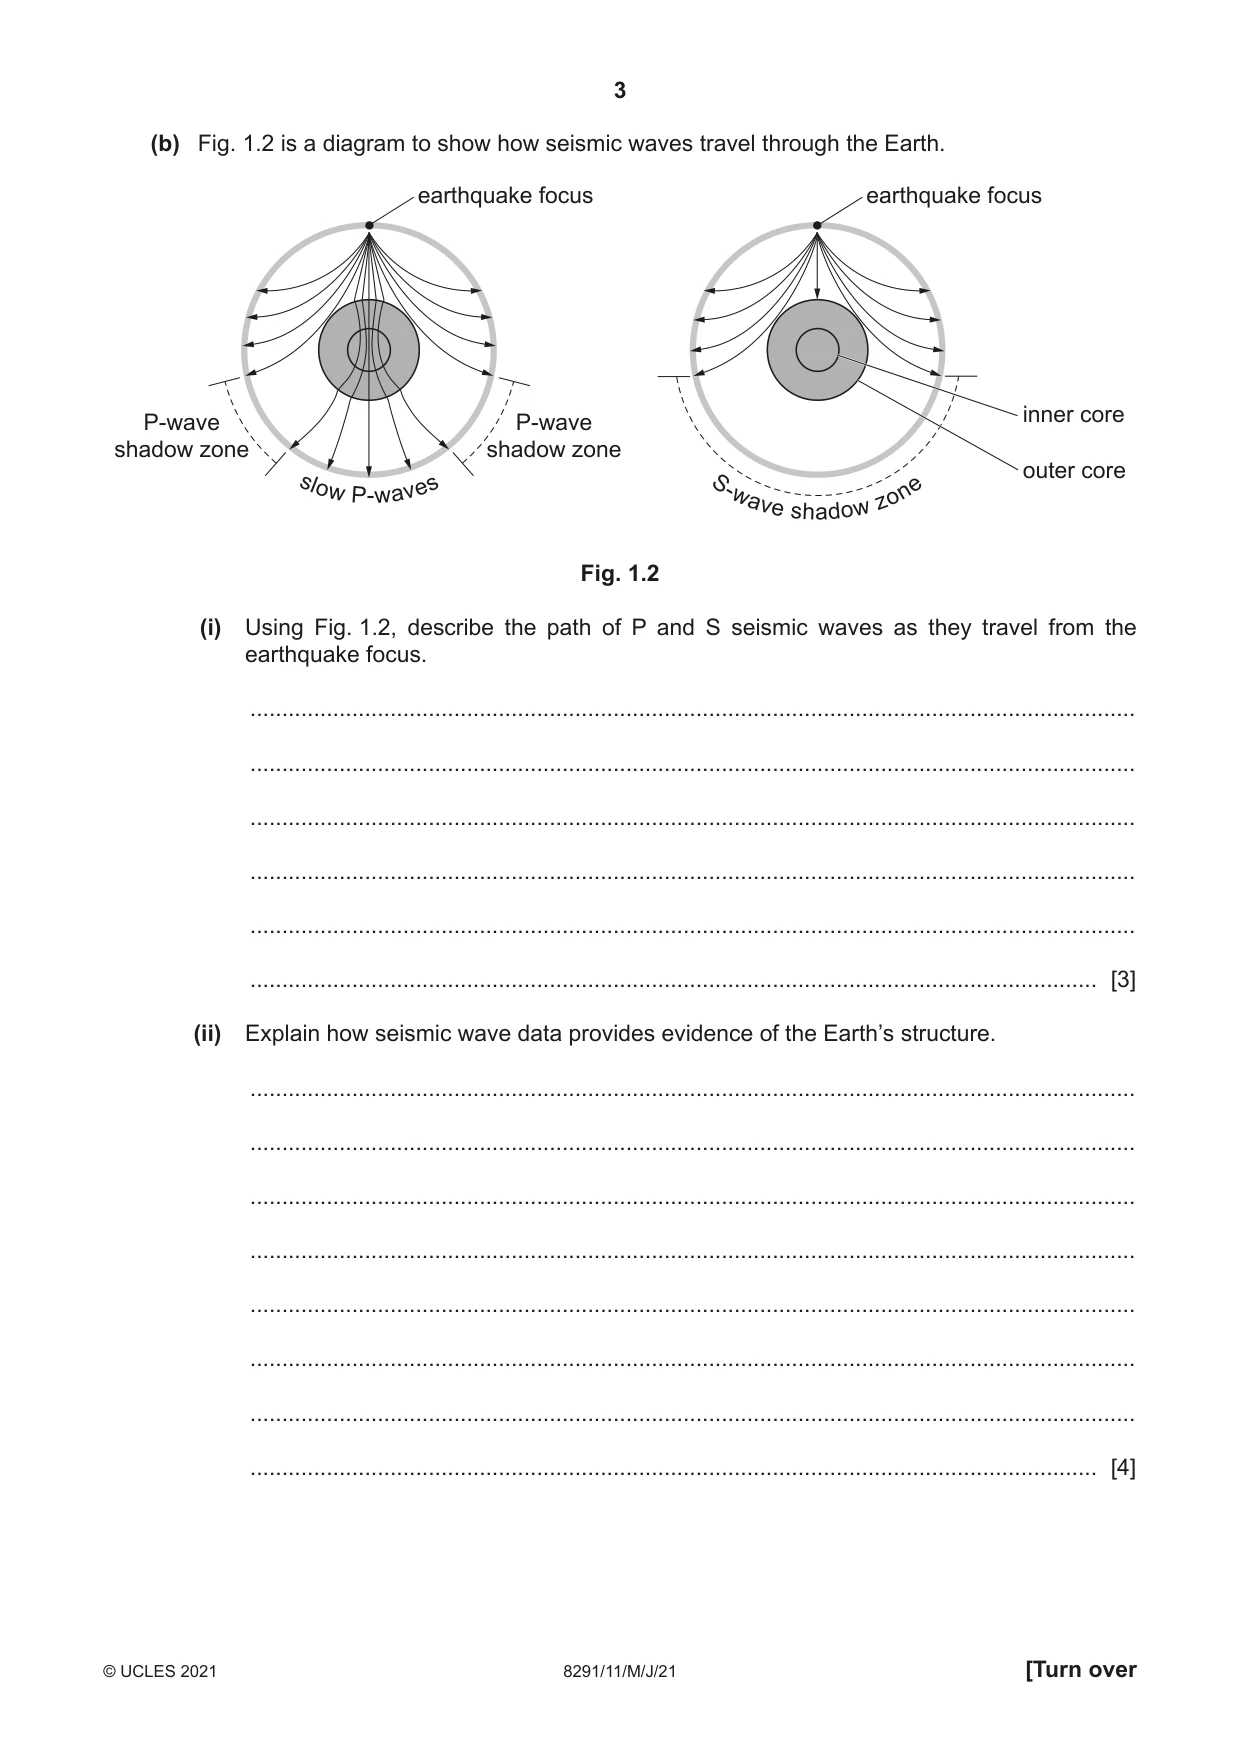
3 8291/11/M/J/21 © UCLES 2021 [Turn over (b) Fig. 1.2 is a diagram to show how seismic waves travel through the Earth. earthquake focus P-wave shadow zone P-wave shadow zone s l o w P - w a v e s earthquake focus S - w a v e s h a d o w z o n e inner core outer core Fig. 1.2 (i) Using Fig. 1.2, describe the path of P and S seismic waves as they travel from the earthquake focus. … … … … … … [3] (ii) Explain how seismic wave data provides evidence of the Earth’s structure. … … … … … … … … [4]
Question paper, page 4
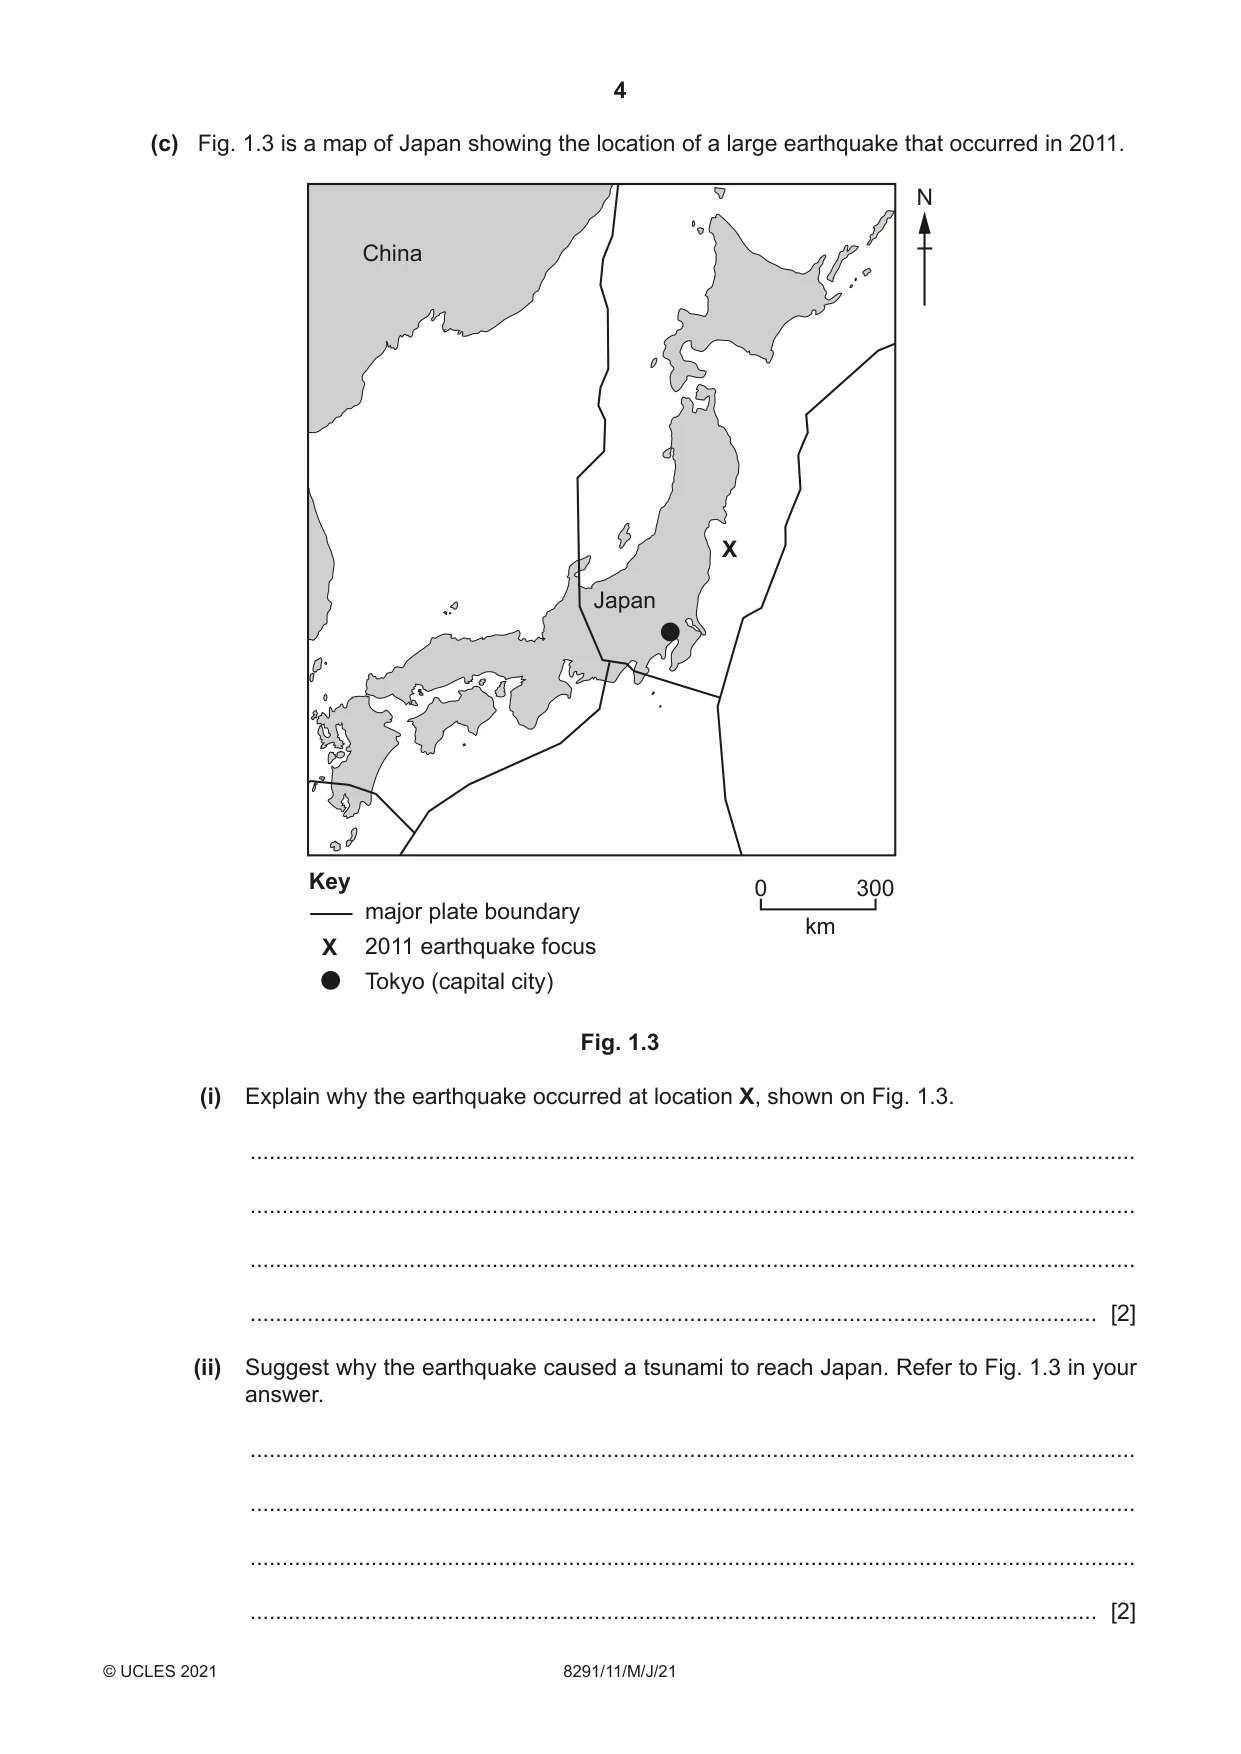
4 8291/11/M/J/21 © UCLES 2021 (c) Fig. 1.3 is a map of Japan showing the location of a large earthquake that occurred in 2011. 0 300 km Key major plate boundary 2011 earthquake focus Tokyo (capital city) N Japan China X X Fig. 1.3 (i) Explain why the earthquake occurred at location X, shown on Fig. 1.3. … … … … [2] (ii) Suggest why the earthquake caused a tsunami to reach Japan. Refer to Fig. 1.3 in your answer. … … … … [2]
Question paper, page 5
5 8291/11/M/J/21 © UCLES 2021 [Turn over (iii) Early warning systems are one strategy to limit damage and loss of life from earthquakes. Residents of Tokyo received a warning one minute before the earthquake shook the city. Suggest how this strategy limited damage and loss of life in Tokyo. … … … … [2] (iv) Describe two strategies, other than early warning systems, which could be used to limit damage and loss of life from earthquakes. … … … … … … … … [4] [Total: 20]
Question paper, page 6
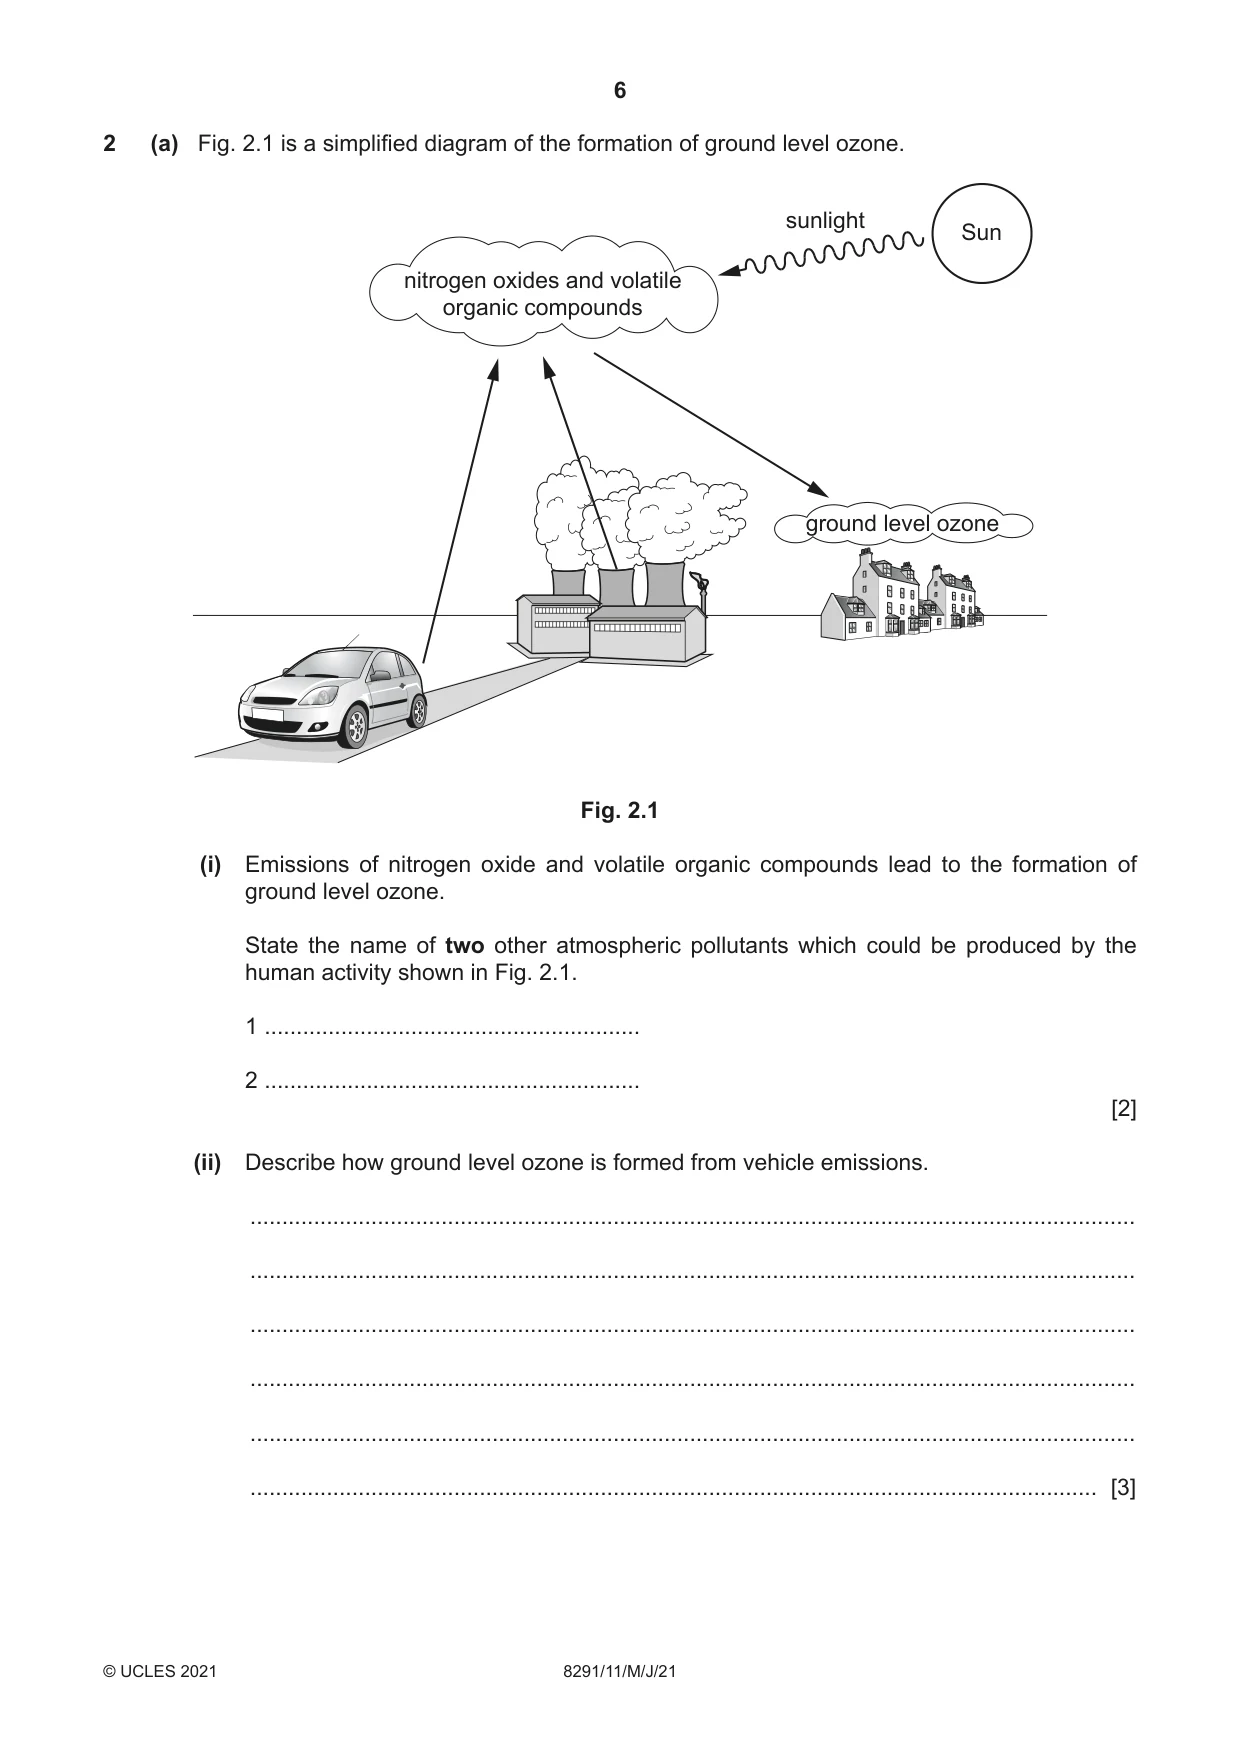
6 8291/11/M/J/21 © UCLES 2021 2 (a) Fig. 2.1 is a simplified diagram of the formation of ground level ozone. ground level ozone Sun nitrogen oxides and volatile organic compounds sunlight Fig. 2.1 (i) Emissions of nitrogen oxide and volatile organic compounds lead to the formation of ground level ozone. State the name of two other atmospheric pollutants which could be produced by the human activity shown in Fig. 2.1. 1 … 2 … [2] (ii) Describe how ground level ozone is formed from vehicle emissions. … … … … … … [3]
Question paper, page 7
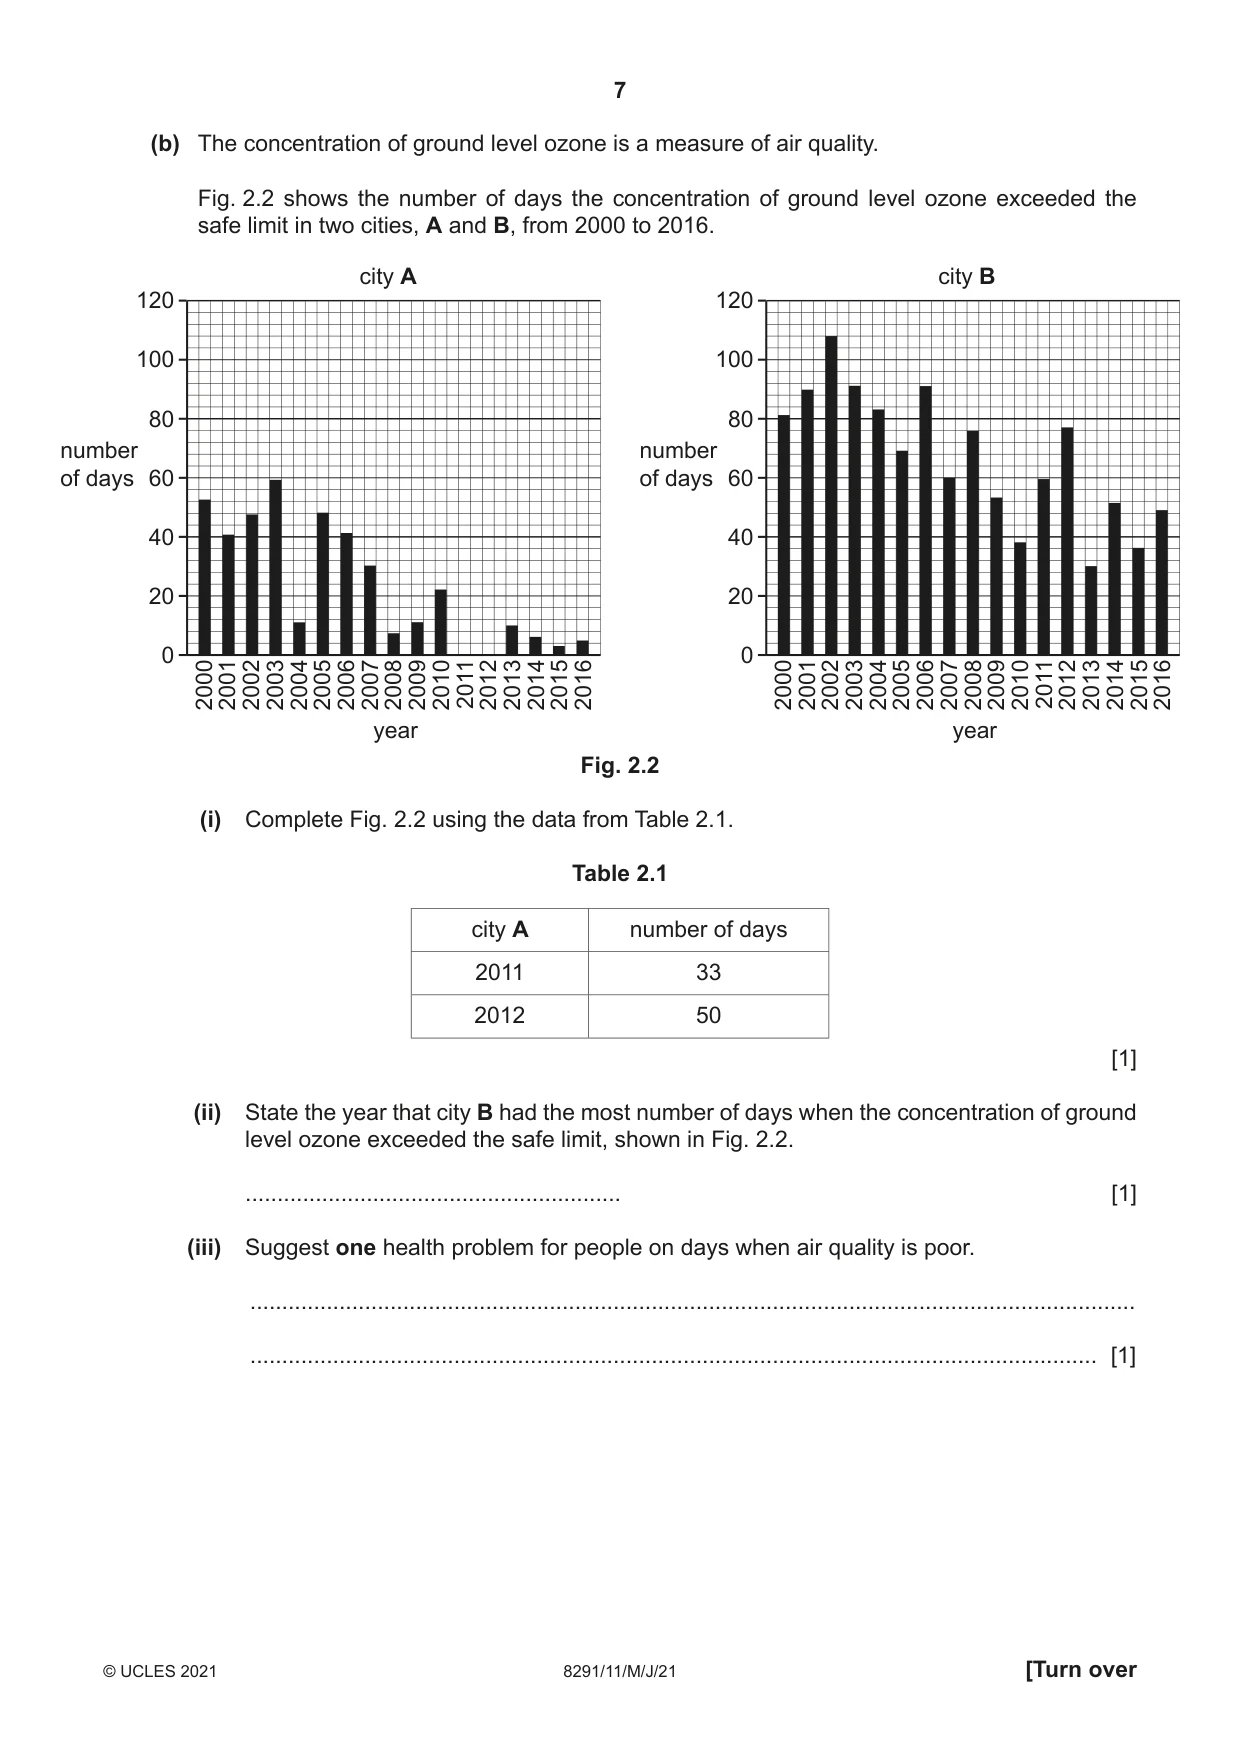
7 8291/11/M/J/21 © UCLES 2021 [Turn over (b) The concentration of ground level ozone is a measure of air quality. Fig. 2.2 shows the number of days the concentration of ground level ozone exceeded the safe limit in two cities, A and B, from 2000 to 2016. city A 0 20 40 60 80 100 120 number of days year 2000 2001 2002 2003 2004 2005 2006 2007 2008 2009 2010 2011 2012 2013 2014 2015 2016 city B 0 20 40 60 80 100 120 number of days year 2000 2001 2002 2003 2004 2005 2006 2007 2008 2009 2010 2011 2012 2013 2014 2015 2016 Fig. 2.2 (i) Complete Fig. 2.2 using the data from Table 2.1. Table 2.1 city A number of days 2011 33 2012 50 [1] (ii) State the year that city B had the most number of days when the concentration of ground level ozone exceeded the safe limit, shown in Fig. 2.2. … [1] (iii) Suggest one health problem for people on days when air quality is poor. … … [1]
Question paper, page 8
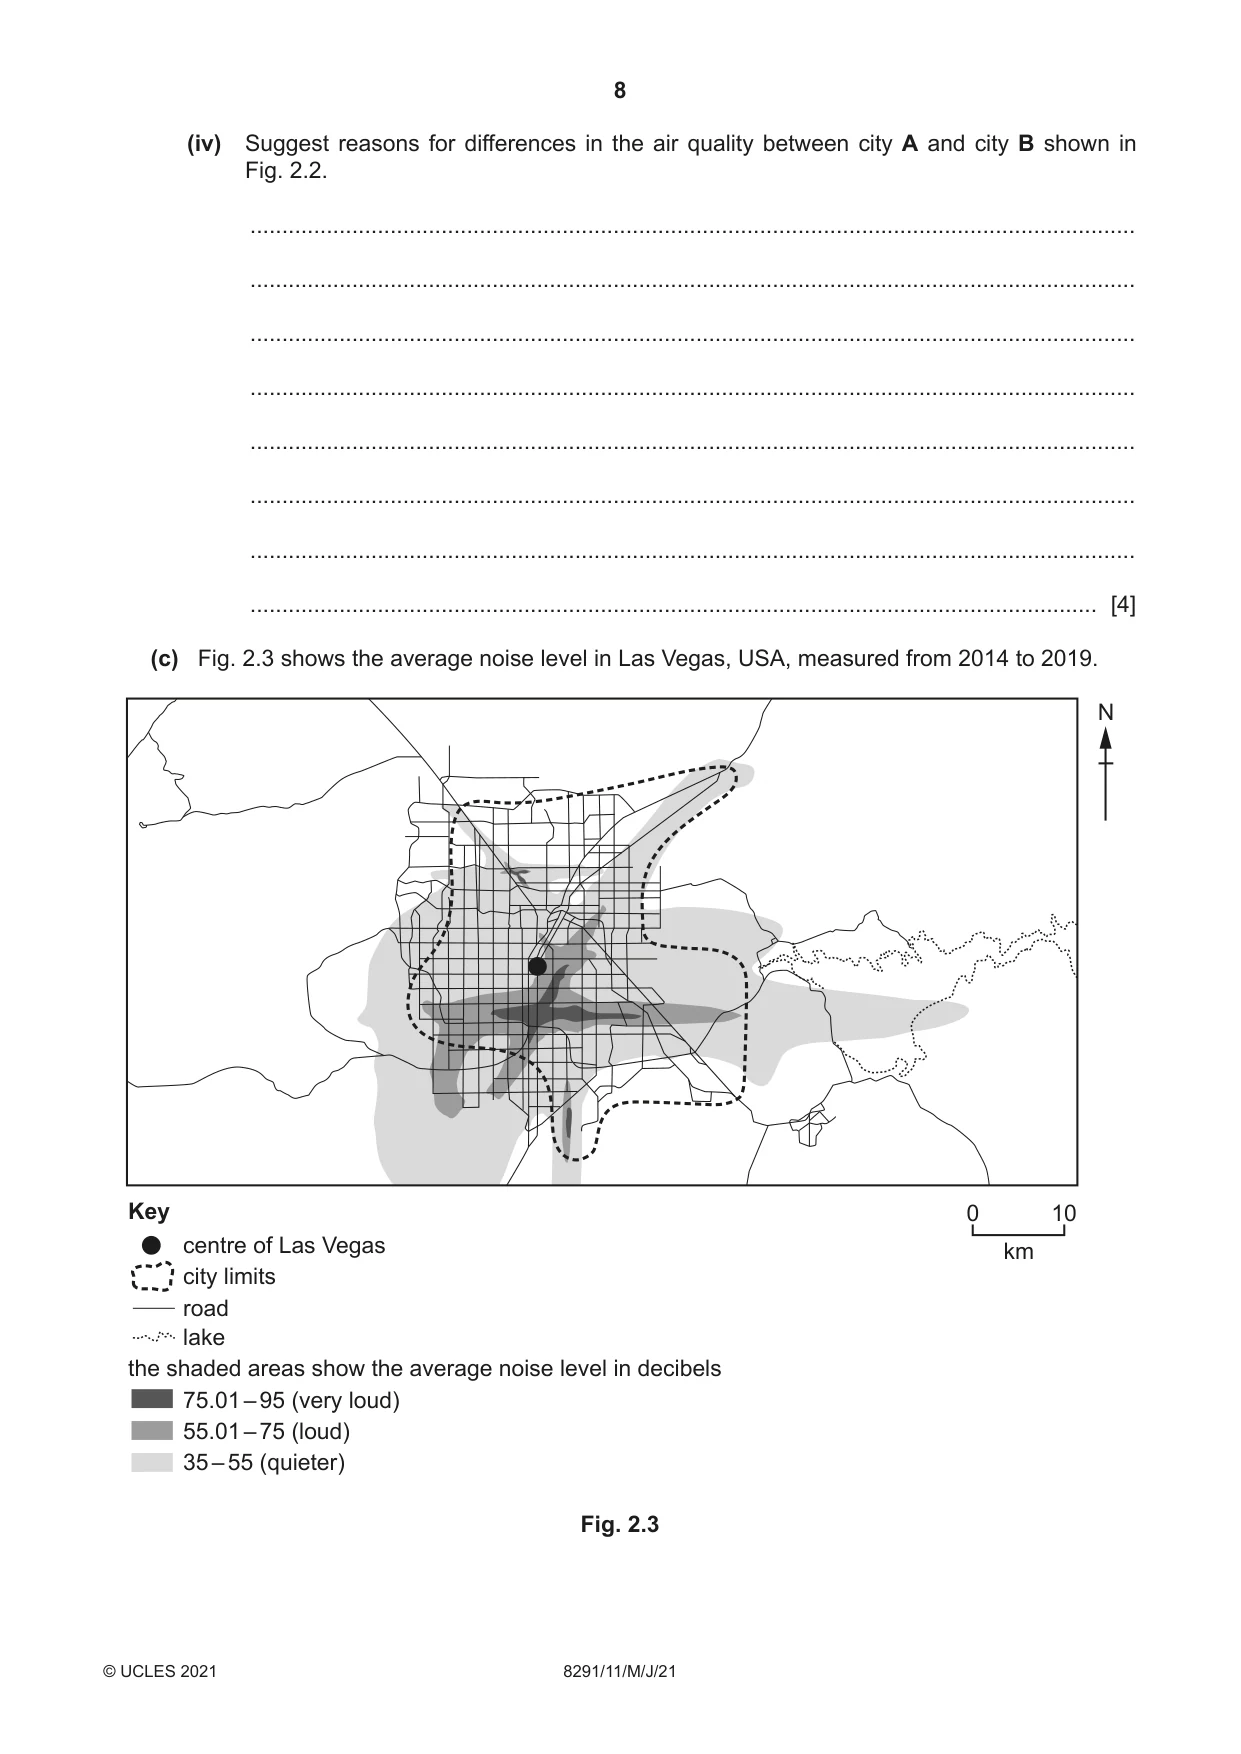
8 8291/11/M/J/21 © UCLES 2021 (iv) Suggest reasons for differences in the air quality between city A and city B shown in Fig. 2.2. … … … … … … … … [4] (c) Fig. 2.3 shows the average noise level in Las Vegas, USA, measured from 2014 to 2019. Key the shaded areas show the average noise level in decibels 75.01 – 95 (very loud) 55.01 – 75 (loud) 35 – 55 (quieter) centre of Las Vegas city limits road lake 0 10 km N Fig. 2.3
Question paper, page 9
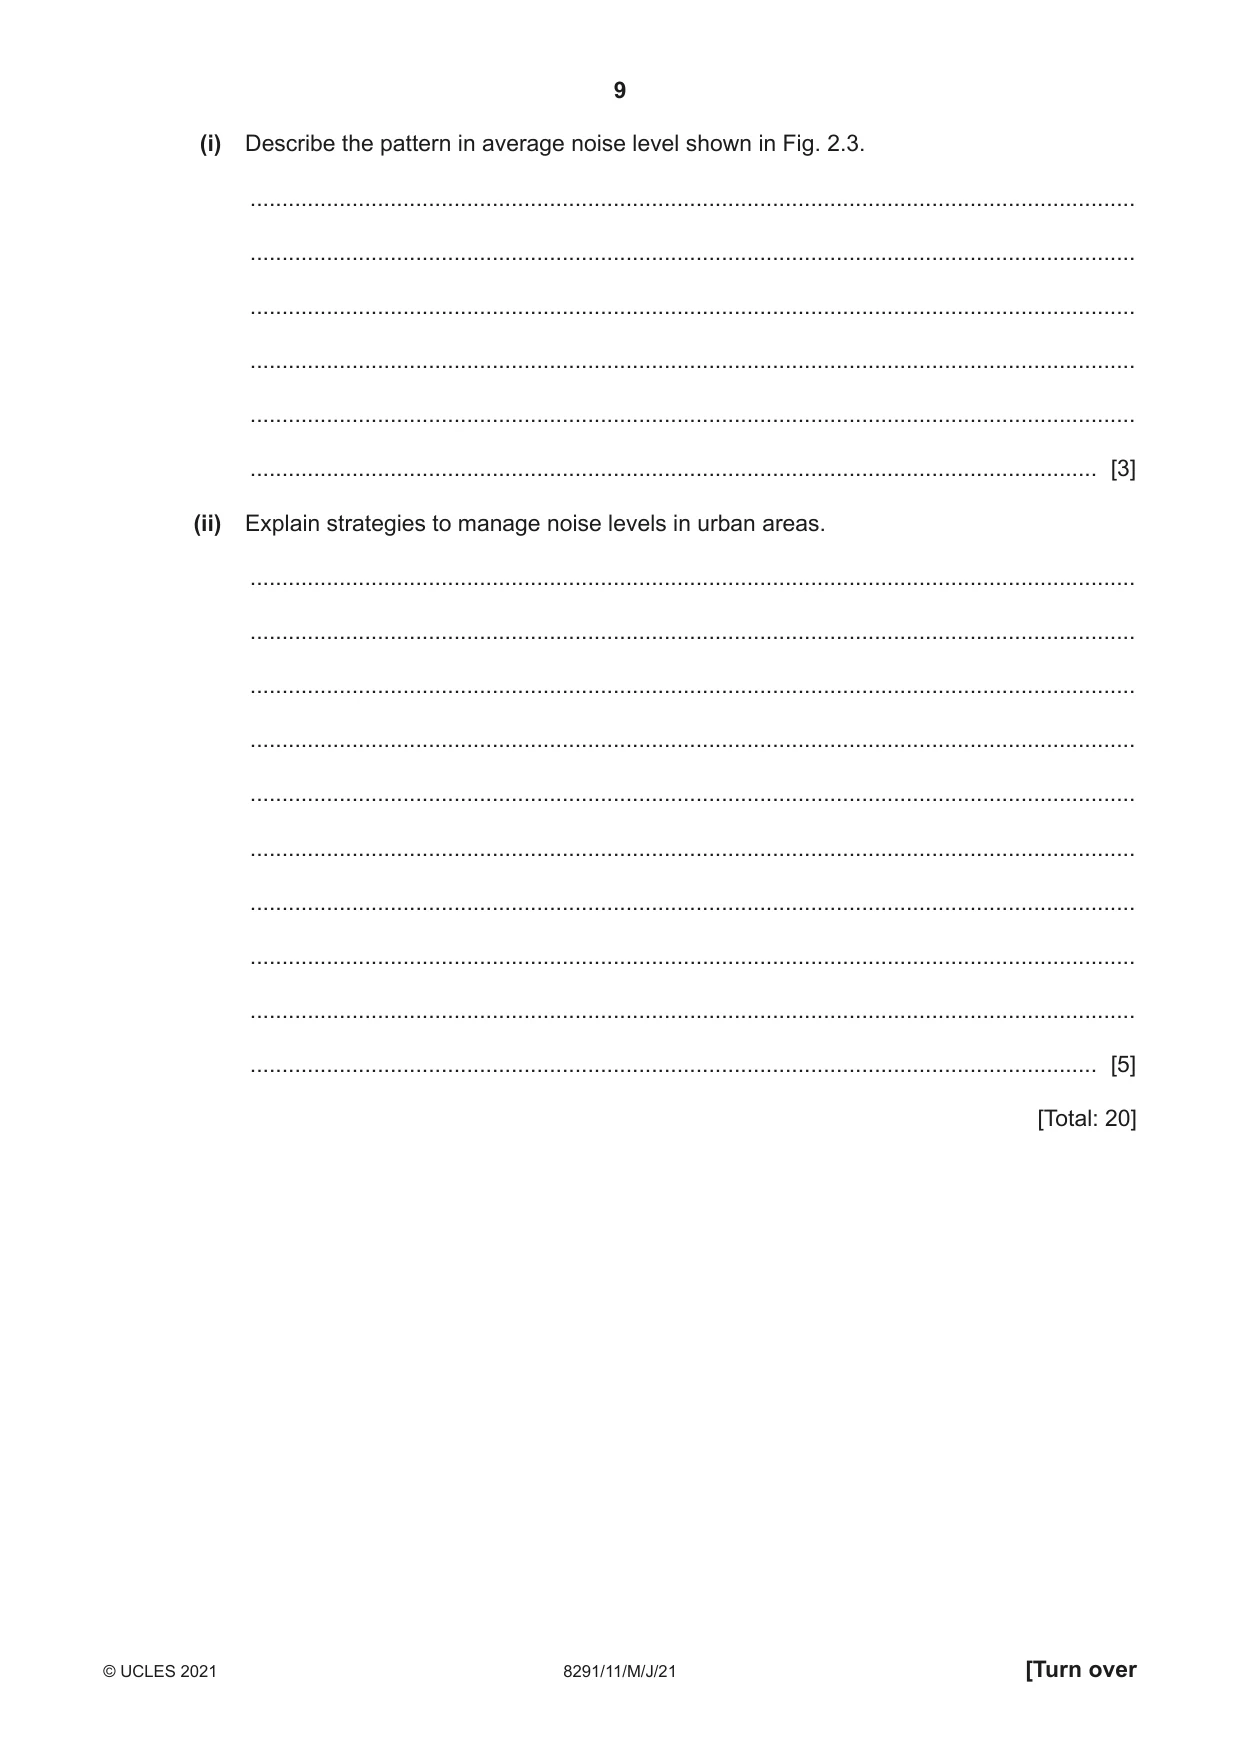
9 8291/11/M/J/21 © UCLES 2021 [Turn over (i) Describe the pattern in average noise level shown in Fig. 2.3. … … … … … … [3] (ii) Explain strategies to manage noise levels in urban areas. … … … … … … … … … … [5] [Total: 20]
Question paper, page 10
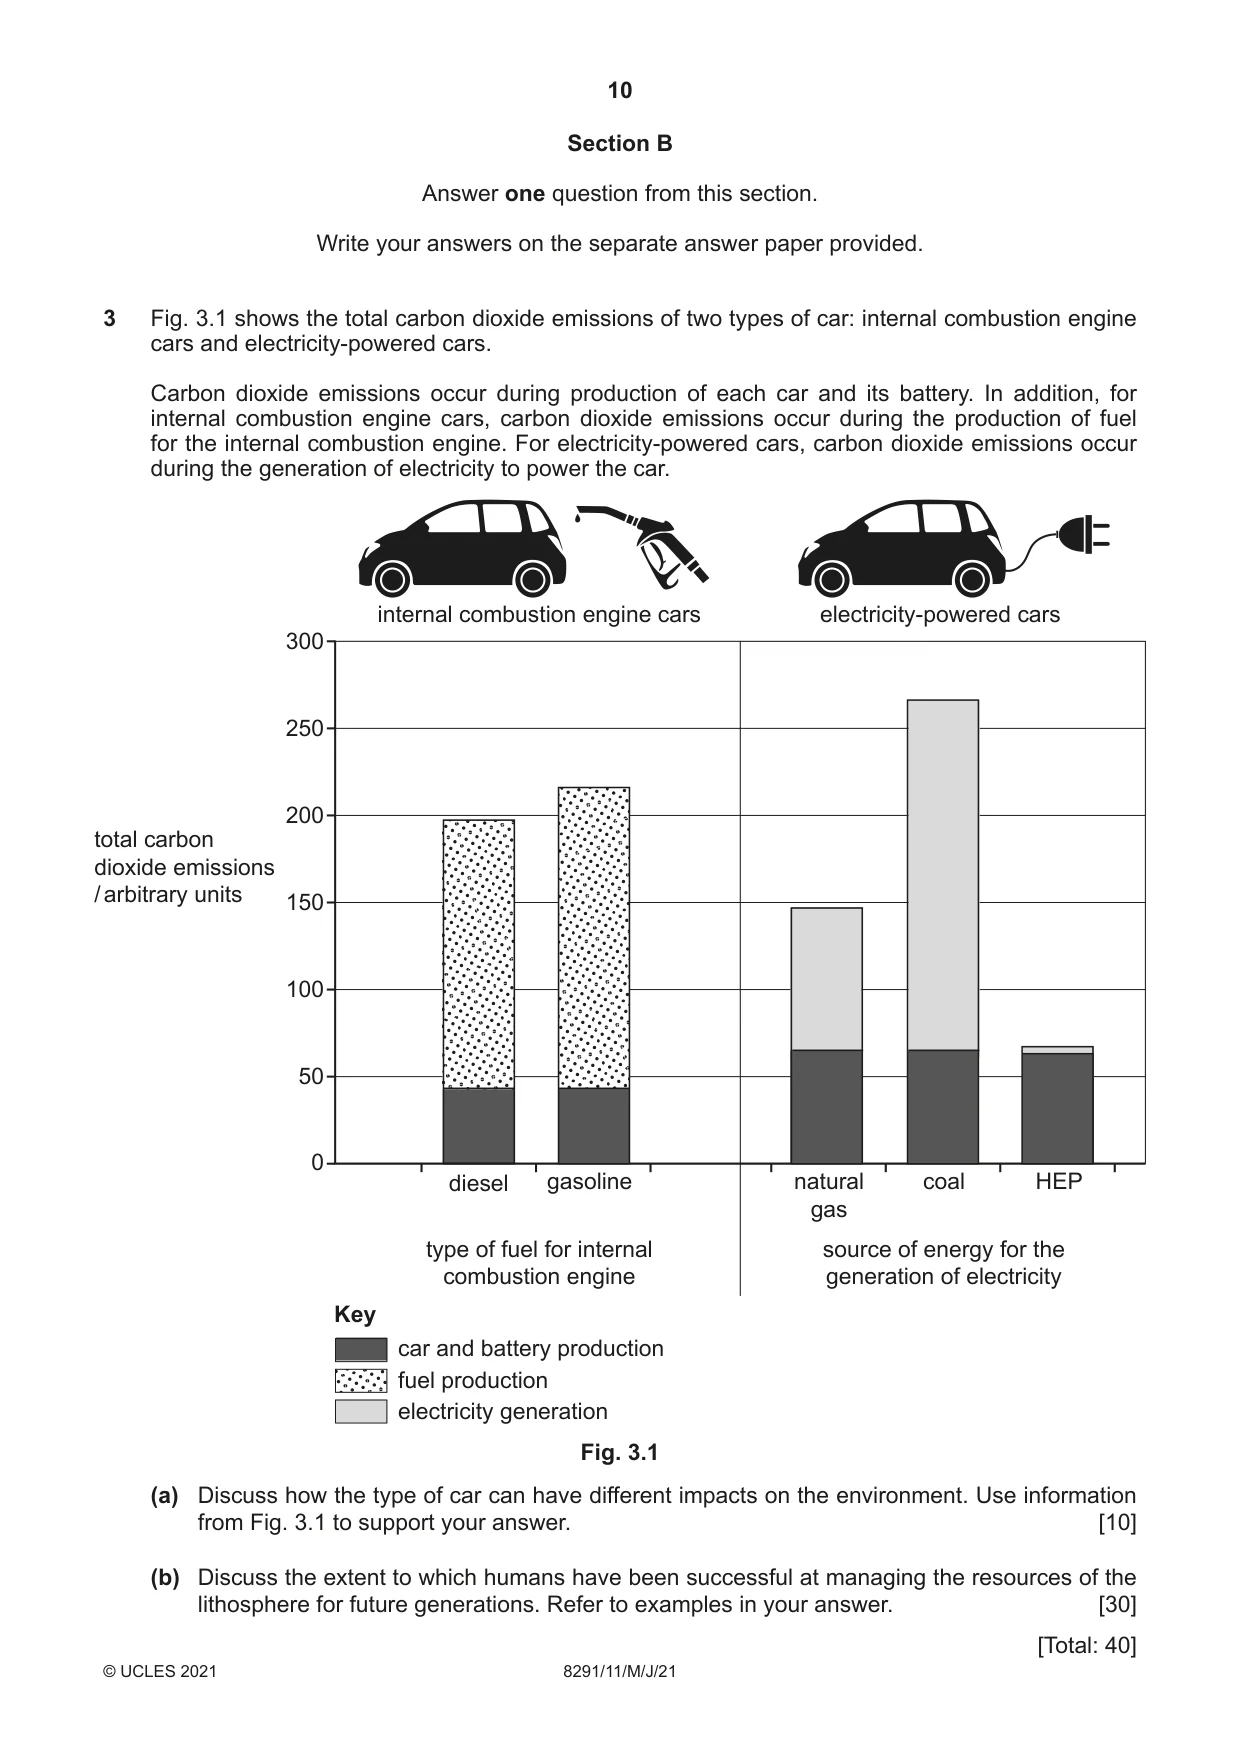
10 8291/11/M/J/21 © UCLES 2021 Section B Answer one question from this section. Write your answers on the separate answer paper provided. 3 Fig. 3.1 shows the total carbon dioxide emissions of two types of car: internal combustion engine cars and electricity-powered cars. Carbon dioxide emissions occur during production of each car and its battery. In addition, for internal combustion engine cars, carbon dioxide emissions occur during the production of fuel for the internal combustion engine. For electricity-powered cars, carbon dioxide emissions occur during the generation of electricity to power the car. 300 total carbon dioxide emissions / arbitrary units 250 200 150 100 50 0 diesel gasoline natural gas coal HEP internal combustion engine cars type of fuel for internal combustion engine source of energy for the generation of electricity electricity-powered cars Key car and battery production fuel production electricity generation Fig. 3.1 (a) Discuss how the type of car can have different impacts on the environment. Use information from Fig. 3.1 to support your answer. [10] (b) Discuss the extent to which humans have been successful at managing the resources of the lithosphere for future generations. Refer to examples in your answer. [30] [Total: 40]
Question paper, page 11
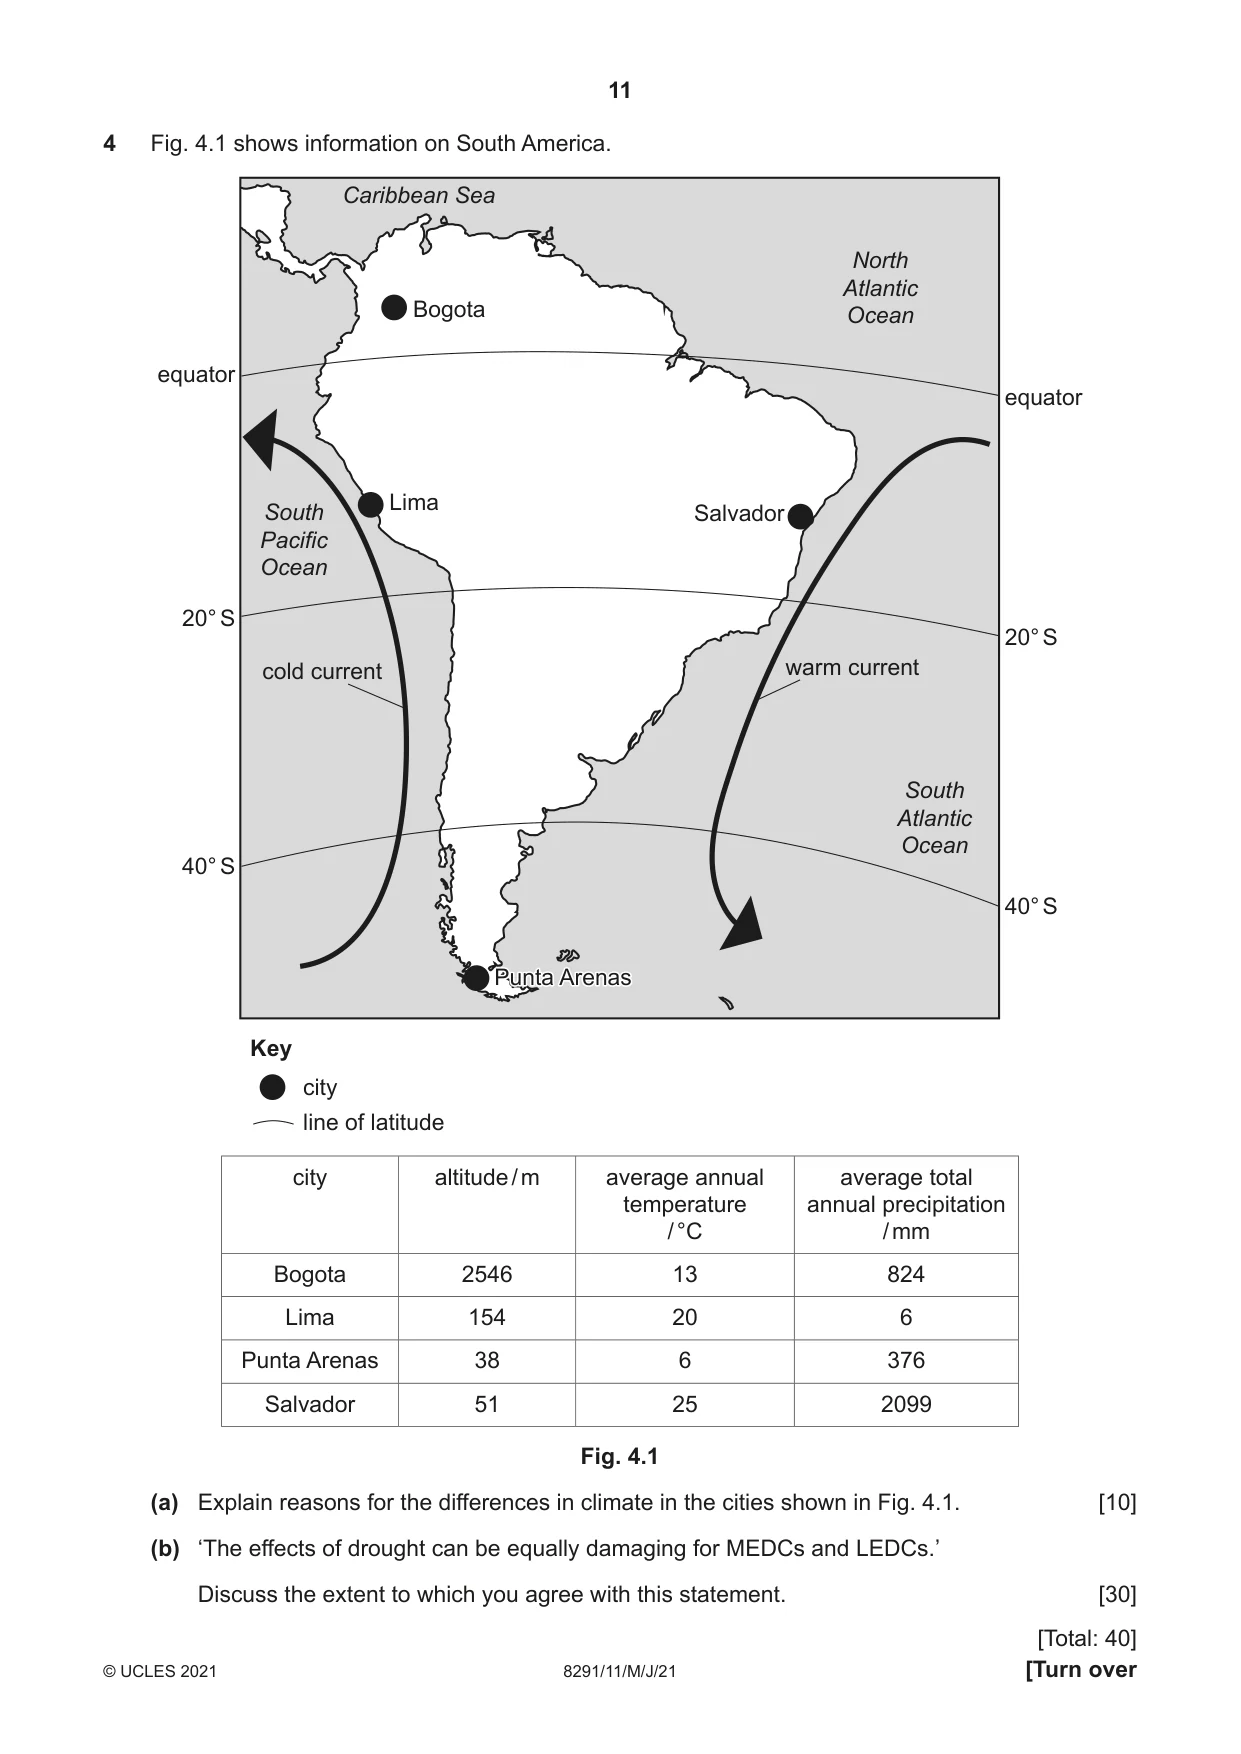
11 8291/11/M/J/21 © UCLES 2021 [Turn over 4 Fig. 4.1 shows information on South America. warm current cold current Bogota Lima Punta Arenas Punta Arenas Salvador North Atlantic Ocean South Atlantic Ocean South Pacific Ocean Caribbean Sea Key city line of latitude 20° S equator 40° S 20° S equator 40° S city altitude / m average annual temperature / °C average total annual precipitation / mm Bogota 2546 13 824 Lima 154 20 6 Punta Arenas 38 6 376 Salvador 51 25 2099 Fig. 4.1 (a) Explain reasons for the differences in climate in the cities shown in Fig. 4.1. [10] (b) ‘The effects of drought can be equally damaging for MEDCs and LEDCs.’ Discuss the extent to which you agree with this statement. [30] [Total: 40]
Question paper, page 12
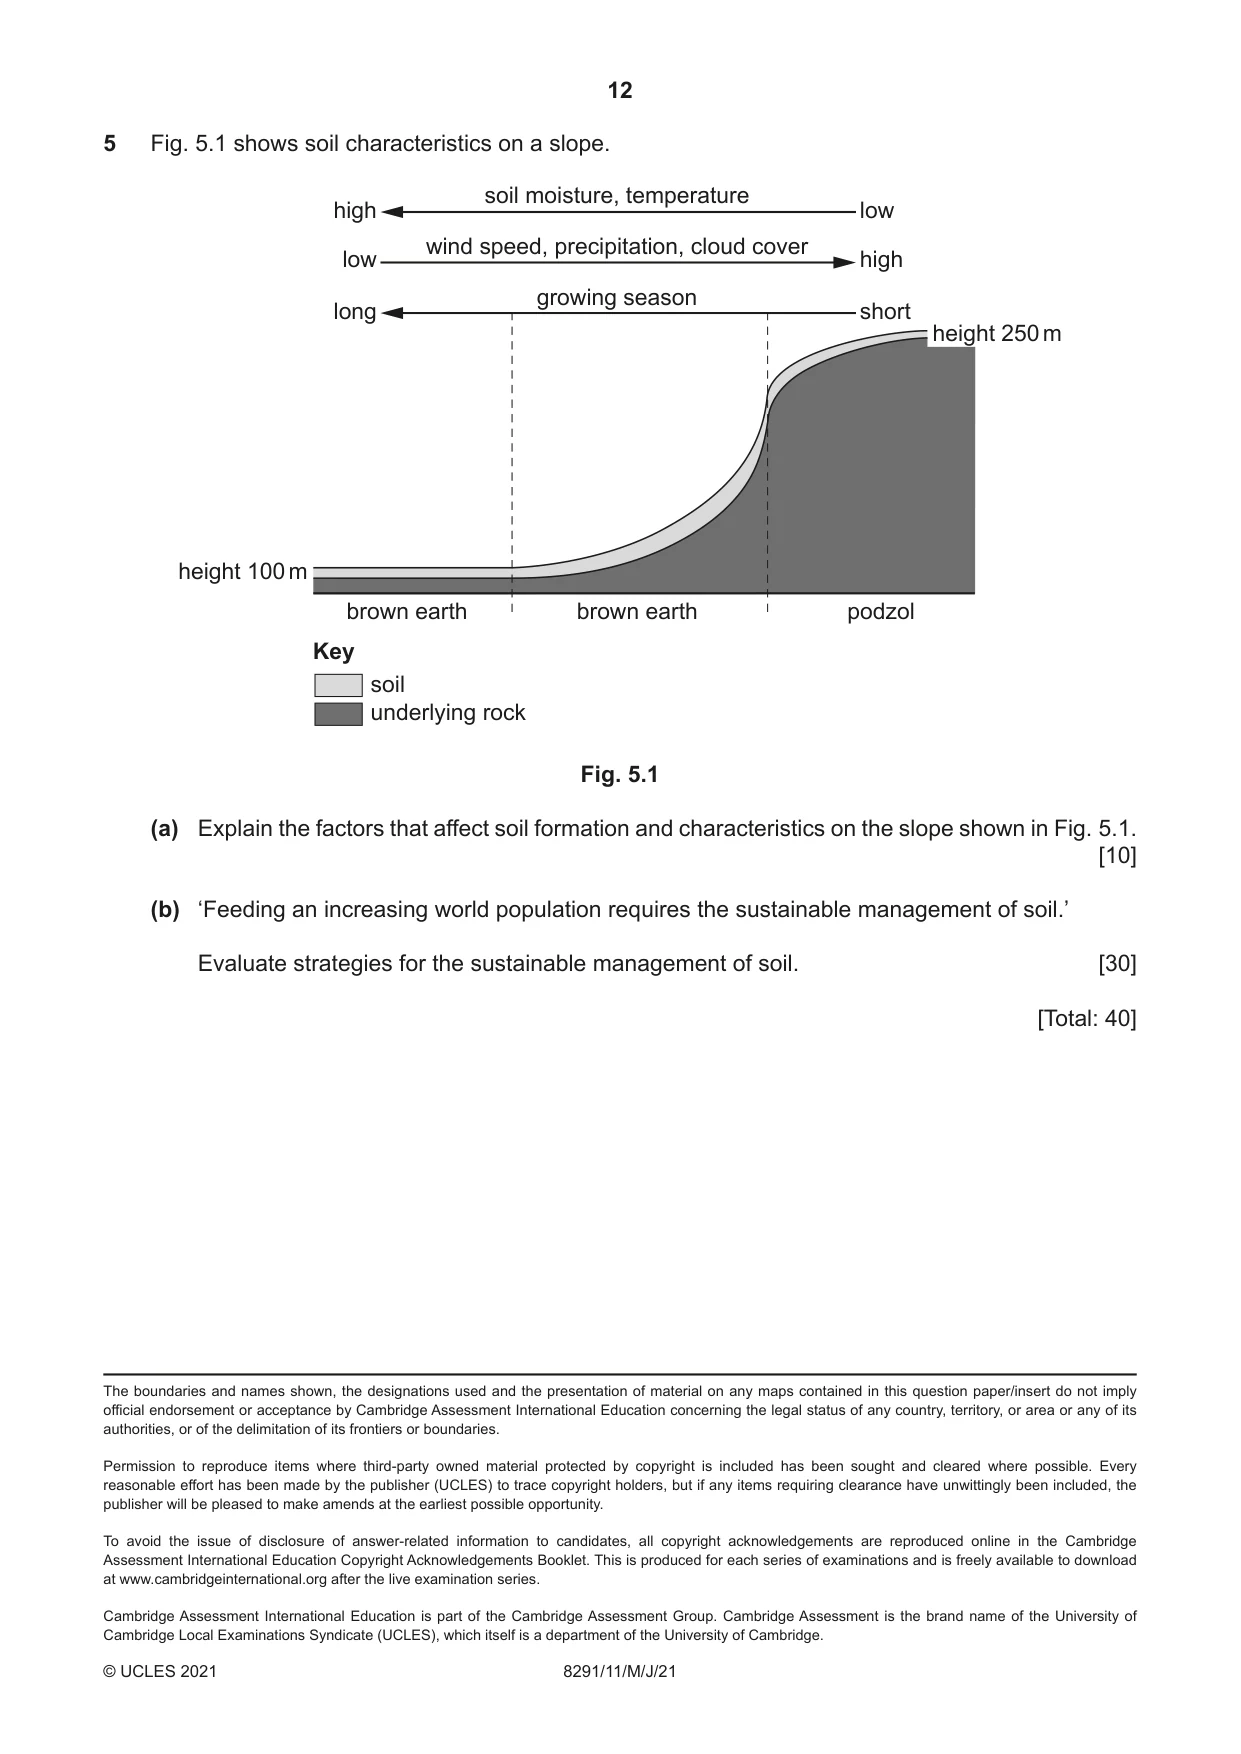
12 8291/11/M/J/21 © UCLES 2021 5 Fig. 5.1 shows soil characteristics on a slope. height 250 m height 100 m brown earth brown earth Key soil underlying rock podzol high low long low high short soil moisture, temperature wind speed, precipitation, cloud cover growing season Fig. 5.1 (a) Explain the factors that affect soil formation and characteristics on the slope shown in Fig. 5.1. [10] (b) ‘Feeding an increasing world population requires the sustainable management of soil.’ Evaluate strategies for the sustainable management of soil. [30] [Total: 40] The boundaries and names shown, the designations used and the presentation of material on any maps contained in this question paper/insert do not imply official endorsement or acceptance by Cambridge Assessment International Education concerning the legal status of any country, territory, or area or any of its authorities, or of the delimitation of its frontiers or boundaries. Permission to reproduce items where third-party owned material protected by copyright is included has been sought and cleared where possible. Every reasonable effort has been made by the publisher (UCLES) to trace copyright holders, but if any items requiring clearance have unwittingly been included, the publisher will be pleased to make amends at the earliest possible opportunity. To avoid the issue of disclosure of answer-related information to candidates, all copyright acknowledgements are reproduced online in the Cambridge Assessment International Education Copyright Acknowledgements Booklet. This is produced for each series of examinations and is freely available to download at www.cambridgeinternational.org after the live examination series. Cambridge Assessment International Education is part of the Cambridge Assessment Group. Cambridge Assessment is the brand name of the University of Cambridge Local Examinations Syndicate (UCLES), which itself is a department of the University of Cambridge.
Mark scheme, page 1
This document consists of 18 printed pages. © UCLES 2021 [Turn over Cambridge International AS Level ENVIRONMENTAL MANAGEMENT 8291/11 Paper 1 May/June 2021 MARK SCHEME Maximum Mark: 80 Published This mark scheme is published as an aid to teachers and candidates, to indicate the requirements of the examination. It shows the basis on which Examiners were instructed to award marks. It does not indicate the details of the discussions that took place at an Examiners’ meeting before marking began, which would have considered the acceptability of alternative answers. Mark schemes should be read in conjunction with the question paper and the Principal Examiner Report for Teachers. Cambridge International will not enter into discussions about these mark schemes. Cambridge International is publishing the mark schemes for the May/June 2021 series for most Cambridge IGCSE™, Cambridge International A and AS Level components and some Cambridge O Level components.
Mark scheme, page 2
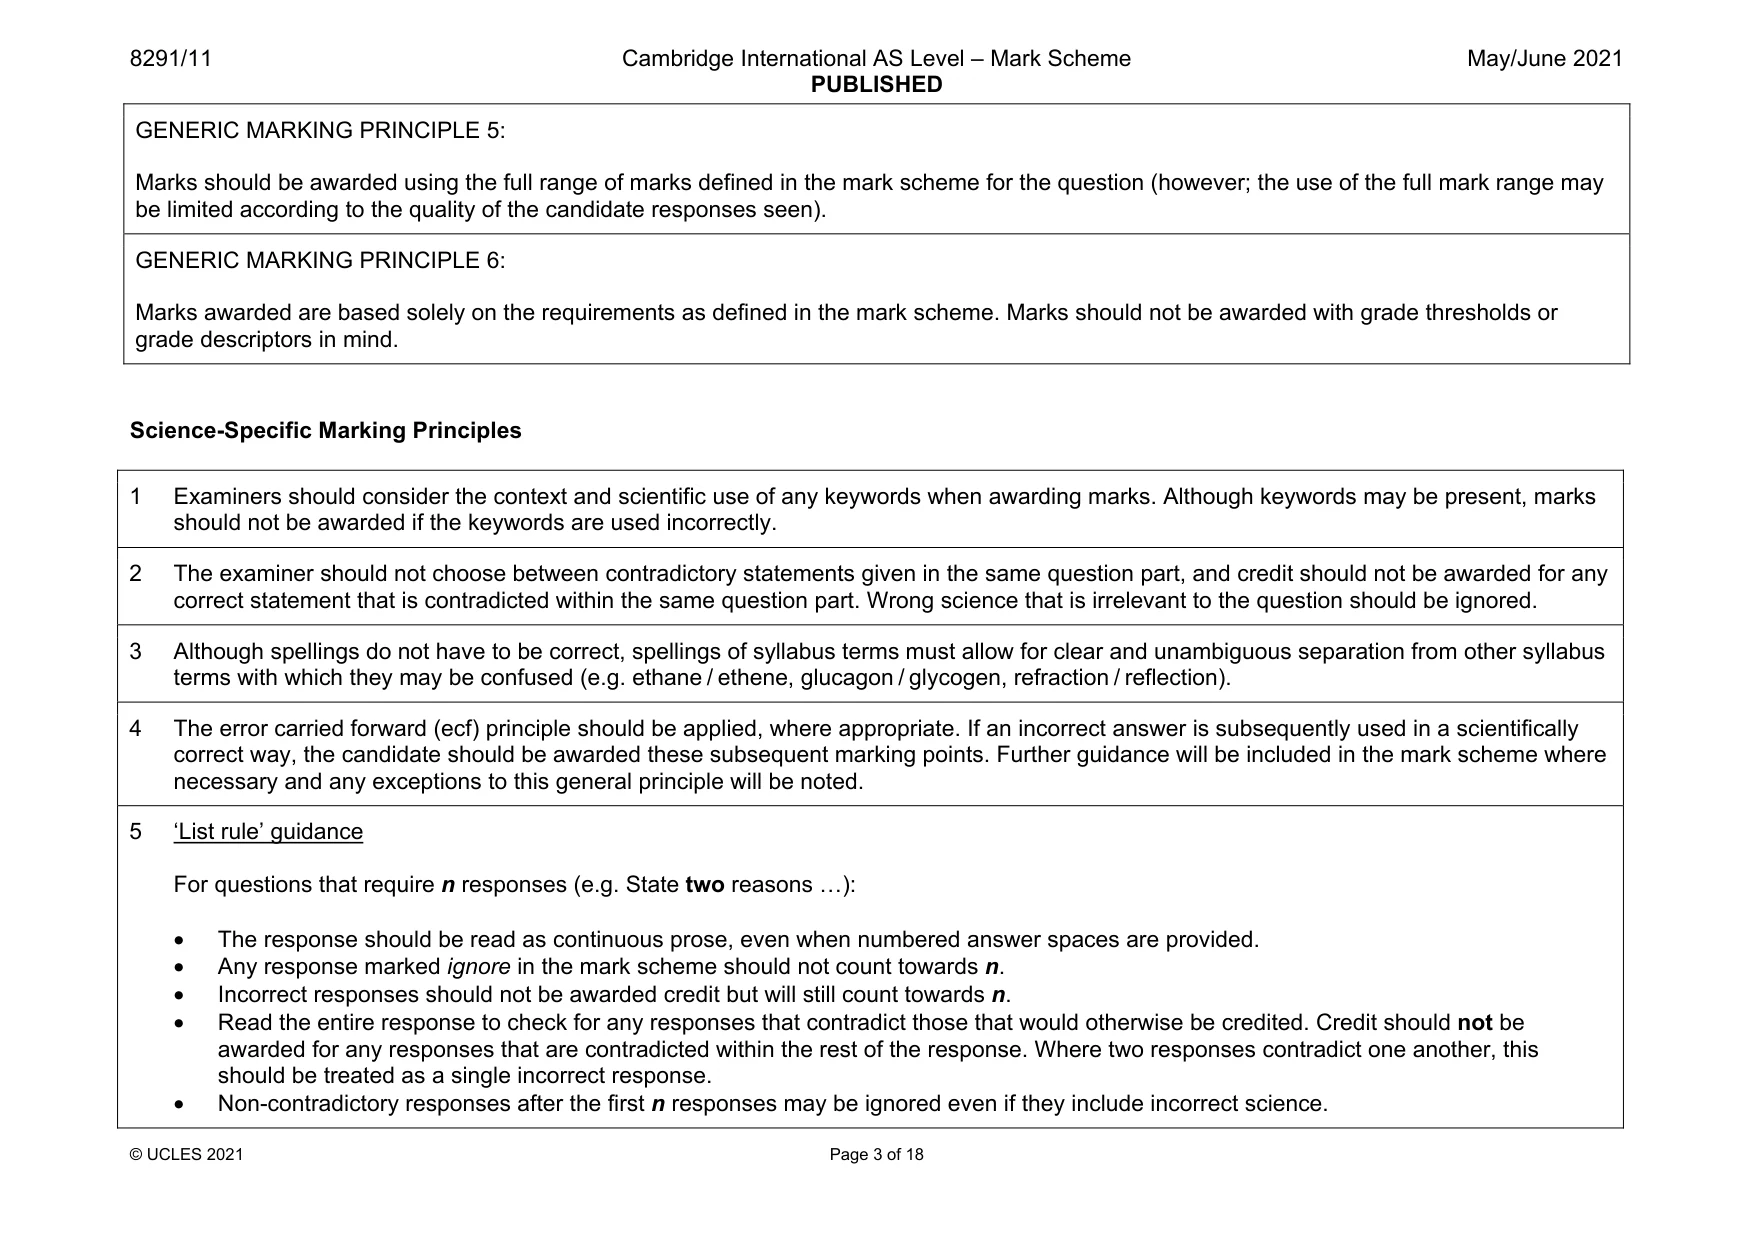
8291/11 Cambridge International AS Level – Mark Scheme PUBLISHED May/June 2021 © UCLES 2021 Page 2 of 18 Generic Marking Principles These general marking principles must be applied by all examiners when marking candidate answers. They should be applied alongside the specific content of the mark scheme or generic level descriptors for a question. Each question paper and mark scheme will also comply with these marking principles. GENERIC MARKING PRINCIPLE 1: Marks must be awarded in line with: • the specific content of the mark scheme or the generic level descriptors for the question • the specific skills defined in the mark scheme or in the generic level descriptors for the question • the standard of response required by a candidate as exemplified by the standardisation scripts. GENERIC MARKING PRINCIPLE 2: Marks awarded are always whole marks (not half marks, or other fractions). GENERIC MARKING PRINCIPLE 3: Marks must be awarded positively: • marks are awarded for correct/valid answers, as defined in the mark scheme. However, credit is given for valid answers which go beyond the scope of the syllabus and mark scheme, referring to your Team Leader as appropriate • marks are awarded when candidates clearly demonstrate what they know and can do • marks are not deducted for errors • marks are not deducted for omissions • answers should only be judged on the quality of spelling, punctuation and grammar when these features are specifically assessed by the question as indicated by the mark scheme. The meaning, however, should be unambiguous. GENERIC MARKING PRINCIPLE 4: Rules must be applied consistently, e.g. in situations where candidates have not followed instructions or in the application of generic level descriptors.
Mark scheme, page 3
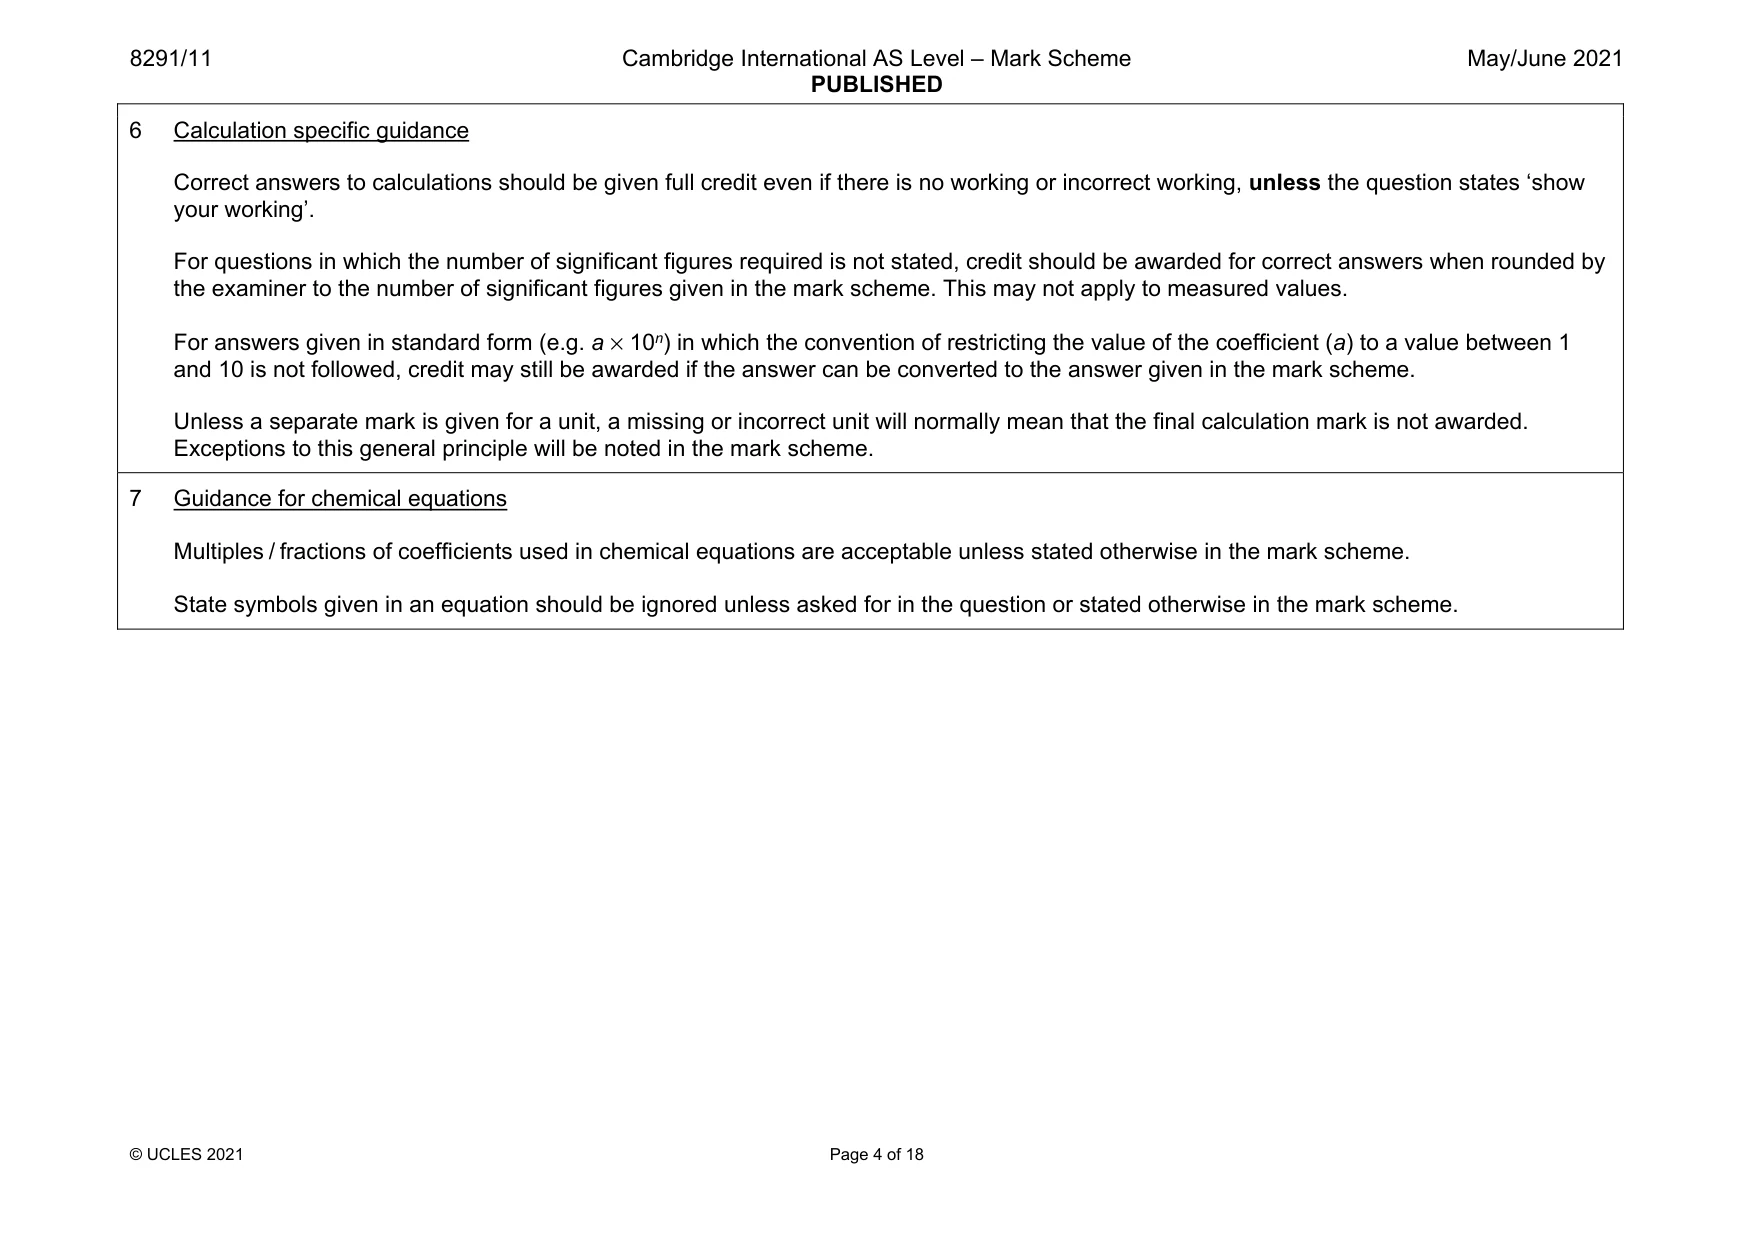
8291/11 Cambridge International AS Level – Mark Scheme PUBLISHED May/June 2021 © UCLES 2021 Page 3 of 18 GENERIC MARKING PRINCIPLE 5: Marks should be awarded using the full range of marks defined in the mark scheme for the question (however; the use of the full mark range may be limited according to the quality of the candidate responses seen). GENERIC MARKING PRINCIPLE 6: Marks awarded are based solely on the requirements as defined in the mark scheme. Marks should not be awarded with grade thresholds or grade descriptors in mind. Science-Specific Marking Principles 1 Examiners should consider the context and scientific use of any keywords when awarding marks. Although keywords may be present, marks should not be awarded if the keywords are used incorrectly. 2 The examiner should not choose between contradictory statements given in the same question part, and credit should not be awarded for any correct statement that is contradicted within the same question part. Wrong science that is irrelevant to the question should be ignored. 3 Although spellings do not have to be correct, spellings of syllabus terms must allow for clear and unambiguous separation from other syllabus terms with which they may be confused (e.g. ethane / ethene, glucagon / glycogen, refraction / reflection). 4 The error carried forward (ecf) principle should be applied, where appropriate. If an incorrect answer is subsequently used in a scientifically correct way, the candidate should be awarded these subsequent marking points. Further guidance will be included in the mark scheme where necessary and any exceptions to this general principle will be noted. 5 ‘List rule’ guidance For questions that require n responses (e.g. State two reasons …): • The response should be read as continuous prose, even when numbered answer spaces are provided. • Any response marked ignore in the mark scheme should not count towards n. • Incorrect responses should not be awarded credit but will still count towards n. • Read the entire response to check for any responses that contradict those that would otherwise be credited. Credit should not be awarded for any responses that are contradicted within the rest of the response. Where two responses contradict one another, this should be treated as a single incorrect response. • Non-contradictory responses after the first n responses may be ignored even if they include incorrect science.
Mark scheme, page 4
8291/11 Cambridge International AS Level – Mark Scheme PUBLISHED May/June 2021 © UCLES 2021 Page 4 of 18 6 Calculation specific guidance Correct answers to calculations should be given full credit even if there is no working or incorrect working, unless the question states ‘show your working’. For questions in which the number of significant figures required is not stated, credit should be awarded for correct answers when rounded by the examiner to the number of significant figures given in the mark scheme. This may not apply to measured values. For answers given in standard form (e.g. a × 10n) in which the convention of restricting the value of the coefficient (a) to a value between 1 and 10 is not followed, credit may still be awarded if the answer can be converted to the answer given in the mark scheme. Unless a separate mark is given for a unit, a missing or incorrect unit will normally mean that the final calculation mark is not awarded. Exceptions to this general principle will be noted in the mark scheme. 7 Guidance for chemical equations Multiples / fractions of coefficients used in chemical equations are acceptable unless stated otherwise in the mark scheme. State symbols given in an equation should be ignored unless asked for in the question or stated otherwise in the mark scheme.
Mark scheme, page 5
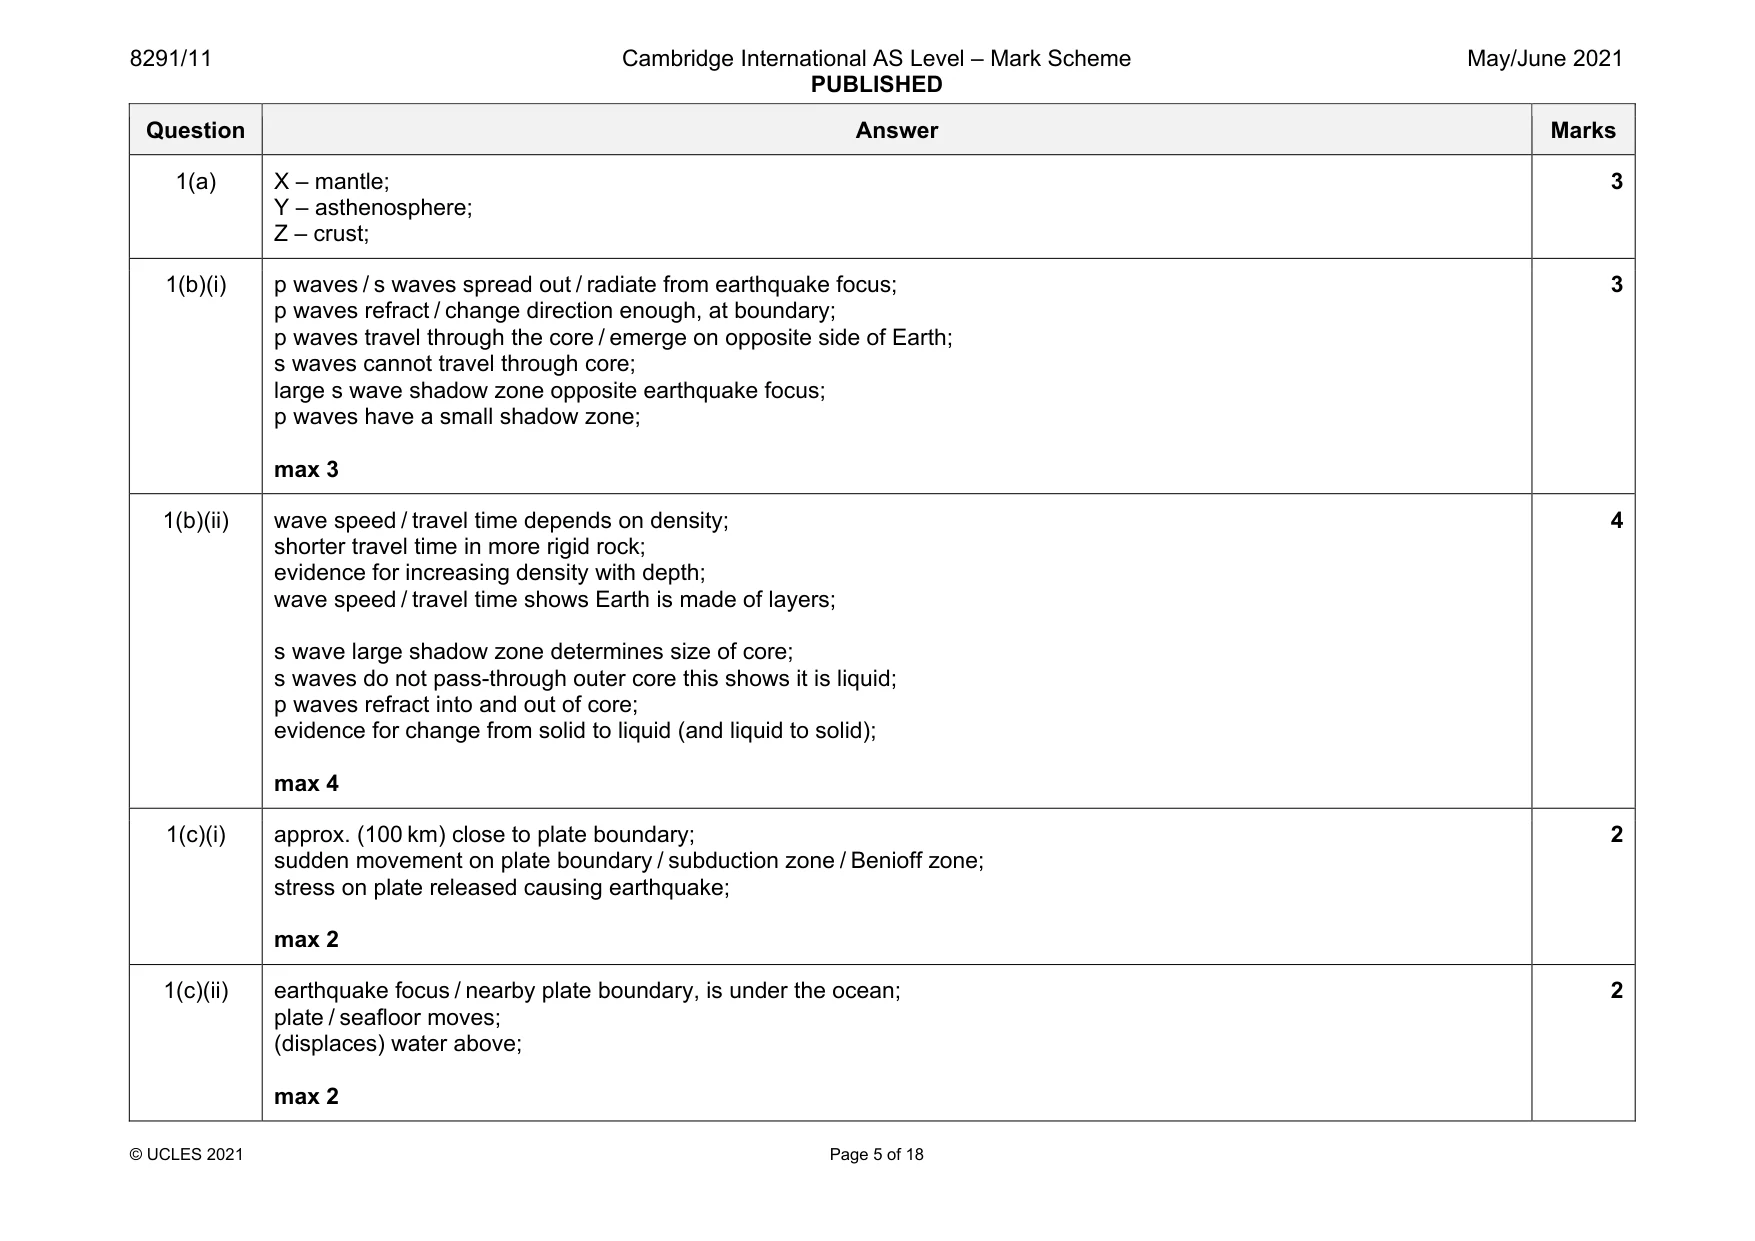
8291/11 Cambridge International AS Level – Mark Scheme PUBLISHED May/June 2021 © UCLES 2021 Page 5 of 18 Question Answer Marks 1(a) X – mantle; Y – asthenosphere; Z – crust; 3 1(b)(i) p waves / s waves spread out / radiate from earthquake focus; p waves refract / change direction enough, at boundary; p waves travel through the core / emerge on opposite side of Earth; s waves cannot travel through core; large s wave shadow zone opposite earthquake focus; p waves have a small shadow zone; max 3 3 1(b)(ii) wave speed / travel time depends on density; shorter travel time in more rigid rock; evidence for increasing density with depth; wave speed / travel time shows Earth is made of layers; s wave large shadow zone determines size of core; s waves do not pass-through outer core this shows it is liquid; p waves refract into and out of core; evidence for change from solid to liquid (and liquid to solid); max 4 4 1(c)(i) approx. (100 km) close to plate boundary; sudden movement on plate boundary / subduction zone / Benioff zone; stress on plate released causing earthquake; max 2 2 1(c)(ii) earthquake focus / nearby plate boundary, is under the ocean; plate / seafloor moves; (displaces) water above; max 2 2
Mark scheme, page 6
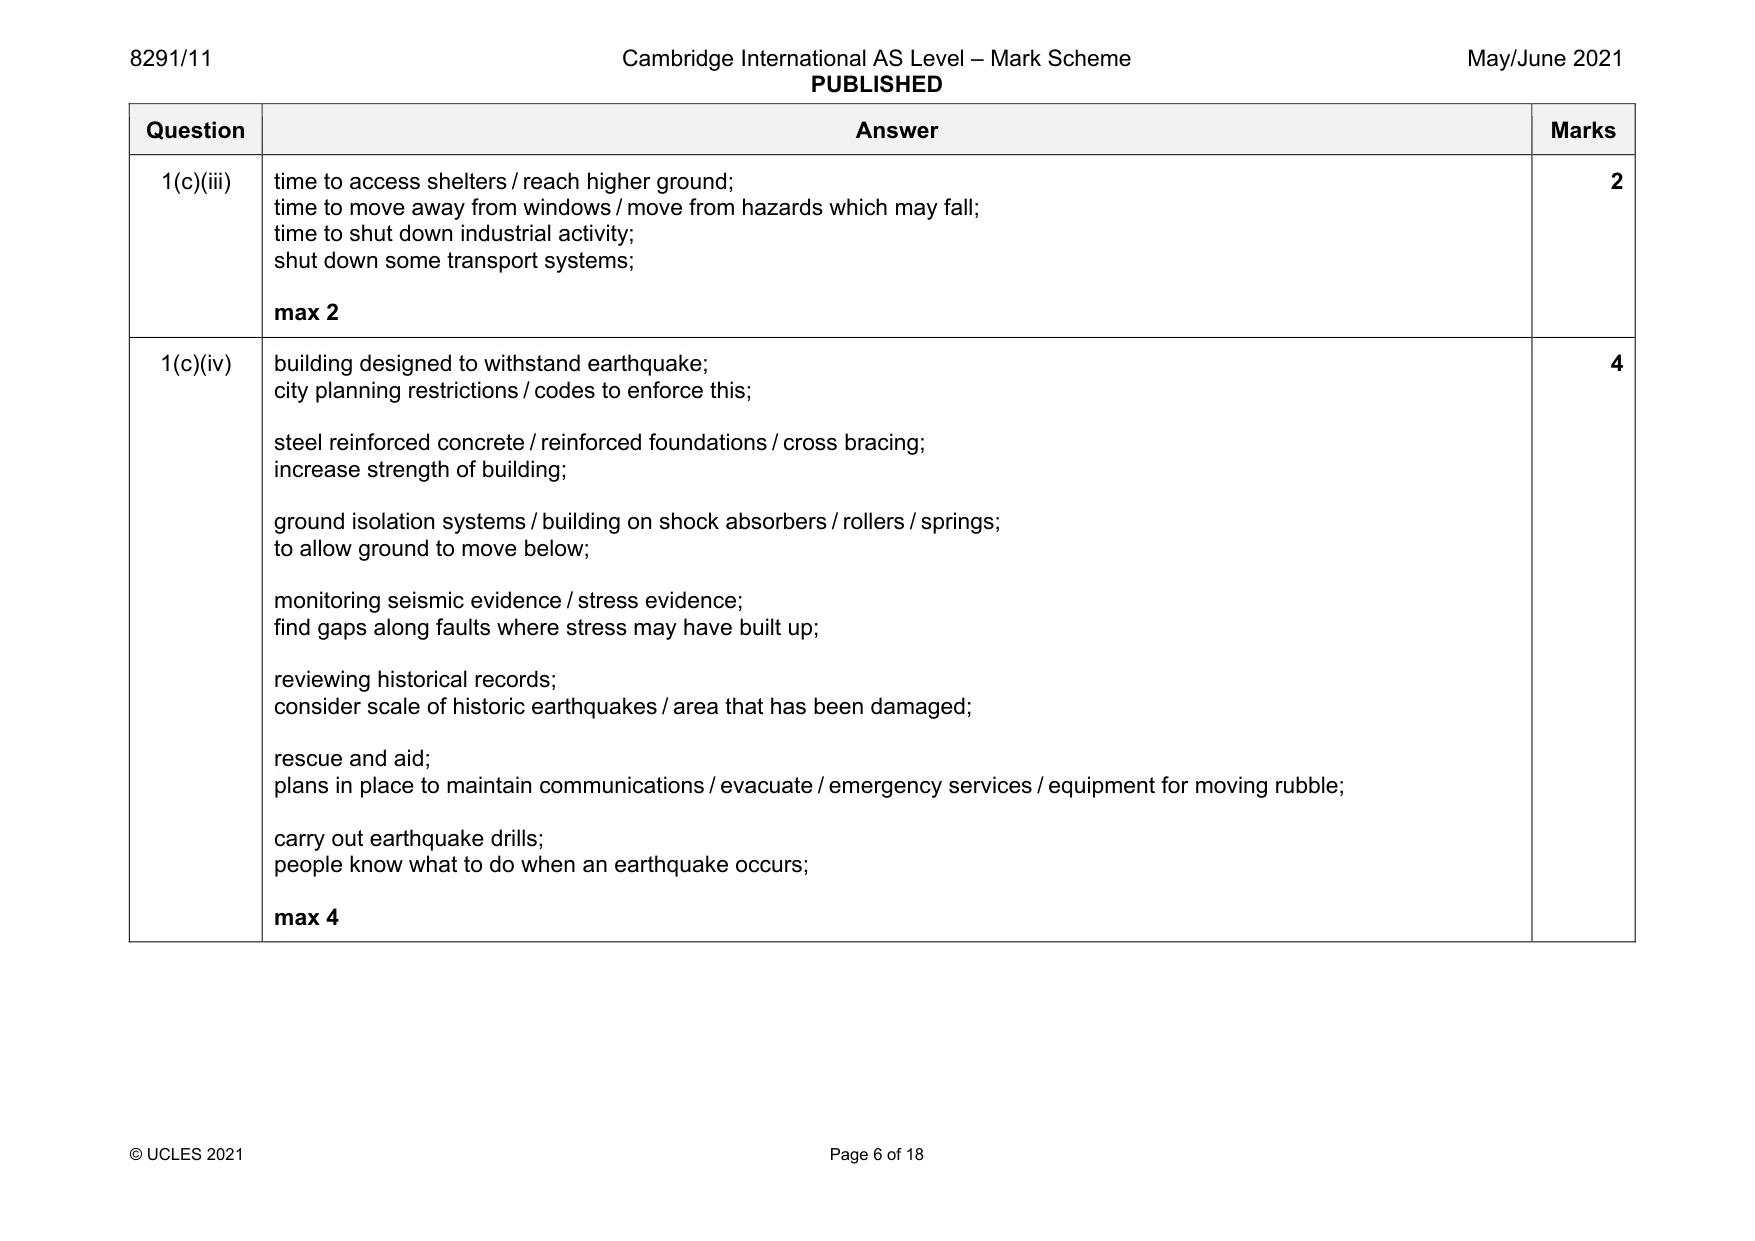
8291/11 Cambridge International AS Level – Mark Scheme PUBLISHED May/June 2021 © UCLES 2021 Page 6 of 18 Question Answer Marks 1(c)(iii) time to access shelters / reach higher ground; time to move away from windows / move from hazards which may fall; time to shut down industrial activity; shut down some transport systems; max 2 2 1(c)(iv) building designed to withstand earthquake; city planning restrictions / codes to enforce this; steel reinforced concrete / reinforced foundations / cross bracing; increase strength of building; ground isolation systems / building on shock absorbers / rollers / springs; to allow ground to move below; monitoring seismic evidence / stress evidence; find gaps along faults where stress may have built up; reviewing historical records; consider scale of historic earthquakes / area that has been damaged; rescue and aid; plans in place to maintain communications / evacuate / emergency services / equipment for moving rubble; carry out earthquake drills; people know what to do when an earthquake occurs; max 4 4
Mark scheme, page 7
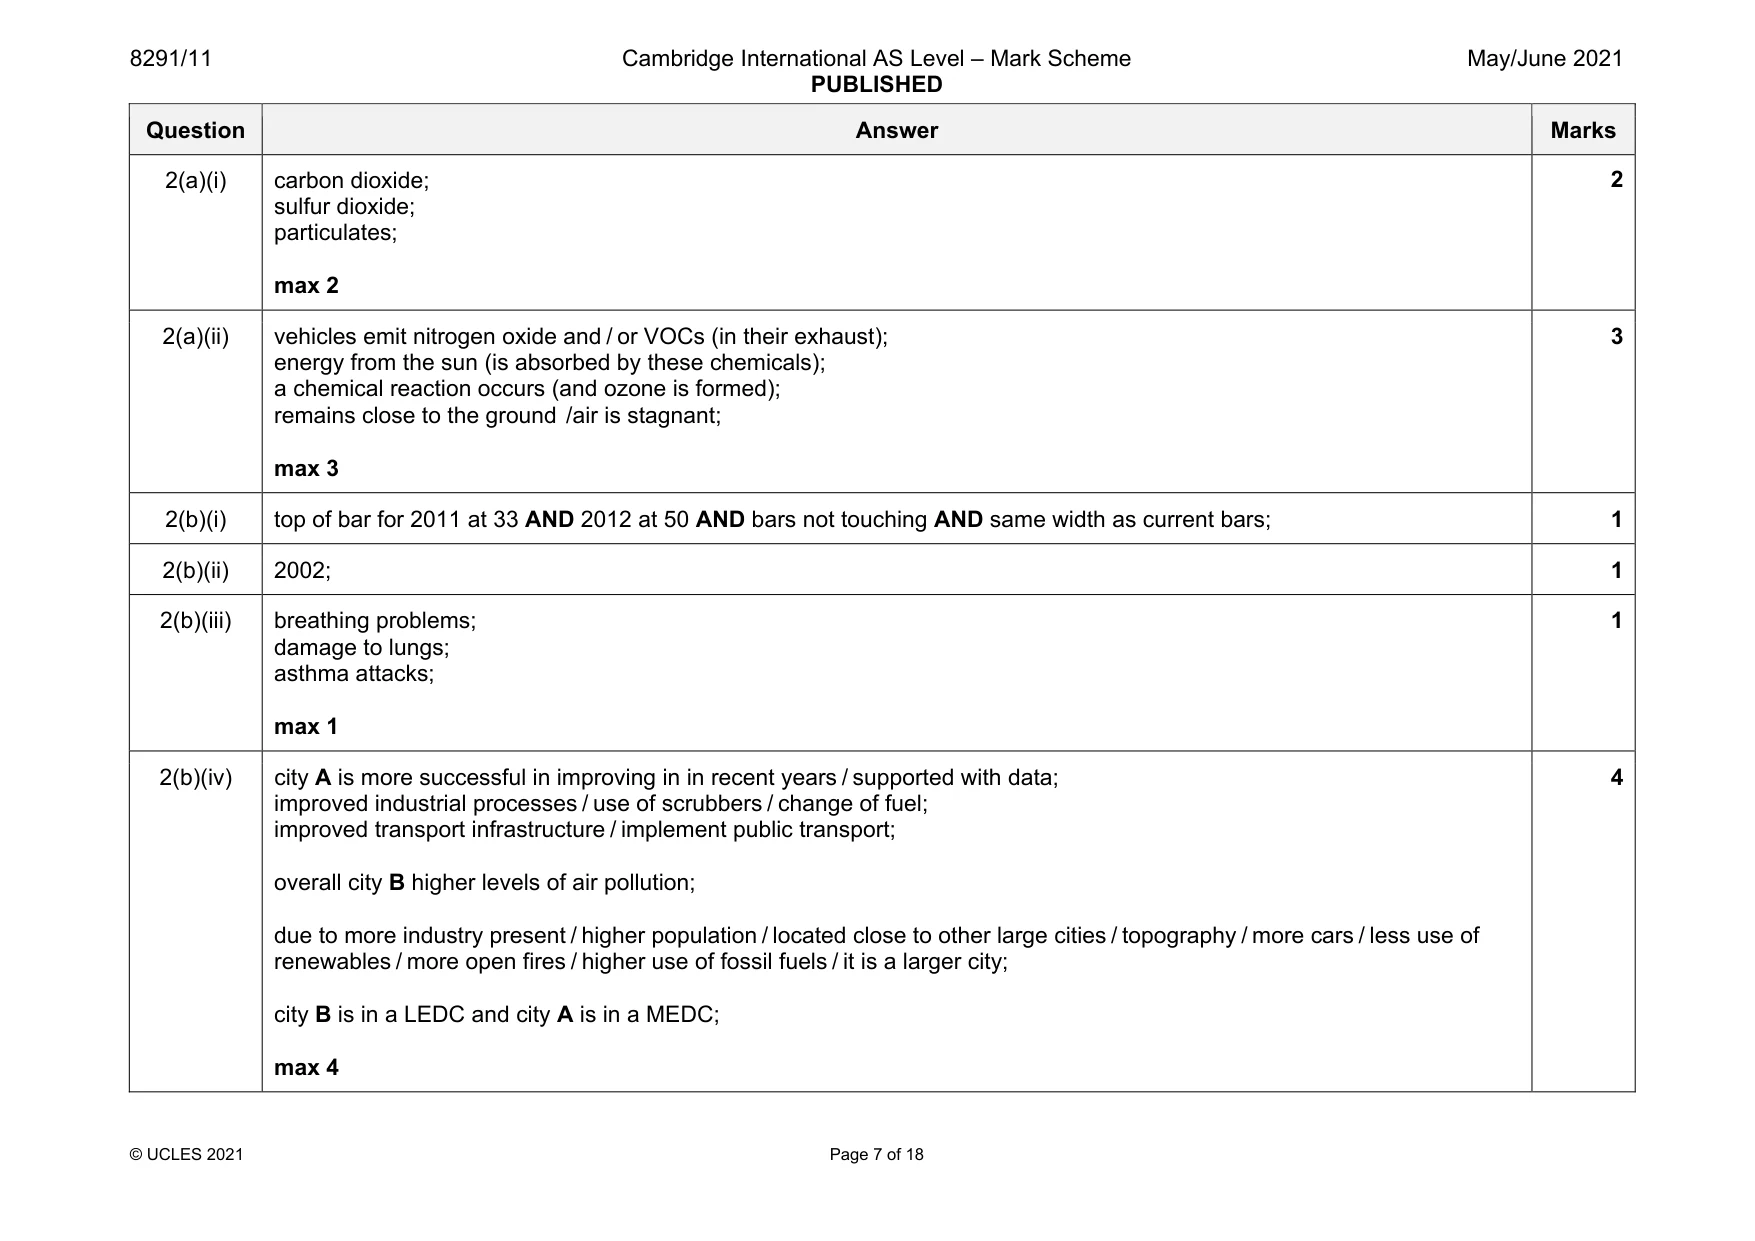
8291/11 Cambridge International AS Level – Mark Scheme PUBLISHED May/June 2021 © UCLES 2021 Page 7 of 18 Question Answer Marks 2(a)(i) carbon dioxide; sulfur dioxide; particulates; max 2 2 2(a)(ii) vehicles emit nitrogen oxide and / or VOCs (in their exhaust); energy from the sun (is absorbed by these chemicals); a chemical reaction occurs (and ozone is formed); remains close to the ground /air is stagnant; max 3 3 2(b)(i) top of bar for 2011 at 33 AND 2012 at 50 AND bars not touching AND same width as current bars; 1 2(b)(ii) 2002; 1 2(b)(iii) breathing problems; damage to lungs; asthma attacks; max 1 1 2(b)(iv) city A is more successful in improving in in recent years / supported with data; improved industrial processes / use of scrubbers / change of fuel; improved transport infrastructure / implement public transport; overall city B higher levels of air pollution; due to more industry present / higher population / located close to other large cities / topography / more cars / less use of renewables / more open fires / higher use of fossil fuels / it is a larger city; city B is in a LEDC and city A is in a MEDC; max 4 4
Mark scheme, page 8
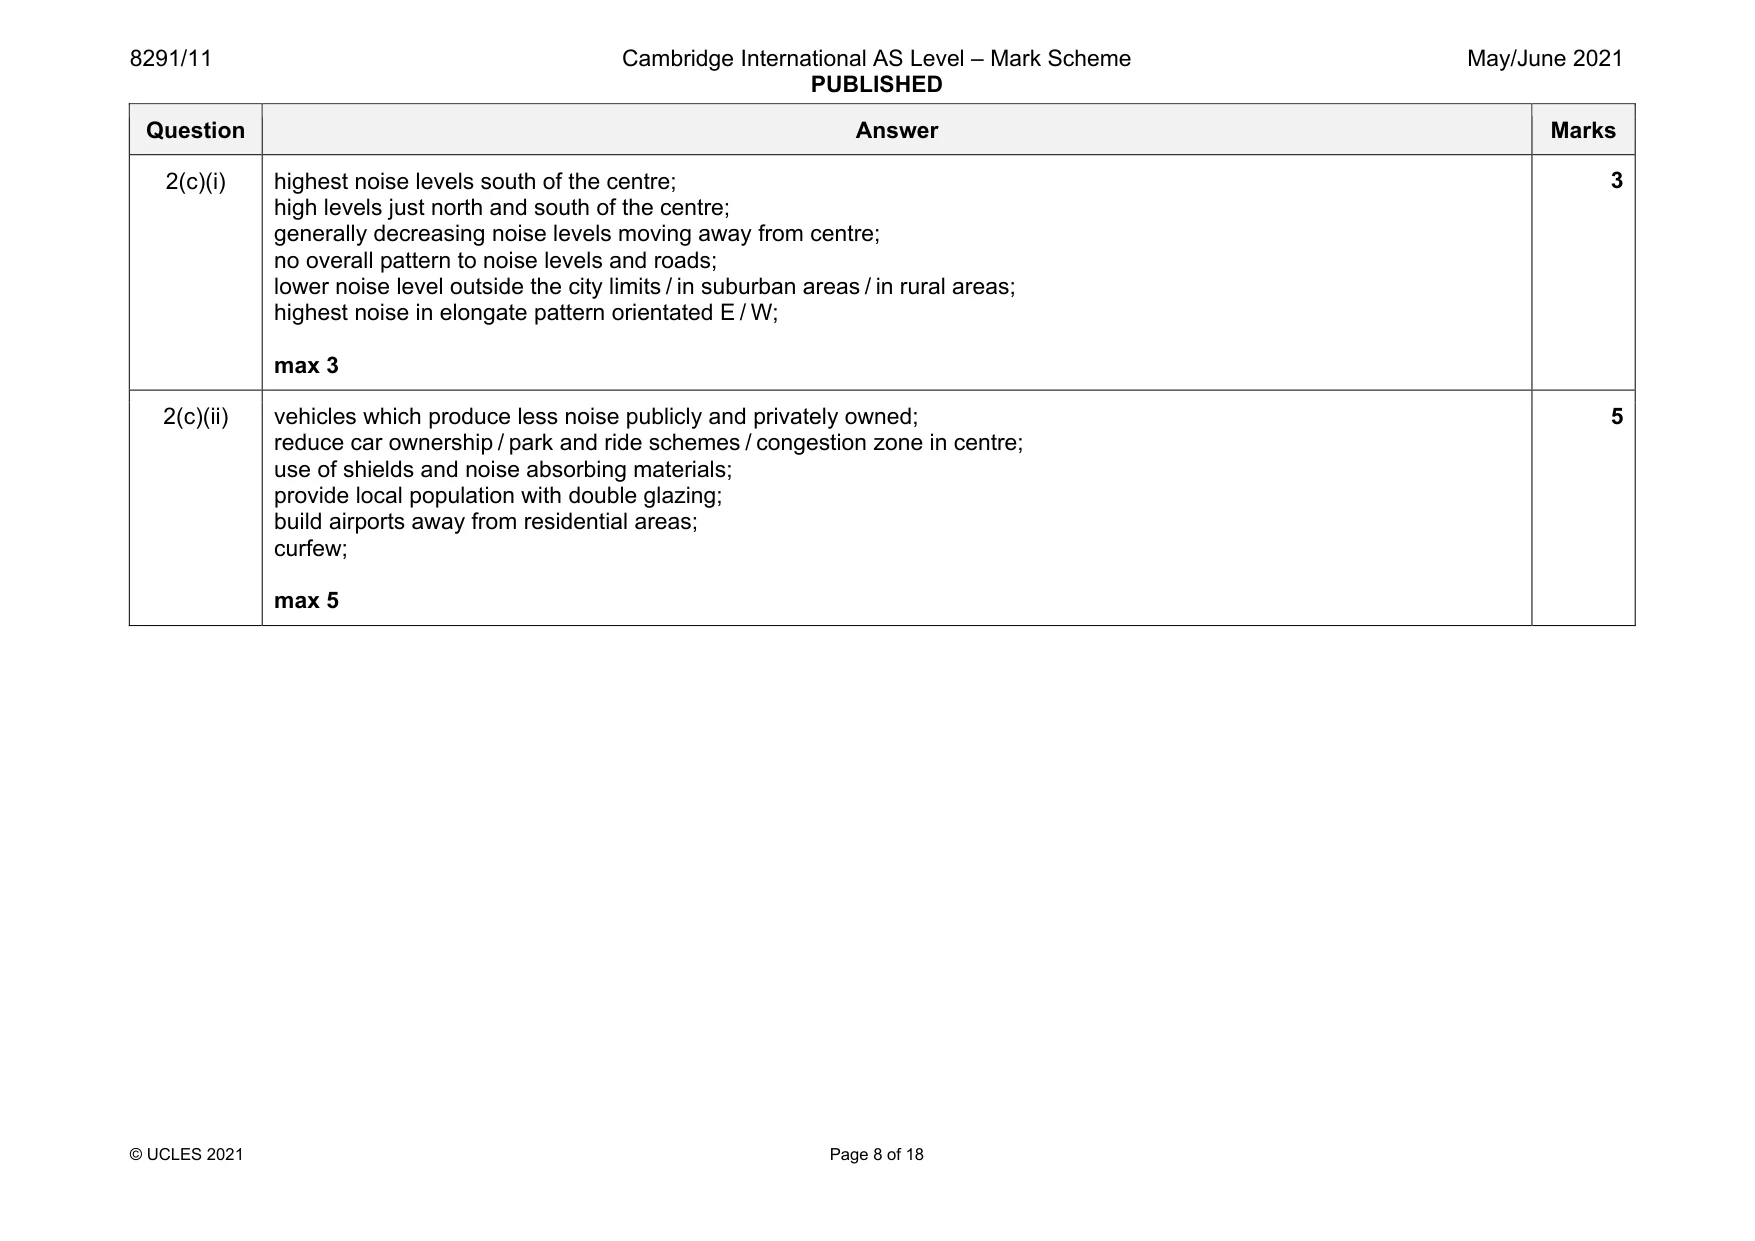
8291/11 Cambridge International AS Level – Mark Scheme PUBLISHED May/June 2021 © UCLES 2021 Page 8 of 18 Question Answer Marks 2(c)(i) highest noise levels south of the centre; high levels just north and south of the centre; generally decreasing noise levels moving away from centre; no overall pattern to noise levels and roads; lower noise level outside the city limits / in suburban areas / in rural areas; highest noise in elongate pattern orientated E / W; max 3 3 2(c)(ii) vehicles which produce less noise publicly and privately owned; reduce car ownership / park and ride schemes / congestion zone in centre; use of shields and noise absorbing materials; provide local population with double glazing; build airports away from residential areas; curfew; max 5 5
Mark scheme, page 9
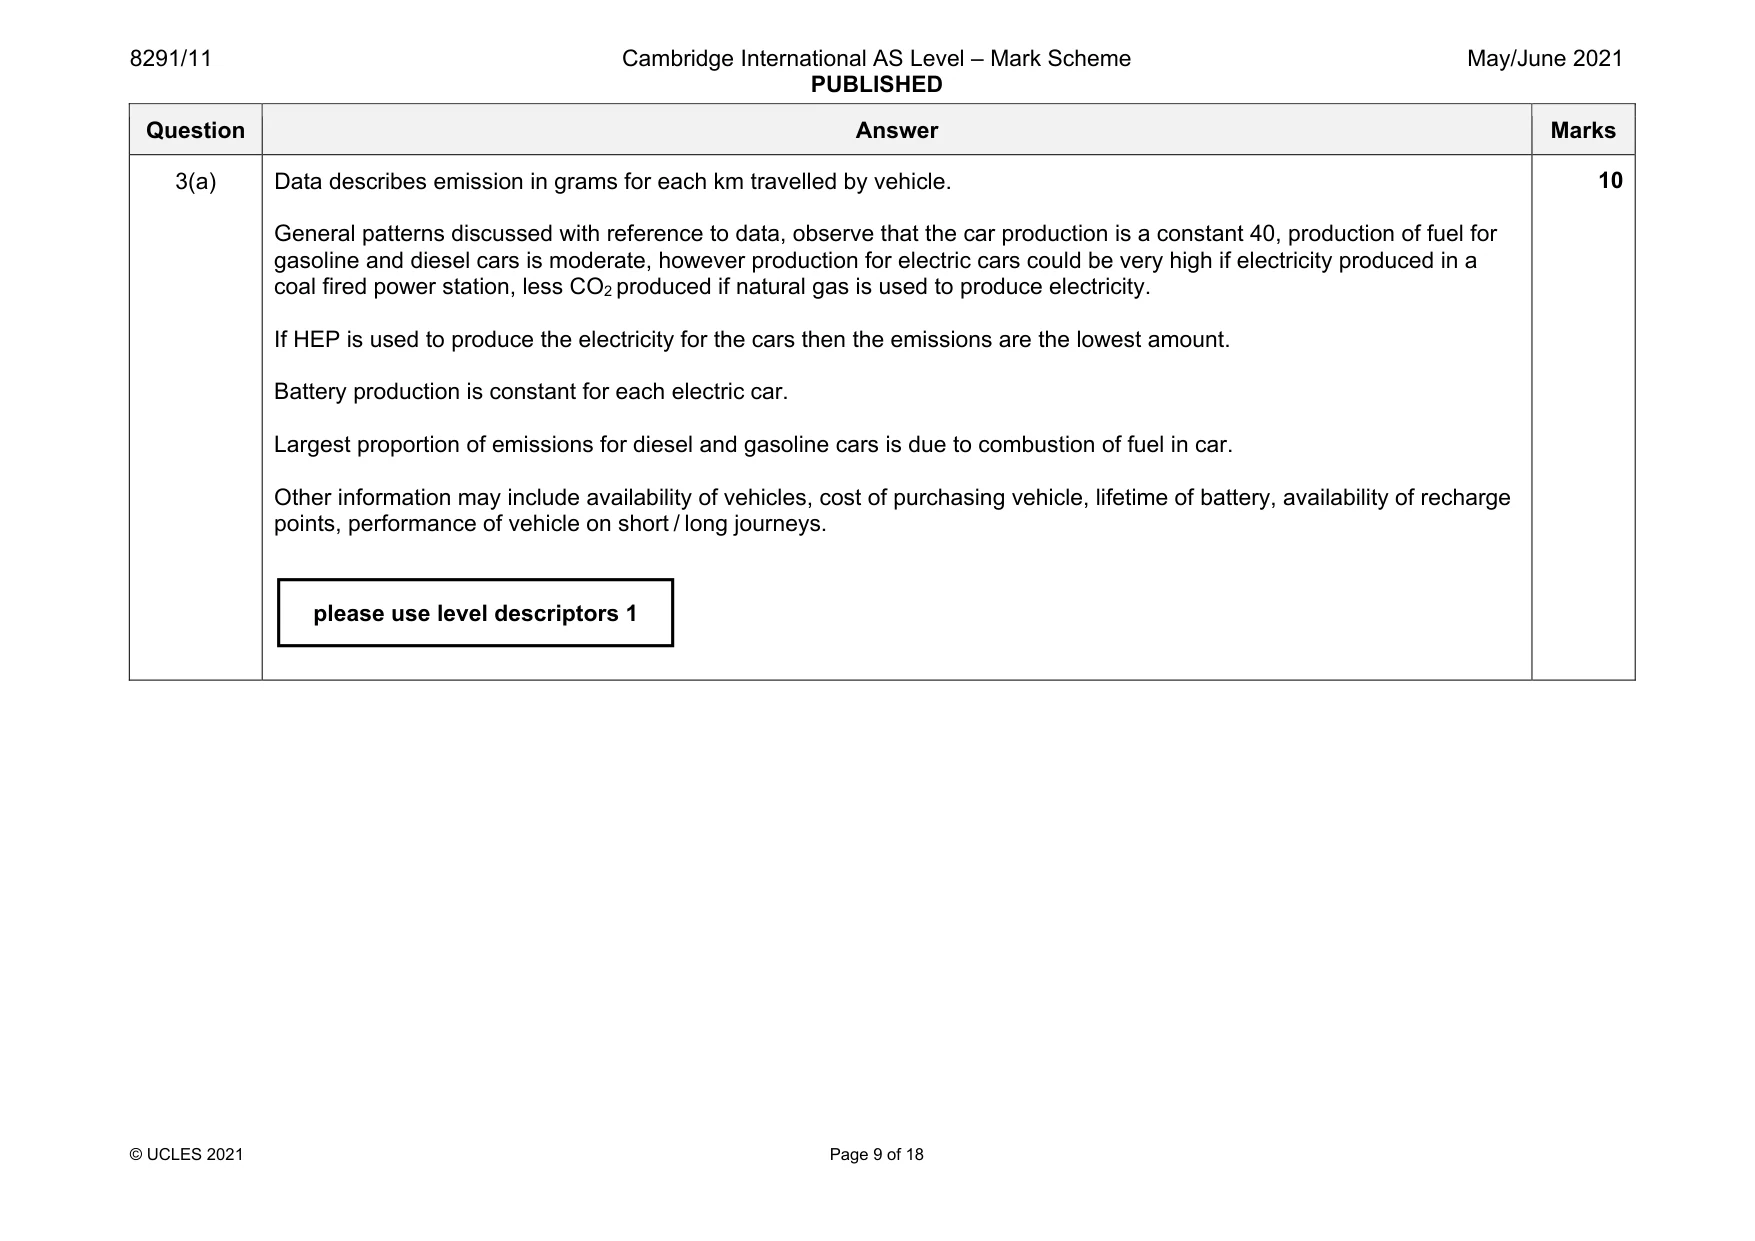
8291/11 Cambridge International AS Level – Mark Scheme PUBLISHED May/June 2021 © UCLES 2021 Page 9 of 18 Question Answer Marks 3(a) Data describes emission in grams for each km travelled by vehicle. General patterns discussed with reference to data, observe that the car production is a constant 40, production of fuel for gasoline and diesel cars is moderate, however production for electric cars could be very high if electricity produced in a coal fired power station, less CO2 produced if natural gas is used to produce electricity. If HEP is used to produce the electricity for the cars then the emissions are the lowest amount. Battery production is constant for each electric car. Largest proportion of emissions for diesel and gasoline cars is due to combustion of fuel in car. Other information may include availability of vehicles, cost of purchasing vehicle, lifetime of battery, availability of recharge points, performance of vehicle on short / long journeys. 10 please use level descriptors 1
Mark scheme, page 10
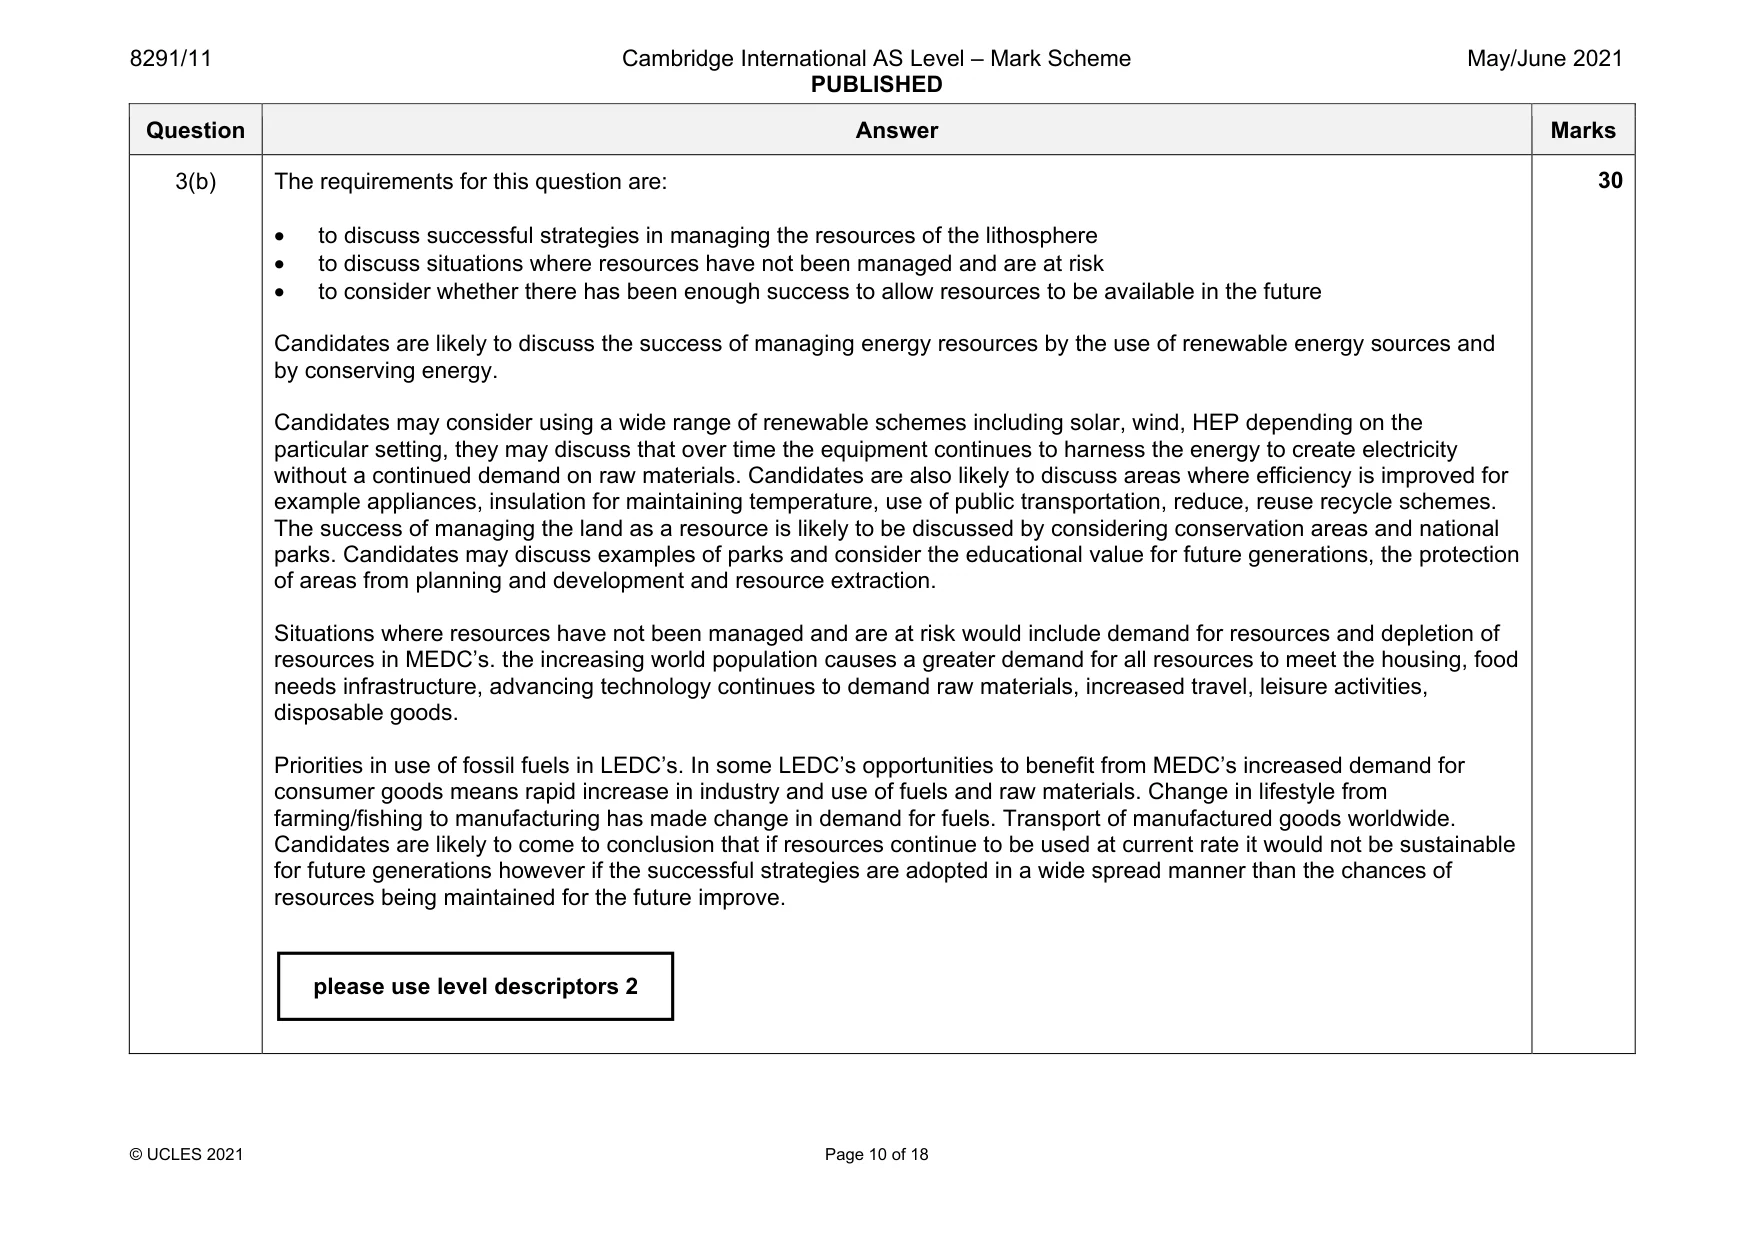
8291/11 Cambridge International AS Level – Mark Scheme PUBLISHED May/June 2021 © UCLES 2021 Page 10 of 18 Question Answer Marks 3(b) The requirements for this question are: • to discuss successful strategies in managing the resources of the lithosphere • to discuss situations where resources have not been managed and are at risk • to consider whether there has been enough success to allow resources to be available in the future Candidates are likely to discuss the success of managing energy resources by the use of renewable energy sources and by conserving energy. Candidates may consider using a wide range of renewable schemes including solar, wind, HEP depending on the particular setting, they may discuss that over time the equipment continues to harness the energy to create electricity without a continued demand on raw materials. Candidates are also likely to discuss areas where efficiency is improved for example appliances, insulation for maintaining temperature, use of public transportation, reduce, reuse recycle schemes. The success of managing the land as a resource is likely to be discussed by considering conservation areas and national parks. Candidates may discuss examples of parks and consider the educational value for future generations, the protection of areas from planning and development and resource extraction. Situations where resources have not been managed and are at risk would include demand for resources and depletion of resources in MEDC’s. the increasing world population causes a greater demand for all resources to meet the housing, food needs infrastructure, advancing technology continues to demand raw materials, increased travel, leisure activities, disposable goods. Priorities in use of fossil fuels in LEDC’s. In some LEDC’s opportunities to benefit from MEDC’s increased demand for consumer goods means rapid increase in industry and use of fuels and raw materials. Change in lifestyle from farming/fishing to manufacturing has made change in demand for fuels. Transport of manufactured goods worldwide. Candidates are likely to come to conclusion that if resources continue to be used at current rate it would not be sustainable for future generations however if the successful strategies are adopted in a wide spread manner than the chances of resources being maintained for the future improve. 30 please use level descriptors 2
Mark scheme, page 11
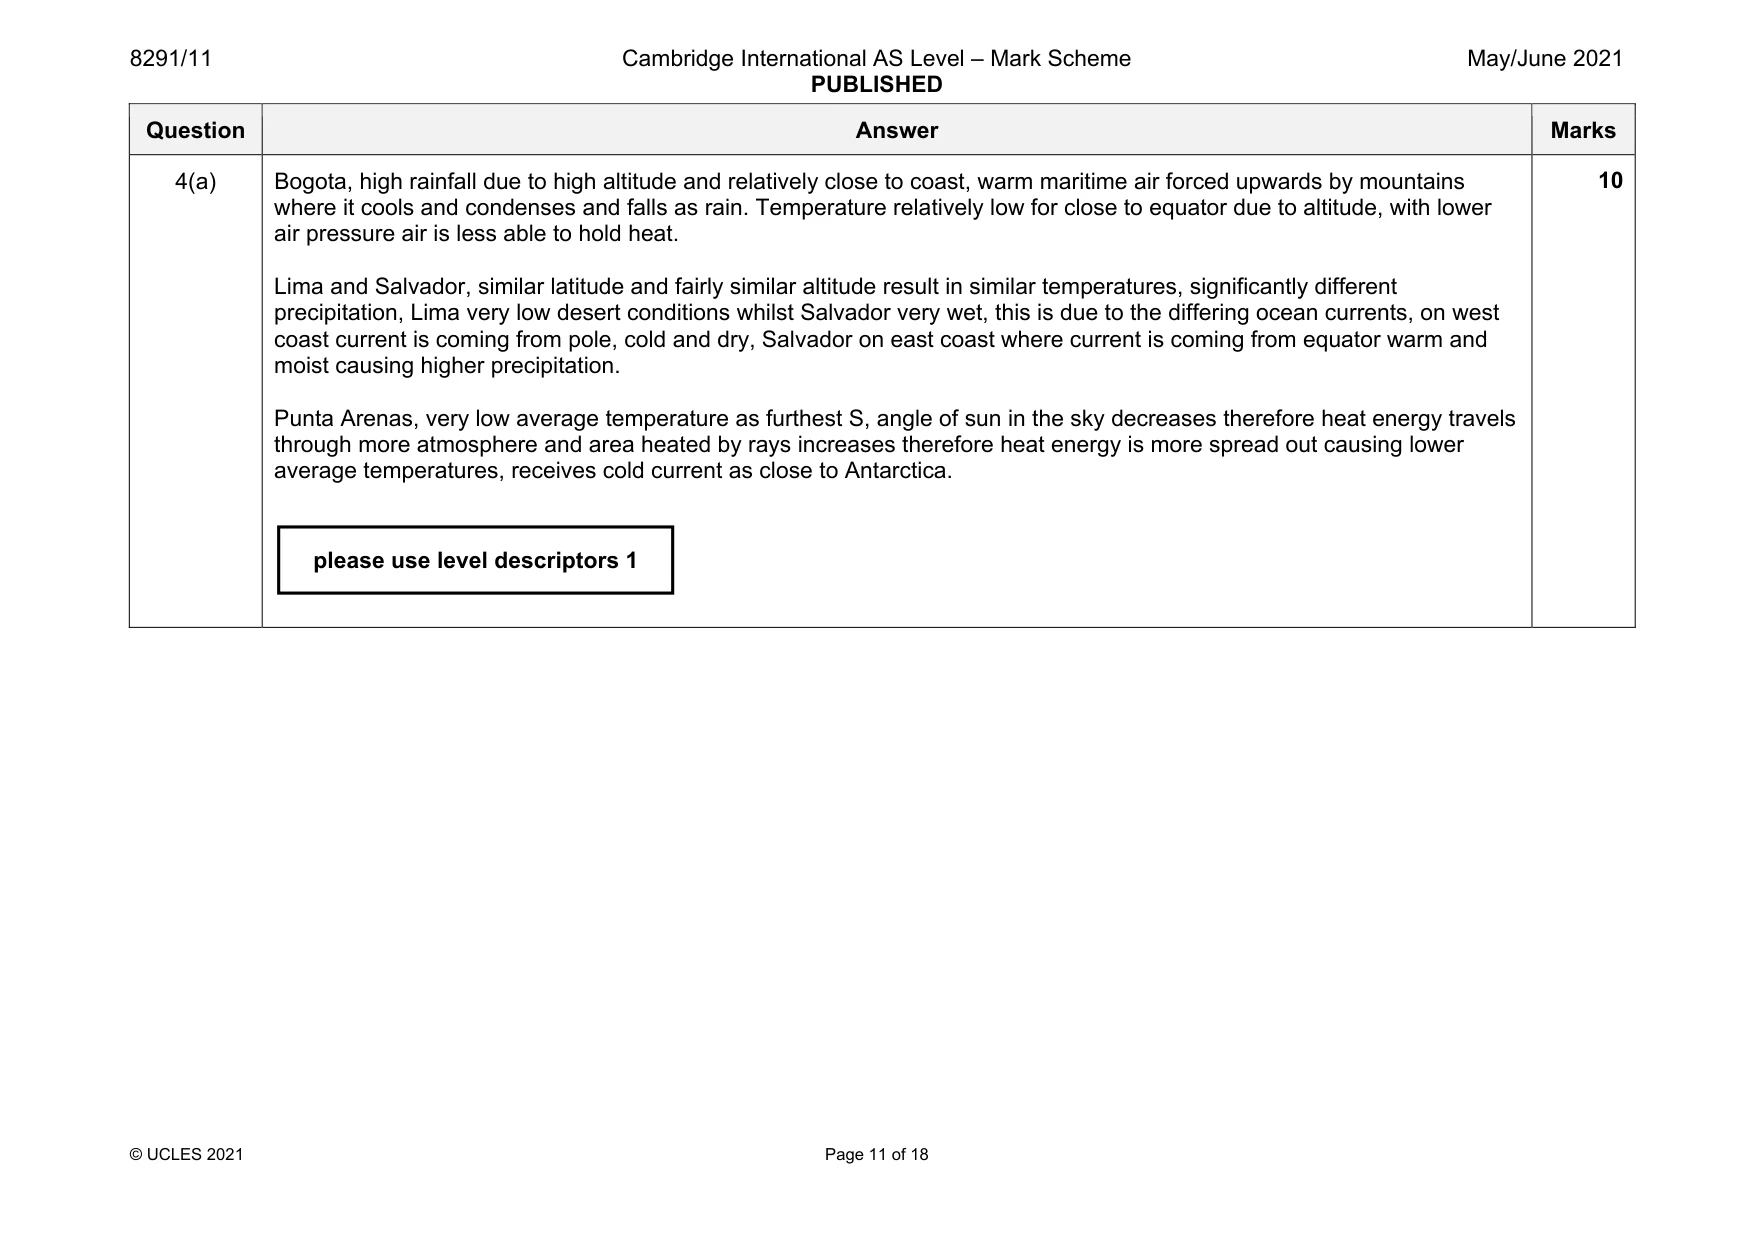
8291/11 Cambridge International AS Level – Mark Scheme PUBLISHED May/June 2021 © UCLES 2021 Page 11 of 18 Question Answer Marks 4(a) Bogota, high rainfall due to high altitude and relatively close to coast, warm maritime air forced upwards by mountains where it cools and condenses and falls as rain. Temperature relatively low for close to equator due to altitude, with lower air pressure air is less able to hold heat. Lima and Salvador, similar latitude and fairly similar altitude result in similar temperatures, significantly different precipitation, Lima very low desert conditions whilst Salvador very wet, this is due to the differing ocean currents, on west coast current is coming from pole, cold and dry, Salvador on east coast where current is coming from equator warm and moist causing higher precipitation. Punta Arenas, very low average temperature as furthest S, angle of sun in the sky decreases therefore heat energy travels through more atmosphere and area heated by rays increases therefore heat energy is more spread out causing lower average temperatures, receives cold current as close to Antarctica. 10 please use level descriptors 1
Mark scheme, page 12
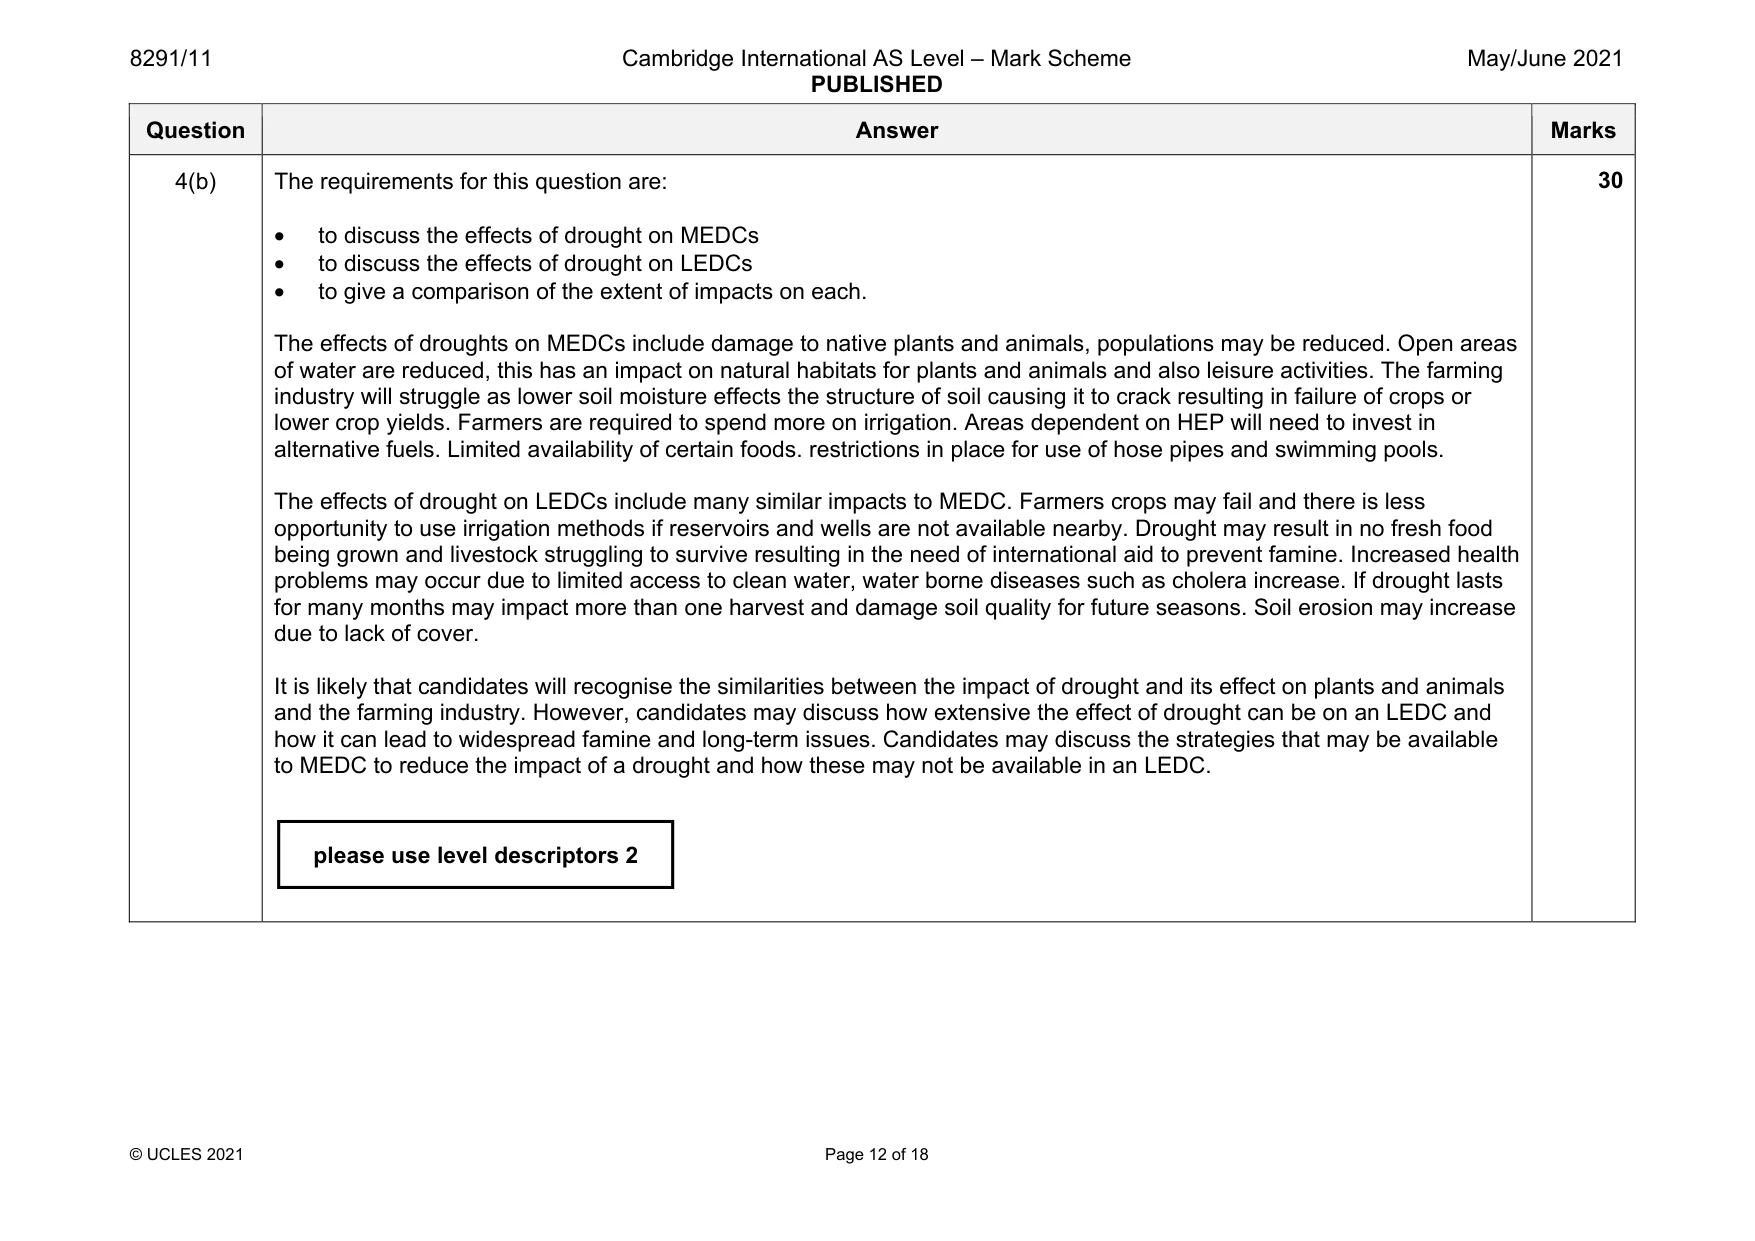
8291/11 Cambridge International AS Level – Mark Scheme PUBLISHED May/June 2021 © UCLES 2021 Page 12 of 18 Question Answer Marks 4(b) The requirements for this question are: • to discuss the effects of drought on MEDCs • to discuss the effects of drought on LEDCs • to give a comparison of the extent of impacts on each. The effects of droughts on MEDCs include damage to native plants and animals, populations may be reduced. Open areas of water are reduced, this has an impact on natural habitats for plants and animals and also leisure activities. The farming industry will struggle as lower soil moisture effects the structure of soil causing it to crack resulting in failure of crops or lower crop yields. Farmers are required to spend more on irrigation. Areas dependent on HEP will need to invest in alternative fuels. Limited availability of certain foods. restrictions in place for use of hose pipes and swimming pools. The effects of drought on LEDCs include many similar impacts to MEDC. Farmers crops may fail and there is less opportunity to use irrigation methods if reservoirs and wells are not available nearby. Drought may result in no fresh food being grown and livestock struggling to survive resulting in the need of international aid to prevent famine. Increased health problems may occur due to limited access to clean water, water borne diseases such as cholera increase. If drought lasts for many months may impact more than one harvest and damage soil quality for future seasons. Soil erosion may increase due to lack of cover. It is likely that candidates will recognise the similarities between the impact of drought and its effect on plants and animals and the farming industry. However, candidates may discuss how extensive the effect of drought can be on an LEDC and how it can lead to widespread famine and long-term issues. Candidates may discuss the strategies that may be available to MEDC to reduce the impact of a drought and how these may not be available in an LEDC. 30 please use level descriptors 2
Mark scheme, page 13
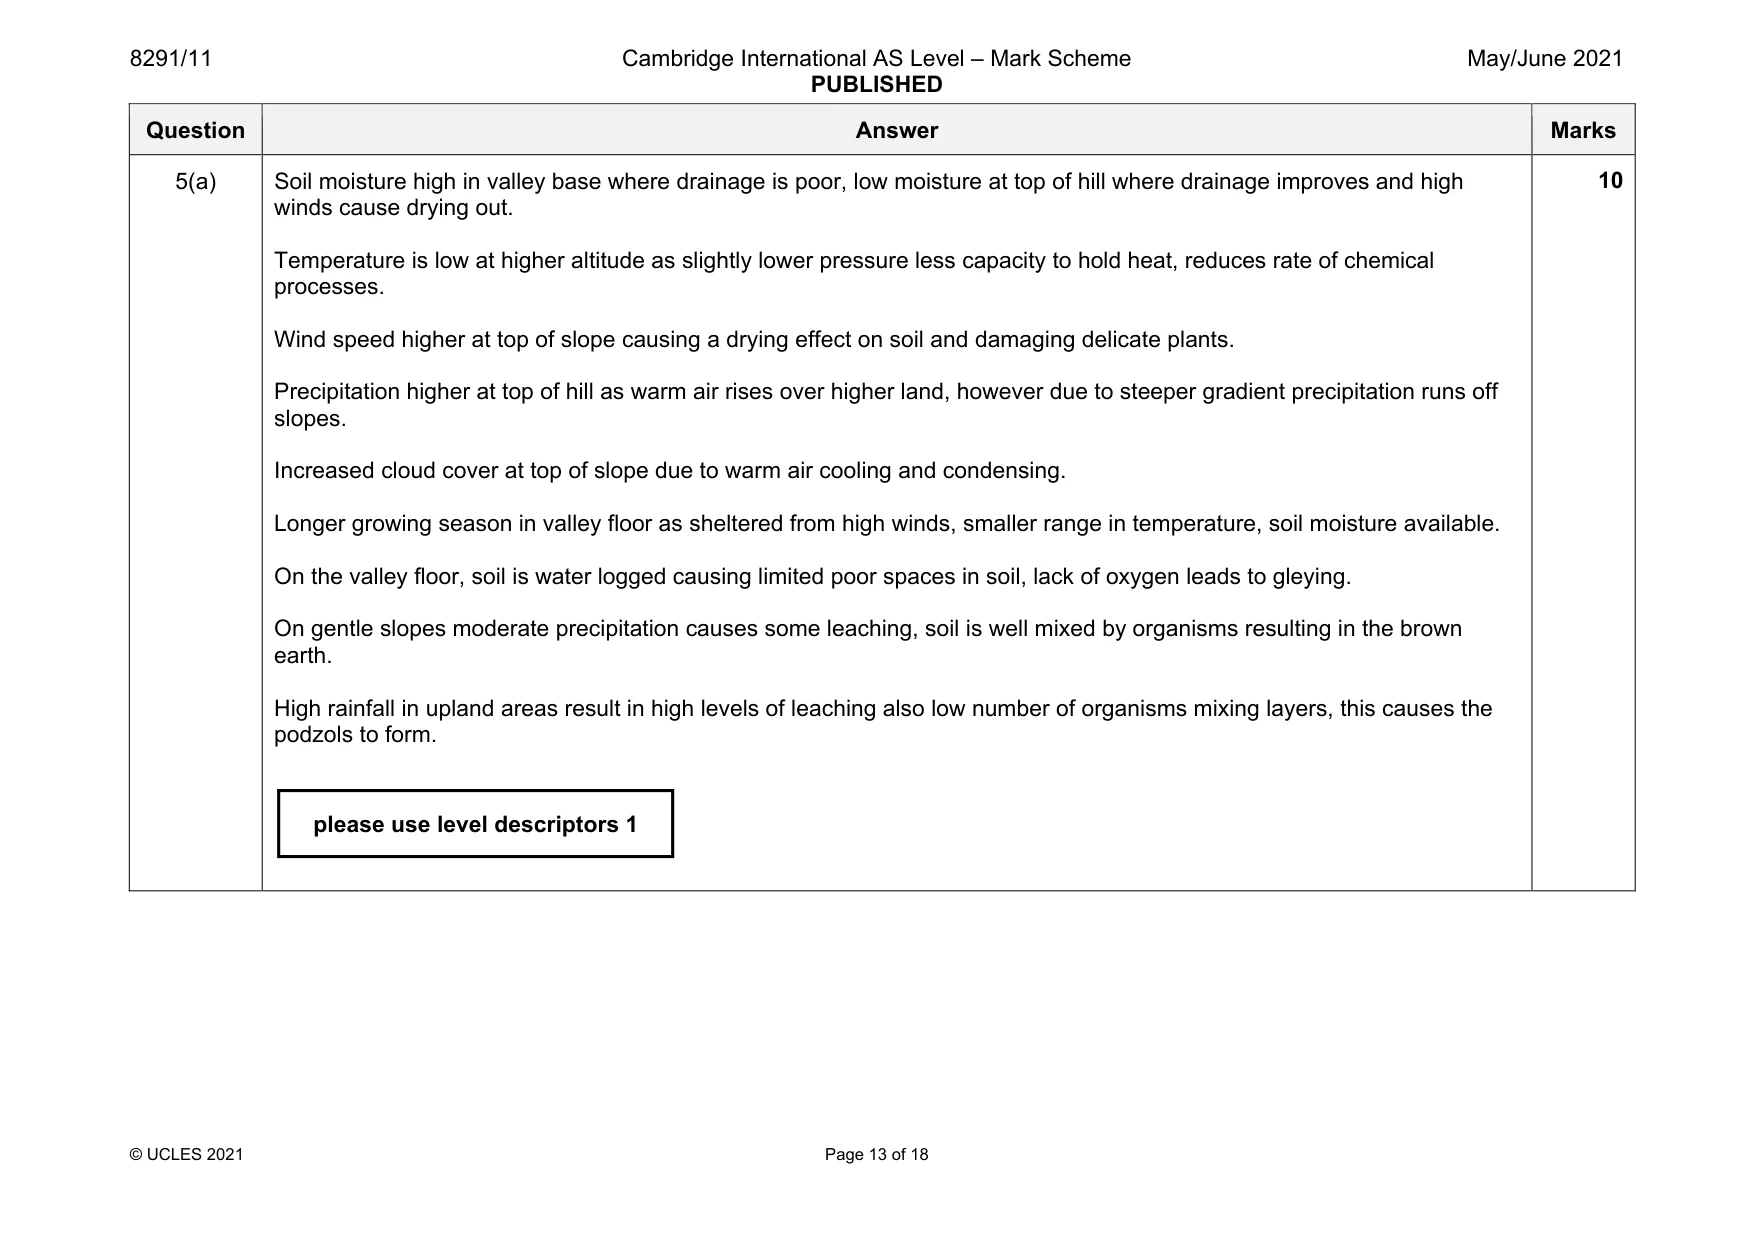
8291/11 Cambridge International AS Level – Mark Scheme PUBLISHED May/June 2021 © UCLES 2021 Page 13 of 18 Question Answer Marks 5(a) Soil moisture high in valley base where drainage is poor, low moisture at top of hill where drainage improves and high winds cause drying out. Temperature is low at higher altitude as slightly lower pressure less capacity to hold heat, reduces rate of chemical processes. Wind speed higher at top of slope causing a drying effect on soil and damaging delicate plants. Precipitation higher at top of hill as warm air rises over higher land, however due to steeper gradient precipitation runs off slopes. Increased cloud cover at top of slope due to warm air cooling and condensing. Longer growing season in valley floor as sheltered from high winds, smaller range in temperature, soil moisture available. On the valley floor, soil is water logged causing limited poor spaces in soil, lack of oxygen leads to gleying. On gentle slopes moderate precipitation causes some leaching, soil is well mixed by organisms resulting in the brown earth. High rainfall in upland areas result in high levels of leaching also low number of organisms mixing layers, this causes the podzols to form. 10 please use level descriptors 1
Mark scheme, page 14
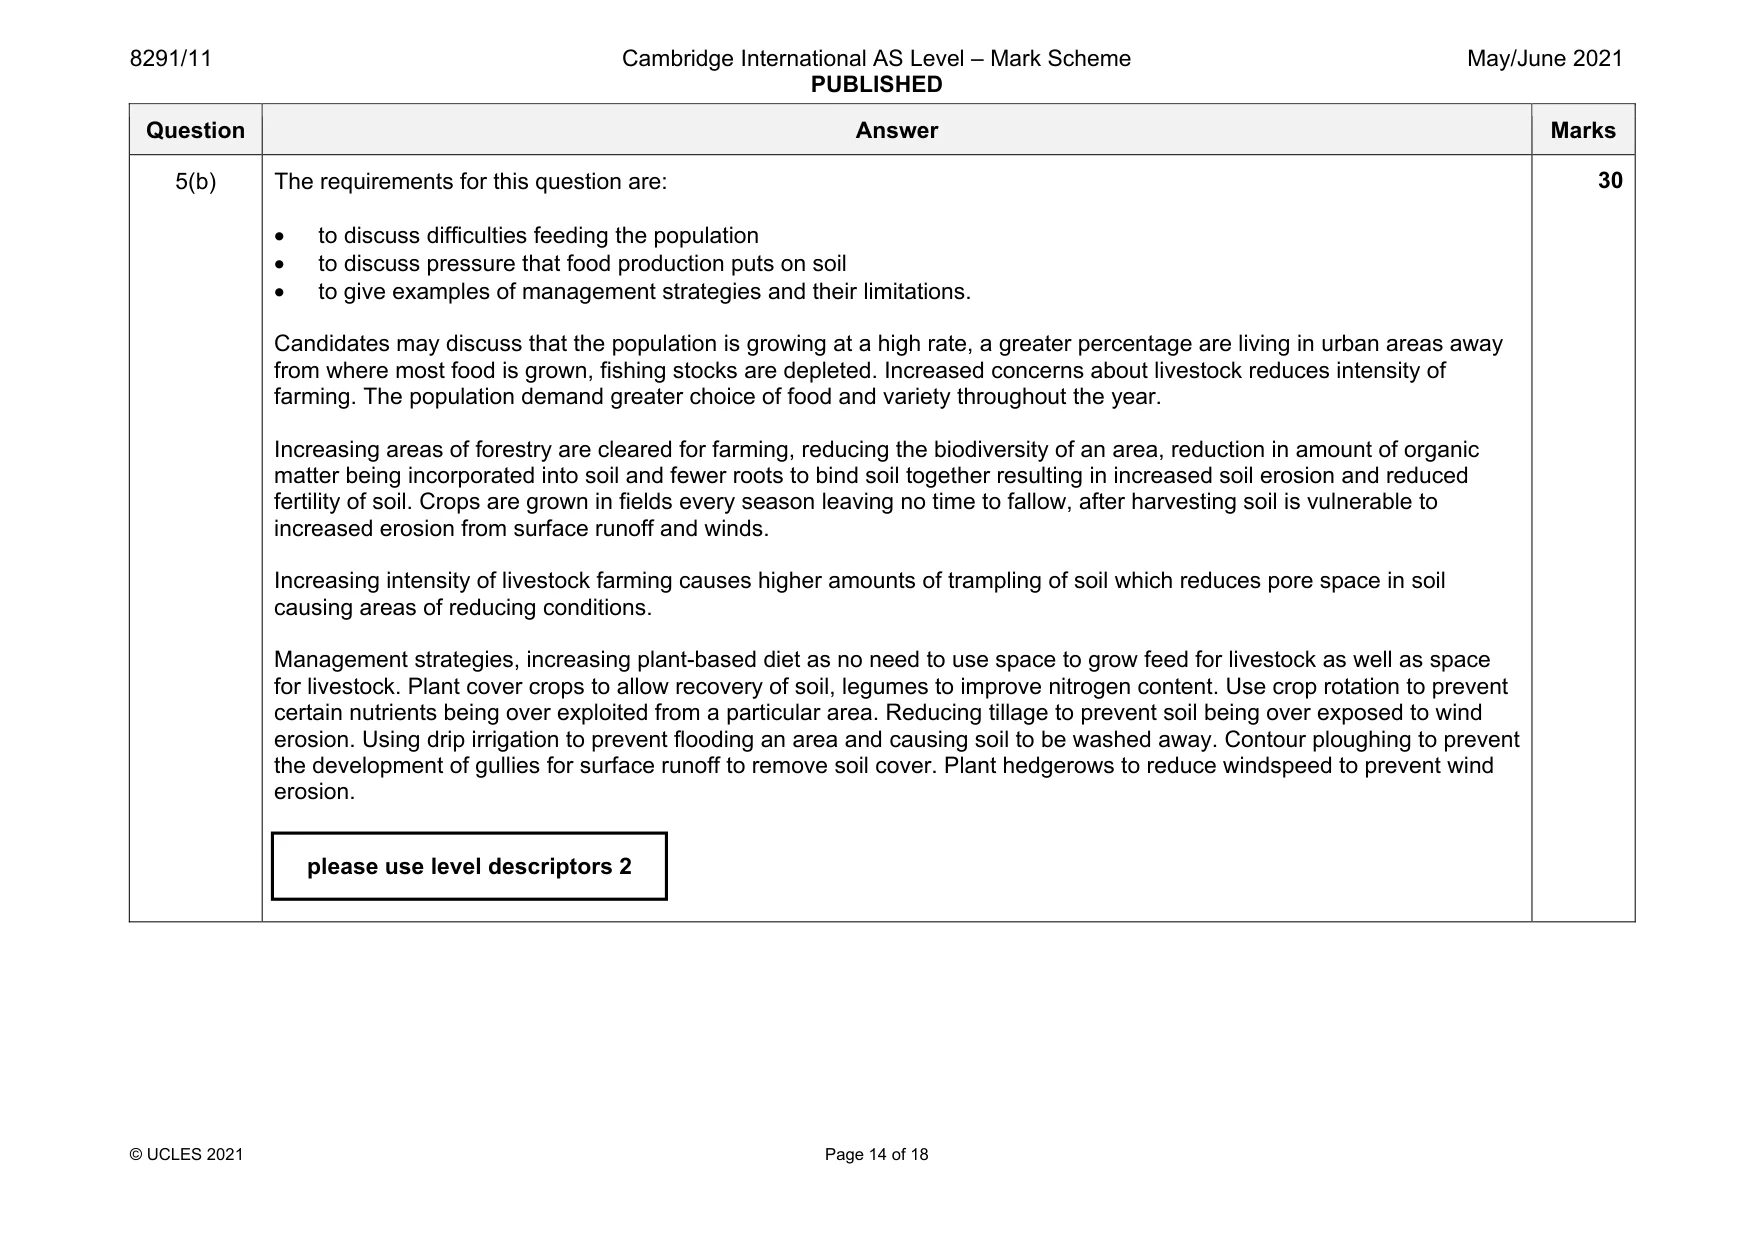
8291/11 Cambridge International AS Level – Mark Scheme PUBLISHED May/June 2021 © UCLES 2021 Page 14 of 18 Question Answer Marks 5(b) The requirements for this question are: • to discuss difficulties feeding the population • to discuss pressure that food production puts on soil • to give examples of management strategies and their limitations. Candidates may discuss that the population is growing at a high rate, a greater percentage are living in urban areas away from where most food is grown, fishing stocks are depleted. Increased concerns about livestock reduces intensity of farming. The population demand greater choice of food and variety throughout the year. Increasing areas of forestry are cleared for farming, reducing the biodiversity of an area, reduction in amount of organic matter being incorporated into soil and fewer roots to bind soil together resulting in increased soil erosion and reduced fertility of soil. Crops are grown in fields every season leaving no time to fallow, after harvesting soil is vulnerable to increased erosion from surface runoff and winds. Increasing intensity of livestock farming causes higher amounts of trampling of soil which reduces pore space in soil causing areas of reducing conditions. Management strategies, increasing plant-based diet as no need to use space to grow feed for livestock as well as space for livestock. Plant cover crops to allow recovery of soil, legumes to improve nitrogen content. Use crop rotation to prevent certain nutrients being over exploited from a particular area. Reducing tillage to prevent soil being over exposed to wind erosion. Using drip irrigation to prevent flooding an area and causing soil to be washed away. Contour ploughing to prevent the development of gullies for surface runoff to remove soil cover. Plant hedgerows to reduce windspeed to prevent wind erosion. 30 please use level descriptors 2
Mark scheme, page 15
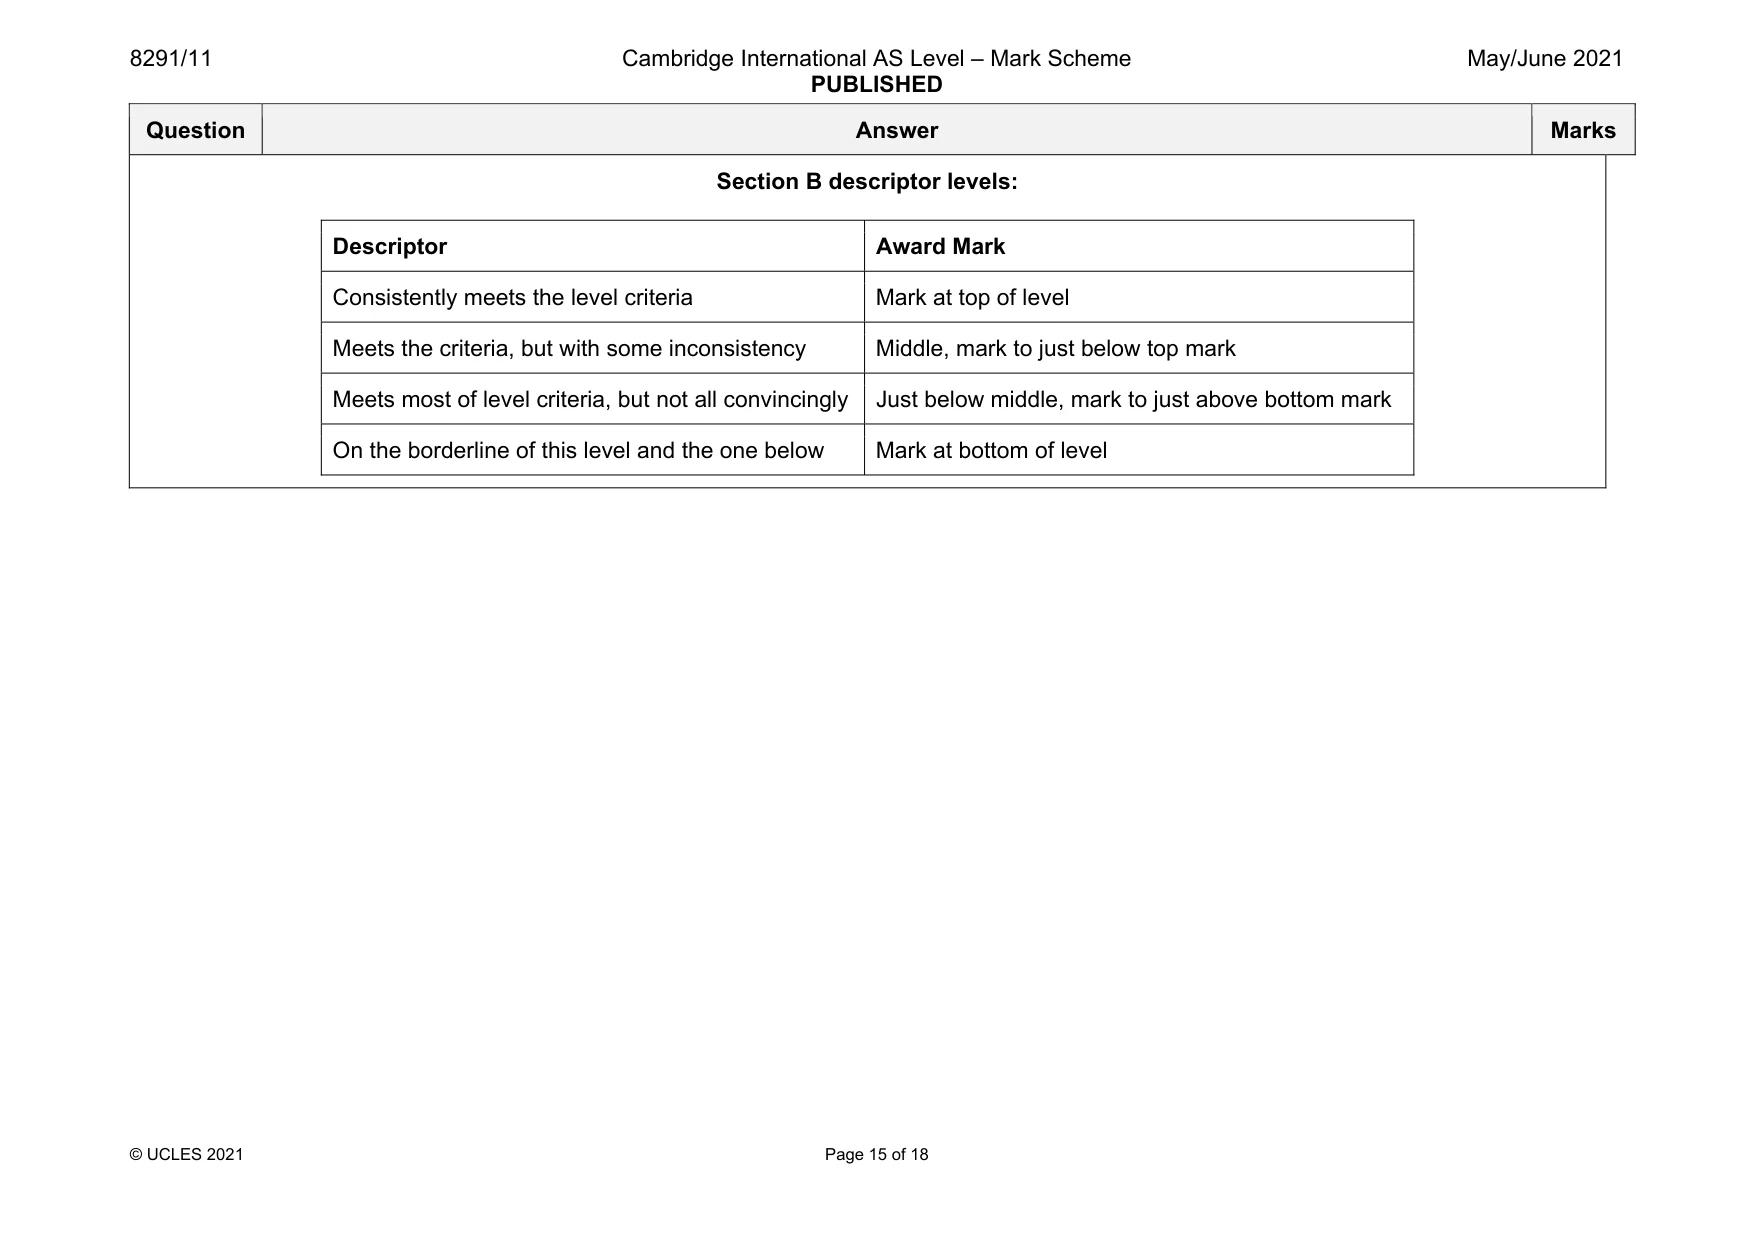
8291/11 Cambridge International AS Level – Mark Scheme PUBLISHED May/June 2021 © UCLES 2021 Page 15 of 18 Question Answer Marks Section B descriptor levels: Descriptor Award Mark Consistently meets the level criteria Mark at top of level Meets the criteria, but with some inconsistency Middle, mark to just below top mark Meets most of level criteria, but not all convincingly Just below middle, mark to just above bottom mark On the borderline of this level and the one below Mark at bottom of level
Mark scheme, page 16
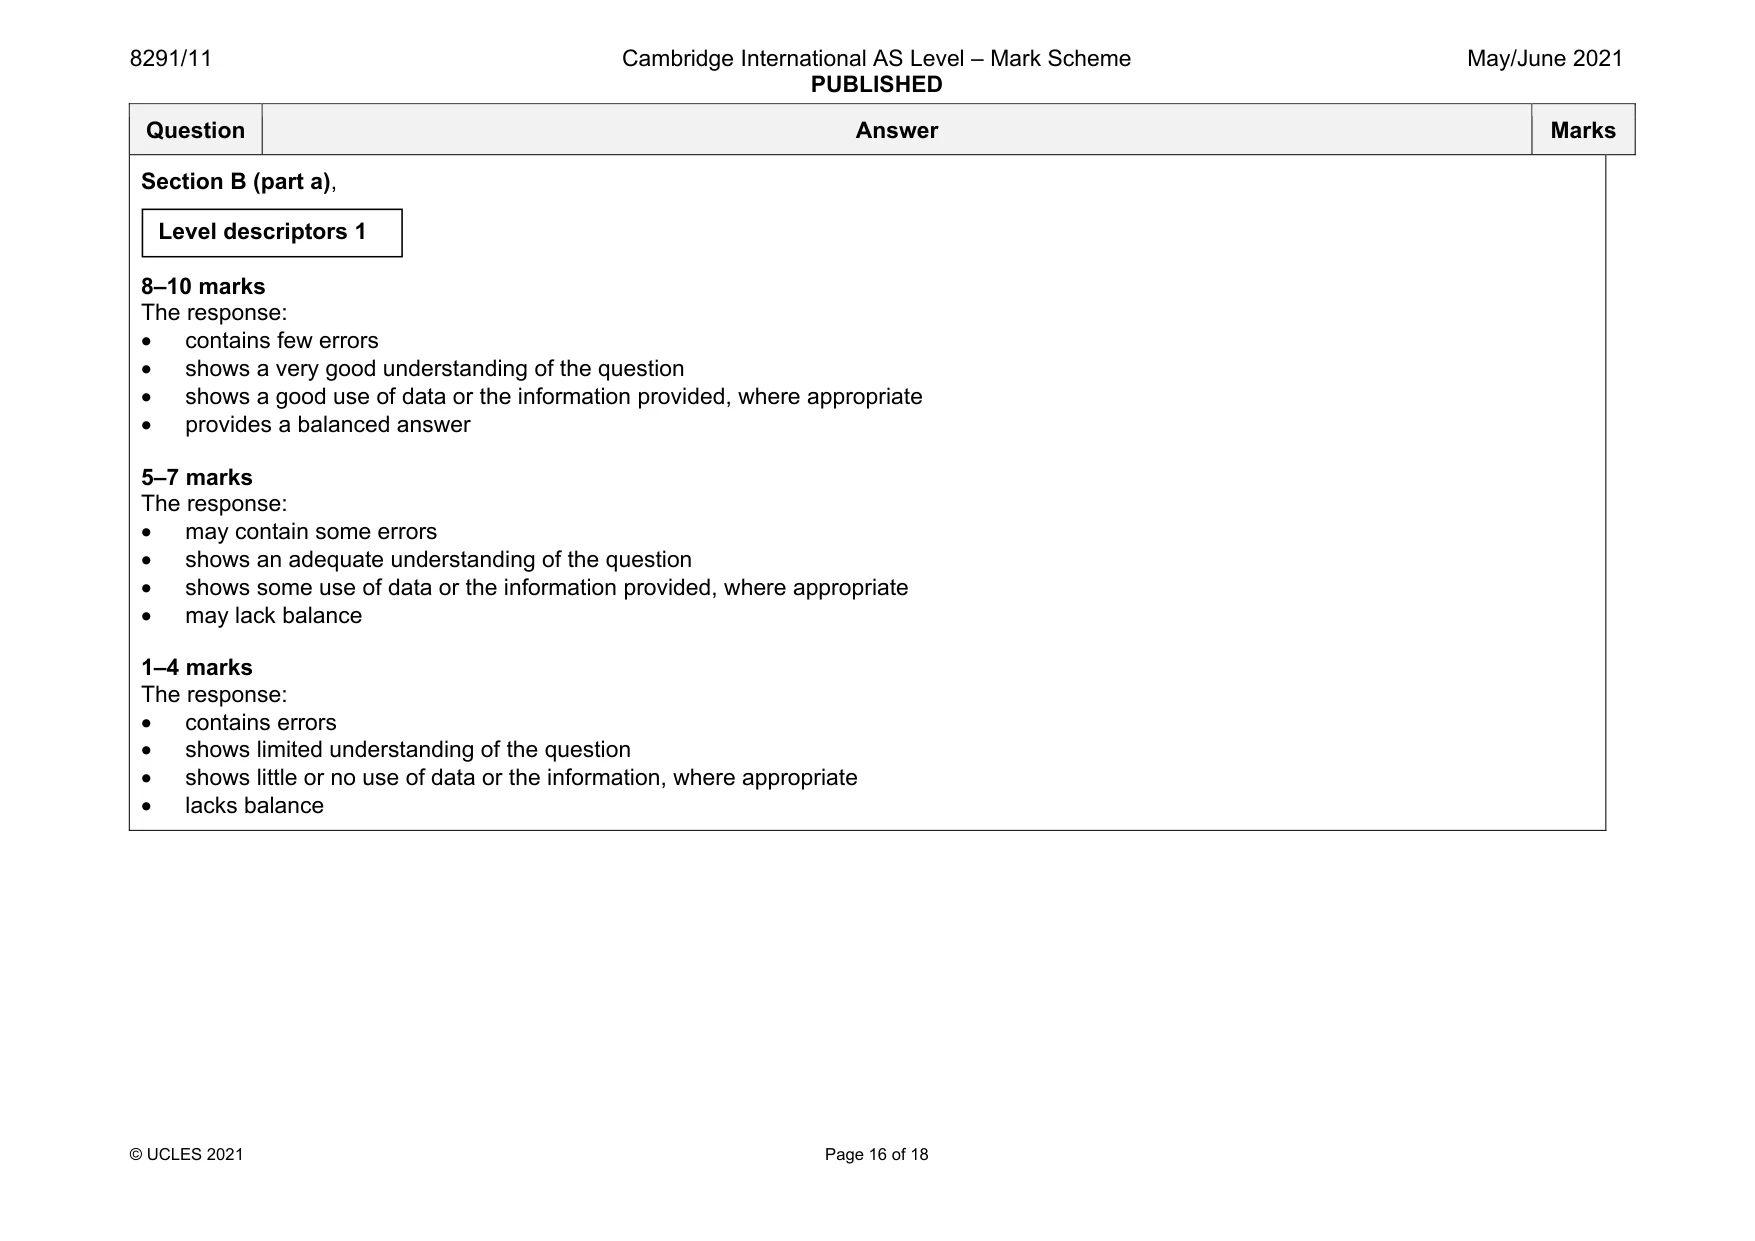
8291/11 Cambridge International AS Level – Mark Scheme PUBLISHED May/June 2021 © UCLES 2021 Page 16 of 18 Question Answer Marks Section B (part a), 8–10 marks The response: • contains few errors • shows a very good understanding of the question • shows a good use of data or the information provided, where appropriate • provides a balanced answer 5–7 marks The response: • may contain some errors • shows an adequate understanding of the question • shows some use of data or the information provided, where appropriate • may lack balance 1–4 marks The response: • contains errors • shows limited understanding of the question • shows little or no use of data or the information, where appropriate • lacks balance Level descriptors 1
Mark scheme, page 17
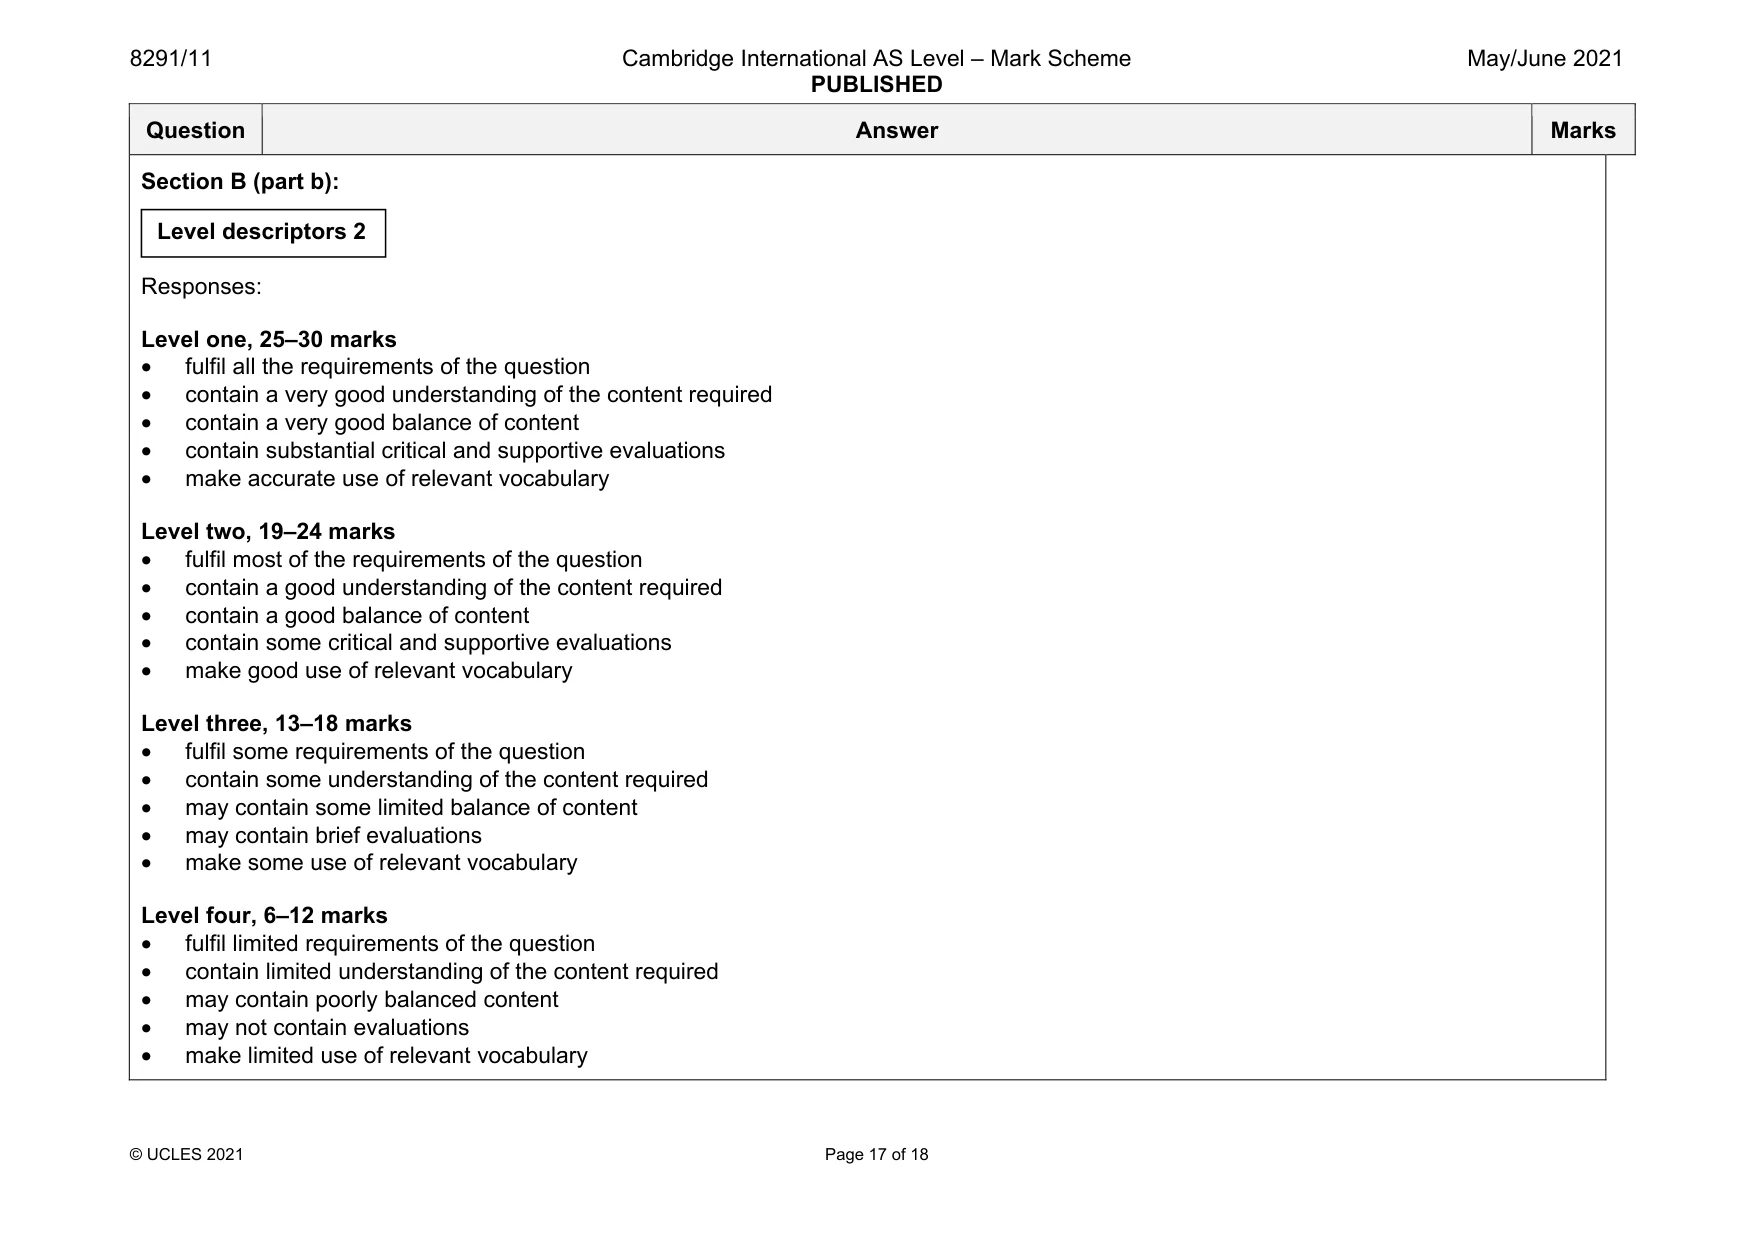
8291/11 Cambridge International AS Level – Mark Scheme PUBLISHED May/June 2021 © UCLES 2021 Page 17 of 18 Question Answer Marks Section B (part b): Responses: Level one, 25–30 marks • fulfil all the requirements of the question • contain a very good understanding of the content required • contain a very good balance of content • contain substantial critical and supportive evaluations • make accurate use of relevant vocabulary Level two, 19–24 marks • fulfil most of the requirements of the question • contain a good understanding of the content required • contain a good balance of content • contain some critical and supportive evaluations • make good use of relevant vocabulary Level three, 13–18 marks • fulfil some requirements of the question • contain some understanding of the content required • may contain some limited balance of content • may contain brief evaluations • make some use of relevant vocabulary Level four, 6–12 marks • fulfil limited requirements of the question • contain limited understanding of the content required • may contain poorly balanced content • may not contain evaluations • make limited use of relevant vocabulary Level descriptors 2
Mark scheme, page 18
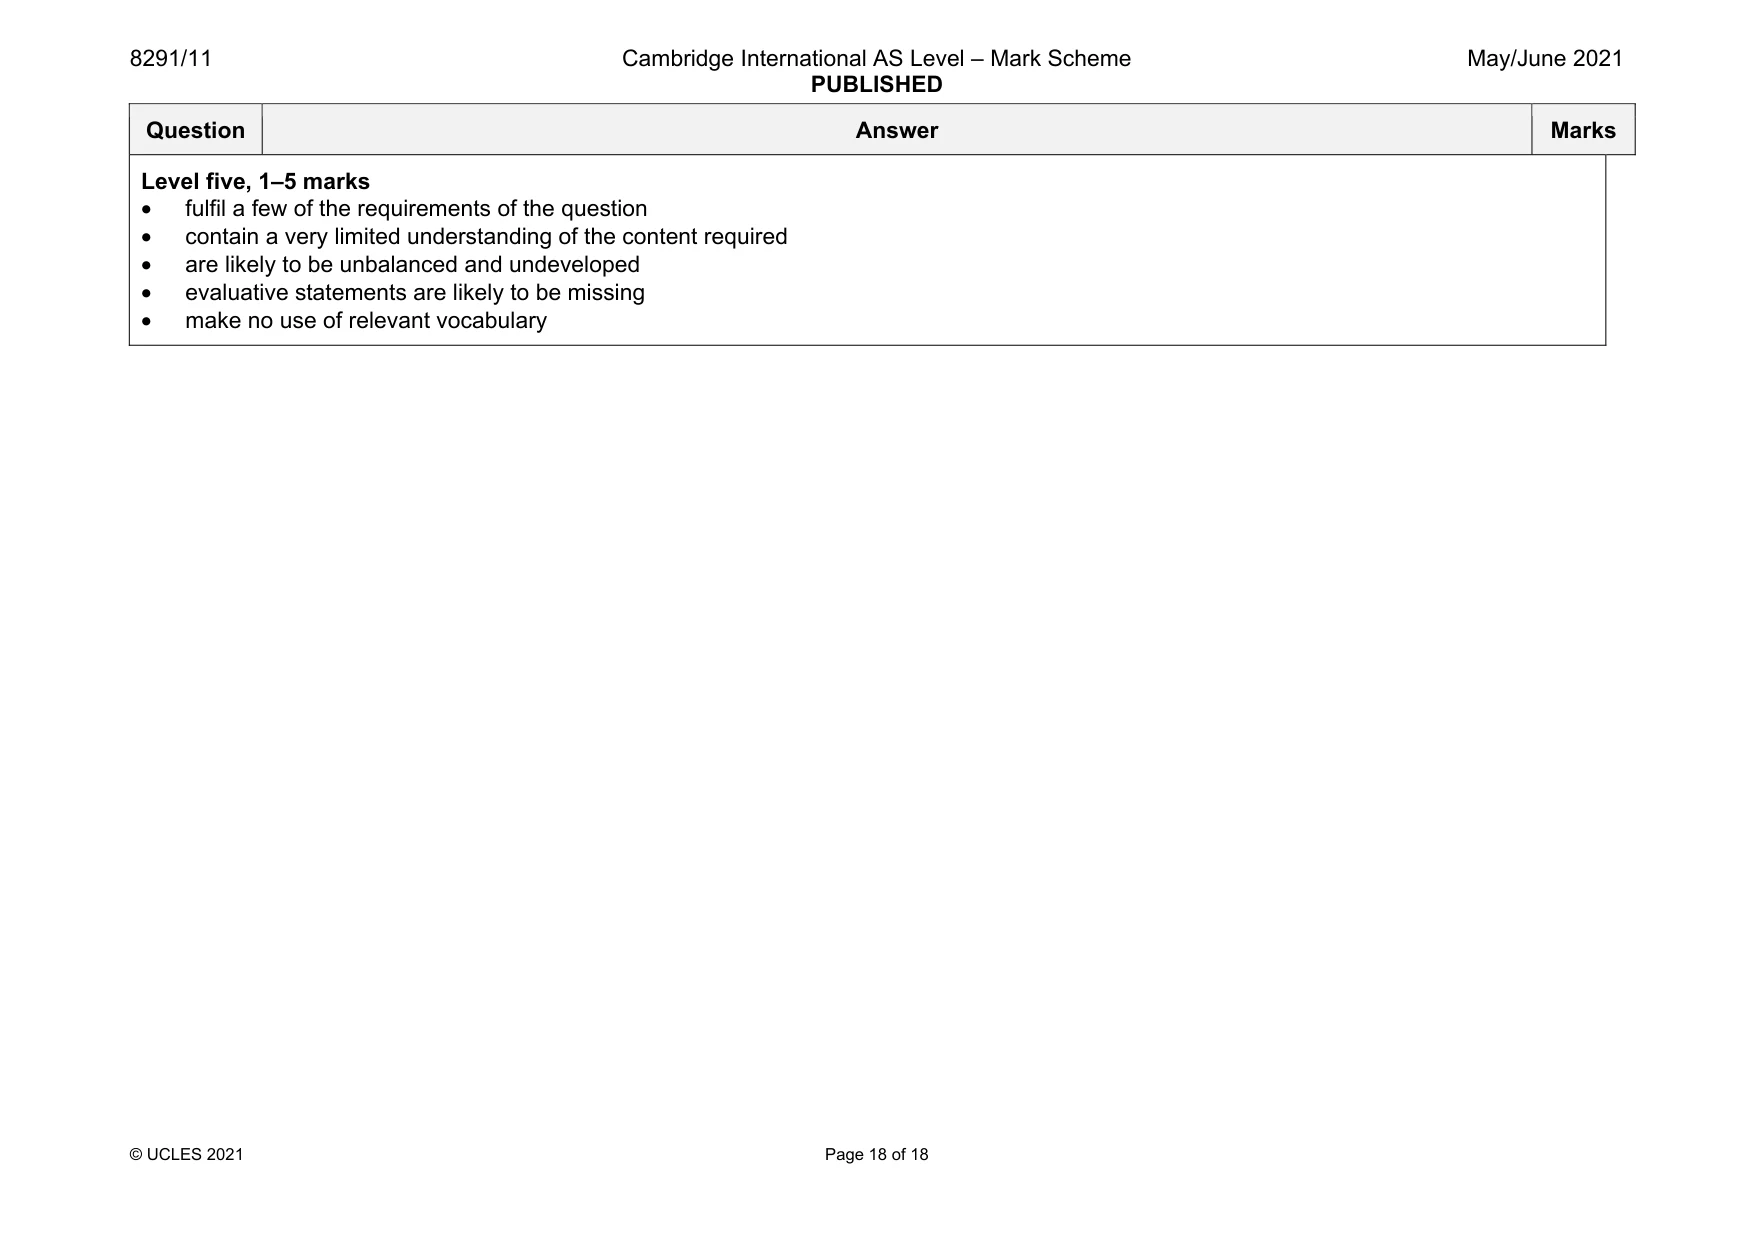
8291/11 Cambridge International AS Level – Mark Scheme PUBLISHED May/June 2021 © UCLES 2021 Page 18 of 18 Question Answer Marks Level five, 1–5 marks • fulfil a few of the requirements of the question • contain a very limited understanding of the content required • are likely to be unbalanced and undeveloped • evaluative statements are likely to be missing • make no use of relevant vocabulary
What you needed in this session
Cambridge’s own grade thresholds for 2021 May/June, Paper 1 · Variant 1. A higher threshold means an easier paper — the bar moves with how the cohort did.