Cambridge A Level Environmental Management (AS only) 8291 — 2020 Oct/Nov Paper 1 · Variant 1
8291/11/O/N/20 · 80 marks · ≈90 min
The question paper and its mark scheme, free to read here and free to download. This is Cambridge’s own paper, exactly as it was sat.
Question paper12 pages

Mark scheme18 pages
Answers below. Sit the paper first if you are practising.
Paper as text
Question paper, page 1
Cambridge International AS Level This document has 12 pages. Blank pages are indicated. DC (JC/CT) 186094/6 © UCLES 2020 [Turn over * 5 4 9 1 6 1 0 8 4 4 * ENVIRONMENTAL MANAGEMENT 8291/11 Paper 1 Lithosphere and Atmosphere October/November 2020 1 hour 30 minutes You must answer Section A on the question paper and Section B on the answer booklet/paper you have been given. You will need: Answer booklet/paper INSTRUCTIONS ● Section A: answer all questions. Write your answer to each question in the space provided on the question paper. ● Section B: answer one question. Write your answer on the separate answer booklet/paper provided. ● Use a black or dark blue pen. You may use an HB pencil for any diagrams or graphs. ● Write your name, centre number and candidate number in the boxes at the top of the page. ● Do not use an erasable pen or correction fluid. ● Do not write on any bar codes. ● You may use a calculator. ● You should show all your working and use appropriate units. ● At the end of the examination, fasten all your work together. Do not use staples, paper clips or glue. INFORMATION ● The total mark for this paper is 80. ● The number of marks for each question or part question is shown in brackets [ ]. For Examiner’s use Section A 1 2 Section B Total
Question paper, page 2
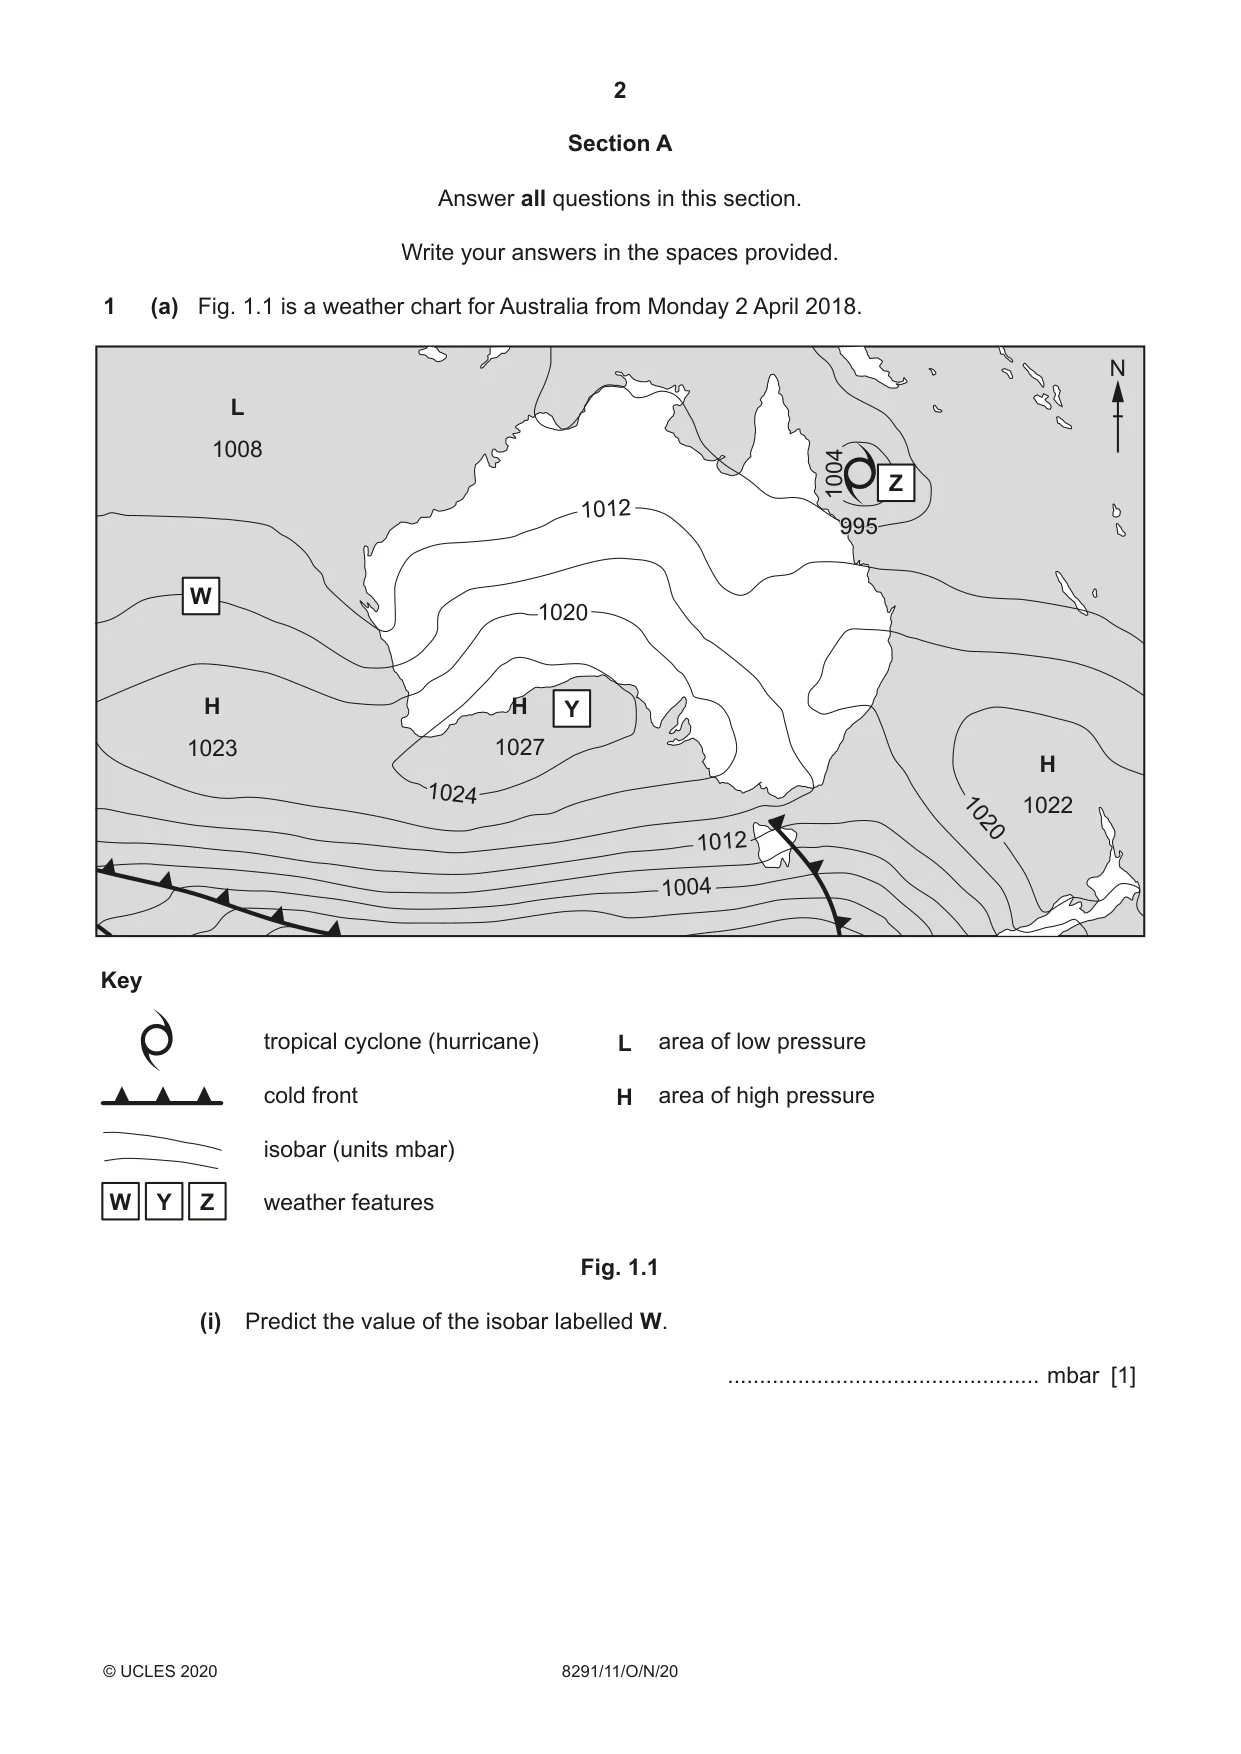
2 8291/11/O/N/20 © UCLES 2020 Section A Answer all questions in this section. Write your answers in the spaces provided. 1 (a) Fig. 1.1 is a weather chart for Australia from Monday 2 April 2018. 1020 1024 1004 1012 1020 1012 1004 W Y Z H 1023 995 H 1027 H 1022 L 1008 995 Key tropical cyclone (hurricane) cold front area of low pressure area of high pressure weather features isobar (units mbar) N H L W Y Z Fig. 1.1 (i) Predict the value of the isobar labelled W. … mbar [1]
Question paper, page 3
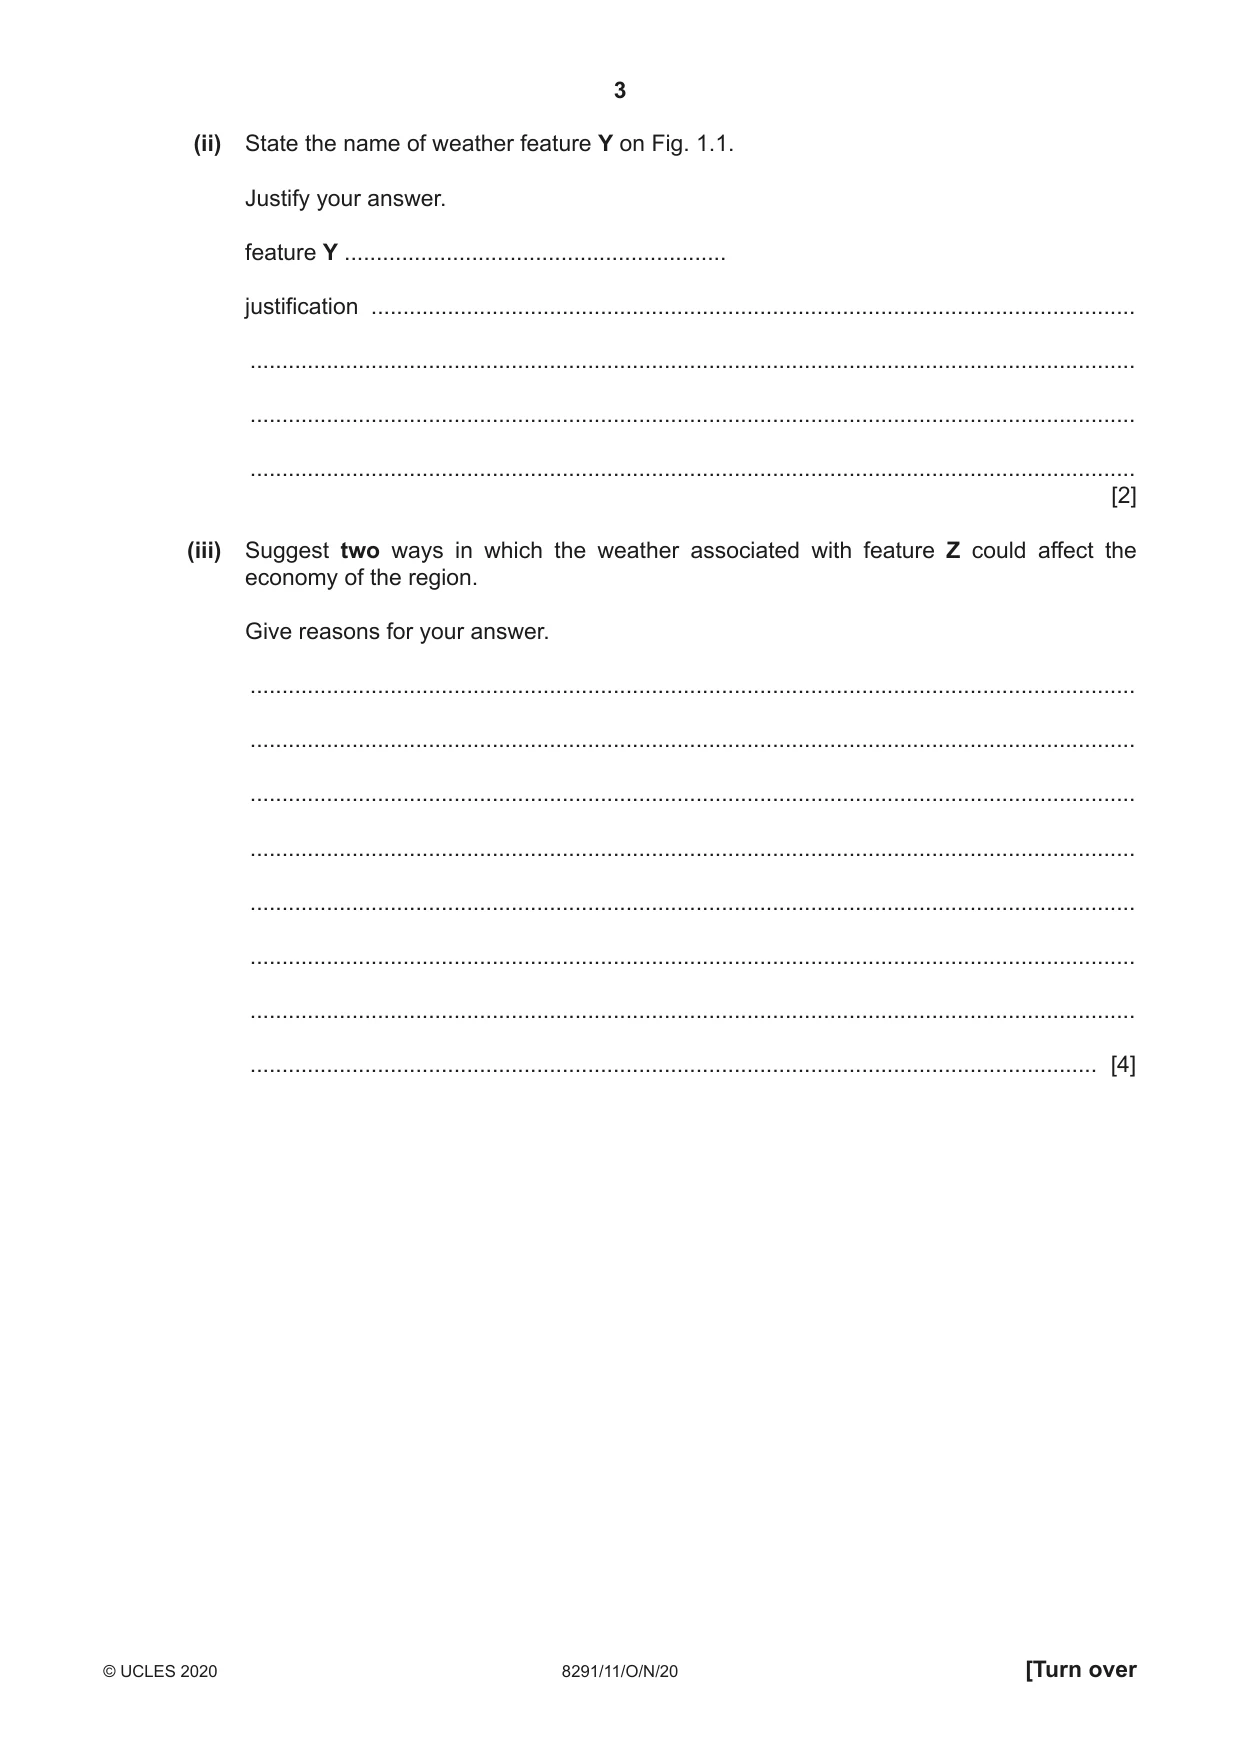
3 8291/11/O/N/20 © UCLES 2020 [Turn over (ii) State the name of weather feature Y on Fig. 1.1. Justify your answer. feature Y … justification … … … … [2] (iii) Suggest two ways in which the weather associated with feature Z could affect the economy of the region. Give reasons for your answer. … … … … … … … … [4]
Question paper, page 4
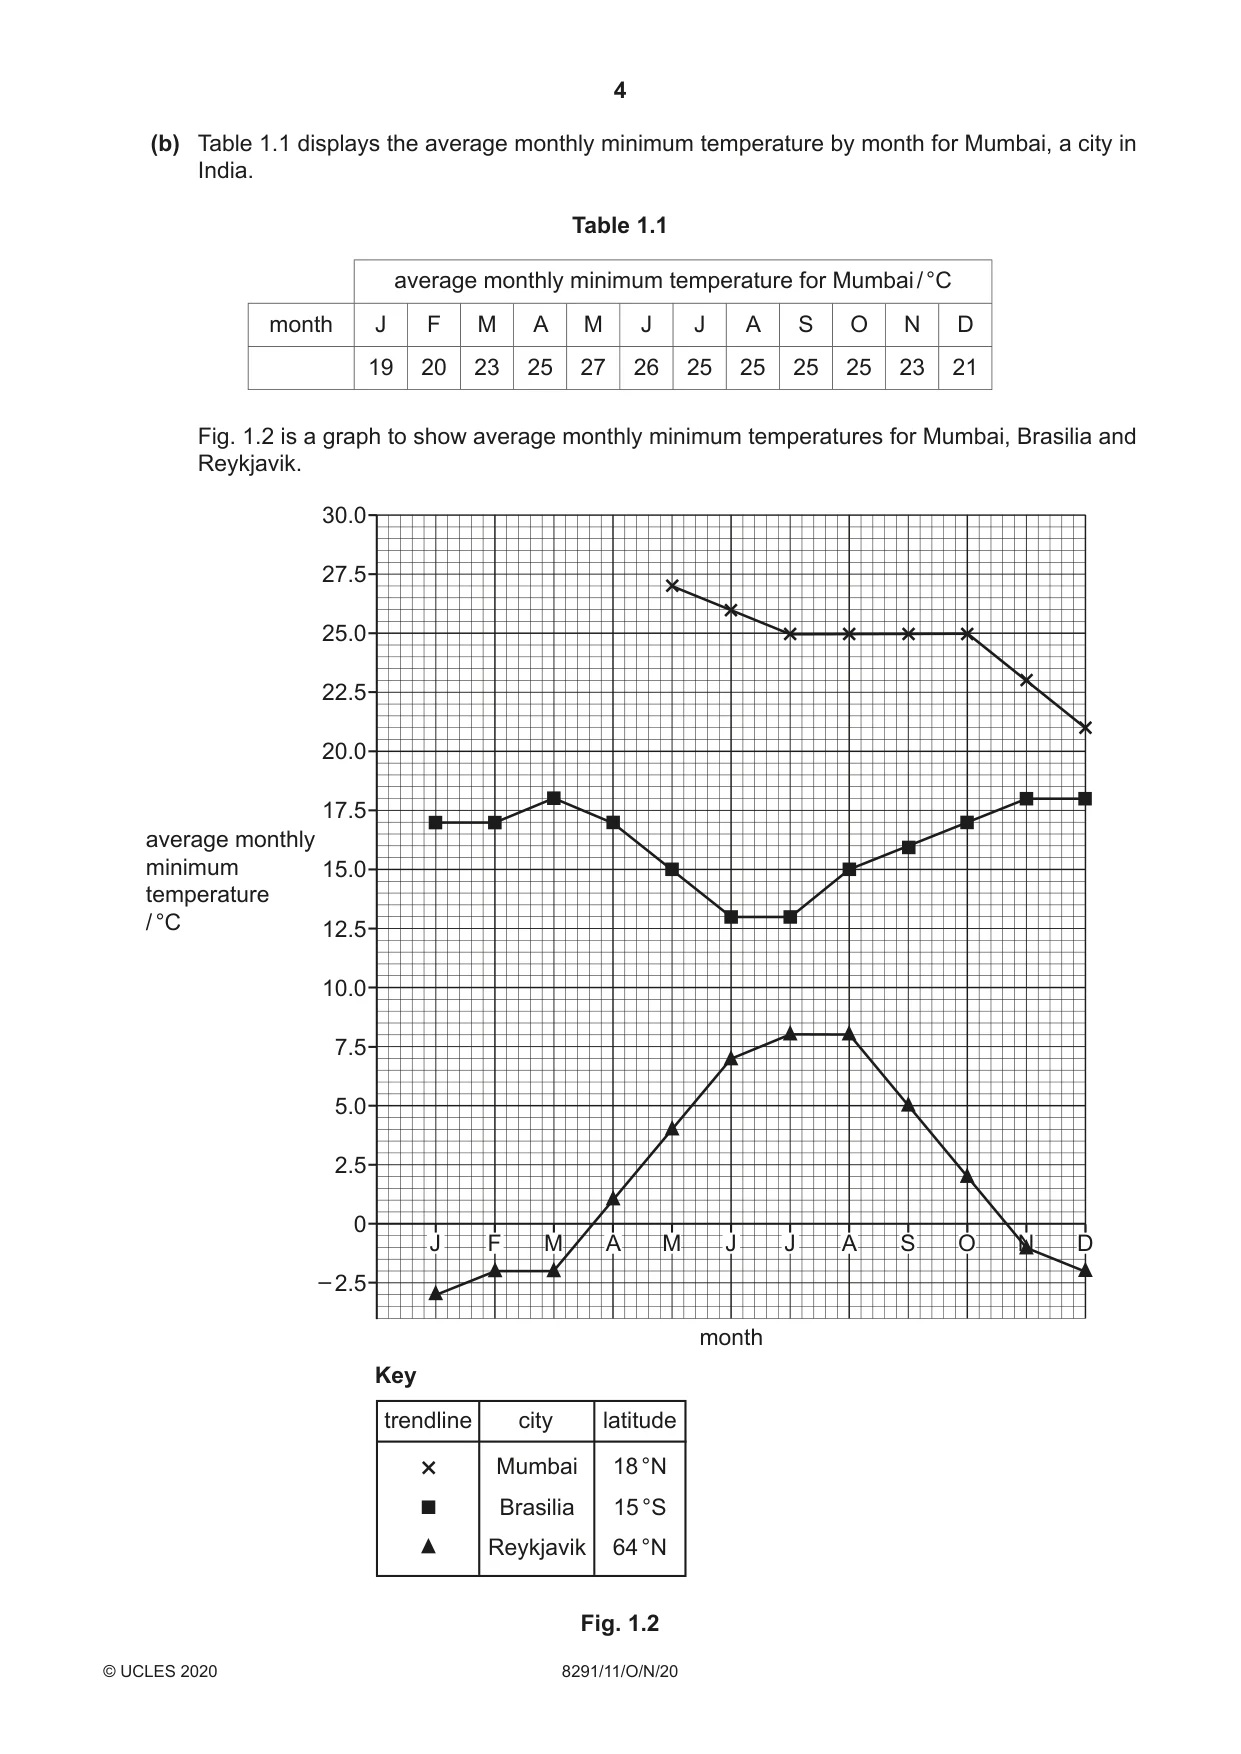
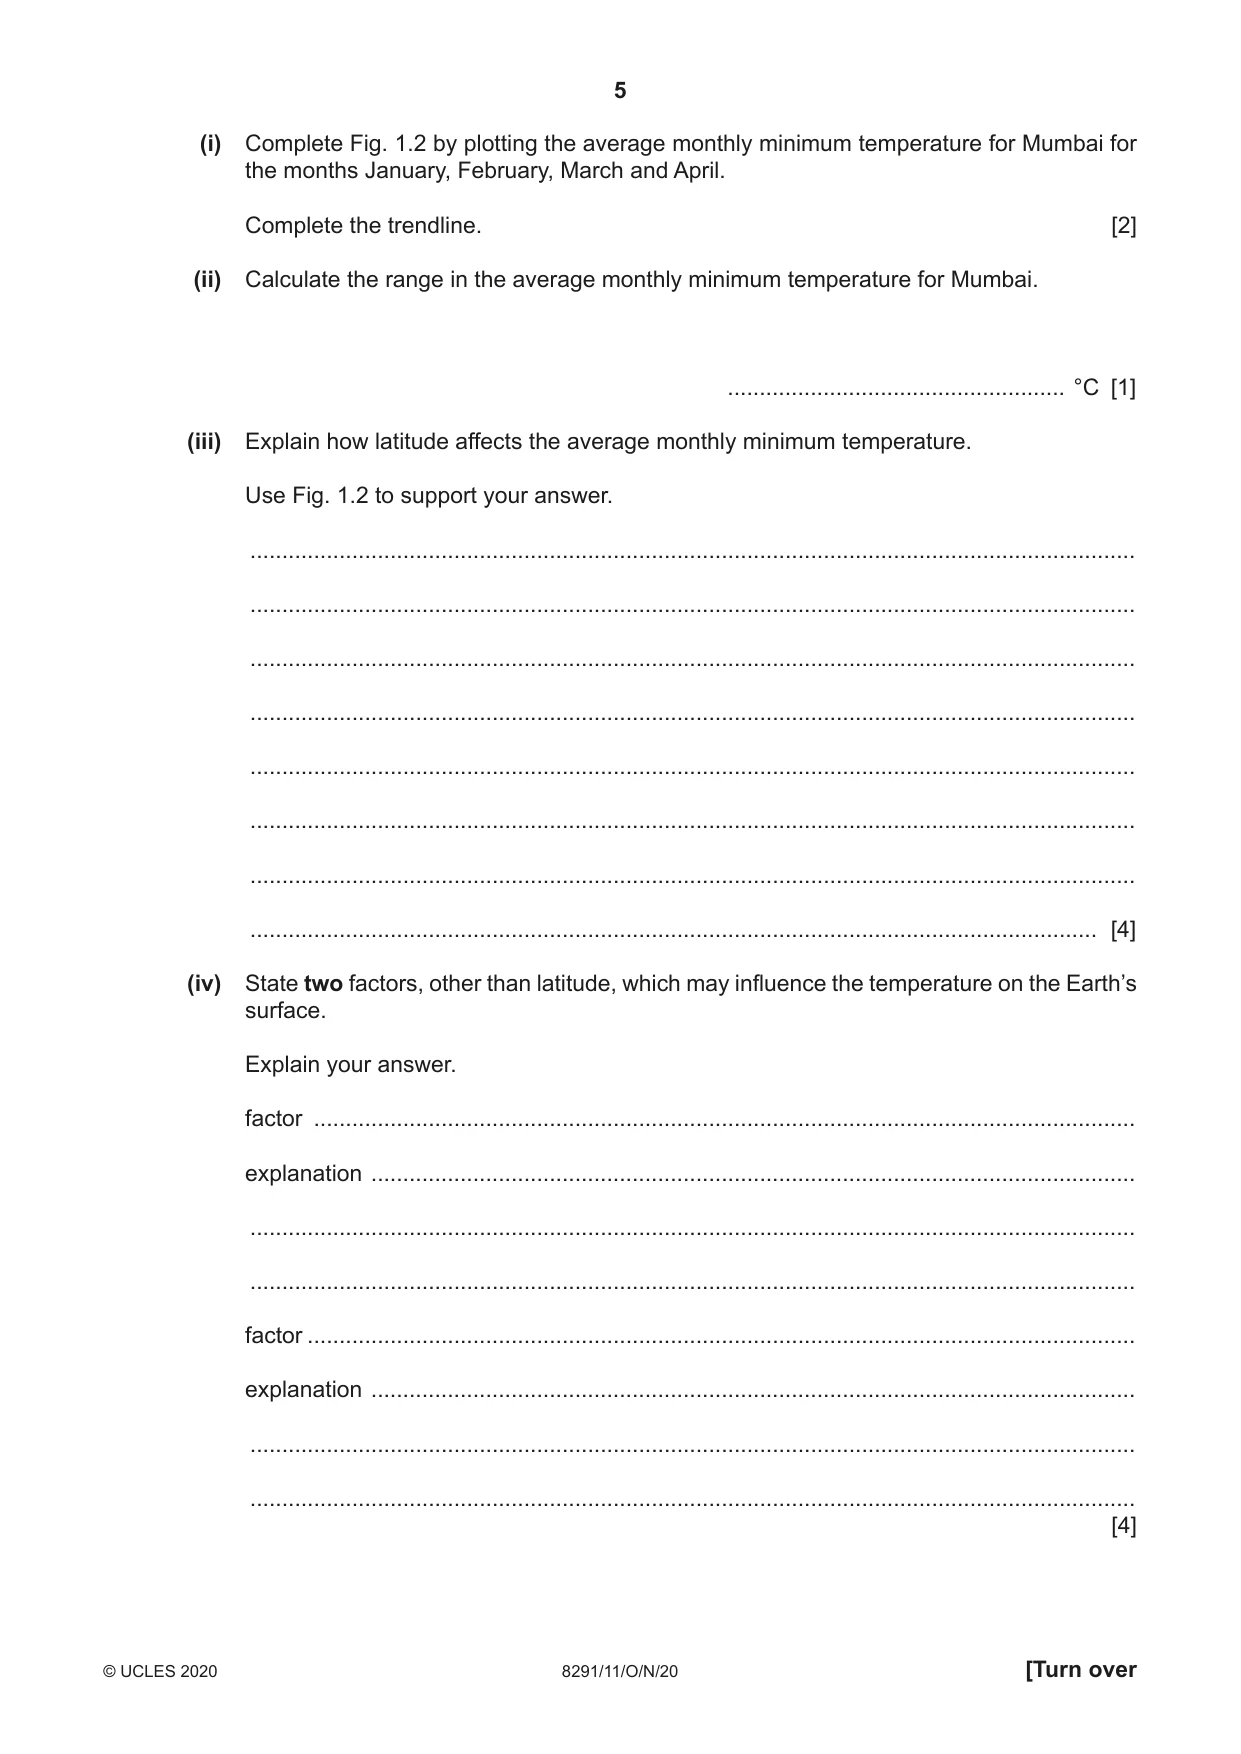
4 8291/11/O/N/20 © UCLES 2020 (b) Table 1.1 displays the average monthly minimum temperature by month for Mumbai, a city in India. Table 1.1 average monthly minimum temperature for Mumbai / °C month J F M A M J J A S O N D 19 20 23 25 27 26 25 25 25 25 23 21 Fig. 1.2 is a graph to show average monthly minimum temperatures for Mumbai, Brasilia and Reykjavik. 0 2.5 – 2.5 5.0 7.5 10.0 12.5 15.0 17.5 20.0 22.5 25.0 27.5 30.0 average monthly minimum temperature / °C month J F M A M J J A S O N D Key trendline city latitude Mumbai 18 °N Brasilia 15 °S Reykjavik 64 °N Fig. 1.2
Question paper, page 5
5 8291/11/O/N/20 © UCLES 2020 [Turn over (i) Complete Fig. 1.2 by plotting the average monthly minimum temperature for Mumbai for the months January, February, March and April. Complete the trendline. [2] (ii) Calculate the range in the average monthly minimum temperature for Mumbai. … °C [1] (iii) Explain how latitude affects the average monthly minimum temperature. Use Fig. 1.2 to support your answer. … … … … … … … … [4] (iv) State two factors, other than latitude, which may influence the temperature on the Earth’s surface. Explain your answer. factor … explanation … … … factor … explanation … … … [4]
Question paper, page 6
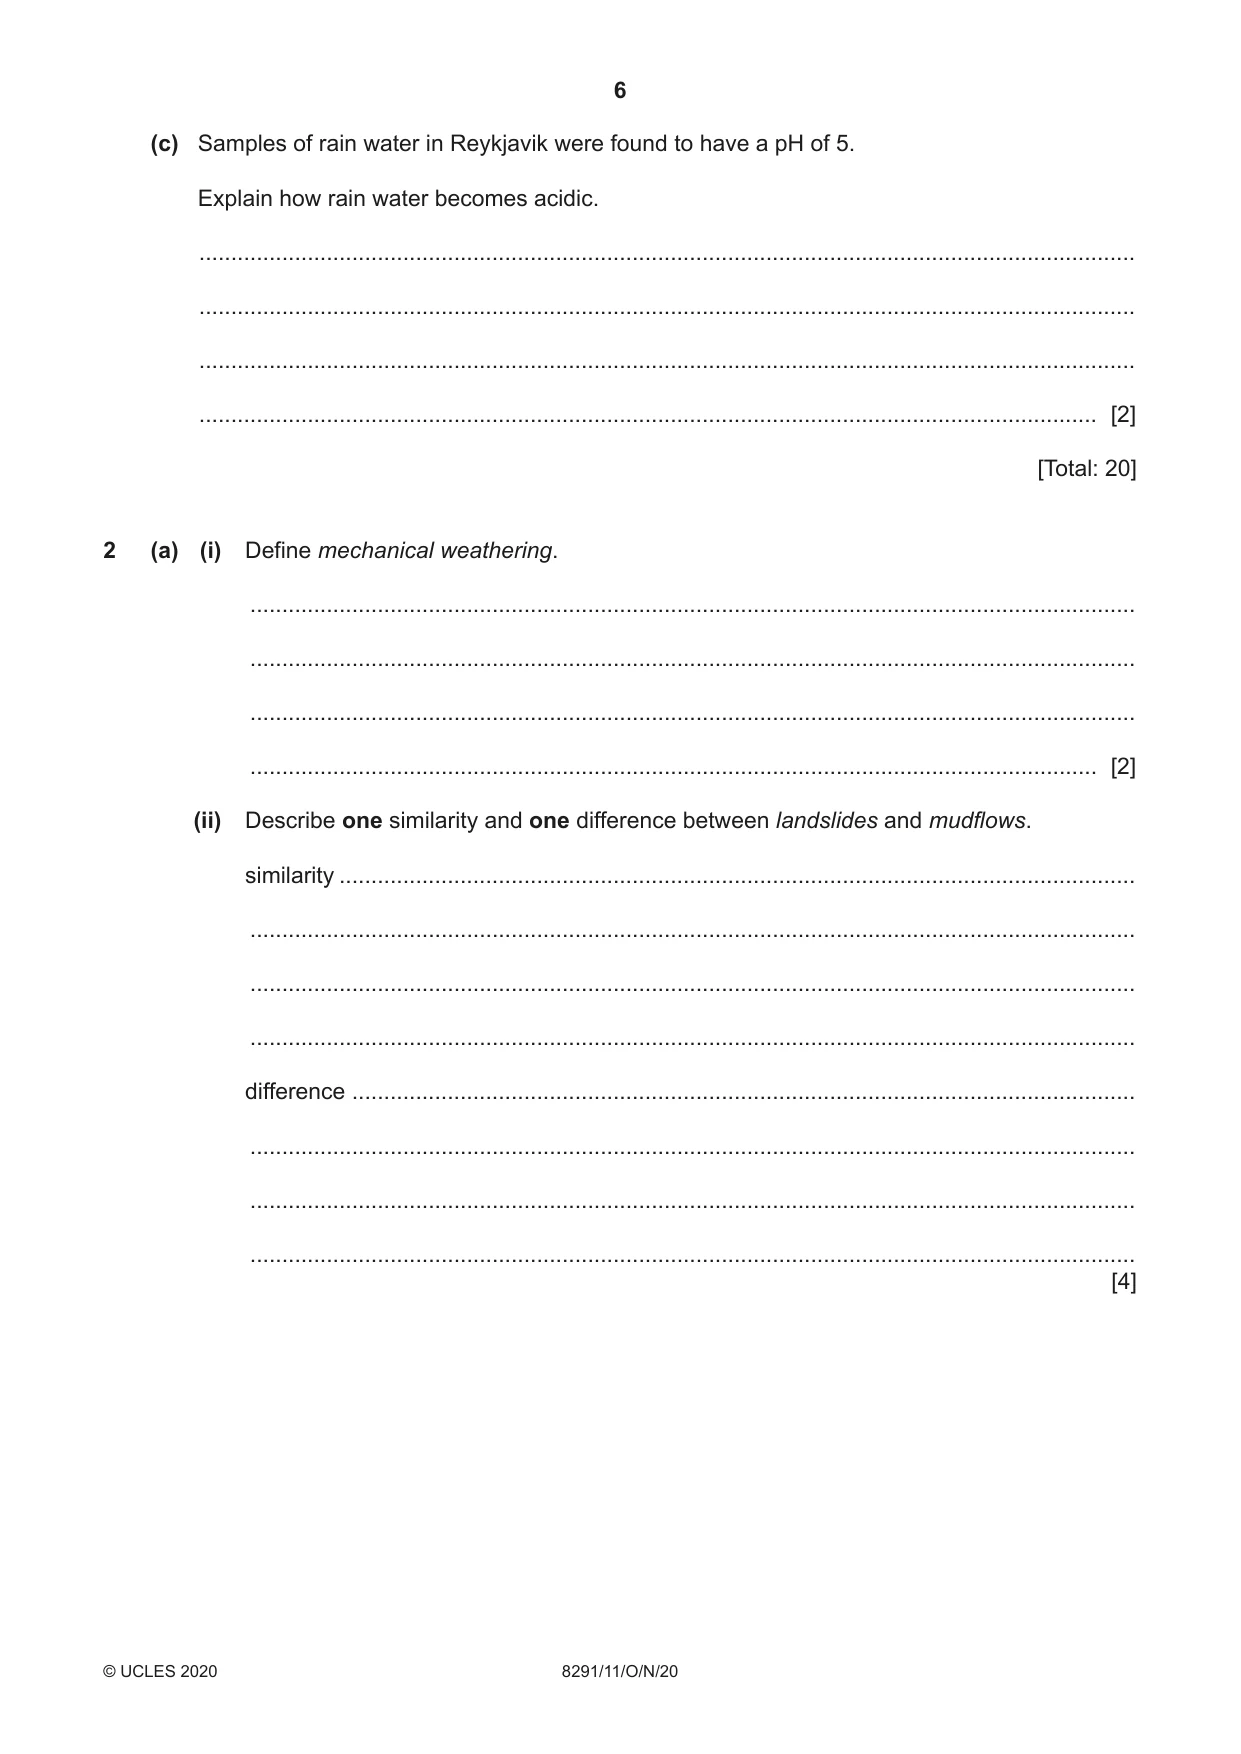
6 8291/11/O/N/20 © UCLES 2020 (c) Samples of rain water in Reykjavik were found to have a pH of 5. Explain how rain water becomes acidic. … … … … [2] [Total: 20] 2 (a) (i) Define mechanical weathering. … … … … [2] (ii) Describe one similarity and one difference between landslides and mudflows. similarity … … … … difference … … … … [4]
Question paper, page 7
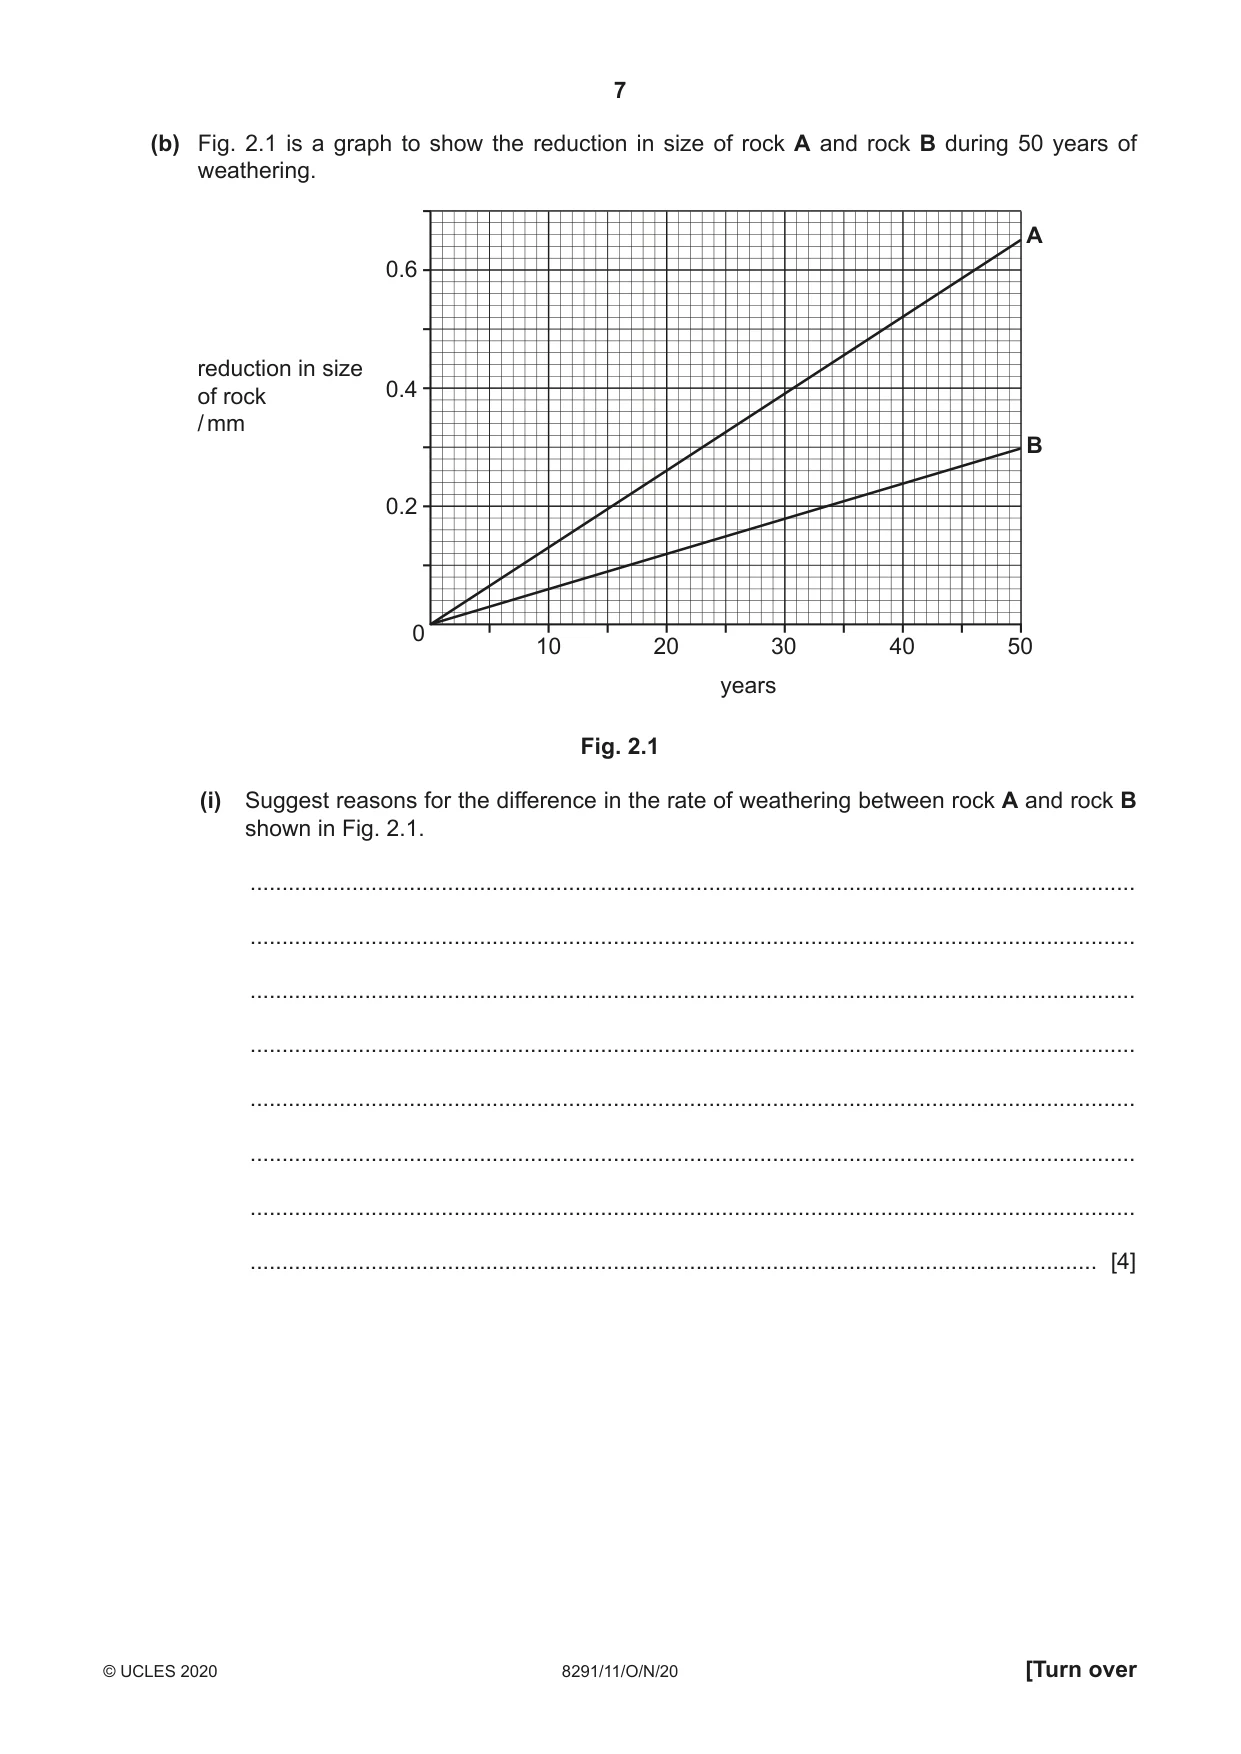
7 8291/11/O/N/20 © UCLES 2020 [Turn over (b) Fig. 2.1 is a graph to show the reduction in size of rock A and rock B during 50 years of weathering. reduction in size of rock / mm years 0.2 0 0.4 0.6 A B 10 20 30 40 50 Fig. 2.1 (i) Suggest reasons for the difference in the rate of weathering between rock A and rock B shown in Fig. 2.1. … … … … … … … … [4]
Question paper, page 8
8 8291/11/O/N/20 © UCLES 2020 (ii) Explain two ways in which human activity can trigger sudden mass movements. … … … … … … … … [4]
Question paper, page 9
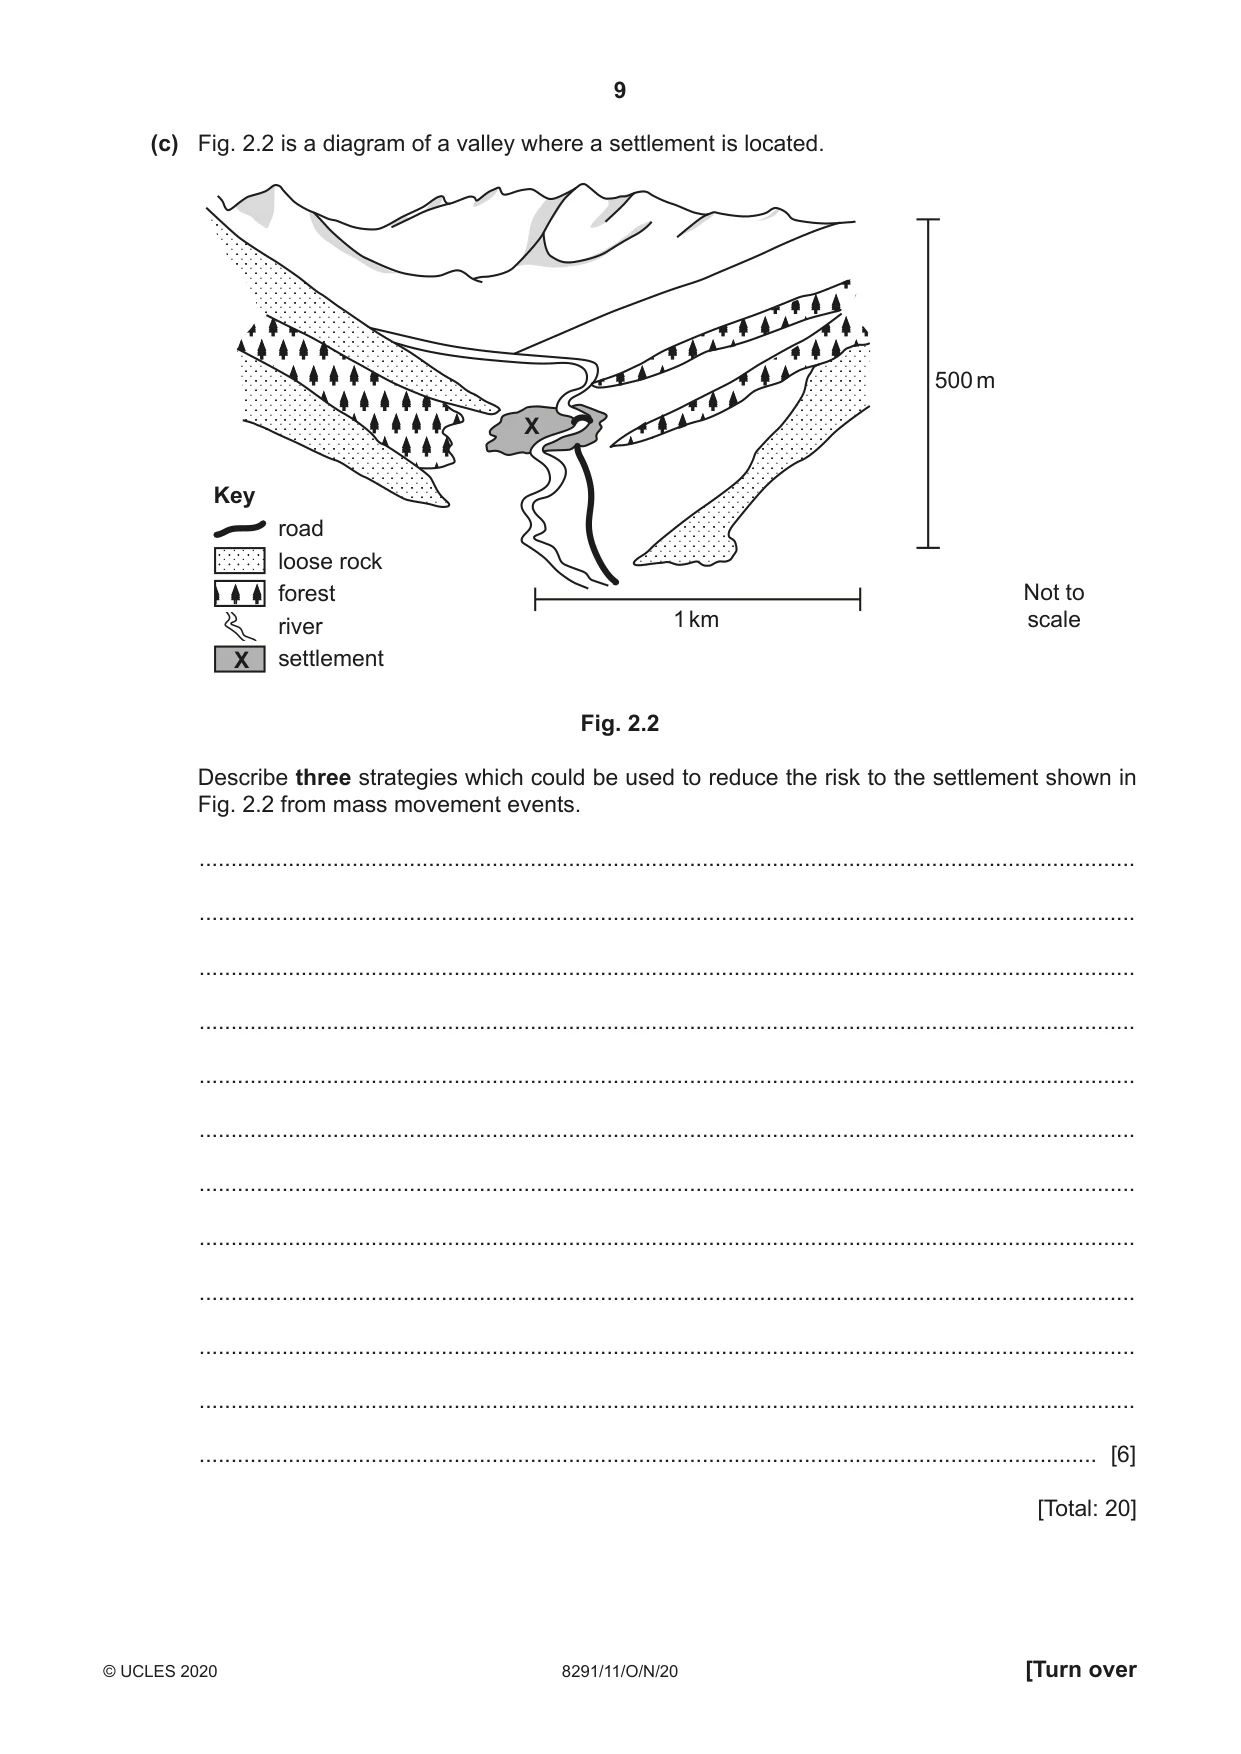
9 8291/11/O/N/20 © UCLES 2020 [Turn over (c) Fig. 2.2 is a diagram of a valley where a settlement is located. X 1 km 500 m Key road loose rock forest river settlement X Not to scale Fig. 2.2 Describe three strategies which could be used to reduce the risk to the settlement shown in Fig. 2.2 from mass movement events. … … … … … … … … … … … … [6] [Total: 20]
Question paper, page 10
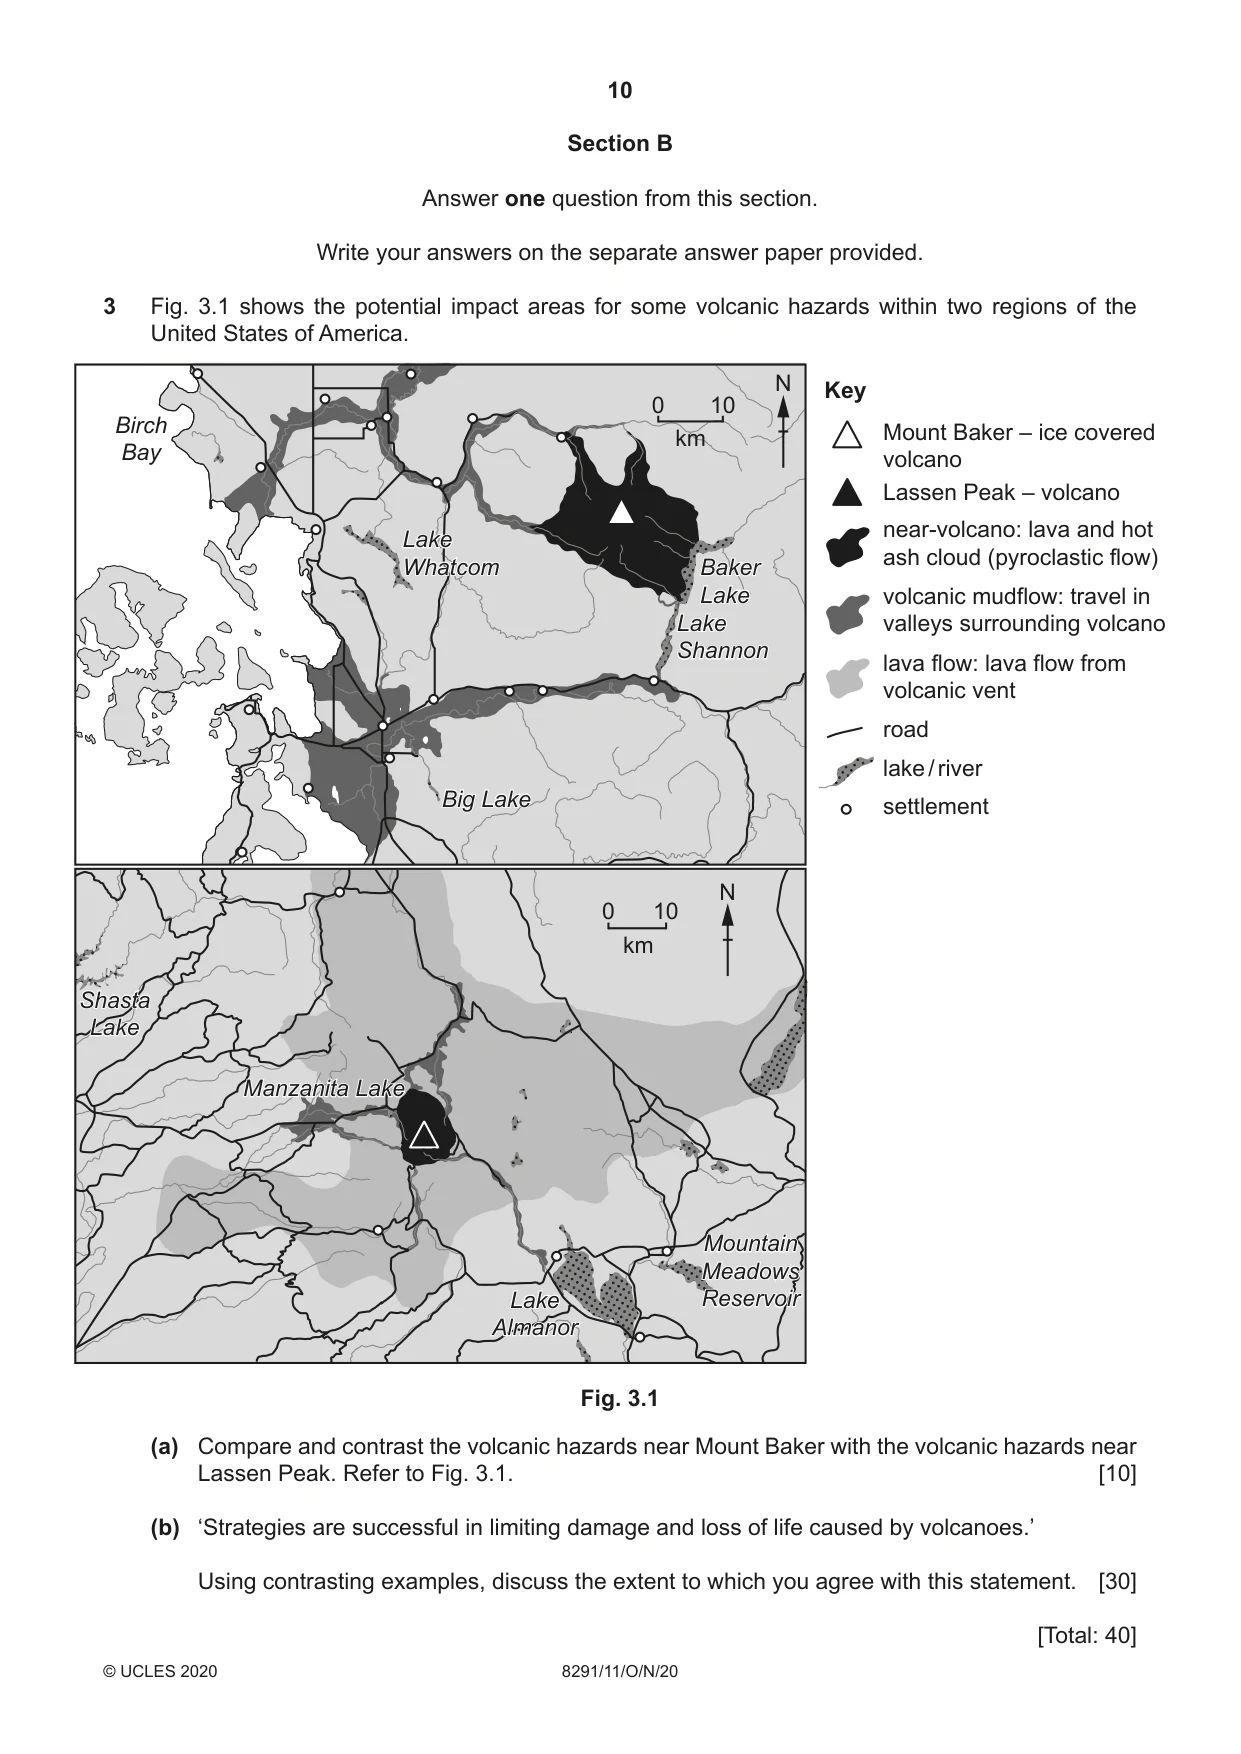
10 8291/11/O/N/20 © UCLES 2020 Section B Answer one question from this section. Write your answers on the separate answer paper provided. 3 Fig. 3.1 shows the potential impact areas for some volcanic hazards within two regions of the United States of America. km 0 10 km 0 10 Birch Bay Big Lake Lake Whatcom Baker Lake Lake Shannon N N Key near-volcano: lava and hot ash cloud (pyroclastic flow) volcanic mudflow: travel in valleys surrounding volcano lava flow: lava flow from volcanic vent road lake / river settlement Lassen Peak – volcano Mount Baker – ice covered volcano Birch Bay Big Lake Lake Whatcom Baker Lake Lake Shannon Manzanita Lake Shasta Lake Lake Almanor Mountain Meadows Reservoir Manzanita Lake Shasta Lake Lake Almanor Mountain Meadows Reservoir Fig. 3.1 (a) Compare and contrast the volcanic hazards near Mount Baker with the volcanic hazards near Lassen Peak. Refer to Fig. 3.1. [10] (b) ‘Strategies are successful in limiting damage and loss of life caused by volcanoes.’ Using contrasting examples, discuss the extent to which you agree with this statement. [30] [Total: 40]
Question paper, page 11
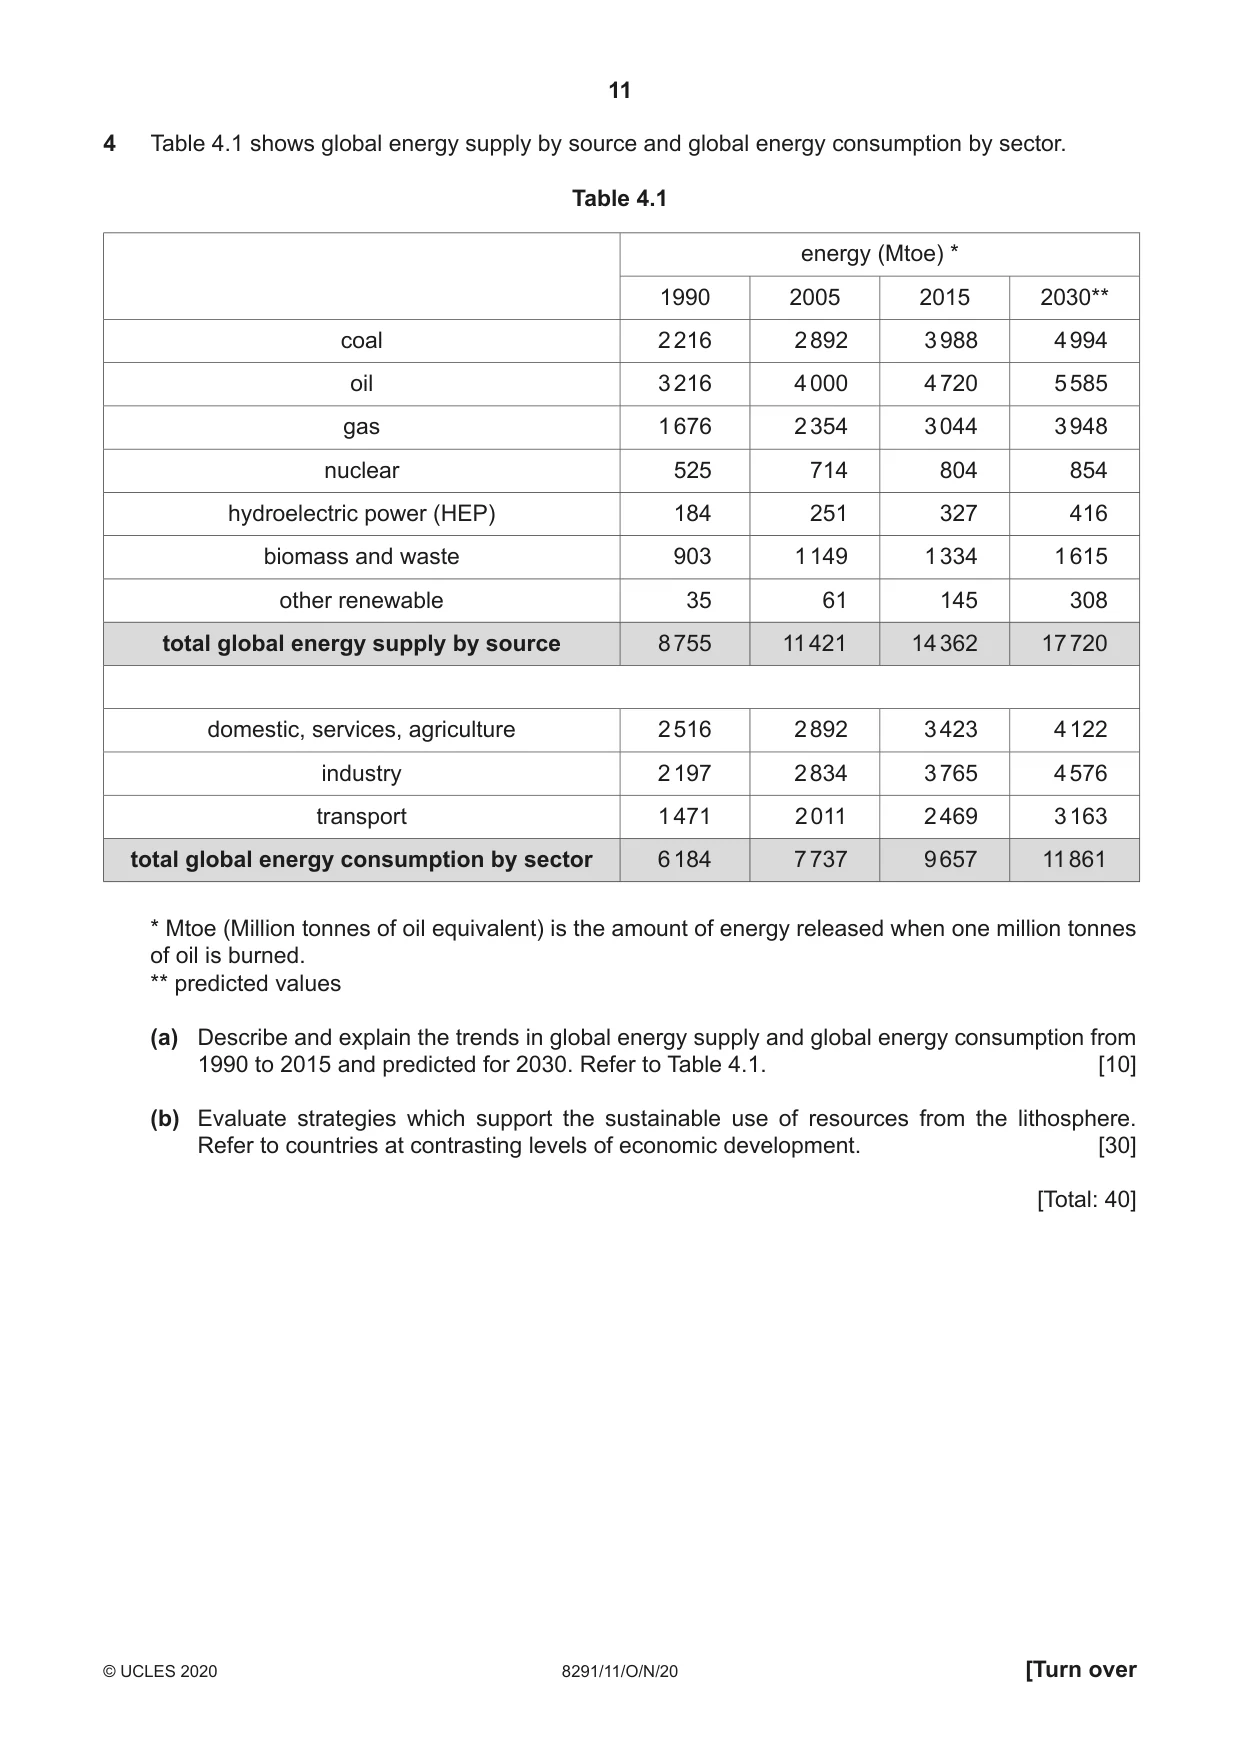
11 8291/11/O/N/20 © UCLES 2020 [Turn over 4 Table 4.1 shows global energy supply by source and global energy consumption by sector. Table 4.1 energy (Mtoe) * 1990 2005 2015 2030** coal 2 216 2 892 3 988 4 994 oil 3 216 4 000 4 720 5 585 gas 1 676 2 354 3 044 3 948 nuclear 525 714 804 854 hydroelectric power (HEP) 184 251 327 416 biomass and waste 903 1 149 1 334 1 615 other renewable 35 61 145 308 total global energy supply by source 8 755 11 421 14 362 17 720 domestic, services, agriculture 2 516 2 892 3 423 4 122 industry 2 197 2 834 3 765 4 576 transport 1 471 2 011 2 469 3 163 total global energy consumption by sector 6 184 7 737 9 657 11 861 * Mtoe (Million tonnes of oil equivalent) is the amount of energy released when one million tonnes of oil is burned. ** predicted values (a) Describe and explain the trends in global energy supply and global energy consumption from 1990 to 2015 and predicted for 2030. Refer to Table 4.1. [10] (b) Evaluate strategies which support the sustainable use of resources from the lithosphere. Refer to countries at contrasting levels of economic development. [30] [Total: 40]
Question paper, page 12
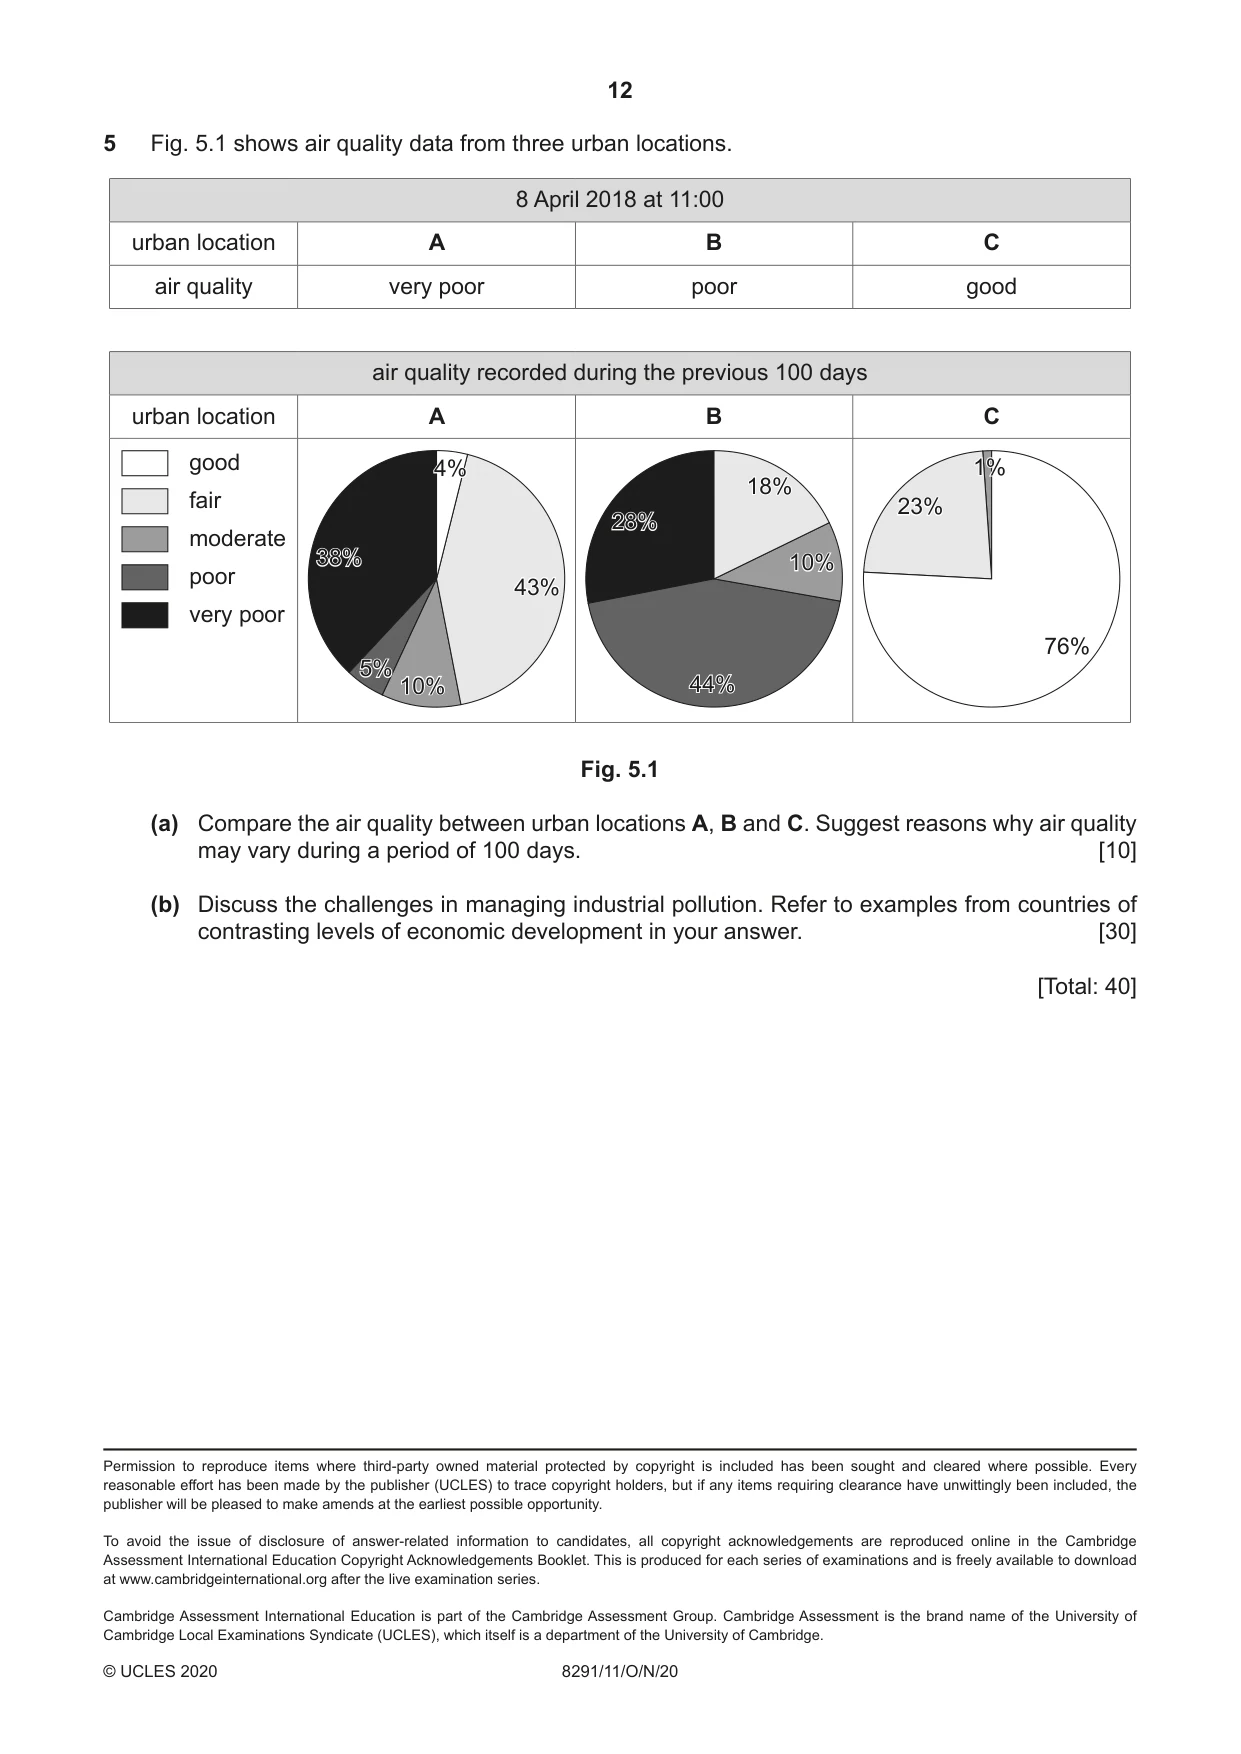
12 8291/11/O/N/20 © UCLES 2020 Permission to reproduce items where third-party owned material protected by copyright is included has been sought and cleared where possible. Every reasonable effort has been made by the publisher (UCLES) to trace copyright holders, but if any items requiring clearance have unwittingly been included, the publisher will be pleased to make amends at the earliest possible opportunity. To avoid the issue of disclosure of answer-related information to candidates, all copyright acknowledgements are reproduced online in the Cambridge Assessment International Education Copyright Acknowledgements Booklet. This is produced for each series of examinations and is freely available to download at www.cambridgeinternational.org after the live examination series. Cambridge Assessment International Education is part of the Cambridge Assessment Group. Cambridge Assessment is the brand name of the University of Cambridge Local Examinations Syndicate (UCLES), which itself is a department of the University of Cambridge. 5 Fig. 5.1 shows air quality data from three urban locations. 8 April 2018 at 11:00 urban location A B C air quality very poor poor good air quality recorded during the previous 100 days urban location A B C good fair moderate poor very poor 4% 5% 43% 38% 10% 4% 5% 43% 38% 10% 28% 18% 10% 44% 28% 18% 10% 44% 76% 1% 23% 76% 1% 23% Fig. 5.1 (a) Compare the air quality between urban locations A, B and C. Suggest reasons why air quality may vary during a period of 100 days. [10] (b) Discuss the challenges in managing industrial pollution. Refer to examples from countries of contrasting levels of economic development in your answer. [30] [Total: 40]
Mark scheme, page 1
This document consists of 18 printed pages. © UCLES 2020 [Turn over Cambridge International AS Level ENVIRONMENTAL MANAGEMENT 8291/11 Paper 1 October/November 2020 MARK SCHEME Maximum Mark: 80 Published This mark scheme is published as an aid to teachers and candidates, to indicate the requirements of the examination. It shows the basis on which Examiners were instructed to award marks. It does not indicate the details of the discussions that took place at an Examiners’ meeting before marking began, which would have considered the acceptability of alternative answers. Mark schemes should be read in conjunction with the question paper and the Principal Examiner Report for Teachers. Cambridge International will not enter into discussions about these mark schemes. Cambridge International is publishing the mark schemes for the October/November 2020 series for most Cambridge IGCSE™, Cambridge International A and AS Level and Cambridge Pre-U components, and some Cambridge O Level components.
Mark scheme, page 2
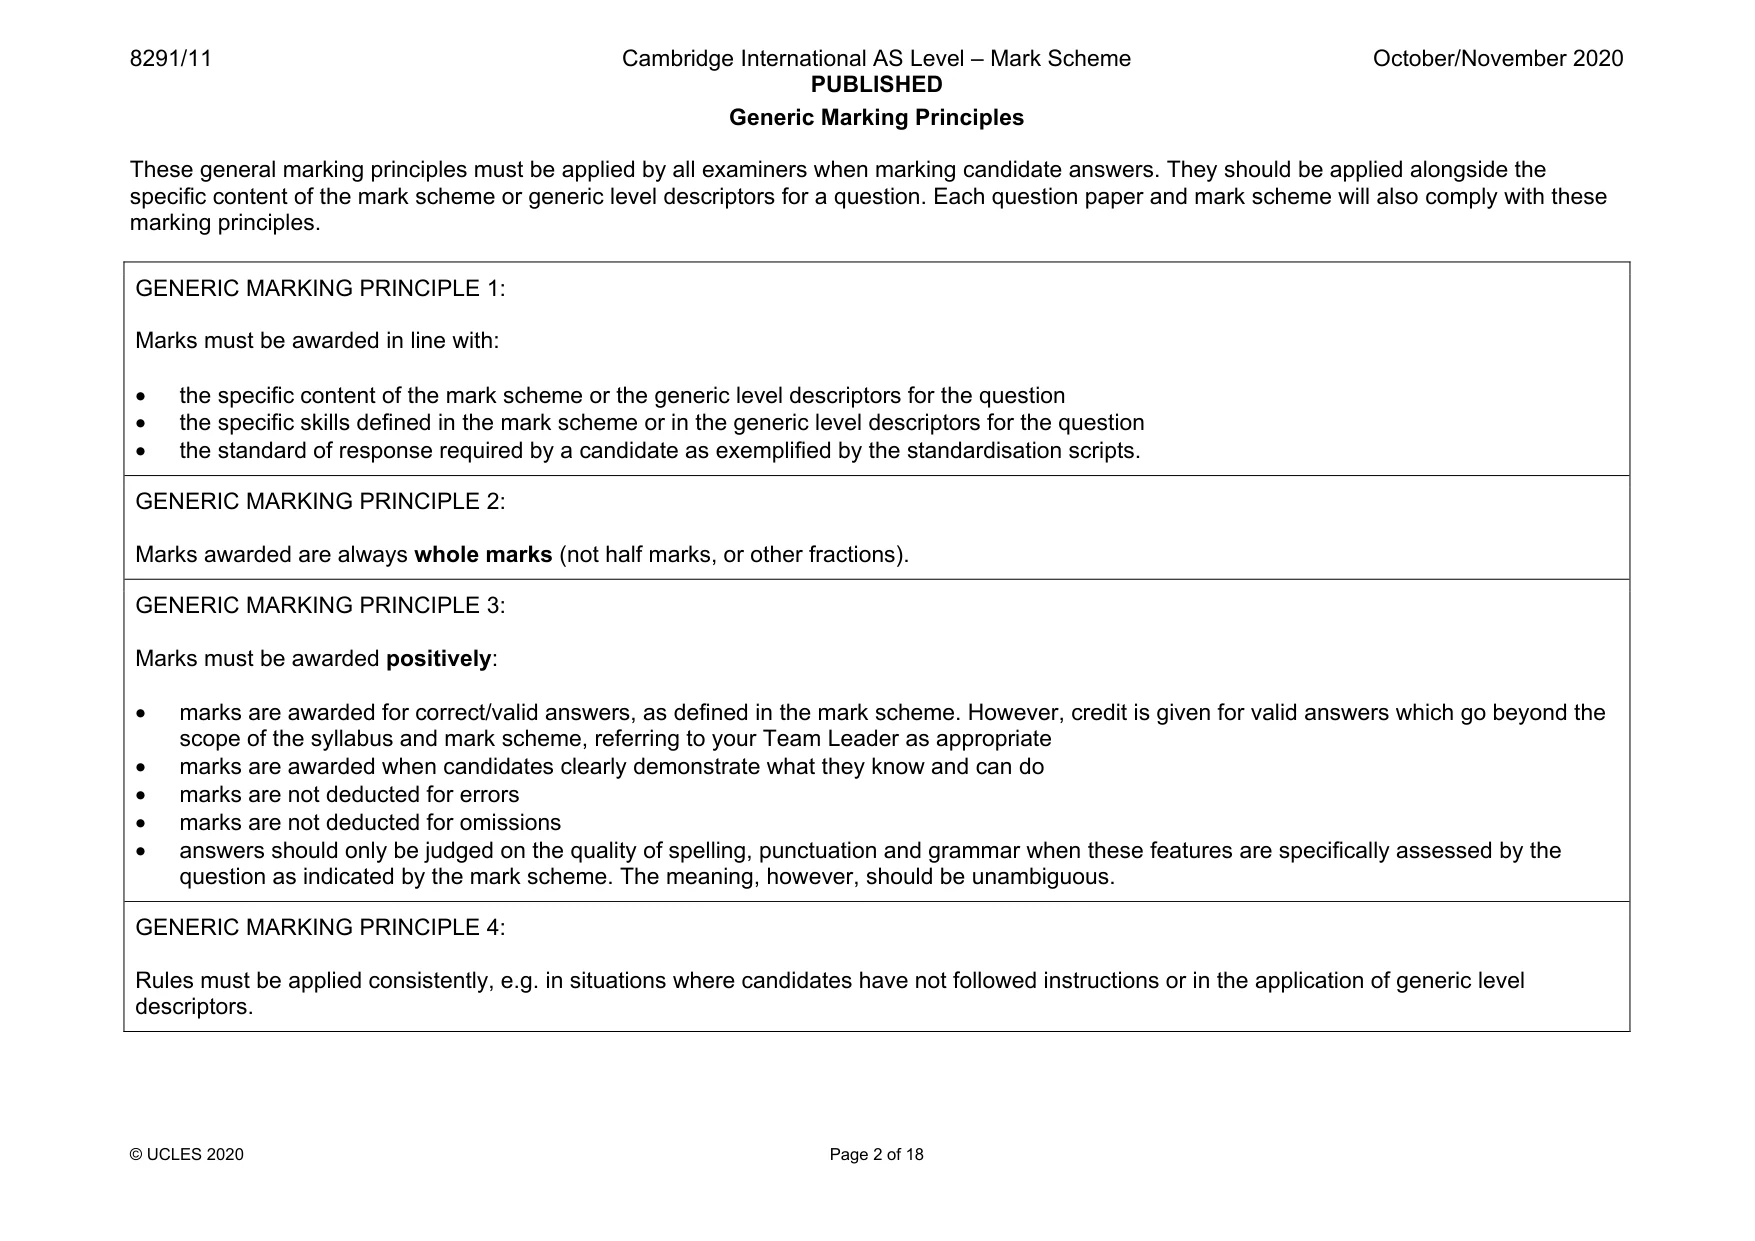
8291/11 Cambridge International AS Level – Mark Scheme PUBLISHED October/November 2020 © UCLES 2020 Page 2 of 18 Generic Marking Principles These general marking principles must be applied by all examiners when marking candidate answers. They should be applied alongside the specific content of the mark scheme or generic level descriptors for a question. Each question paper and mark scheme will also comply with these marking principles. GENERIC MARKING PRINCIPLE 1: Marks must be awarded in line with: • the specific content of the mark scheme or the generic level descriptors for the question • the specific skills defined in the mark scheme or in the generic level descriptors for the question • the standard of response required by a candidate as exemplified by the standardisation scripts. GENERIC MARKING PRINCIPLE 2: Marks awarded are always whole marks (not half marks, or other fractions). GENERIC MARKING PRINCIPLE 3: Marks must be awarded positively: • marks are awarded for correct/valid answers, as defined in the mark scheme. However, credit is given for valid answers which go beyond the scope of the syllabus and mark scheme, referring to your Team Leader as appropriate • marks are awarded when candidates clearly demonstrate what they know and can do • marks are not deducted for errors • marks are not deducted for omissions • answers should only be judged on the quality of spelling, punctuation and grammar when these features are specifically assessed by the question as indicated by the mark scheme. The meaning, however, should be unambiguous. GENERIC MARKING PRINCIPLE 4: Rules must be applied consistently, e.g. in situations where candidates have not followed instructions or in the application of generic level descriptors.
Mark scheme, page 3
8291/11 Cambridge International AS Level – Mark Scheme PUBLISHED October/November 2020 © UCLES 2020 Page 3 of 18 GENERIC MARKING PRINCIPLE 5: Marks should be awarded using the full range of marks defined in the mark scheme for the question (however; the use of the full mark range may be limited according to the quality of the candidate responses seen). GENERIC MARKING PRINCIPLE 6: Marks awarded are based solely on the requirements as defined in the mark scheme. Marks should not be awarded with grade thresholds or grade descriptors in mind.
Mark scheme, page 4
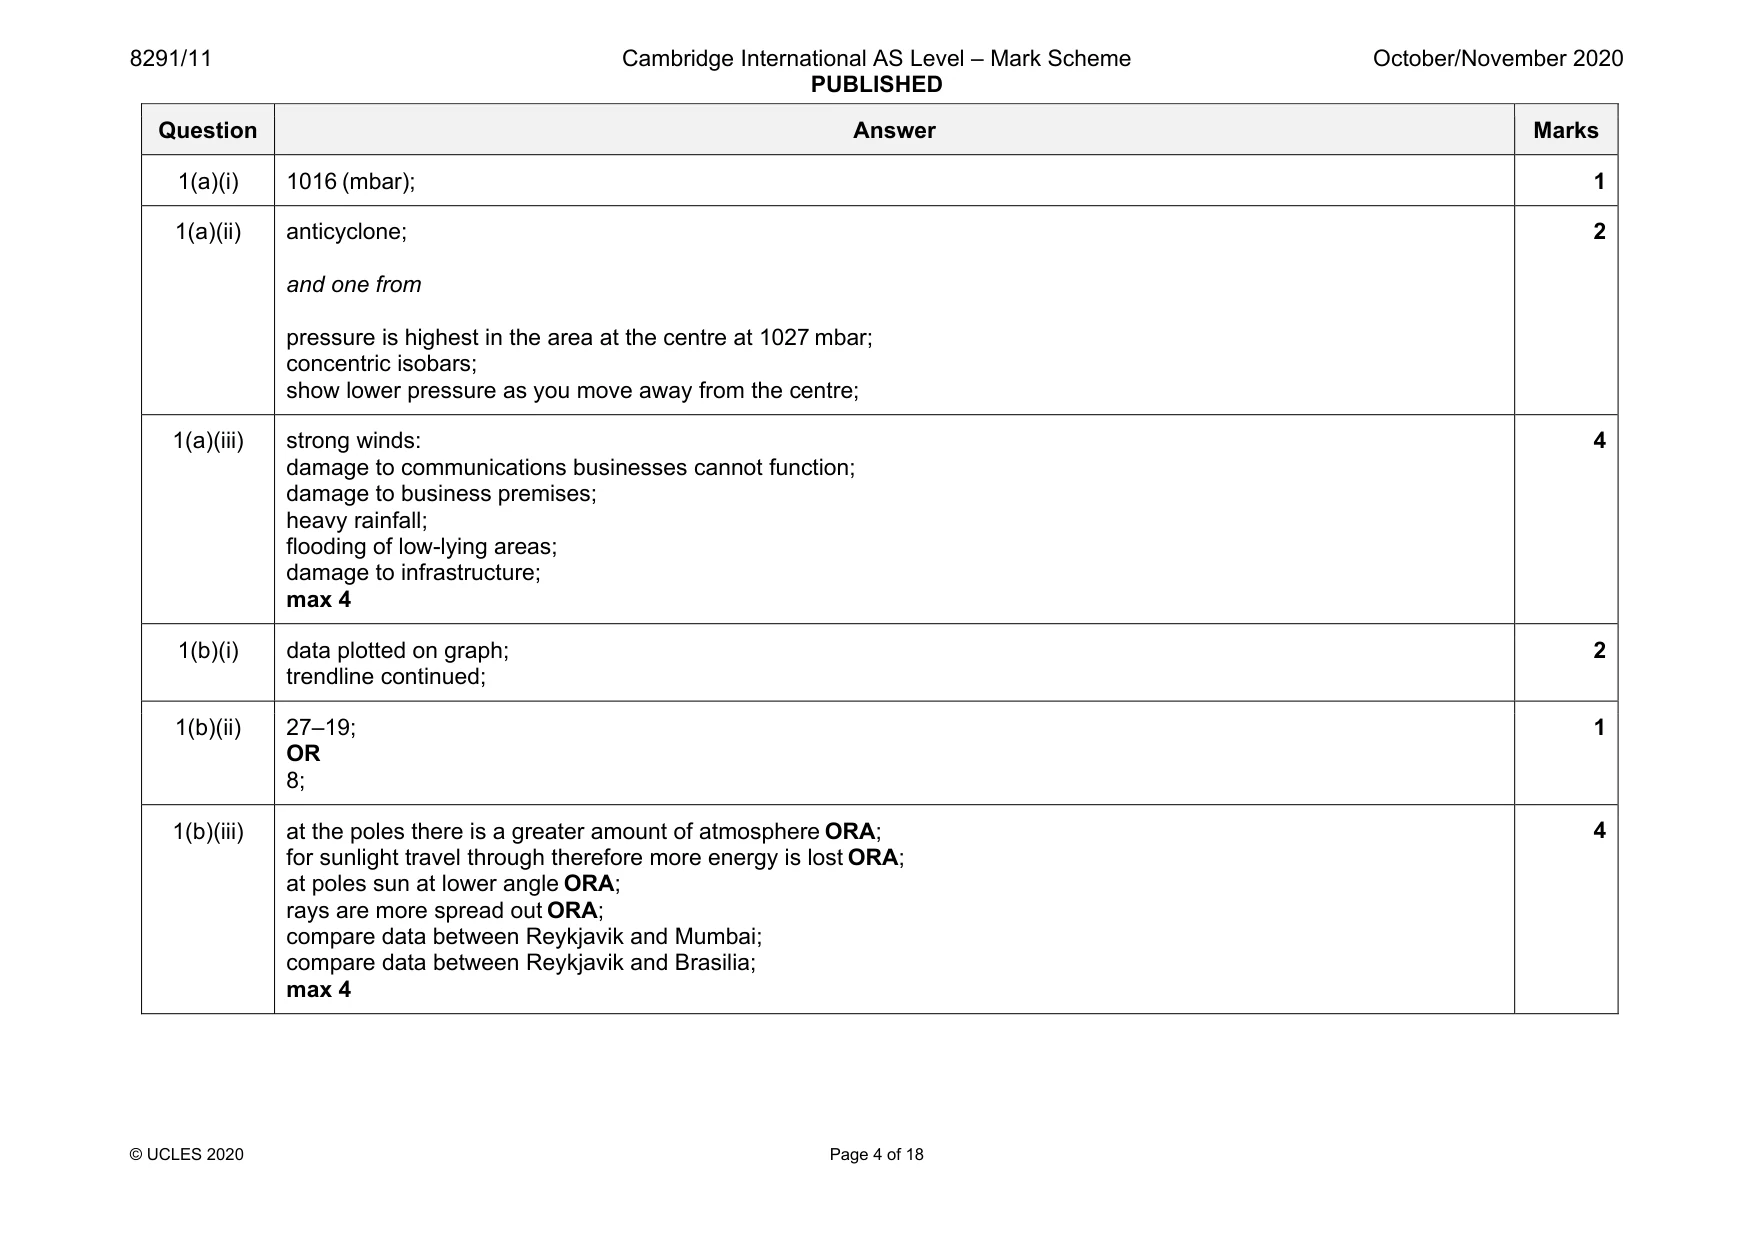
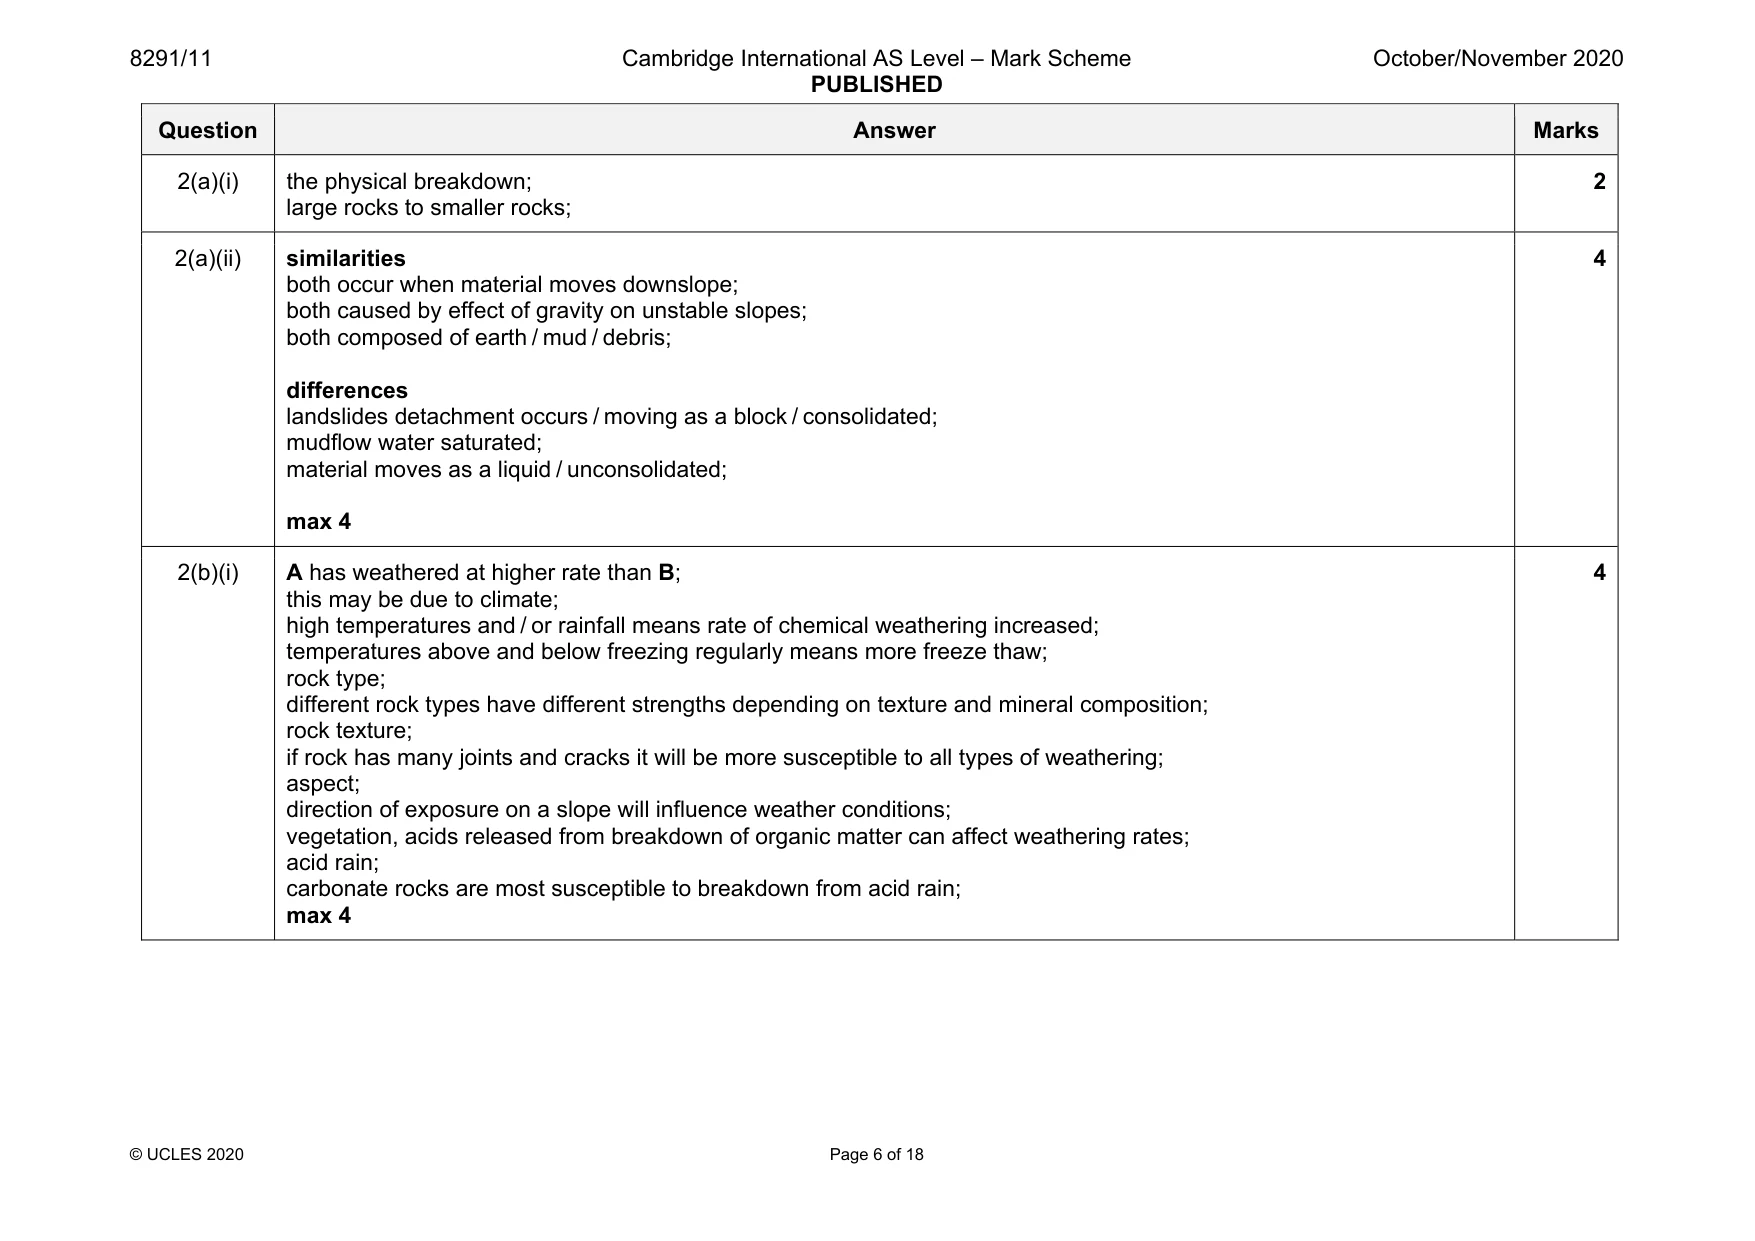
8291/11 Cambridge International AS Level – Mark Scheme PUBLISHED October/November 2020 © UCLES 2020 Page 4 of 18 Question Answer Marks 1(a)(i) 1016 (mbar); 1 1(a)(ii) anticyclone; and one from pressure is highest in the area at the centre at 1027 mbar; concentric isobars; show lower pressure as you move away from the centre; 2 1(a)(iii) strong winds: damage to communications businesses cannot function; damage to business premises; heavy rainfall; flooding of low-lying areas; damage to infrastructure; max 4 4 1(b)(i) data plotted on graph; trendline continued; 2 1(b)(ii) 27–19; OR 8; 1 1(b)(iii) at the poles there is a greater amount of atmosphere ORA; for sunlight travel through therefore more energy is lost ORA; at poles sun at lower angle ORA; rays are more spread out ORA; compare data between Reykjavik and Mumbai; compare data between Reykjavik and Brasilia; max 4 4
Mark scheme, page 5
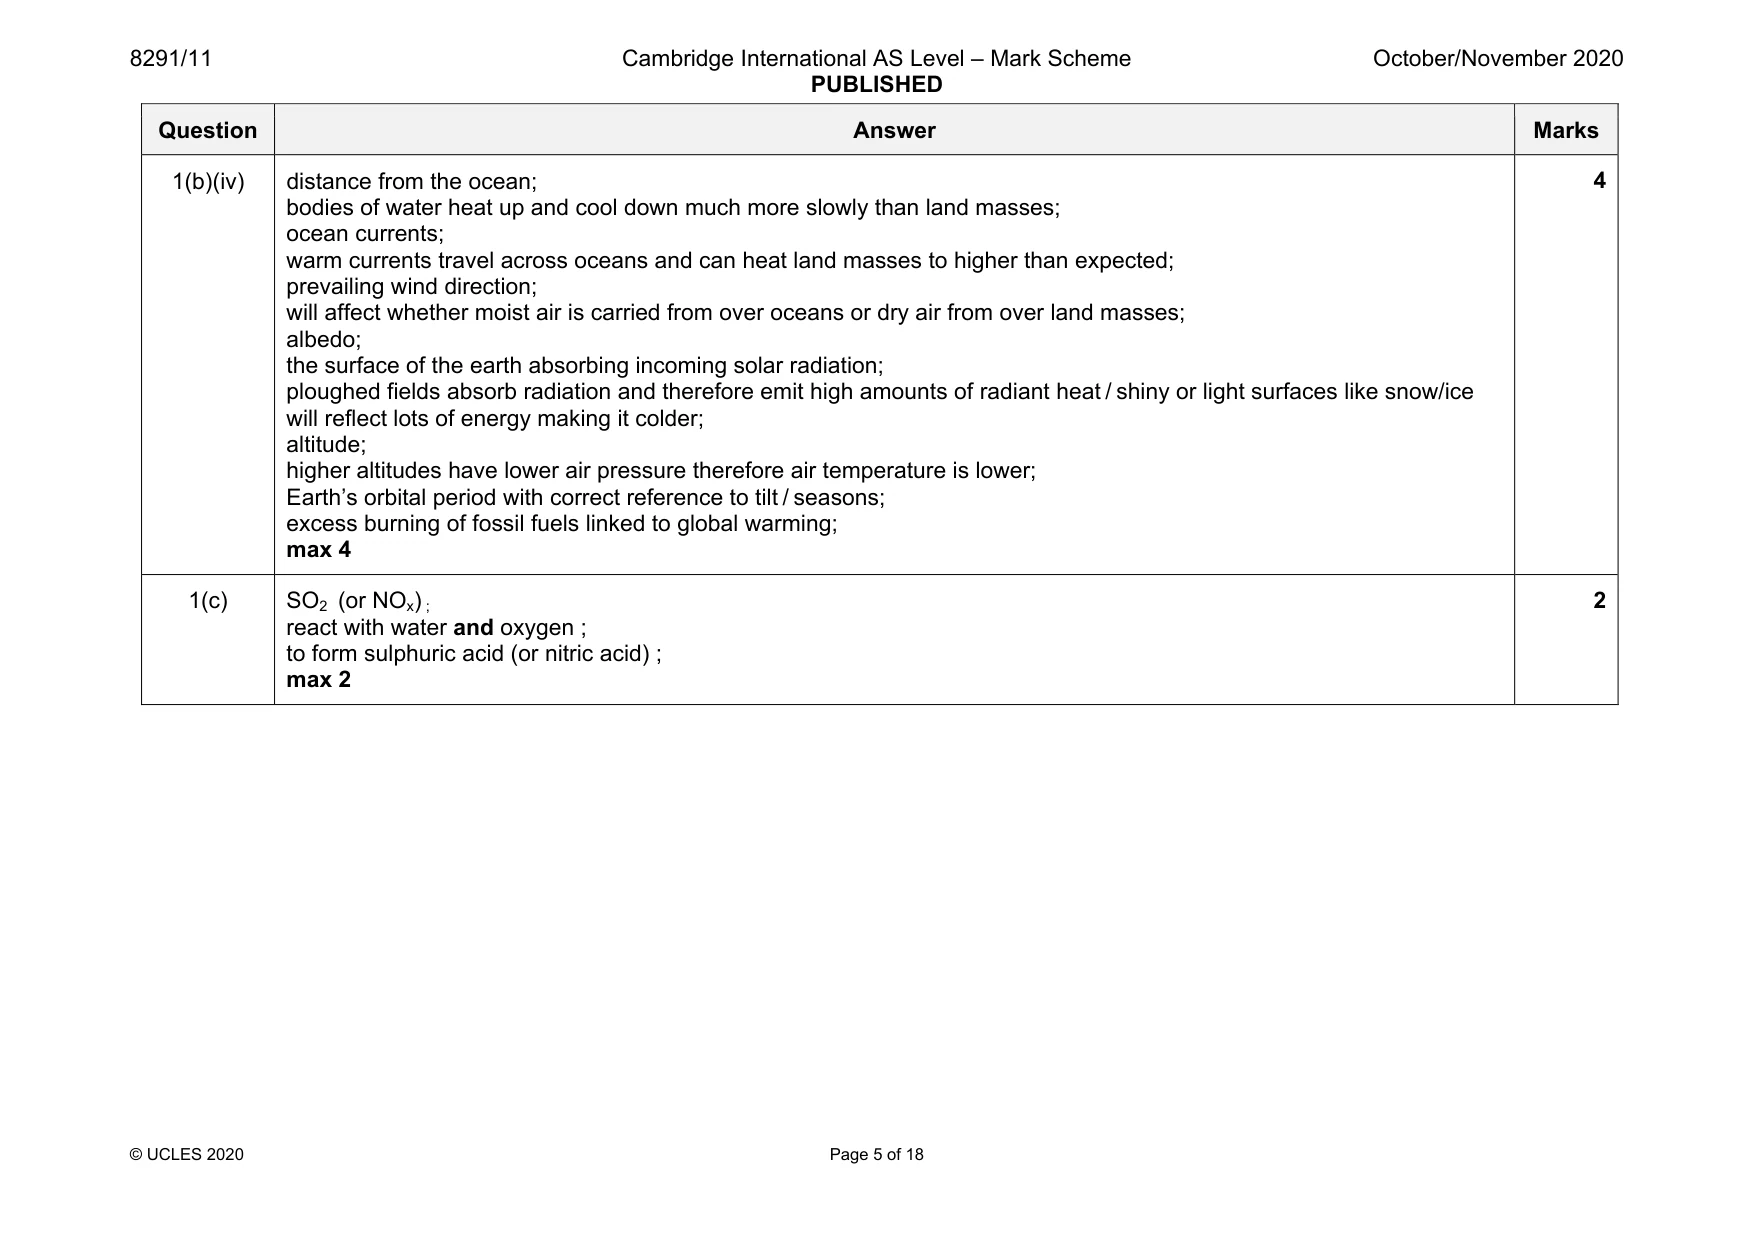
8291/11 Cambridge International AS Level – Mark Scheme PUBLISHED October/November 2020 © UCLES 2020 Page 5 of 18 Question Answer Marks 1(b)(iv) distance from the ocean; bodies of water heat up and cool down much more slowly than land masses; ocean currents; warm currents travel across oceans and can heat land masses to higher than expected; prevailing wind direction; will affect whether moist air is carried from over oceans or dry air from over land masses; albedo; the surface of the earth absorbing incoming solar radiation; ploughed fields absorb radiation and therefore emit high amounts of radiant heat / shiny or light surfaces like snow/ice will reflect lots of energy making it colder; altitude; higher altitudes have lower air pressure therefore air temperature is lower; Earth’s orbital period with correct reference to tilt / seasons; excess burning of fossil fuels linked to global warming; max 4 4 1(c) SO2 (or NOx) ; react with water and oxygen ; to form sulphuric acid (or nitric acid) ; max 2 2
Mark scheme, page 6
8291/11 Cambridge International AS Level – Mark Scheme PUBLISHED October/November 2020 © UCLES 2020 Page 6 of 18 Question Answer Marks 2(a)(i) the physical breakdown; large rocks to smaller rocks; 2 2(a)(ii) similarities both occur when material moves downslope; both caused by effect of gravity on unstable slopes; both composed of earth / mud / debris; differences landslides detachment occurs / moving as a block / consolidated; mudflow water saturated; material moves as a liquid / unconsolidated; max 4 4 2(b)(i) A has weathered at higher rate than B; this may be due to climate; high temperatures and / or rainfall means rate of chemical weathering increased; temperatures above and below freezing regularly means more freeze thaw; rock type; different rock types have different strengths depending on texture and mineral composition; rock texture; if rock has many joints and cracks it will be more susceptible to all types of weathering; aspect; direction of exposure on a slope will influence weather conditions; vegetation, acids released from breakdown of organic matter can affect weathering rates; acid rain; carbonate rocks are most susceptible to breakdown from acid rain; max 4 4
Mark scheme, page 7
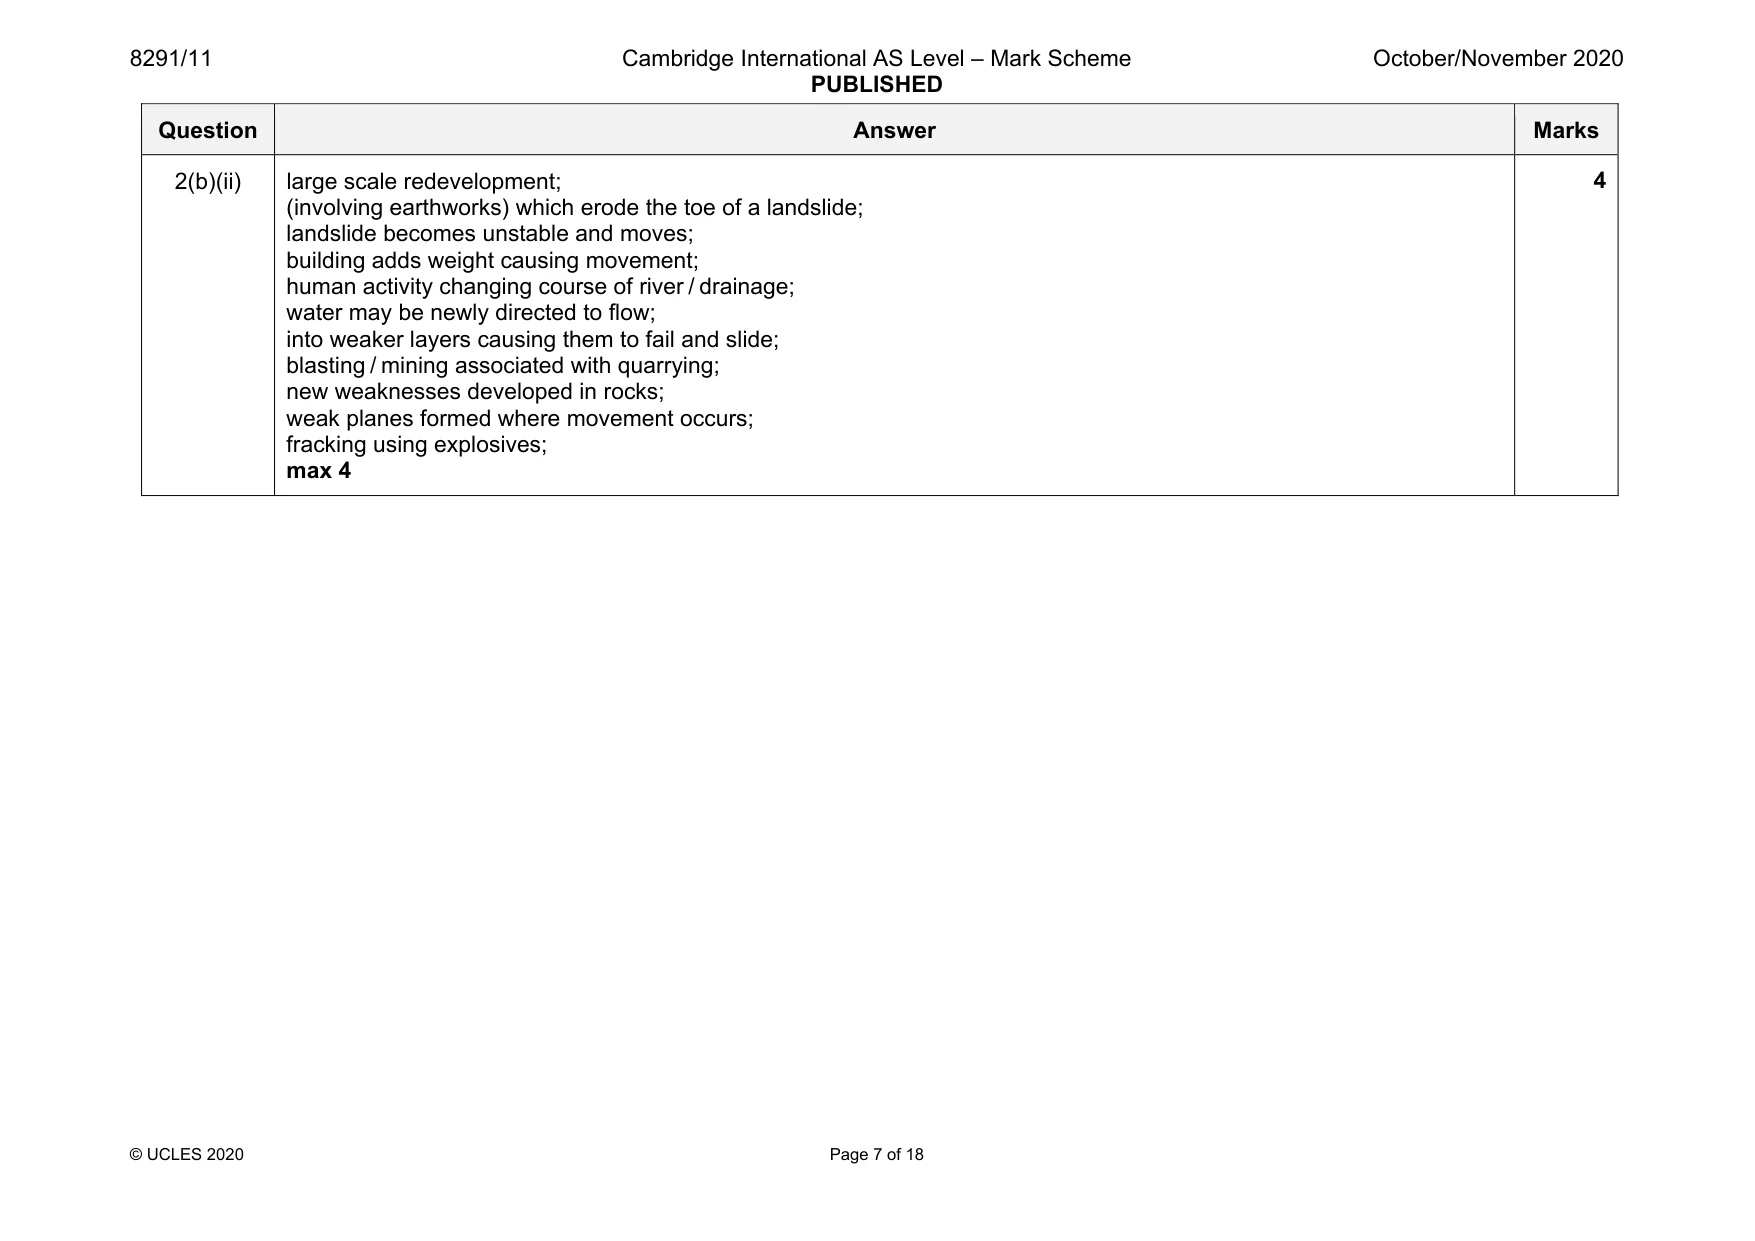
8291/11 Cambridge International AS Level – Mark Scheme PUBLISHED October/November 2020 © UCLES 2020 Page 7 of 18 Question Answer Marks 2(b)(ii) large scale redevelopment; (involving earthworks) which erode the toe of a landslide; landslide becomes unstable and moves; building adds weight causing movement; human activity changing course of river / drainage; water may be newly directed to flow; into weaker layers causing them to fail and slide; blasting / mining associated with quarrying; new weaknesses developed in rocks; weak planes formed where movement occurs; fracking using explosives; max 4 4
Mark scheme, page 8
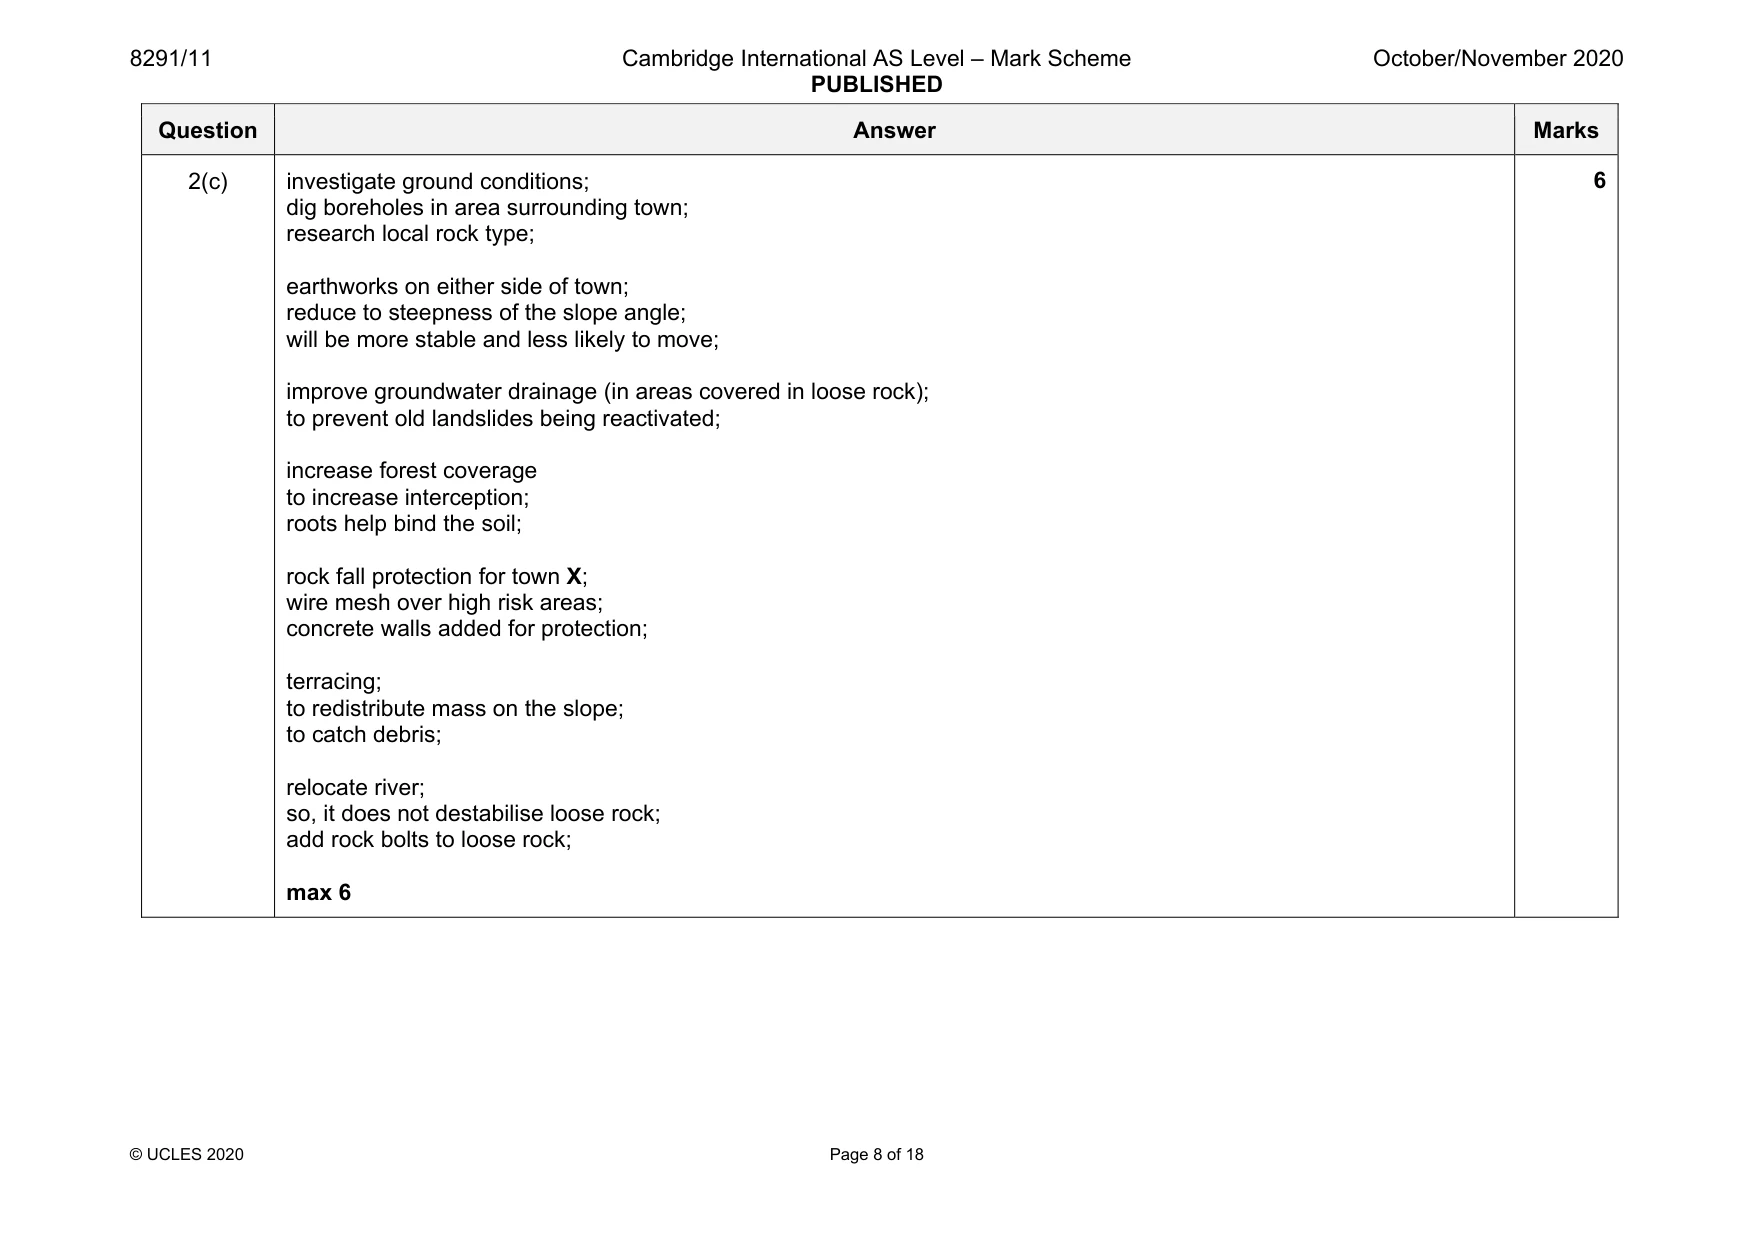
8291/11 Cambridge International AS Level – Mark Scheme PUBLISHED October/November 2020 © UCLES 2020 Page 8 of 18 Question Answer Marks 2(c) investigate ground conditions; dig boreholes in area surrounding town; research local rock type; earthworks on either side of town; reduce to steepness of the slope angle; will be more stable and less likely to move; improve groundwater drainage (in areas covered in loose rock); to prevent old landslides being reactivated; increase forest coverage to increase interception; roots help bind the soil; rock fall protection for town X; wire mesh over high risk areas; concrete walls added for protection; terracing; to redistribute mass on the slope; to catch debris; relocate river; so, it does not destabilise loose rock; add rock bolts to loose rock; max 6 6
Mark scheme, page 9
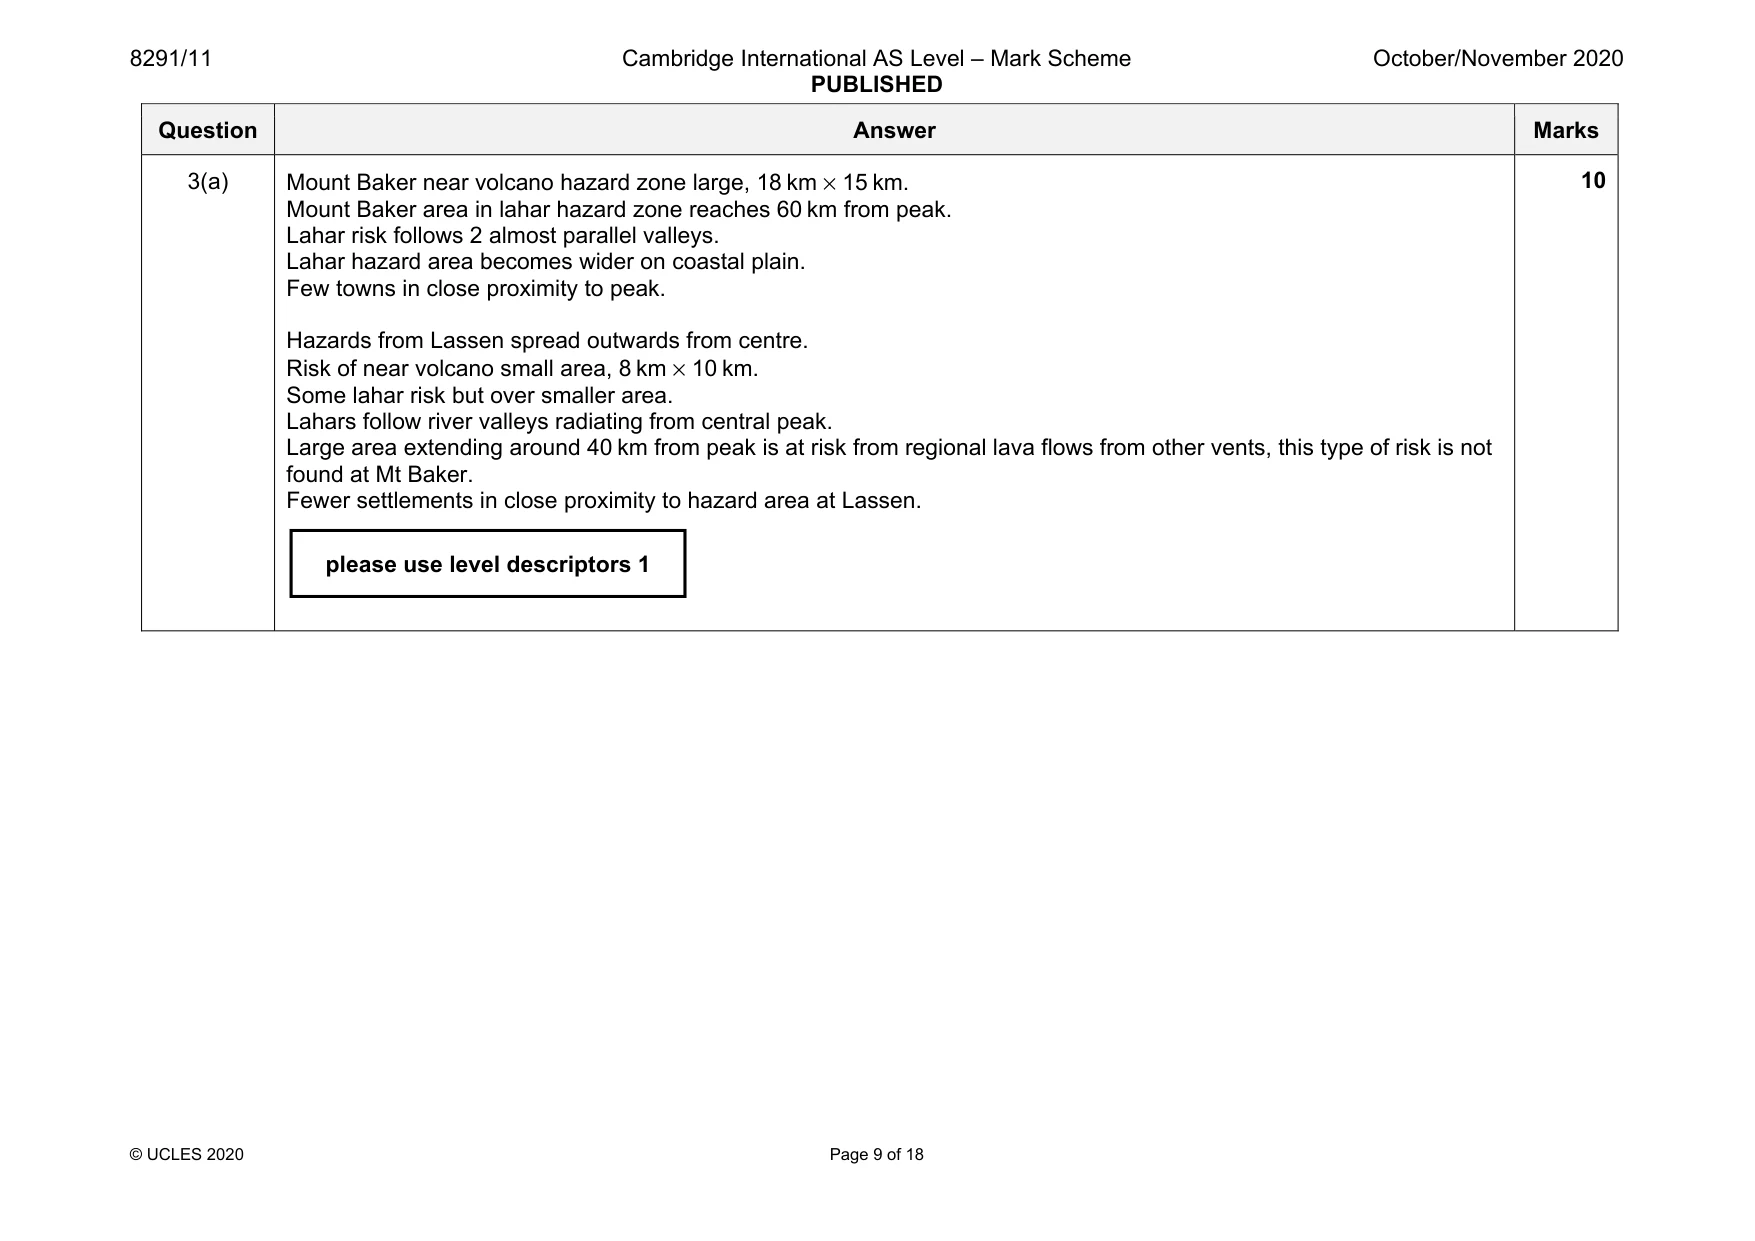
8291/11 Cambridge International AS Level – Mark Scheme PUBLISHED October/November 2020 © UCLES 2020 Page 9 of 18 Question Answer Marks 3(a) Mount Baker near volcano hazard zone large, 18 km × 15 km. Mount Baker area in lahar hazard zone reaches 60 km from peak. Lahar risk follows 2 almost parallel valleys. Lahar hazard area becomes wider on coastal plain. Few towns in close proximity to peak. Hazards from Lassen spread outwards from centre. Risk of near volcano small area, 8 km × 10 km. Some lahar risk but over smaller area. Lahars follow river valleys radiating from central peak. Large area extending around 40 km from peak is at risk from regional lava flows from other vents, this type of risk is not found at Mt Baker. Fewer settlements in close proximity to hazard area at Lassen. 10 please use level descriptors 1
Mark scheme, page 10
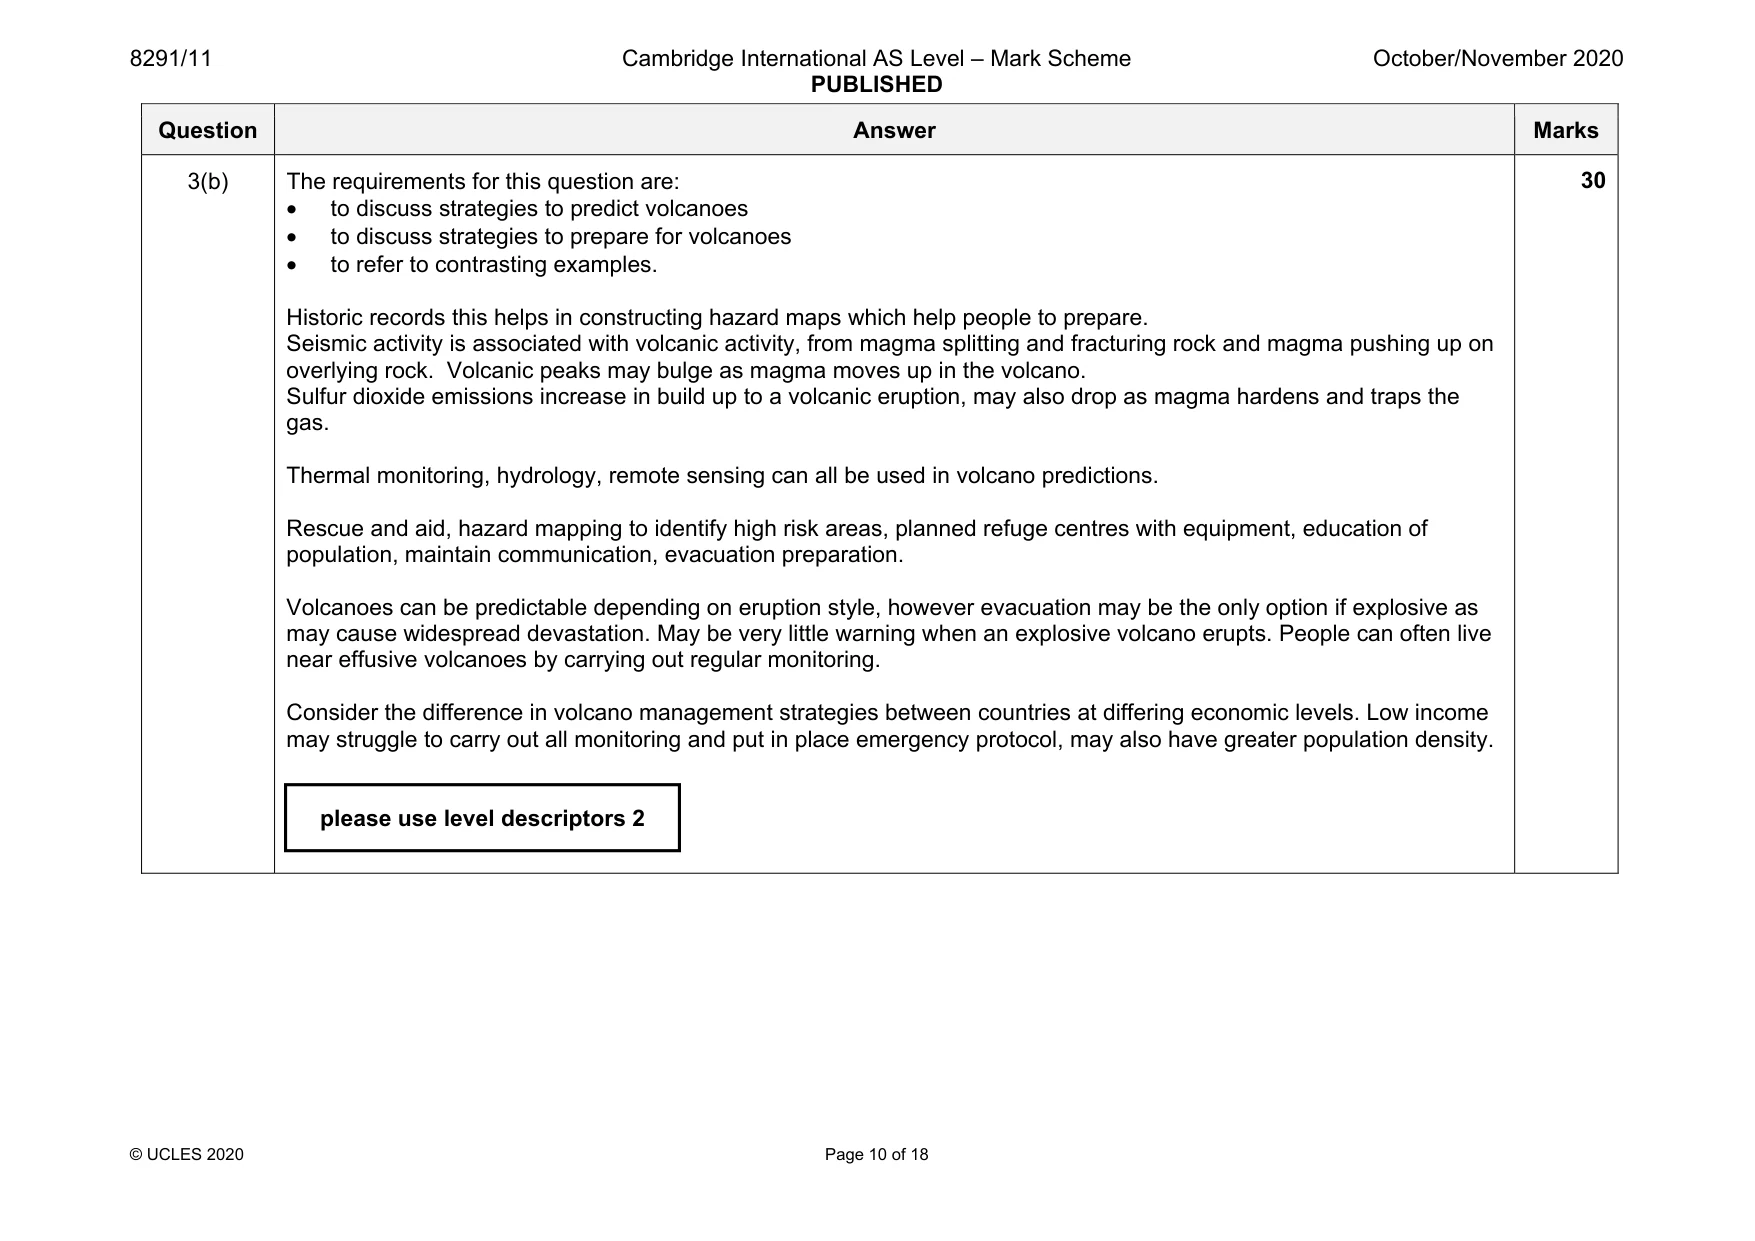
8291/11 Cambridge International AS Level – Mark Scheme PUBLISHED October/November 2020 © UCLES 2020 Page 10 of 18 Question Answer Marks 3(b) The requirements for this question are: • to discuss strategies to predict volcanoes • to discuss strategies to prepare for volcanoes • to refer to contrasting examples. Historic records this helps in constructing hazard maps which help people to prepare. Seismic activity is associated with volcanic activity, from magma splitting and fracturing rock and magma pushing up on overlying rock. Volcanic peaks may bulge as magma moves up in the volcano. Sulfur dioxide emissions increase in build up to a volcanic eruption, may also drop as magma hardens and traps the gas. Thermal monitoring, hydrology, remote sensing can all be used in volcano predictions. Rescue and aid, hazard mapping to identify high risk areas, planned refuge centres with equipment, education of population, maintain communication, evacuation preparation. Volcanoes can be predictable depending on eruption style, however evacuation may be the only option if explosive as may cause widespread devastation. May be very little warning when an explosive volcano erupts. People can often live near effusive volcanoes by carrying out regular monitoring. Consider the difference in volcano management strategies between countries at differing economic levels. Low income may struggle to carry out all monitoring and put in place emergency protocol, may also have greater population density. 30 please use level descriptors 2
Mark scheme, page 11
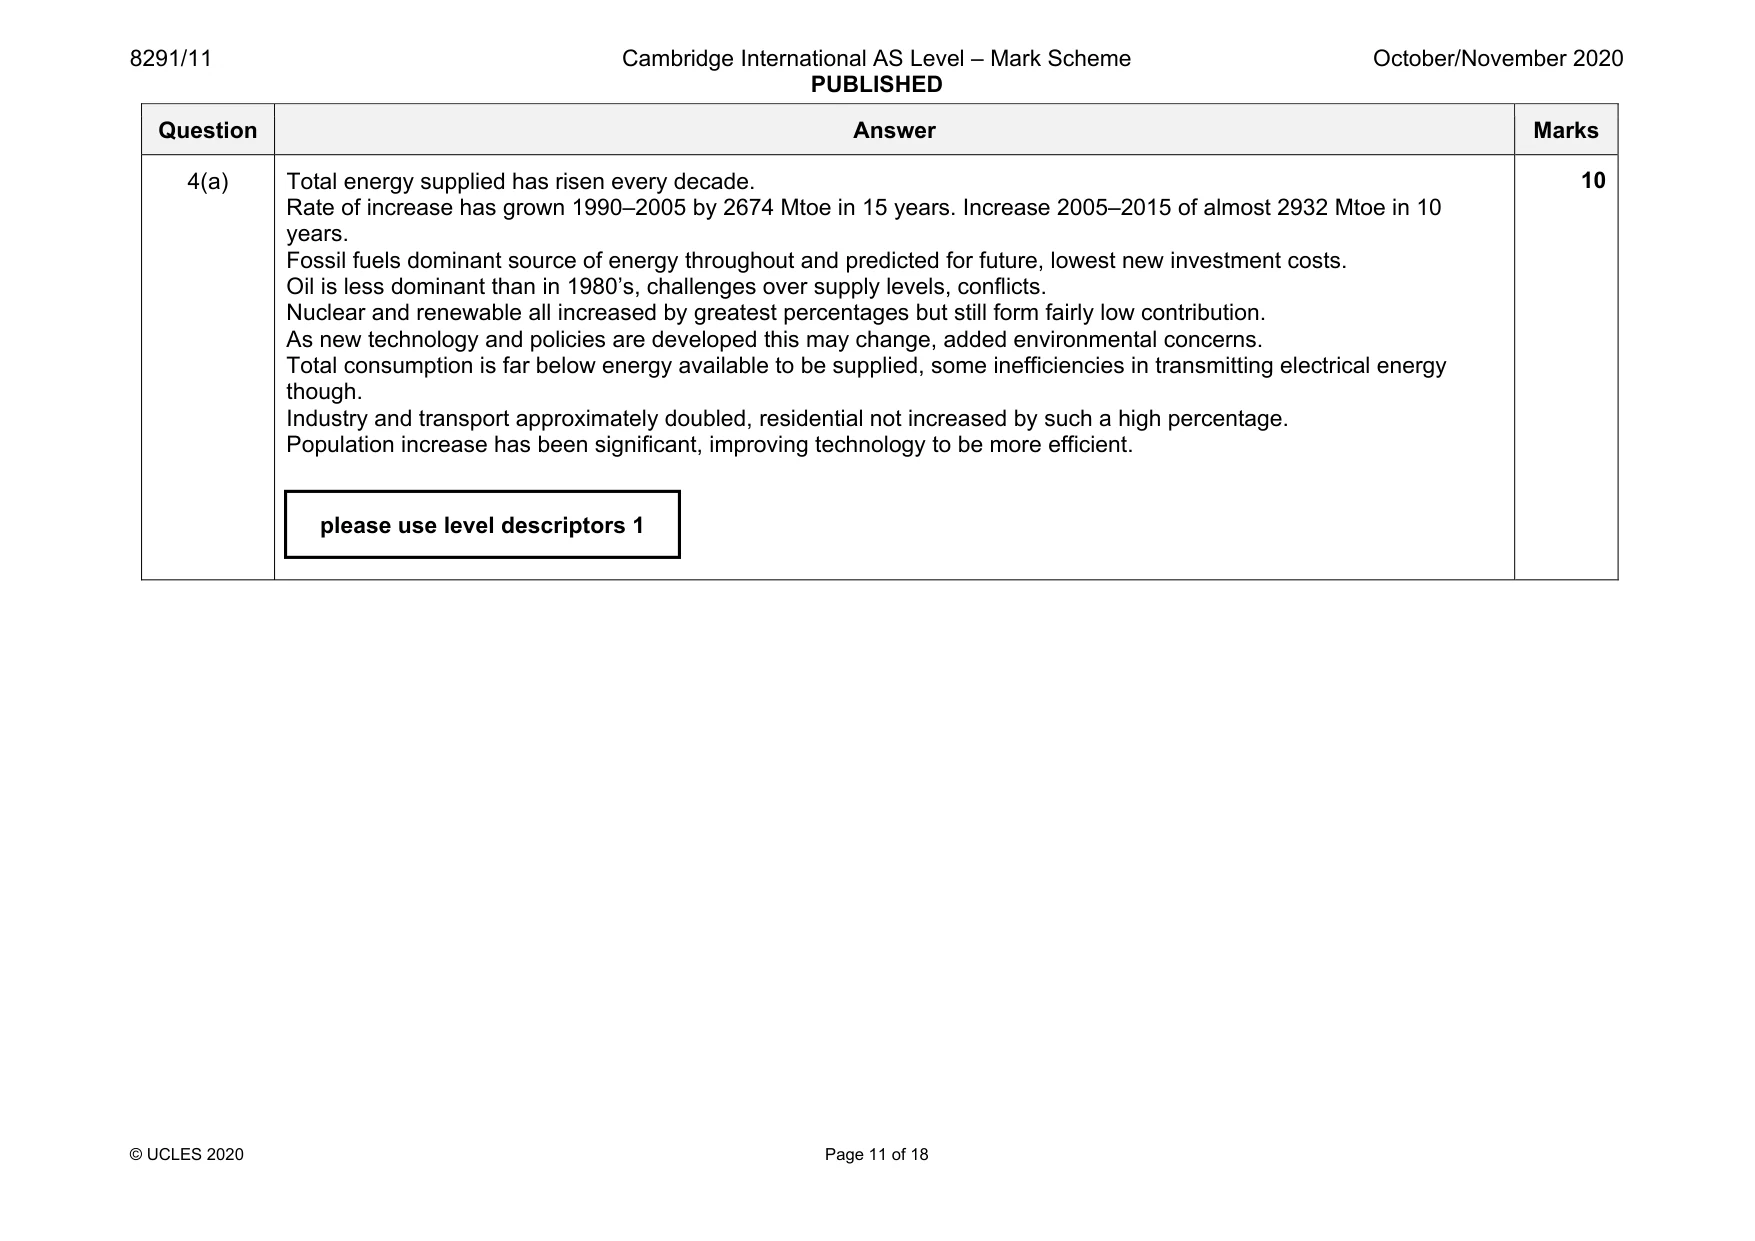
8291/11 Cambridge International AS Level – Mark Scheme PUBLISHED October/November 2020 © UCLES 2020 Page 11 of 18 Question Answer Marks 4(a) Total energy supplied has risen every decade. Rate of increase has grown 1990–2005 by 2674 Mtoe in 15 years. Increase 2005–2015 of almost 2932 Mtoe in 10 years. Fossil fuels dominant source of energy throughout and predicted for future, lowest new investment costs. Oil is less dominant than in 1980’s, challenges over supply levels, conflicts. Nuclear and renewable all increased by greatest percentages but still form fairly low contribution. As new technology and policies are developed this may change, added environmental concerns. Total consumption is far below energy available to be supplied, some inefficiencies in transmitting electrical energy though. Industry and transport approximately doubled, residential not increased by such a high percentage. Population increase has been significant, improving technology to be more efficient. 10 please use level descriptors 1
Mark scheme, page 12
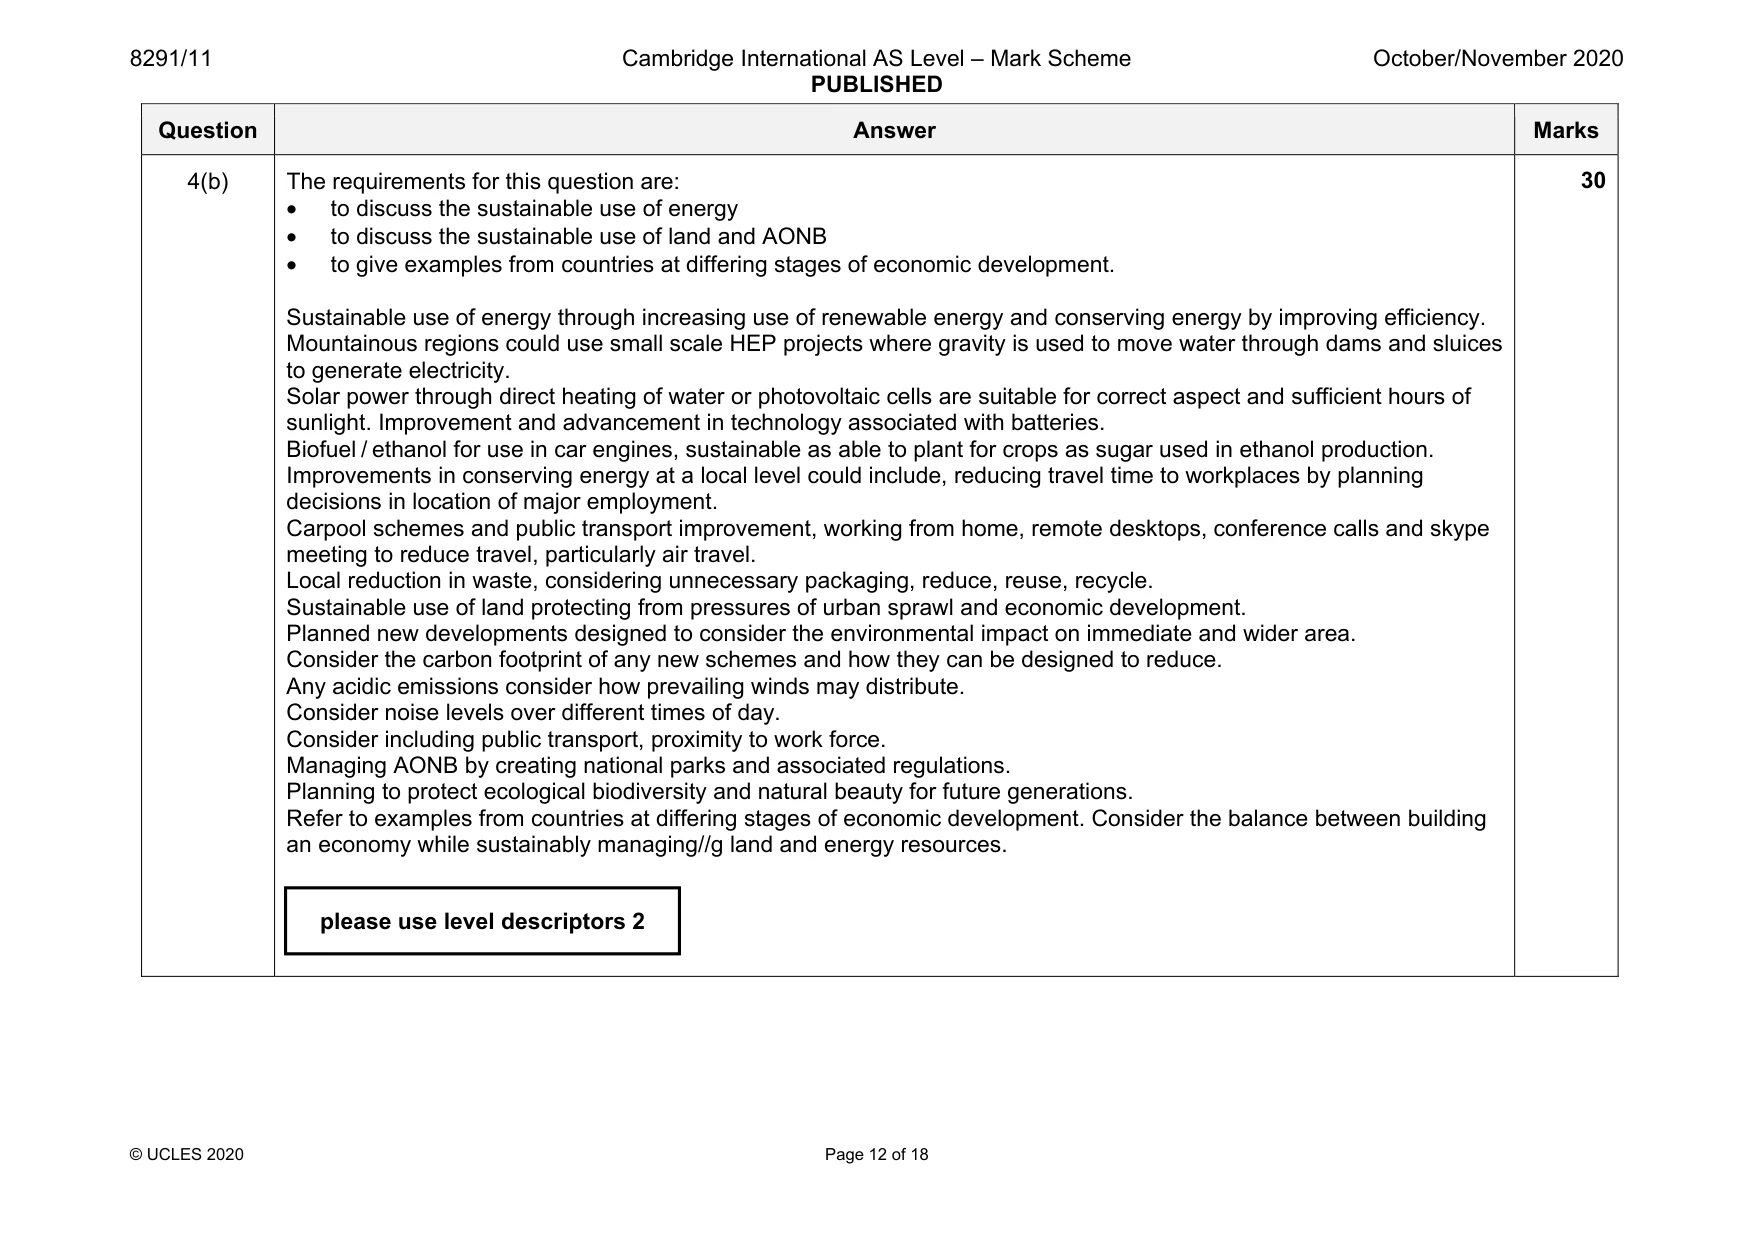
8291/11 Cambridge International AS Level – Mark Scheme PUBLISHED October/November 2020 © UCLES 2020 Page 12 of 18 Question Answer Marks 4(b) The requirements for this question are: • to discuss the sustainable use of energy • to discuss the sustainable use of land and AONB • to give examples from countries at differing stages of economic development. Sustainable use of energy through increasing use of renewable energy and conserving energy by improving efficiency. Mountainous regions could use small scale HEP projects where gravity is used to move water through dams and sluices to generate electricity. Solar power through direct heating of water or photovoltaic cells are suitable for correct aspect and sufficient hours of sunlight. Improvement and advancement in technology associated with batteries. Biofuel / ethanol for use in car engines, sustainable as able to plant for crops as sugar used in ethanol production. Improvements in conserving energy at a local level could include, reducing travel time to workplaces by planning decisions in location of major employment. Carpool schemes and public transport improvement, working from home, remote desktops, conference calls and skype meeting to reduce travel, particularly air travel. Local reduction in waste, considering unnecessary packaging, reduce, reuse, recycle. Sustainable use of land protecting from pressures of urban sprawl and economic development. Planned new developments designed to consider the environmental impact on immediate and wider area. Consider the carbon footprint of any new schemes and how they can be designed to reduce. Any acidic emissions consider how prevailing winds may distribute. Consider noise levels over different times of day. Consider including public transport, proximity to work force. Managing AONB by creating national parks and associated regulations. Planning to protect ecological biodiversity and natural beauty for future generations. Refer to examples from countries at differing stages of economic development. Consider the balance between building an economy while sustainably managing//g land and energy resources. 30 please use level descriptors 2
Mark scheme, page 13
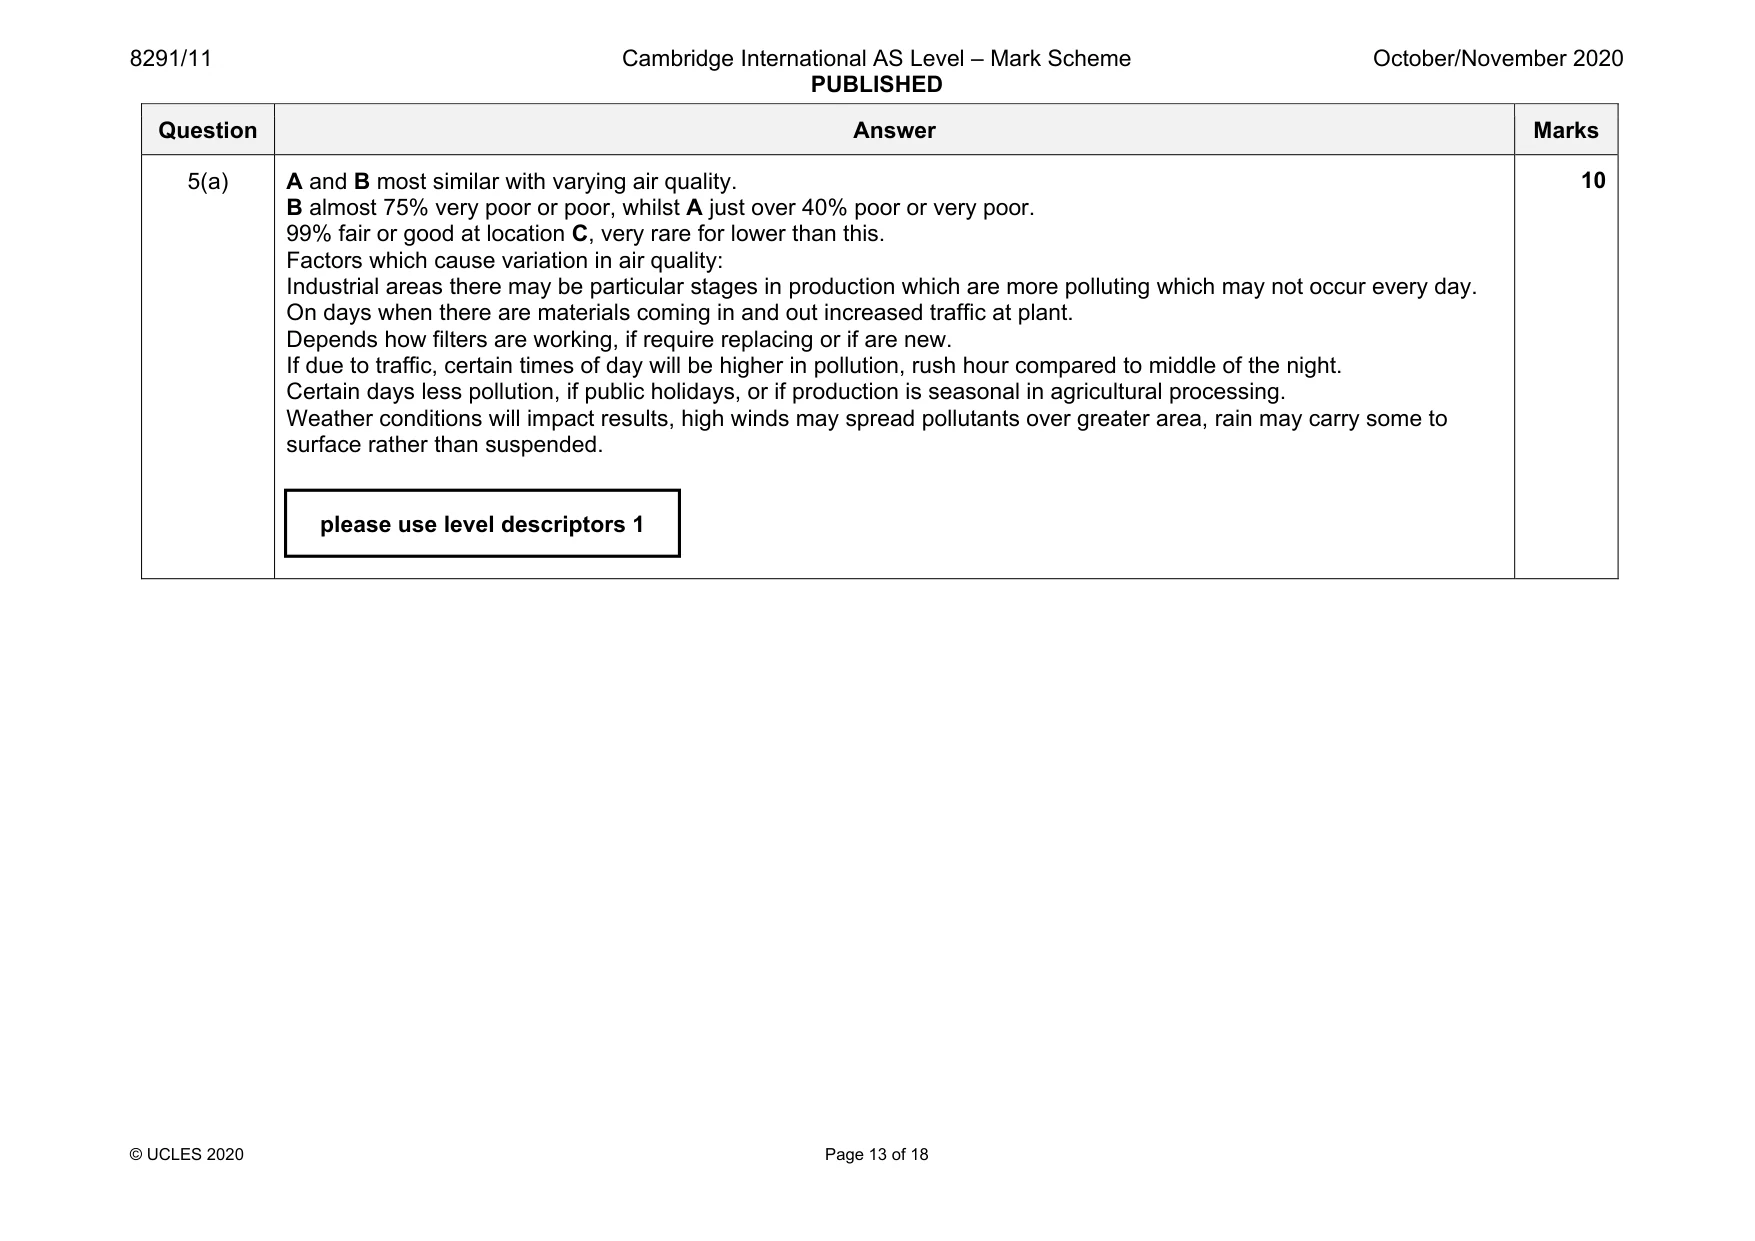
8291/11 Cambridge International AS Level – Mark Scheme PUBLISHED October/November 2020 © UCLES 2020 Page 13 of 18 Question Answer Marks 5(a) A and B most similar with varying air quality. B almost 75% very poor or poor, whilst A just over 40% poor or very poor. 99% fair or good at location C, very rare for lower than this. Factors which cause variation in air quality: Industrial areas there may be particular stages in production which are more polluting which may not occur every day. On days when there are materials coming in and out increased traffic at plant. Depends how filters are working, if require replacing or if are new. If due to traffic, certain times of day will be higher in pollution, rush hour compared to middle of the night. Certain days less pollution, if public holidays, or if production is seasonal in agricultural processing. Weather conditions will impact results, high winds may spread pollutants over greater area, rain may carry some to surface rather than suspended. 10 please use level descriptors 1
Mark scheme, page 14
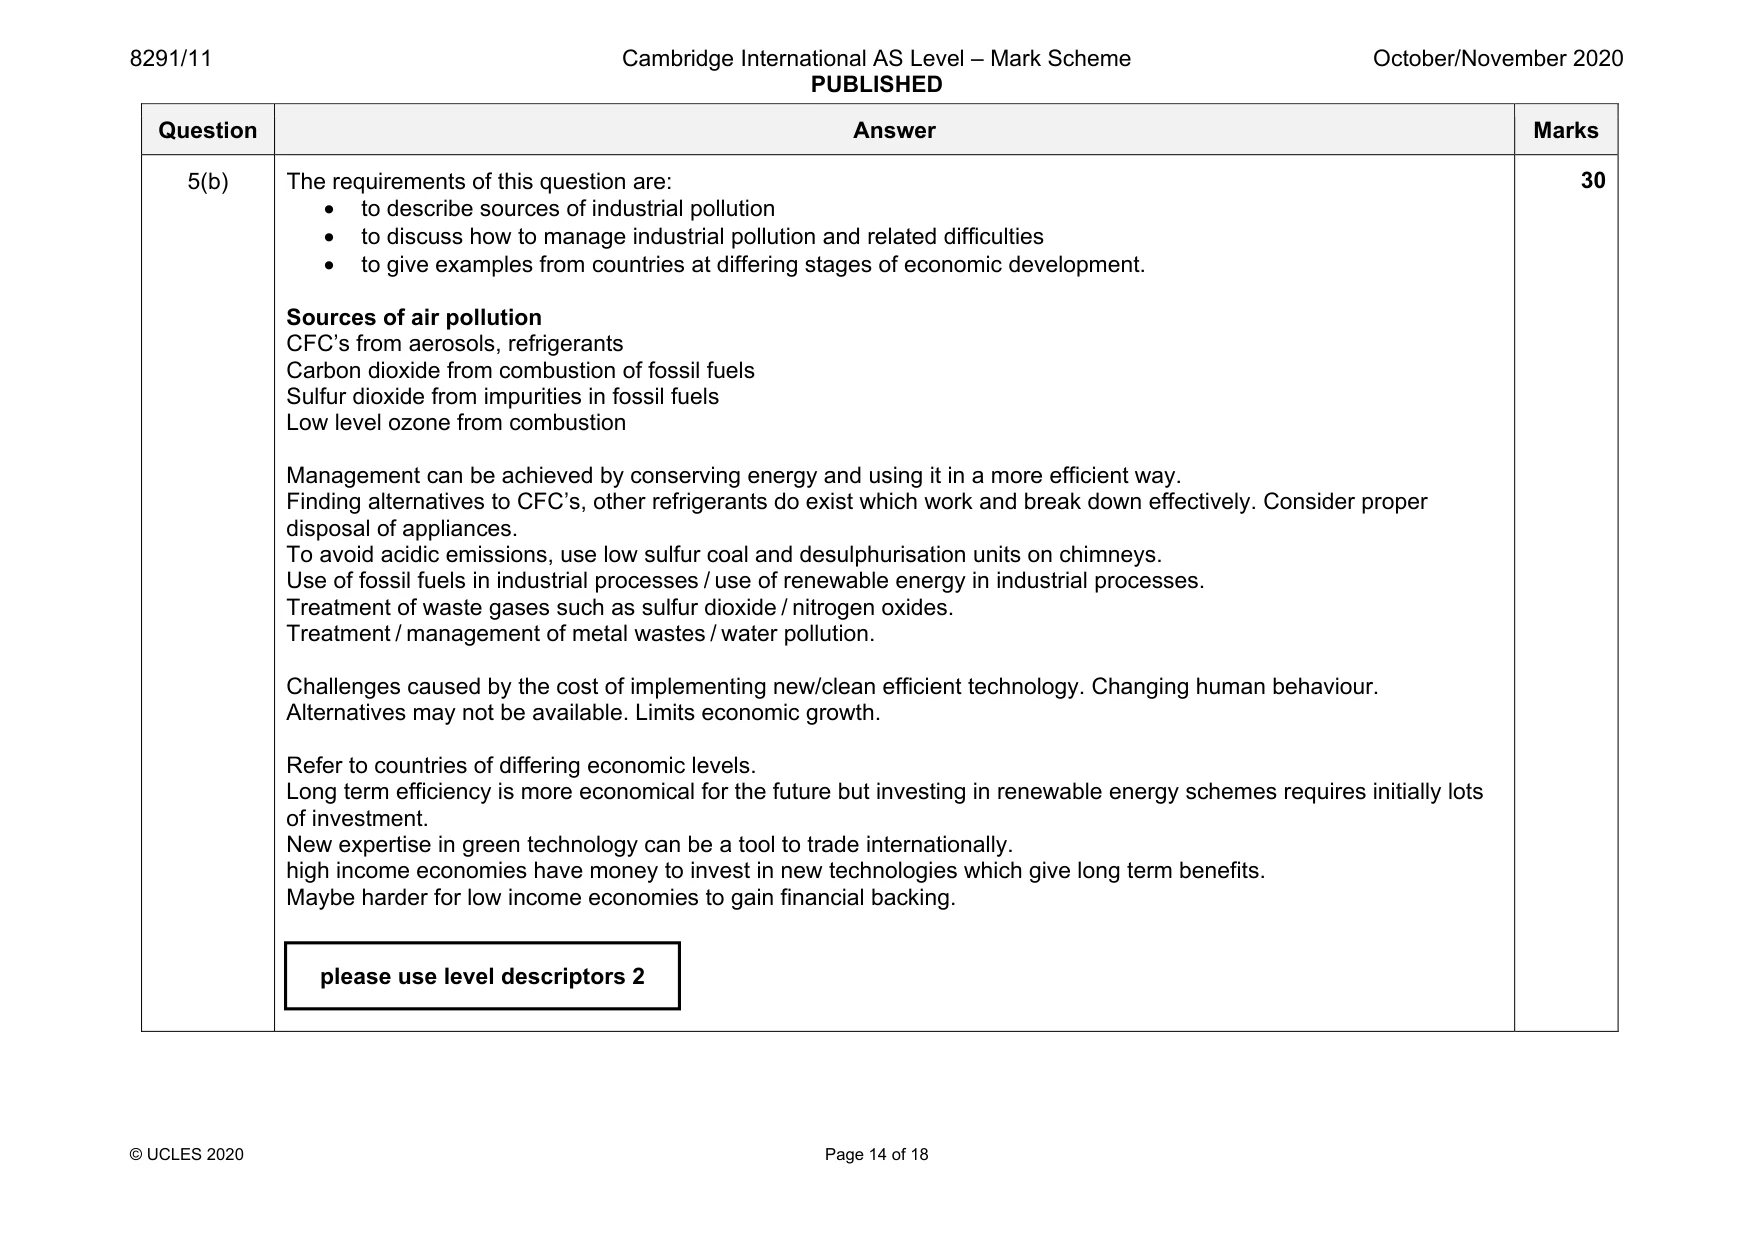
8291/11 Cambridge International AS Level – Mark Scheme PUBLISHED October/November 2020 © UCLES 2020 Page 14 of 18 Question Answer Marks 5(b) The requirements of this question are: • to describe sources of industrial pollution • to discuss how to manage industrial pollution and related difficulties • to give examples from countries at differing stages of economic development. Sources of air pollution CFC’s from aerosols, refrigerants Carbon dioxide from combustion of fossil fuels Sulfur dioxide from impurities in fossil fuels Low level ozone from combustion Management can be achieved by conserving energy and using it in a more efficient way. Finding alternatives to CFC’s, other refrigerants do exist which work and break down effectively. Consider proper disposal of appliances. To avoid acidic emissions, use low sulfur coal and desulphurisation units on chimneys. Use of fossil fuels in industrial processes / use of renewable energy in industrial processes. Treatment of waste gases such as sulfur dioxide / nitrogen oxides. Treatment / management of metal wastes / water pollution. Challenges caused by the cost of implementing new/clean efficient technology. Changing human behaviour. Alternatives may not be available. Limits economic growth. Refer to countries of differing economic levels. Long term efficiency is more economical for the future but investing in renewable energy schemes requires initially lots of investment. New expertise in green technology can be a tool to trade internationally. high income economies have money to invest in new technologies which give long term benefits. Maybe harder for low income economies to gain financial backing. 30 please use level descriptors 2
Mark scheme, page 15
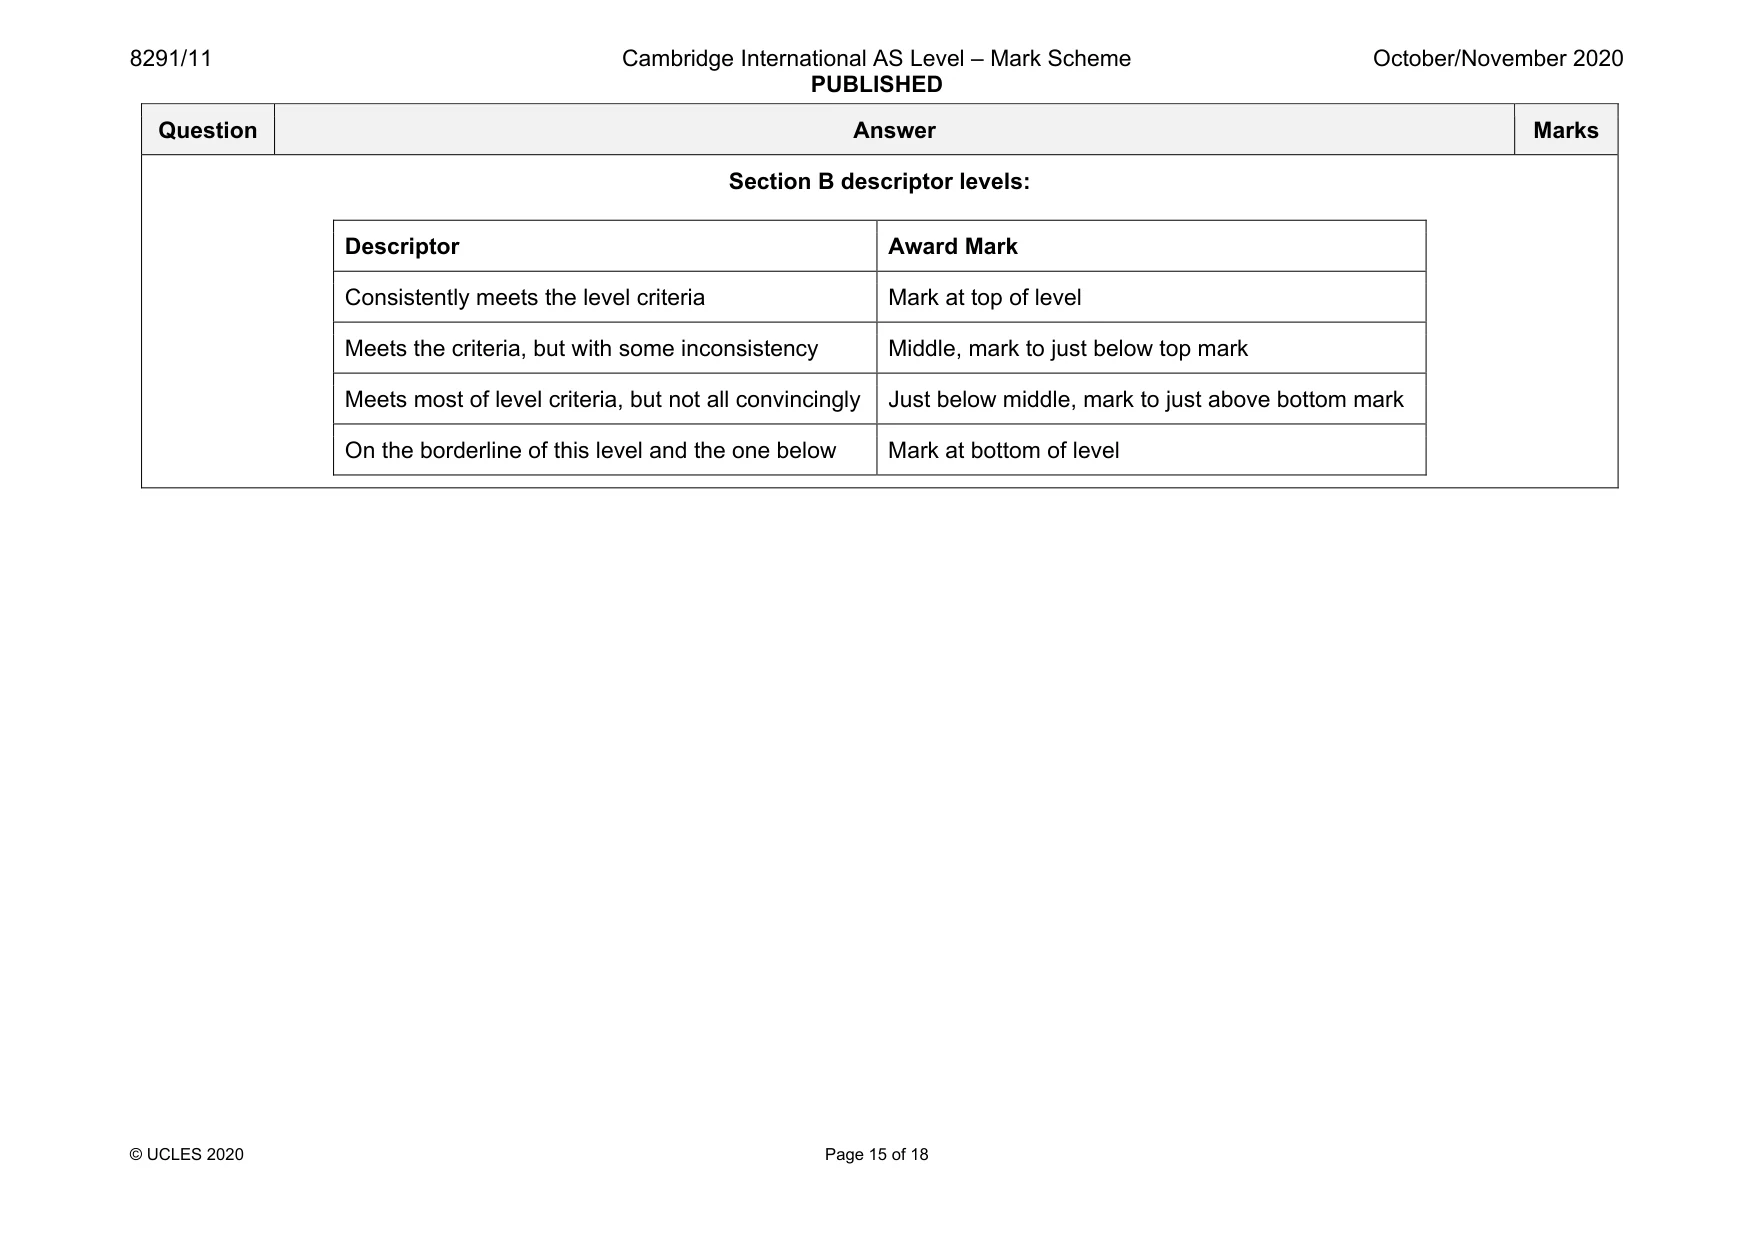
8291/11 Cambridge International AS Level – Mark Scheme PUBLISHED October/November 2020 © UCLES 2020 Page 15 of 18 Question Answer Marks Section B descriptor levels: Descriptor Award Mark Consistently meets the level criteria Mark at top of level Meets the criteria, but with some inconsistency Middle, mark to just below top mark Meets most of level criteria, but not all convincingly Just below middle, mark to just above bottom mark On the borderline of this level and the one below Mark at bottom of level
Mark scheme, page 16
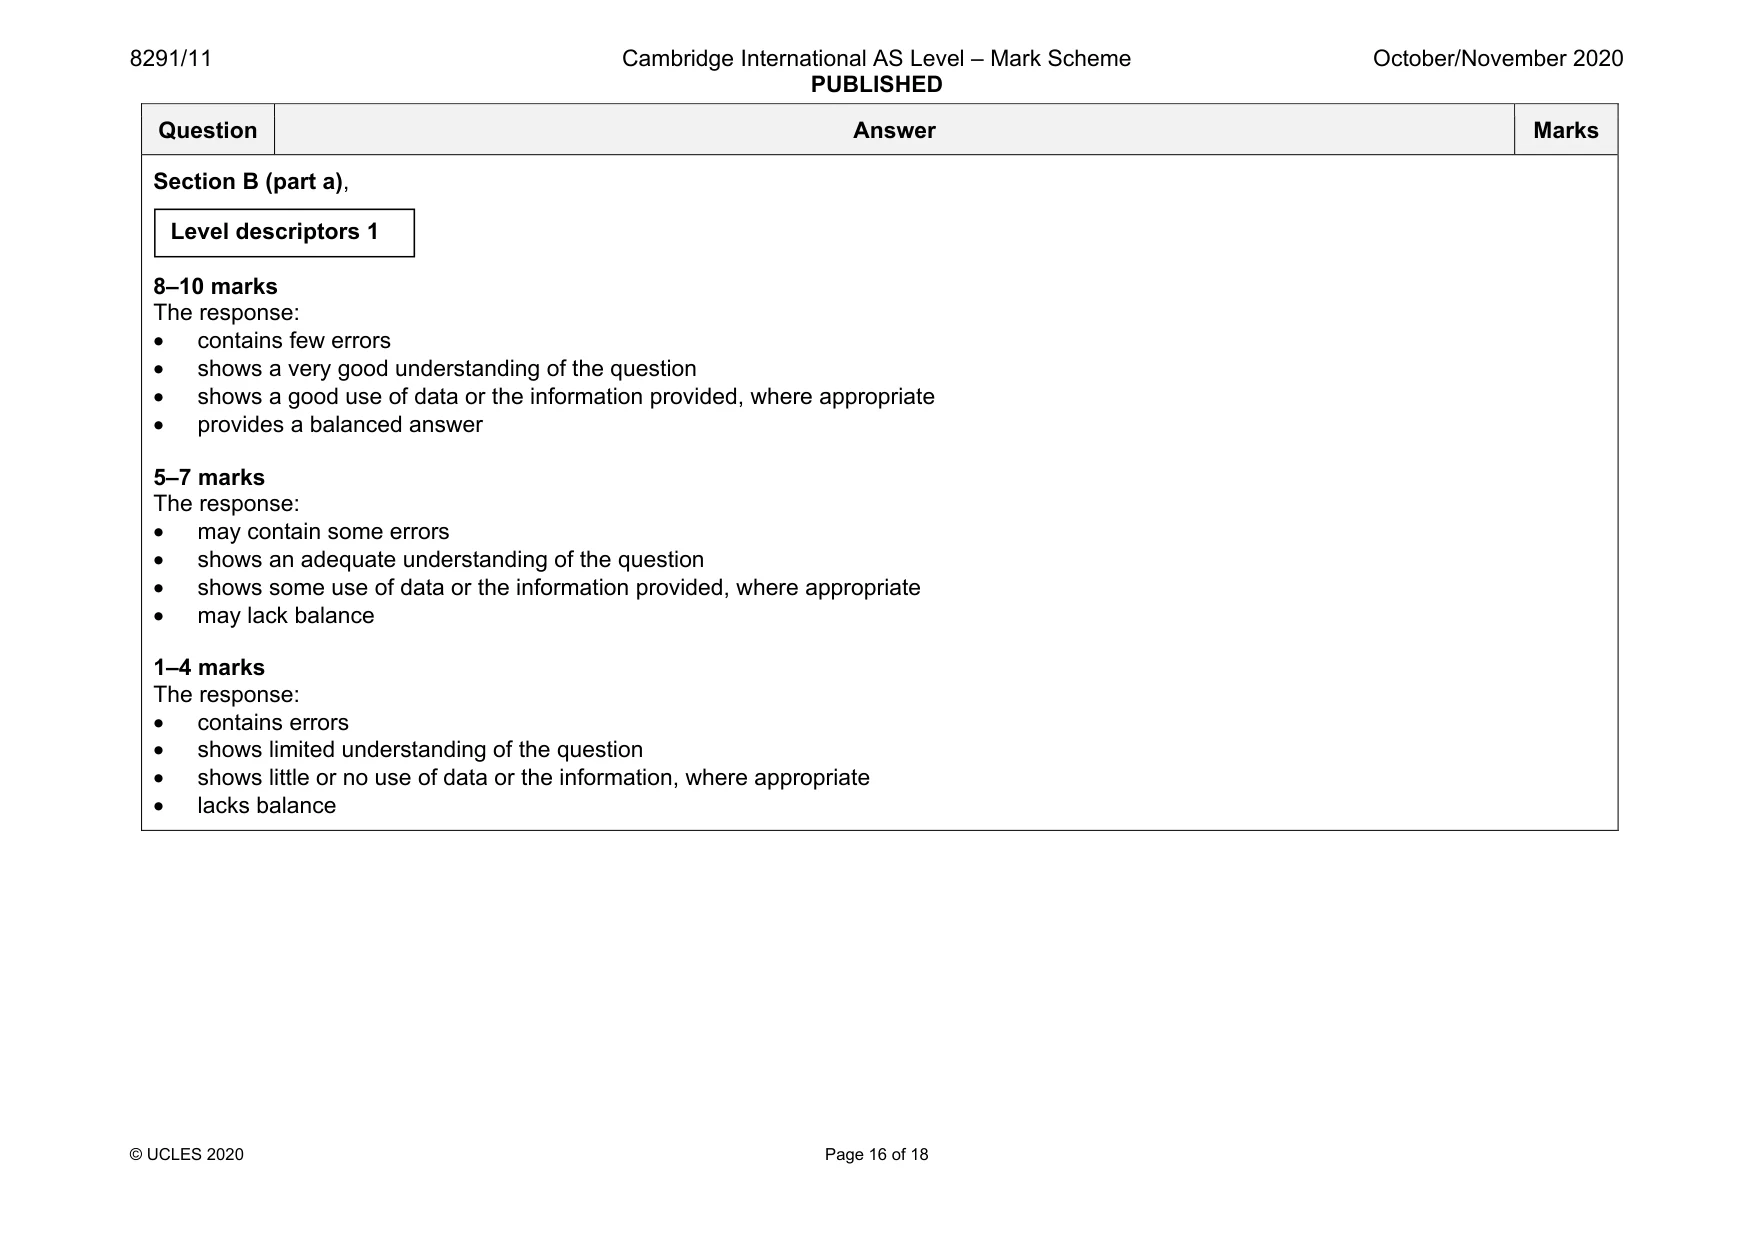
8291/11 Cambridge International AS Level – Mark Scheme PUBLISHED October/November 2020 © UCLES 2020 Page 16 of 18 Question Answer Marks Section B (part a), 8–10 marks The response: • contains few errors • shows a very good understanding of the question • shows a good use of data or the information provided, where appropriate • provides a balanced answer 5–7 marks The response: • may contain some errors • shows an adequate understanding of the question • shows some use of data or the information provided, where appropriate • may lack balance 1–4 marks The response: • contains errors • shows limited understanding of the question • shows little or no use of data or the information, where appropriate • lacks balance Level descriptors 1
Mark scheme, page 17
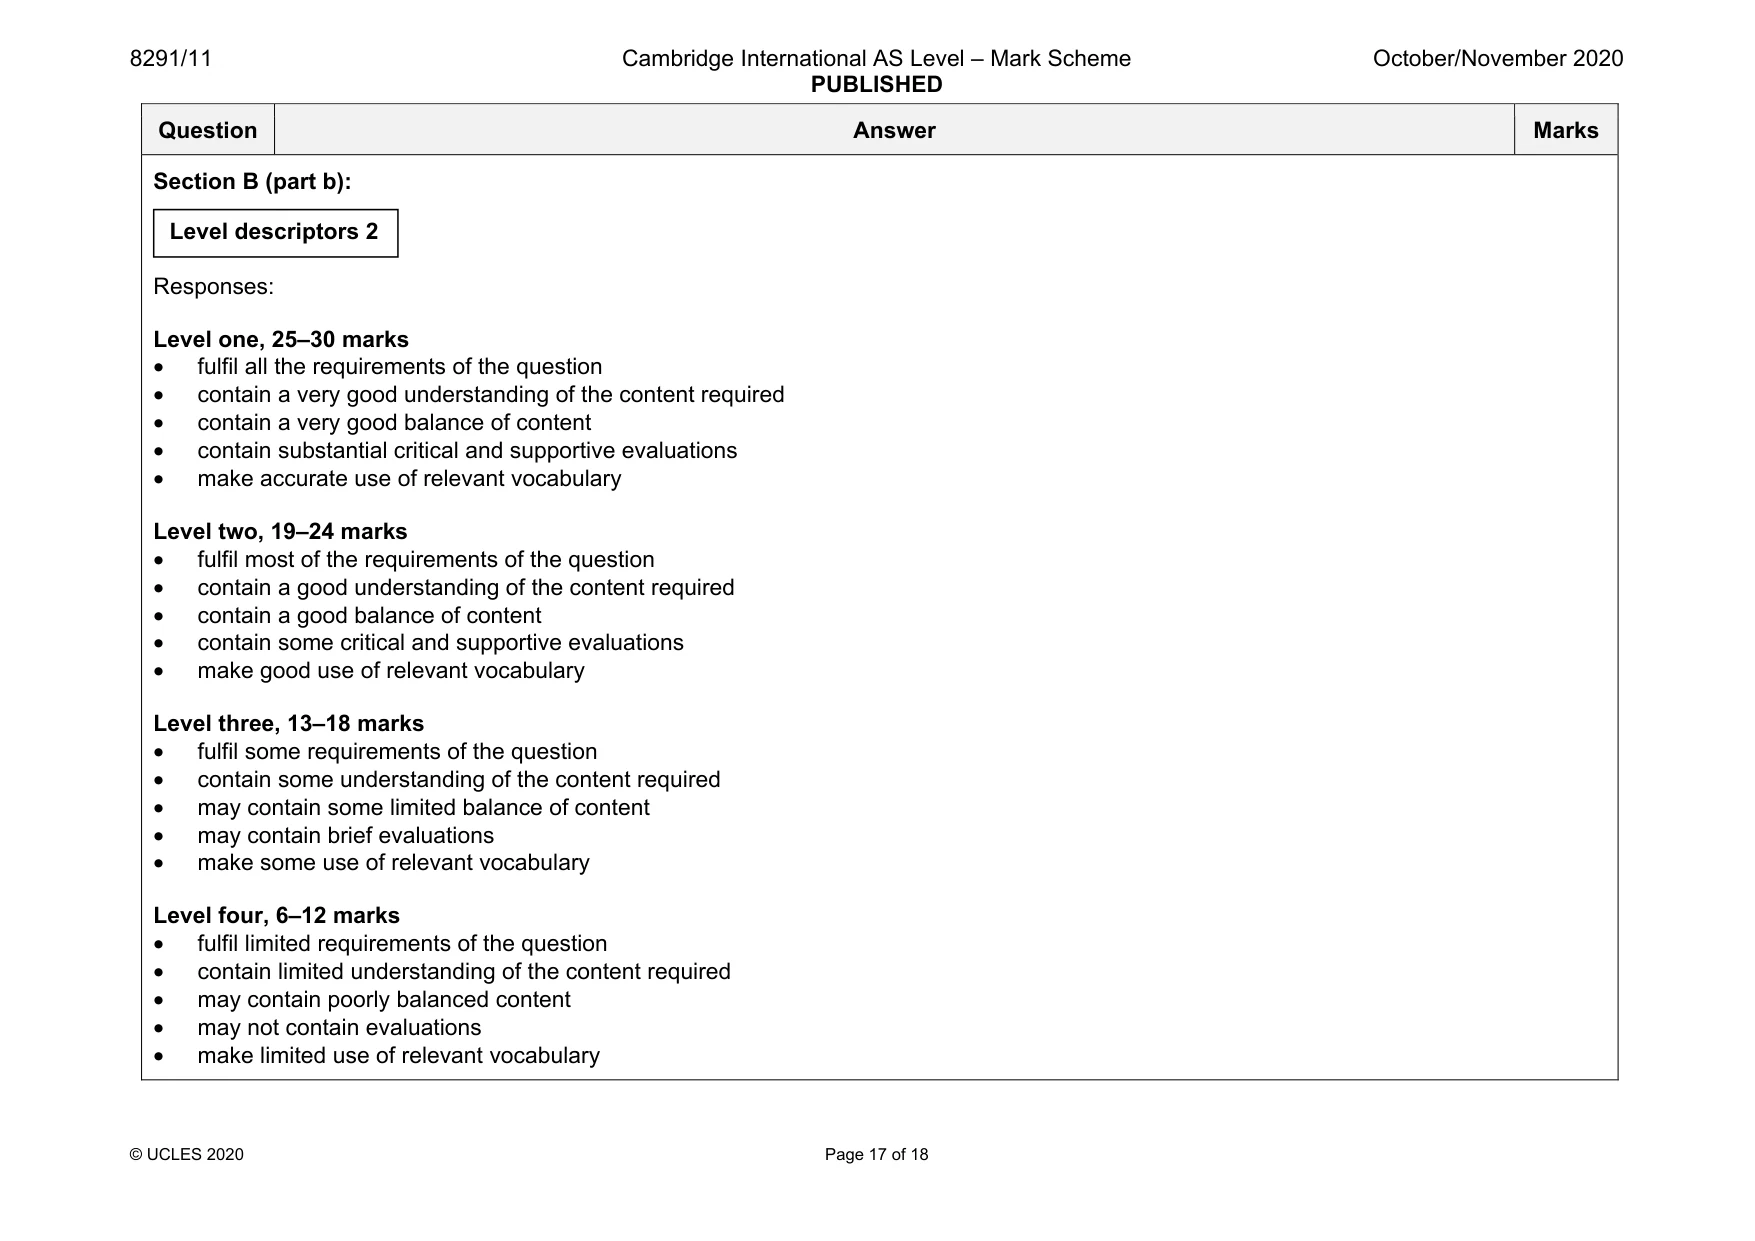
8291/11 Cambridge International AS Level – Mark Scheme PUBLISHED October/November 2020 © UCLES 2020 Page 17 of 18 Question Answer Marks Section B (part b): Responses: Level one, 25–30 marks • fulfil all the requirements of the question • contain a very good understanding of the content required • contain a very good balance of content • contain substantial critical and supportive evaluations • make accurate use of relevant vocabulary Level two, 19–24 marks • fulfil most of the requirements of the question • contain a good understanding of the content required • contain a good balance of content • contain some critical and supportive evaluations • make good use of relevant vocabulary Level three, 13–18 marks • fulfil some requirements of the question • contain some understanding of the content required • may contain some limited balance of content • may contain brief evaluations • make some use of relevant vocabulary Level four, 6–12 marks • fulfil limited requirements of the question • contain limited understanding of the content required • may contain poorly balanced content • may not contain evaluations • make limited use of relevant vocabulary Level descriptors 2
Mark scheme, page 18
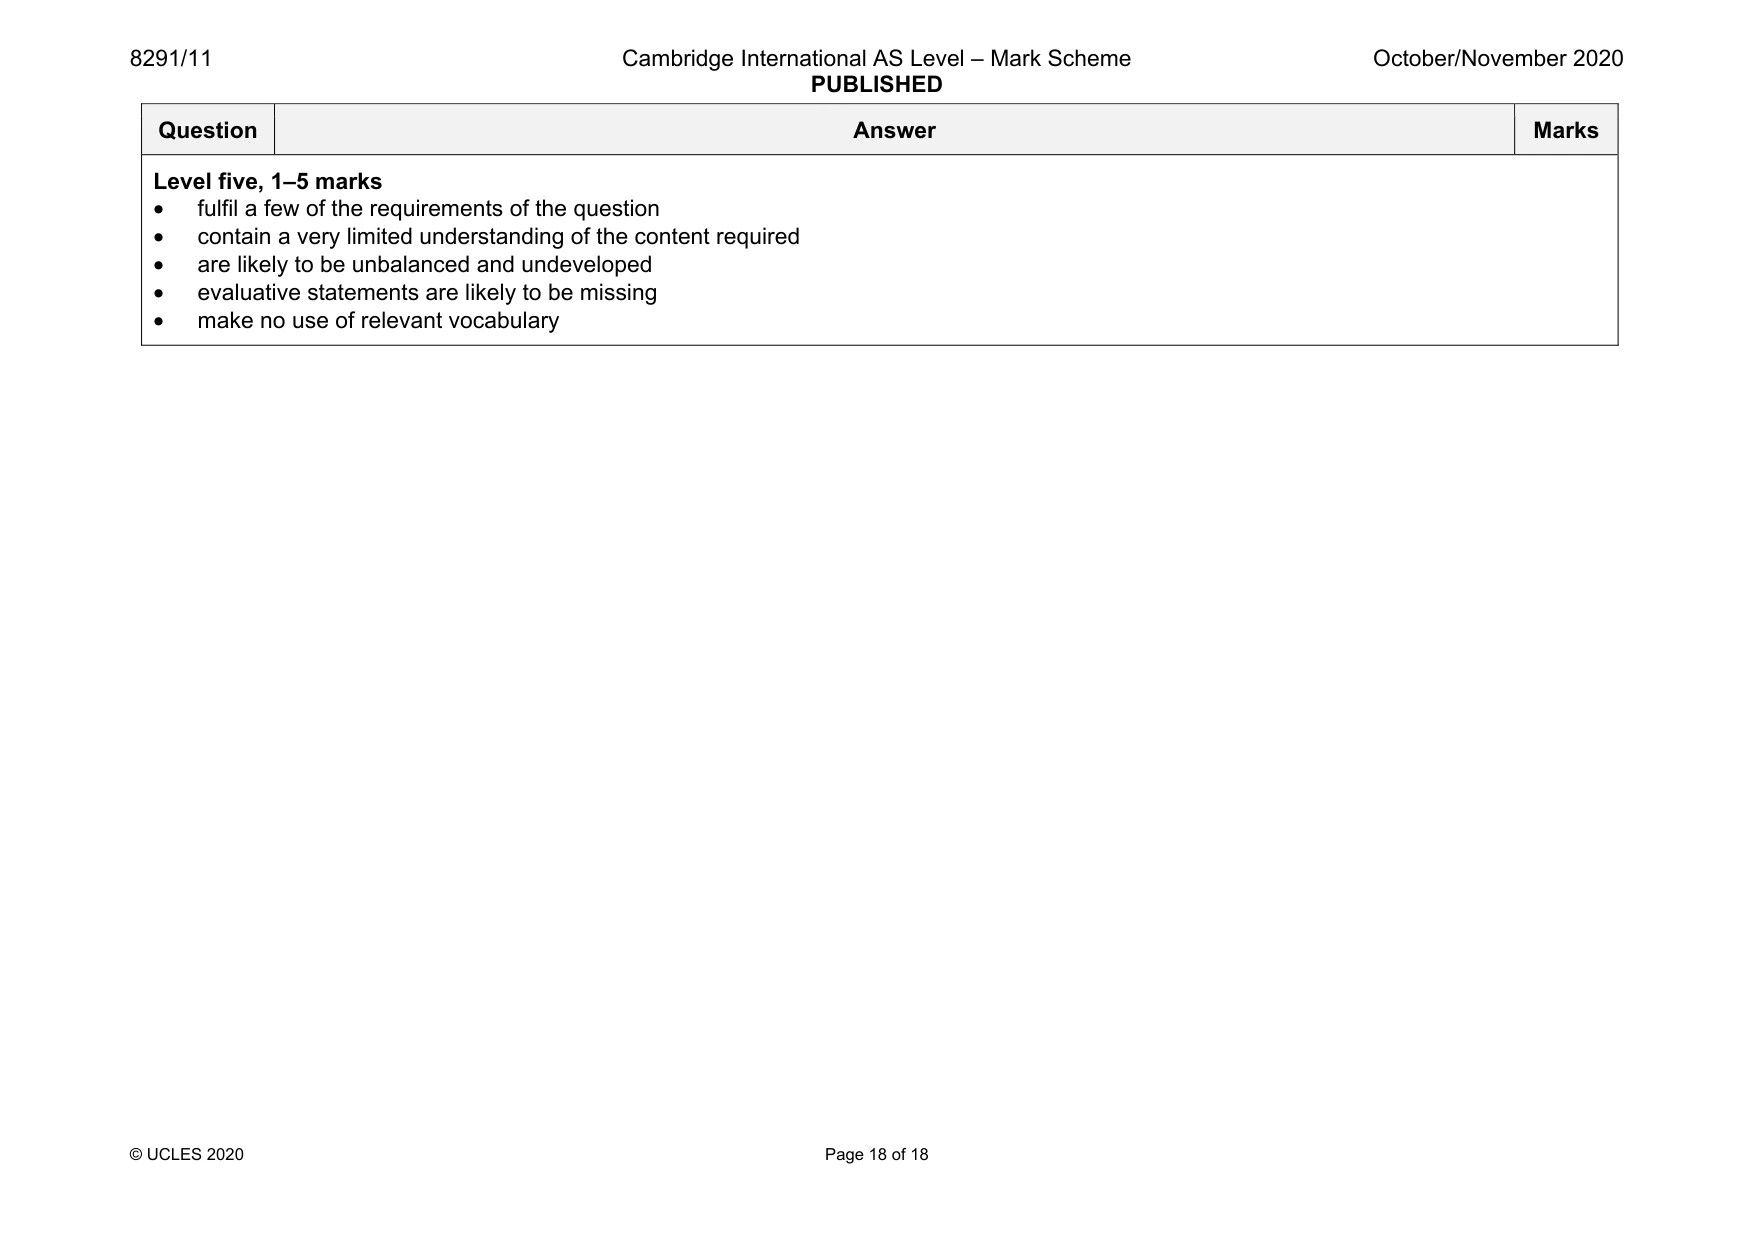
8291/11 Cambridge International AS Level – Mark Scheme PUBLISHED October/November 2020 © UCLES 2020 Page 18 of 18 Question Answer Marks Level five, 1–5 marks • fulfil a few of the requirements of the question • contain a very limited understanding of the content required • are likely to be unbalanced and undeveloped • evaluative statements are likely to be missing • make no use of relevant vocabulary
What you needed in this session
Cambridge’s own grade thresholds for 2020 Oct/Nov, Paper 1 · Variant 1. A higher threshold means an easier paper — the bar moves with how the cohort did.