Cambridge A Level Environmental Management (AS only) 8291 — 2020 Oct/Nov Paper 1 · Variant 2
8291/12/O/N/20 · 80 marks · ≈90 min
The question paper and its mark scheme, free to read here and free to download. This is Cambridge’s own paper, exactly as it was sat.
Question paper12 pages


Mark scheme18 pages
Answers below. Sit the paper first if you are practising.
Paper as text
Question paper, page 1
Cambridge International AS Level DC (JC/CT) 186095/5 © UCLES 2020 [Turn over This document has 12 pages. Blank pages are indicated. For Examiner’s use Section A 1 2 Section B Total ENVIRONMENTAL MANAGEMENT 8291/12 Paper 1 Lithosphere and Atmosphere October/November 2020 1 hour 30 minutes You must answer Section A on the question paper and Section B on the answer booklet/paper you have been given. You will need: Answer booklet/paper INSTRUCTIONS ● Section A: answer all questions. Write your answer to each question in the space provided on the question paper. ● Section B: answer one question. Write your answer on the separate answer booklet/paper provided. ● Use a black or dark blue pen. You may use an HB pencil for any diagrams or graphs. ● Write your name, centre number and candidate number in the boxes at the top of the page. ● Do not use an erasable pen or correction fluid. ● Do not write on any bar codes. ● You may use a calculator. ● You should show all your working and use appropriate units. ● At the end of the examination, fasten all your work together. Do not use staples, paper clips or glue. INFORMATION ● The total mark for this paper is 80. ● The number of marks for each question or part question is shown in brackets [ ]. * 3 1 9 1 6 9 8 0 6 3 *
Question paper, page 2
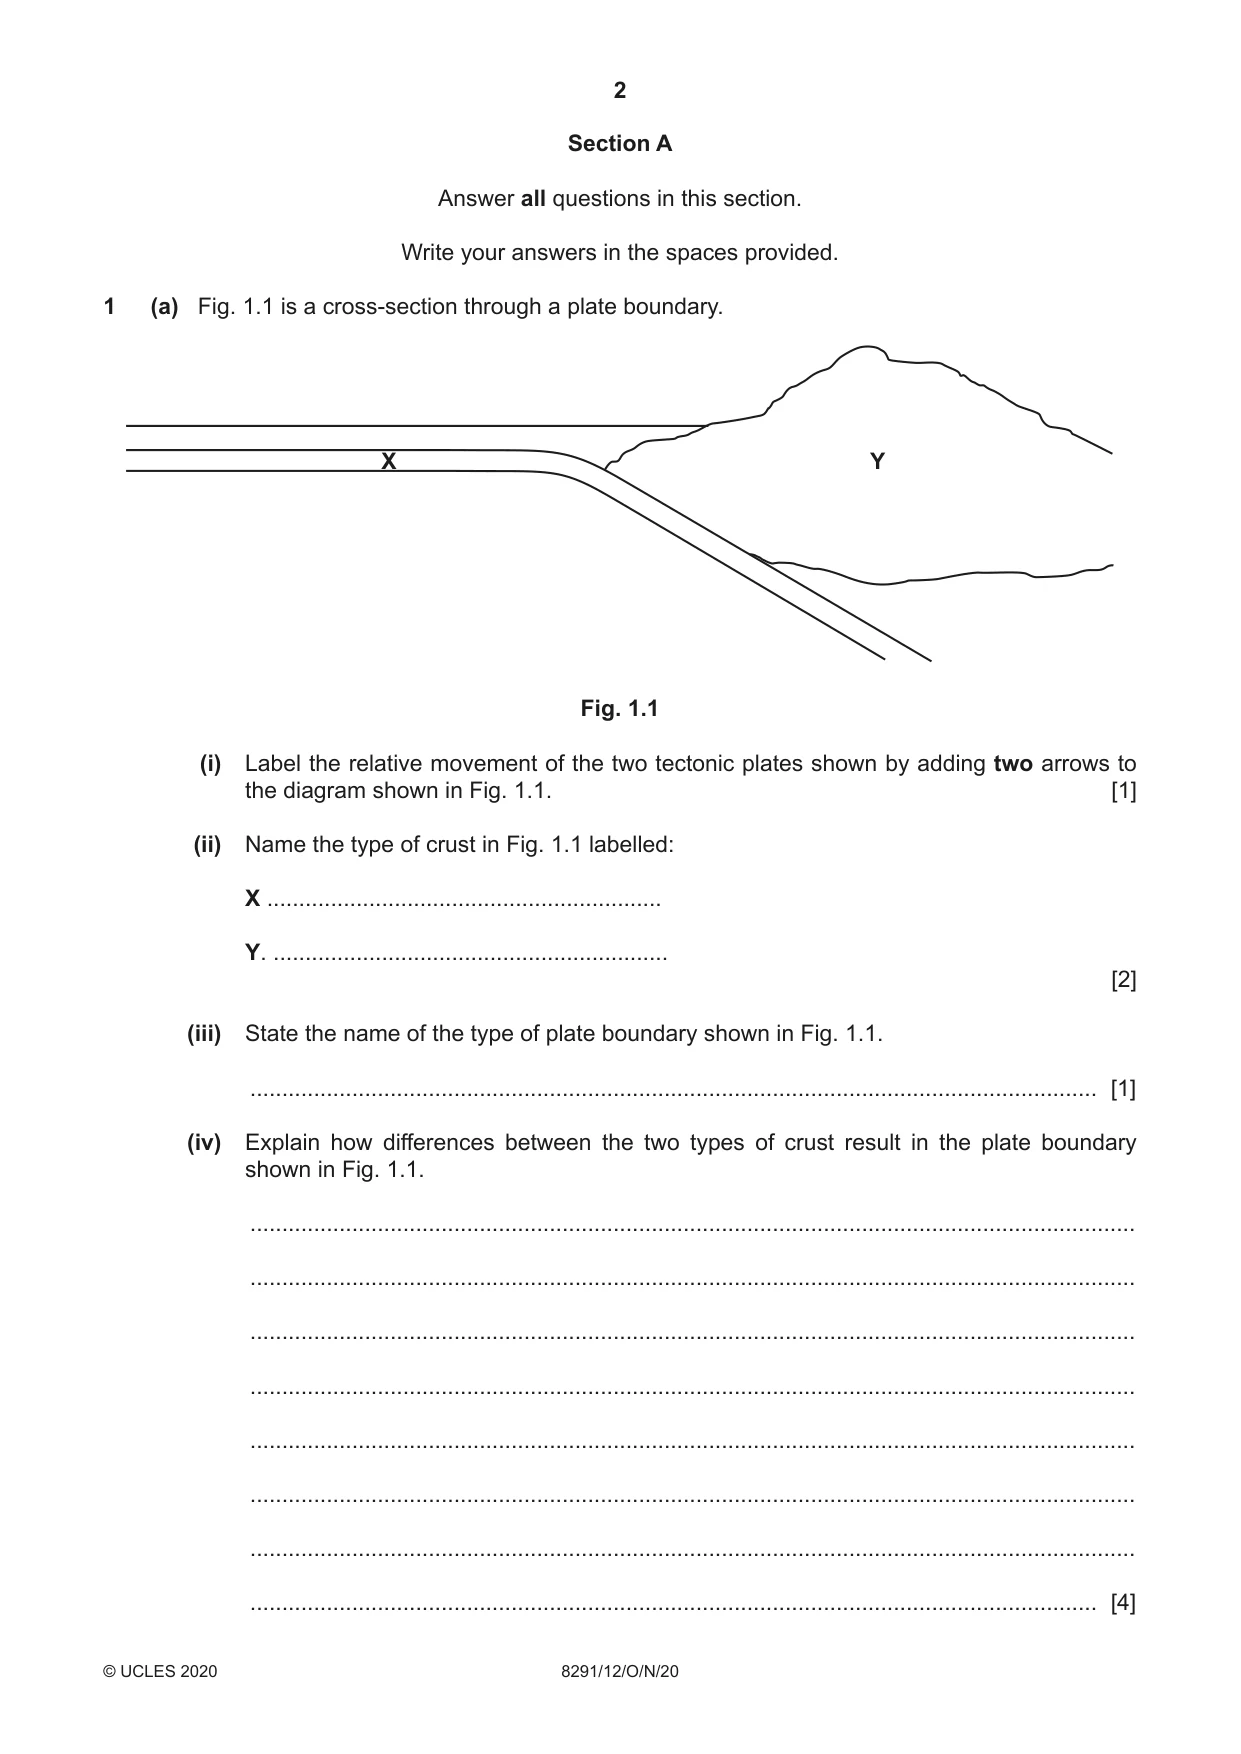
2 8291/12/O/N/20 © UCLES 2020 Section A Answer all questions in this section. Write your answers in the spaces provided. 1 (a) Fig. 1.1 is a cross-section through a plate boundary. X Y Fig. 1.1 (i) Label the relative movement of the two tectonic plates shown by adding two arrows to the diagram shown in Fig. 1.1. [1] (ii) Name the type of crust in Fig. 1.1 labelled: X … Y. … [2] (iii) State the name of the type of plate boundary shown in Fig. 1.1. … [1] (iv) Explain how differences between the two types of crust result in the plate boundary shown in Fig. 1.1. … … … … … … … … [4]
Question paper, page 3
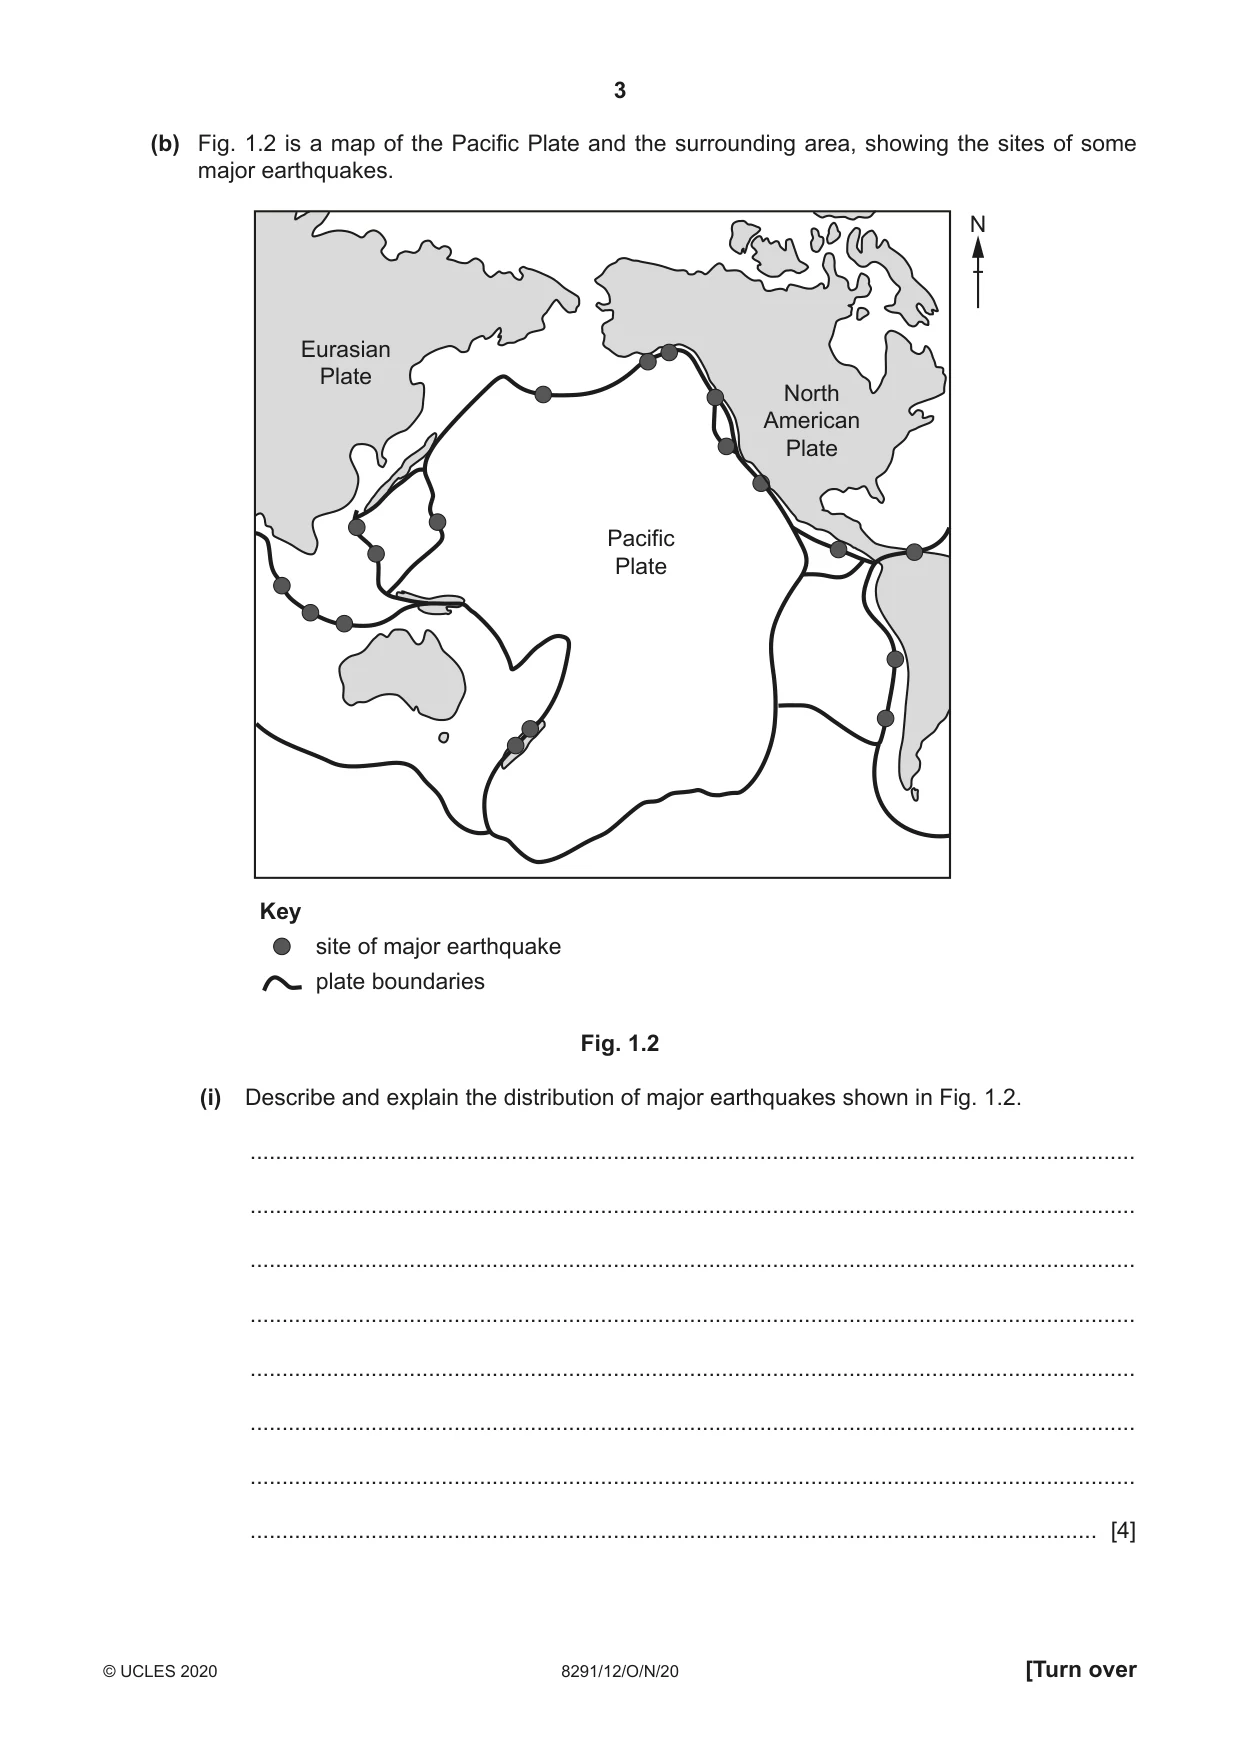
3 8291/12/O/N/20 © UCLES 2020 [Turn over (b) Fig. 1.2 is a map of the Pacific Plate and the surrounding area, showing the sites of some major earthquakes. Pacific Plate Eurasian Plate North American Plate site of major earthquake plate boundaries Key N Fig. 1.2 (i) Describe and explain the distribution of major earthquakes shown in Fig. 1.2. … … … … … … … … [4]
Question paper, page 4
4 8291/12/O/N/20 © UCLES 2020 (ii) Suggest two reasons why people choose to live close to the Pacific Plate boundary despite the risks involved. … … … … [2] (iii) Discuss the strategies used to reduce the scale of damage and loss of life which can be caused by living close to a plate boundary. … … … … … … … … … … … … [6] [Total: 20]
Question paper, page 5
5 8291/12/O/N/20 © UCLES 2020 [Turn over 2 (a) Describe the difference between renewable and non-renewable resources. … … … … [1] (b) Wind energy is an alternative energy resource. Suggest three reasons why a wind energy farm would not be built. 1. … … 2. … … 3. … … [3]
Question paper, page 6
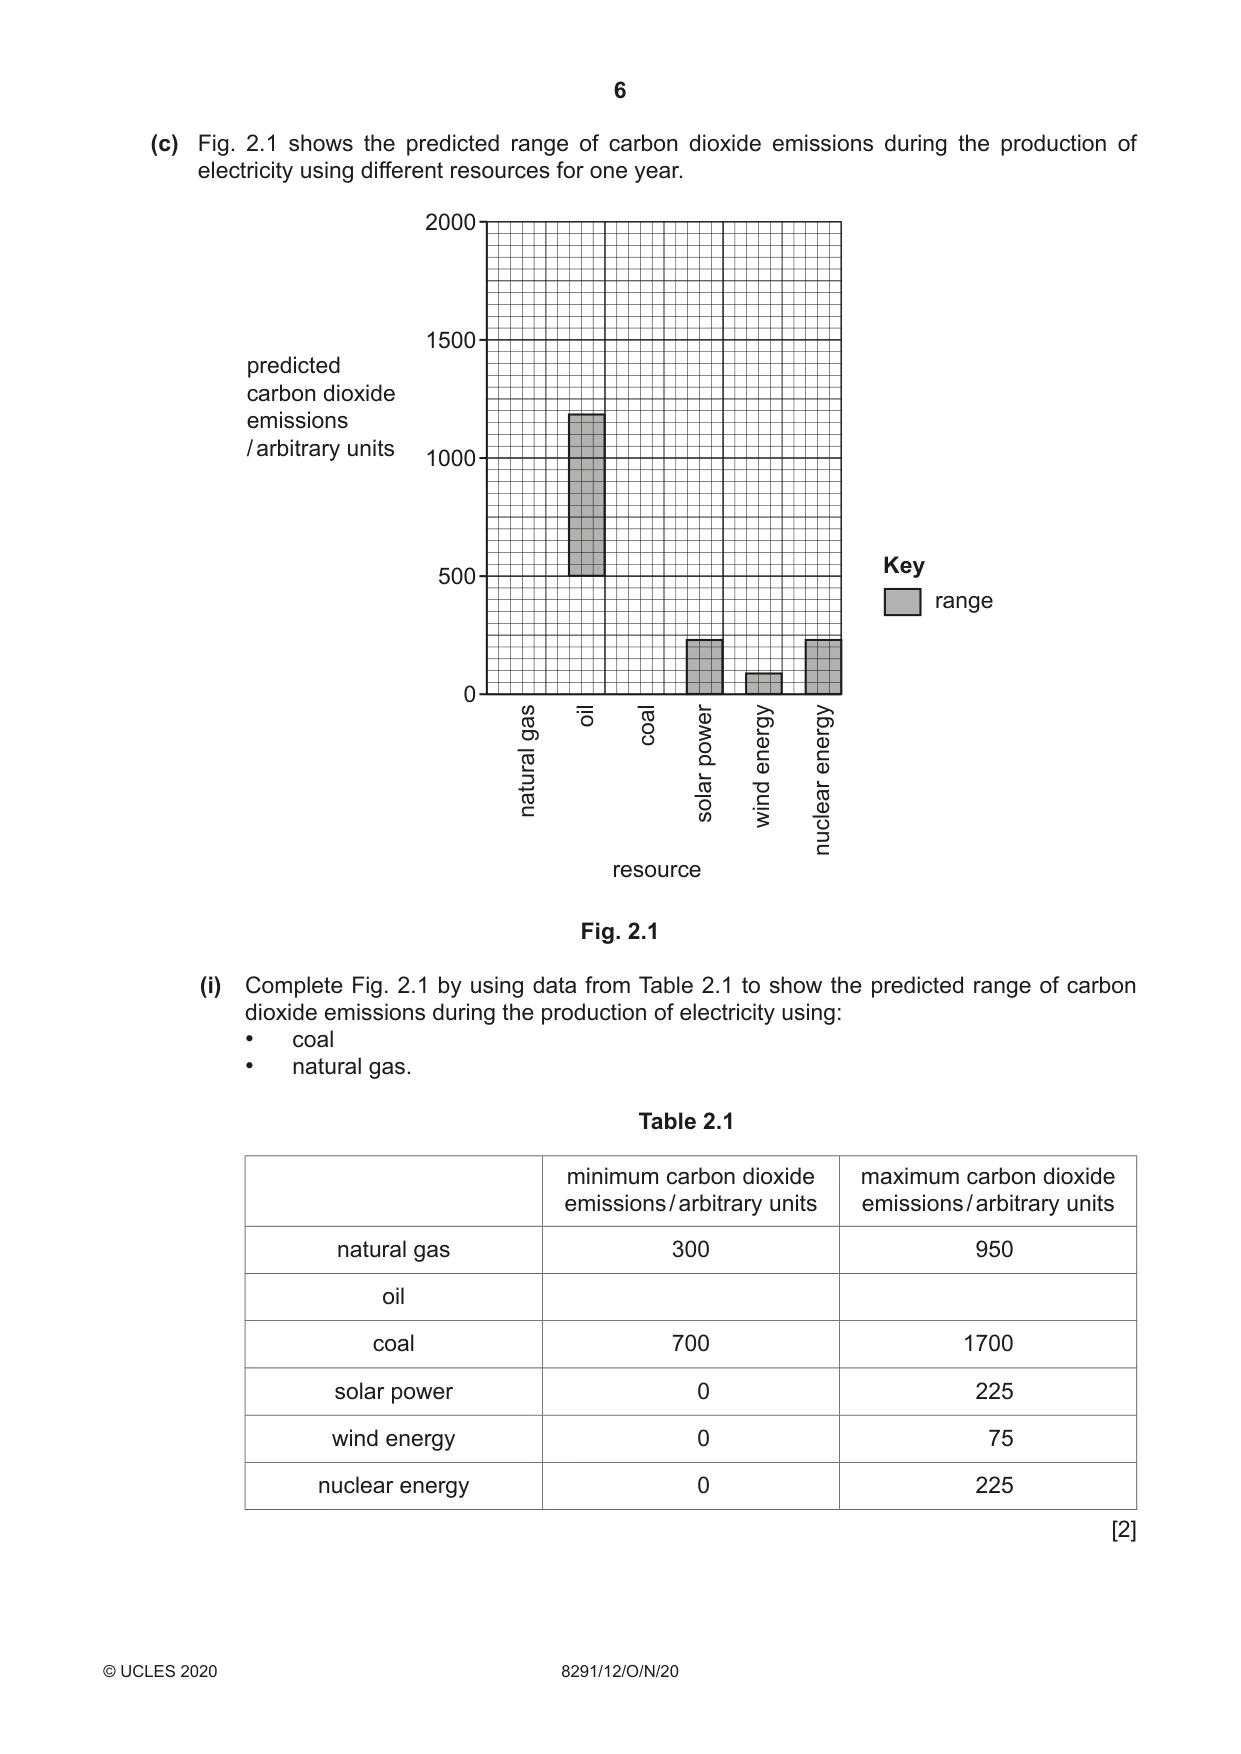
6 8291/12/O/N/20 © UCLES 2020 (c) Fig. 2.1 shows the predicted range of carbon dioxide emissions during the production of electricity using different resources for one year. 0 500 1000 1500 2000 solar power wind energy nuclear energy natural gas oil coal predicted carbon dioxide emissions / arbitrary units resource Key range Fig. 2.1 (i) Complete Fig. 2.1 by using data from Table 2.1 to show the predicted range of carbon dioxide emissions during the production of electricity using: • coal • natural gas. Table 2.1 minimum carbon dioxide emissions / arbitrary units maximum carbon dioxide emissions / arbitrary units natural gas 300 950 oil coal 700 1700 solar power 0 225 wind energy 0 75 nuclear energy 0 225 [2]
Question paper, page 7
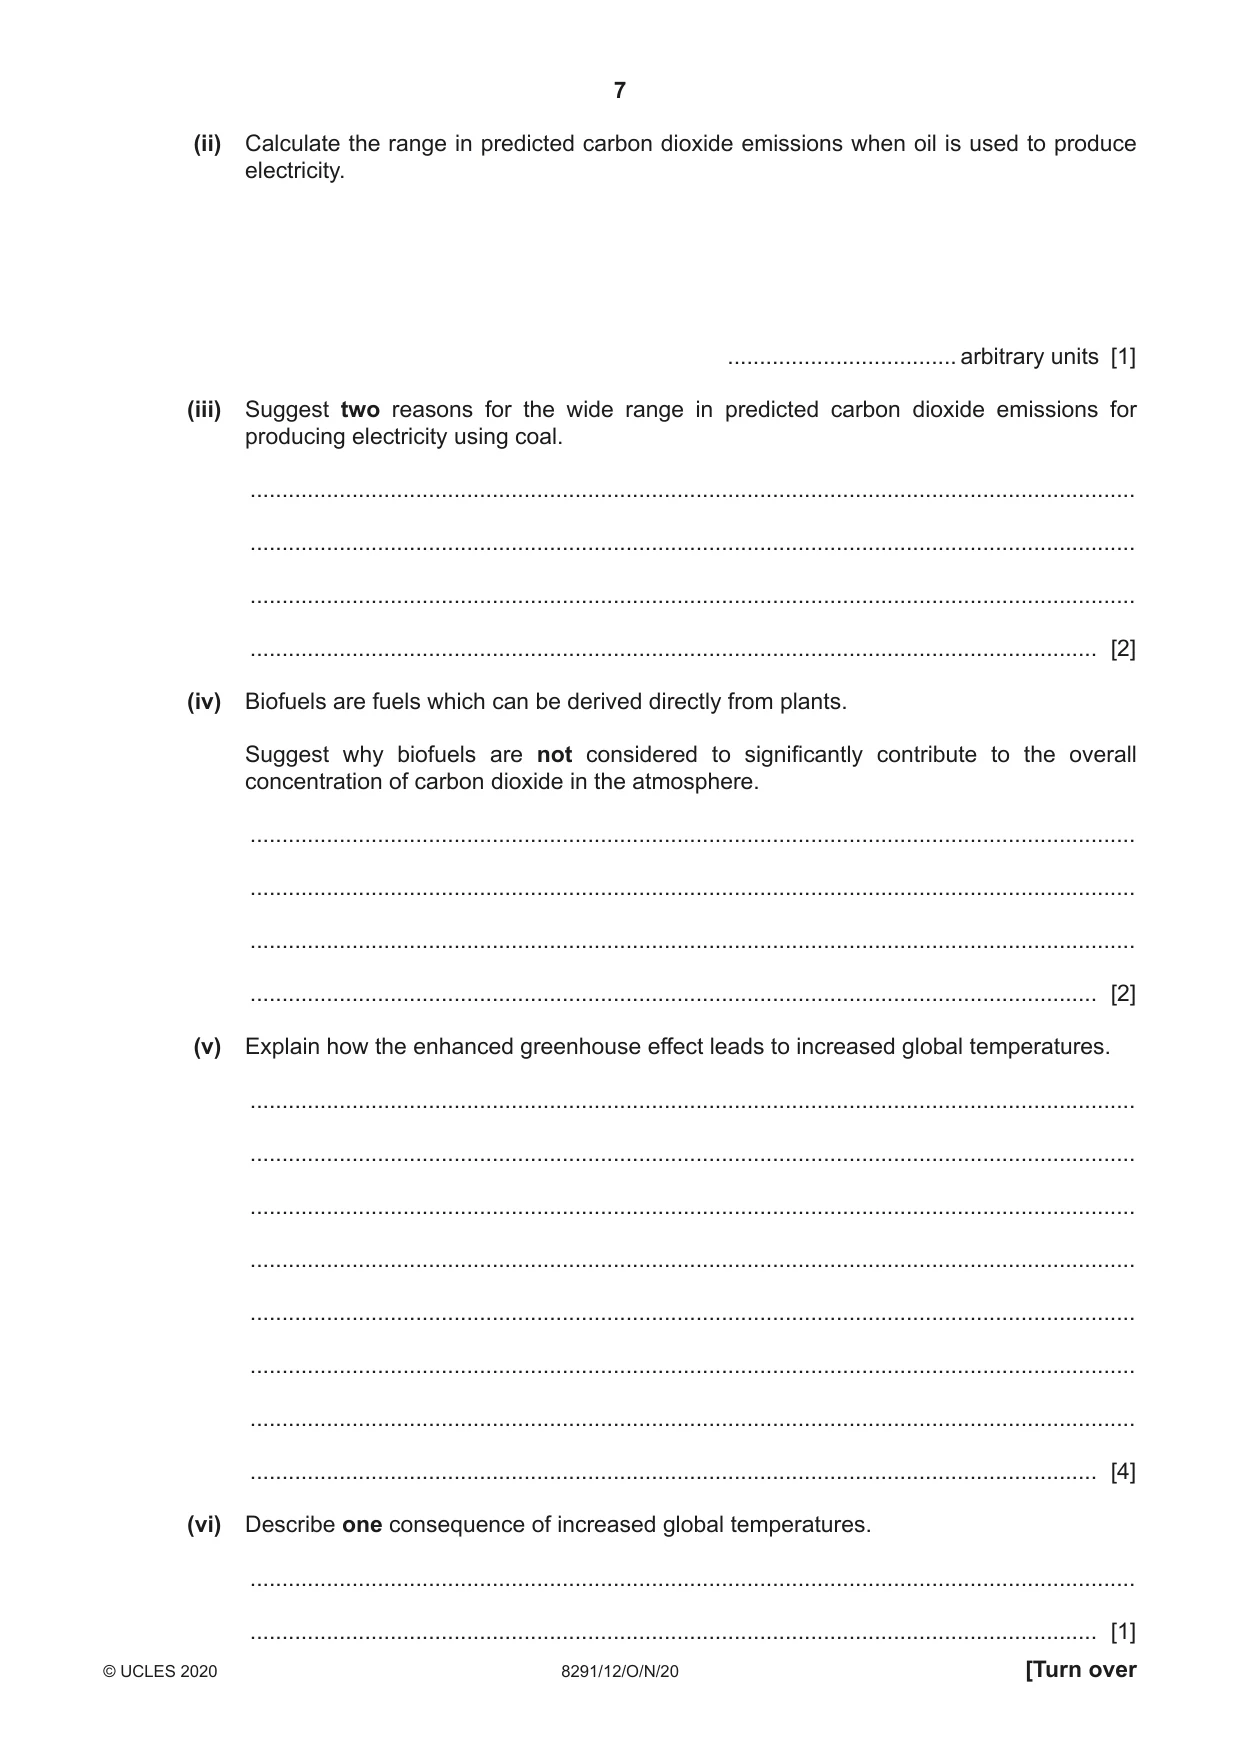
7 8291/12/O/N/20 © UCLES 2020 [Turn over (ii) Calculate the range in predicted carbon dioxide emissions when oil is used to produce electricity. … arbitrary units [1] (iii) Suggest two reasons for the wide range in predicted carbon dioxide emissions for producing electricity using coal. … … … … [2] (iv) Biofuels are fuels which can be derived directly from plants. Suggest why biofuels are not considered to significantly contribute to the overall concentration of carbon dioxide in the atmosphere. … … … … [2] (v) Explain how the enhanced greenhouse effect leads to increased global temperatures. … … … … … … … … [4] (vi) Describe one consequence of increased global temperatures. … … [1]
Question paper, page 8
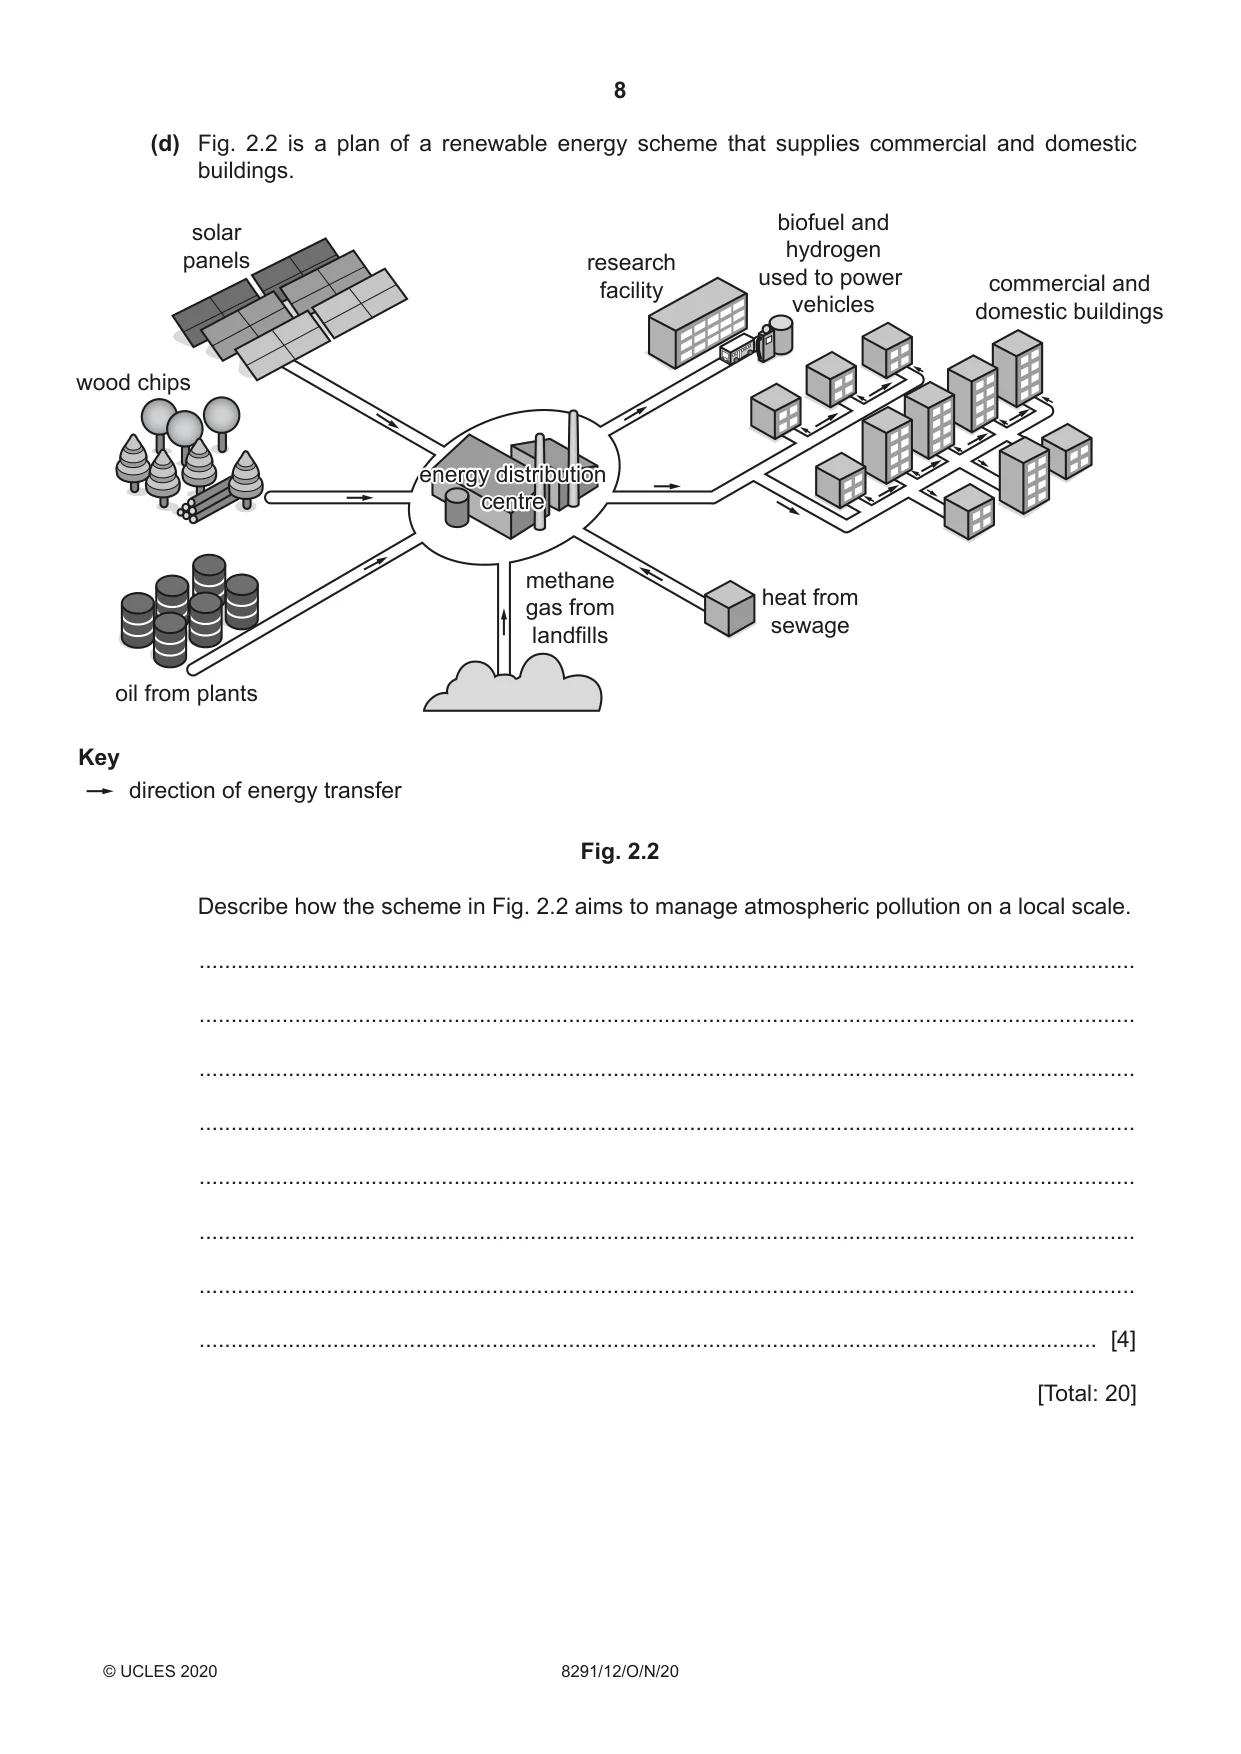
8 8291/12/O/N/20 © UCLES 2020 (d) Fig. 2.2 is a plan of a renewable energy scheme that supplies commercial and domestic buildings. oil from plants wood chips Key direction of energy transfer methane gas from landfills solar panels research facility biofuel and hydrogen used to power vehicles commercial and domestic buildings heat from sewage energy distribution centre energy distribution centre Fig. 2.2 Describe how the scheme in Fig. 2.2 aims to manage atmospheric pollution on a local scale. … … … … … … … … [4] [Total: 20]
Question paper, page 9
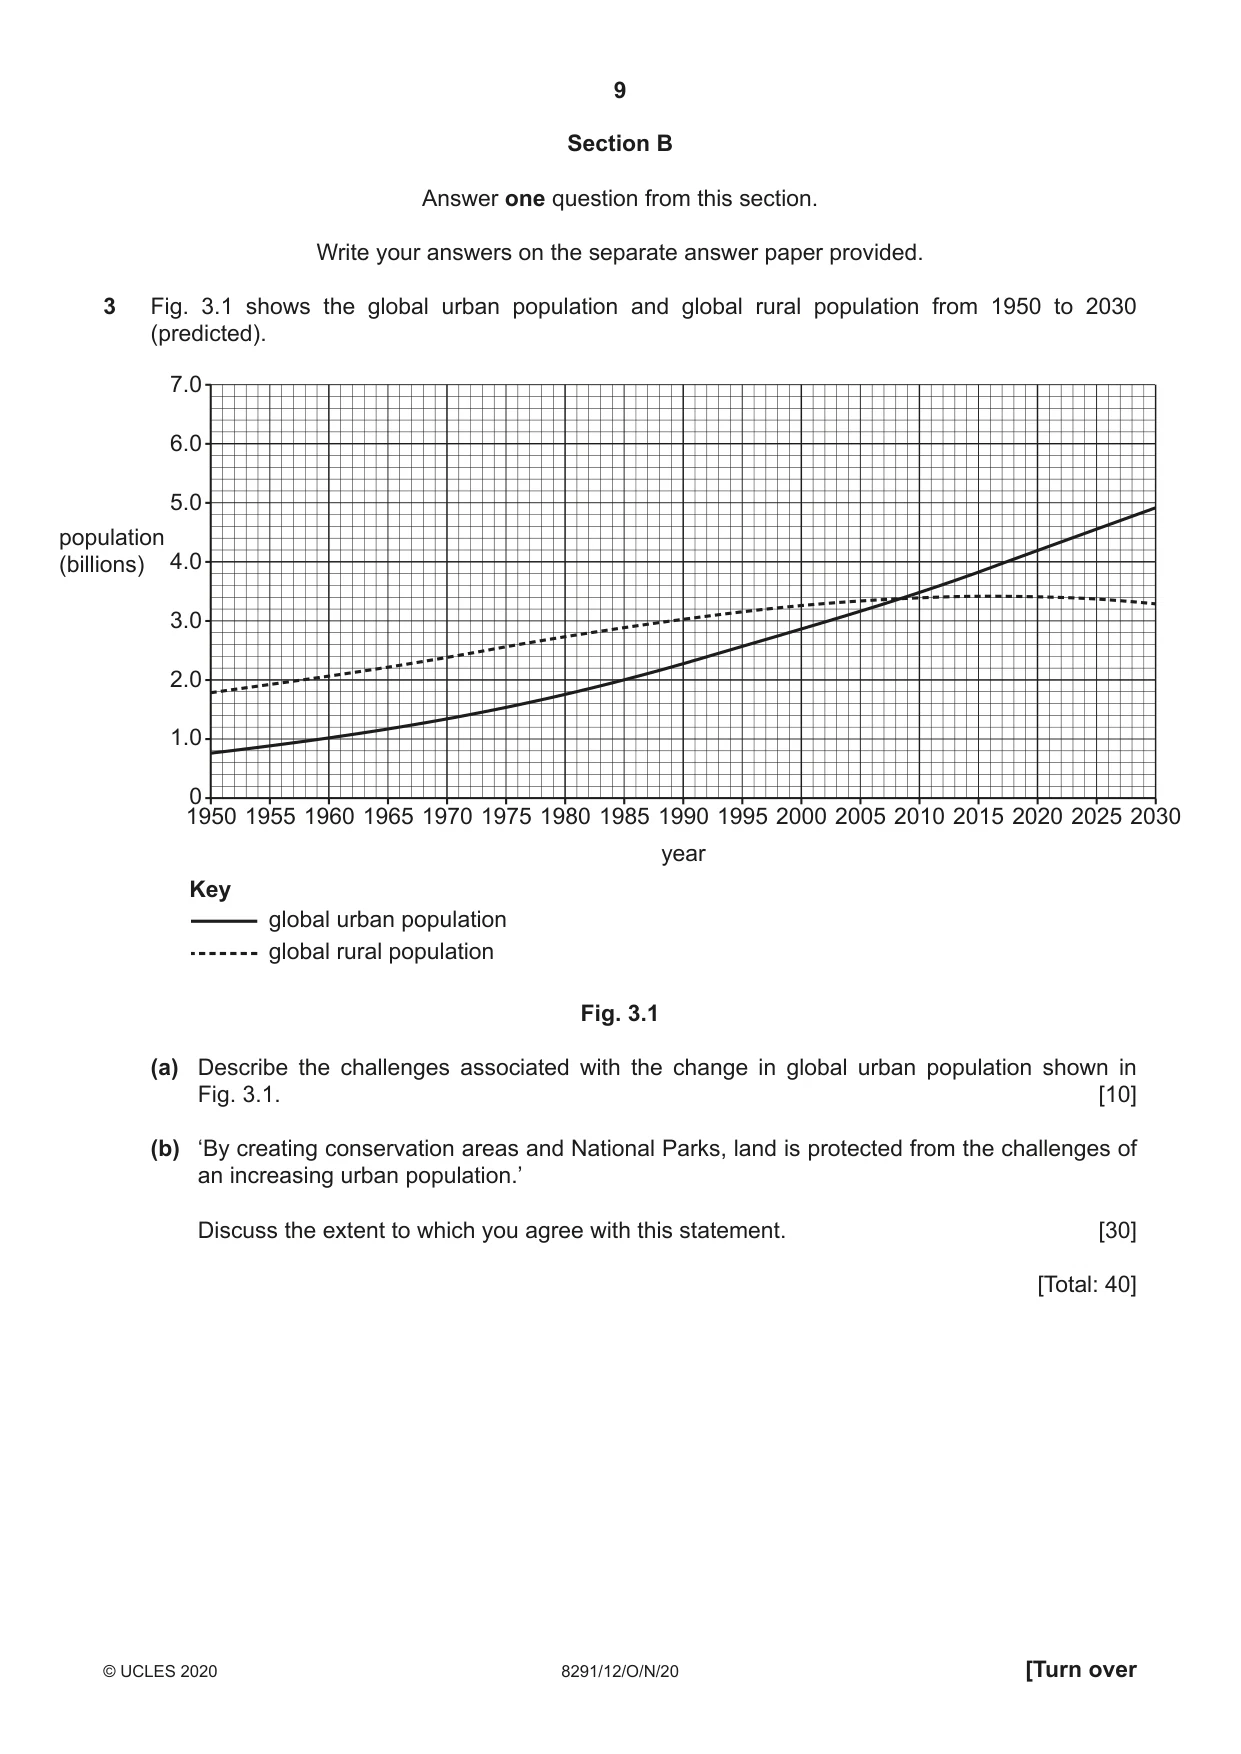
9 8291/12/O/N/20 © UCLES 2020 [Turn over Section B Answer one question from this section. Write your answers on the separate answer paper provided. 3 Fig. 3.1 shows the global urban population and global rural population from 1950 to 2030 (predicted). 0 1.0 2.0 3.0 4.0 5.0 6.0 7.0 population (billions) 1950 1955 1960 1965 1970 1975 1980 1985 1990 year 1995 2000 2005 2010 2015 2020 2025 2030 global urban population Key global rural population Fig. 3.1 (a) Describe the challenges associated with the change in global urban population shown in Fig. 3.1. [10] (b) ‘By creating conservation areas and National Parks, land is protected from the challenges of an increasing urban population.’ Discuss the extent to which you agree with this statement. [30] [Total: 40]
Question paper, page 10
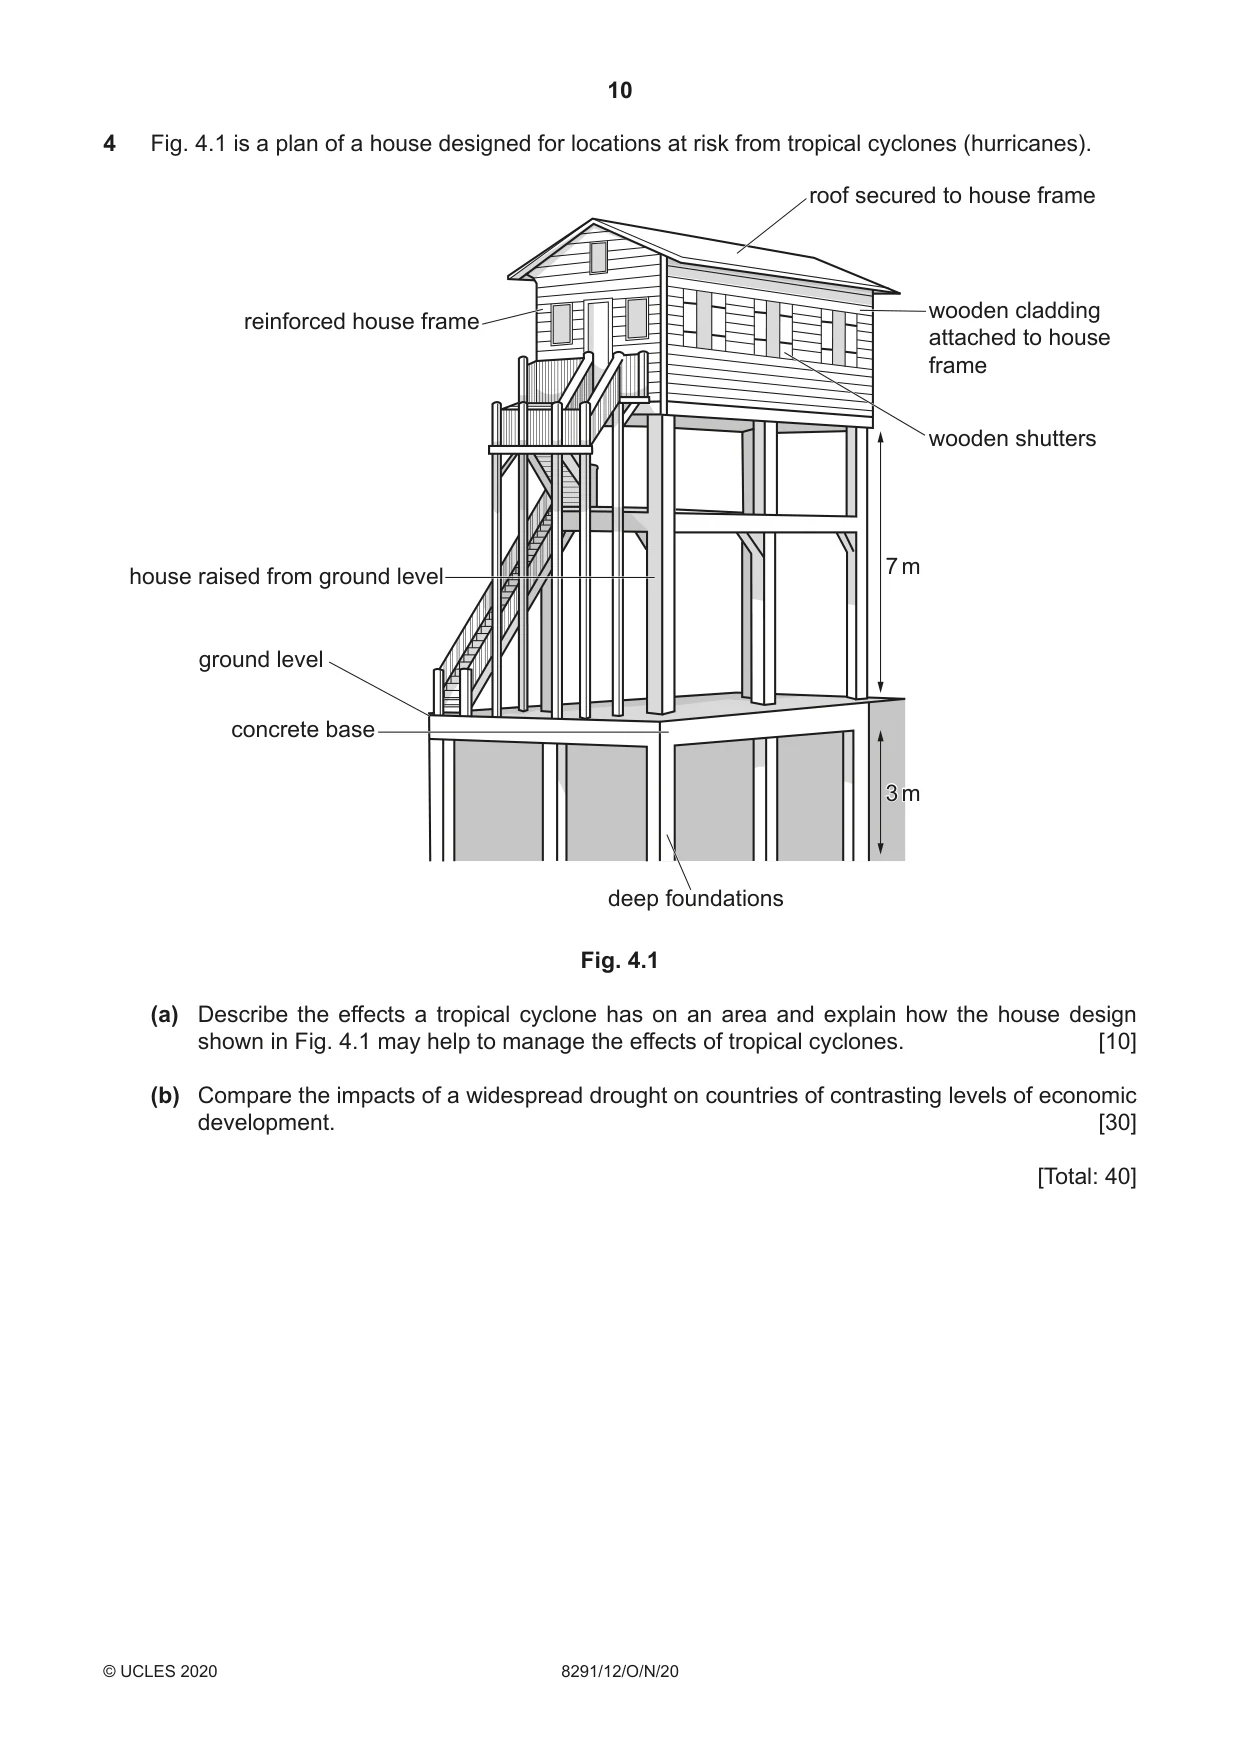
10 8291/12/O/N/20 © UCLES 2020 4 Fig. 4.1 is a plan of a house designed for locations at risk from tropical cyclones (hurricanes). reinforced house frame house raised from ground level ground level concrete base 7 m 3 m 3 m roof secured to house frame wooden cladding attached to house frame wooden shutters deep foundations Fig. 4.1 (a) Describe the effects a tropical cyclone has on an area and explain how the house design shown in Fig. 4.1 may help to manage the effects of tropical cyclones. [10] (b) Compare the impacts of a widespread drought on countries of contrasting levels of economic development. [30] [Total: 40]
Question paper, page 11
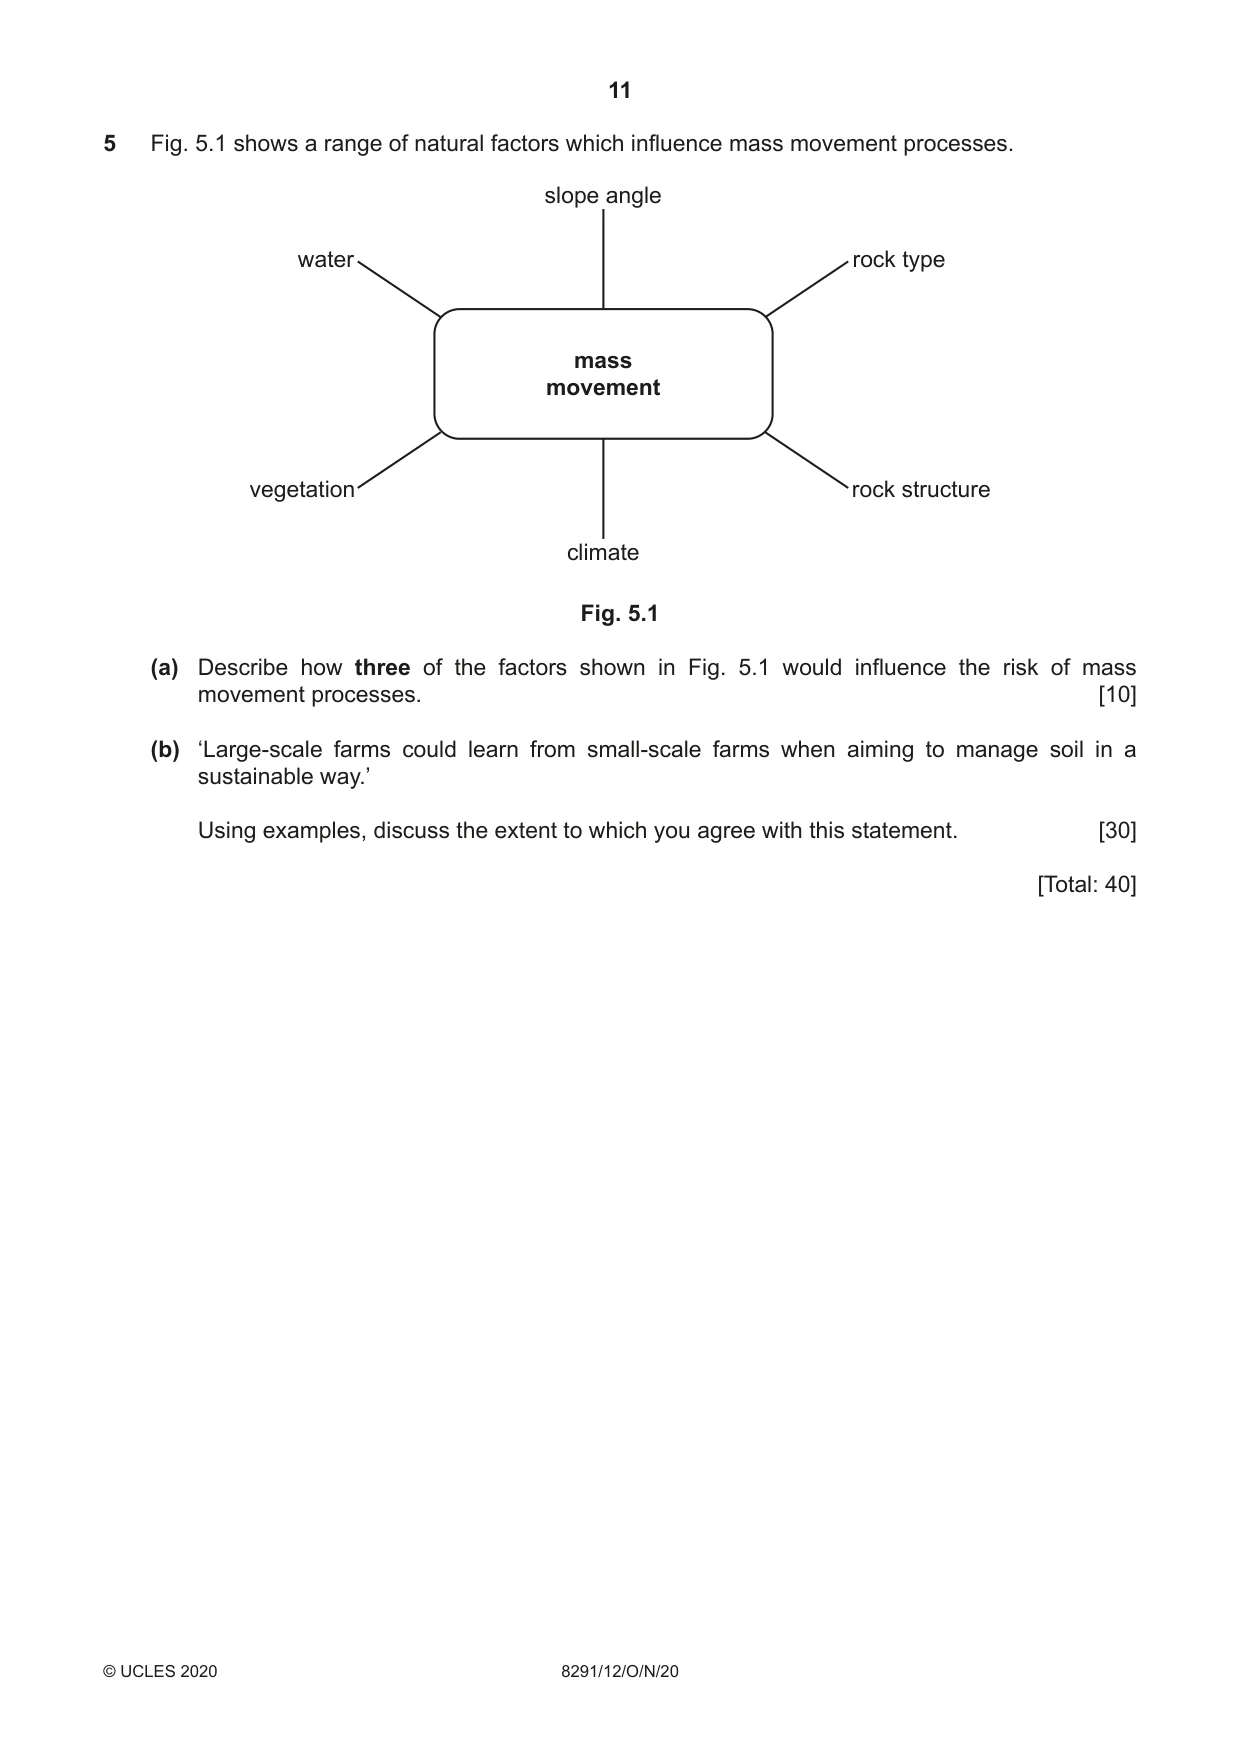
11 8291/12/O/N/20 © UCLES 2020 5 Fig. 5.1 shows a range of natural factors which influence mass movement processes. slope angle water vegetation rock type rock structure climate mass movement Fig. 5.1 (a) Describe how three of the factors shown in Fig. 5.1 would influence the risk of mass movement processes. [10] (b) ‘Large-scale farms could learn from small-scale farms when aiming to manage soil in a sustainable way.’ Using examples, discuss the extent to which you agree with this statement. [30] [Total: 40]
Question paper, page 12
12 8291/12/O/N/20 © UCLES 2020 Permission to reproduce items where third-party owned material protected by copyright is included has been sought and cleared where possible. Every reasonable effort has been made by the publisher (UCLES) to trace copyright holders, but if any items requiring clearance have unwittingly been included, the publisher will be pleased to make amends at the earliest possible opportunity. To avoid the issue of disclosure of answer-related information to candidates, all copyright acknowledgements are reproduced online in the Cambridge Assessment International Education Copyright Acknowledgements Booklet. This is produced for each series of examinations and is freely available to download at www.cambridgeinternational.org after the live examination series. Cambridge Assessment International Education is part of the Cambridge Assessment Group. Cambridge Assessment is the brand name of the University of Cambridge Local Examinations Syndicate (UCLES), which itself is a department of the University of Cambridge. BLANK PAGE
Mark scheme, page 1
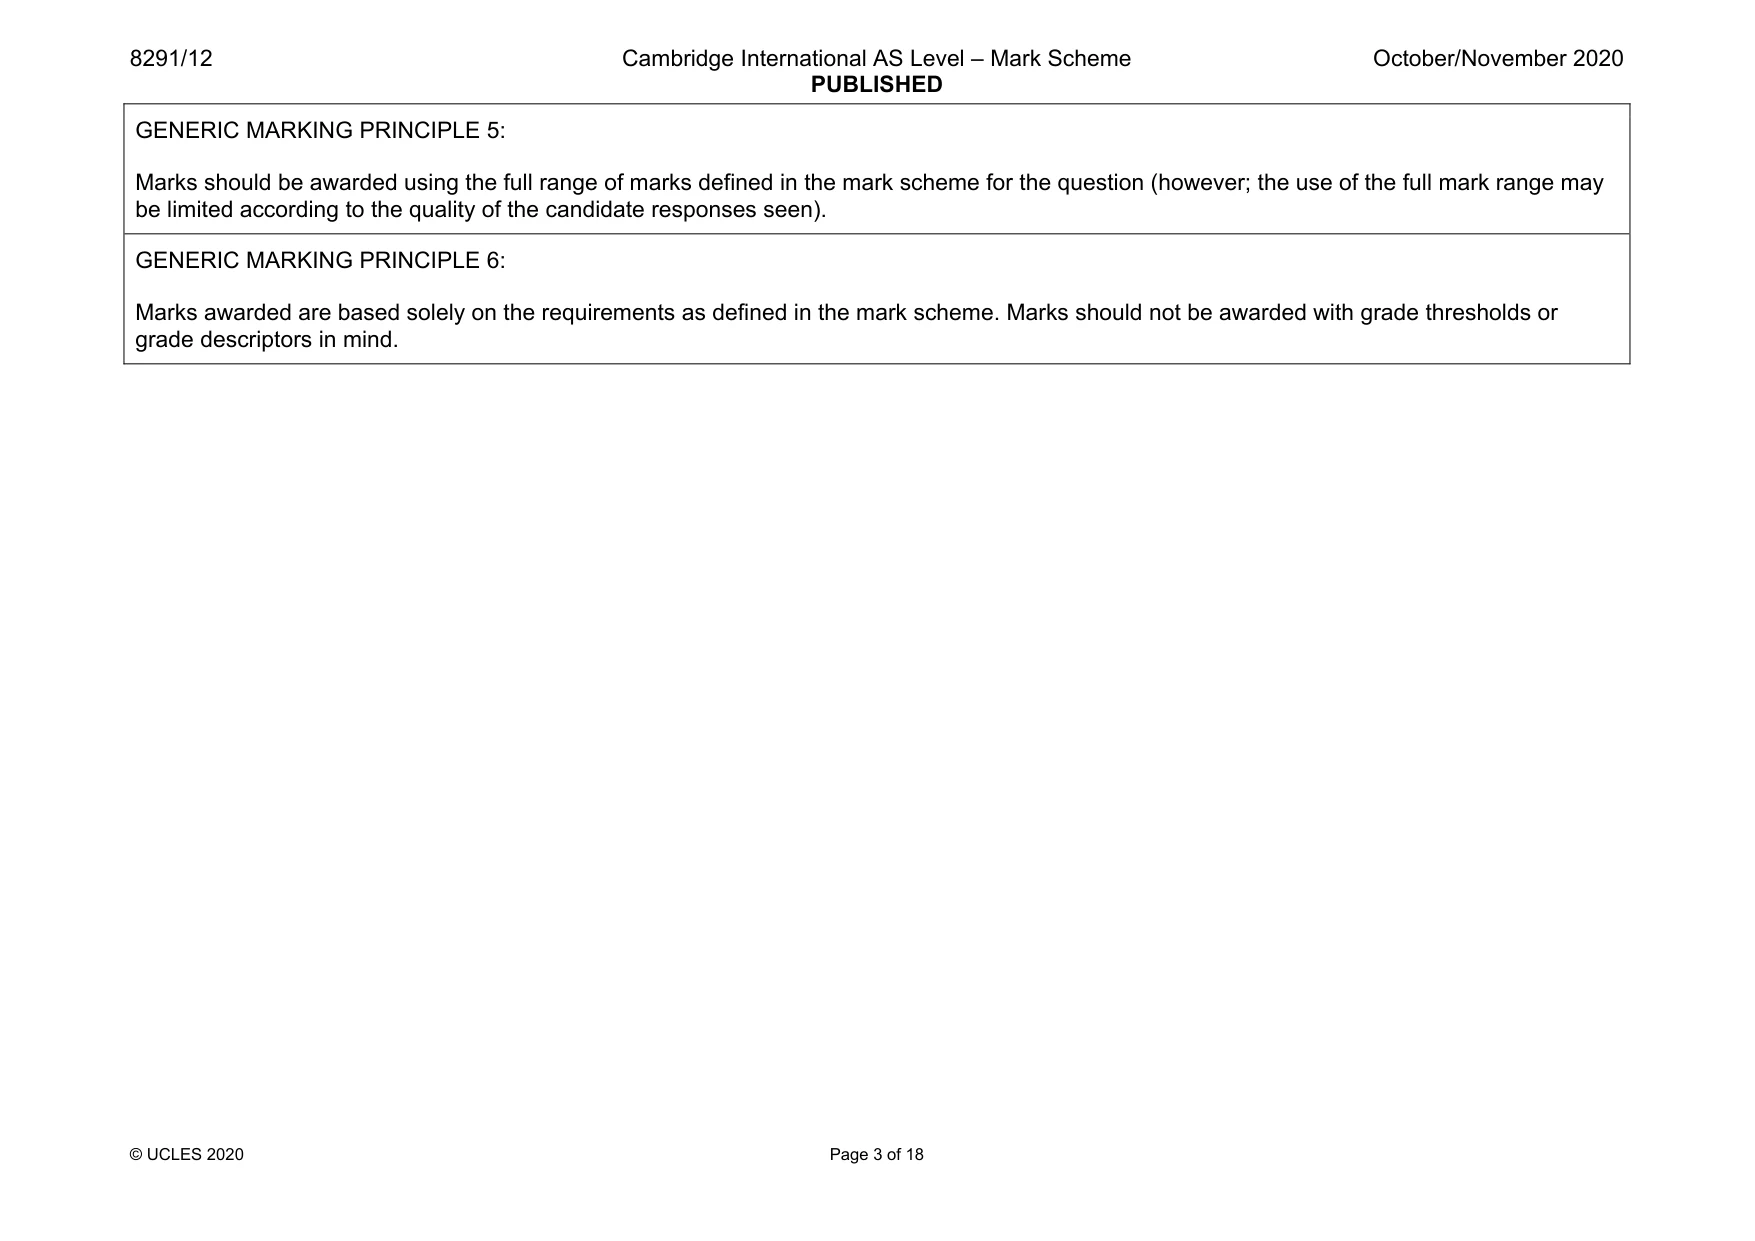
This document consists of 18 printed pages. © UCLES 2020 [Turn over Cambridge International AS Level ENVIRONMENTAL MANAGEMENT 8291/12 Paper 1 October/November 2020 MARK SCHEME Maximum Mark: 80 Published This mark scheme is published as an aid to teachers and candidates, to indicate the requirements of the examination. It shows the basis on which Examiners were instructed to award marks. It does not indicate the details of the discussions that took place at an Examiners’ meeting before marking began, which would have considered the acceptability of alternative answers. Mark schemes should be read in conjunction with the question paper and the Principal Examiner Report for Teachers. Cambridge International will not enter into discussions about these mark schemes. Cambridge International is publishing the mark schemes for the October/November 2020 series for most Cambridge IGCSE™, Cambridge International A and AS Level and Cambridge Pre-U components, and some Cambridge O Level components.
Mark scheme, page 2
8291/12 Cambridge International AS Level – Mark Scheme PUBLISHED October/November 2020 © UCLES 2020 Page 2 of 18 Generic Marking Principles These general marking principles must be applied by all examiners when marking candidate answers. They should be applied alongside the specific content of the mark scheme or generic level descriptors for a question. Each question paper and mark scheme will also comply with these marking principles. GENERIC MARKING PRINCIPLE 1: Marks must be awarded in line with: • the specific content of the mark scheme or the generic level descriptors for the question • the specific skills defined in the mark scheme or in the generic level descriptors for the question • the standard of response required by a candidate as exemplified by the standardisation scripts. GENERIC MARKING PRINCIPLE 2: Marks awarded are always whole marks (not half marks, or other fractions). GENERIC MARKING PRINCIPLE 3: Marks must be awarded positively: • marks are awarded for correct/valid answers, as defined in the mark scheme. However, credit is given for valid answers which go beyond the scope of the syllabus and mark scheme, referring to your Team Leader as appropriate • marks are awarded when candidates clearly demonstrate what they know and can do • marks are not deducted for errors • marks are not deducted for omissions • answers should only be judged on the quality of spelling, punctuation and grammar when these features are specifically assessed by the question as indicated by the mark scheme. The meaning, however, should be unambiguous. GENERIC MARKING PRINCIPLE 4: Rules must be applied consistently, e.g. in situations where candidates have not followed instructions or in the application of generic level descriptors.
Mark scheme, page 3
8291/12 Cambridge International AS Level – Mark Scheme PUBLISHED October/November 2020 © UCLES 2020 Page 3 of 18 GENERIC MARKING PRINCIPLE 5: Marks should be awarded using the full range of marks defined in the mark scheme for the question (however; the use of the full mark range may be limited according to the quality of the candidate responses seen). GENERIC MARKING PRINCIPLE 6: Marks awarded are based solely on the requirements as defined in the mark scheme. Marks should not be awarded with grade thresholds or grade descriptors in mind.
Mark scheme, page 4
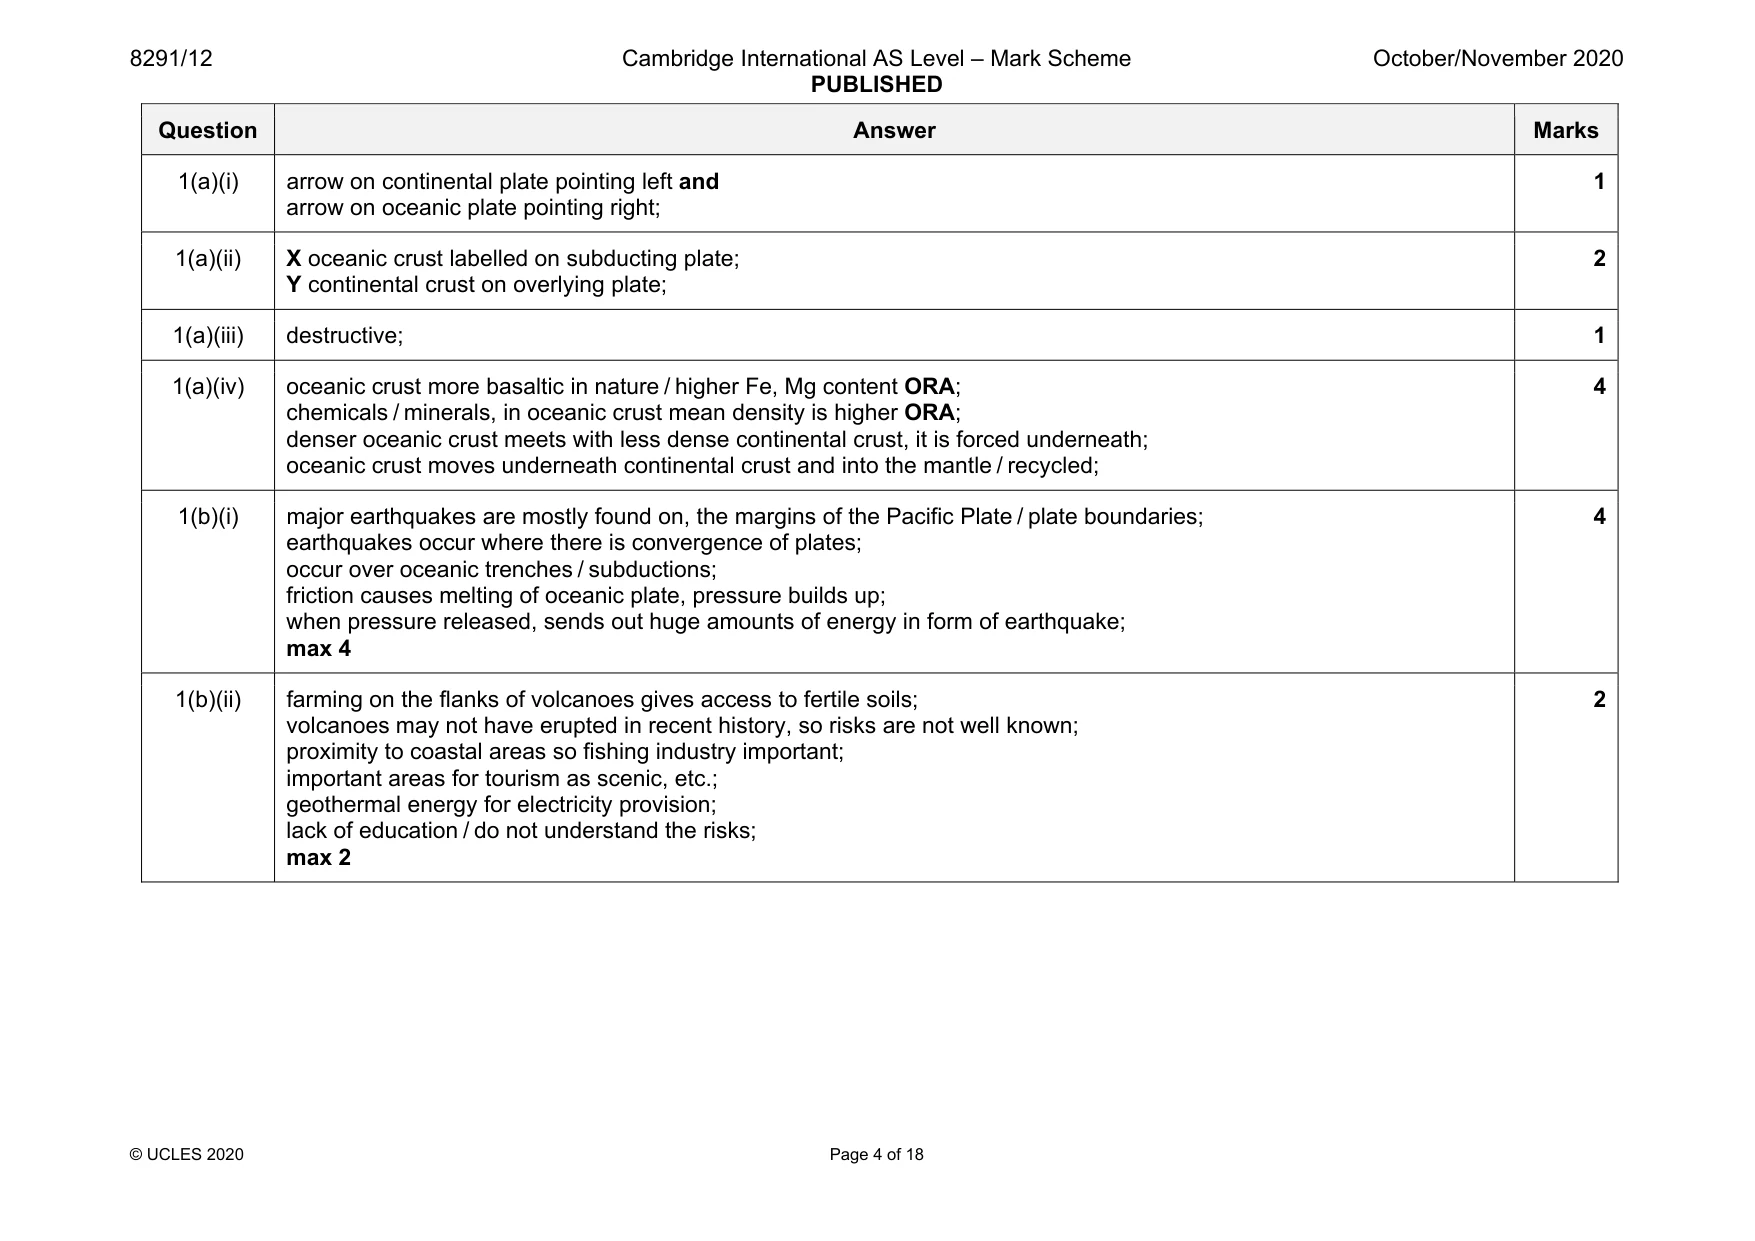
8291/12 Cambridge International AS Level – Mark Scheme PUBLISHED October/November 2020 © UCLES 2020 Page 4 of 18 Question Answer Marks 1(a)(i) arrow on continental plate pointing left and arrow on oceanic plate pointing right; 1 1(a)(ii) X oceanic crust labelled on subducting plate; Y continental crust on overlying plate; 2 1(a)(iii) destructive; 1 1(a)(iv) oceanic crust more basaltic in nature / higher Fe, Mg content ORA; chemicals / minerals, in oceanic crust mean density is higher ORA; denser oceanic crust meets with less dense continental crust, it is forced underneath; oceanic crust moves underneath continental crust and into the mantle / recycled; 4 1(b)(i) major earthquakes are mostly found on, the margins of the Pacific Plate / plate boundaries; earthquakes occur where there is convergence of plates; occur over oceanic trenches / subductions; friction causes melting of oceanic plate, pressure builds up; when pressure released, sends out huge amounts of energy in form of earthquake; max 4 4 1(b)(ii) farming on the flanks of volcanoes gives access to fertile soils; volcanoes may not have erupted in recent history, so risks are not well known; proximity to coastal areas so fishing industry important; important areas for tourism as scenic, etc.; geothermal energy for electricity provision; lack of education / do not understand the risks; max 2 2
Mark scheme, page 5
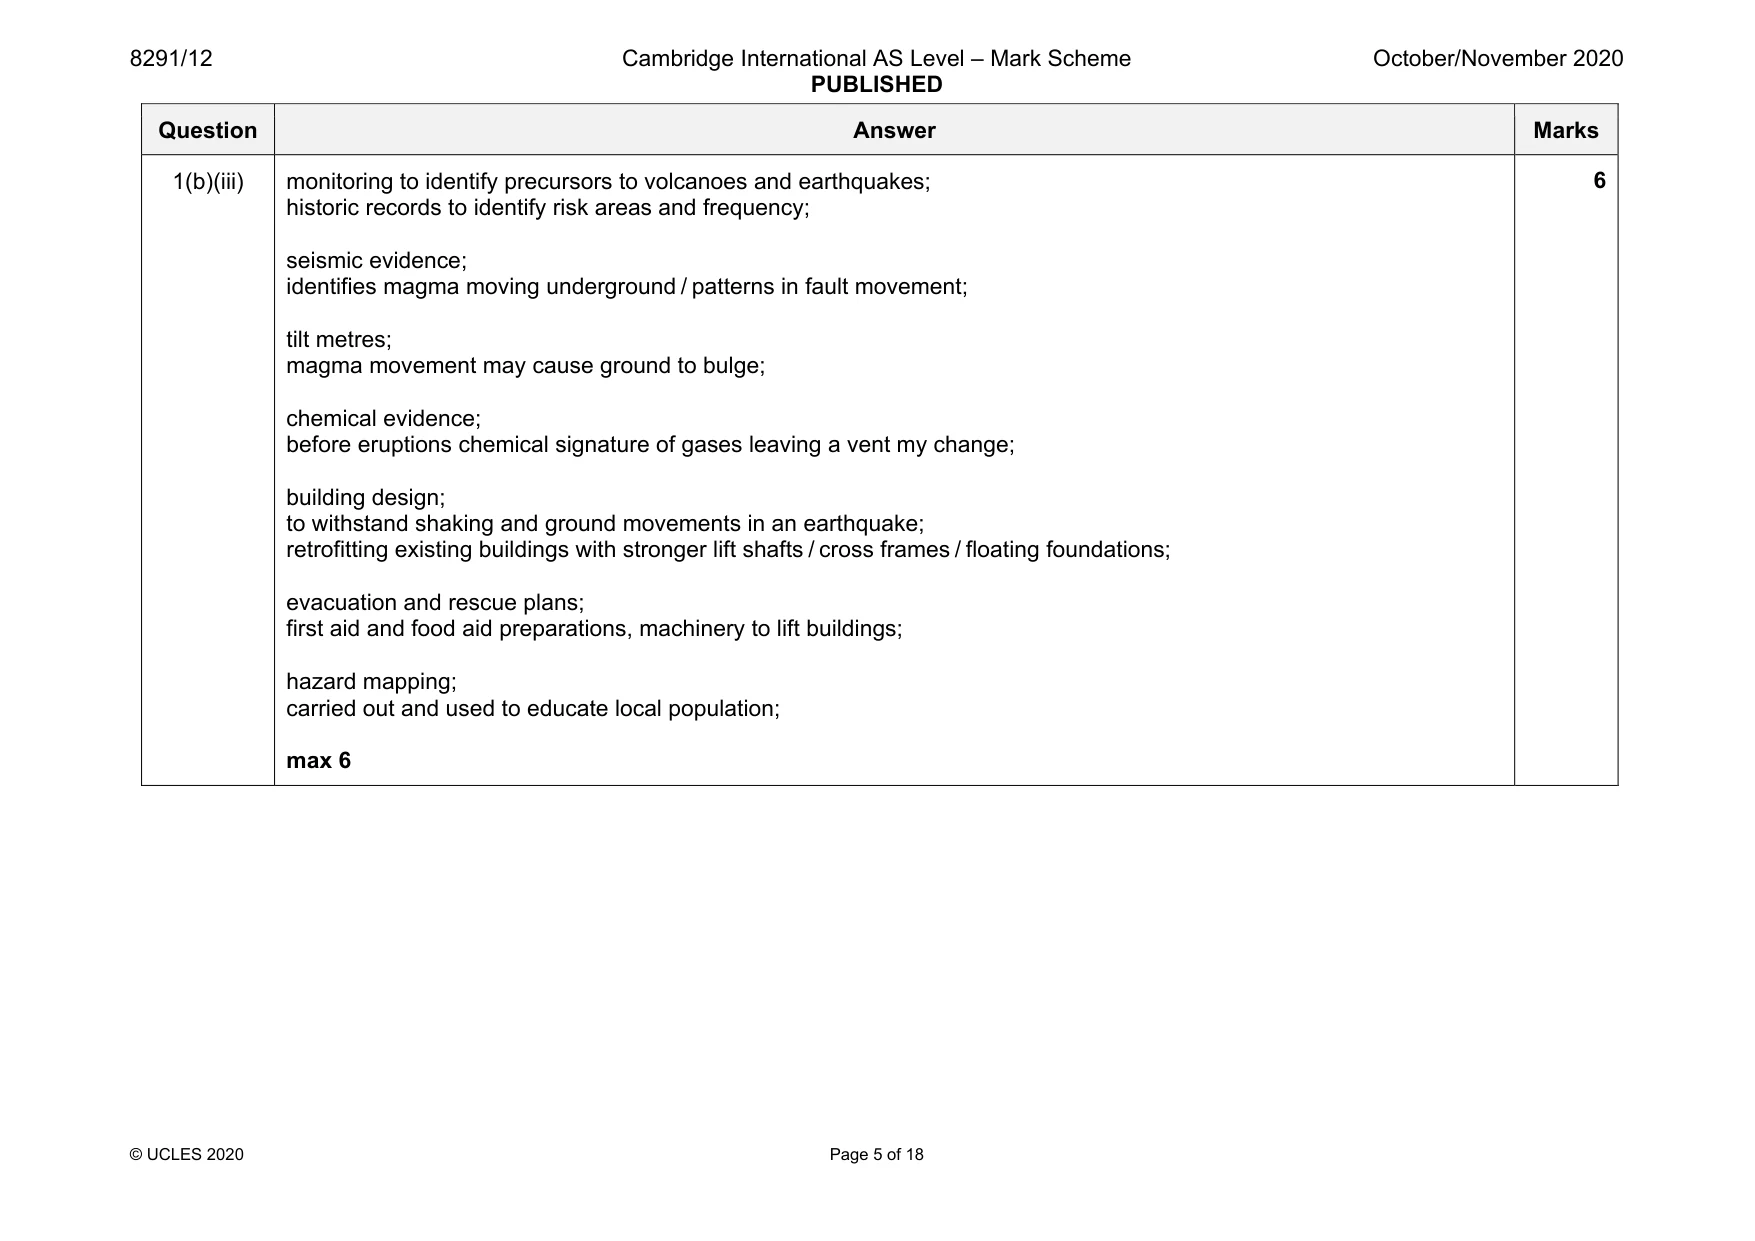
8291/12 Cambridge International AS Level – Mark Scheme PUBLISHED October/November 2020 © UCLES 2020 Page 5 of 18 Question Answer Marks 1(b)(iii) monitoring to identify precursors to volcanoes and earthquakes; historic records to identify risk areas and frequency; seismic evidence; identifies magma moving underground / patterns in fault movement; tilt metres; magma movement may cause ground to bulge; chemical evidence; before eruptions chemical signature of gases leaving a vent my change; building design; to withstand shaking and ground movements in an earthquake; retrofitting existing buildings with stronger lift shafts / cross frames / floating foundations; evacuation and rescue plans; first aid and food aid preparations, machinery to lift buildings; hazard mapping; carried out and used to educate local population; max 6 6
Mark scheme, page 6
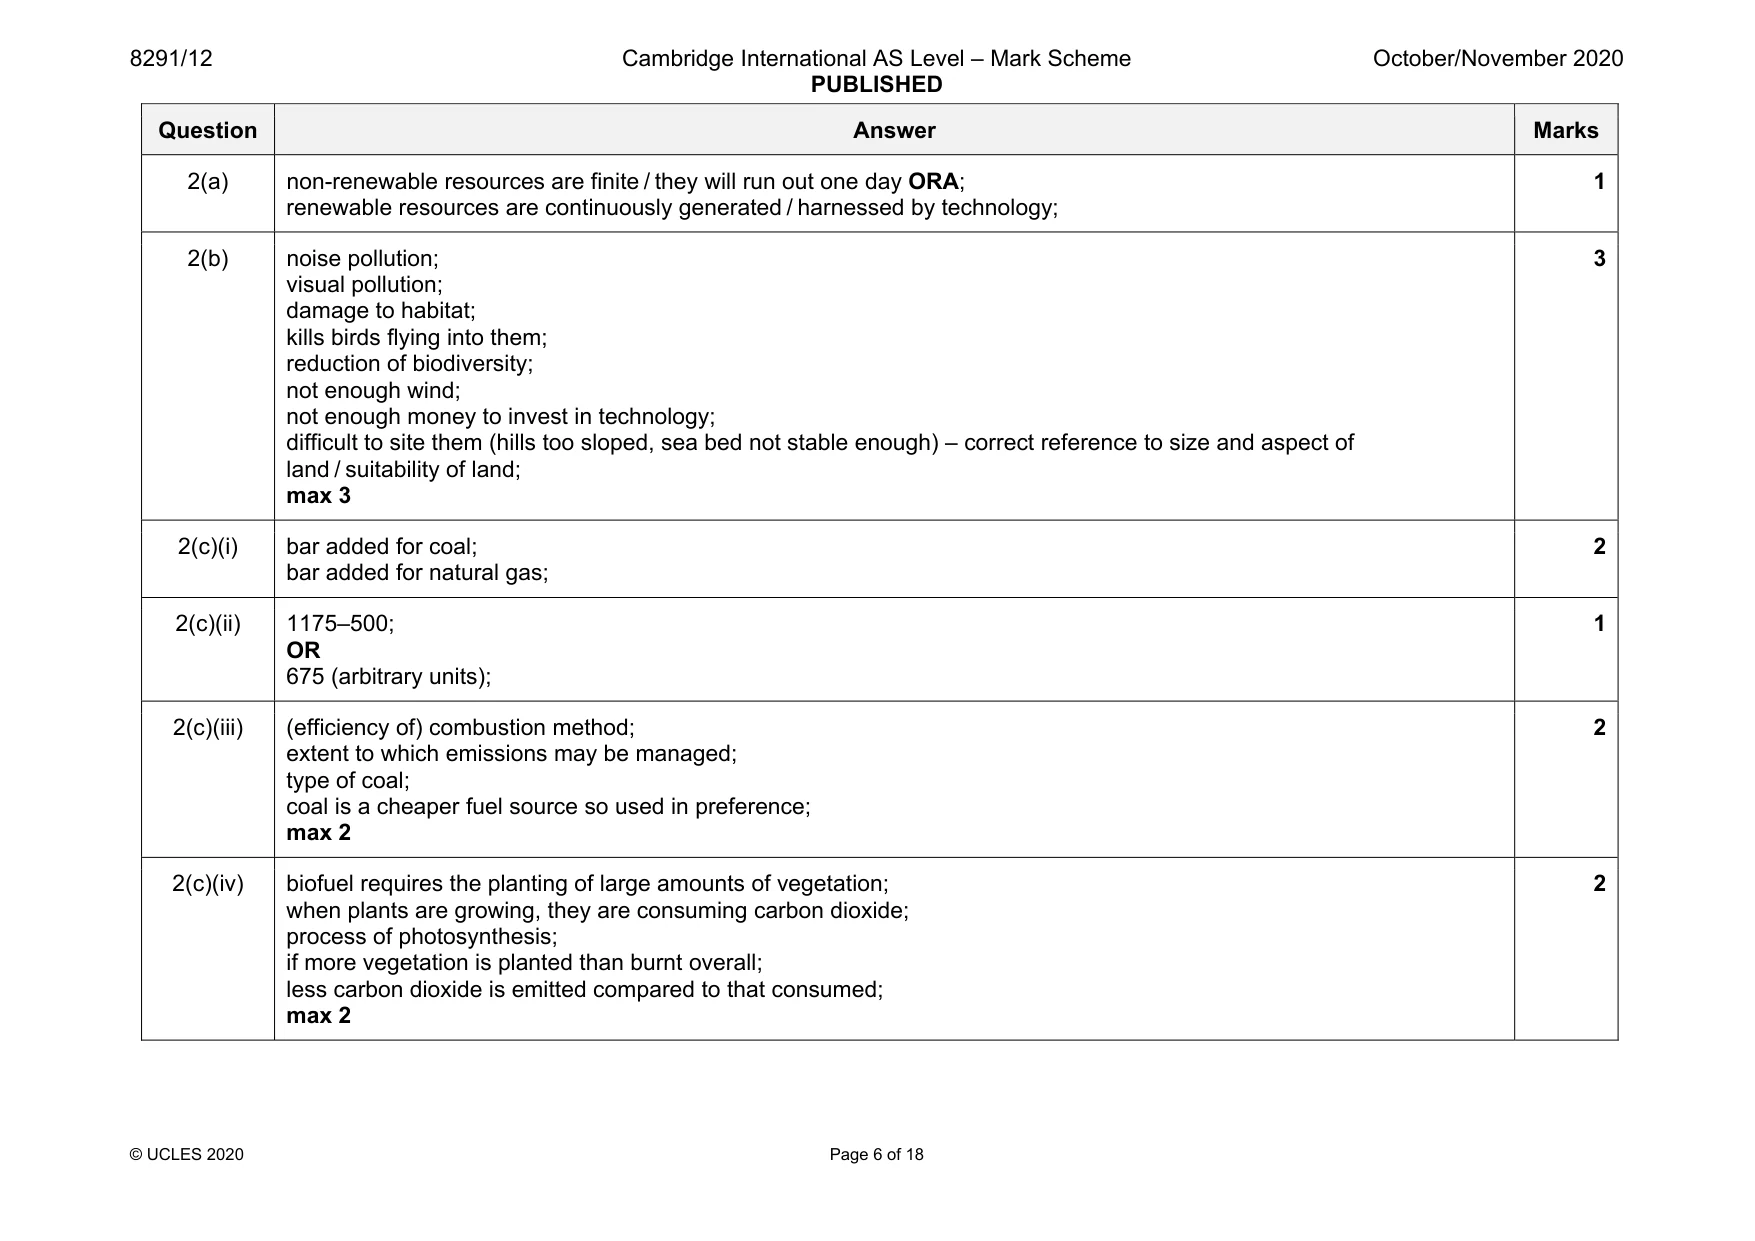
8291/12 Cambridge International AS Level – Mark Scheme PUBLISHED October/November 2020 © UCLES 2020 Page 6 of 18 Question Answer Marks 2(a) non-renewable resources are finite / they will run out one day ORA; renewable resources are continuously generated / harnessed by technology; 1 2(b) noise pollution; visual pollution; damage to habitat; kills birds flying into them; reduction of biodiversity; not enough wind; not enough money to invest in technology; difficult to site them (hills too sloped, sea bed not stable enough) – correct reference to size and aspect of land / suitability of land; max 3 3 2(c)(i) bar added for coal; bar added for natural gas; 2 2(c)(ii) 1175–500; OR 675 (arbitrary units); 1 2(c)(iii) (efficiency of) combustion method; extent to which emissions may be managed; type of coal; coal is a cheaper fuel source so used in preference; max 2 2 2(c)(iv) biofuel requires the planting of large amounts of vegetation; when plants are growing, they are consuming carbon dioxide; process of photosynthesis; if more vegetation is planted than burnt overall; less carbon dioxide is emitted compared to that consumed; max 2 2
Mark scheme, page 7
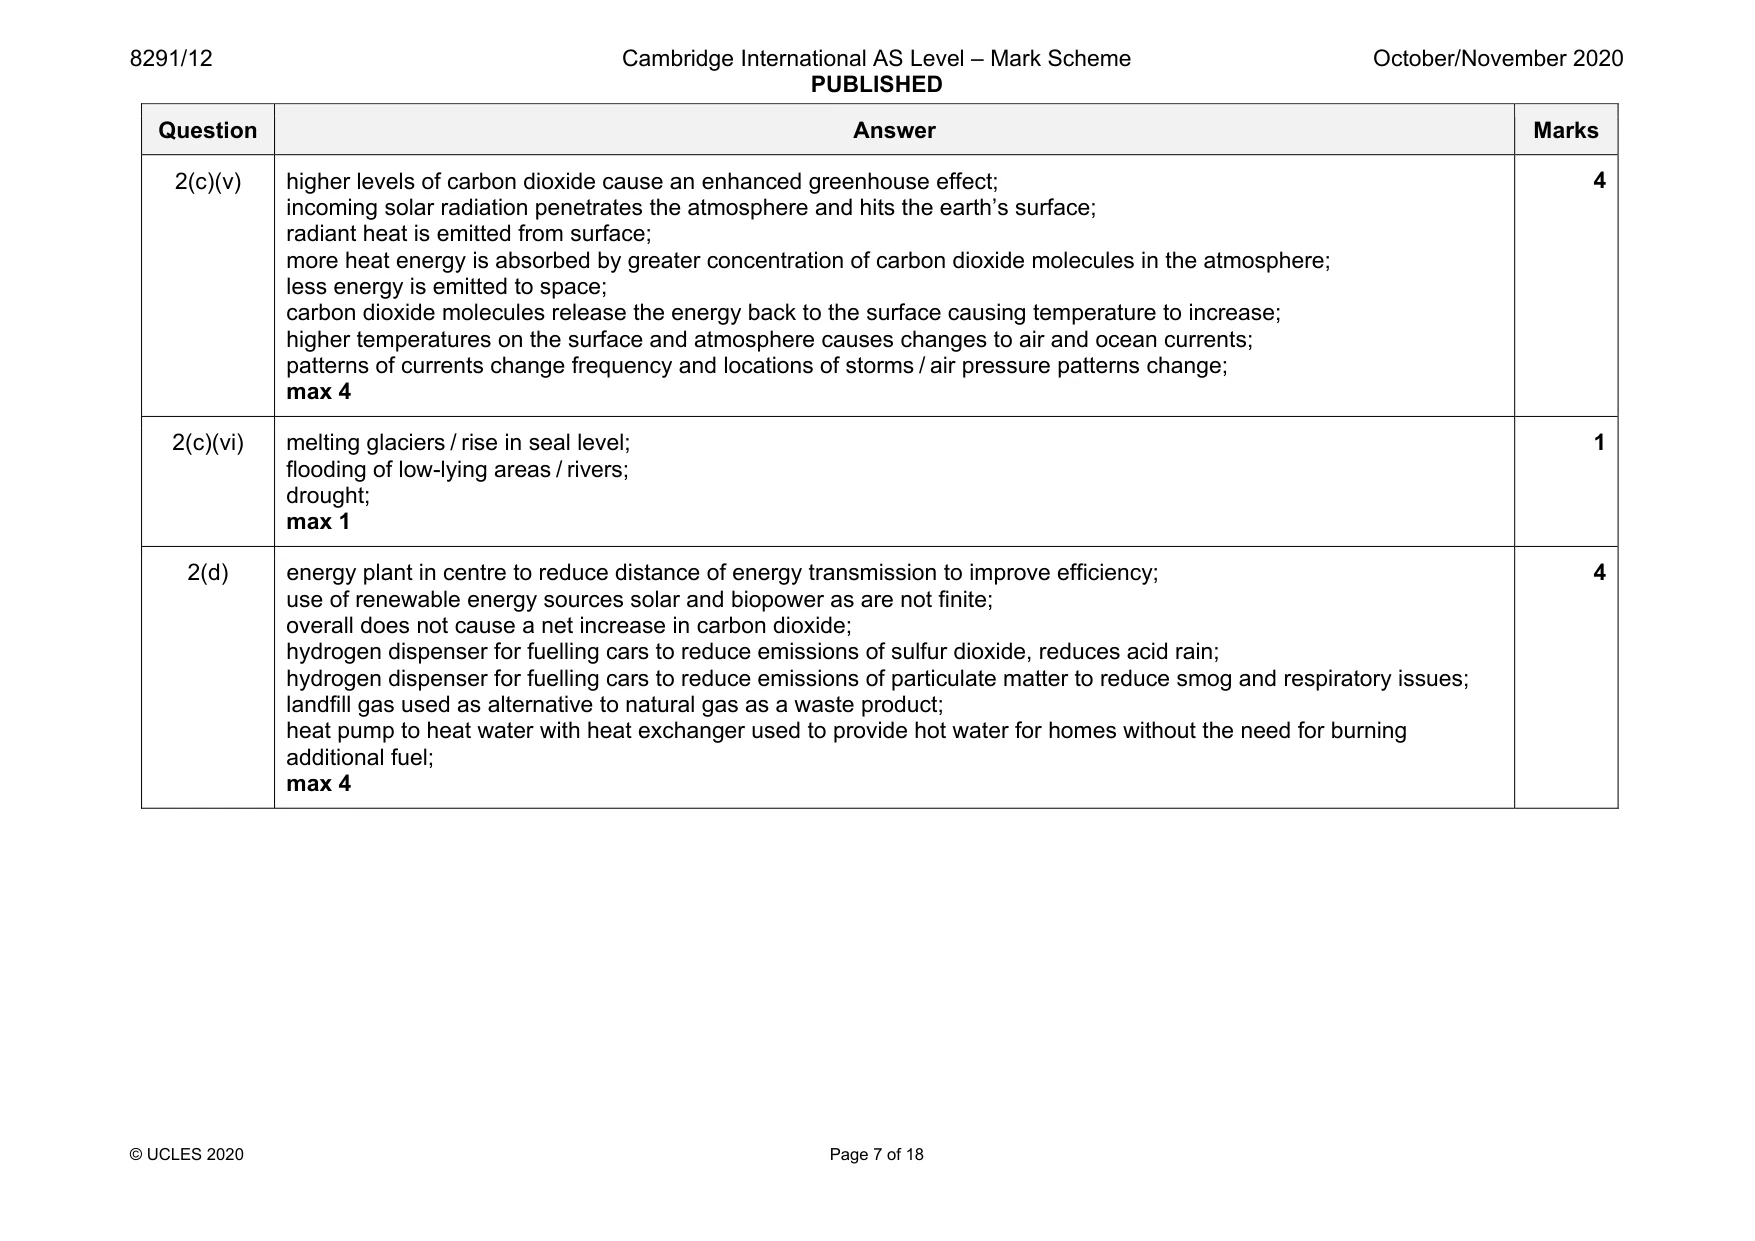
8291/12 Cambridge International AS Level – Mark Scheme PUBLISHED October/November 2020 © UCLES 2020 Page 7 of 18 Question Answer Marks 2(c)(v) higher levels of carbon dioxide cause an enhanced greenhouse effect; incoming solar radiation penetrates the atmosphere and hits the earth’s surface; radiant heat is emitted from surface; more heat energy is absorbed by greater concentration of carbon dioxide molecules in the atmosphere; less energy is emitted to space; carbon dioxide molecules release the energy back to the surface causing temperature to increase; higher temperatures on the surface and atmosphere causes changes to air and ocean currents; patterns of currents change frequency and locations of storms / air pressure patterns change; max 4 4 2(c)(vi) melting glaciers / rise in seal level; flooding of low-lying areas / rivers; drought; max 1 1 2(d) energy plant in centre to reduce distance of energy transmission to improve efficiency; use of renewable energy sources solar and biopower as are not finite; overall does not cause a net increase in carbon dioxide; hydrogen dispenser for fuelling cars to reduce emissions of sulfur dioxide, reduces acid rain; hydrogen dispenser for fuelling cars to reduce emissions of particulate matter to reduce smog and respiratory issues; landfill gas used as alternative to natural gas as a waste product; heat pump to heat water with heat exchanger used to provide hot water for homes without the need for burning additional fuel; max 4 4
Mark scheme, page 8
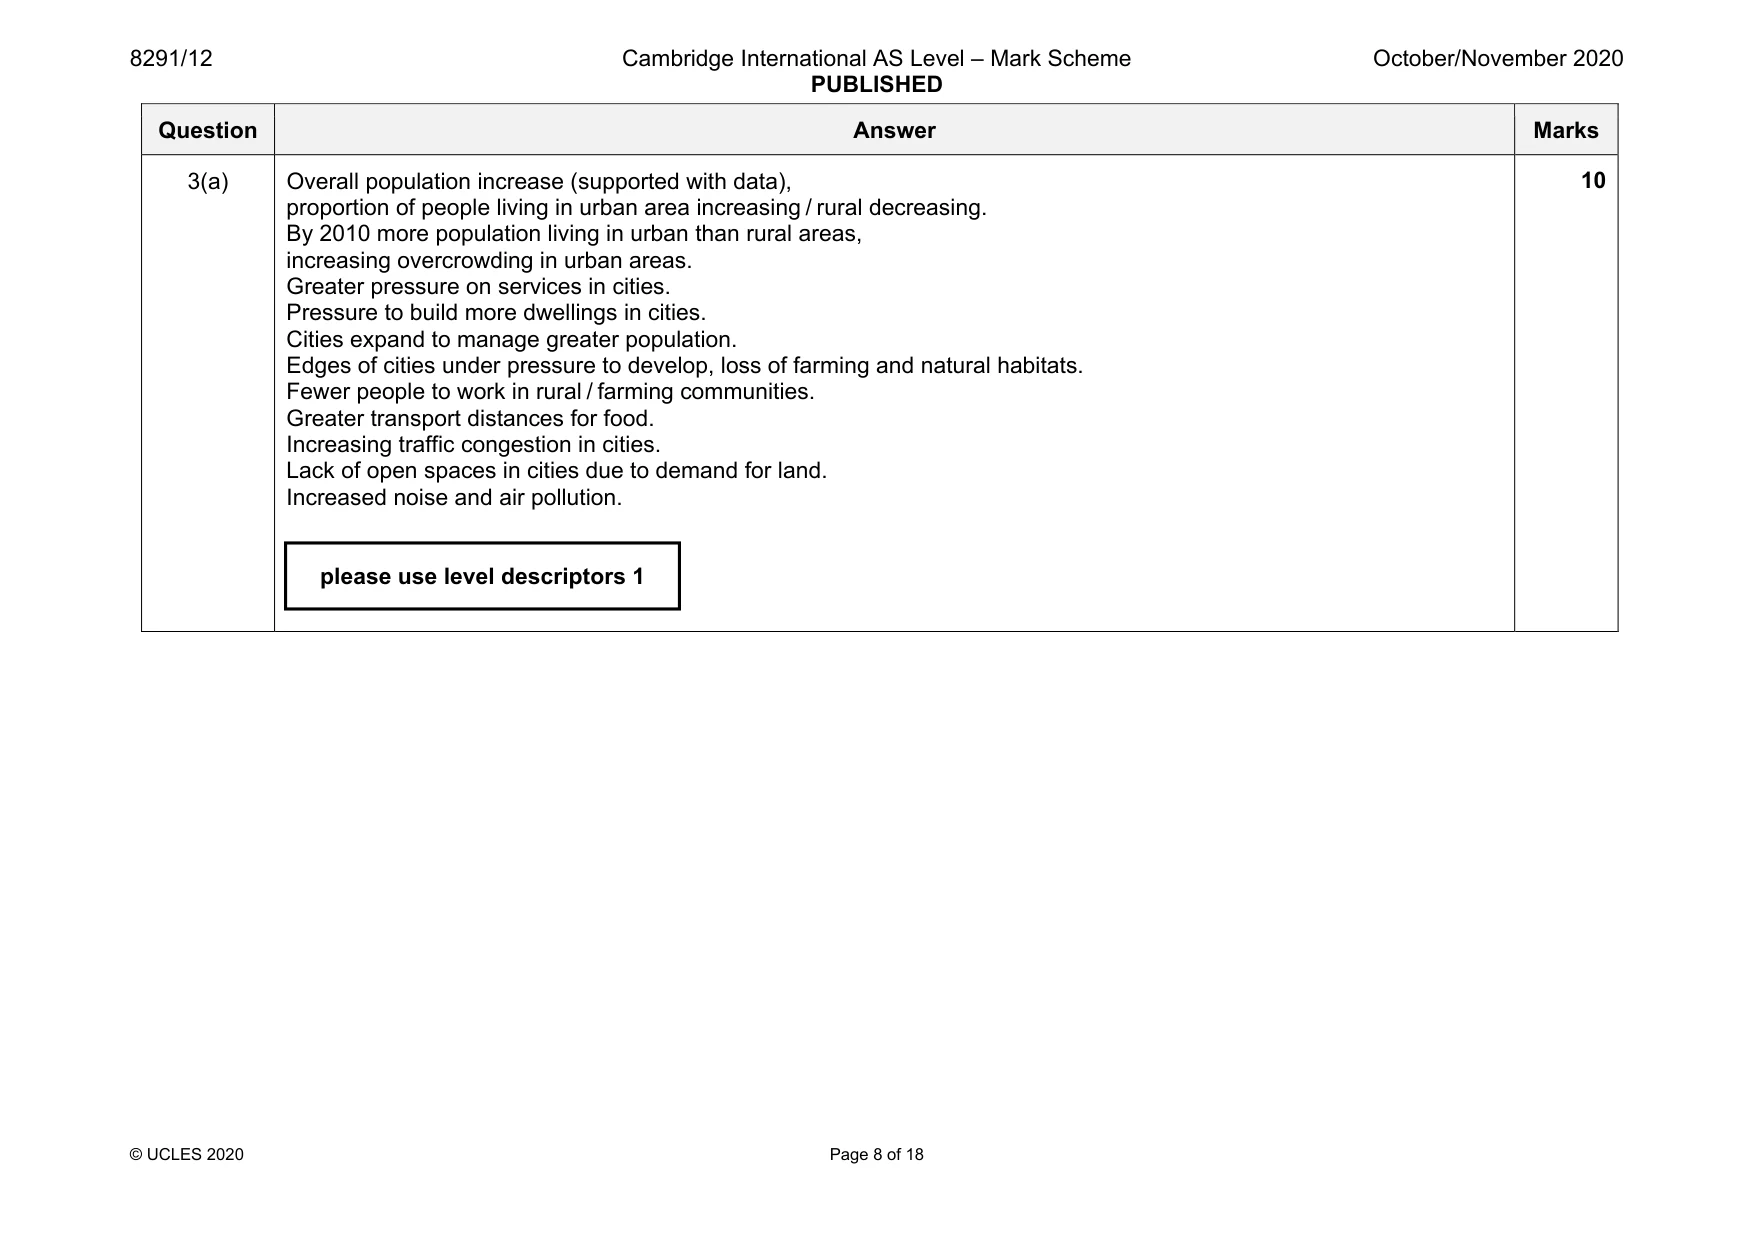
8291/12 Cambridge International AS Level – Mark Scheme PUBLISHED October/November 2020 © UCLES 2020 Page 8 of 18 Question Answer Marks 3(a) Overall population increase (supported with data), proportion of people living in urban area increasing / rural decreasing. By 2010 more population living in urban than rural areas, increasing overcrowding in urban areas. Greater pressure on services in cities. Pressure to build more dwellings in cities. Cities expand to manage greater population. Edges of cities under pressure to develop, loss of farming and natural habitats. Fewer people to work in rural / farming communities. Greater transport distances for food. Increasing traffic congestion in cities. Lack of open spaces in cities due to demand for land. Increased noise and air pollution. 10 please use level descriptors 1
Mark scheme, page 9
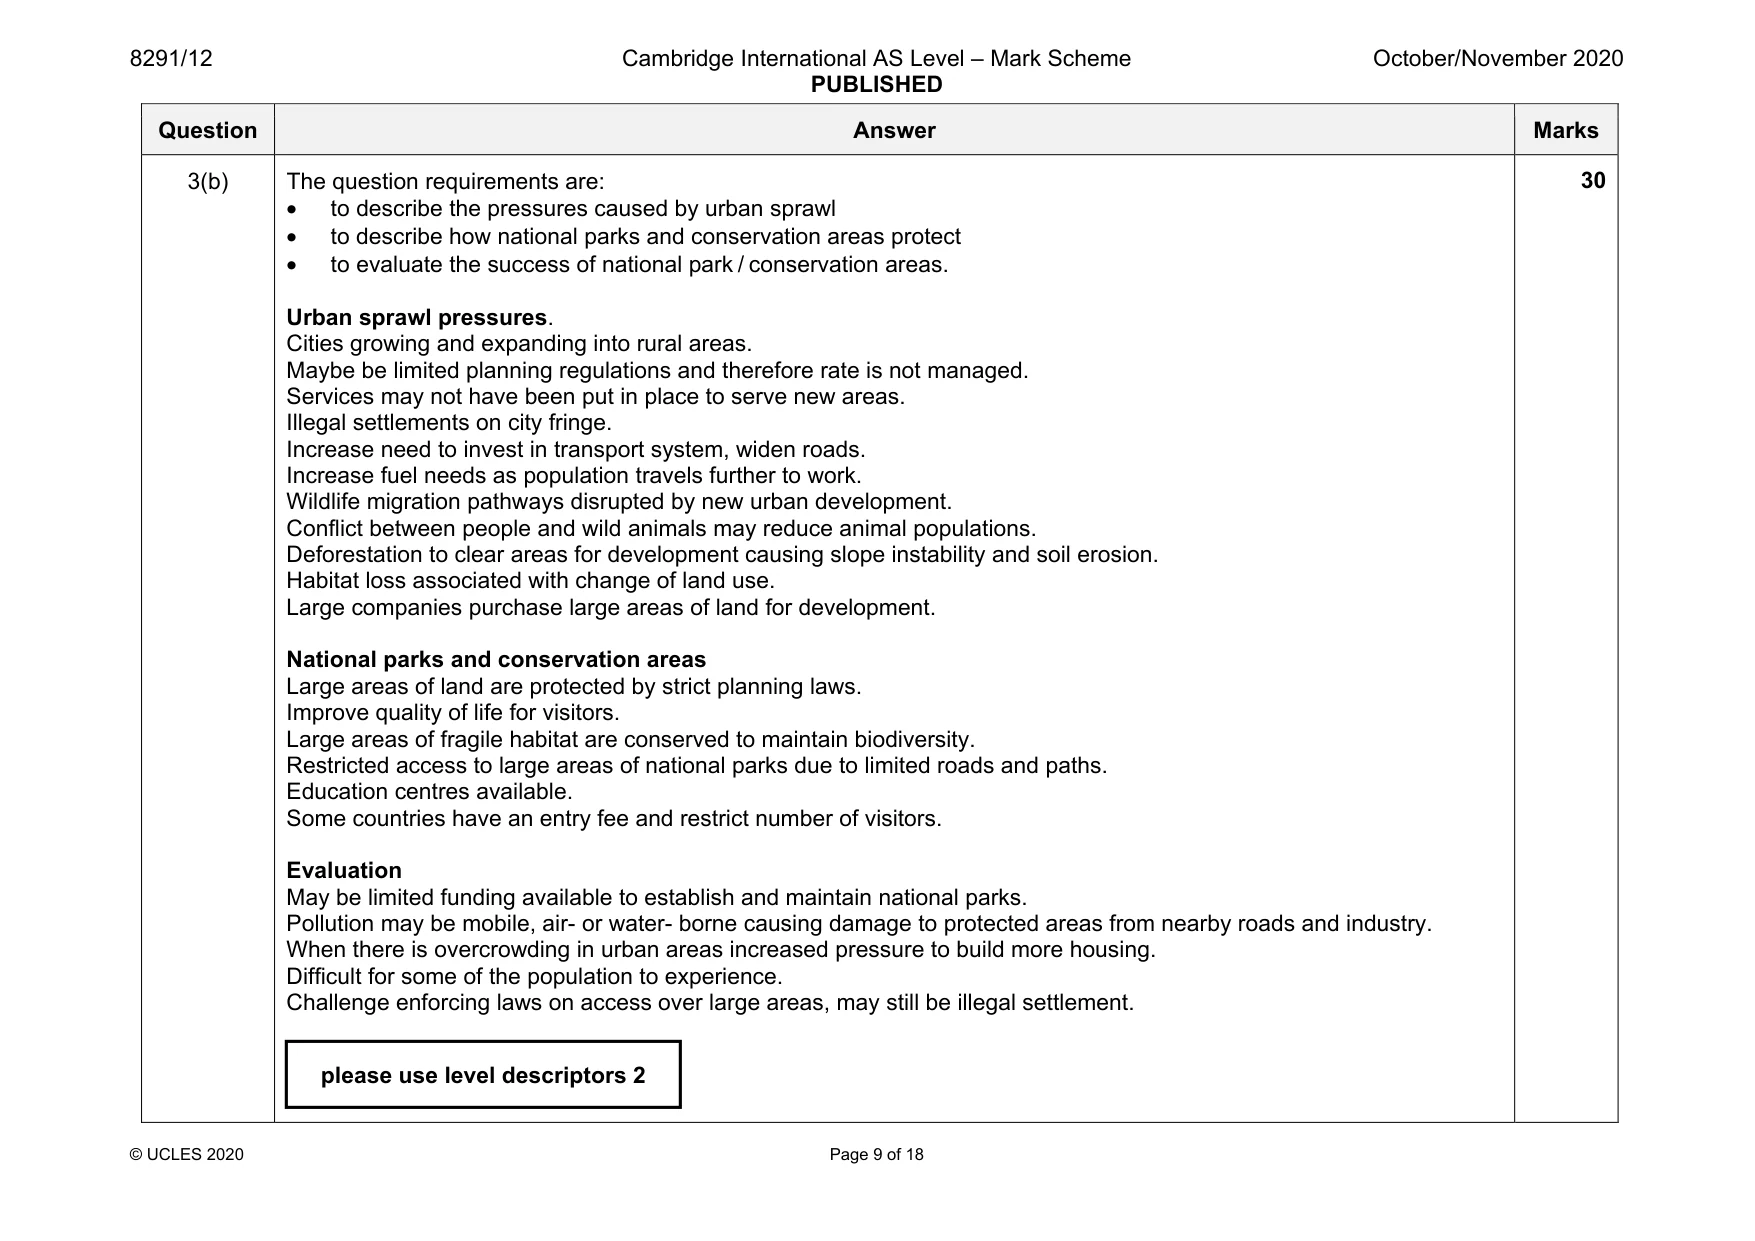
8291/12 Cambridge International AS Level – Mark Scheme PUBLISHED October/November 2020 © UCLES 2020 Page 9 of 18 Question Answer Marks 3(b) The question requirements are: • to describe the pressures caused by urban sprawl • to describe how national parks and conservation areas protect • to evaluate the success of national park / conservation areas. Urban sprawl pressures. Cities growing and expanding into rural areas. Maybe be limited planning regulations and therefore rate is not managed. Services may not have been put in place to serve new areas. Illegal settlements on city fringe. Increase need to invest in transport system, widen roads. Increase fuel needs as population travels further to work. Wildlife migration pathways disrupted by new urban development. Conflict between people and wild animals may reduce animal populations. Deforestation to clear areas for development causing slope instability and soil erosion. Habitat loss associated with change of land use. Large companies purchase large areas of land for development. National parks and conservation areas Large areas of land are protected by strict planning laws. Improve quality of life for visitors. Large areas of fragile habitat are conserved to maintain biodiversity. Restricted access to large areas of national parks due to limited roads and paths. Education centres available. Some countries have an entry fee and restrict number of visitors. Evaluation May be limited funding available to establish and maintain national parks. Pollution may be mobile, air- or water- borne causing damage to protected areas from nearby roads and industry. When there is overcrowding in urban areas increased pressure to build more housing. Difficult for some of the population to experience. Challenge enforcing laws on access over large areas, may still be illegal settlement. 30 please use level descriptors 2
Mark scheme, page 10
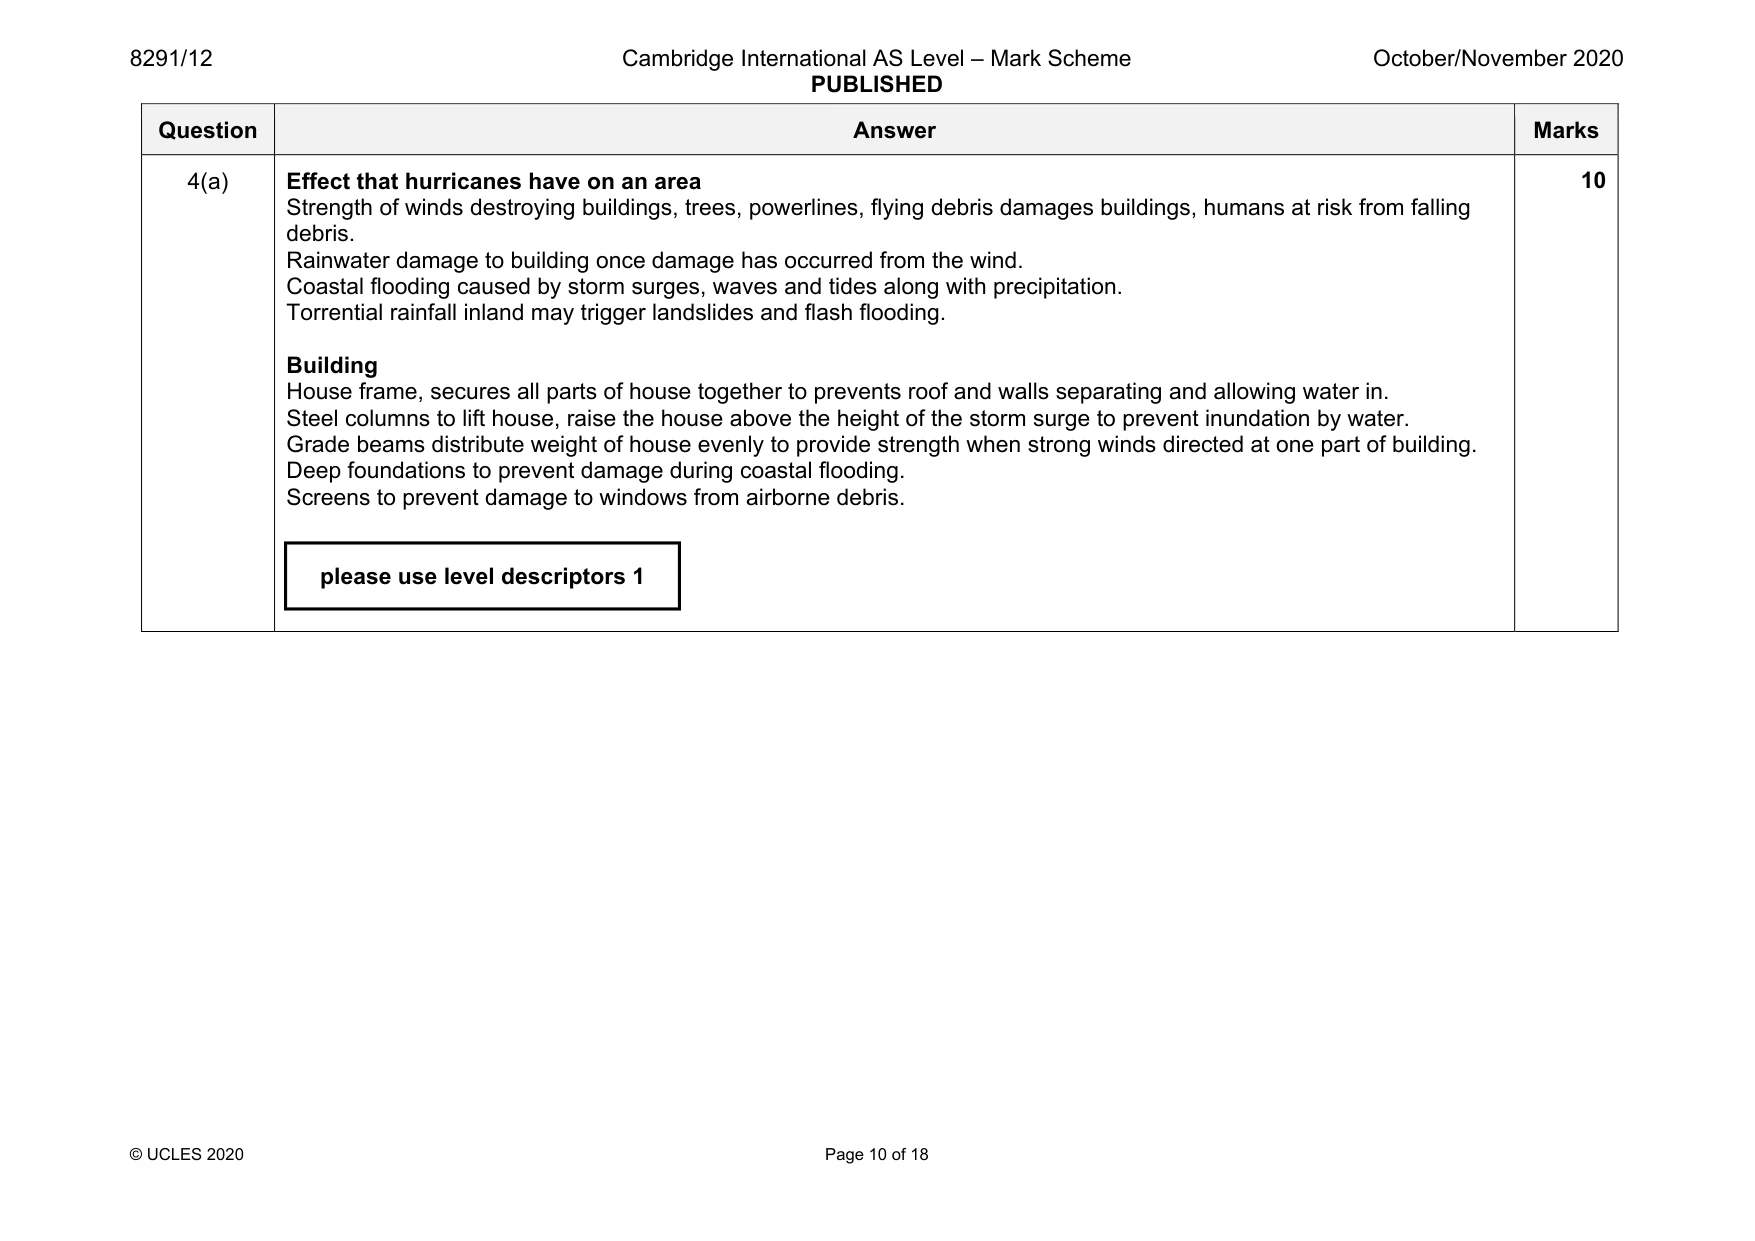
8291/12 Cambridge International AS Level – Mark Scheme PUBLISHED October/November 2020 © UCLES 2020 Page 10 of 18 Question Answer Marks 4(a) Effect that hurricanes have on an area Strength of winds destroying buildings, trees, powerlines, flying debris damages buildings, humans at risk from falling debris. Rainwater damage to building once damage has occurred from the wind. Coastal flooding caused by storm surges, waves and tides along with precipitation. Torrential rainfall inland may trigger landslides and flash flooding. Building House frame, secures all parts of house together to prevents roof and walls separating and allowing water in. Steel columns to lift house, raise the house above the height of the storm surge to prevent inundation by water. Grade beams distribute weight of house evenly to provide strength when strong winds directed at one part of building. Deep foundations to prevent damage during coastal flooding. Screens to prevent damage to windows from airborne debris. 10 please use level descriptors 1
Mark scheme, page 11
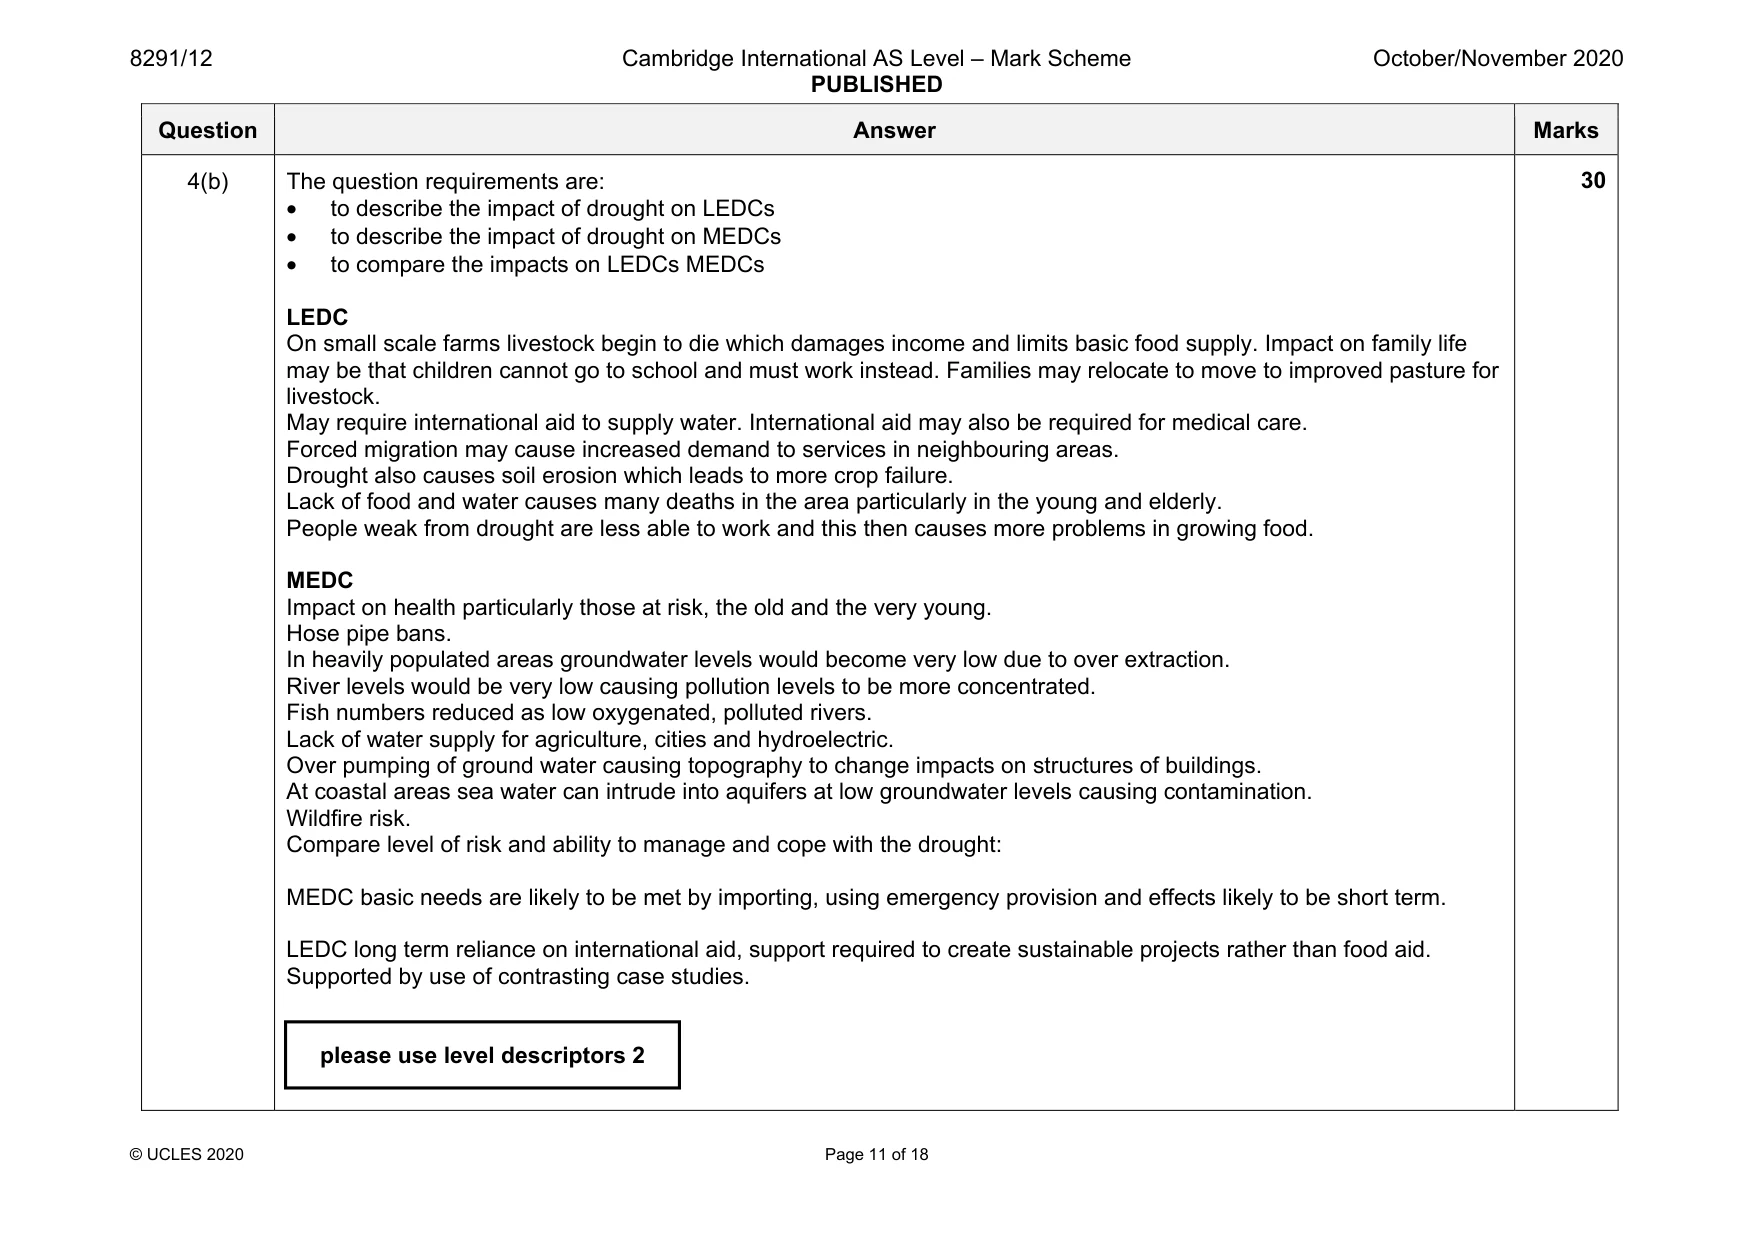
8291/12 Cambridge International AS Level – Mark Scheme PUBLISHED October/November 2020 © UCLES 2020 Page 11 of 18 Question Answer Marks 4(b) The question requirements are: • to describe the impact of drought on LEDCs • to describe the impact of drought on MEDCs • to compare the impacts on LEDCs MEDCs LEDC On small scale farms livestock begin to die which damages income and limits basic food supply. Impact on family life may be that children cannot go to school and must work instead. Families may relocate to move to improved pasture for livestock. May require international aid to supply water. International aid may also be required for medical care. Forced migration may cause increased demand to services in neighbouring areas. Drought also causes soil erosion which leads to more crop failure. Lack of food and water causes many deaths in the area particularly in the young and elderly. People weak from drought are less able to work and this then causes more problems in growing food. MEDC Impact on health particularly those at risk, the old and the very young. Hose pipe bans. In heavily populated areas groundwater levels would become very low due to over extraction. River levels would be very low causing pollution levels to be more concentrated. Fish numbers reduced as low oxygenated, polluted rivers. Lack of water supply for agriculture, cities and hydroelectric. Over pumping of ground water causing topography to change impacts on structures of buildings. At coastal areas sea water can intrude into aquifers at low groundwater levels causing contamination. Wildfire risk. Compare level of risk and ability to manage and cope with the drought: MEDC basic needs are likely to be met by importing, using emergency provision and effects likely to be short term. LEDC long term reliance on international aid, support required to create sustainable projects rather than food aid. Supported by use of contrasting case studies. 30 please use level descriptors 2
Mark scheme, page 12
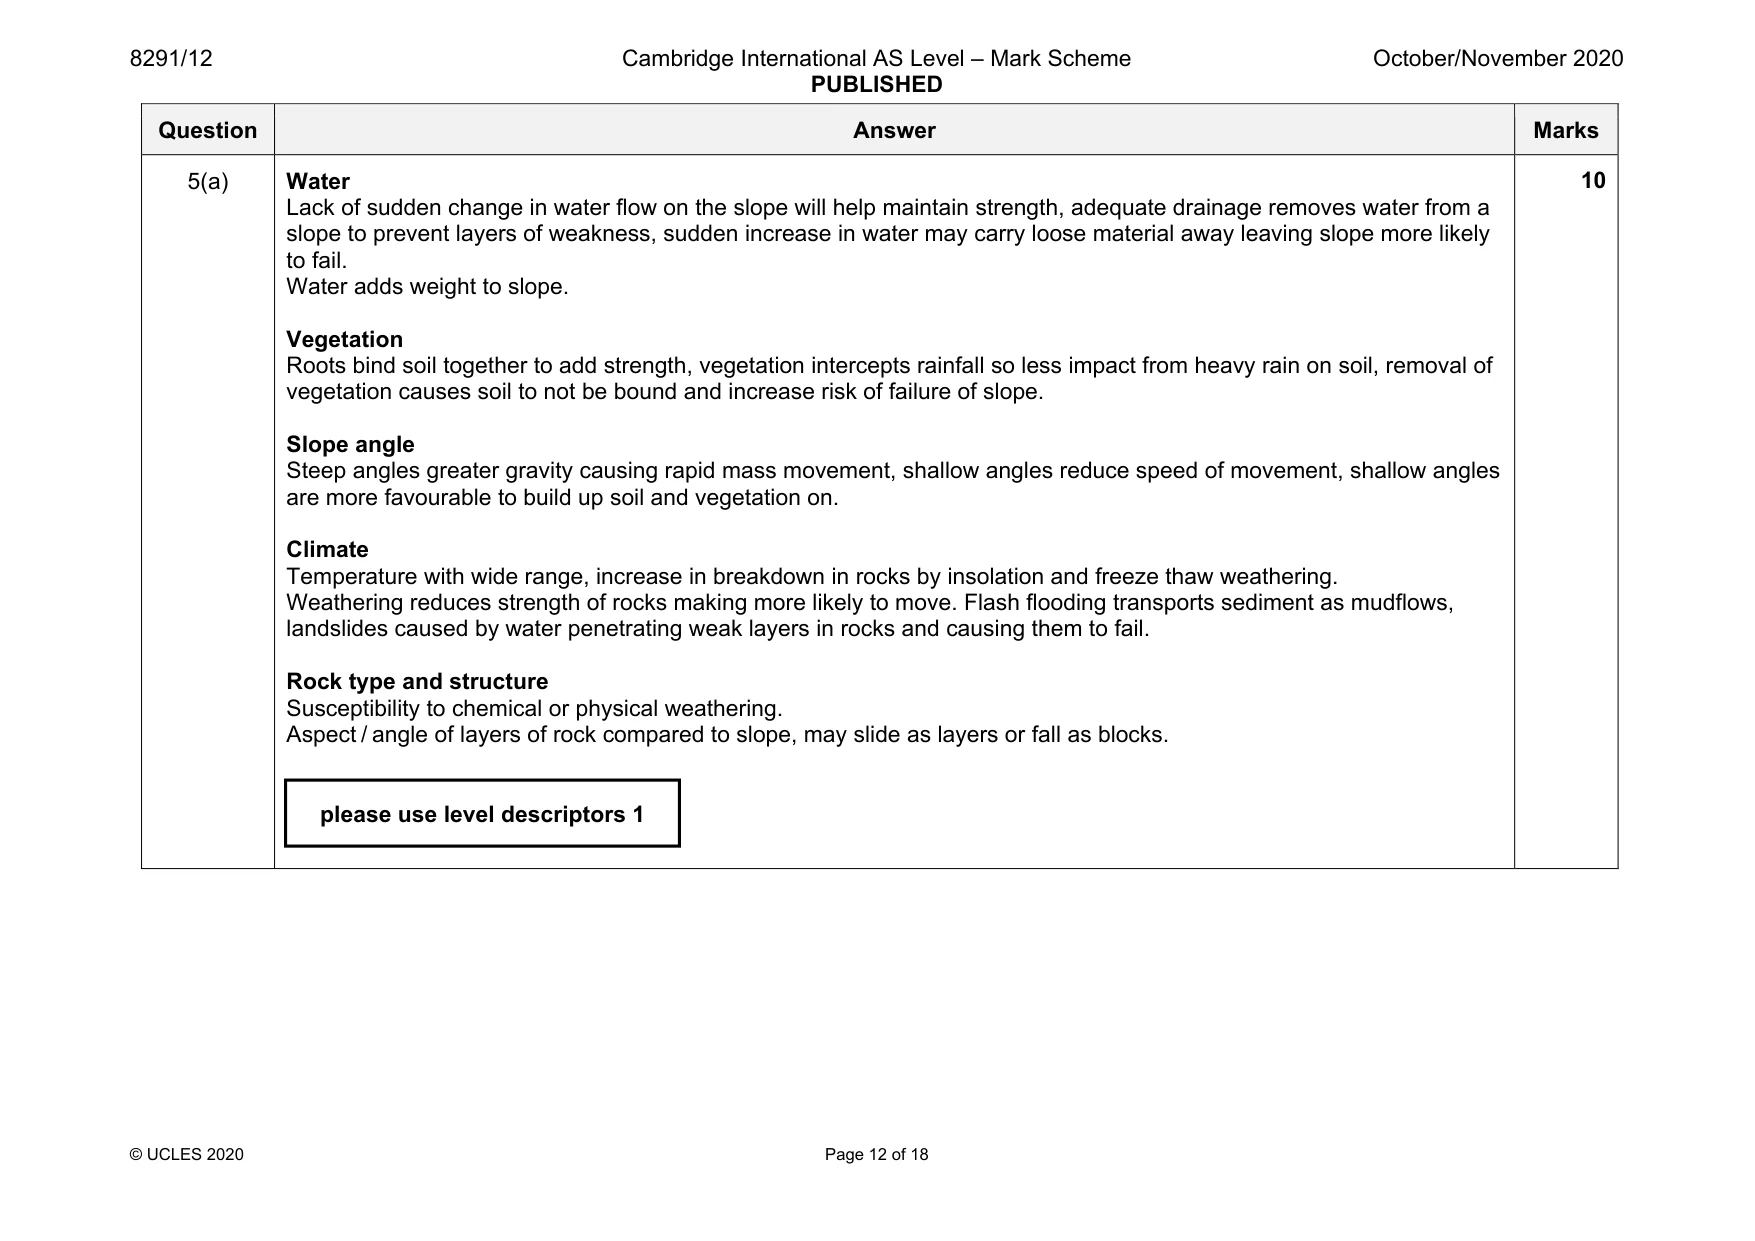
8291/12 Cambridge International AS Level – Mark Scheme PUBLISHED October/November 2020 © UCLES 2020 Page 12 of 18 Question Answer Marks 5(a) Water Lack of sudden change in water flow on the slope will help maintain strength, adequate drainage removes water from a slope to prevent layers of weakness, sudden increase in water may carry loose material away leaving slope more likely to fail. Water adds weight to slope. Vegetation Roots bind soil together to add strength, vegetation intercepts rainfall so less impact from heavy rain on soil, removal of vegetation causes soil to not be bound and increase risk of failure of slope. Slope angle Steep angles greater gravity causing rapid mass movement, shallow angles reduce speed of movement, shallow angles are more favourable to build up soil and vegetation on. Climate Temperature with wide range, increase in breakdown in rocks by insolation and freeze thaw weathering. Weathering reduces strength of rocks making more likely to move. Flash flooding transports sediment as mudflows, landslides caused by water penetrating weak layers in rocks and causing them to fail. Rock type and structure Susceptibility to chemical or physical weathering. Aspect / angle of layers of rock compared to slope, may slide as layers or fall as blocks. 10 please use level descriptors 1
Mark scheme, page 13
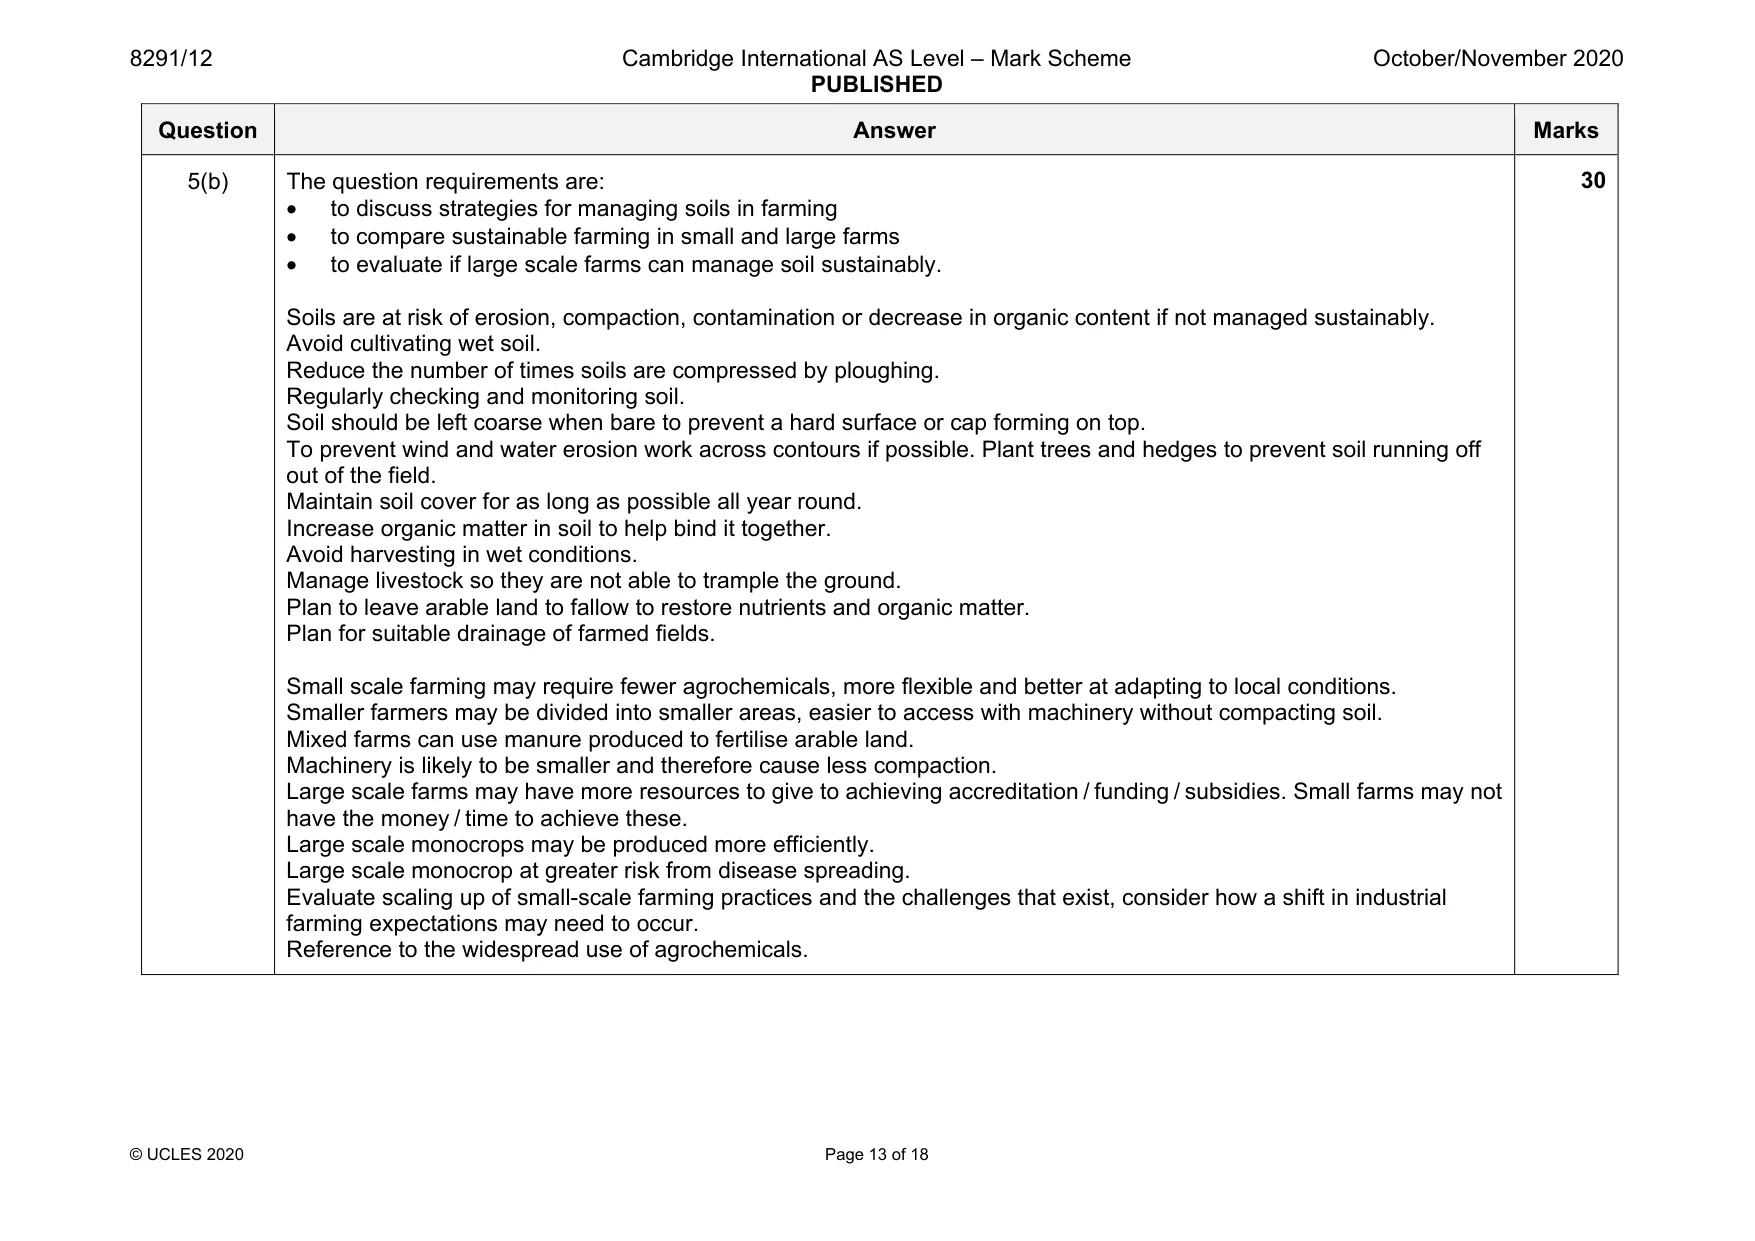
8291/12 Cambridge International AS Level – Mark Scheme PUBLISHED October/November 2020 © UCLES 2020 Page 13 of 18 Question Answer Marks 5(b) The question requirements are: • to discuss strategies for managing soils in farming • to compare sustainable farming in small and large farms • to evaluate if large scale farms can manage soil sustainably. Soils are at risk of erosion, compaction, contamination or decrease in organic content if not managed sustainably. Avoid cultivating wet soil. Reduce the number of times soils are compressed by ploughing. Regularly checking and monitoring soil. Soil should be left coarse when bare to prevent a hard surface or cap forming on top. To prevent wind and water erosion work across contours if possible. Plant trees and hedges to prevent soil running off out of the field. Maintain soil cover for as long as possible all year round. Increase organic matter in soil to help bind it together. Avoid harvesting in wet conditions. Manage livestock so they are not able to trample the ground. Plan to leave arable land to fallow to restore nutrients and organic matter. Plan for suitable drainage of farmed fields. Small scale farming may require fewer agrochemicals, more flexible and better at adapting to local conditions. Smaller farmers may be divided into smaller areas, easier to access with machinery without compacting soil. Mixed farms can use manure produced to fertilise arable land. Machinery is likely to be smaller and therefore cause less compaction. Large scale farms may have more resources to give to achieving accreditation / funding / subsidies. Small farms may not have the money / time to achieve these. Large scale monocrops may be produced more efficiently. Large scale monocrop at greater risk from disease spreading. Evaluate scaling up of small-scale farming practices and the challenges that exist, consider how a shift in industrial farming expectations may need to occur. Reference to the widespread use of agrochemicals. 30
Mark scheme, page 14
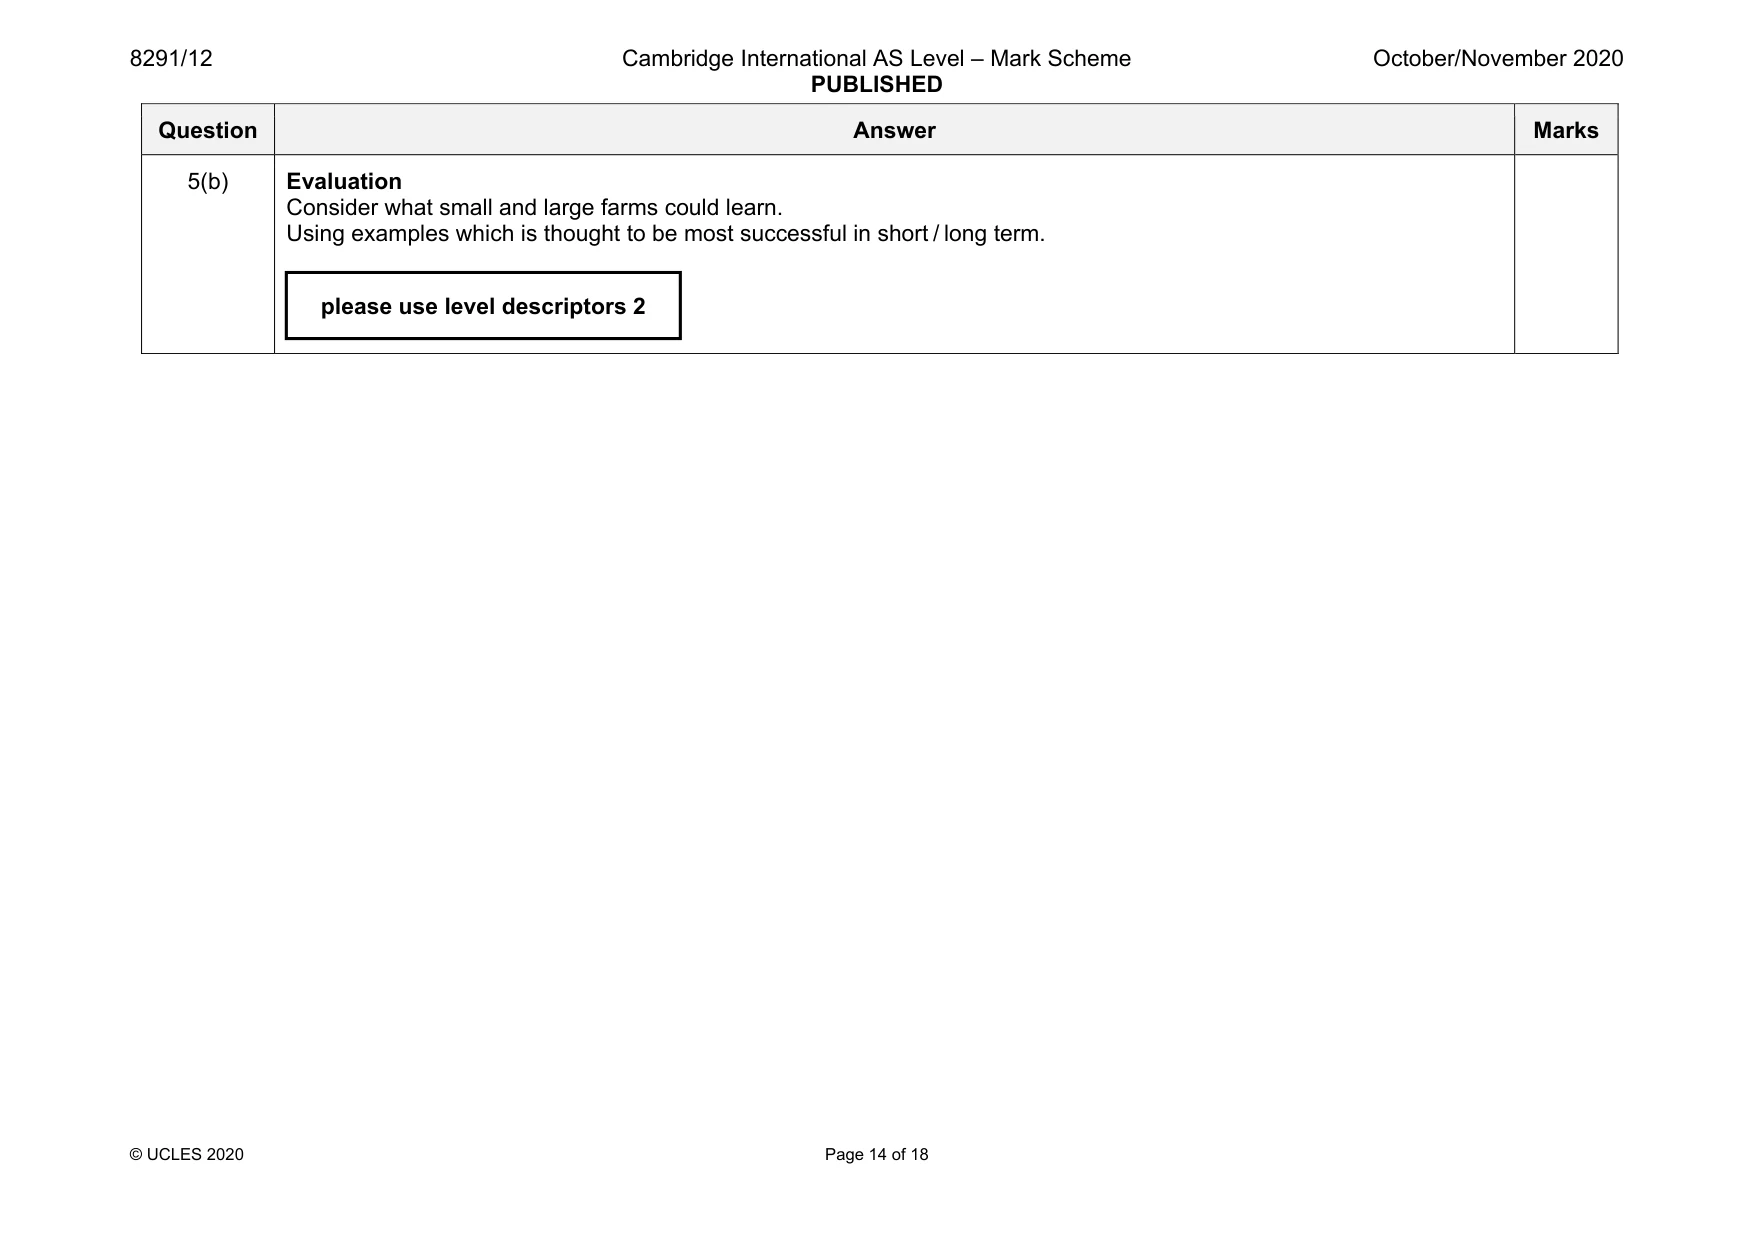
8291/12 Cambridge International AS Level – Mark Scheme PUBLISHED October/November 2020 © UCLES 2020 Page 14 of 18 Question Answer Marks 5(b) Evaluation Consider what small and large farms could learn. Using examples which is thought to be most successful in short / long term. please use level descriptors 2
Mark scheme, page 15
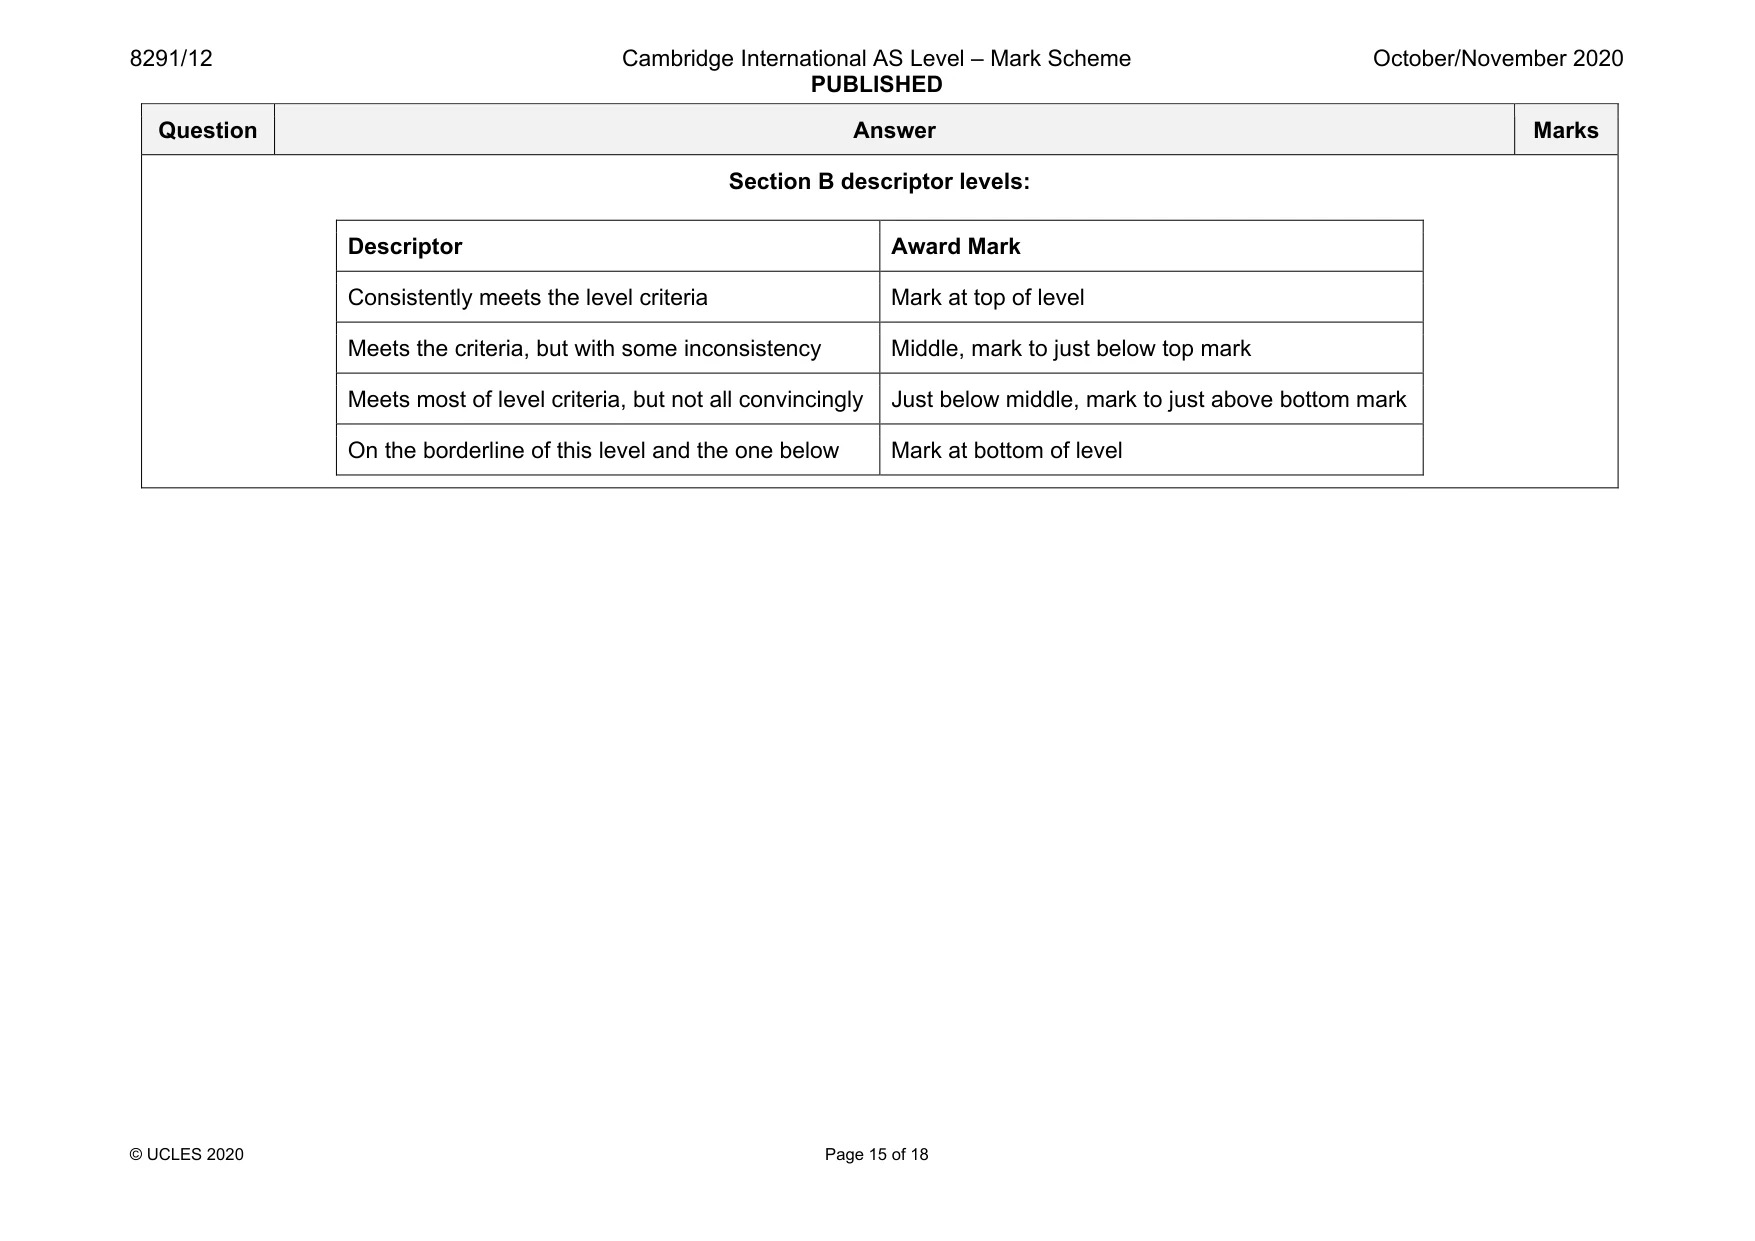
8291/12 Cambridge International AS Level – Mark Scheme PUBLISHED October/November 2020 © UCLES 2020 Page 15 of 18 Question Answer Marks Section B descriptor levels: Descriptor Award Mark Consistently meets the level criteria Mark at top of level Meets the criteria, but with some inconsistency Middle, mark to just below top mark Meets most of level criteria, but not all convincingly Just below middle, mark to just above bottom mark On the borderline of this level and the one below Mark at bottom of level
Mark scheme, page 16
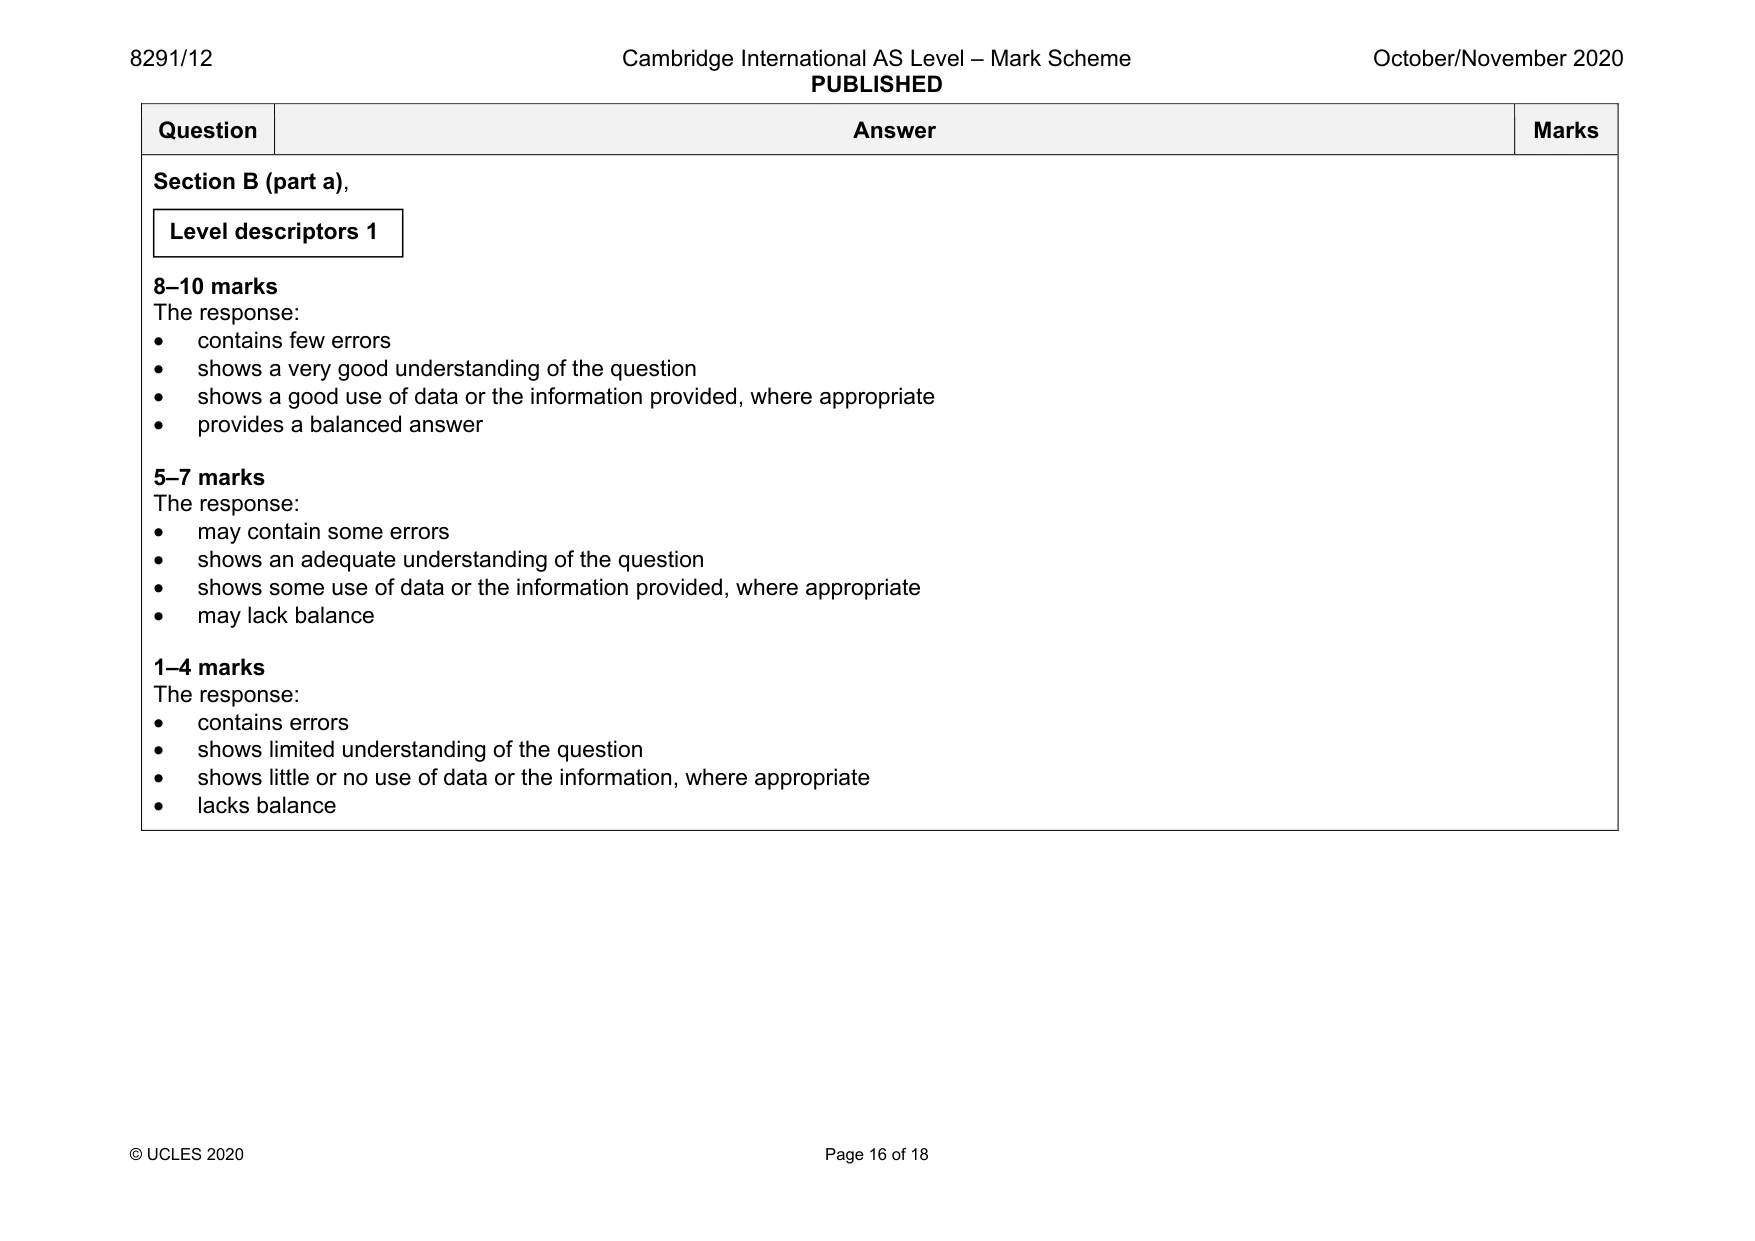
8291/12 Cambridge International AS Level – Mark Scheme PUBLISHED October/November 2020 © UCLES 2020 Page 16 of 18 Question Answer Marks Section B (part a), 8–10 marks The response: • contains few errors • shows a very good understanding of the question • shows a good use of data or the information provided, where appropriate • provides a balanced answer 5–7 marks The response: • may contain some errors • shows an adequate understanding of the question • shows some use of data or the information provided, where appropriate • may lack balance 1–4 marks The response: • contains errors • shows limited understanding of the question • shows little or no use of data or the information, where appropriate • lacks balance Level descriptors 1
Mark scheme, page 17
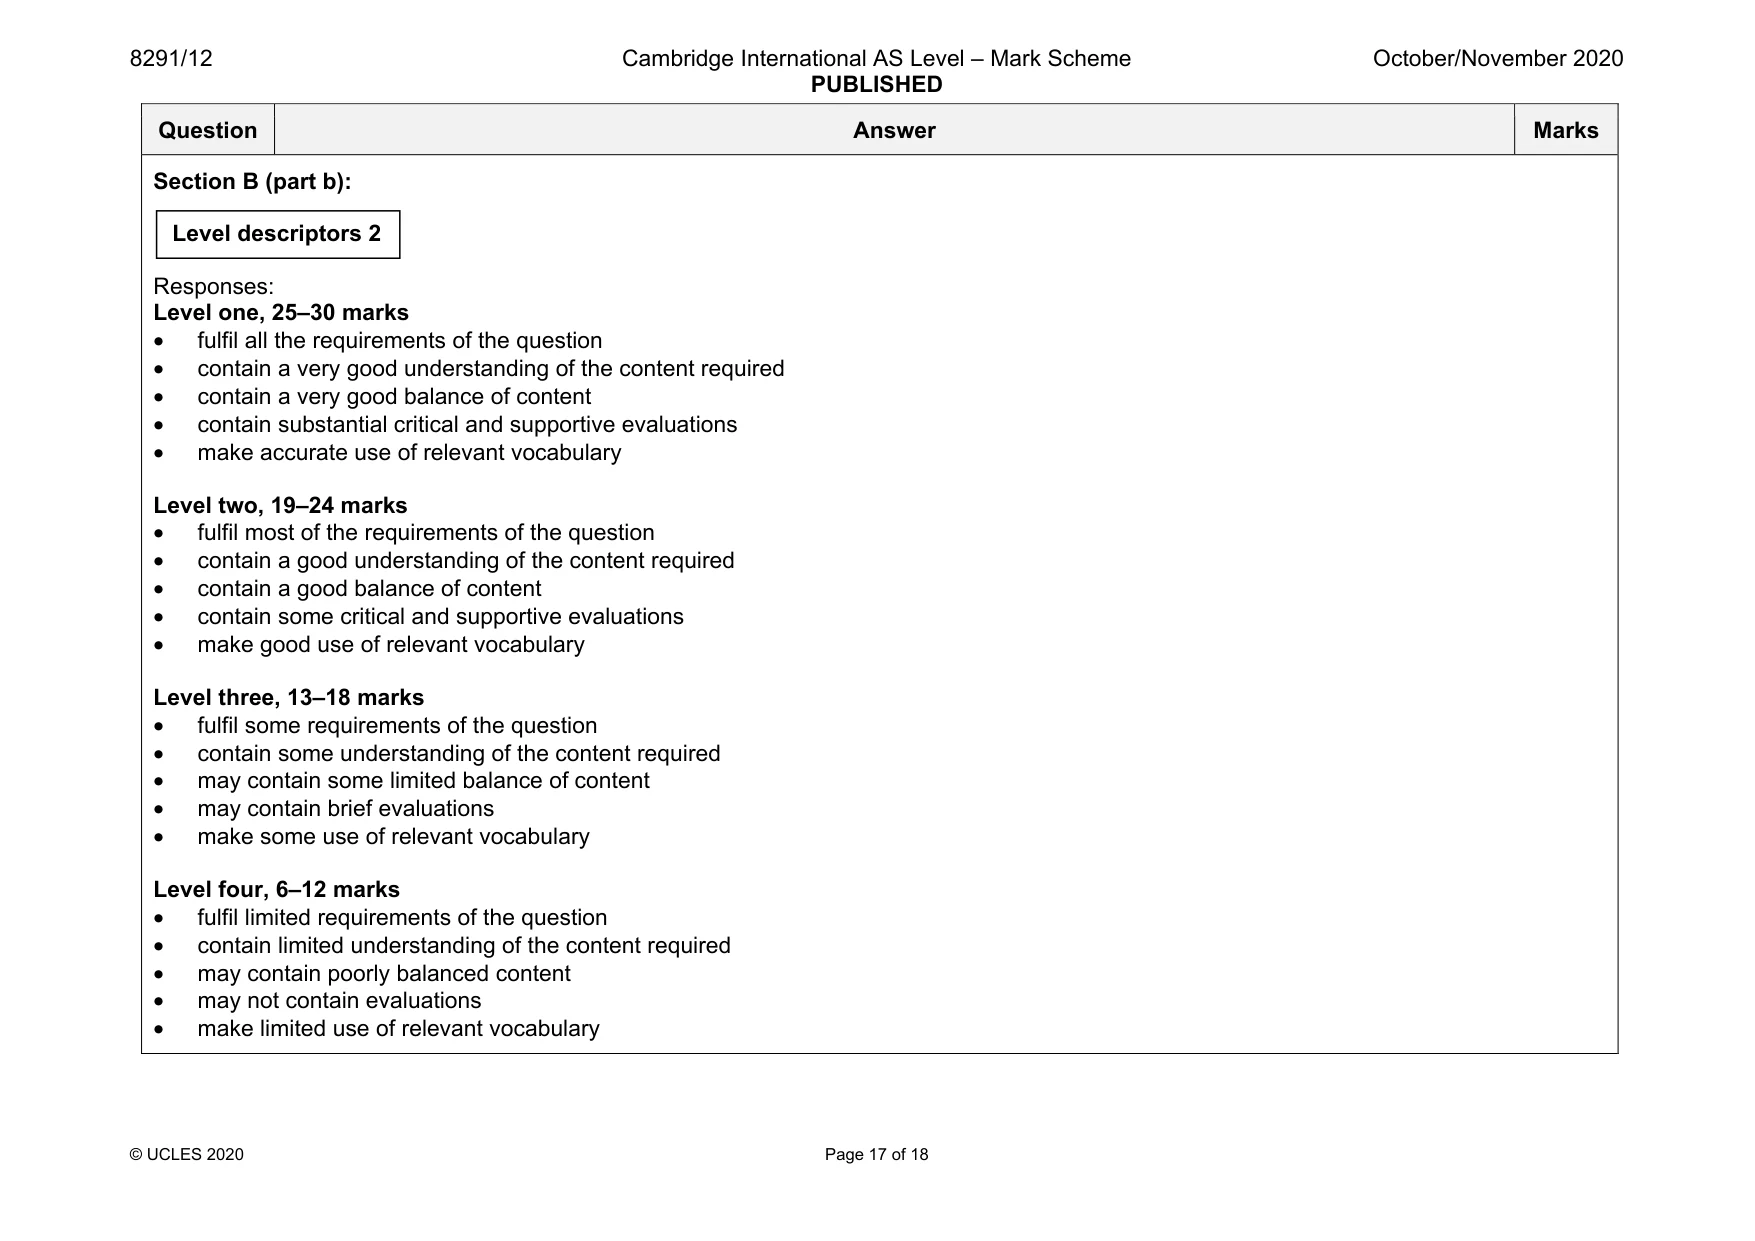
8291/12 Cambridge International AS Level – Mark Scheme PUBLISHED October/November 2020 © UCLES 2020 Page 17 of 18 Question Answer Marks Section B (part b): Responses: Level one, 25–30 marks • fulfil all the requirements of the question • contain a very good understanding of the content required • contain a very good balance of content • contain substantial critical and supportive evaluations • make accurate use of relevant vocabulary Level two, 19–24 marks • fulfil most of the requirements of the question • contain a good understanding of the content required • contain a good balance of content • contain some critical and supportive evaluations • make good use of relevant vocabulary Level three, 13–18 marks • fulfil some requirements of the question • contain some understanding of the content required • may contain some limited balance of content • may contain brief evaluations • make some use of relevant vocabulary Level four, 6–12 marks • fulfil limited requirements of the question • contain limited understanding of the content required • may contain poorly balanced content • may not contain evaluations • make limited use of relevant vocabulary Level descriptors 2
Mark scheme, page 18
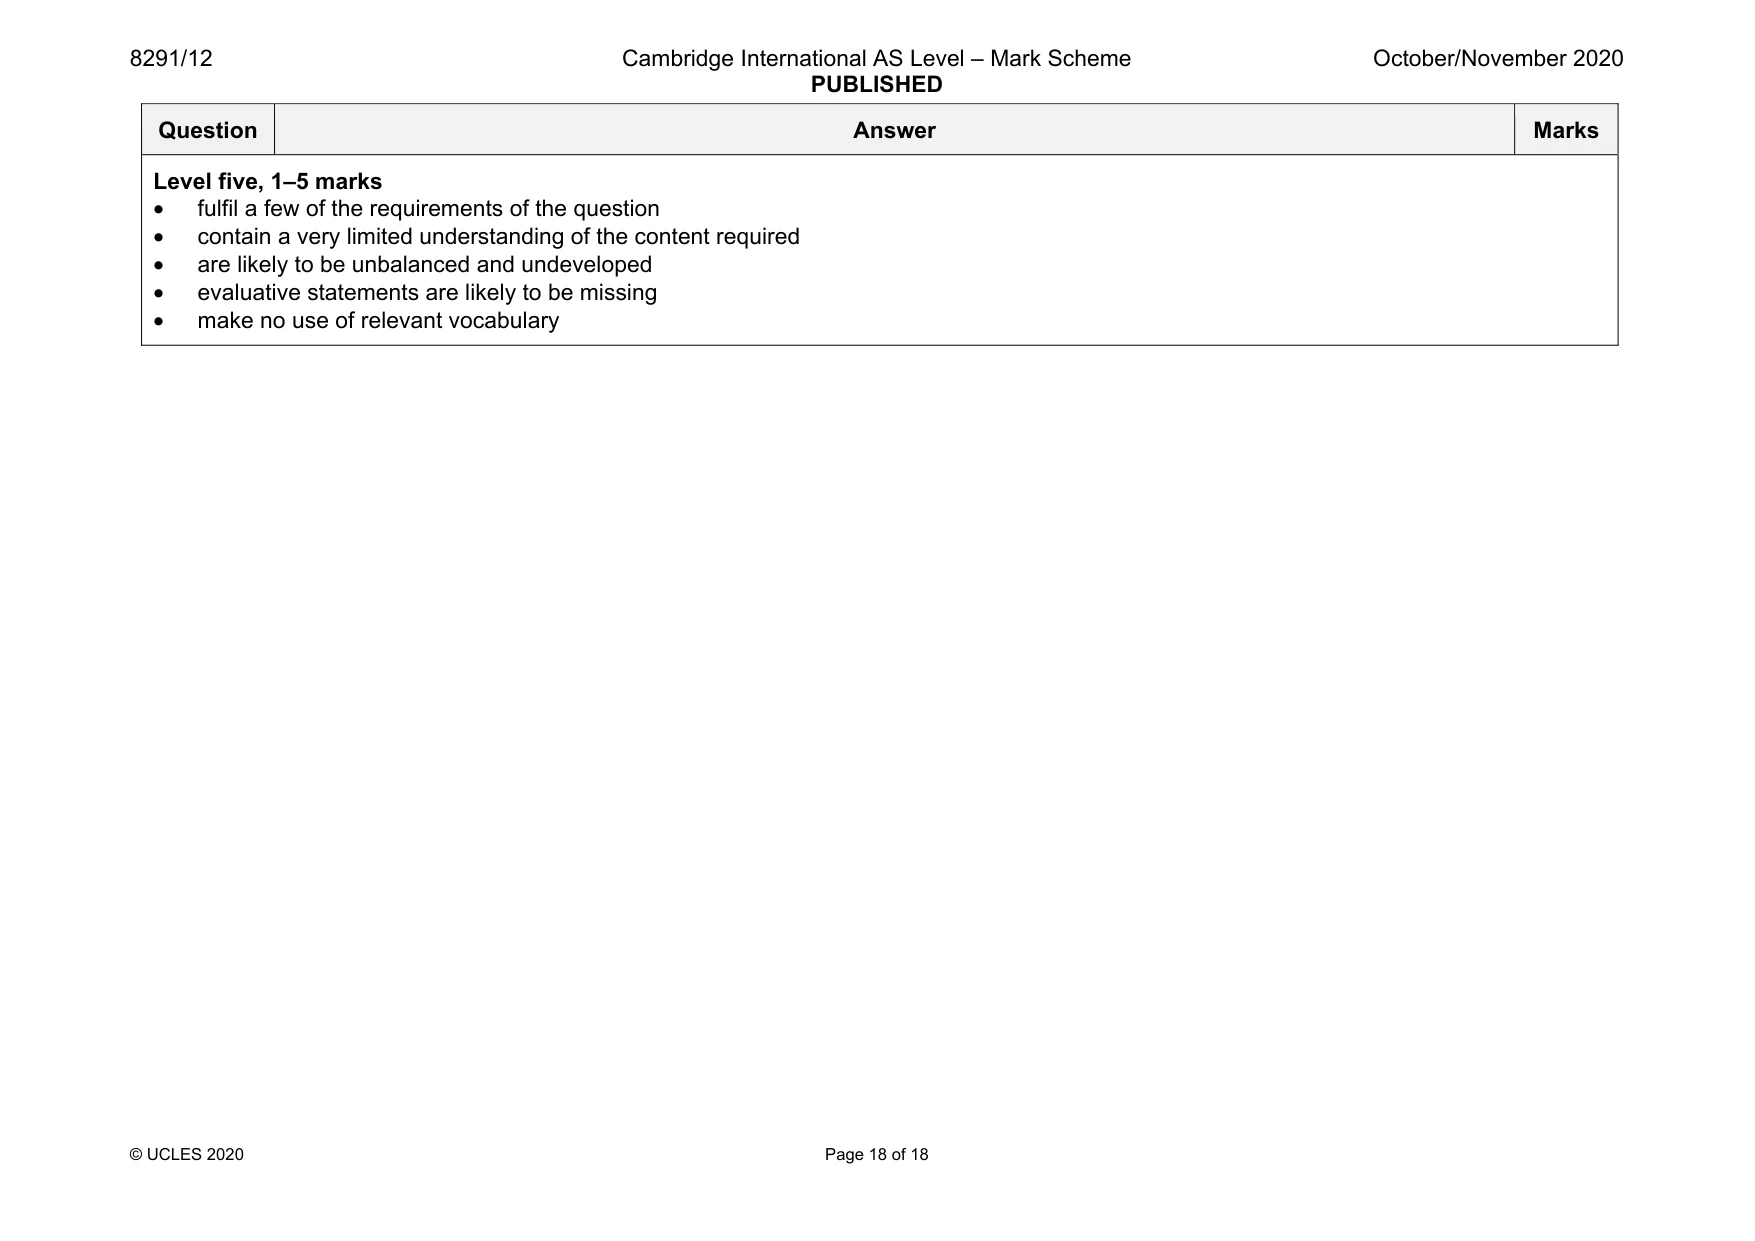
8291/12 Cambridge International AS Level – Mark Scheme PUBLISHED October/November 2020 © UCLES 2020 Page 18 of 18 Question Answer Marks Level five, 1–5 marks • fulfil a few of the requirements of the question • contain a very limited understanding of the content required • are likely to be unbalanced and undeveloped • evaluative statements are likely to be missing • make no use of relevant vocabulary
What you needed in this session
Cambridge’s own grade thresholds for 2020 Oct/Nov, Paper 1 · Variant 2. A higher threshold means an easier paper — the bar moves with how the cohort did.