Cambridge A Level Environmental Management (AS only) 8291 — 2020 May/June Paper 1 · Variant 1
8291/11/M/J/20
The question paper and its mark scheme, free to read here and free to download. This is Cambridge’s own paper, exactly as it was sat.
Question paper12 pages

Mark scheme17 pages
Answers below. Sit the paper first if you are practising.
Paper as text
Question paper, page 1
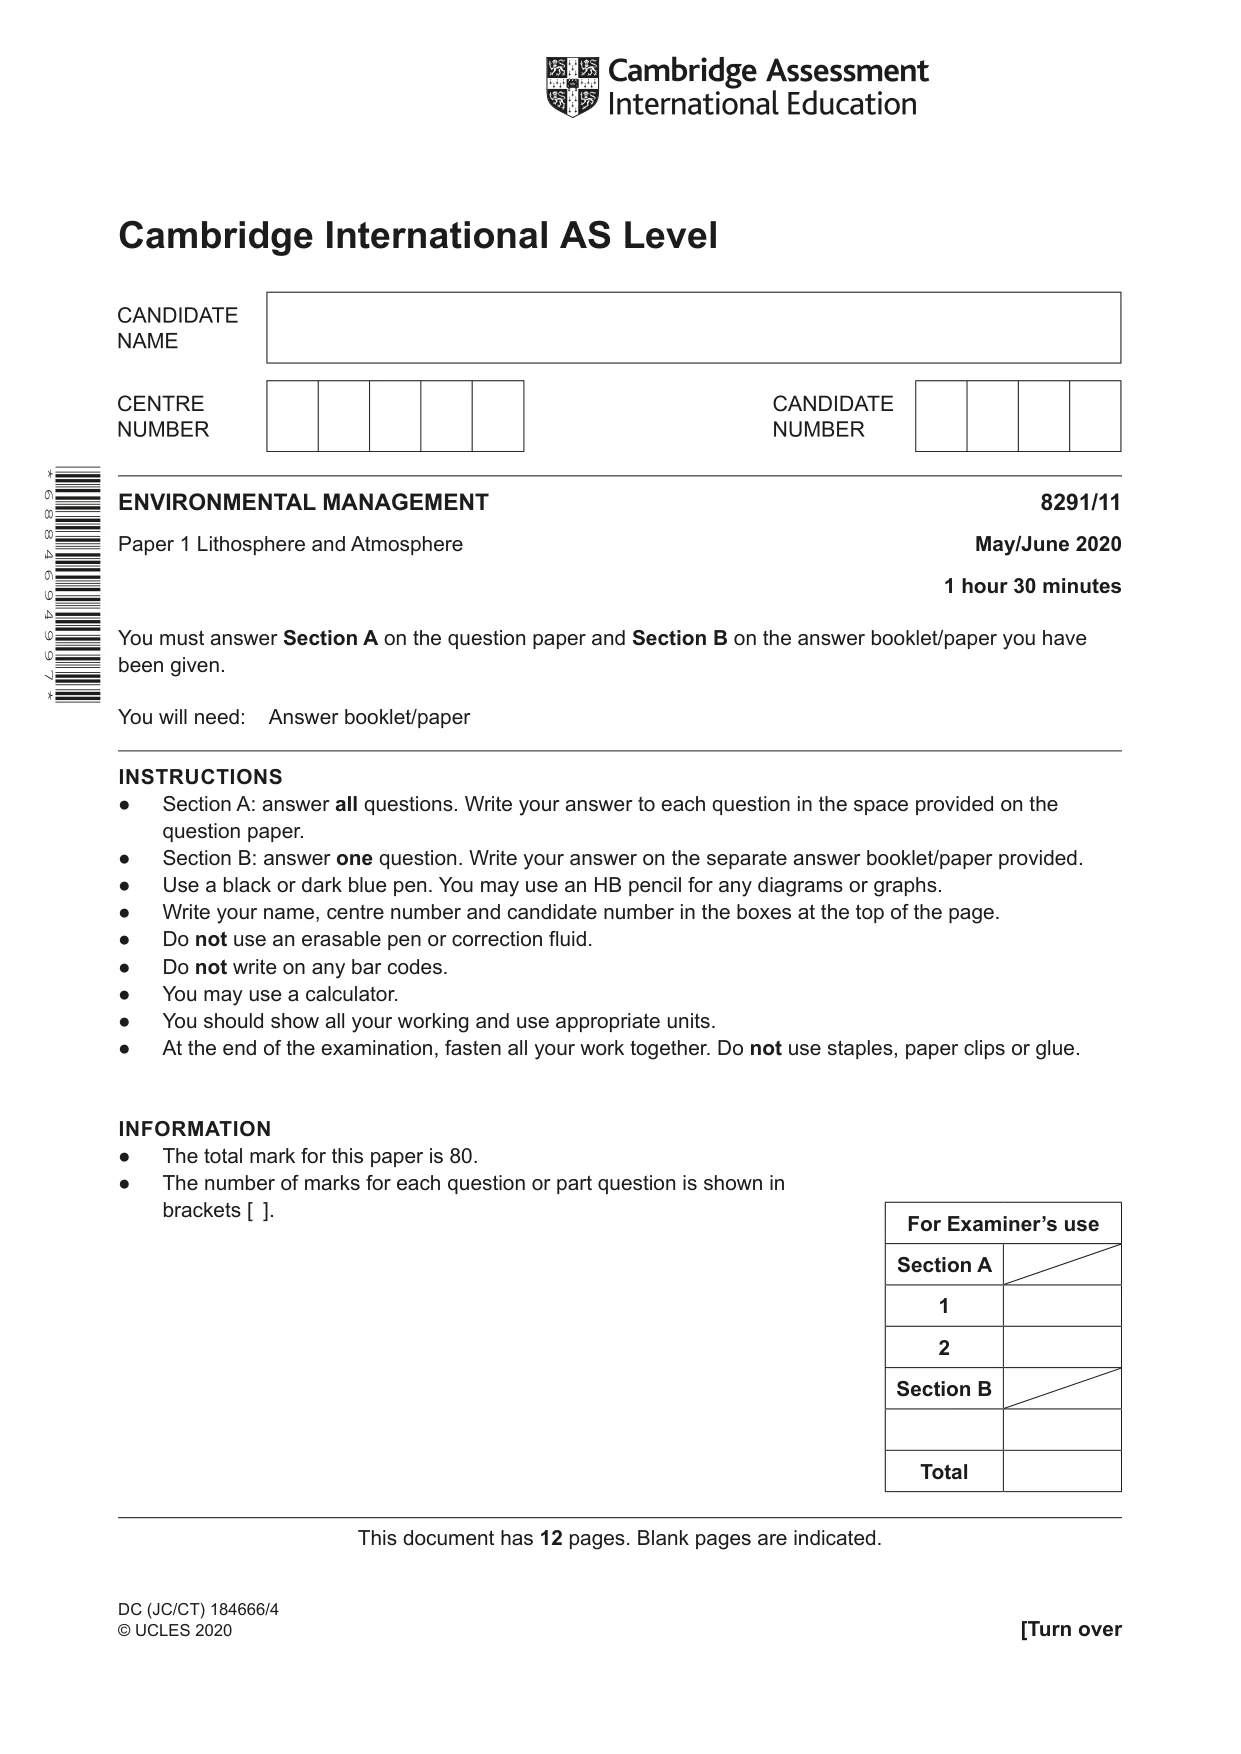
Cambridge International AS Level DC (JC/CT) 184666/4 © UCLES 2020 [Turn over This document has 12 pages. Blank pages are indicated. * 6 8 8 4 6 9 4 9 9 7 * ENVIRONMENTAL MANAGEMENT 8291/11 Paper 1 Lithosphere and Atmosphere May/June 2020 1 hour 30 minutes You must answer Section A on the question paper and Section B on the answer booklet/paper you have been given. You will need: Answer booklet/paper INSTRUCTIONS ● Section A: answer all questions. Write your answer to each question in the space provided on the question paper. ● Section B: answer one question. Write your answer on the separate answer booklet/paper provided. ● Use a black or dark blue pen. You may use an HB pencil for any diagrams or graphs. ● Write your name, centre number and candidate number in the boxes at the top of the page. ● Do not use an erasable pen or correction fluid. ● Do not write on any bar codes. ● You may use a calculator. ● You should show all your working and use appropriate units. ● At the end of the examination, fasten all your work together. Do not use staples, paper clips or glue. INFORMATION ● The total mark for this paper is 80. ● The number of marks for each question or part question is shown in brackets [ ]. For Examiner’s use Section A 1 2 Section B Total
Question paper, page 2
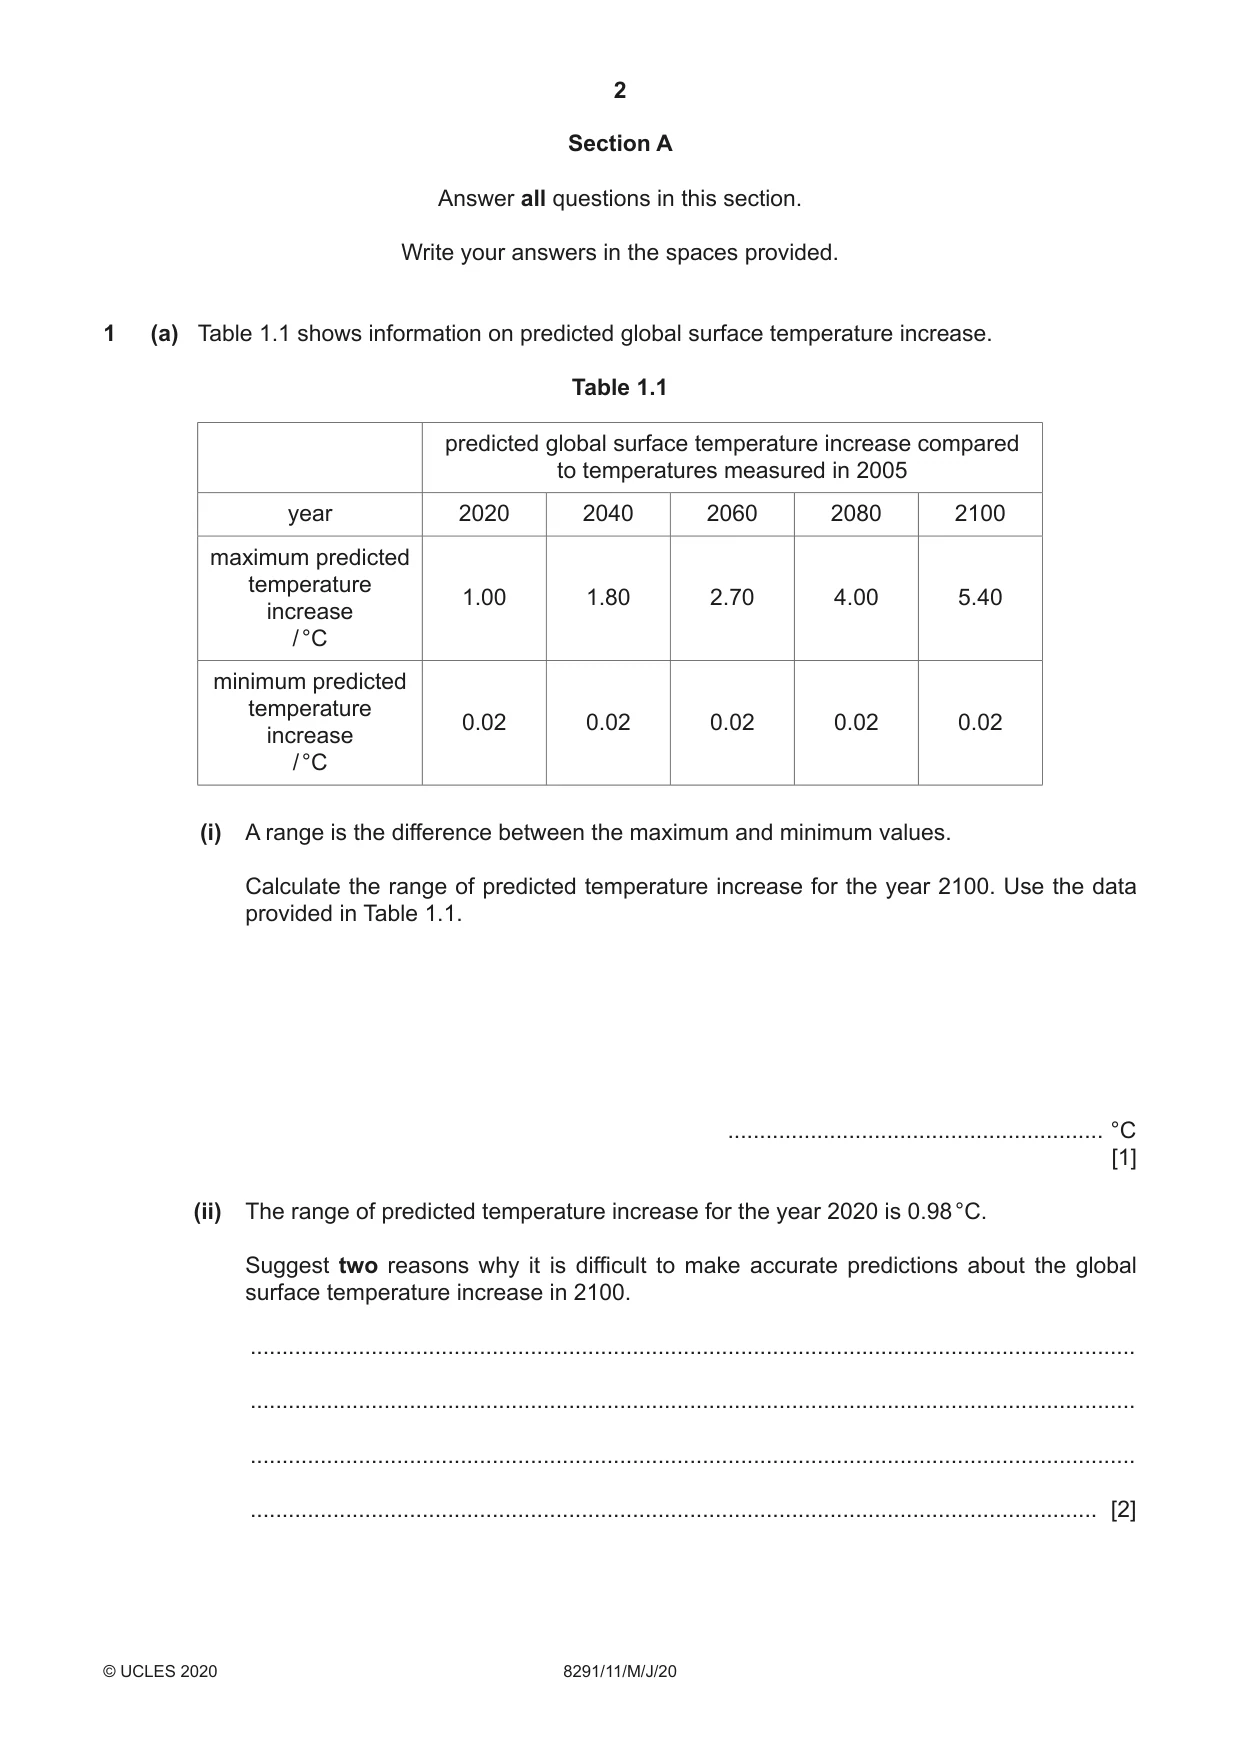
2 8291/11/M/J/20 © UCLES 2020 Section A Answer all questions in this section. Write your answers in the spaces provided. 1 (a) Table 1.1 shows information on predicted global surface temperature increase. Table 1.1 predicted global surface temperature increase compared to temperatures measured in 2005 year 2020 2040 2060 2080 2100 maximum predicted temperature increase / °C 1.00 1.80 2.70 4.00 5.40 minimum predicted temperature increase / °C 0.02 0.02 0.02 0.02 0.02 (i) A range is the difference between the maximum and minimum values. Calculate the range of predicted temperature increase for the year 2100. Use the data provided in Table 1.1. … °C [1] (ii) The range of predicted temperature increase for the year 2020 is 0.98 °C. Suggest two reasons why it is difficult to make accurate predictions about the global surface temperature increase in 2100. … … … … [2]
Question paper, page 3
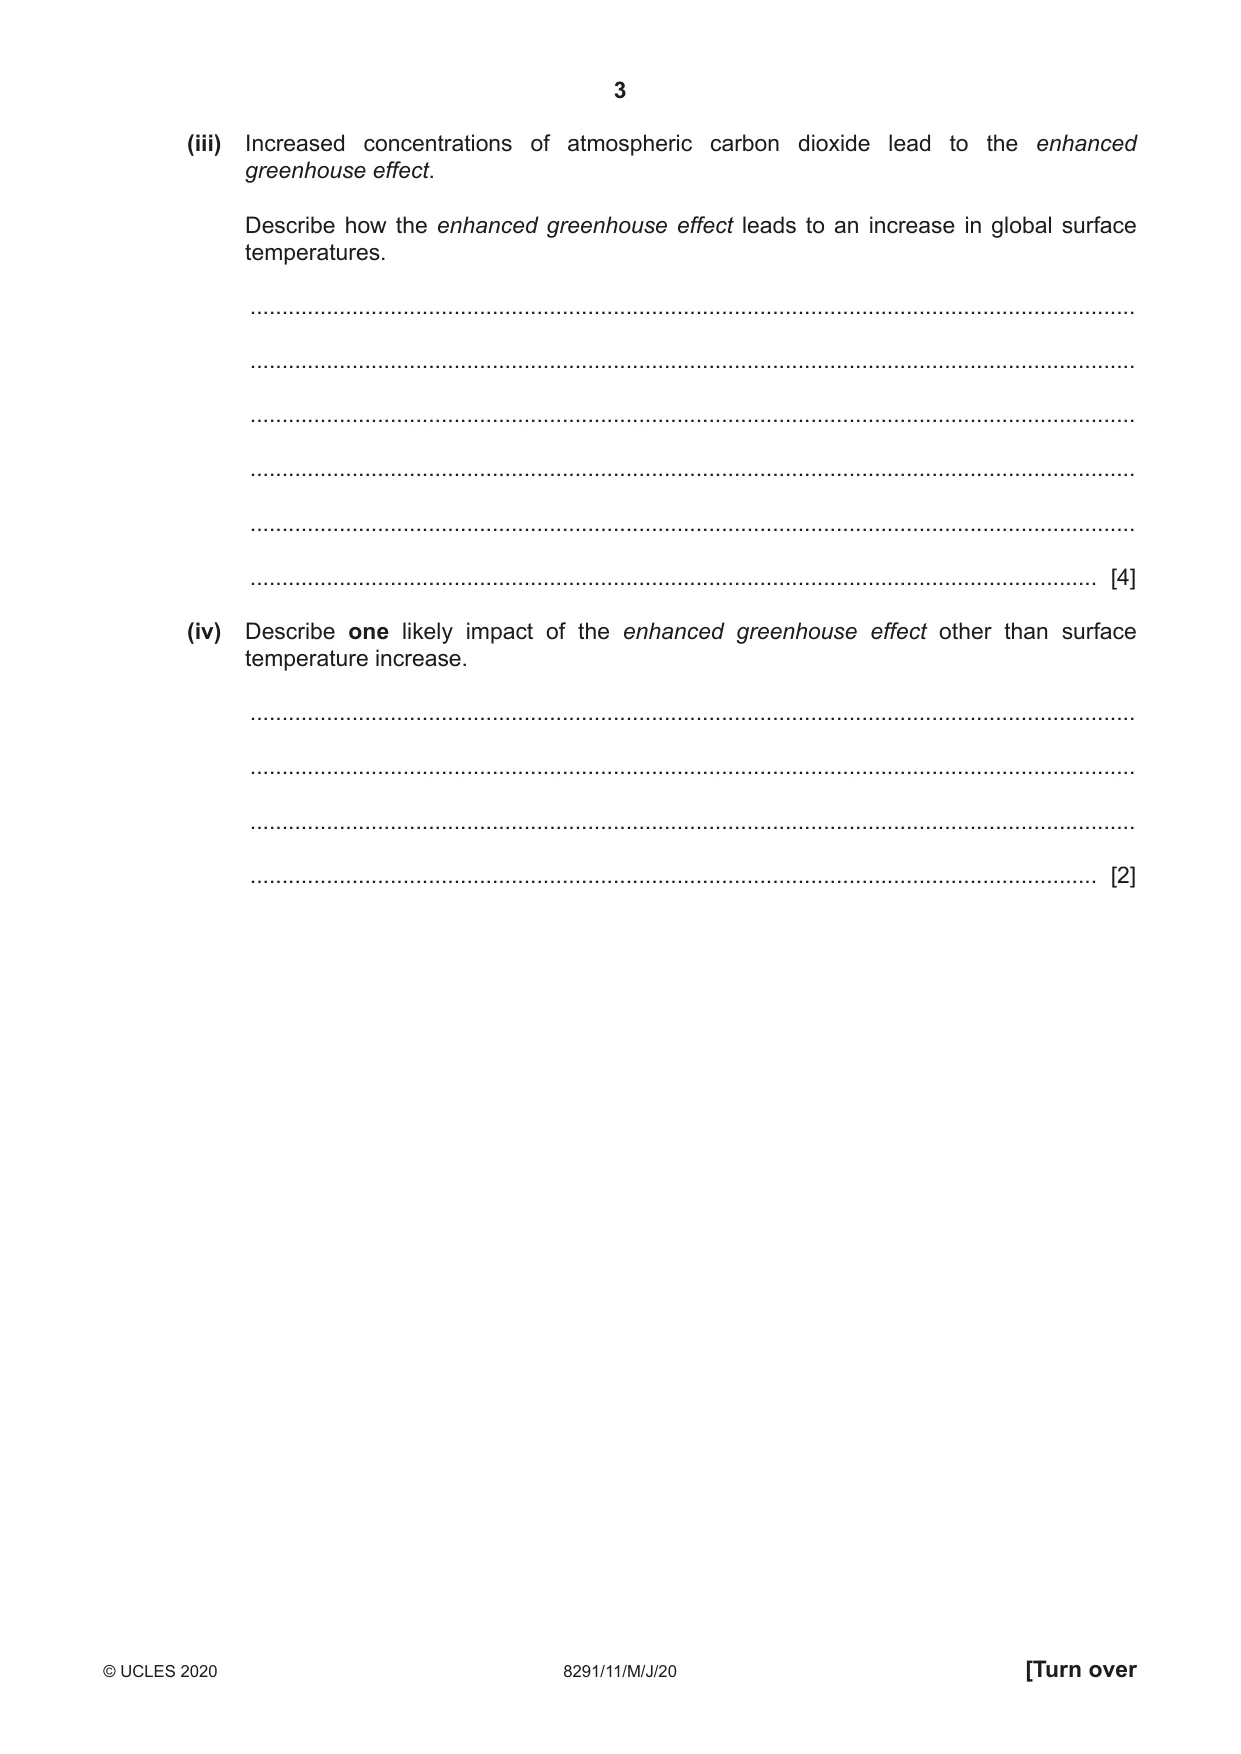
3 8291/11/M/J/20 © UCLES 2020 [Turn over (iii) Increased concentrations of atmospheric carbon dioxide lead to the enhanced greenhouse effect. Describe how the enhanced greenhouse effect leads to an increase in global surface temperatures. … … … … … … [4] (iv) Describe one likely impact of the enhanced greenhouse effect other than surface temperature increase. … … … … [2]
Question paper, page 4
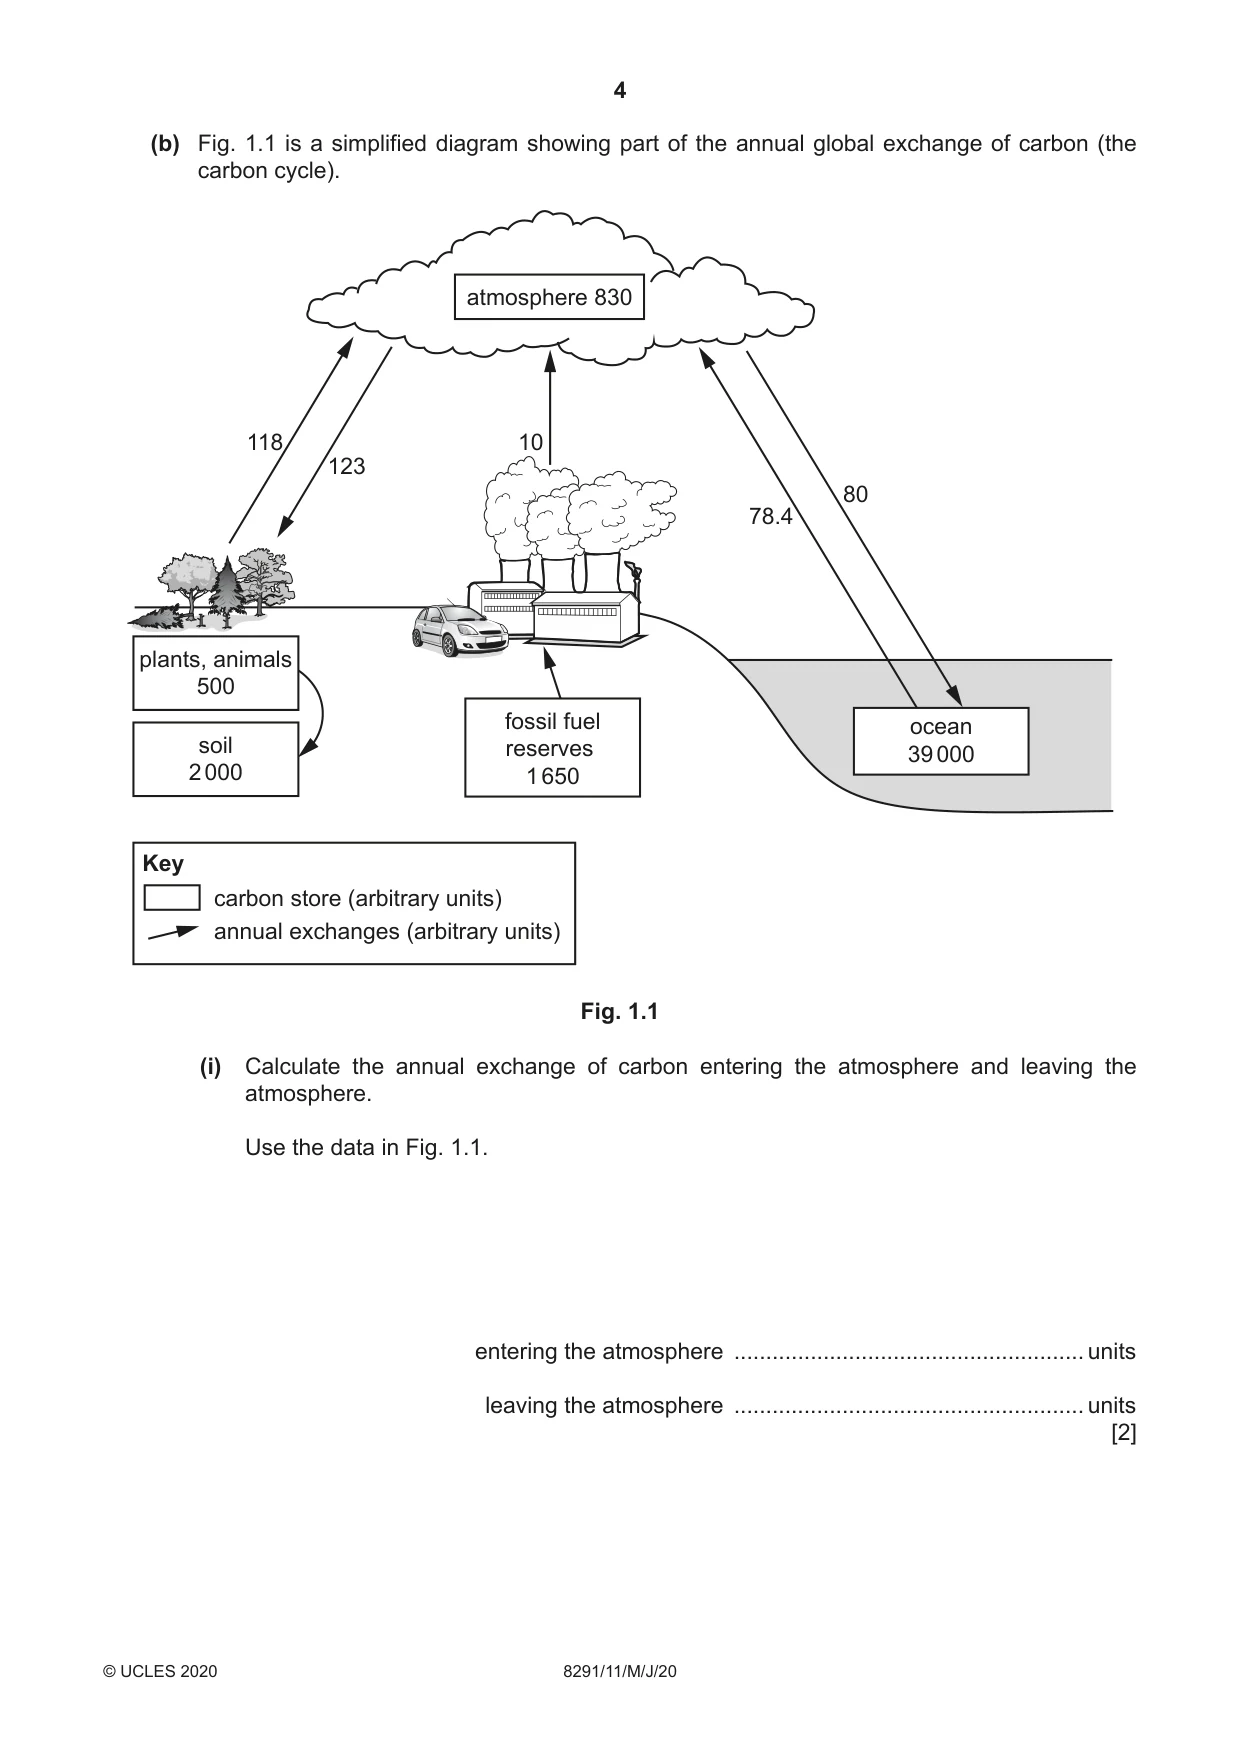
4 8291/11/M/J/20 © UCLES 2020 (b) Fig. 1.1 is a simplified diagram showing part of the annual global exchange of carbon (the carbon cycle). 118 123 10 78.4 80 atmosphere 830 fossil fuel reserves 1 650 ocean 39 000 plants, animals 500 soil 2 000 Key carbon store (arbitrary units) annual exchanges (arbitrary units) Fig. 1.1 (i) Calculate the annual exchange of carbon entering the atmosphere and leaving the atmosphere. Use the data in Fig. 1.1. entering the atmosphere … units leaving the atmosphere … units [2]
Question paper, page 5
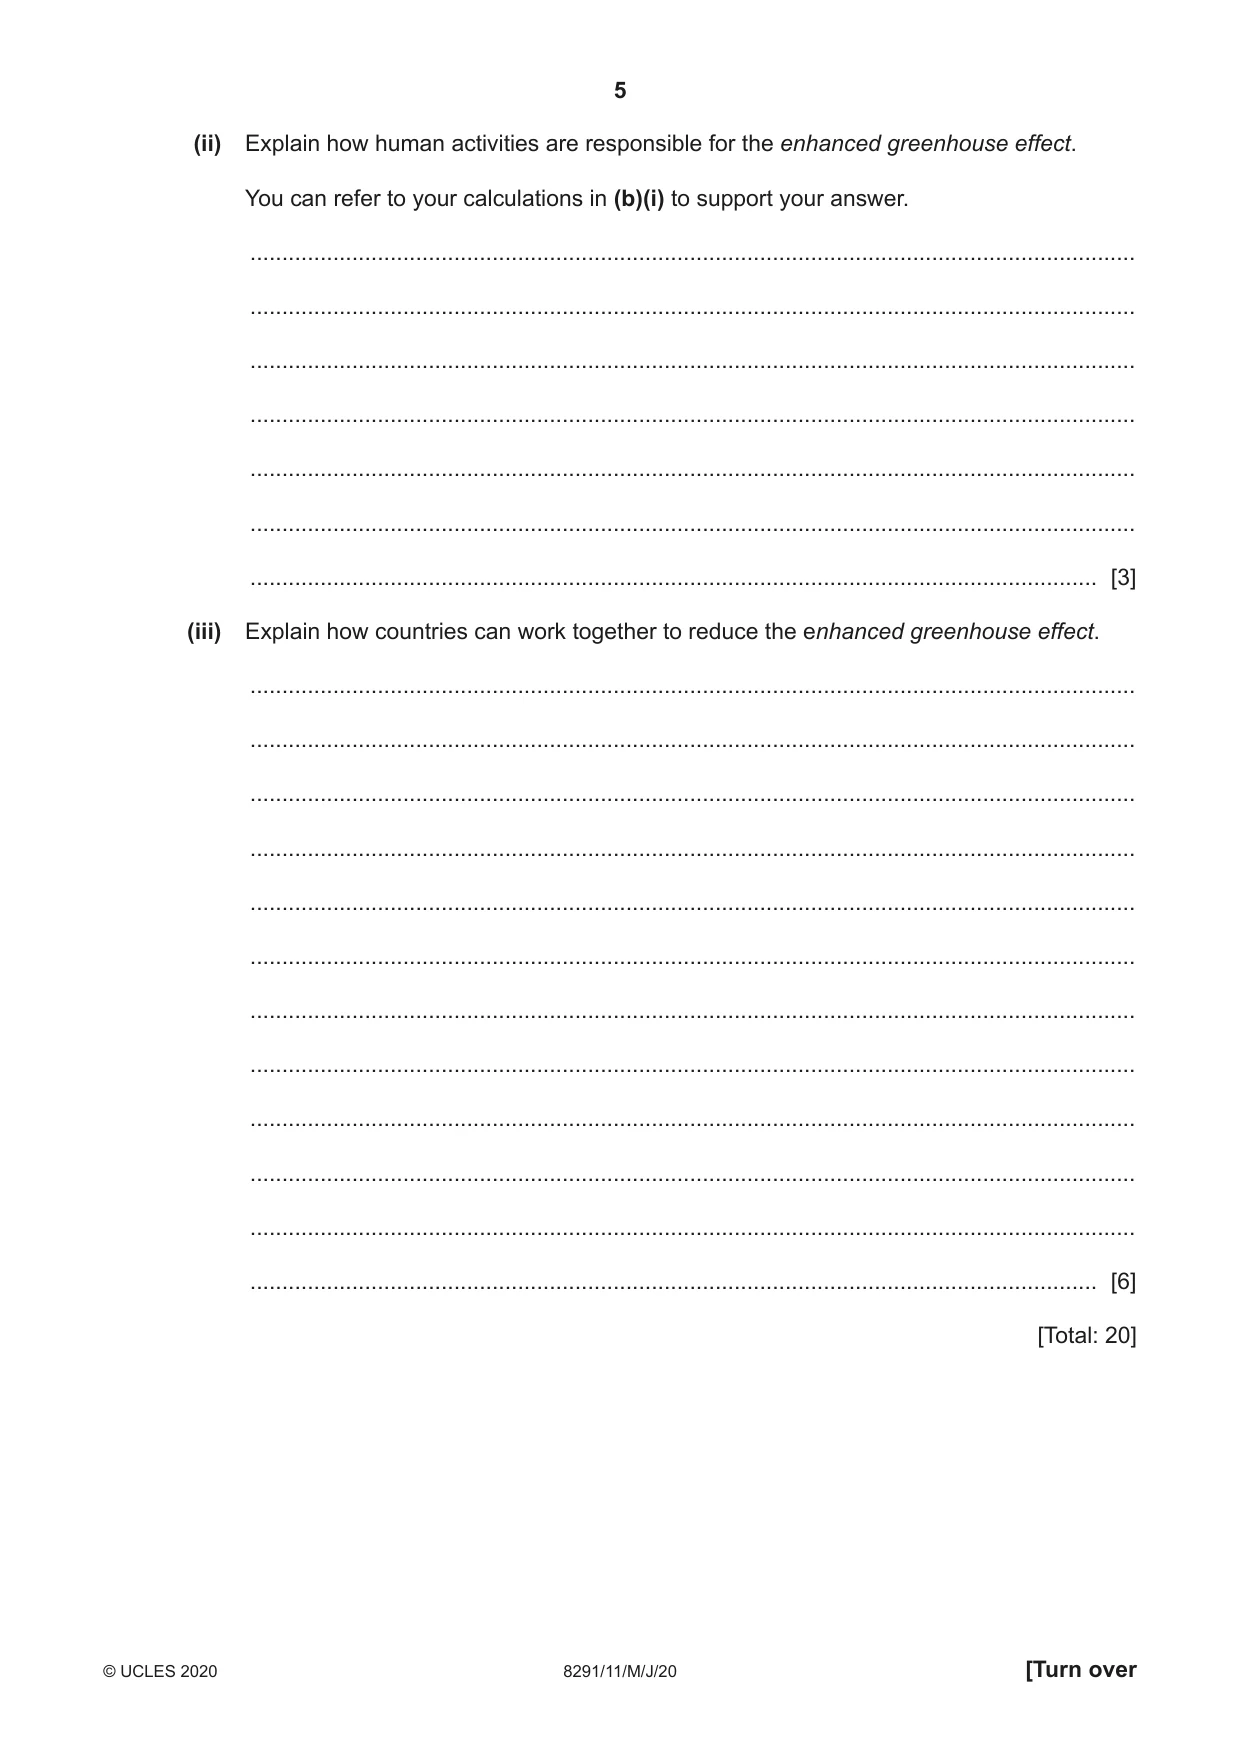
5 8291/11/M/J/20 © UCLES 2020 [Turn over (ii) Explain how human activities are responsible for the enhanced greenhouse effect. You can refer to your calculations in (b)(i) to support your answer. … … … … … … … [3] (iii) Explain how countries can work together to reduce the enhanced greenhouse effect. … … … … … … … … … … … … [6] [Total: 20]
Question paper, page 6
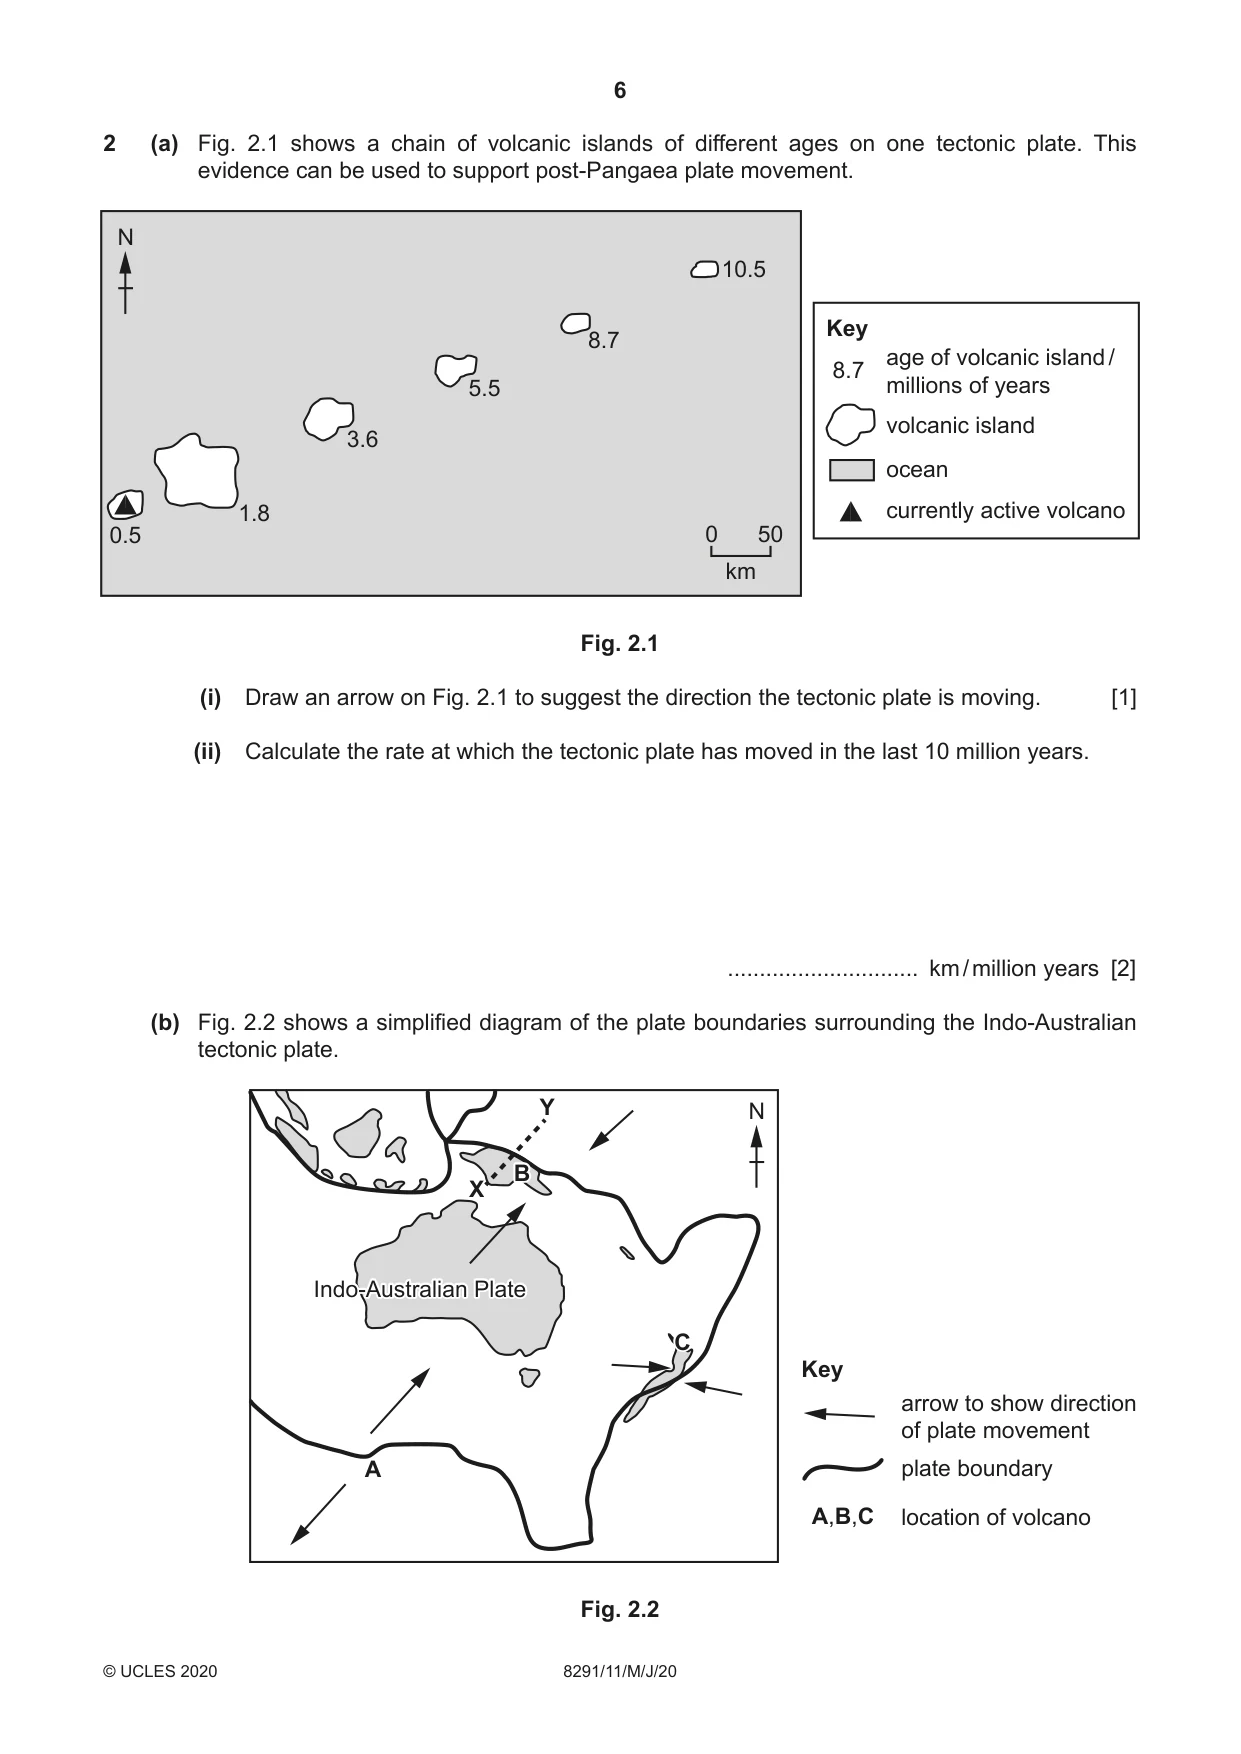
6 8291/11/M/J/20 © UCLES 2020 2 (a) Fig. 2.1 shows a chain of volcanic islands of different ages on one tectonic plate. This evidence can be used to support post-Pangaea plate movement. 0 50 km 0.5 1.8 3.6 5.5 8.7 10.5 Key 8.7 age of volcanic island / millions of years volcanic island ocean currently active volcano N Fig. 2.1 (i) Draw an arrow on Fig. 2.1 to suggest the direction the tectonic plate is moving. [1] (ii) Calculate the rate at which the tectonic plate has moved in the last 10 million years. … km / million years [2] (b) Fig. 2.2 shows a simplified diagram of the plate boundaries surrounding the Indo-Australian tectonic plate. A B C B Y X C Indo-Australian Plate Indo-Australian Plate Key A,B,C arrow to show direction of plate movement plate boundary location of volcano N Fig. 2.2
Question paper, page 7
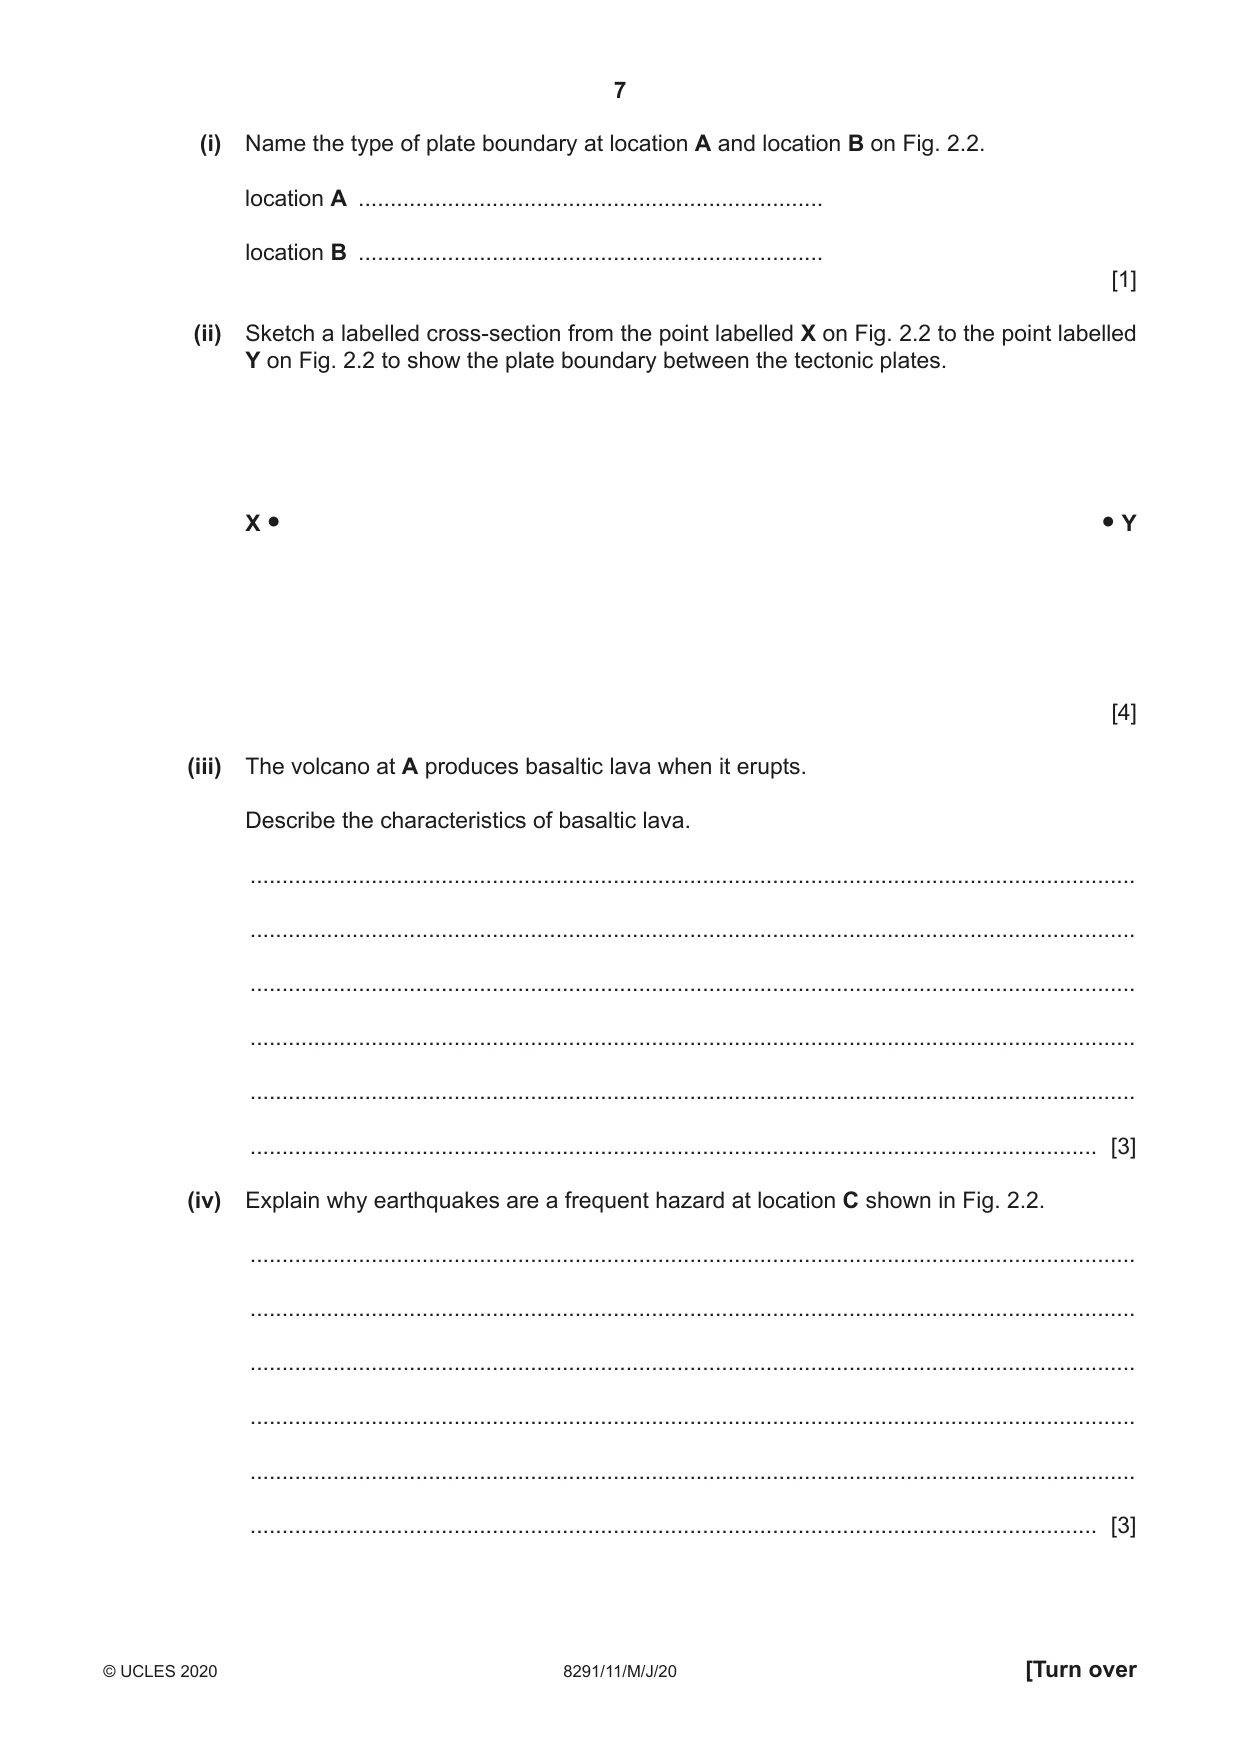
7 8291/11/M/J/20 © UCLES 2020 [Turn over (i) Name the type of plate boundary at location A and location B on Fig. 2.2. location A … location B … [1] (ii) Sketch a labelled cross-section from the point labelled X on Fig. 2.2 to the point labelled Y on Fig. 2.2 to show the plate boundary between the tectonic plates. X ● ● Y [4] (iii) The volcano at A produces basaltic lava when it erupts. Describe the characteristics of basaltic lava. … … … … … … [3] (iv) Explain why earthquakes are a frequent hazard at location C shown in Fig. 2.2. … … … … … … [3]
Question paper, page 8
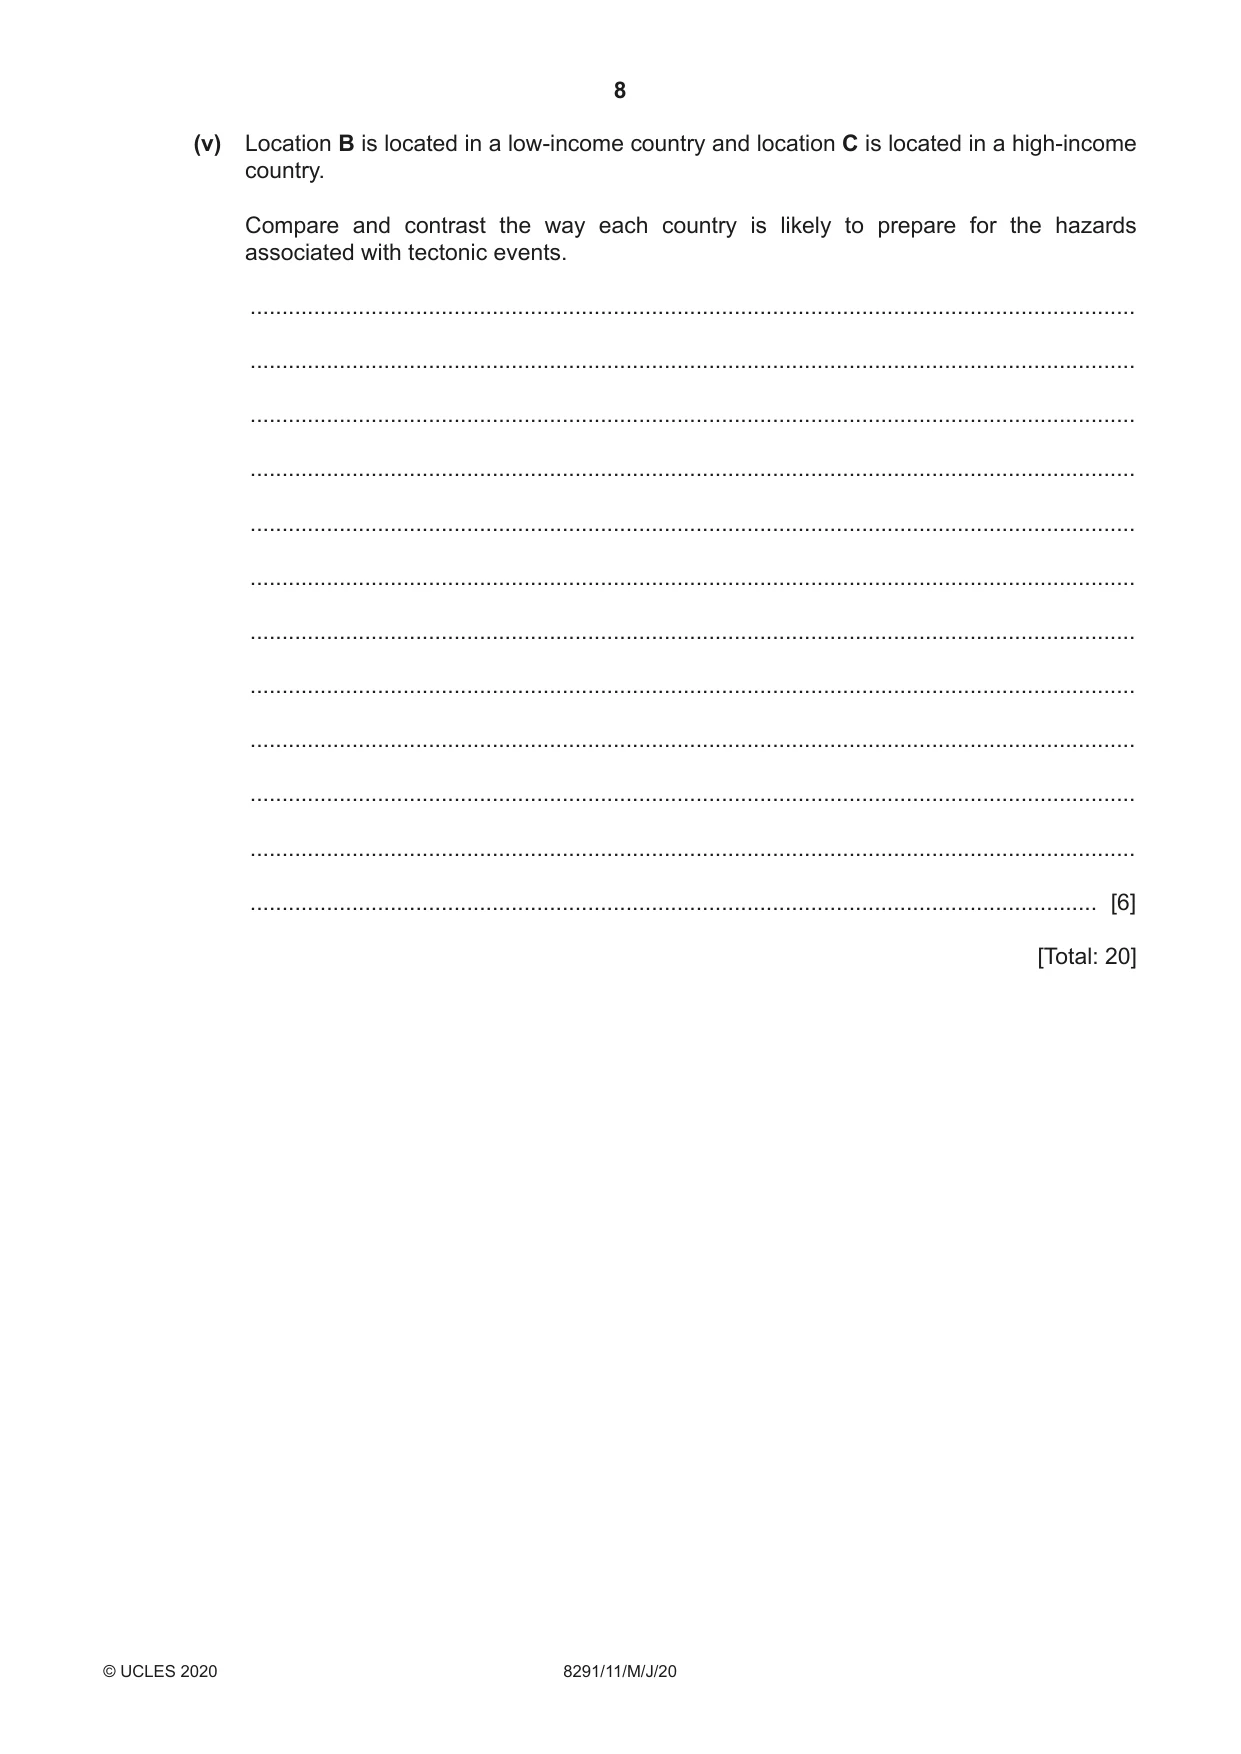
8 8291/11/M/J/20 © UCLES 2020 (v) Location B is located in a low-income country and location C is located in a high-income country. Compare and contrast the way each country is likely to prepare for the hazards associated with tectonic events. … … … … … … … … … … … … [6] [Total: 20]
Question paper, page 9
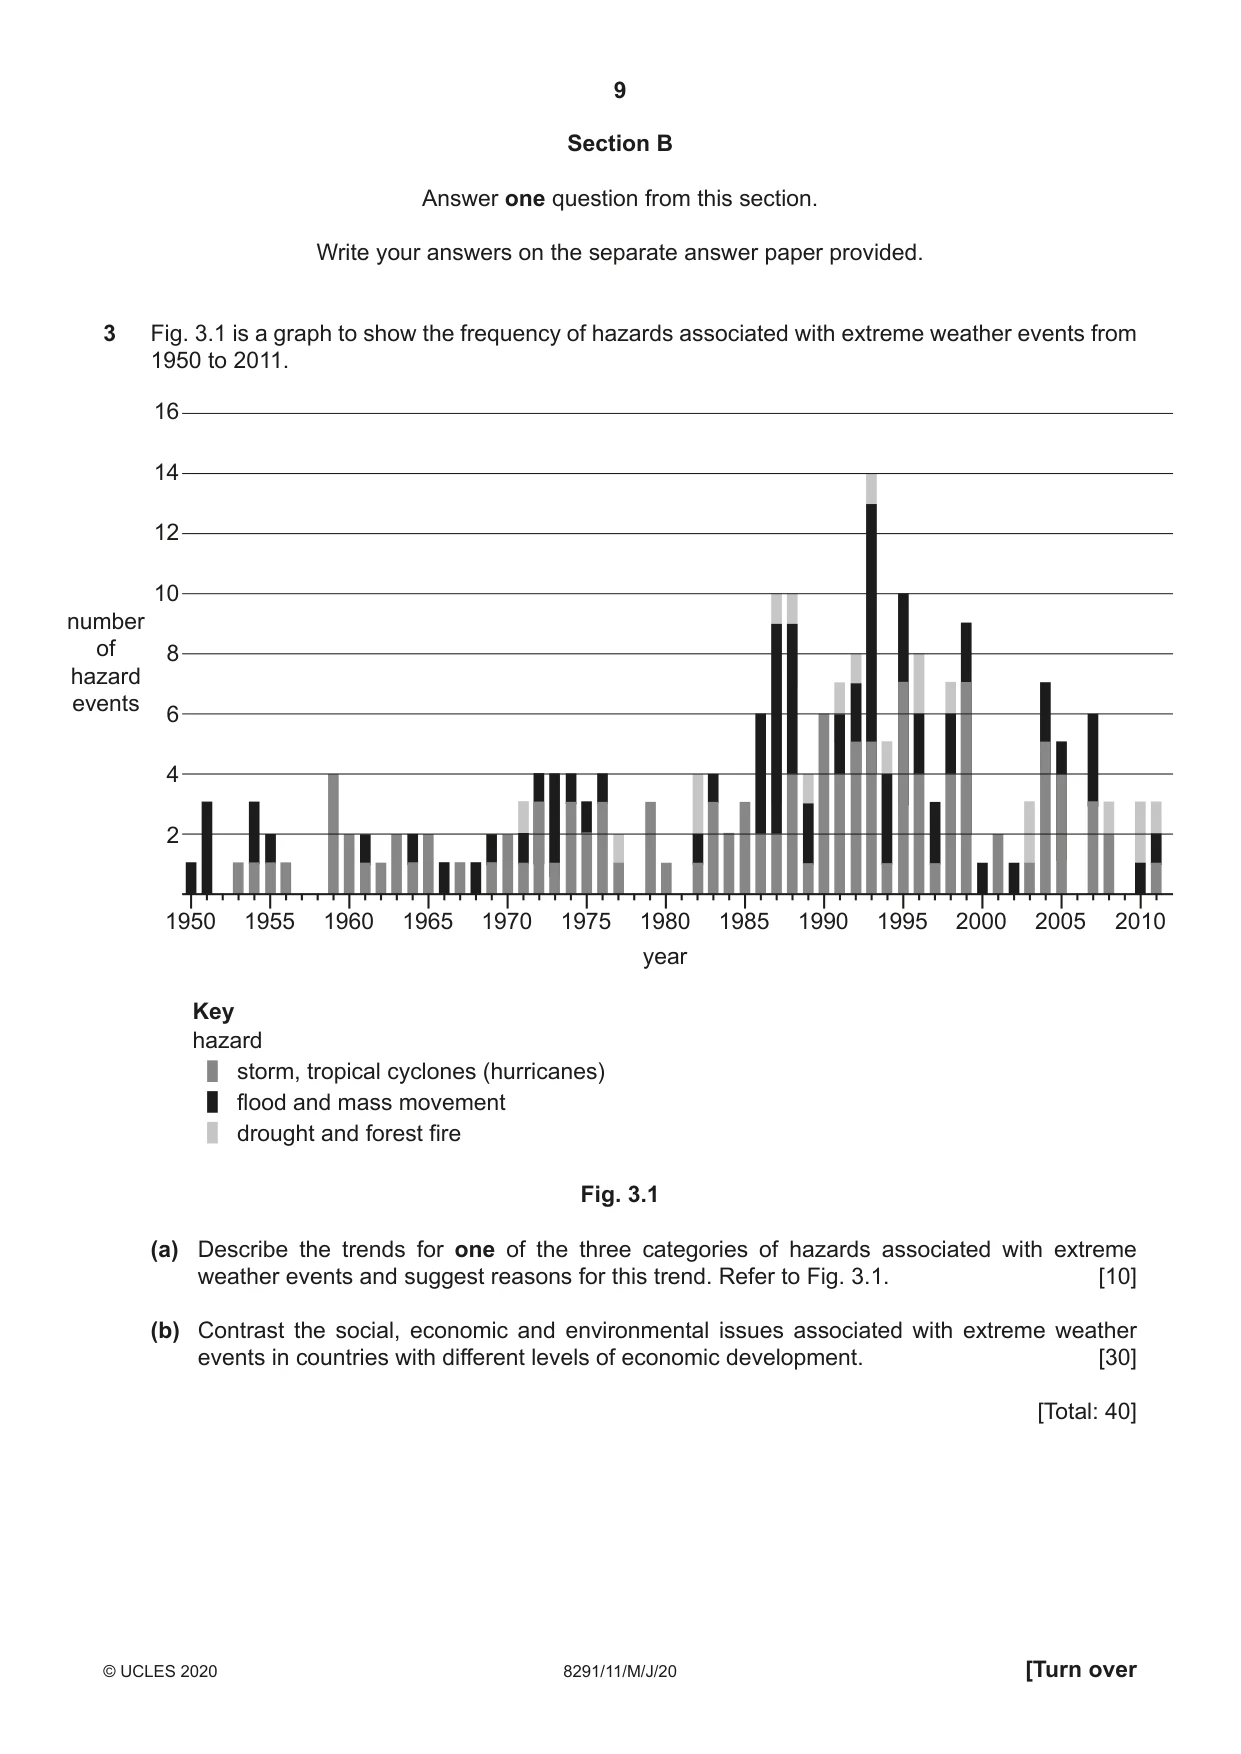
9 8291/11/M/J/20 © UCLES 2020 [Turn over Section B Answer one question from this section. Write your answers on the separate answer paper provided. 3 Fig. 3.1 is a graph to show the frequency of hazards associated with extreme weather events from 1950 to 2011. number of hazard events 2 4 6 8 10 12 14 16 drought and forest fire flood and mass movement storm, tropical cyclones (hurricanes) Key hazard 1950 1955 1960 1965 1970 1975 year 1980 1985 1990 1995 2000 2005 2010 Fig. 3.1 (a) Describe the trends for one of the three categories of hazards associated with extreme weather events and suggest reasons for this trend. Refer to Fig. 3.1. [10] (b) Contrast the social, economic and environmental issues associated with extreme weather events in countries with different levels of economic development. [30] [Total: 40]
Question paper, page 10
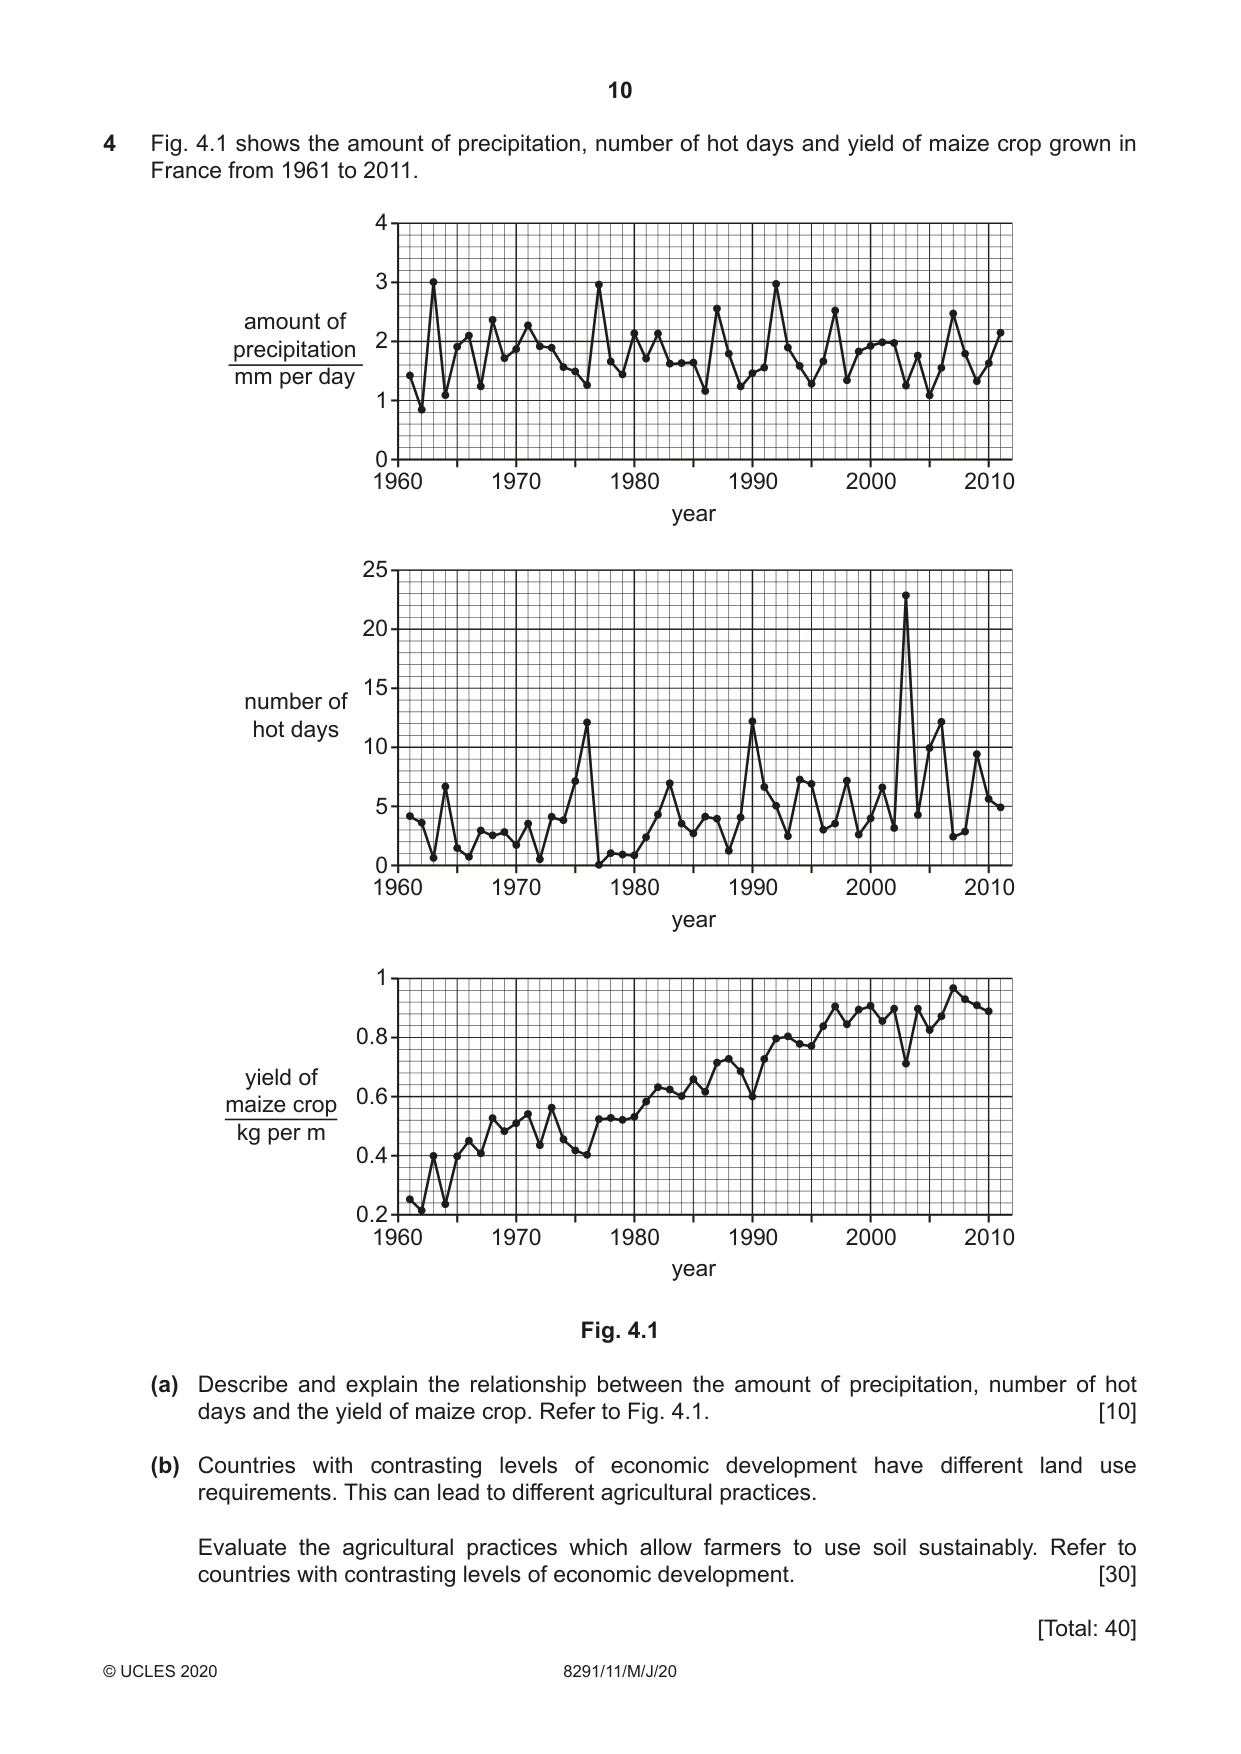
10 8291/11/M/J/20 © UCLES 2020 4 Fig. 4.1 shows the amount of precipitation, number of hot days and yield of maize crop grown in France from 1961 to 2011. 0.2 1960 1970 1980 year 1990 2000 2010 0.4 0.6 0.8 1 yield of maize crop kg per m 0 1960 1970 1980 year 1990 2000 2010 5 10 15 20 25 number of hot days 0 1960 1970 1980 year 1990 2000 2010 1 2 3 4 amount of precipitation mm per day Fig. 4.1 (a) Describe and explain the relationship between the amount of precipitation, number of hot days and the yield of maize crop. Refer to Fig. 4.1. [10] (b) Countries with contrasting levels of economic development have different land use requirements. This can lead to different agricultural practices. Evaluate the agricultural practices which allow farmers to use soil sustainably. Refer to countries with contrasting levels of economic development. [30] [Total: 40]
Question paper, page 11
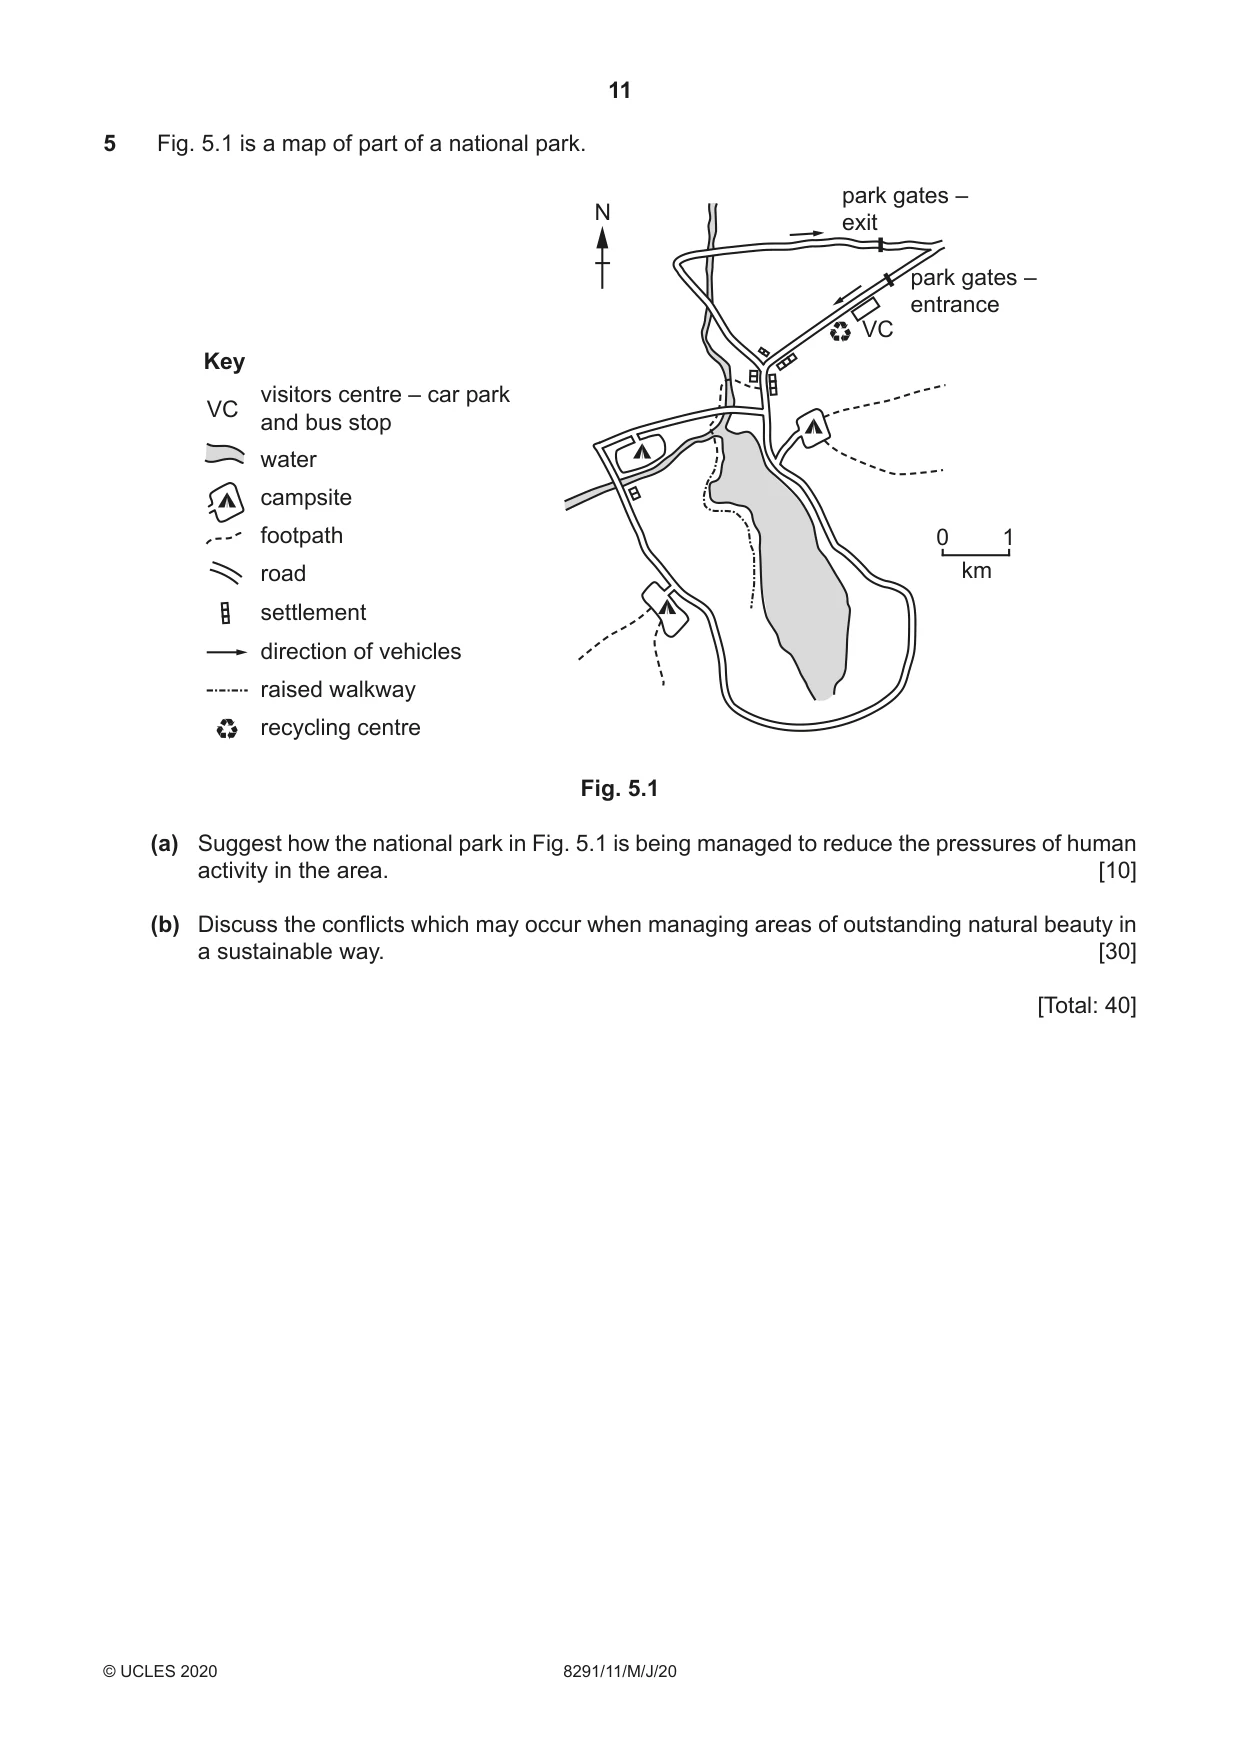
11 8291/11/M/J/20 © UCLES 2020 5 Fig. 5.1 is a map of part of a national park. km 0 1 park gates – entrance park gates – exit VC VC visitors centre – car park and bus stop water campsite footpath road settlement direction of vehicles raised walkway recycling centre Key N Fig. 5.1 (a) Suggest how the national park in Fig. 5.1 is being managed to reduce the pressures of human activity in the area. [10] (b) Discuss the conflicts which may occur when managing areas of outstanding natural beauty in a sustainable way. [30] [Total: 40]
Question paper, page 12
12 8291/11/M/J/20 © UCLES 2020 Permission to reproduce items where third-party owned material protected by copyright is included has been sought and cleared where possible. Every reasonable effort has been made by the publisher (UCLES) to trace copyright holders, but if any items requiring clearance have unwittingly been included, the publisher will be pleased to make amends at the earliest possible opportunity. To avoid the issue of disclosure of answer-related information to candidates, all copyright acknowledgements are reproduced online in the Cambridge Assessment International Education Copyright Acknowledgements Booklet. This is produced for each series of examinations and is freely available to download at www.cambridgeinternational.org after the live examination series. Cambridge Assessment International Education is part of the Cambridge Assessment Group. Cambridge Assessment is the brand name of the University of Cambridge Local Examinations Syndicate (UCLES), which itself is a department of the University of Cambridge. BLANK PAGE
Mark scheme, page 1
This document consists of 17 printed pages. © UCLES 2020 [Turn over Cambridge International AS Level ENVIRONMENTAL MANAGEMENT 8291/11 Paper 1 May/June 2020 MARK SCHEME Maximum Mark: 80 Published Students did not sit exam papers in the June 2020 series due to the Covid-19 global pandemic. This mark scheme is published to support teachers and students and should be read together with the question paper. It shows the requirements of the exam. The answer column of the mark scheme shows the proposed basis on which Examiners would award marks for this exam. Where appropriate, this column also provides the most likely acceptable alternative responses expected from students. Examiners usually review the mark scheme after they have seen student responses and update the mark scheme if appropriate. In the June series, Examiners were unable to consider the acceptability of alternative responses, as there were no student responses to consider. Mark schemes should usually be read together with the Principal Examiner Report for Teachers. However, because students did not sit exam papers, there is no Principal Examiner Report for Teachers for the June 2020 series. Cambridge International will not enter into discussions about these mark schemes. Cambridge International is publishing the mark schemes for the June 2020 series for most Cambridge IGCSE™ and Cambridge International A & AS Level components, and some Cambridge O Level components.
Mark scheme, page 2
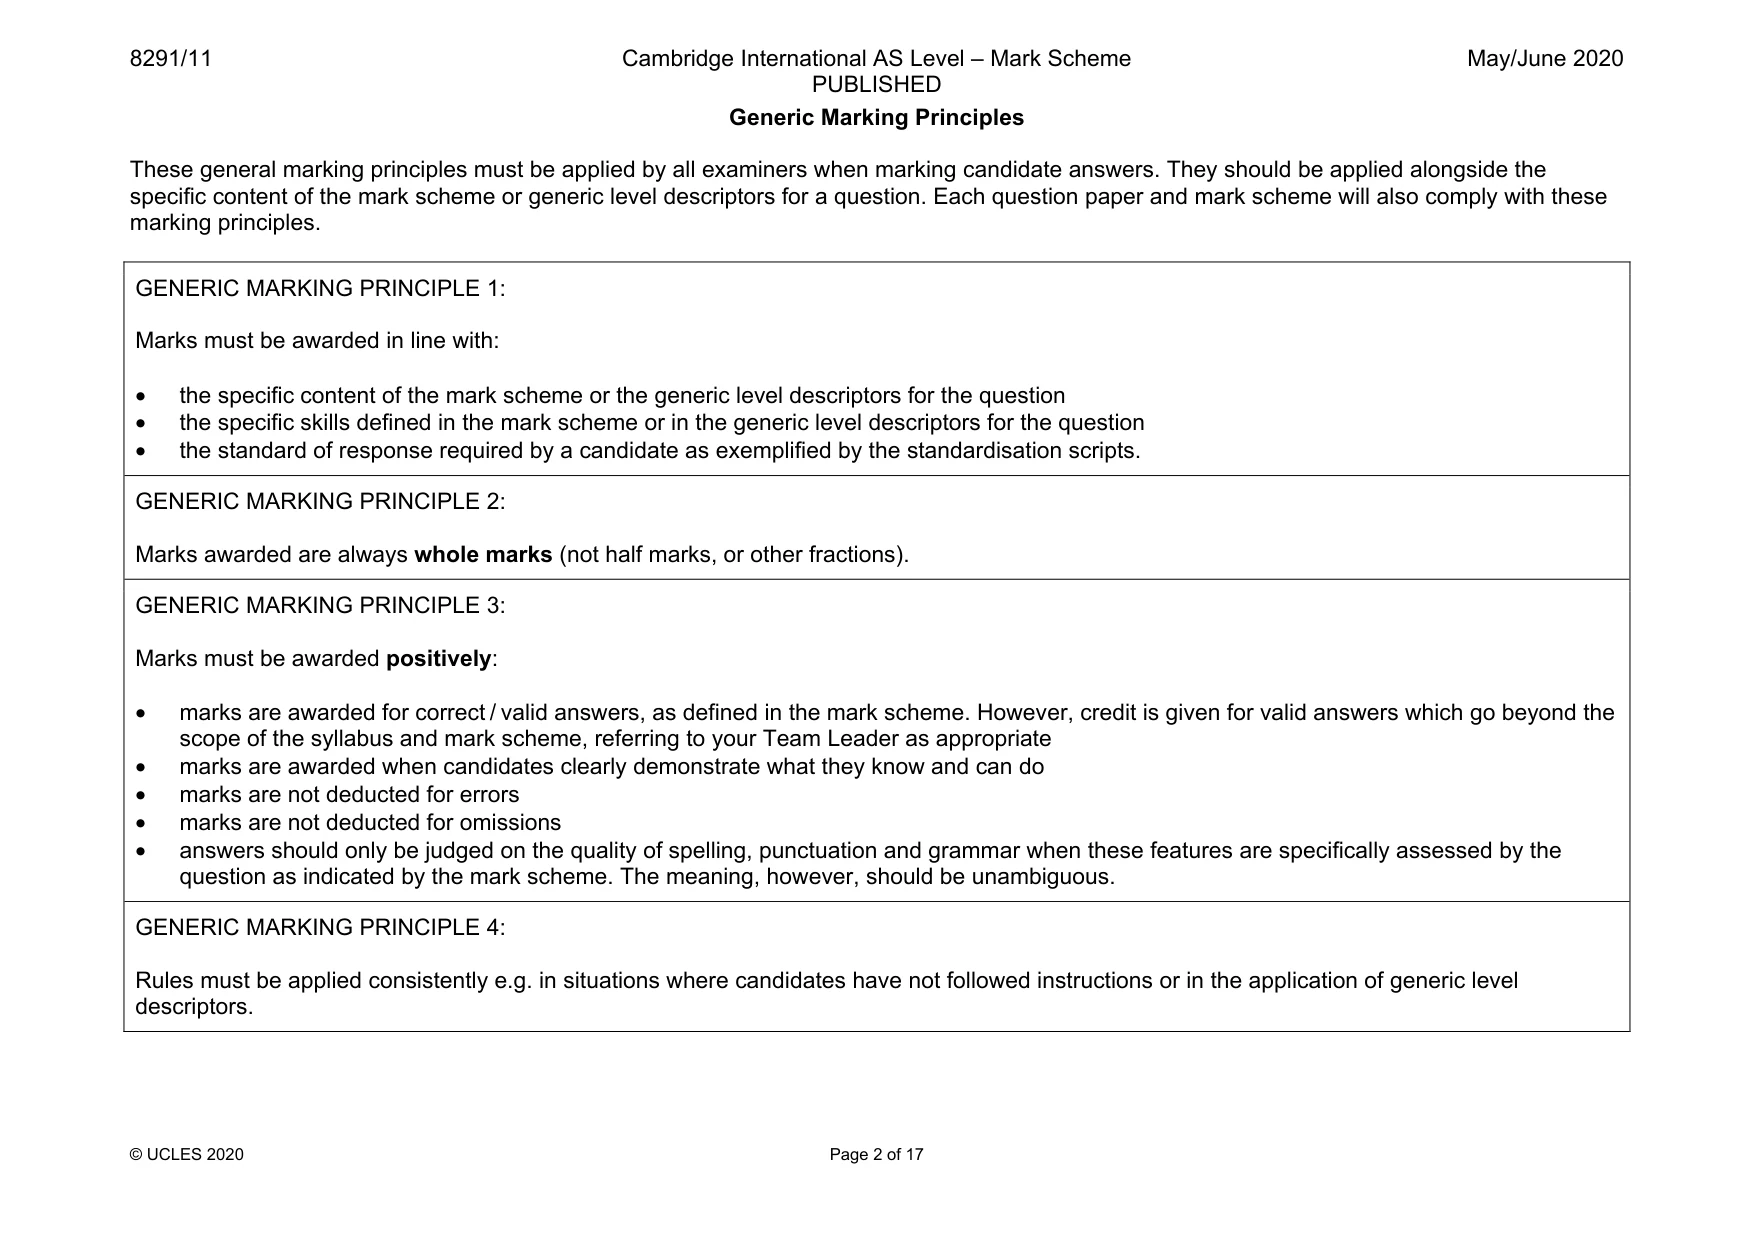
8291/11 Cambridge International AS Level – Mark Scheme PUBLISHED May/June 2020 © UCLES 2020 Page 2 of 17 Generic Marking Principles These general marking principles must be applied by all examiners when marking candidate answers. They should be applied alongside the specific content of the mark scheme or generic level descriptors for a question. Each question paper and mark scheme will also comply with these marking principles. GENERIC MARKING PRINCIPLE 1: Marks must be awarded in line with: • the specific content of the mark scheme or the generic level descriptors for the question • the specific skills defined in the mark scheme or in the generic level descriptors for the question • the standard of response required by a candidate as exemplified by the standardisation scripts. GENERIC MARKING PRINCIPLE 2: Marks awarded are always whole marks (not half marks, or other fractions). GENERIC MARKING PRINCIPLE 3: Marks must be awarded positively: • marks are awarded for correct / valid answers, as defined in the mark scheme. However, credit is given for valid answers which go beyond the scope of the syllabus and mark scheme, referring to your Team Leader as appropriate • marks are awarded when candidates clearly demonstrate what they know and can do • marks are not deducted for errors • marks are not deducted for omissions • answers should only be judged on the quality of spelling, punctuation and grammar when these features are specifically assessed by the question as indicated by the mark scheme. The meaning, however, should be unambiguous. GENERIC MARKING PRINCIPLE 4: Rules must be applied consistently e.g. in situations where candidates have not followed instructions or in the application of generic level descriptors.
Mark scheme, page 3
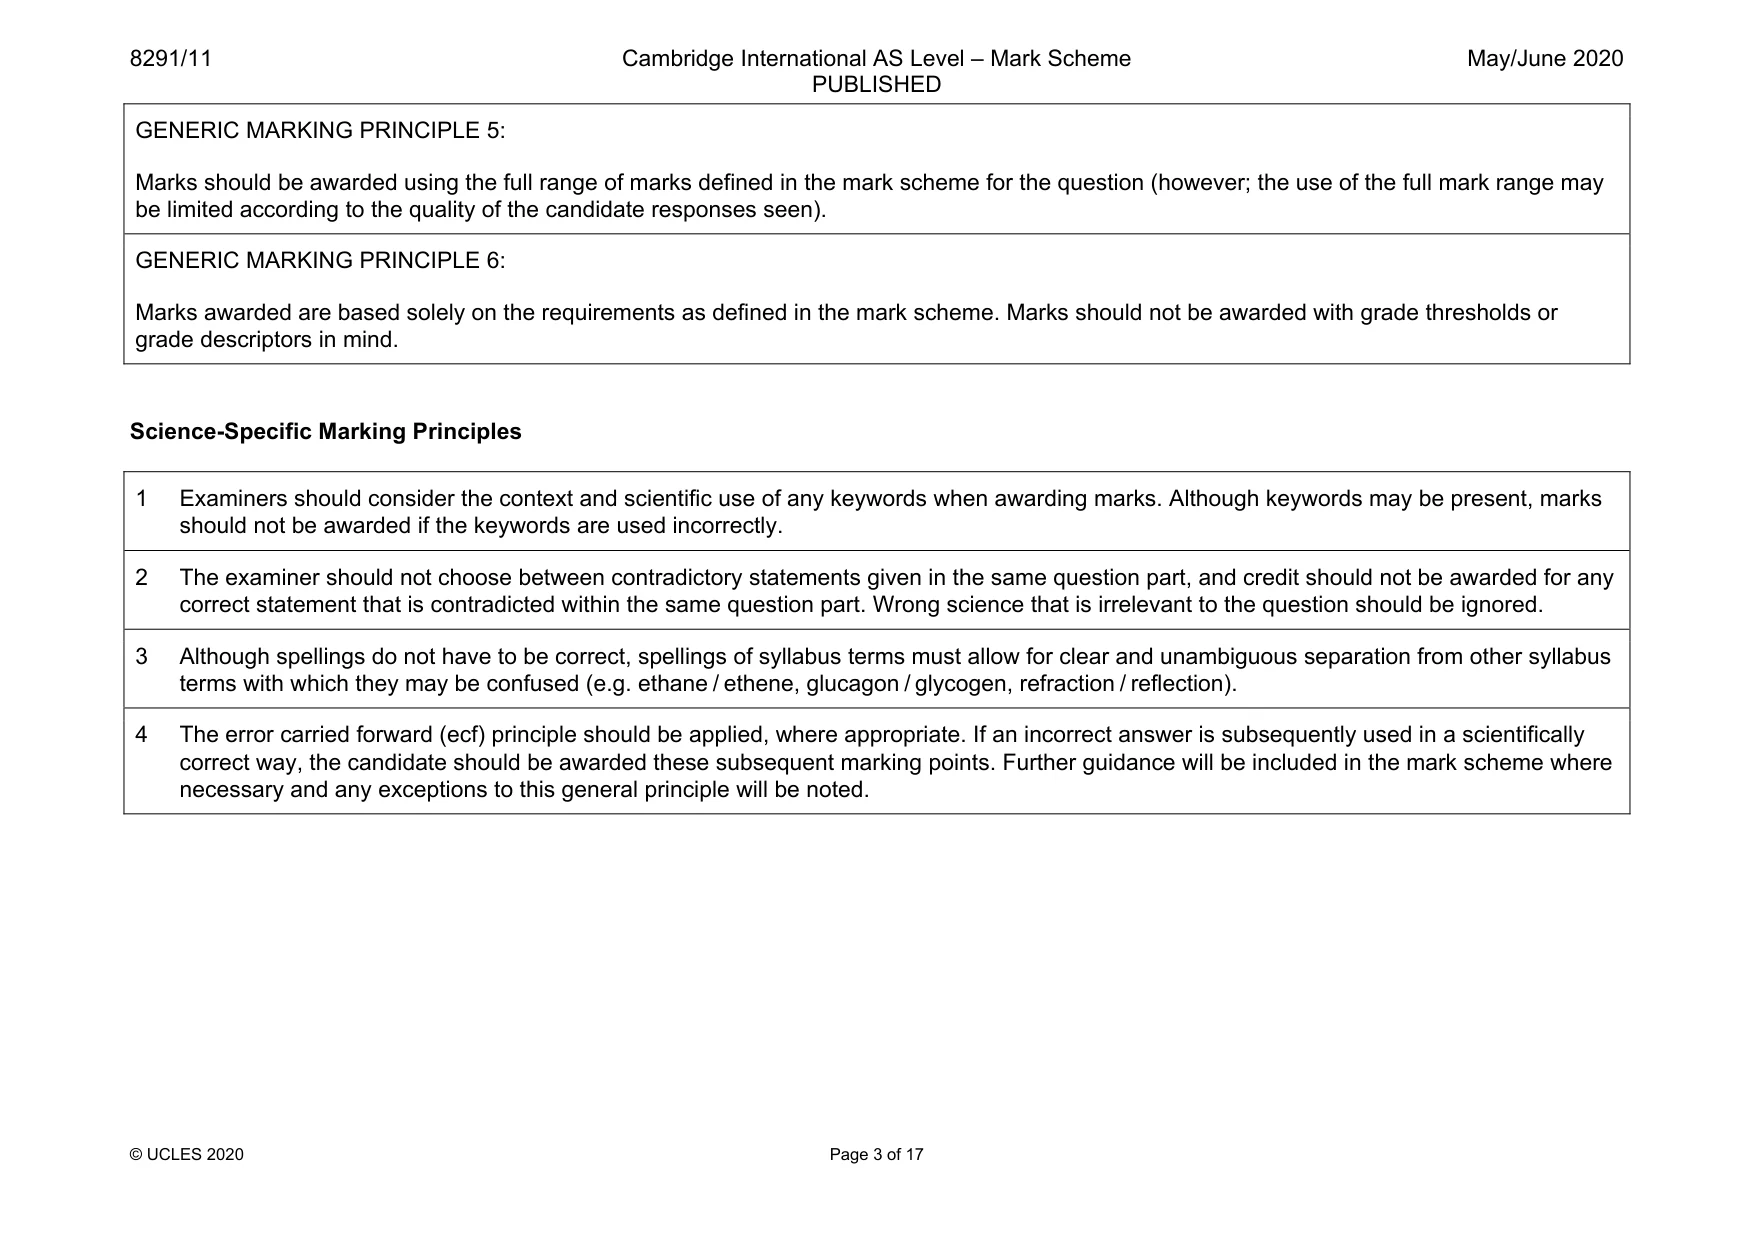
8291/11 Cambridge International AS Level – Mark Scheme PUBLISHED May/June 2020 © UCLES 2020 Page 3 of 17 GENERIC MARKING PRINCIPLE 5: Marks should be awarded using the full range of marks defined in the mark scheme for the question (however; the use of the full mark range may be limited according to the quality of the candidate responses seen). GENERIC MARKING PRINCIPLE 6: Marks awarded are based solely on the requirements as defined in the mark scheme. Marks should not be awarded with grade thresholds or grade descriptors in mind. Science-Specific Marking Principles 1 Examiners should consider the context and scientific use of any keywords when awarding marks. Although keywords may be present, marks should not be awarded if the keywords are used incorrectly. 2 The examiner should not choose between contradictory statements given in the same question part, and credit should not be awarded for any correct statement that is contradicted within the same question part. Wrong science that is irrelevant to the question should be ignored. 3 Although spellings do not have to be correct, spellings of syllabus terms must allow for clear and unambiguous separation from other syllabus terms with which they may be confused (e.g. ethane / ethene, glucagon / glycogen, refraction / reflection). 4 The error carried forward (ecf) principle should be applied, where appropriate. If an incorrect answer is subsequently used in a scientifically correct way, the candidate should be awarded these subsequent marking points. Further guidance will be included in the mark scheme where necessary and any exceptions to this general principle will be noted.
Mark scheme, page 4
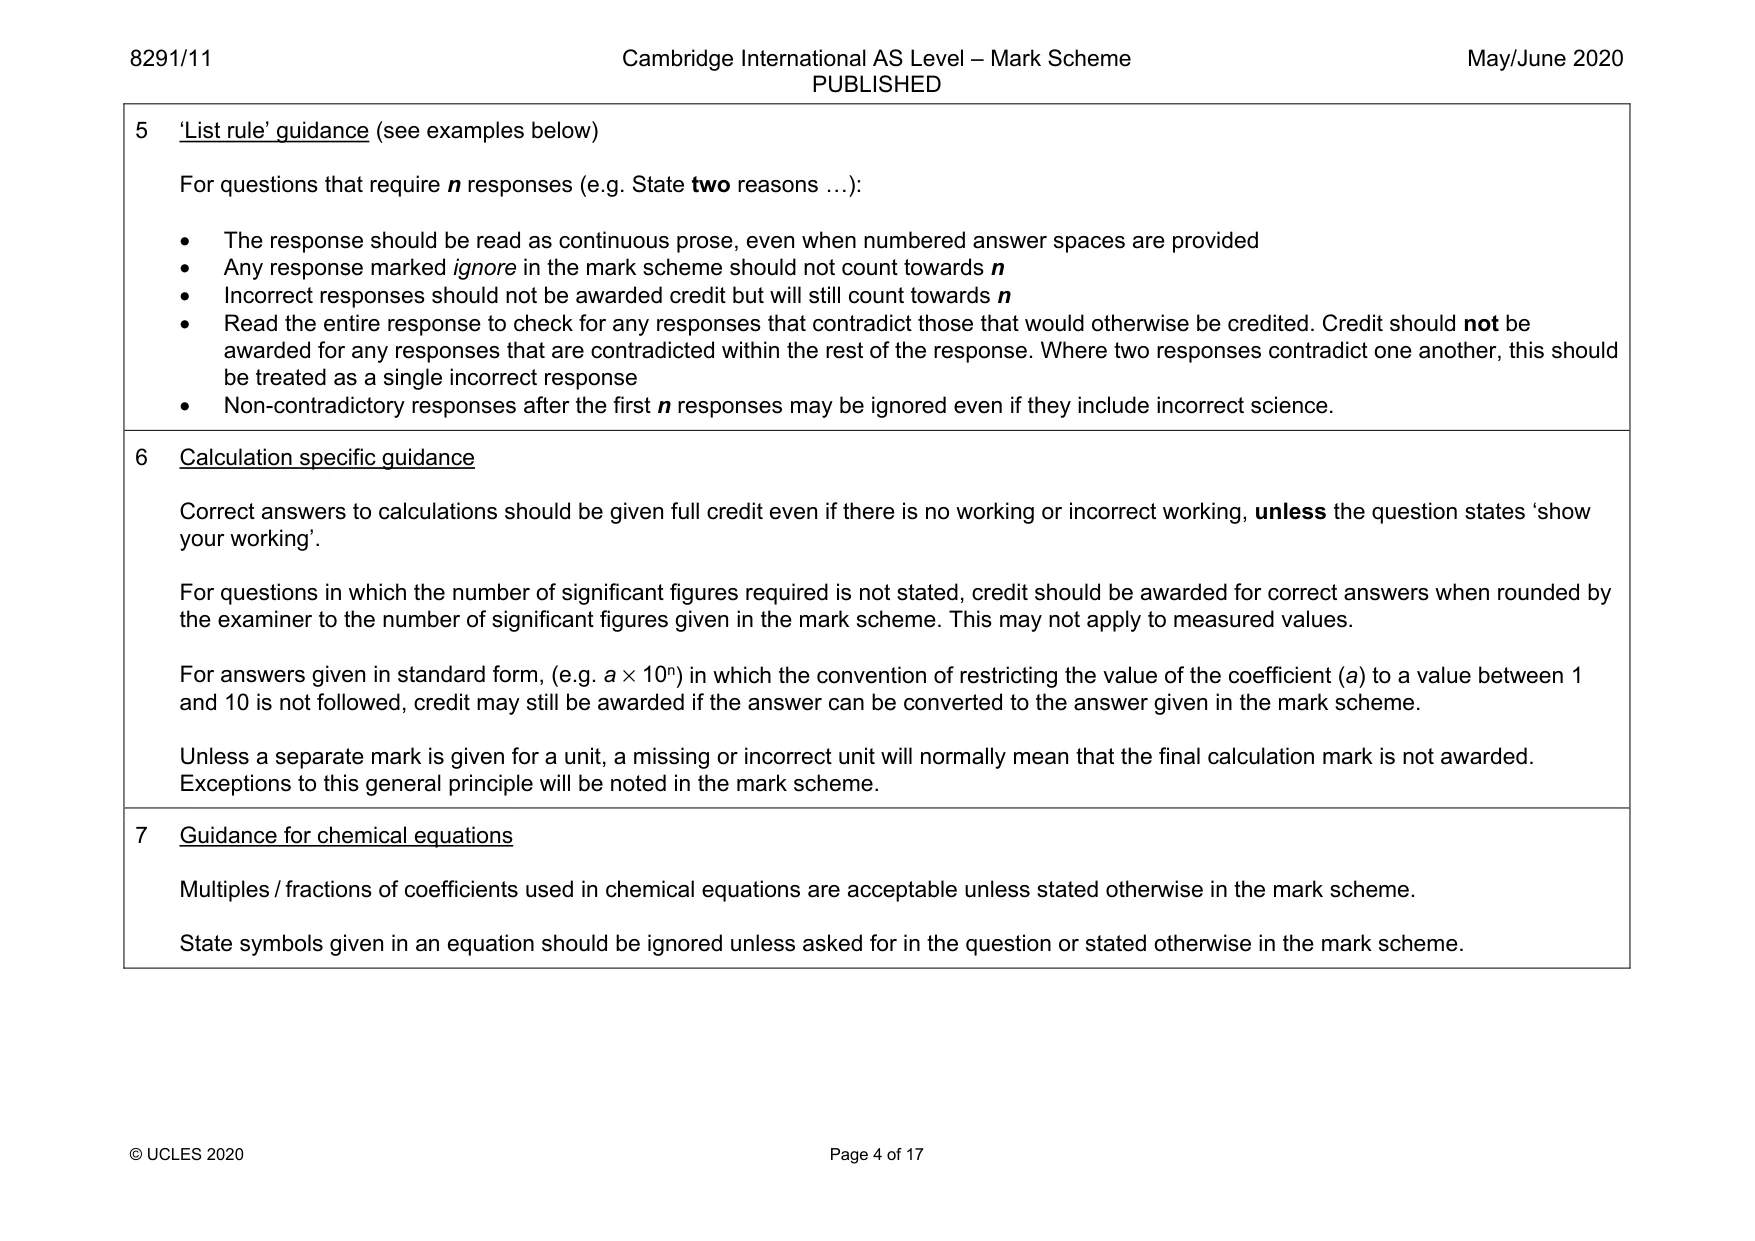
8291/11 Cambridge International AS Level – Mark Scheme PUBLISHED May/June 2020 © UCLES 2020 Page 4 of 17 5 ‘List rule’ guidance (see examples below) For questions that require n responses (e.g. State two reasons …): • The response should be read as continuous prose, even when numbered answer spaces are provided • Any response marked ignore in the mark scheme should not count towards n • Incorrect responses should not be awarded credit but will still count towards n • Read the entire response to check for any responses that contradict those that would otherwise be credited. Credit should not be awarded for any responses that are contradicted within the rest of the response. Where two responses contradict one another, this should be treated as a single incorrect response • Non-contradictory responses after the first n responses may be ignored even if they include incorrect science. 6 Calculation specific guidance Correct answers to calculations should be given full credit even if there is no working or incorrect working, unless the question states ‘show your working’. For questions in which the number of significant figures required is not stated, credit should be awarded for correct answers when rounded by the examiner to the number of significant figures given in the mark scheme. This may not apply to measured values. For answers given in standard form, (e.g. a × 10n) in which the convention of restricting the value of the coefficient (a) to a value between 1 and 10 is not followed, credit may still be awarded if the answer can be converted to the answer given in the mark scheme. Unless a separate mark is given for a unit, a missing or incorrect unit will normally mean that the final calculation mark is not awarded. Exceptions to this general principle will be noted in the mark scheme. 7 Guidance for chemical equations Multiples / fractions of coefficients used in chemical equations are acceptable unless stated otherwise in the mark scheme. State symbols given in an equation should be ignored unless asked for in the question or stated otherwise in the mark scheme.
Mark scheme, page 5
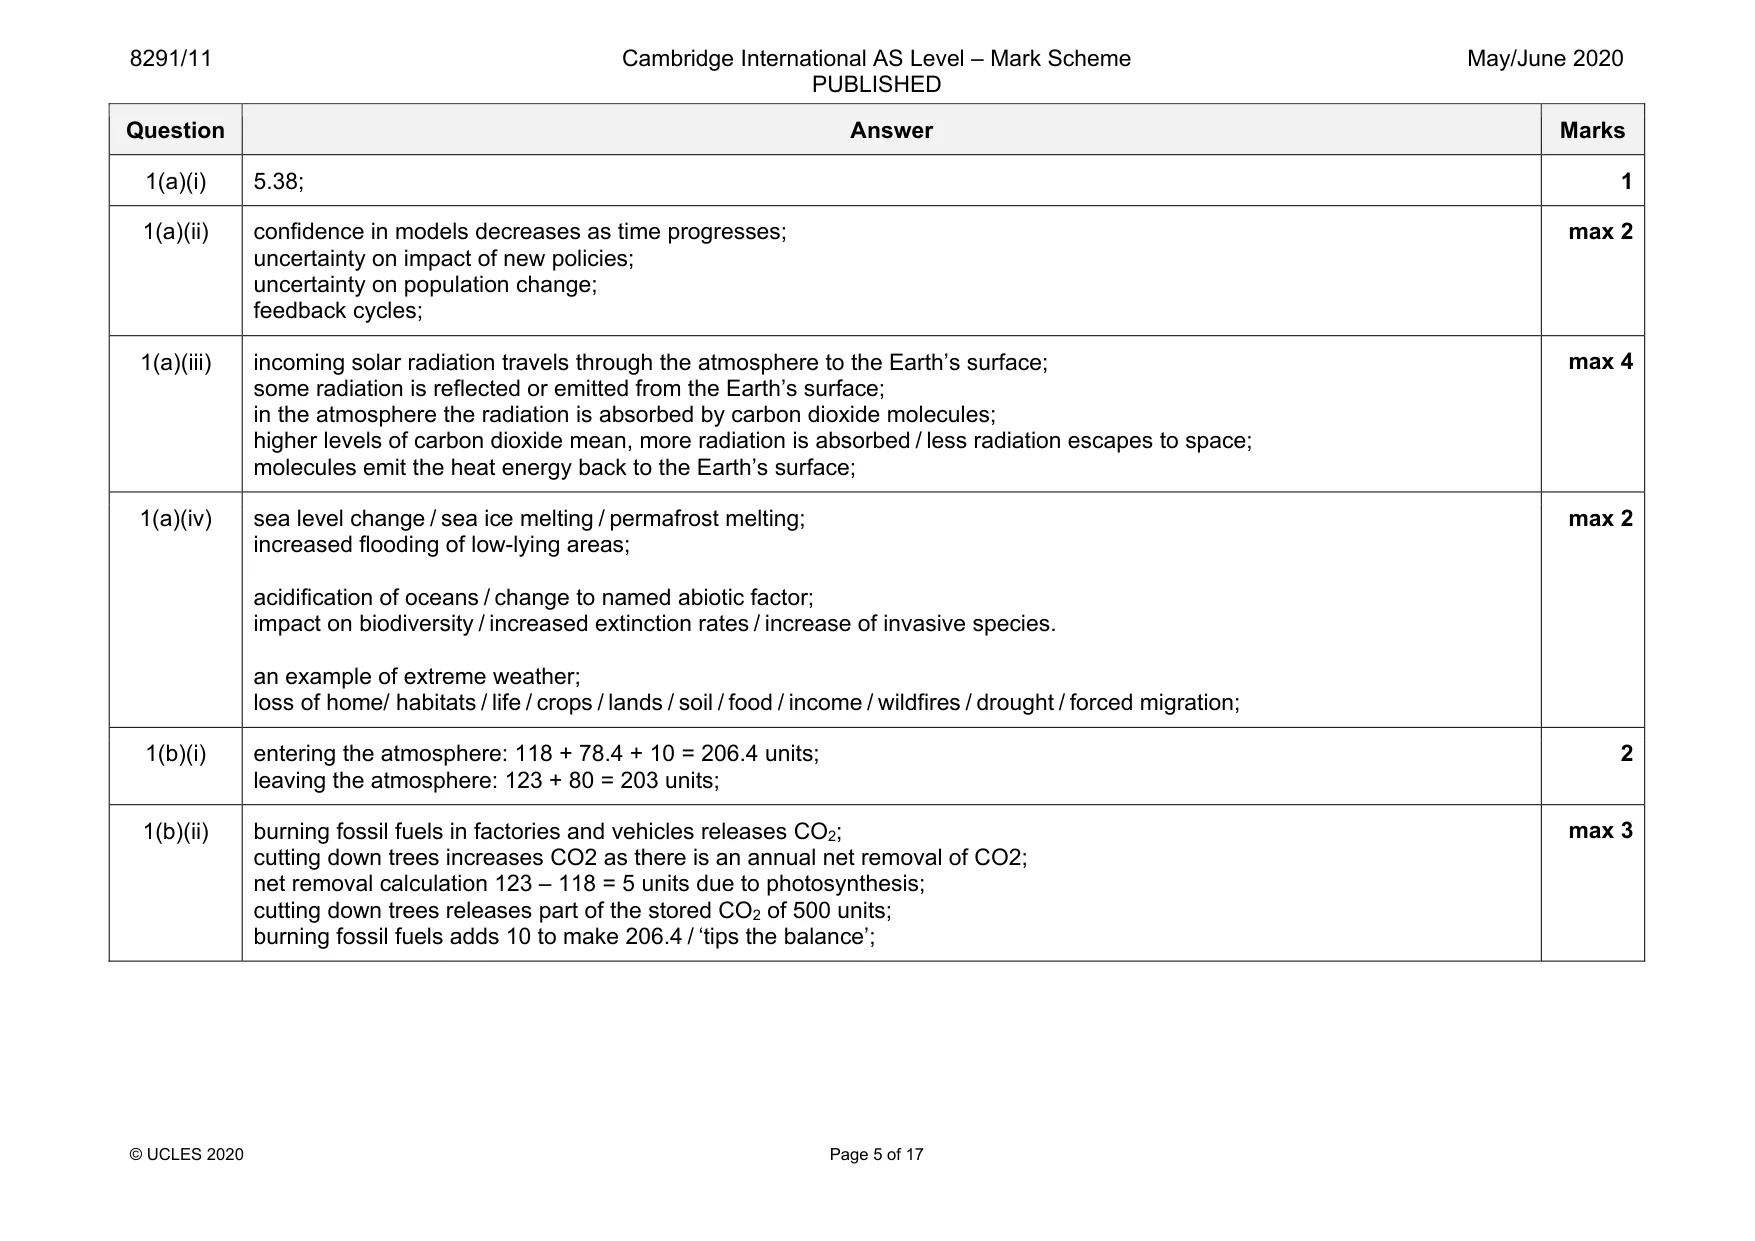
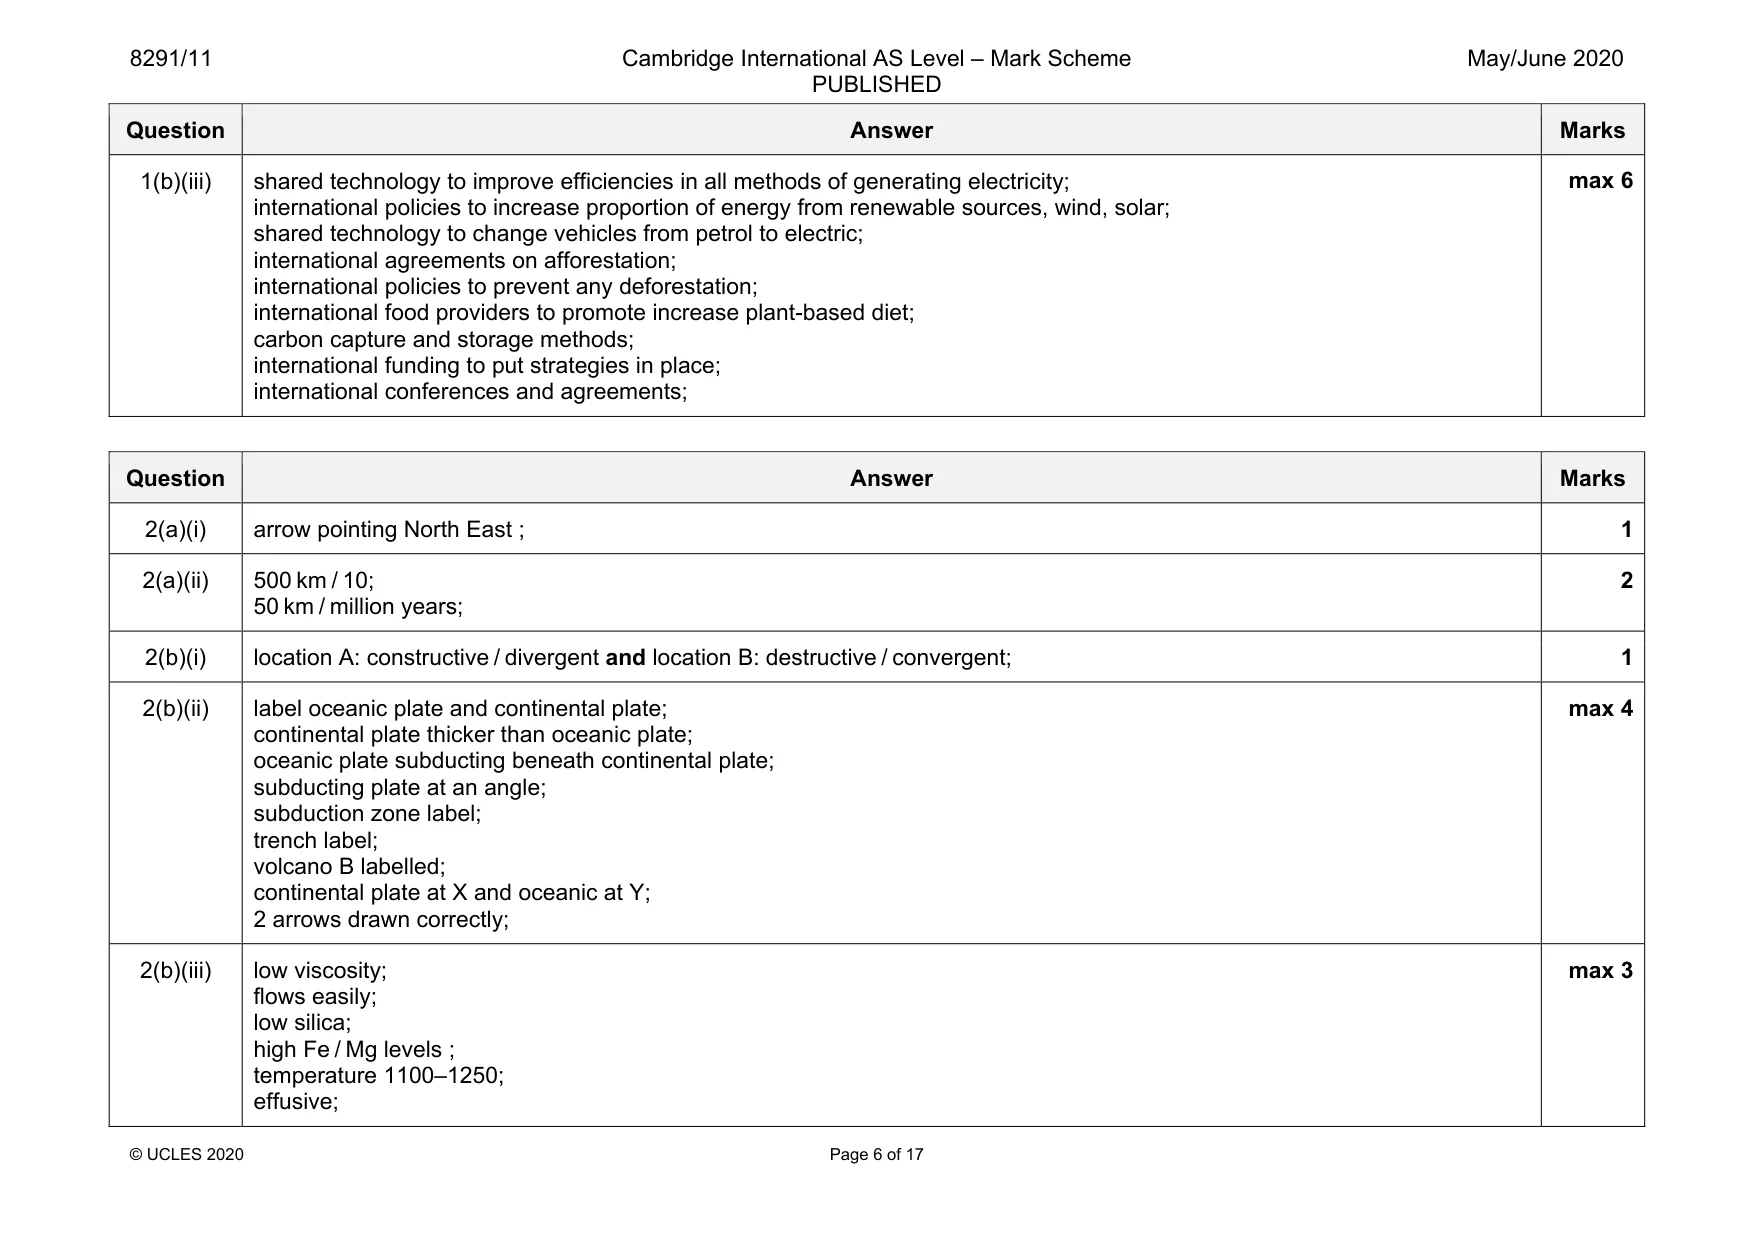
8291/11 Cambridge International AS Level – Mark Scheme PUBLISHED May/June 2020 © UCLES 2020 Page 5 of 17 Question Answer Marks 1(a)(i) 5.38; 1 1(a)(ii) confidence in models decreases as time progresses; uncertainty on impact of new policies; uncertainty on population change; feedback cycles; max 2 1(a)(iii) incoming solar radiation travels through the atmosphere to the Earth’s surface; some radiation is reflected or emitted from the Earth’s surface; in the atmosphere the radiation is absorbed by carbon dioxide molecules; higher levels of carbon dioxide mean, more radiation is absorbed / less radiation escapes to space; molecules emit the heat energy back to the Earth’s surface; max 4 1(a)(iv) sea level change / sea ice melting / permafrost melting; increased flooding of low-lying areas; acidification of oceans / change to named abiotic factor; impact on biodiversity / increased extinction rates / increase of invasive species. an example of extreme weather; loss of home/ habitats / life / crops / lands / soil / food / income / wildfires / drought / forced migration; max 2 1(b)(i) entering the atmosphere: 118 + 78.4 + 10 = 206.4 units; leaving the atmosphere: 123 + 80 = 203 units; 2 1(b)(ii) burning fossil fuels in factories and vehicles releases CO2; cutting down trees increases CO2 as there is an annual net removal of CO2; net removal calculation 123 – 118 = 5 units due to photosynthesis; cutting down trees releases part of the stored CO2 of 500 units; burning fossil fuels adds 10 to make 206.4 / ‘tips the balance’; max 3
Mark scheme, page 6
8291/11 Cambridge International AS Level – Mark Scheme PUBLISHED May/June 2020 © UCLES 2020 Page 6 of 17 Question Answer Marks 1(b)(iii) shared technology to improve efficiencies in all methods of generating electricity; international policies to increase proportion of energy from renewable sources, wind, solar; shared technology to change vehicles from petrol to electric; international agreements on afforestation; international policies to prevent any deforestation; international food providers to promote increase plant-based diet; carbon capture and storage methods; international funding to put strategies in place; international conferences and agreements; max 6 Question Answer Marks 2(a)(i) arrow pointing North East ; 1 2(a)(ii) 500 km / 10; 50 km / million years; 2 2(b)(i) location A: constructive / divergent and location B: destructive / convergent; 1 2(b)(ii) label oceanic plate and continental plate; continental plate thicker than oceanic plate; oceanic plate subducting beneath continental plate; subducting plate at an angle; subduction zone label; trench label; volcano B labelled; continental plate at X and oceanic at Y; 2 arrows drawn correctly; max 4 2(b)(iii) low viscosity; flows easily; low silica; high Fe / Mg levels ; temperature 1100–1250; effusive; max 3
Mark scheme, page 7
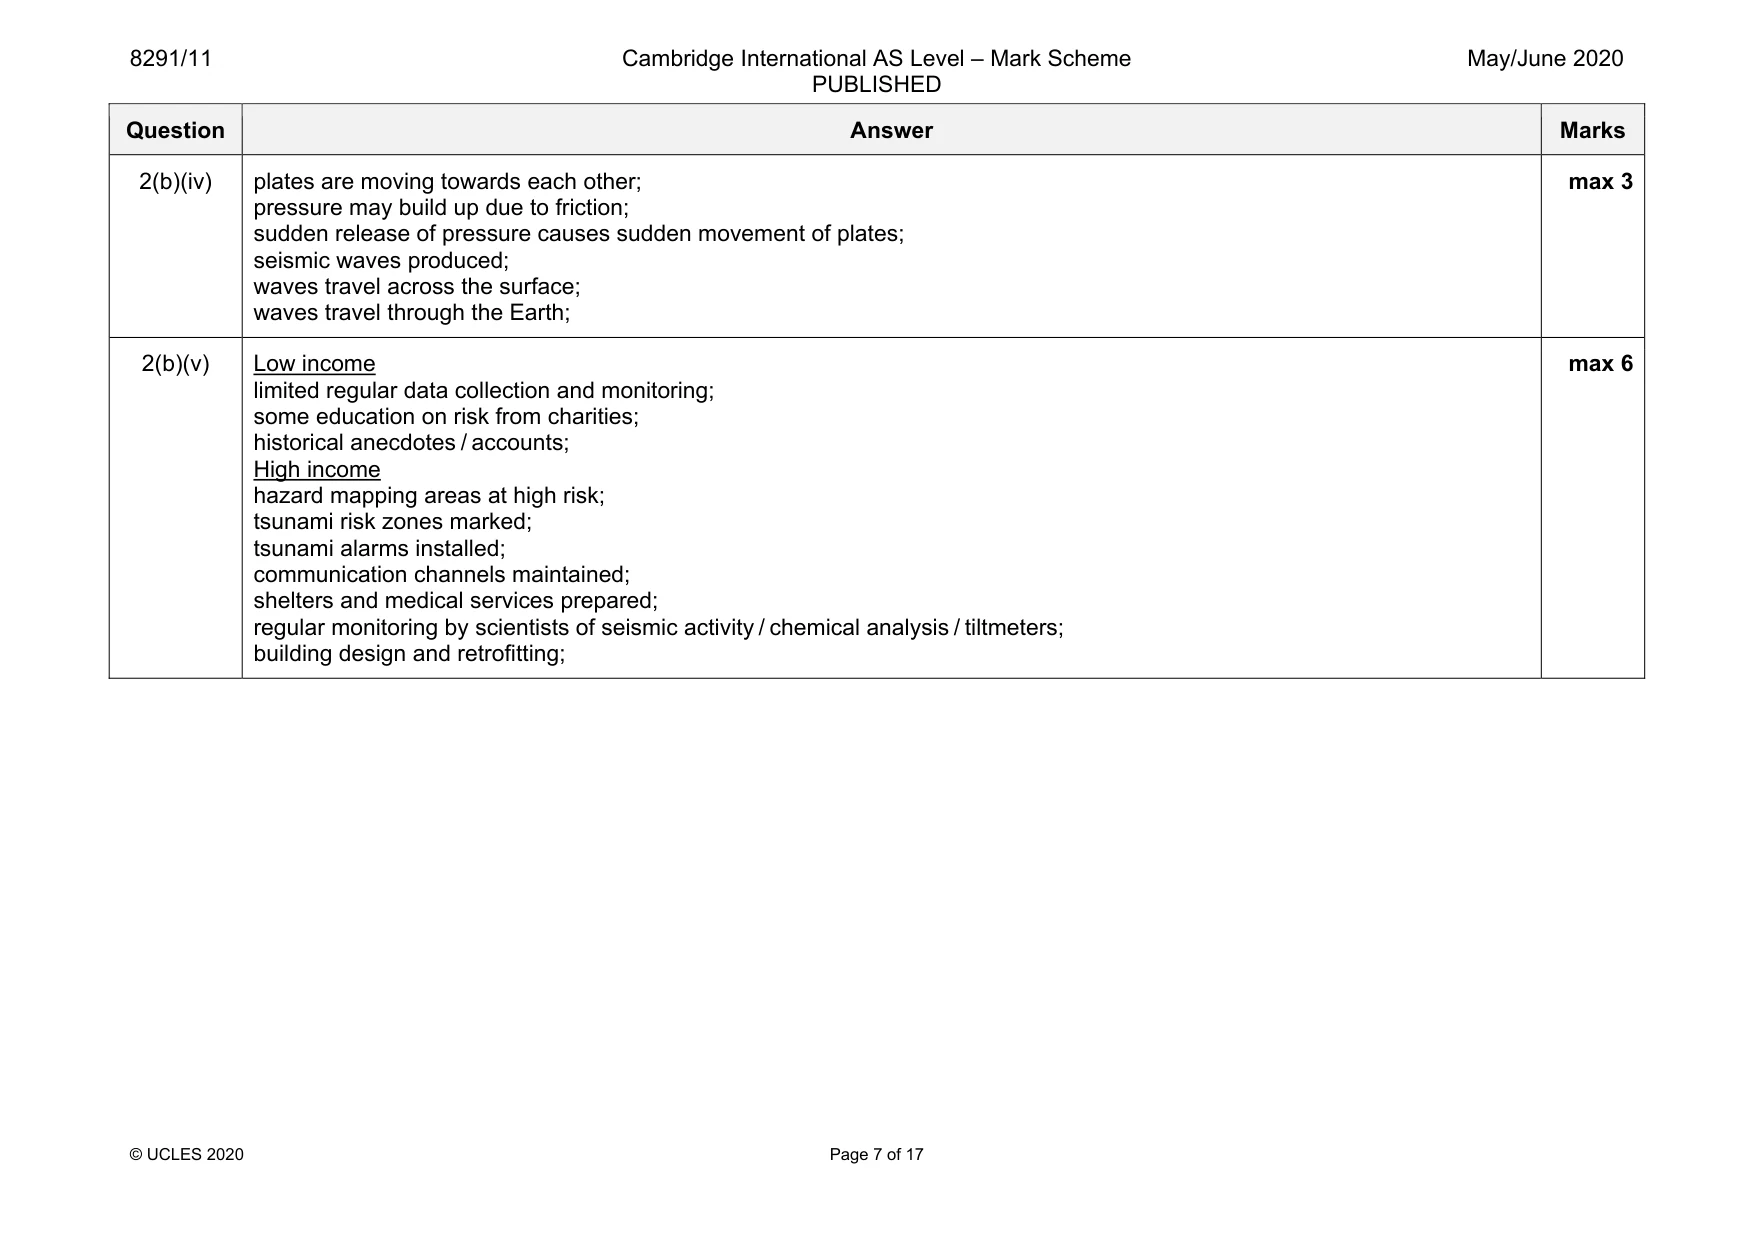
8291/11 Cambridge International AS Level – Mark Scheme PUBLISHED May/June 2020 © UCLES 2020 Page 7 of 17 Question Answer Marks 2(b)(iv) plates are moving towards each other; pressure may build up due to friction; sudden release of pressure causes sudden movement of plates; seismic waves produced; waves travel across the surface; waves travel through the Earth; max 3 2(b)(v) Low income limited regular data collection and monitoring; some education on risk from charities; historical anecdotes / accounts; High income hazard mapping areas at high risk; tsunami risk zones marked; tsunami alarms installed; communication channels maintained; shelters and medical services prepared; regular monitoring by scientists of seismic activity / chemical analysis / tiltmeters; building design and retrofitting; max 6
Mark scheme, page 8
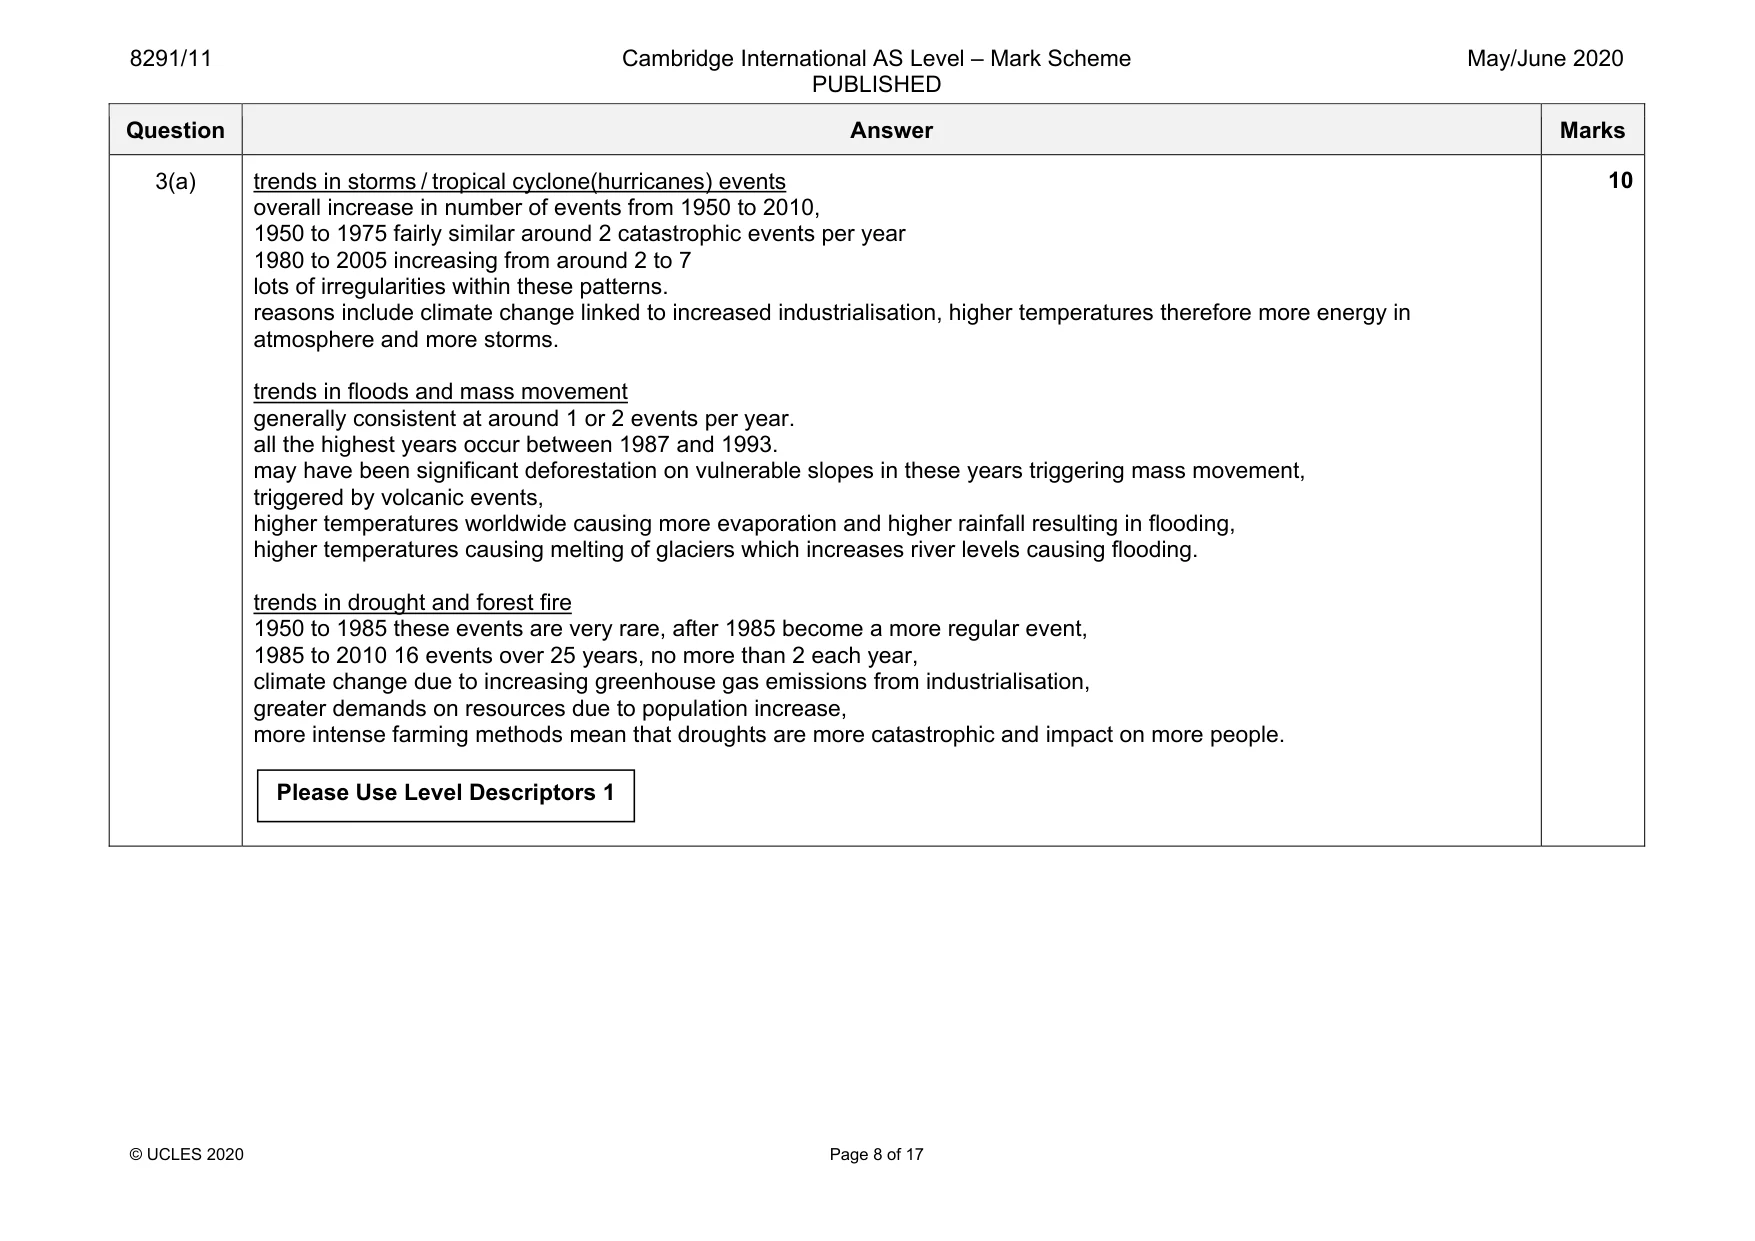
8291/11 Cambridge International AS Level – Mark Scheme PUBLISHED May/June 2020 © UCLES 2020 Page 8 of 17 Question Answer Marks 3(a) trends in storms / tropical cyclone(hurricanes) events overall increase in number of events from 1950 to 2010, 1950 to 1975 fairly similar around 2 catastrophic events per year 1980 to 2005 increasing from around 2 to 7 lots of irregularities within these patterns. reasons include climate change linked to increased industrialisation, higher temperatures therefore more energy in atmosphere and more storms. trends in floods and mass movement generally consistent at around 1 or 2 events per year. all the highest years occur between 1987 and 1993. may have been significant deforestation on vulnerable slopes in these years triggering mass movement, triggered by volcanic events, higher temperatures worldwide causing more evaporation and higher rainfall resulting in flooding, higher temperatures causing melting of glaciers which increases river levels causing flooding. trends in drought and forest fire 1950 to 1985 these events are very rare, after 1985 become a more regular event, 1985 to 2010 16 events over 25 years, no more than 2 each year, climate change due to increasing greenhouse gas emissions from industrialisation, greater demands on resources due to population increase, more intense farming methods mean that droughts are more catastrophic and impact on more people. 10 Please Use Level Descriptors 1
Mark scheme, page 9
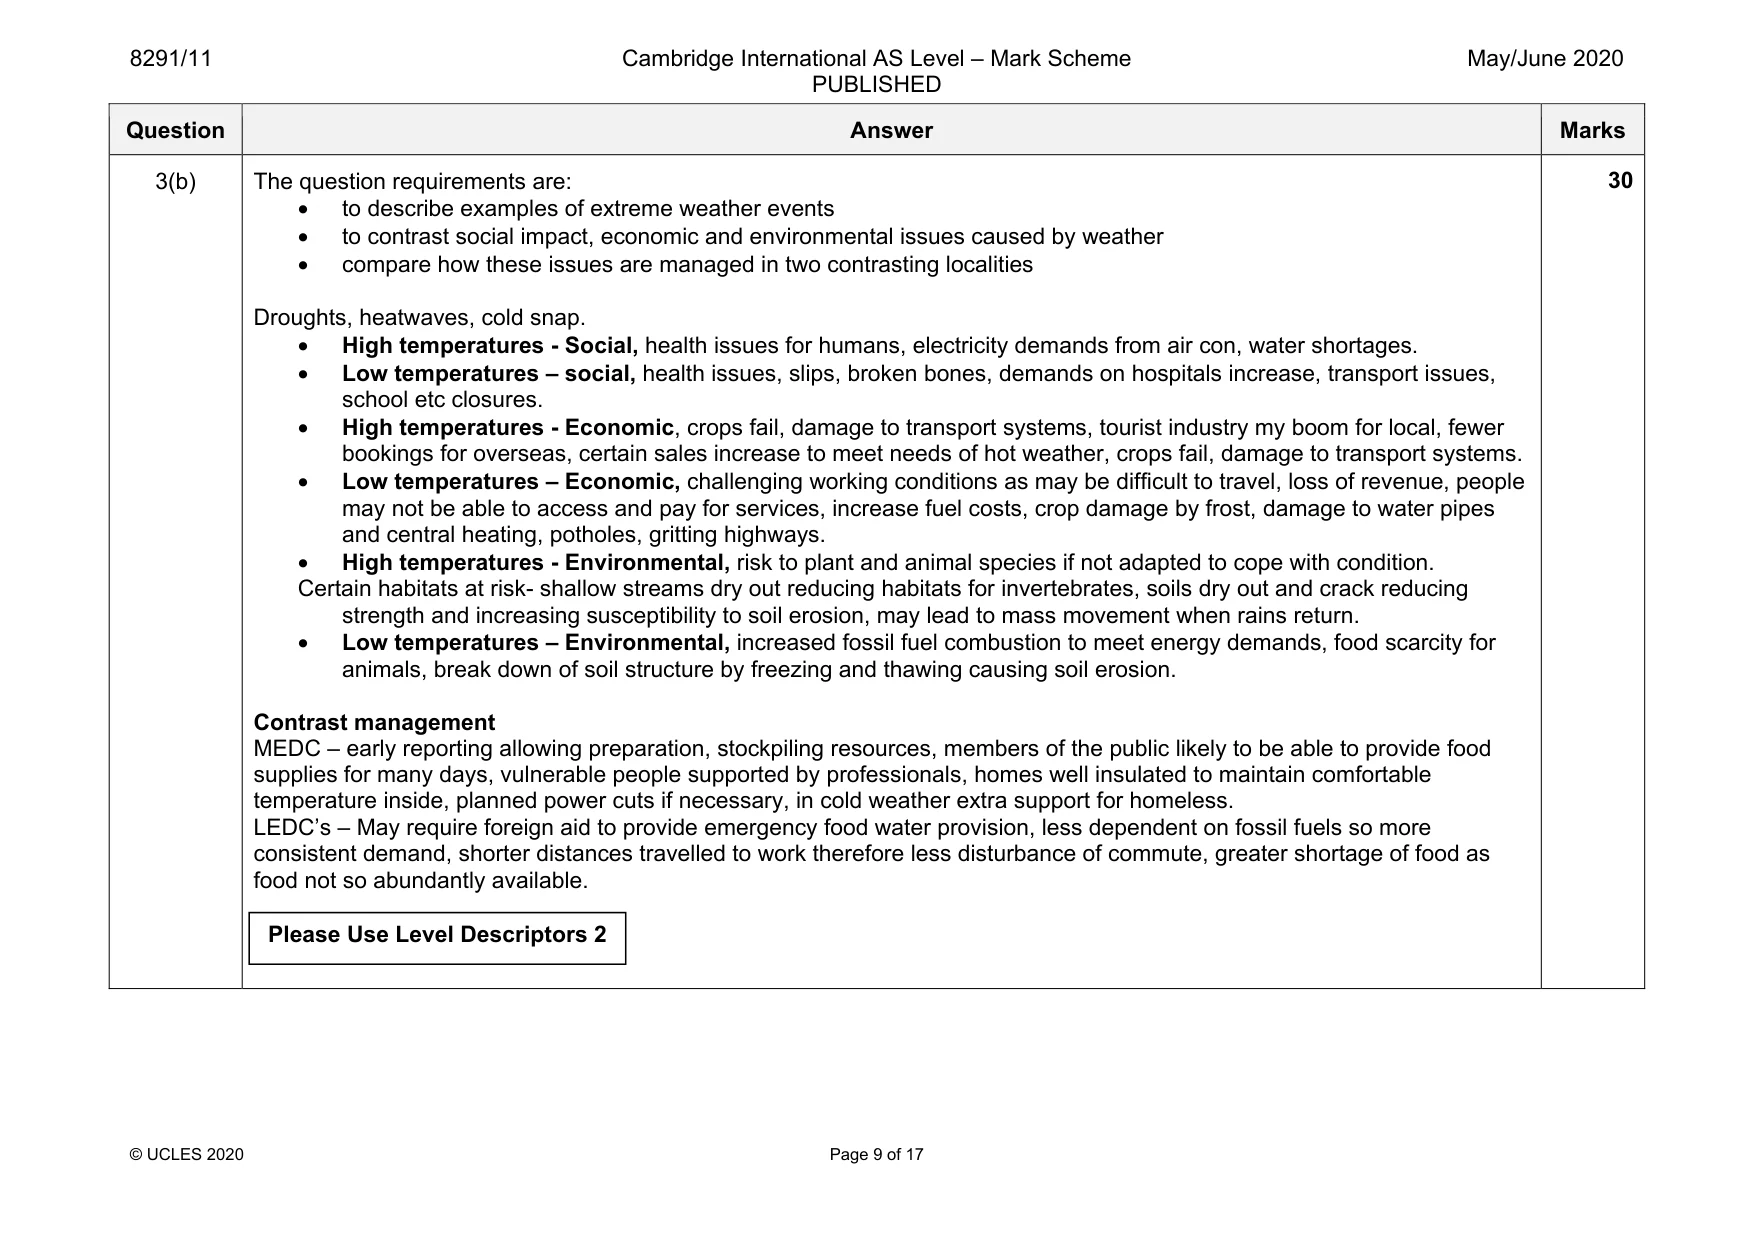
8291/11 Cambridge International AS Level – Mark Scheme PUBLISHED May/June 2020 © UCLES 2020 Page 9 of 17 Question Answer Marks 3(b) The question requirements are: • to describe examples of extreme weather events • to contrast social impact, economic and environmental issues caused by weather • compare how these issues are managed in two contrasting localities Droughts, heatwaves, cold snap. • High temperatures - Social, health issues for humans, electricity demands from air con, water shortages. • Low temperatures – social, health issues, slips, broken bones, demands on hospitals increase, transport issues, school etc closures. • High temperatures - Economic, crops fail, damage to transport systems, tourist industry my boom for local, fewer bookings for overseas, certain sales increase to meet needs of hot weather, crops fail, damage to transport systems. • Low temperatures – Economic, challenging working conditions as may be difficult to travel, loss of revenue, people may not be able to access and pay for services, increase fuel costs, crop damage by frost, damage to water pipes and central heating, potholes, gritting highways. • High temperatures - Environmental, risk to plant and animal species if not adapted to cope with condition. Certain habitats at risk- shallow streams dry out reducing habitats for invertebrates, soils dry out and crack reducing strength and increasing susceptibility to soil erosion, may lead to mass movement when rains return. • Low temperatures – Environmental, increased fossil fuel combustion to meet energy demands, food scarcity for animals, break down of soil structure by freezing and thawing causing soil erosion. Contrast management MEDC – early reporting allowing preparation, stockpiling resources, members of the public likely to be able to provide food supplies for many days, vulnerable people supported by professionals, homes well insulated to maintain comfortable temperature inside, planned power cuts if necessary, in cold weather extra support for homeless. LEDC’s – May require foreign aid to provide emergency food water provision, less dependent on fossil fuels so more consistent demand, shorter distances travelled to work therefore less disturbance of commute, greater shortage of food as food not so abundantly available. 30 Please Use Level Descriptors 2
Mark scheme, page 10
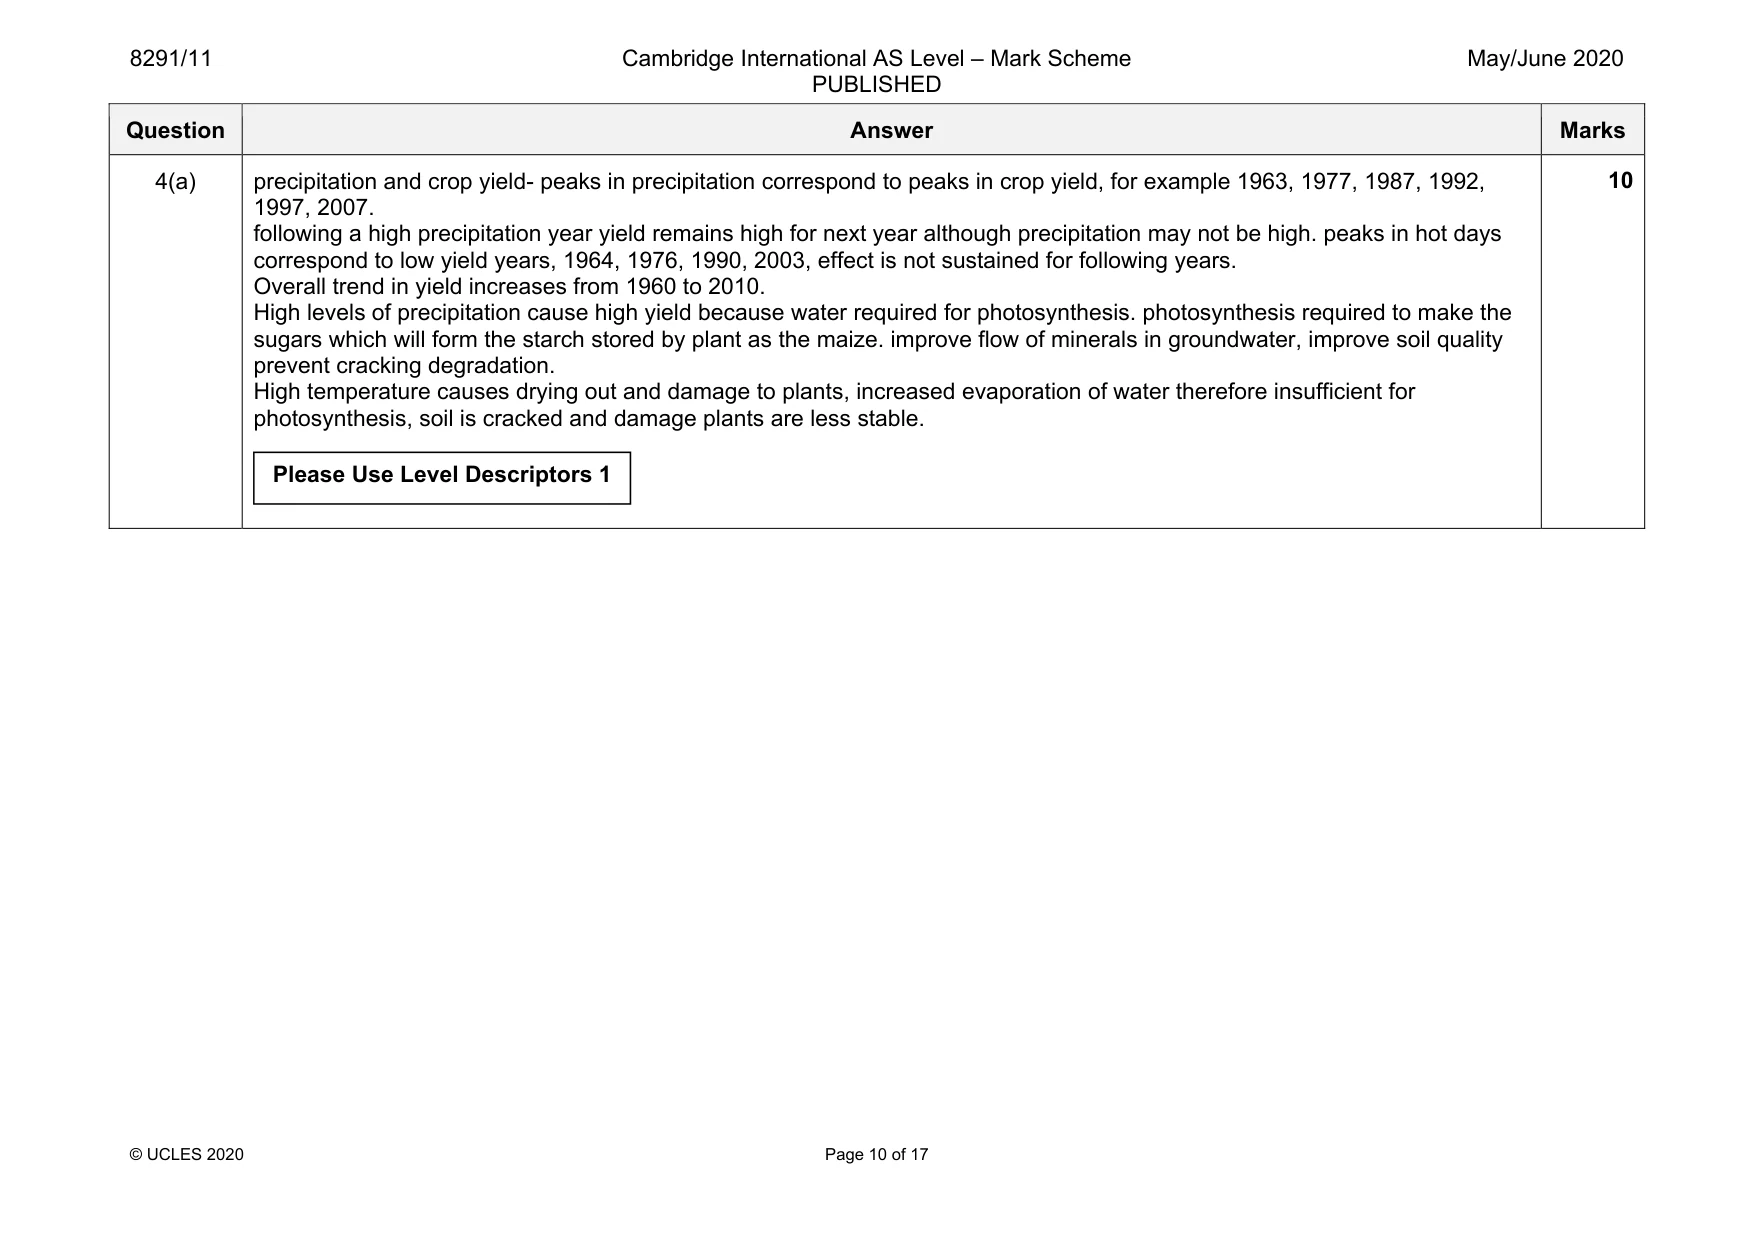
8291/11 Cambridge International AS Level – Mark Scheme PUBLISHED May/June 2020 © UCLES 2020 Page 10 of 17 Question Answer Marks 4(a) precipitation and crop yield- peaks in precipitation correspond to peaks in crop yield, for example 1963, 1977, 1987, 1992, 1997, 2007. following a high precipitation year yield remains high for next year although precipitation may not be high. peaks in hot days correspond to low yield years, 1964, 1976, 1990, 2003, effect is not sustained for following years. Overall trend in yield increases from 1960 to 2010. High levels of precipitation cause high yield because water required for photosynthesis. photosynthesis required to make the sugars which will form the starch stored by plant as the maize. improve flow of minerals in groundwater, improve soil quality prevent cracking degradation. High temperature causes drying out and damage to plants, increased evaporation of water therefore insufficient for photosynthesis, soil is cracked and damage plants are less stable. 10 Please Use Level Descriptors 1
Mark scheme, page 11
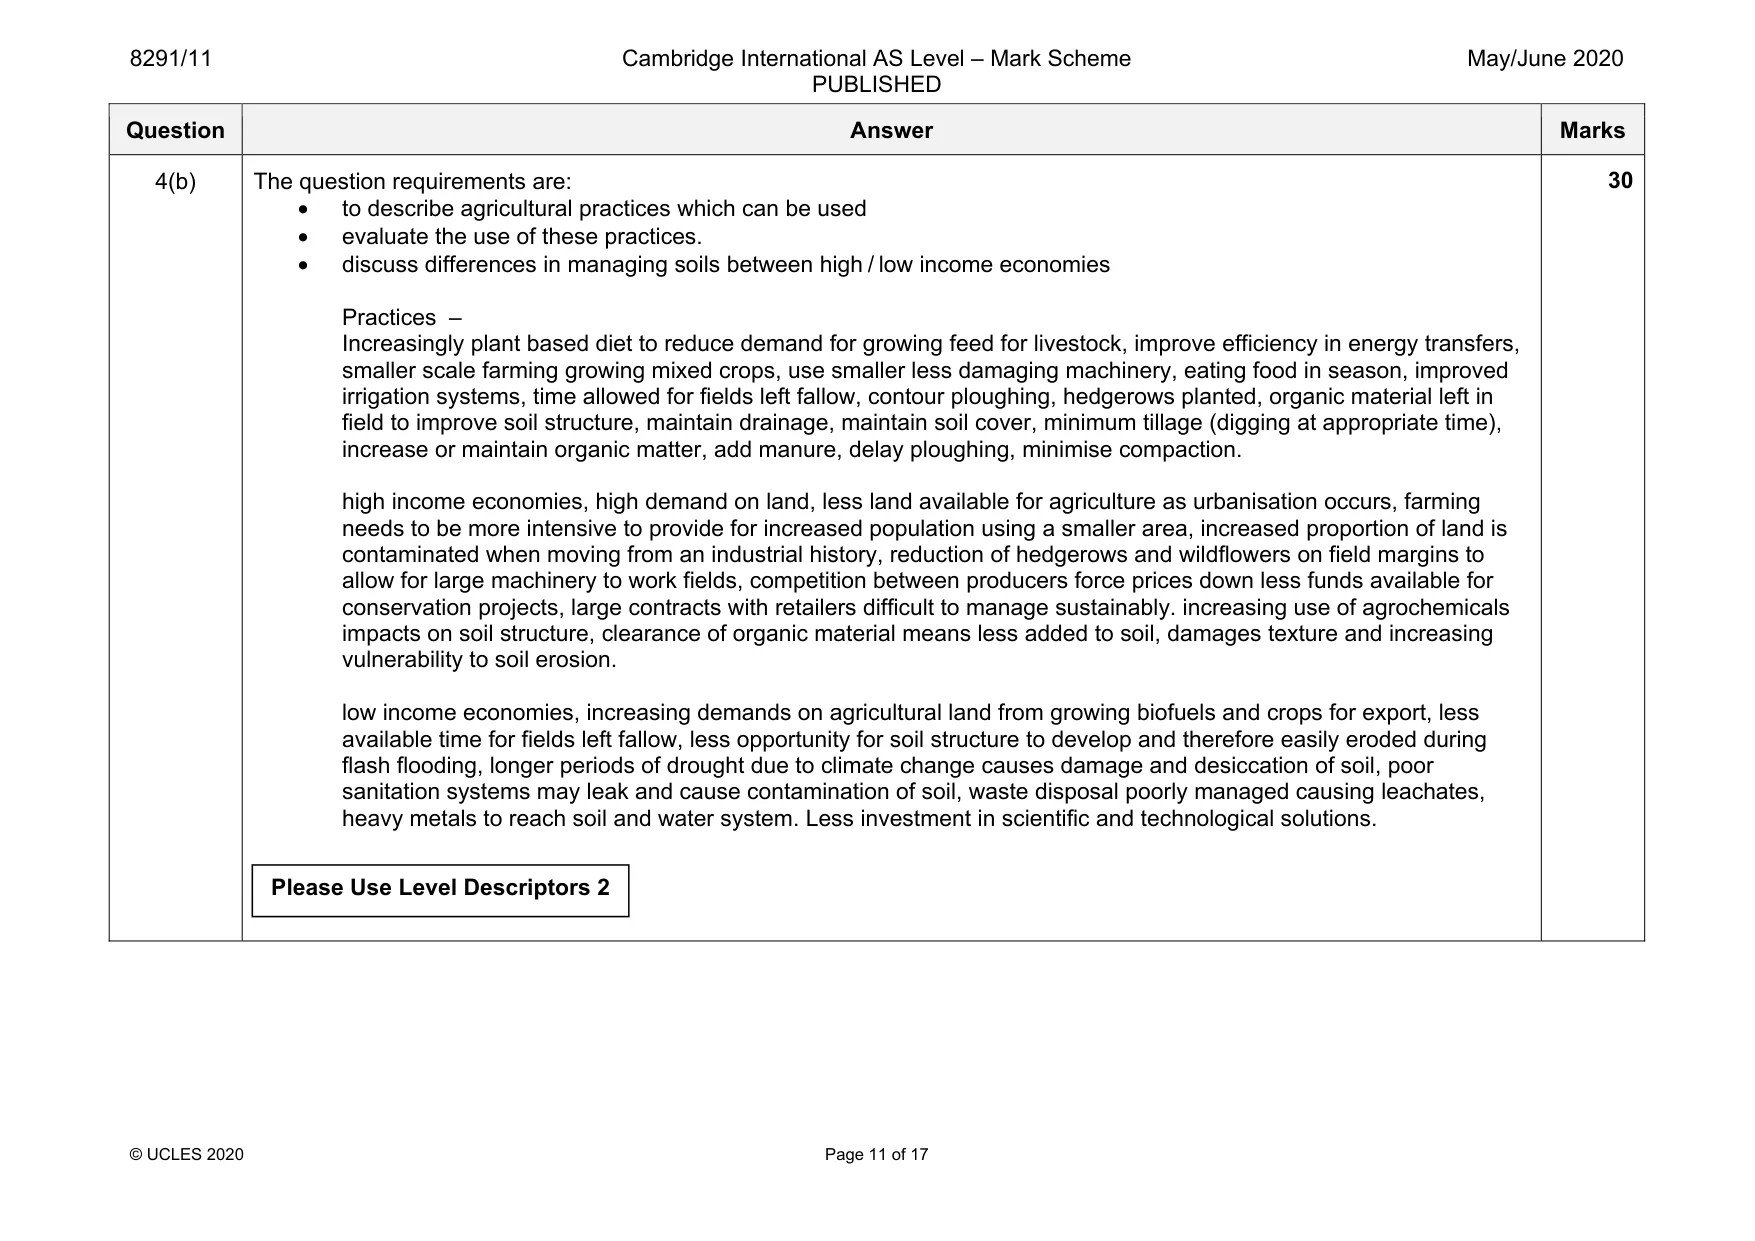
8291/11 Cambridge International AS Level – Mark Scheme PUBLISHED May/June 2020 © UCLES 2020 Page 11 of 17 Question Answer Marks 4(b) The question requirements are: • to describe agricultural practices which can be used • evaluate the use of these practices. • discuss differences in managing soils between high / low income economies Practices – Increasingly plant based diet to reduce demand for growing feed for livestock, improve efficiency in energy transfers, smaller scale farming growing mixed crops, use smaller less damaging machinery, eating food in season, improved irrigation systems, time allowed for fields left fallow, contour ploughing, hedgerows planted, organic material left in field to improve soil structure, maintain drainage, maintain soil cover, minimum tillage (digging at appropriate time), increase or maintain organic matter, add manure, delay ploughing, minimise compaction. high income economies, high demand on land, less land available for agriculture as urbanisation occurs, farming needs to be more intensive to provide for increased population using a smaller area, increased proportion of land is contaminated when moving from an industrial history, reduction of hedgerows and wildflowers on field margins to allow for large machinery to work fields, competition between producers force prices down less funds available for conservation projects, large contracts with retailers difficult to manage sustainably. increasing use of agrochemicals impacts on soil structure, clearance of organic material means less added to soil, damages texture and increasing vulnerability to soil erosion. low income economies, increasing demands on agricultural land from growing biofuels and crops for export, less available time for fields left fallow, less opportunity for soil structure to develop and therefore easily eroded during flash flooding, longer periods of drought due to climate change causes damage and desiccation of soil, poor sanitation systems may leak and cause contamination of soil, waste disposal poorly managed causing leachates, heavy metals to reach soil and water system. Less investment in scientific and technological solutions. 30 Please Use Level Descriptors 2
Mark scheme, page 12
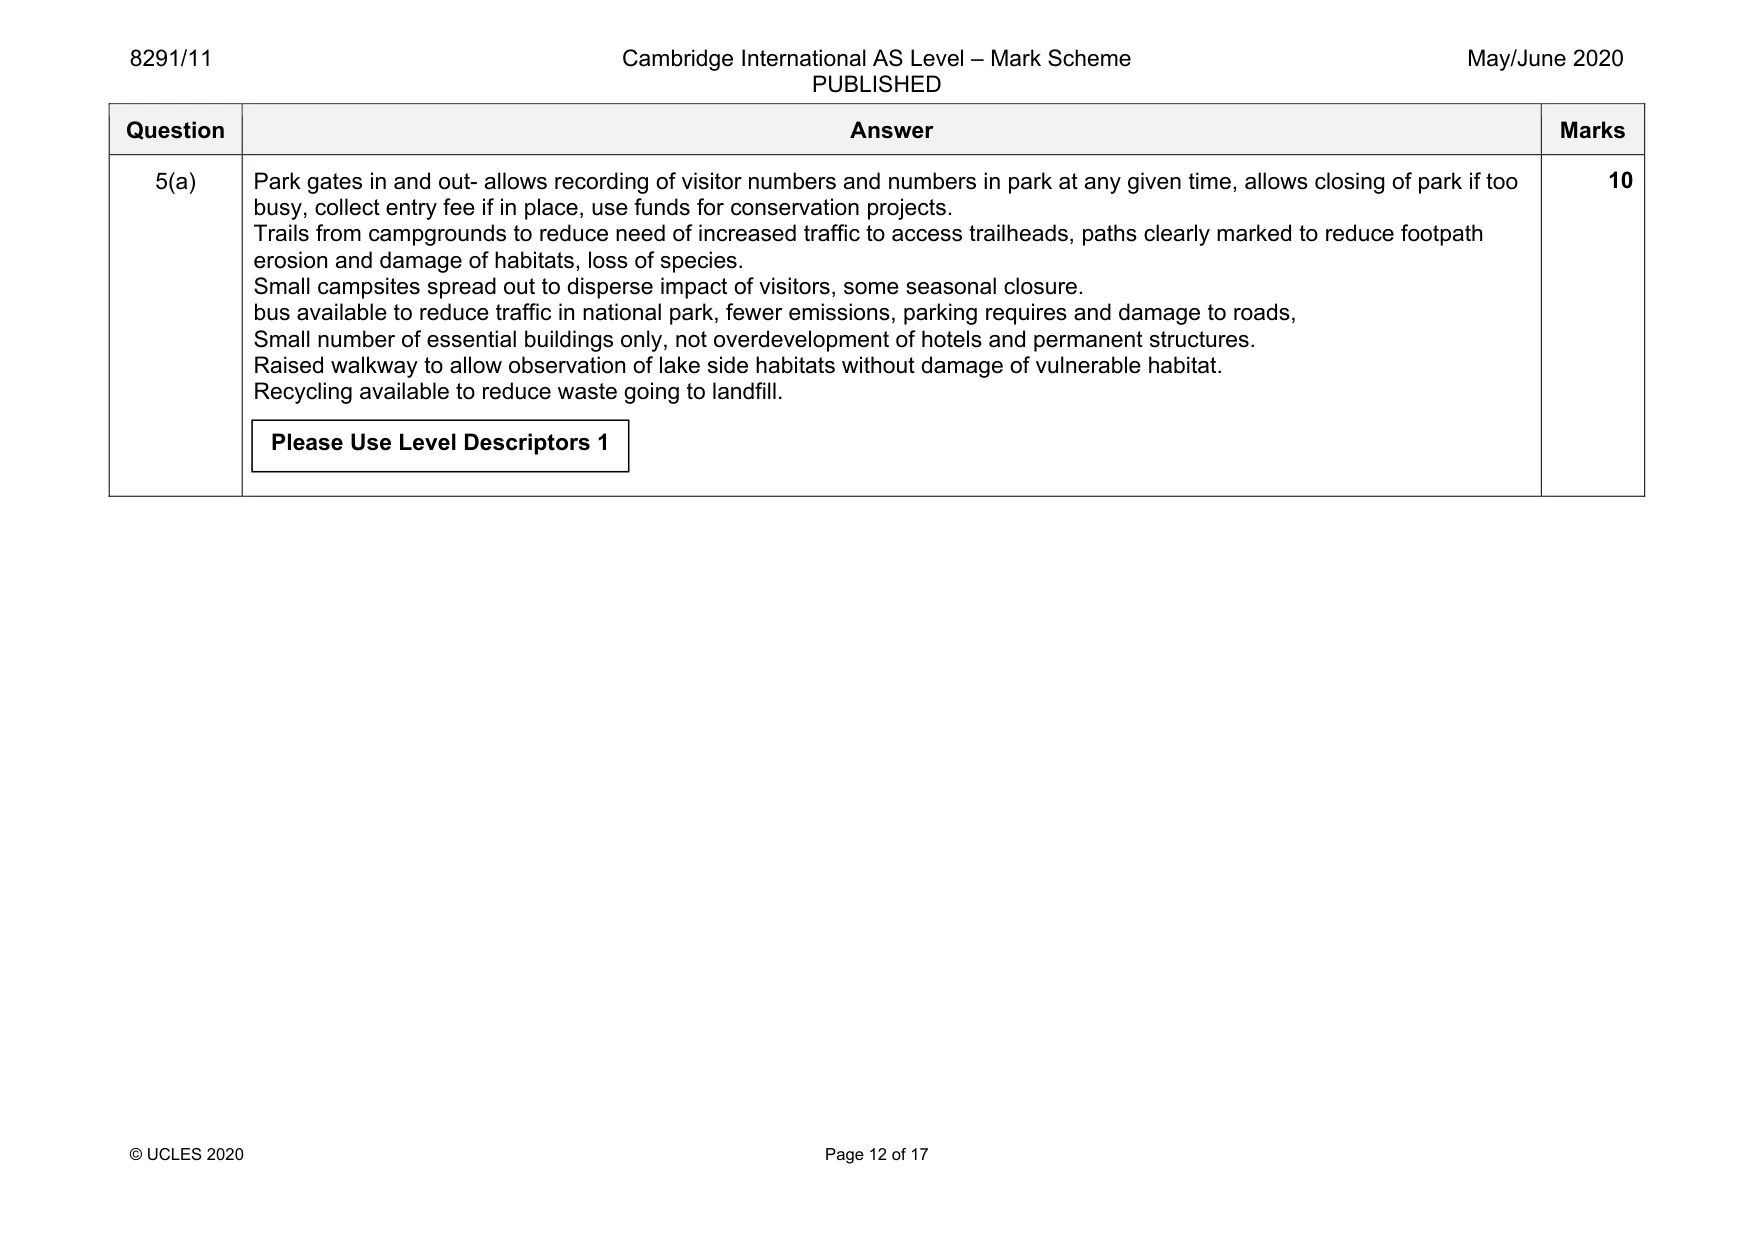
8291/11 Cambridge International AS Level – Mark Scheme PUBLISHED May/June 2020 © UCLES 2020 Page 12 of 17 Question Answer Marks 5(a) Park gates in and out- allows recording of visitor numbers and numbers in park at any given time, allows closing of park if too busy, collect entry fee if in place, use funds for conservation projects. Trails from campgrounds to reduce need of increased traffic to access trailheads, paths clearly marked to reduce footpath erosion and damage of habitats, loss of species. Small campsites spread out to disperse impact of visitors, some seasonal closure. bus available to reduce traffic in national park, fewer emissions, parking requires and damage to roads, Small number of essential buildings only, not overdevelopment of hotels and permanent structures. Raised walkway to allow observation of lake side habitats without damage of vulnerable habitat. Recycling available to reduce waste going to landfill. 10 Please Use Level Descriptors 1
Mark scheme, page 13
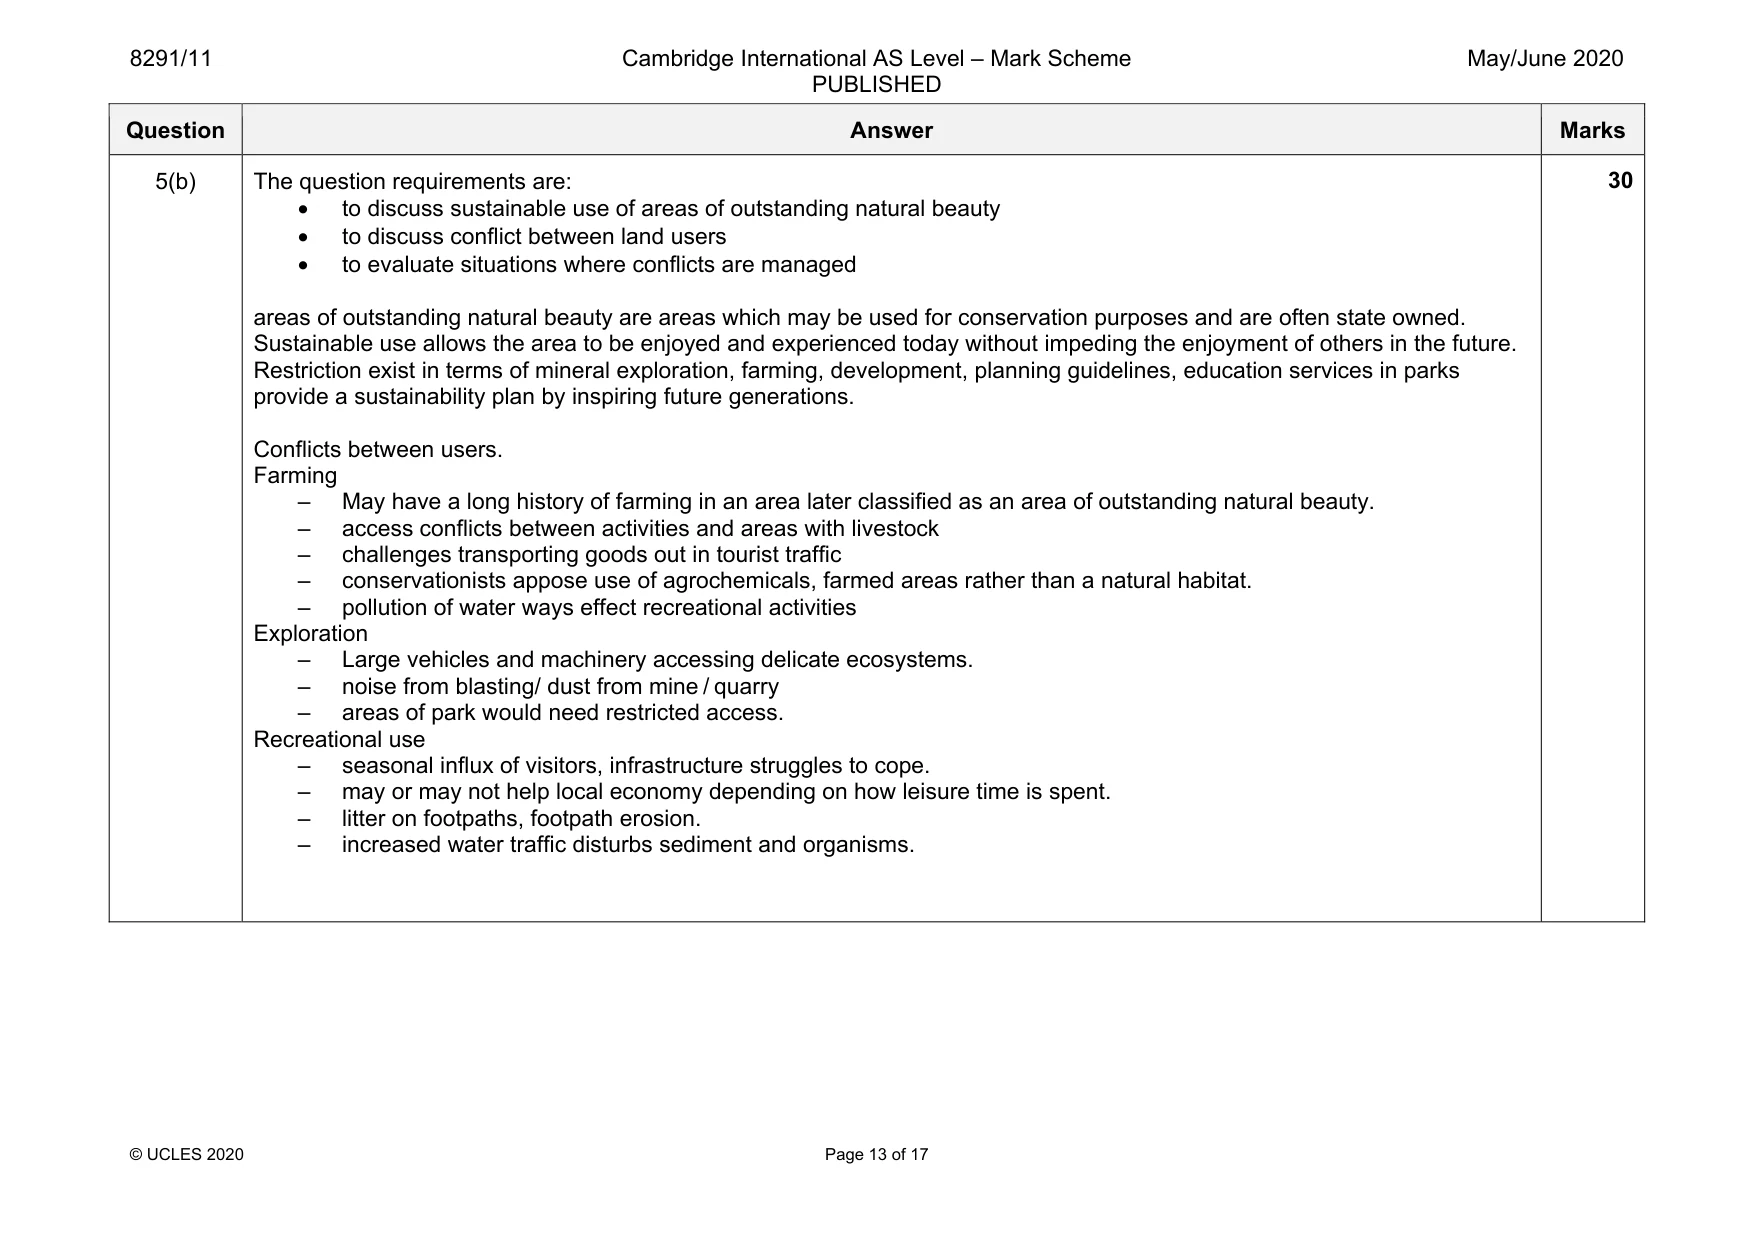
8291/11 Cambridge International AS Level – Mark Scheme PUBLISHED May/June 2020 © UCLES 2020 Page 13 of 17 Question Answer Marks 5(b) The question requirements are: • to discuss sustainable use of areas of outstanding natural beauty • to discuss conflict between land users • to evaluate situations where conflicts are managed areas of outstanding natural beauty are areas which may be used for conservation purposes and are often state owned. Sustainable use allows the area to be enjoyed and experienced today without impeding the enjoyment of others in the future. Restriction exist in terms of mineral exploration, farming, development, planning guidelines, education services in parks provide a sustainability plan by inspiring future generations. Conflicts between users. Farming – May have a long history of farming in an area later classified as an area of outstanding natural beauty. – access conflicts between activities and areas with livestock – challenges transporting goods out in tourist traffic – conservationists appose use of agrochemicals, farmed areas rather than a natural habitat. – pollution of water ways effect recreational activities Exploration – Large vehicles and machinery accessing delicate ecosystems. – noise from blasting/ dust from mine / quarry – areas of park would need restricted access. Recreational use – seasonal influx of visitors, infrastructure struggles to cope. – may or may not help local economy depending on how leisure time is spent. – litter on footpaths, footpath erosion. – increased water traffic disturbs sediment and organisms. 30
Mark scheme, page 14
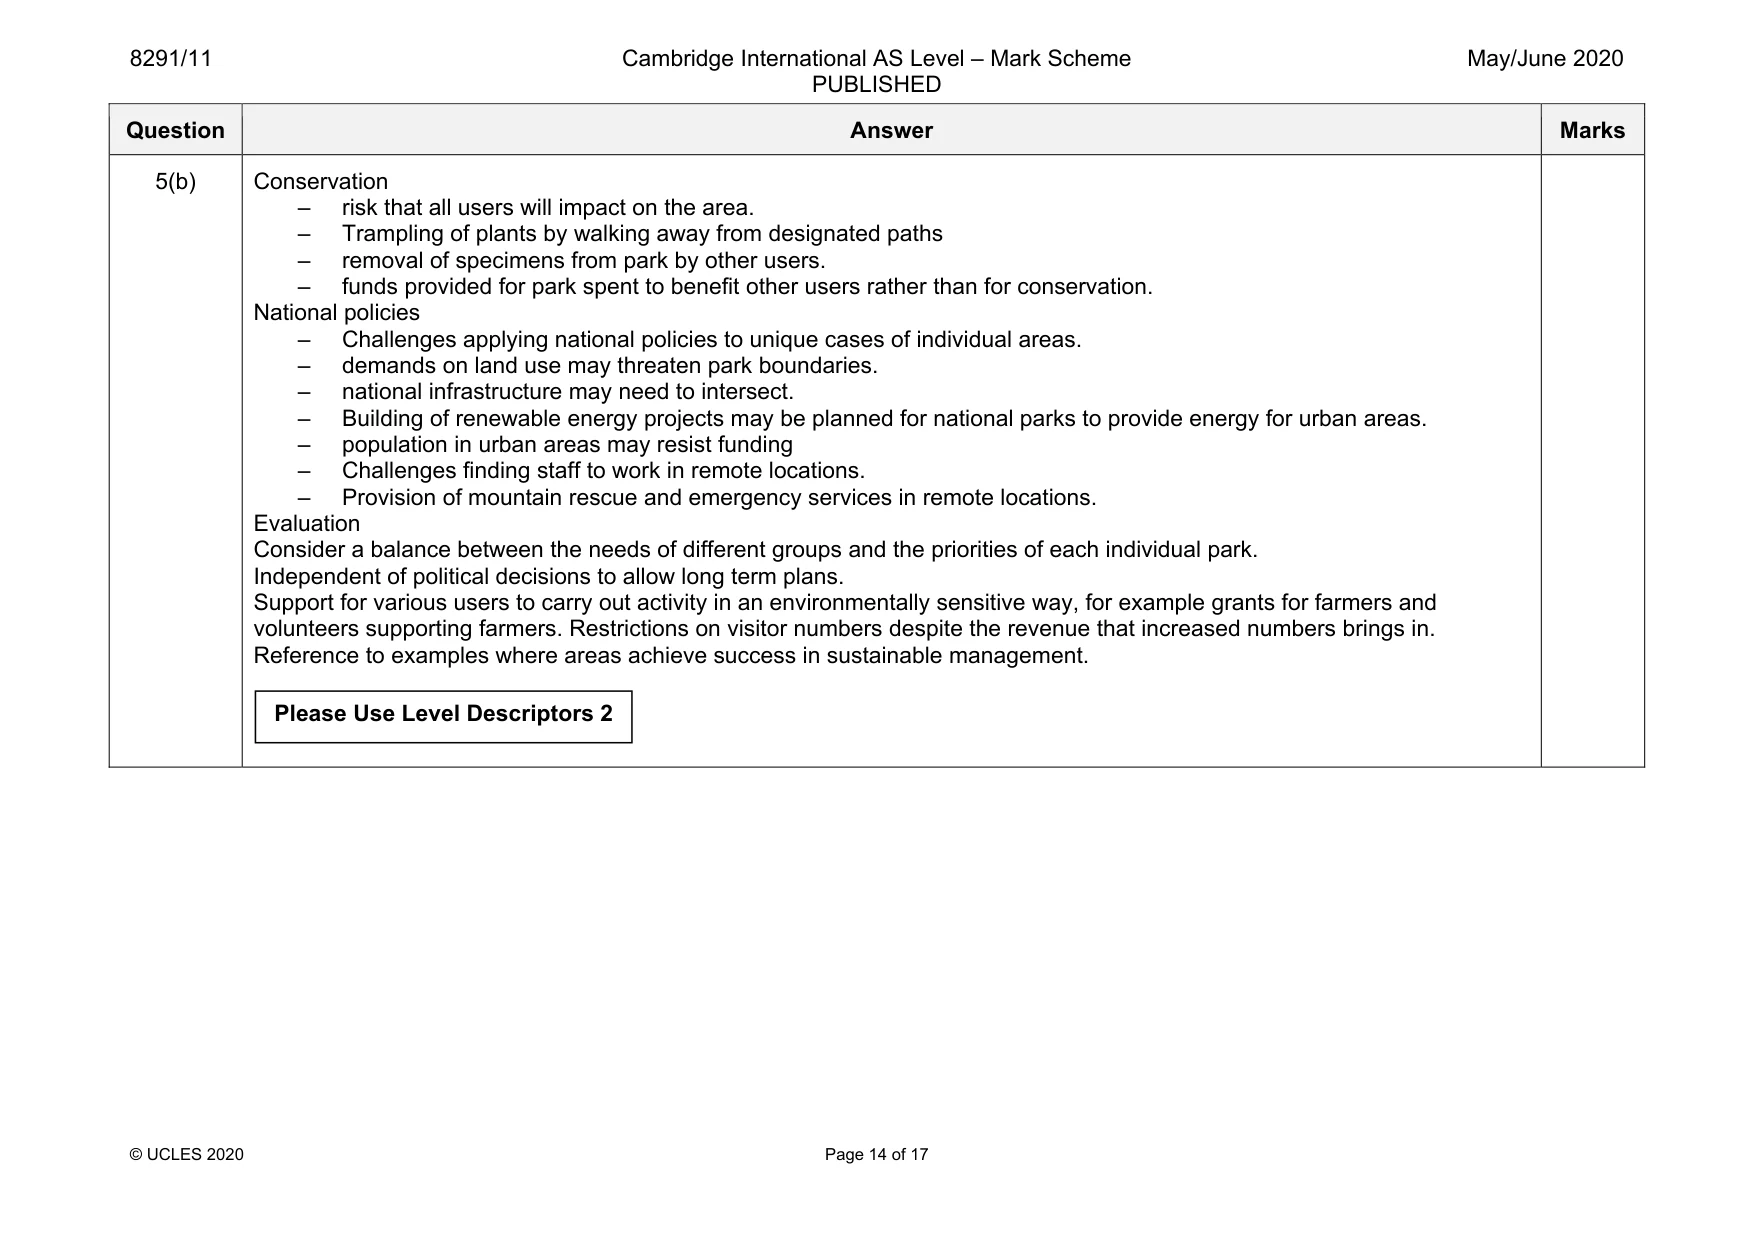
8291/11 Cambridge International AS Level – Mark Scheme PUBLISHED May/June 2020 © UCLES 2020 Page 14 of 17 Question Answer Marks 5(b) Conservation – risk that all users will impact on the area. – Trampling of plants by walking away from designated paths – removal of specimens from park by other users. – funds provided for park spent to benefit other users rather than for conservation. National policies – Challenges applying national policies to unique cases of individual areas. – demands on land use may threaten park boundaries. – national infrastructure may need to intersect. – Building of renewable energy projects may be planned for national parks to provide energy for urban areas. – population in urban areas may resist funding – Challenges finding staff to work in remote locations. – Provision of mountain rescue and emergency services in remote locations. Evaluation Consider a balance between the needs of different groups and the priorities of each individual park. Independent of political decisions to allow long term plans. Support for various users to carry out activity in an environmentally sensitive way, for example grants for farmers and volunteers supporting farmers. Restrictions on visitor numbers despite the revenue that increased numbers brings in. Reference to examples where areas achieve success in sustainable management. Please Use Level Descriptors 2
Mark scheme, page 15
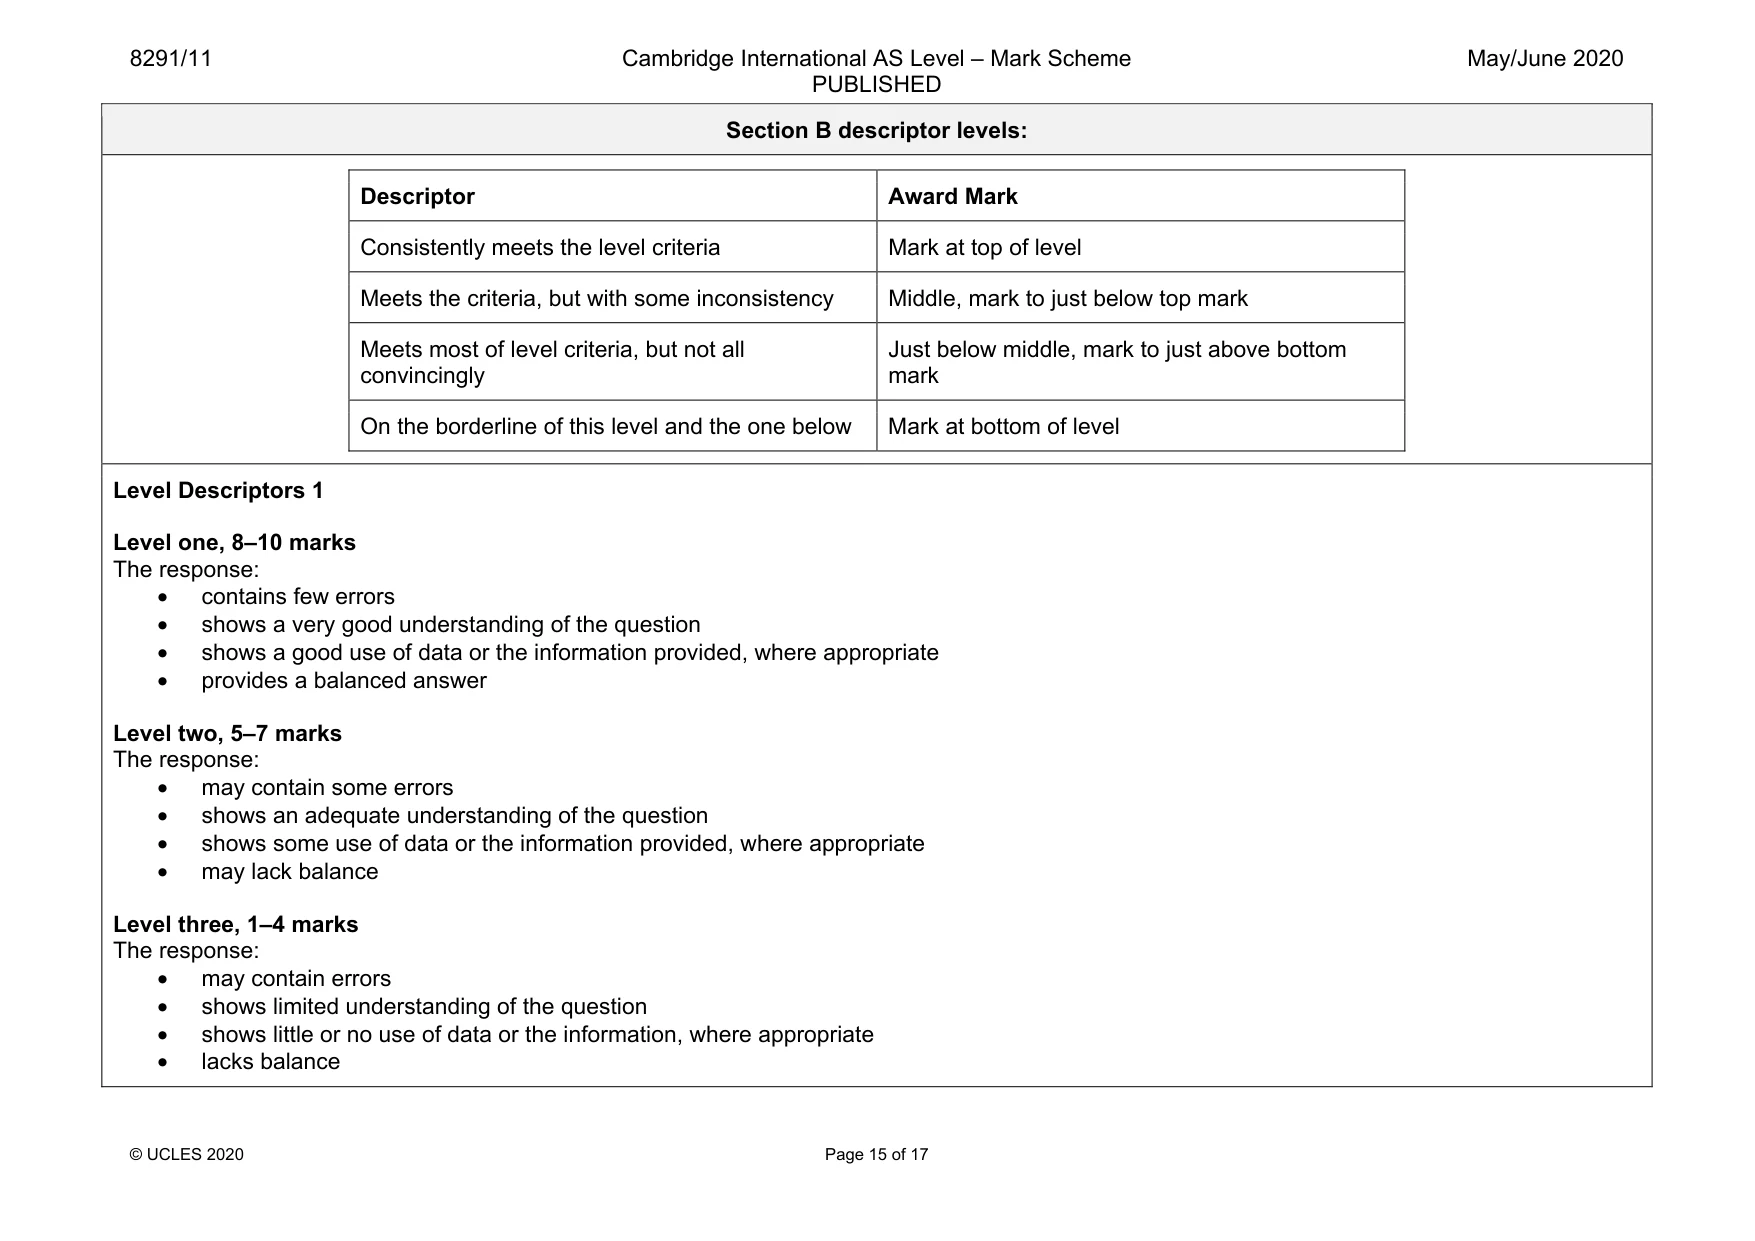
8291/11 Cambridge International AS Level – Mark Scheme PUBLISHED May/June 2020 © UCLES 2020 Page 15 of 17 Section B descriptor levels: Descriptor Award Mark Consistently meets the level criteria Mark at top of level Meets the criteria, but with some inconsistency Middle, mark to just below top mark Meets most of level criteria, but not all convincingly Just below middle, mark to just above bottom mark On the borderline of this level and the one below Mark at bottom of level Level Descriptors 1 Level one, 8–10 marks The response: • contains few errors • shows a very good understanding of the question • shows a good use of data or the information provided, where appropriate • provides a balanced answer Level two, 5–7 marks The response: • may contain some errors • shows an adequate understanding of the question • shows some use of data or the information provided, where appropriate • may lack balance Level three, 1–4 marks The response: • may contain errors • shows limited understanding of the question • shows little or no use of data or the information, where appropriate • lacks balance
Mark scheme, page 16
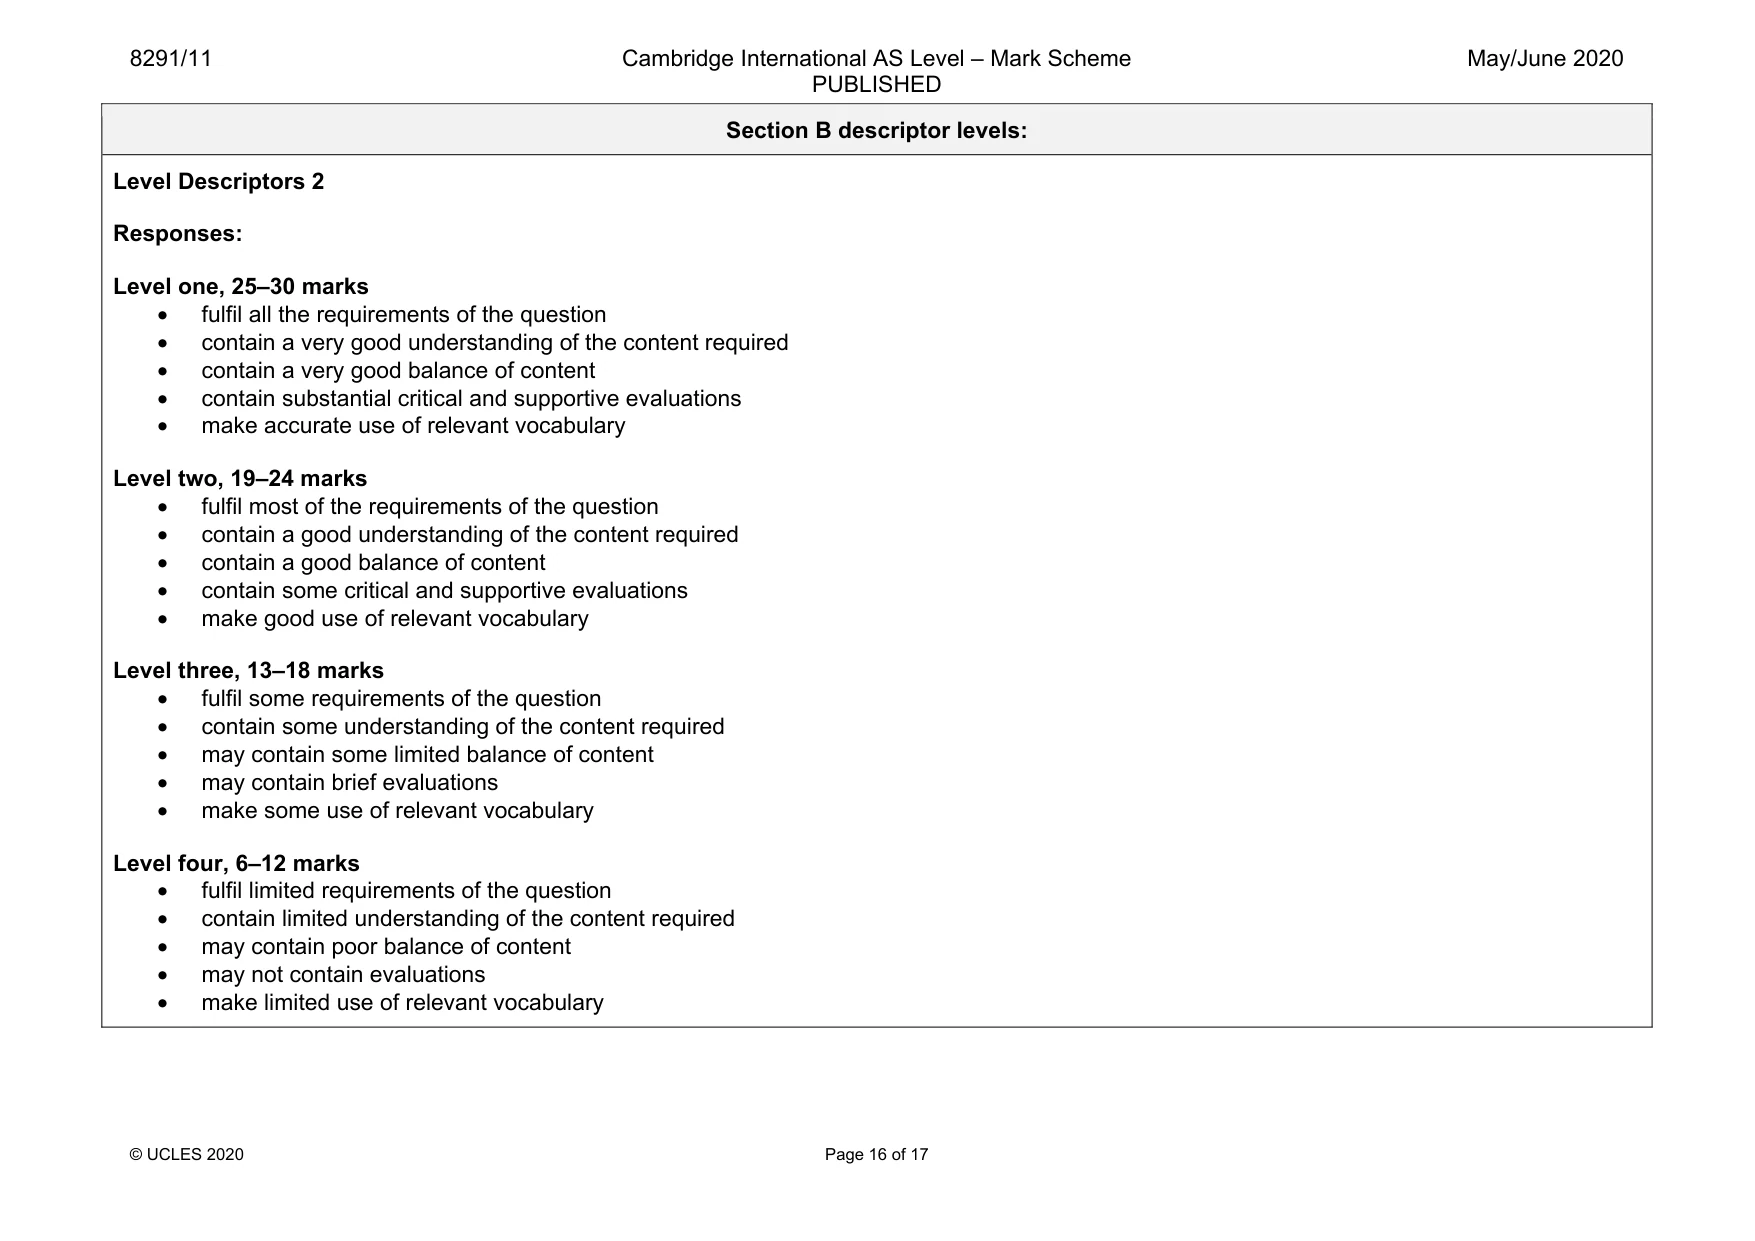
8291/11 Cambridge International AS Level – Mark Scheme PUBLISHED May/June 2020 © UCLES 2020 Page 16 of 17 Section B descriptor levels: Level Descriptors 2 Responses: Level one, 25–30 marks • fulfil all the requirements of the question • contain a very good understanding of the content required • contain a very good balance of content • contain substantial critical and supportive evaluations • make accurate use of relevant vocabulary Level two, 19–24 marks • fulfil most of the requirements of the question • contain a good understanding of the content required • contain a good balance of content • contain some critical and supportive evaluations • make good use of relevant vocabulary Level three, 13–18 marks • fulfil some requirements of the question • contain some understanding of the content required • may contain some limited balance of content • may contain brief evaluations • make some use of relevant vocabulary Level four, 6–12 marks • fulfil limited requirements of the question • contain limited understanding of the content required • may contain poor balance of content • may not contain evaluations • make limited use of relevant vocabulary
Mark scheme, page 17
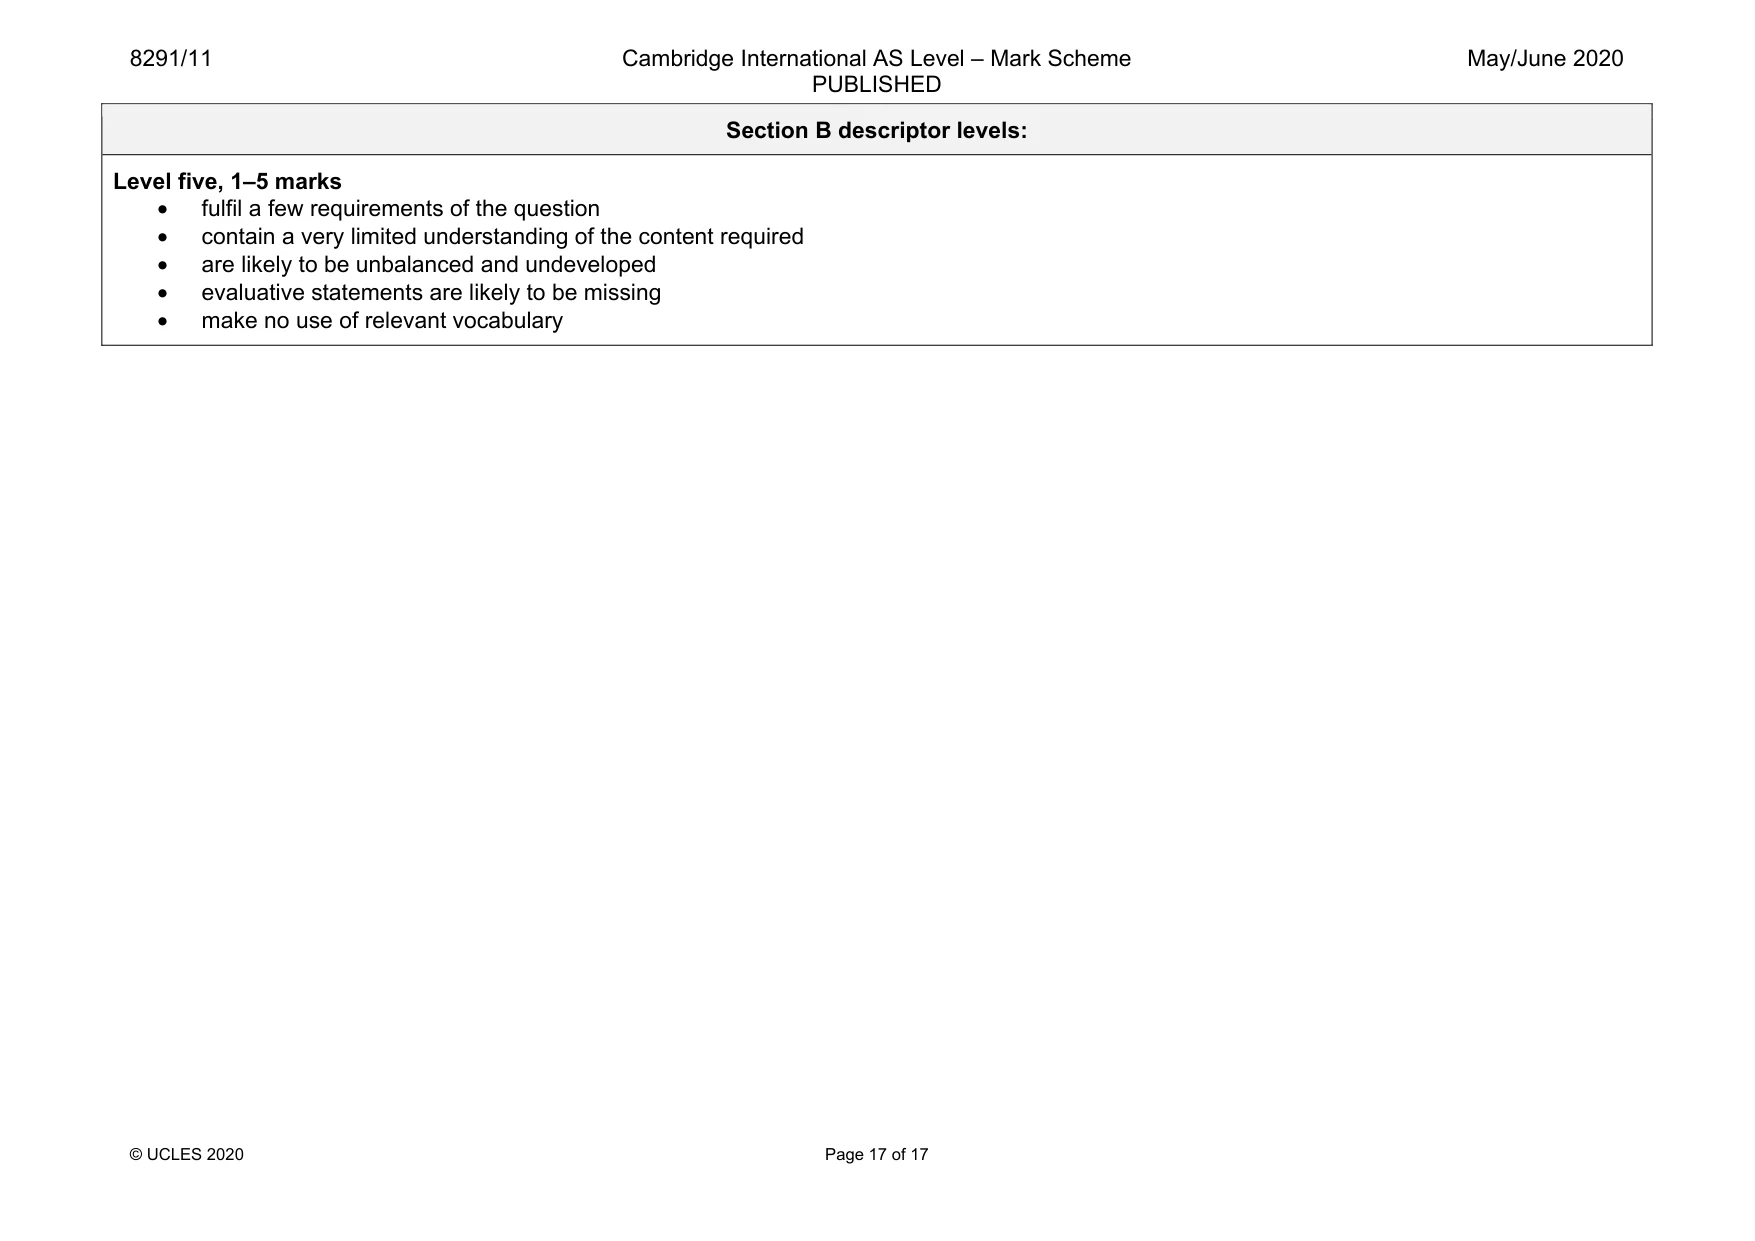
8291/11 Cambridge International AS Level – Mark Scheme PUBLISHED May/June 2020 © UCLES 2020 Page 17 of 17 Section B descriptor levels: Level five, 1–5 marks • fulfil a few requirements of the question • contain a very limited understanding of the content required • are likely to be unbalanced and undeveloped • evaluative statements are likely to be missing • make no use of relevant vocabulary