Cambridge A Level Environmental Management (AS only) 8291 — 2019 Oct/Nov Paper 1 · Variant 1
8291/11/O/N/19 · 80 marks · ≈90 min
The question paper and its mark scheme, free to read here and free to download. This is Cambridge’s own paper, exactly as it was sat.
Question paper12 pages


Mark scheme16 pages
Answers below. Sit the paper first if you are practising.
Paper as text
Question paper, page 1
This document consists of 10 printed pages and 2 blank pages. DC (LEG/SG) 166730/5 © UCLES 2019 [Turn over * 8 0 8 8 5 5 7 9 8 9 * ENVIRONMENTAL MANAGEMENT 8291/11 Paper 1 Lithosphere and Atmosphere October/November 2019 1 hour 30 minutes Additional Materials: Answer Booklet/Paper READ THESE INSTRUCTIONS FIRST Write your centre number, candidate number and name on all the work you hand in. Write in dark blue or black pen. You may use an HB pencil for any diagrams or graphs. Do not use staples, paper clips, glue or correction fluid. DO NOT WRITE IN ANY BARCODES. Electronic calculators may be used. You may lose marks if you do not show your working or if you do not use appropriate units. Section A Answer all questions in this section. Write your answers in the spaces provided on the question paper. Section B Answer one question from this section. Write your answers on the separate answer paper provided. At the end of the examination, 1. fasten all separate answer paper securely to the question paper; 2. enter the question number from Section B in the grid. Cambridge Assessment International Education Cambridge International Advanced Subsidiary Level For Examiner’s Use Section A 1 2 Section B Total
Question paper, page 2
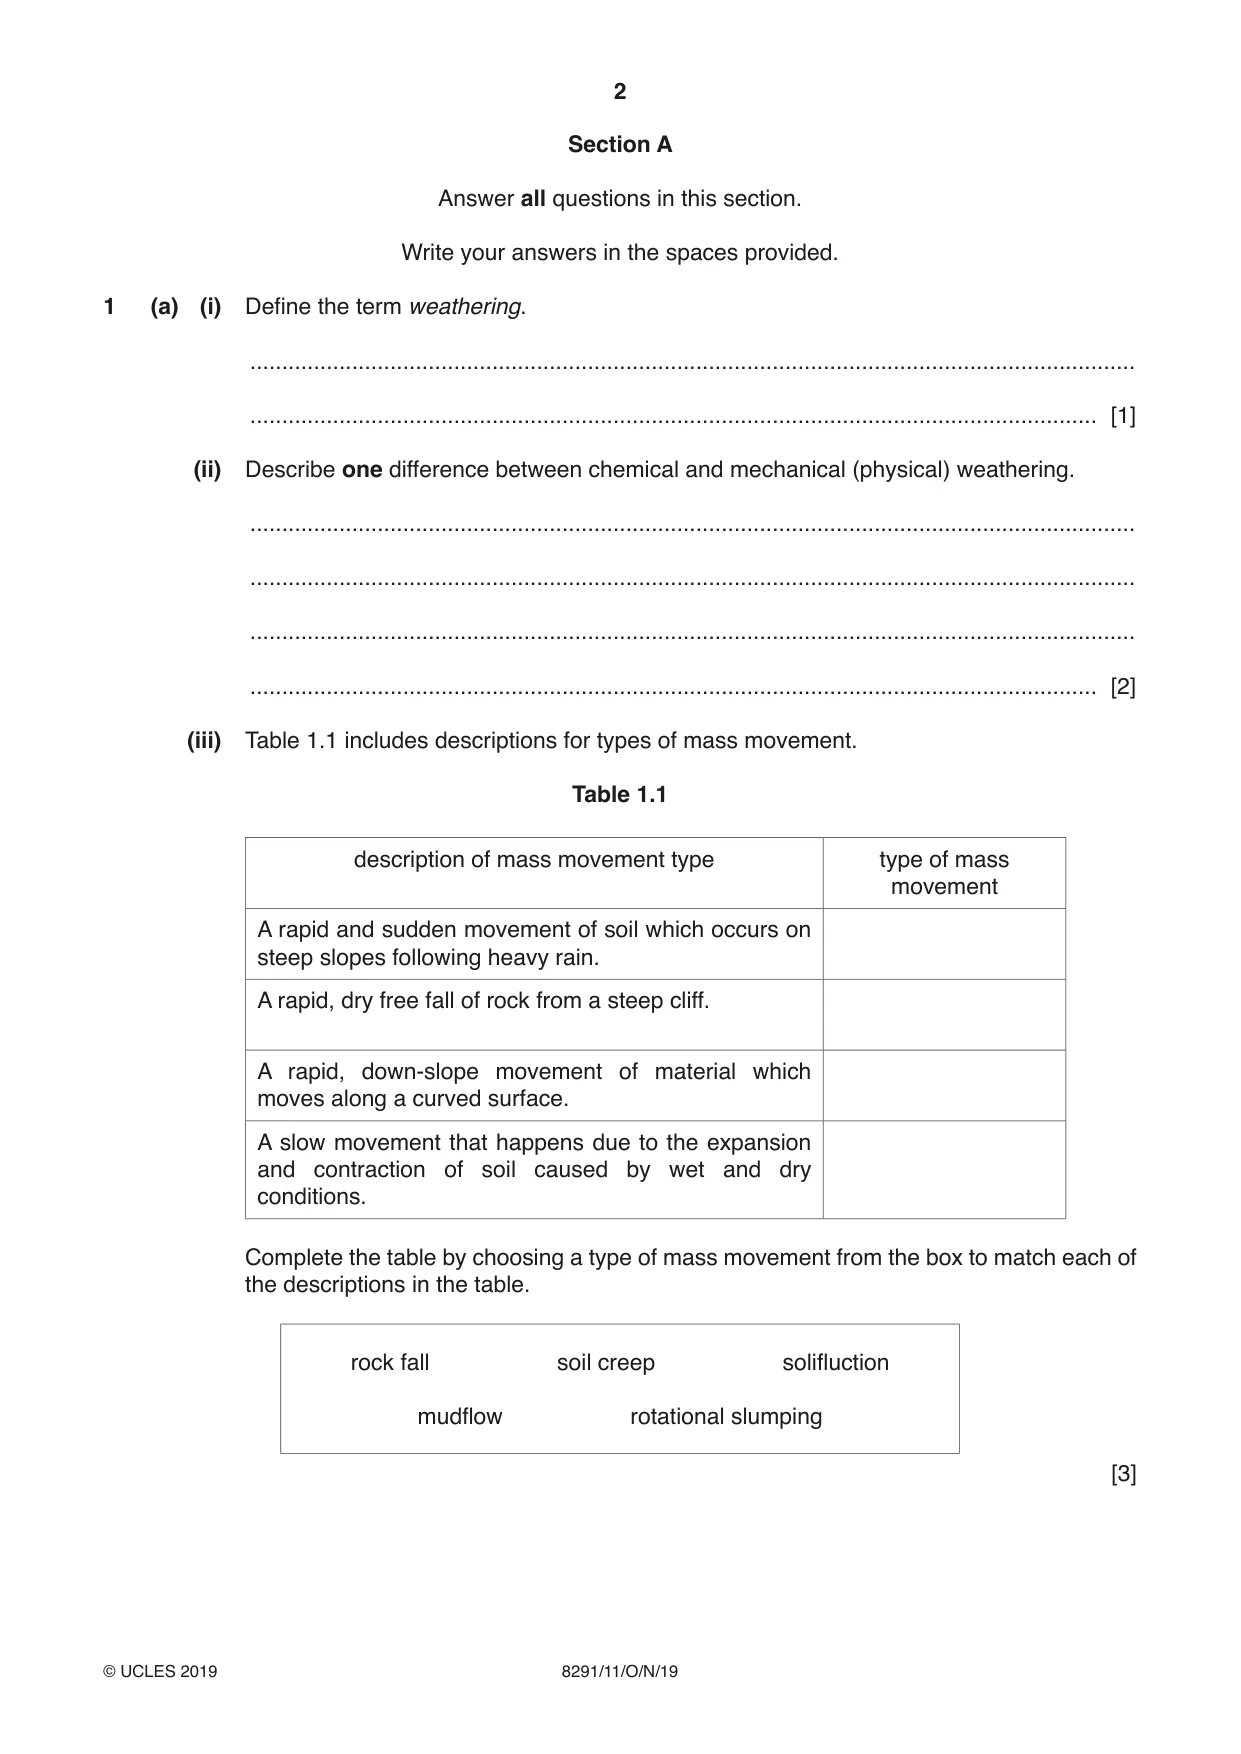
2 8291/11/O/N/19 © UCLES 2019 Section A Answer all questions in this section. Write your answers in the spaces provided. 1 (a) (i) Define the term weathering. … … [1] (ii) Describe one difference between chemical and mechanical (physical) weathering. … … … … [2] (iii) Table 1.1 includes descriptions for types of mass movement. Table 1.1 description of mass movement type type of mass movement A rapid and sudden movement of soil which occurs on steep slopes following heavy rain. A rapid, dry free fall of rock from a steep cliff. A rapid, down-slope movement of material which moves along a curved surface. A slow movement that happens due to the expansion and contraction of soil caused by wet and dry conditions. Complete the table by choosing a type of mass movement from the box to match each of the descriptions in the table. rock fall soil creep solifluction mudflow rotational slumping [3]
Question paper, page 3
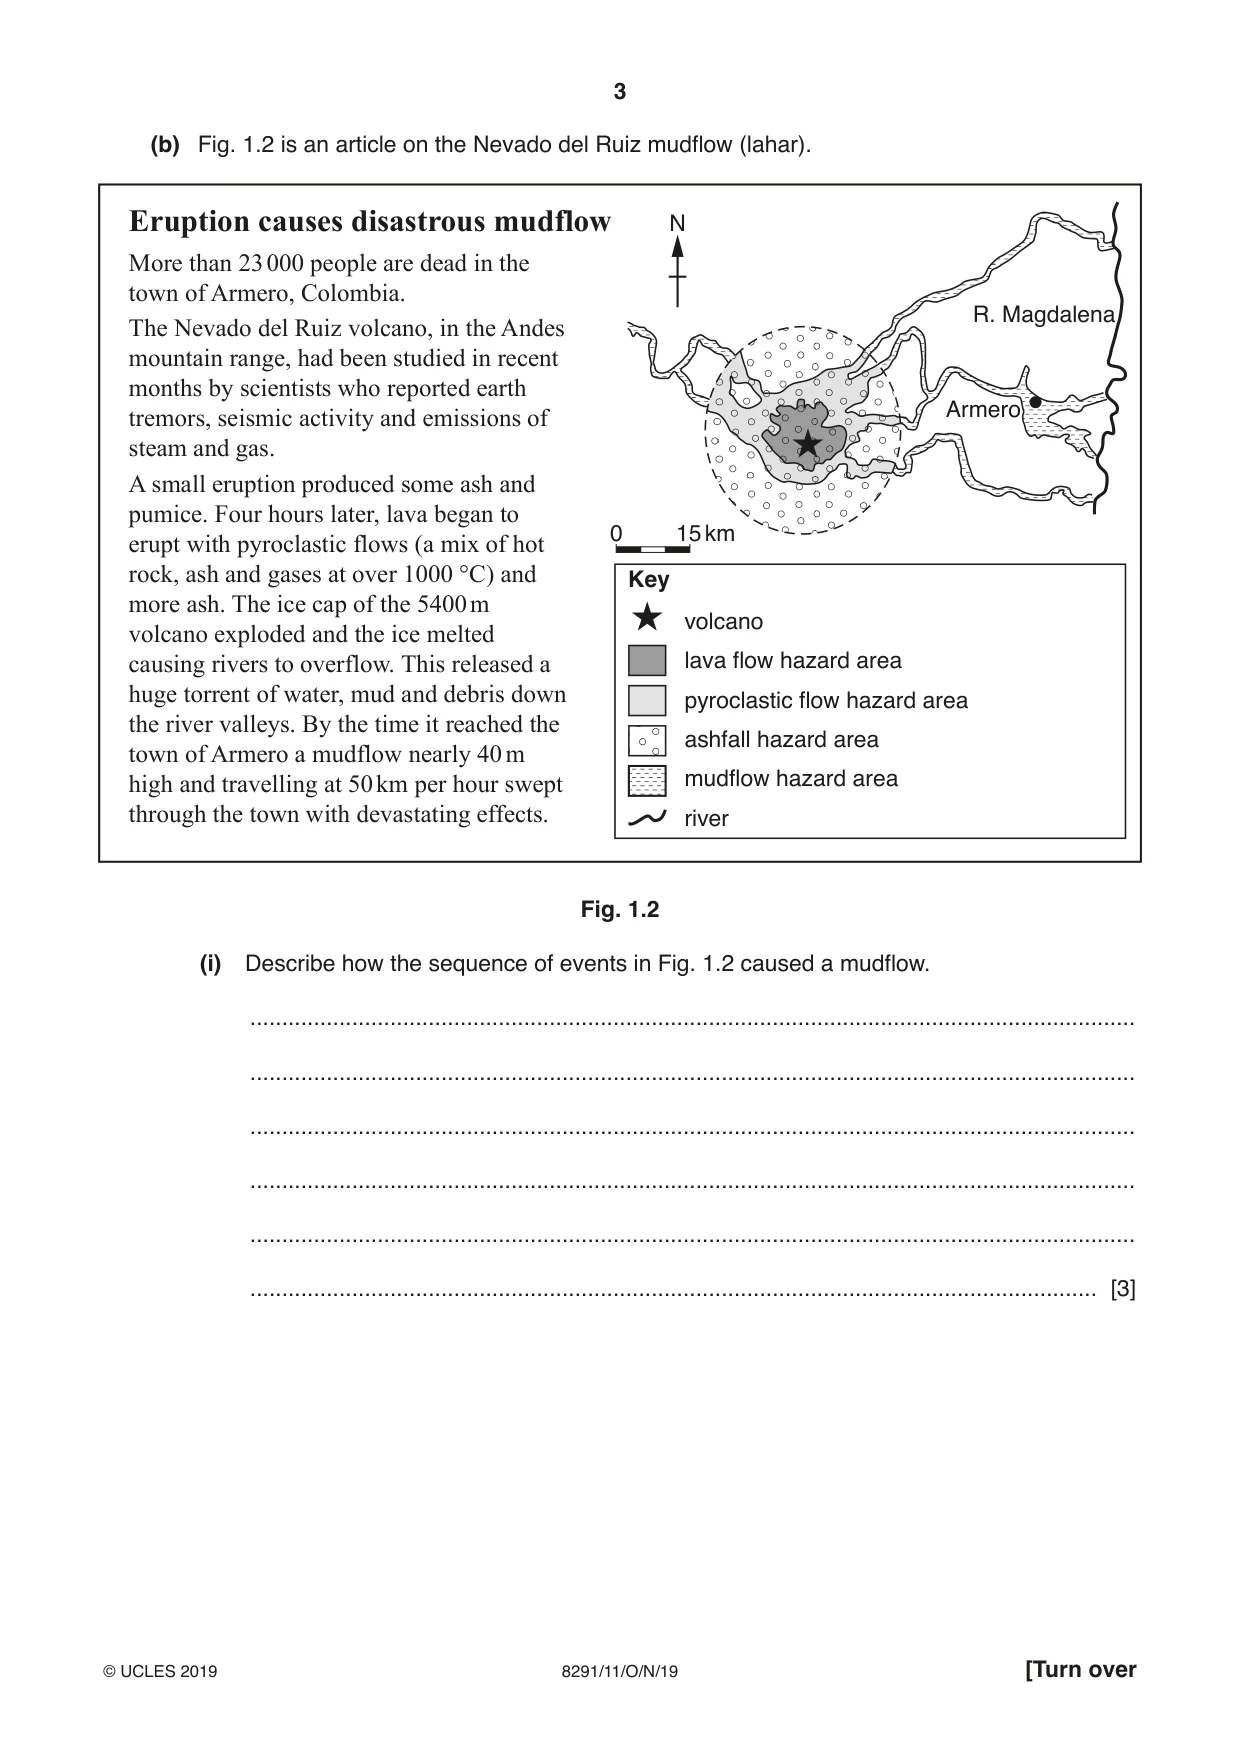
3 8291/11/O/N/19 © UCLES 2019 [Turn over (b) Fig. 1.2 is an article on the Nevado del Ruiz mudflow (lahar). Eruption causes disastrous mudflow More than 23 000 people are dead in the town of Armero, Colombia. The Nevado del Ruiz volcano, in the Andes mountain range, had been studied in recent months by scientists who reported earth tremors, seismic activity and emissions of steam and gas. A small eruption produced some ash and pumice. Four hours later, lava began to erupt with pyroclastic flows (a mix of hot rock, ash and gases at over 1000 °C) and more ash. The ice cap of the 5400 m volcano exploded and the ice melted causing rivers to overflow. This released a huge torrent of water, mud and debris down the river valleys. By the time it reached the town of Armero a mudflow nearly 40 m high and travelling at 50 km per hour swept through the town with devastating effects. Armero R. Magdalena 0 15 km Key volcano lava flow hazard area pyroclastic flow hazard area ashfall hazard area mudflow hazard area river N Fig. 1.2 (i) Describe how the sequence of events in Fig. 1.2 caused a mudflow. … … … … … … [3]
Question paper, page 4
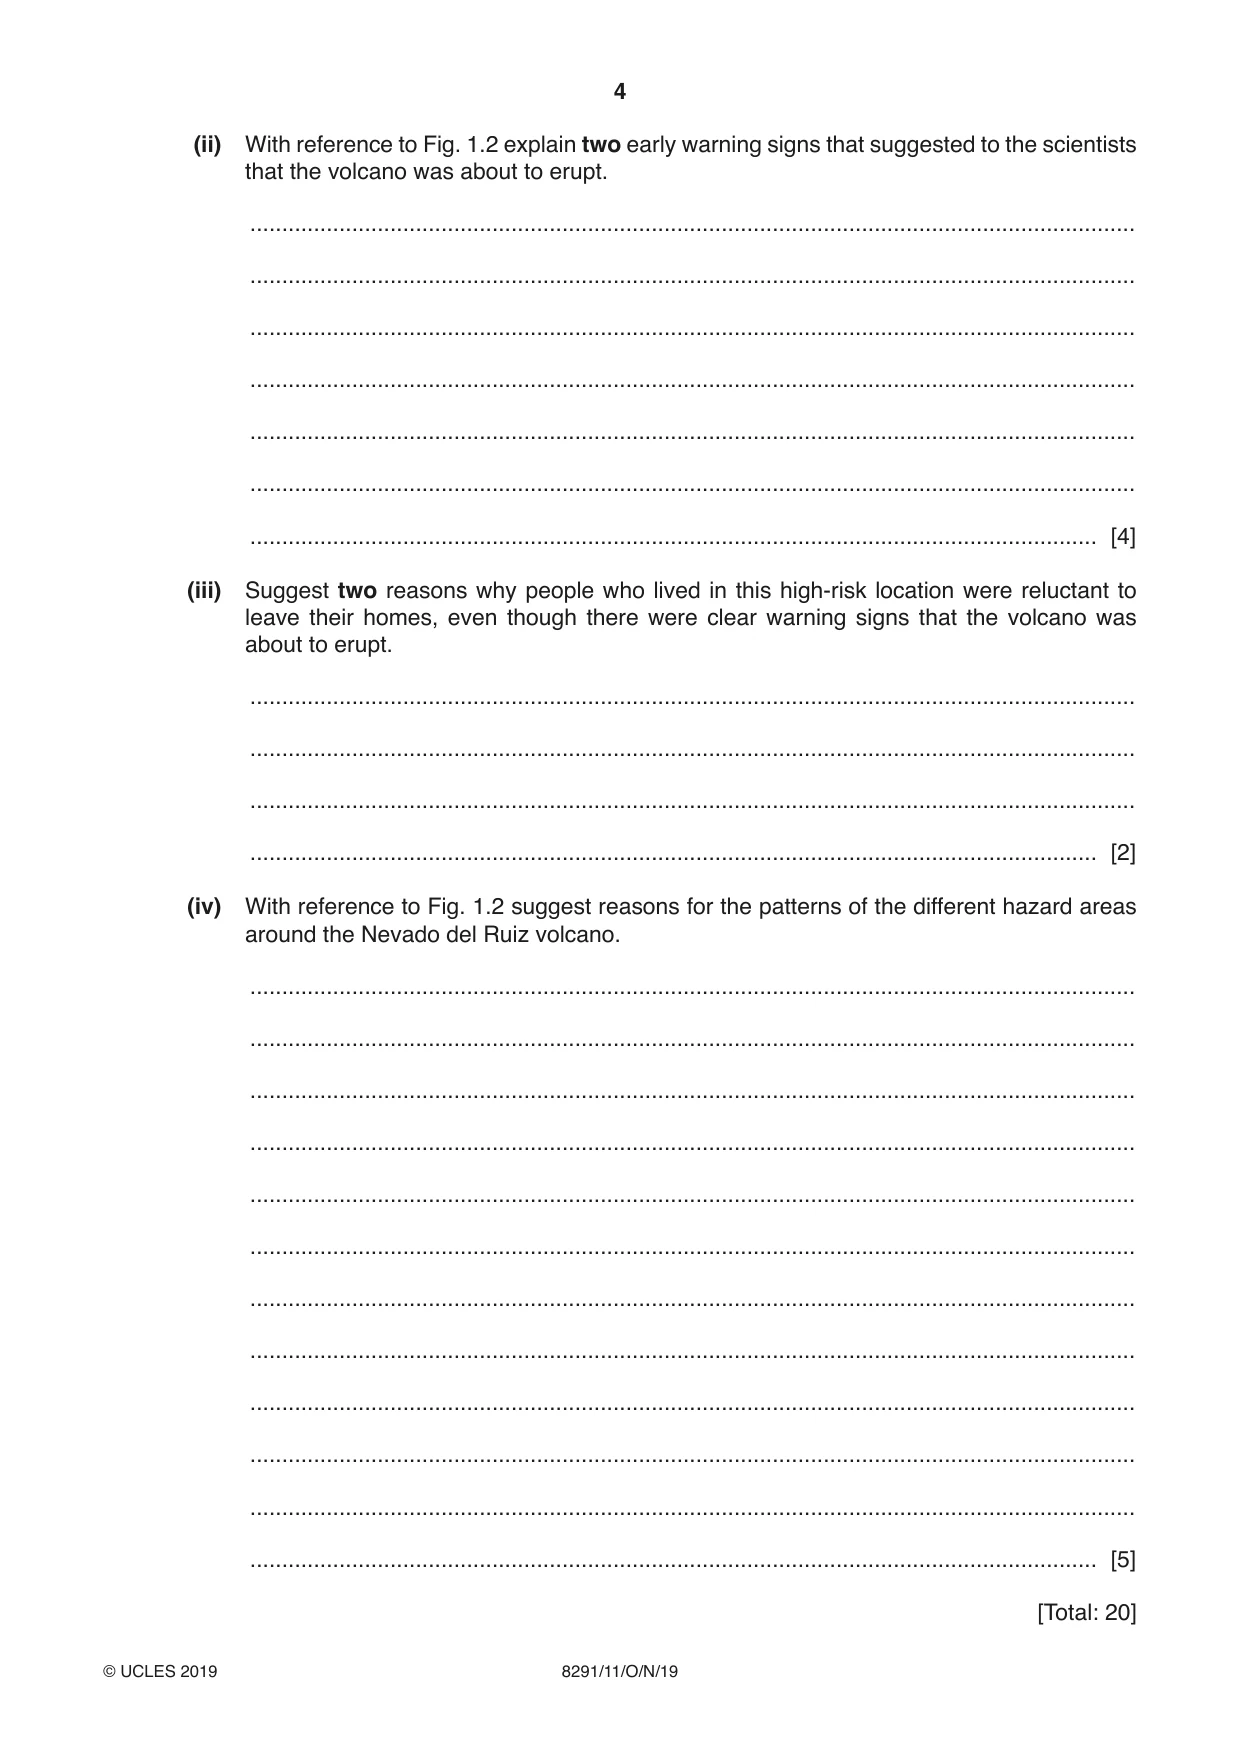
4 8291/11/O/N/19 © UCLES 2019 (ii) With reference to Fig. 1.2 explain two early warning signs that suggested to the scientists that the volcano was about to erupt. … … … … … … … [4] (iii) Suggest two reasons why people who lived in this high-risk location were reluctant to leave their homes, even though there were clear warning signs that the volcano was about to erupt. … … … … [2] (iv) With reference to Fig. 1.2 suggest reasons for the patterns of the different hazard areas around the Nevado del Ruiz volcano. … … … … … … … … … … … … [5] [Total: 20]
Question paper, page 5
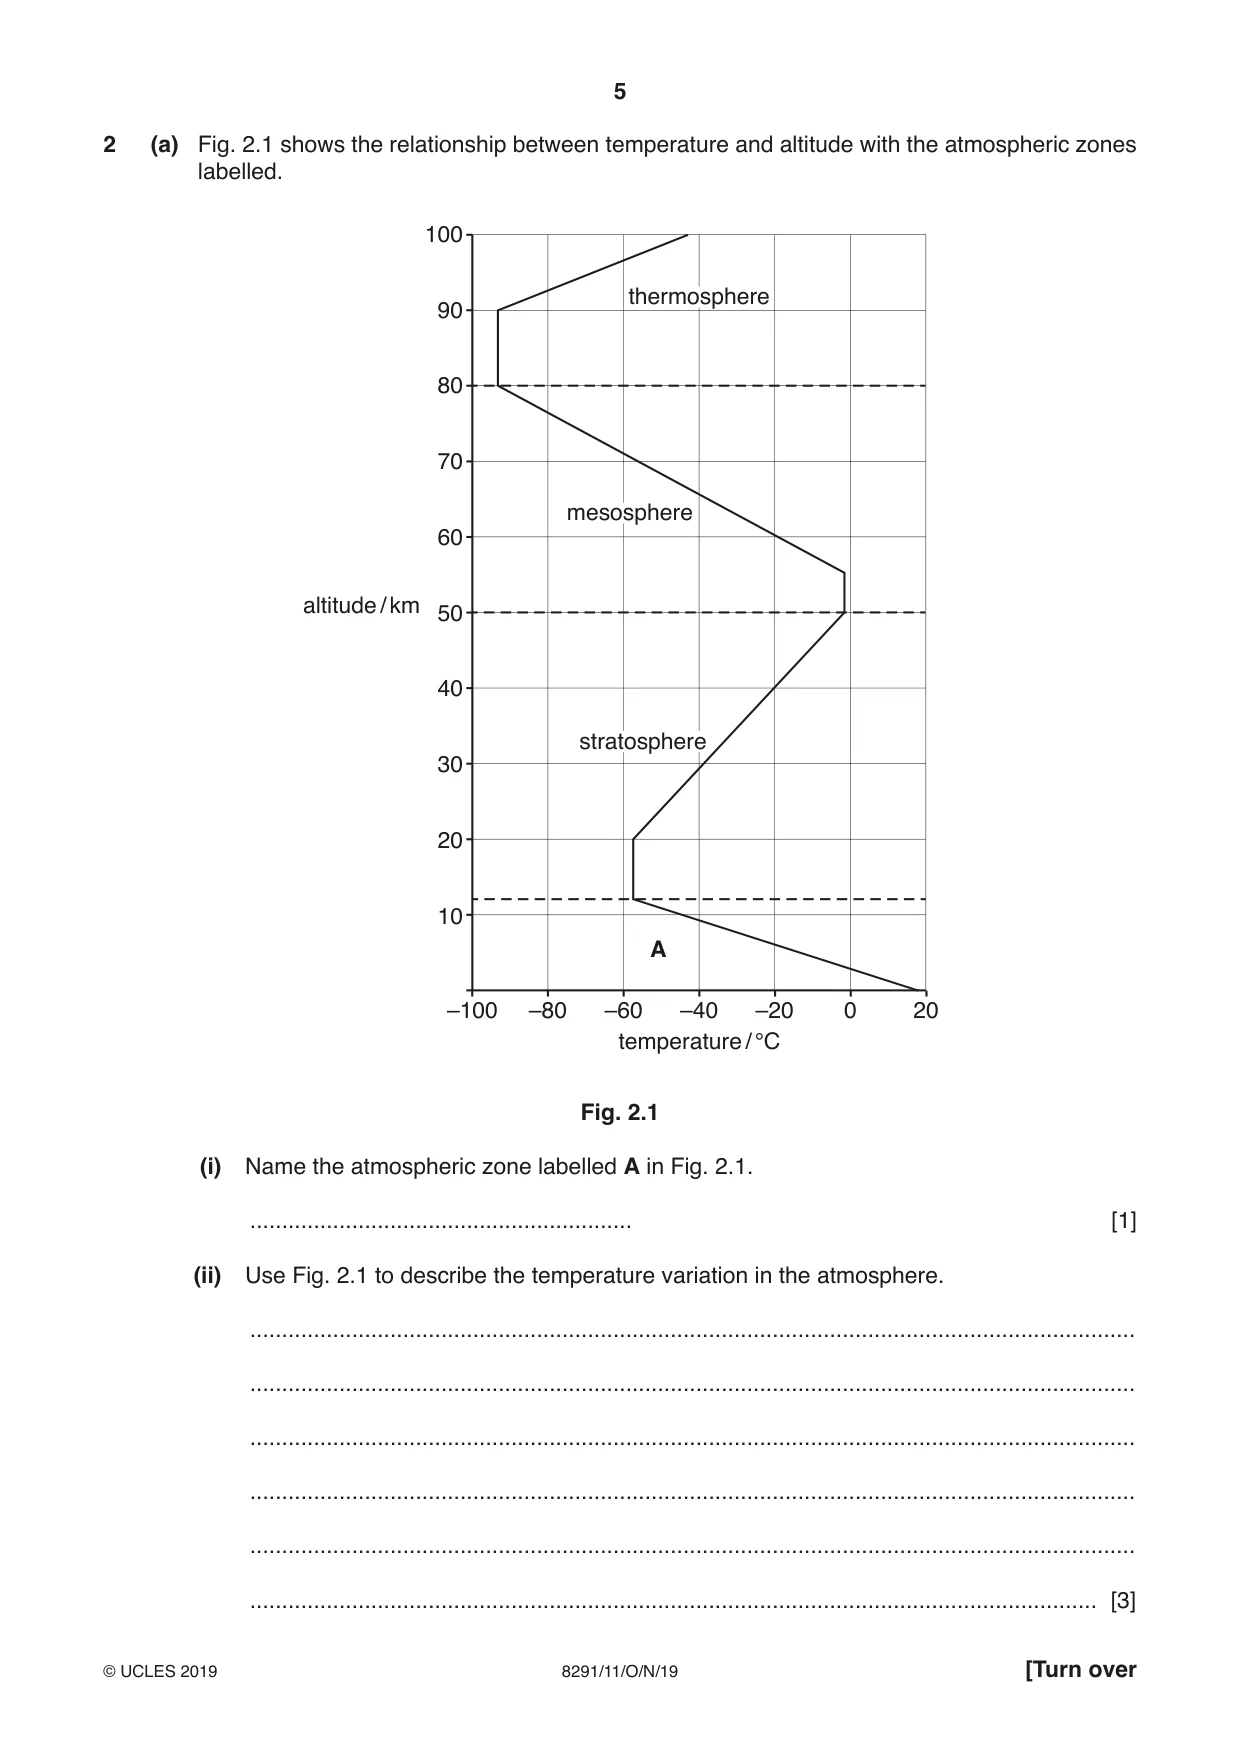
5 8291/11/O/N/19 © UCLES 2019 [Turn over 2 (a) Fig. 2.1 shows the relationship between temperature and altitude with the atmospheric zones labelled. –100 10 20 30 40 50 60 70 80 90 100 –80 –60 –40 temperature / °C –20 0 20 altitude / km mesosphere thermosphere stratosphere A Fig. 2.1 (i) Name the atmospheric zone labelled A in Fig. 2.1. … [1] (ii) Use Fig. 2.1 to describe the temperature variation in the atmosphere. … … … … … … [3]
Question paper, page 6
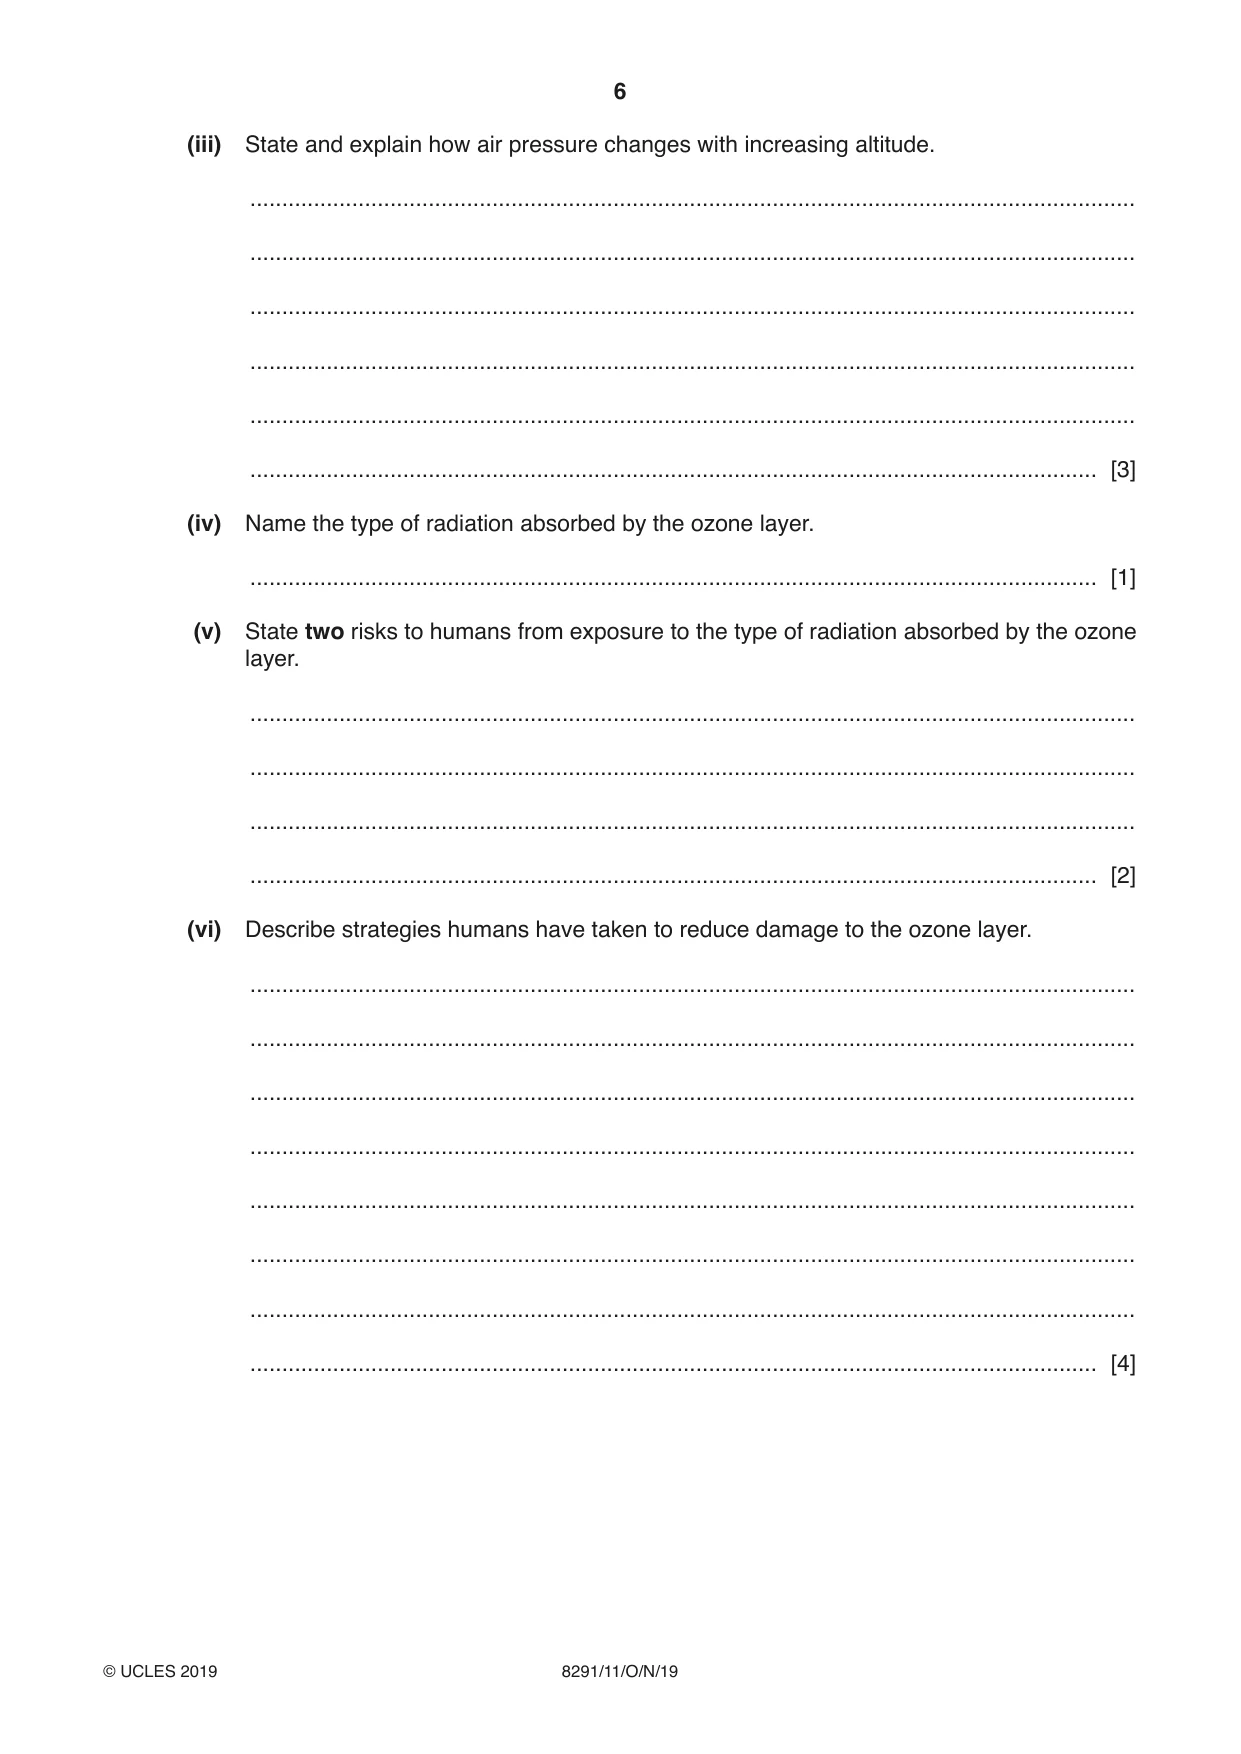
6 8291/11/O/N/19 © UCLES 2019 (iii) State and explain how air pressure changes with increasing altitude. … … … … … … [3] (iv) Name the type of radiation absorbed by the ozone layer. … [1] (v) State two risks to humans from exposure to the type of radiation absorbed by the ozone layer. … … … … [2] (vi) Describe strategies humans have taken to reduce damage to the ozone layer. … … … … … … … … [4]
Question paper, page 7
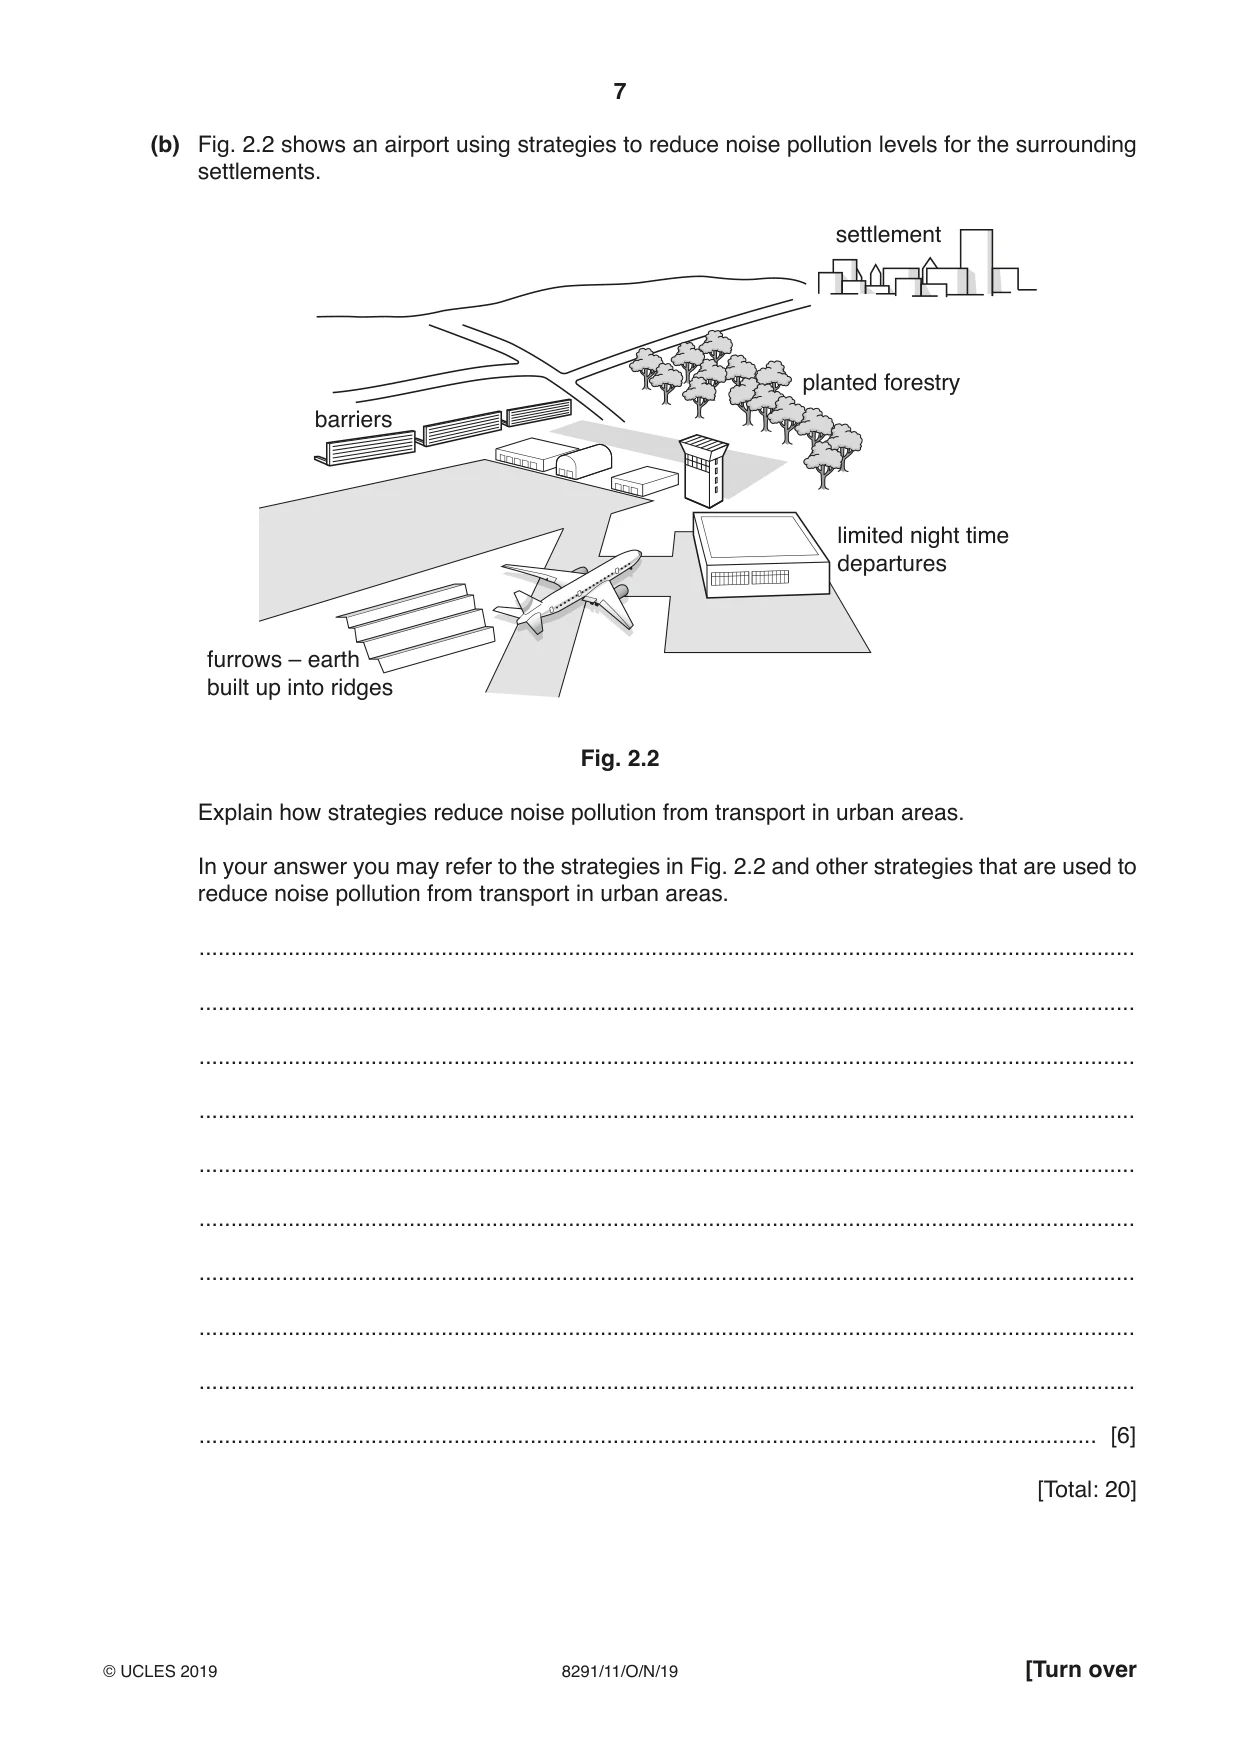
7 8291/11/O/N/19 © UCLES 2019 [Turn over (b) Fig. 2.2 shows an airport using strategies to reduce noise pollution levels for the surrounding settlements. limited night time departures furrows – earth built up into ridges barriers planted forestry settlement Fig. 2.2 Explain how strategies reduce noise pollution from transport in urban areas. In your answer you may refer to the strategies in Fig. 2.2 and other strategies that are used to reduce noise pollution from transport in urban areas. … … … … … … … … … … [6] [Total: 20]
Question paper, page 8
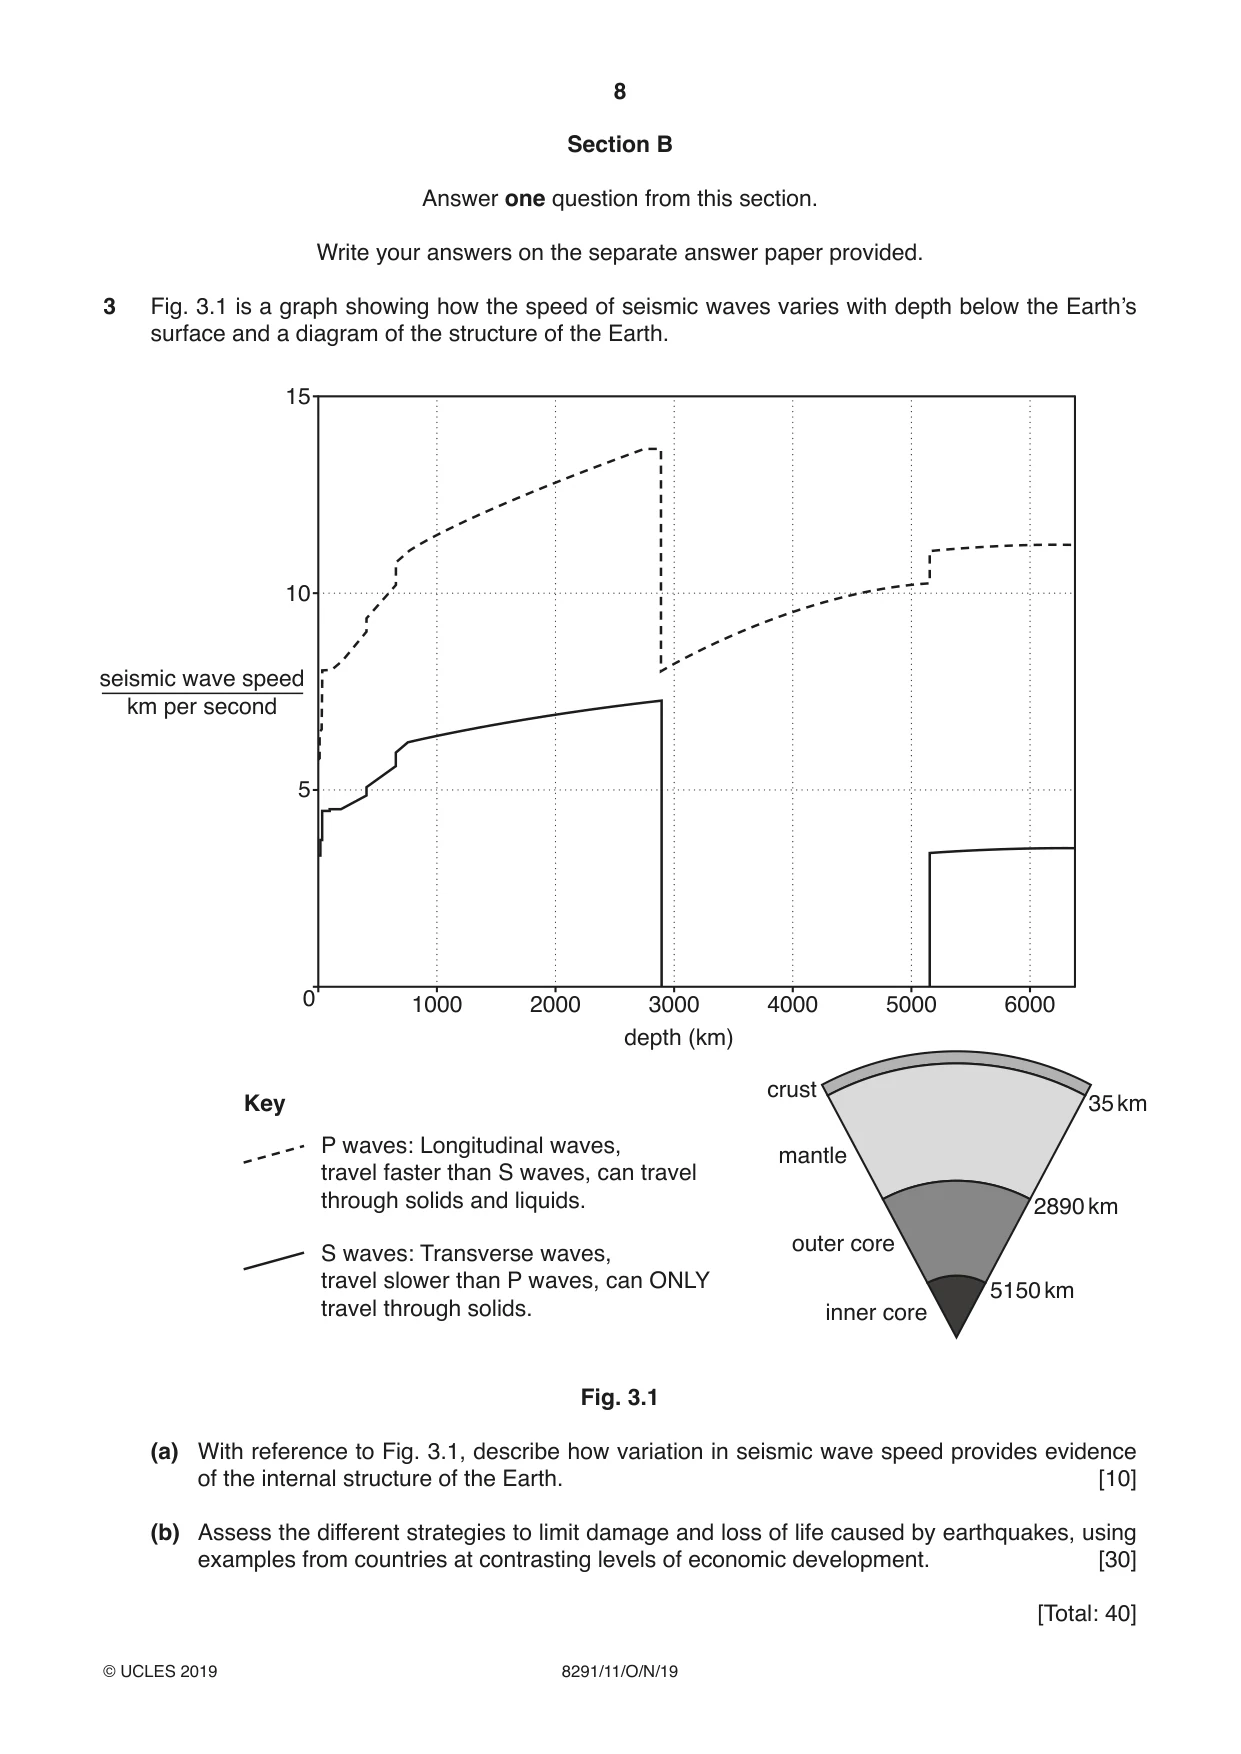
8 8291/11/O/N/19 © UCLES 2019 Section B Answer one question from this section. Write your answers on the separate answer paper provided. 3 Fig. 3.1 is a graph showing how the speed of seismic waves varies with depth below the Earth’s surface and a diagram of the structure of the Earth. 0 5 10 15 seismic wave speed km per second depth (km) 1000 2000 3000 4000 5000 6000 Key P waves: Longitudinal waves, travel faster than S waves, can travel through solids and liquids. S waves: Transverse waves, travel slower than P waves, can ONLY travel through solids. crust mantle outer core inner core 5150 km 2890 km 35 km Fig. 3.1 (a) With reference to Fig. 3.1, describe how variation in seismic wave speed provides evidence of the internal structure of the Earth. [10] (b) Assess the different strategies to limit damage and loss of life caused by earthquakes, using examples from countries at contrasting levels of economic development. [30] [Total: 40]
Question paper, page 9
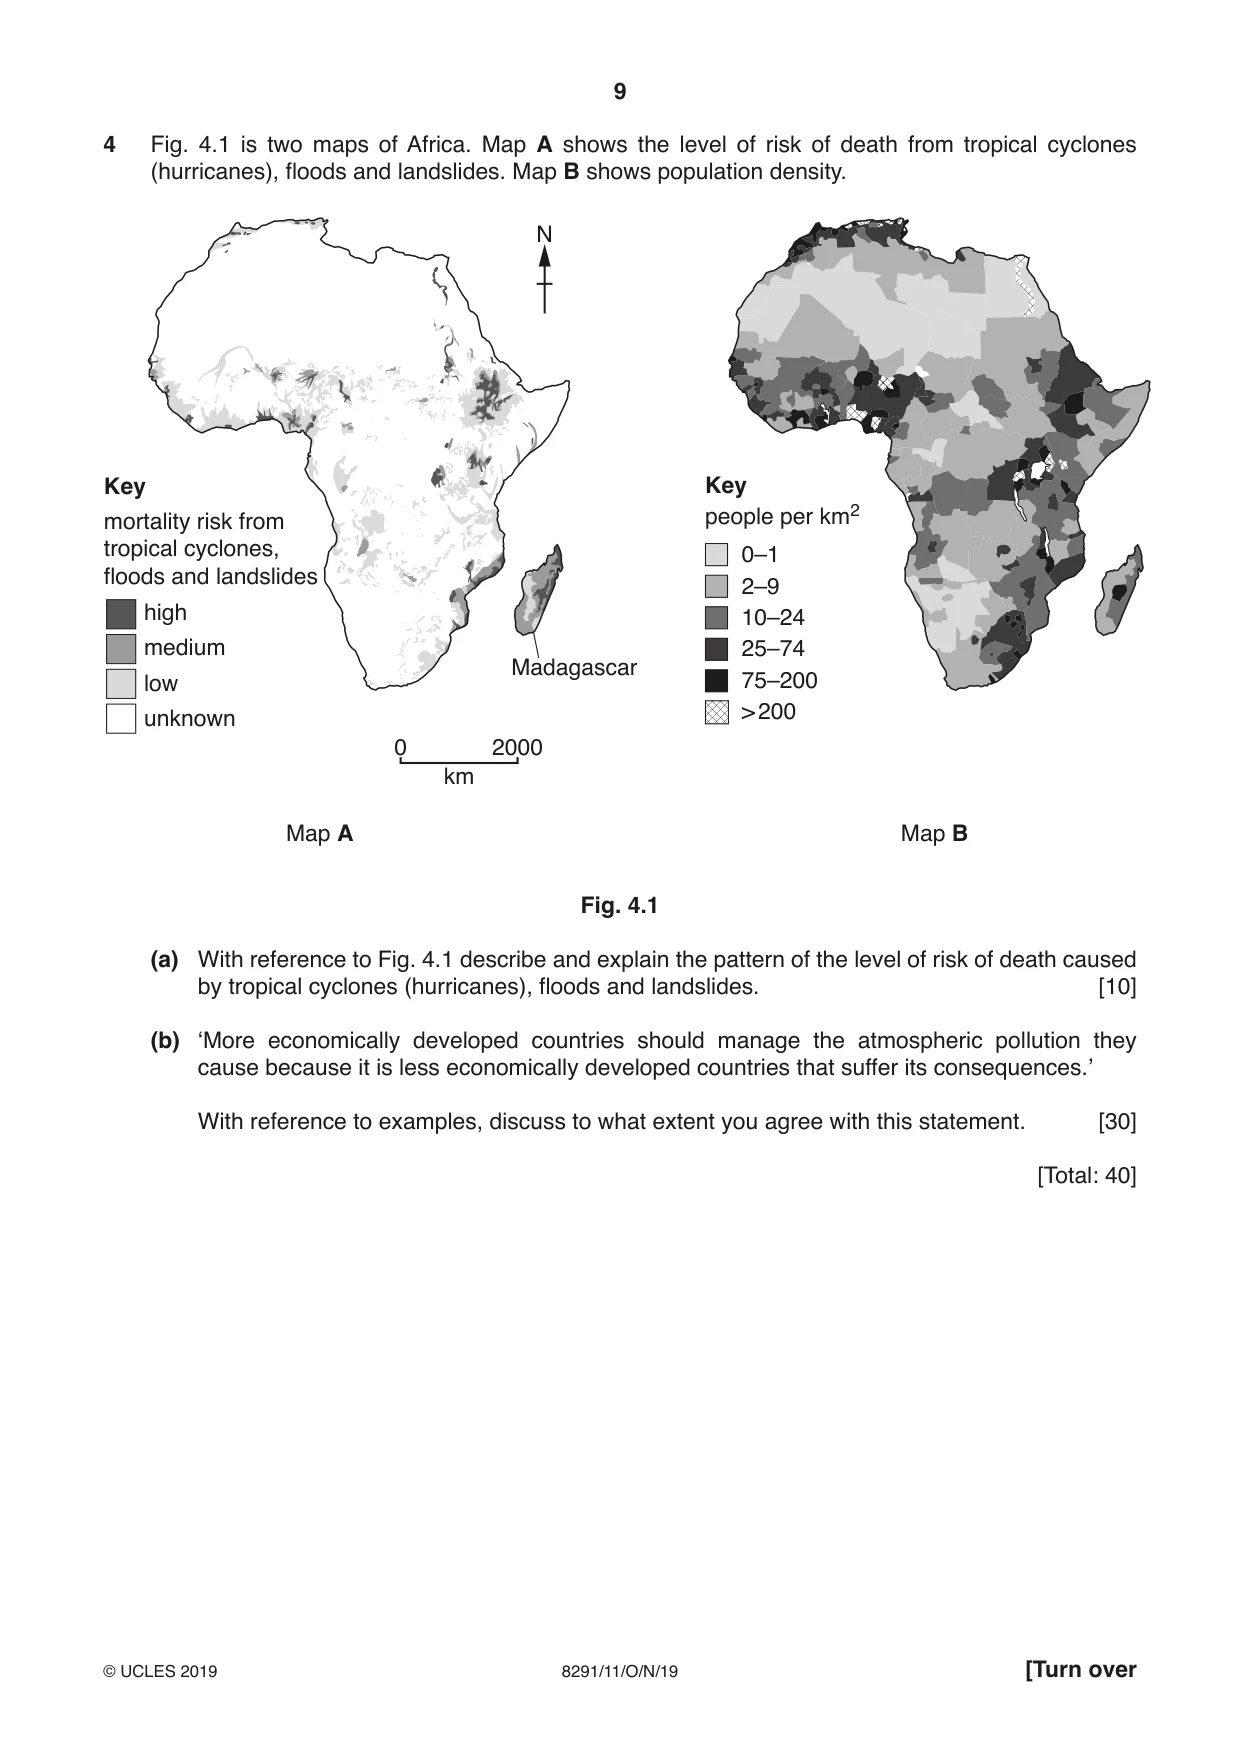
9 8291/11/O/N/19 © UCLES 2019 [Turn over 4 Fig. 4.1 is two maps of Africa. Map A shows the level of risk of death from tropical cyclones (hurricanes), floods and landslides. Map B shows population density. 0 2000 km high medium low unknown Key mortality risk from tropical cyclones, floods and landslides people per km2 Key > 200 75–200 25–74 10–24 2–9 0–1 Map B Map A N Madagascar Fig. 4.1 (a) With reference to Fig. 4.1 describe and explain the pattern of the level of risk of death caused by tropical cyclones (hurricanes), floods and landslides. [10] (b) ‘More economically developed countries should manage the atmospheric pollution they cause because it is less economically developed countries that suffer its consequences.’ With reference to examples, discuss to what extent you agree with this statement. [30] [Total: 40]
Question paper, page 10
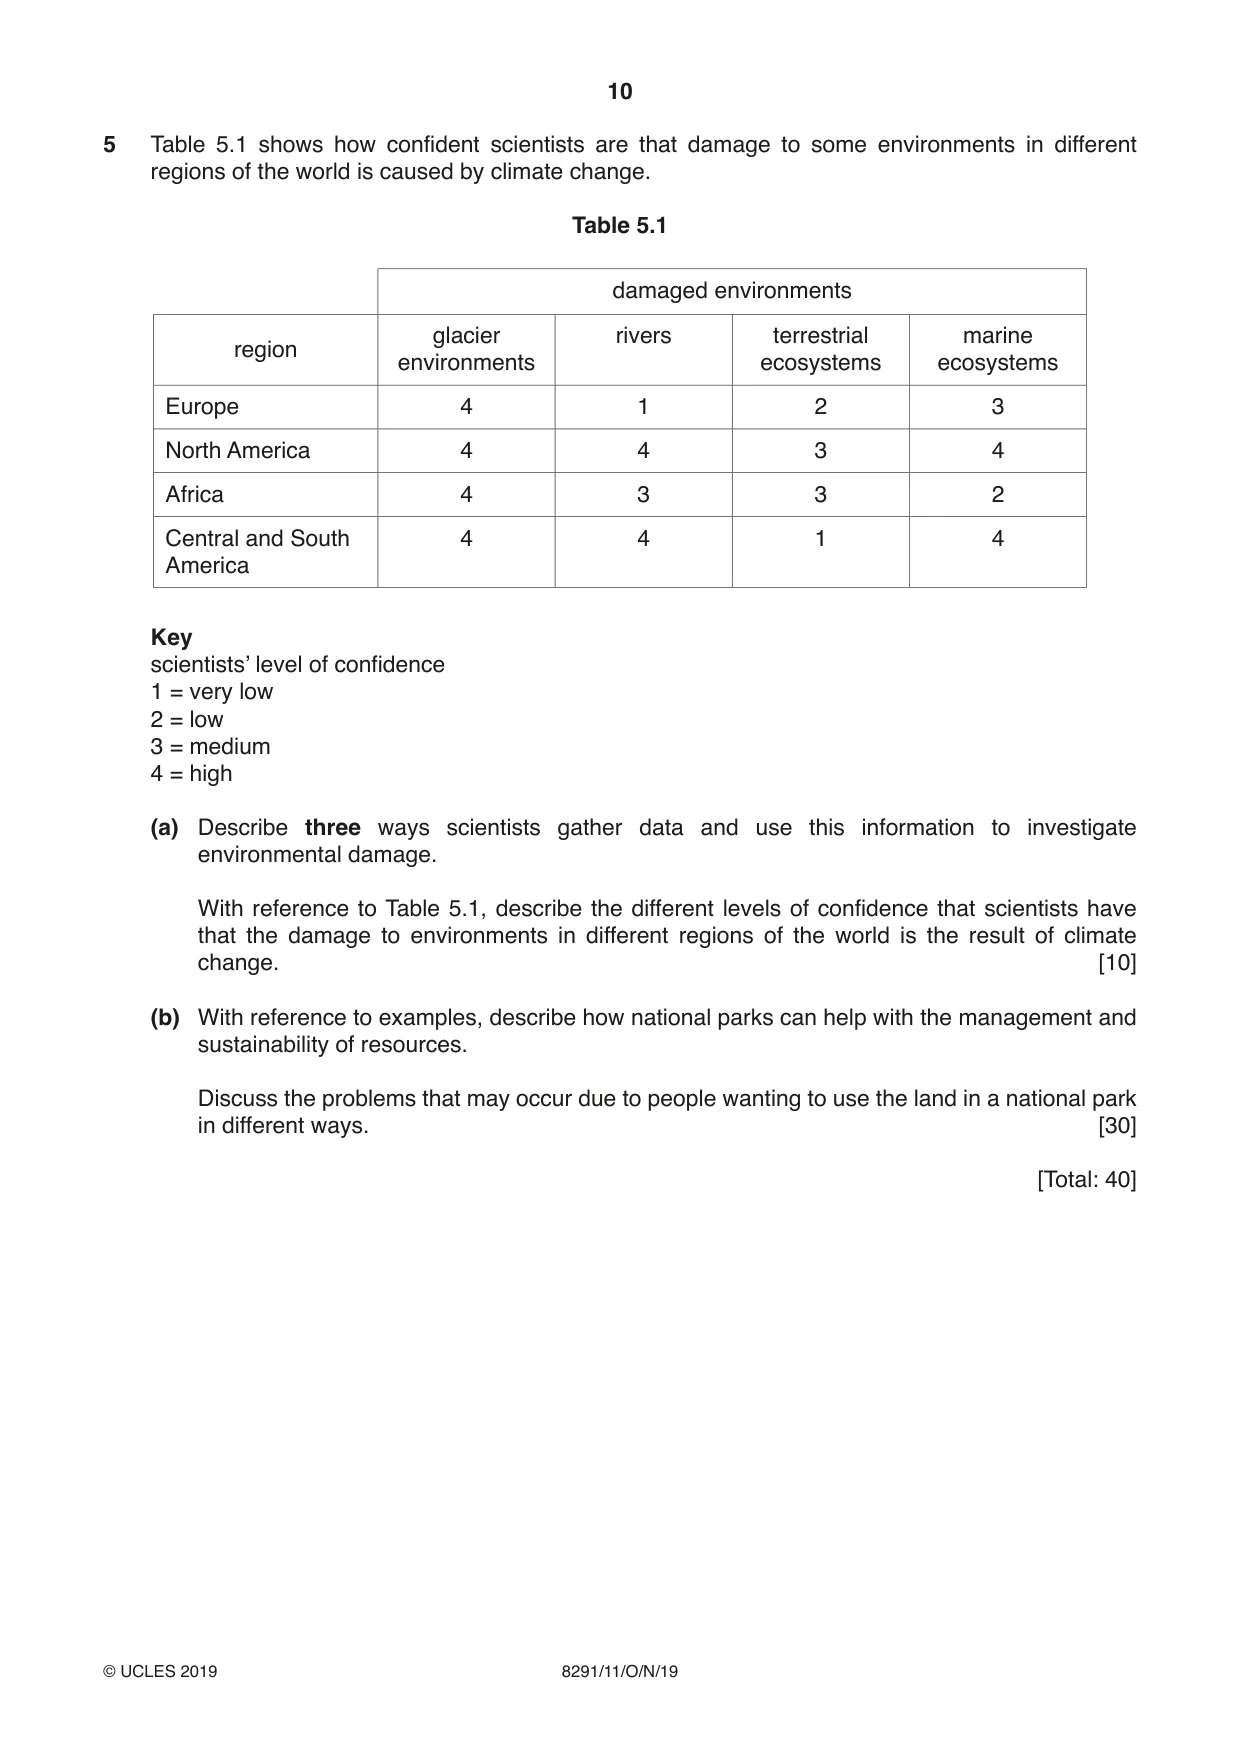
10 8291/11/O/N/19 © UCLES 2019 5 Table 5.1 shows how confident scientists are that damage to some environments in different regions of the world is caused by climate change. Table 5.1 damaged environments region glacier environments rivers terrestrial ecosystems marine ecosystems Europe 4 1 2 3 North America 4 4 3 4 Africa 4 3 3 2 Central and South America 4 4 1 4 Key scientists’ level of confidence 1 = very low 2 = low 3 = medium 4 = high (a) Describe three ways scientists gather data and use this information to investigate environmental damage. With reference to Table 5.1, describe the different levels of confidence that scientists have that the damage to environments in different regions of the world is the result of climate change. [10] (b) With reference to examples, describe how national parks can help with the management and sustainability of resources. Discuss the problems that may occur due to people wanting to use the land in a national park in different ways. [30] [Total: 40]
Question paper, page 11
11 8291/11/O/N/19 © UCLES 2019 BLANK PAGE
Question paper, page 12
12 8291/11/O/N/19 © UCLES 2019 Permission to reproduce items where third-party owned material protected by copyright is included has been sought and cleared where possible. Every reasonable effort has been made by the publisher (UCLES) to trace copyright holders, but if any items requiring clearance have unwittingly been included, the publisher will be pleased to make amends at the earliest possible opportunity. To avoid the issue of disclosure of answer-related information to candidates, all copyright acknowledgements are reproduced online in the Cambridge Assessment International Education Copyright Acknowledgements Booklet. This is produced for each series of examinations and is freely available to download at www.cambridgeinternational.org after the live examination series. Cambridge Assessment International Education is part of the Cambridge Assessment Group. Cambridge Assessment is the brand name of the University of Cambridge Local Examinations Syndicate (UCLES), which itself is a department of the University of Cambridge. BLANK PAGE
Mark scheme, page 1
This document consists of 16 printed pages. © UCLES 2019 [Turn over Cambridge Assessment International Education Cambridge International Advanced Subsidiary Level ENVIRONMENTAL MANAGEMENT 8291/11 Paper 1 October/November 2019 MARK SCHEME Maximum Mark: 80 Published This mark scheme is published as an aid to teachers and candidates, to indicate the requirements of the examination. It shows the basis on which Examiners were instructed to award marks. It does not indicate the details of the discussions that took place at an Examiners’ meeting before marking began, which would have considered the acceptability of alternative answers. Mark schemes should be read in conjunction with the question paper and the Principal Examiner Report for Teachers. Cambridge International will not enter into discussions about these mark schemes. Cambridge International is publishing the mark schemes for the October/November 2019 series for most Cambridge IGCSE™, Cambridge International A and AS Level components and some Cambridge O Level components.
Mark scheme, page 2
8291/11 Cambridge International AS Level – Mark Scheme PUBLISHED October/November 2019 © UCLES 2019 Page 2 of 16 Generic Marking Principles These general marking principles must be applied by all examiners when marking candidate answers. They should be applied alongside the specific content of the mark scheme or generic level descriptors for a question. Each question paper and mark scheme will also comply with these marking principles. GENERIC MARKING PRINCIPLE 1: Marks must be awarded in line with: • the specific content of the mark scheme or the generic level descriptors for the question • the specific skills defined in the mark scheme or in the generic level descriptors for the question • the standard of response required by a candidate as exemplified by the standardisation scripts. GENERIC MARKING PRINCIPLE 2: Marks awarded are always whole marks (not half marks, or other fractions). GENERIC MARKING PRINCIPLE 3: Marks must be awarded positively: • marks are awarded for correct/valid answers, as defined in the mark scheme. However, credit is given for valid answers which go beyond the scope of the syllabus and mark scheme, referring to your Team Leader as appropriate • marks are awarded when candidates clearly demonstrate what they know and can do • marks are not deducted for errors • marks are not deducted for omissions • answers should only be judged on the quality of spelling, punctuation and grammar when these features are specifically assessed by the question as indicated by the mark scheme. The meaning, however, should be unambiguous. GENERIC MARKING PRINCIPLE 4: Rules must be applied consistently e.g. in situations where candidates have not followed instructions or in the application of generic level descriptors.
Mark scheme, page 3
8291/11 Cambridge International AS Level – Mark Scheme PUBLISHED October/November 2019 © UCLES 2019 Page 3 of 16 GENERIC MARKING PRINCIPLE 5: Marks should be awarded using the full range of marks defined in the mark scheme for the question (however; the use of the full mark range may be limited according to the quality of the candidate responses seen). GENERIC MARKING PRINCIPLE 6: Marks awarded are based solely on the requirements as defined in the mark scheme. Marks should not be awarded with grade thresholds or grade descriptors in mind.
Mark scheme, page 4
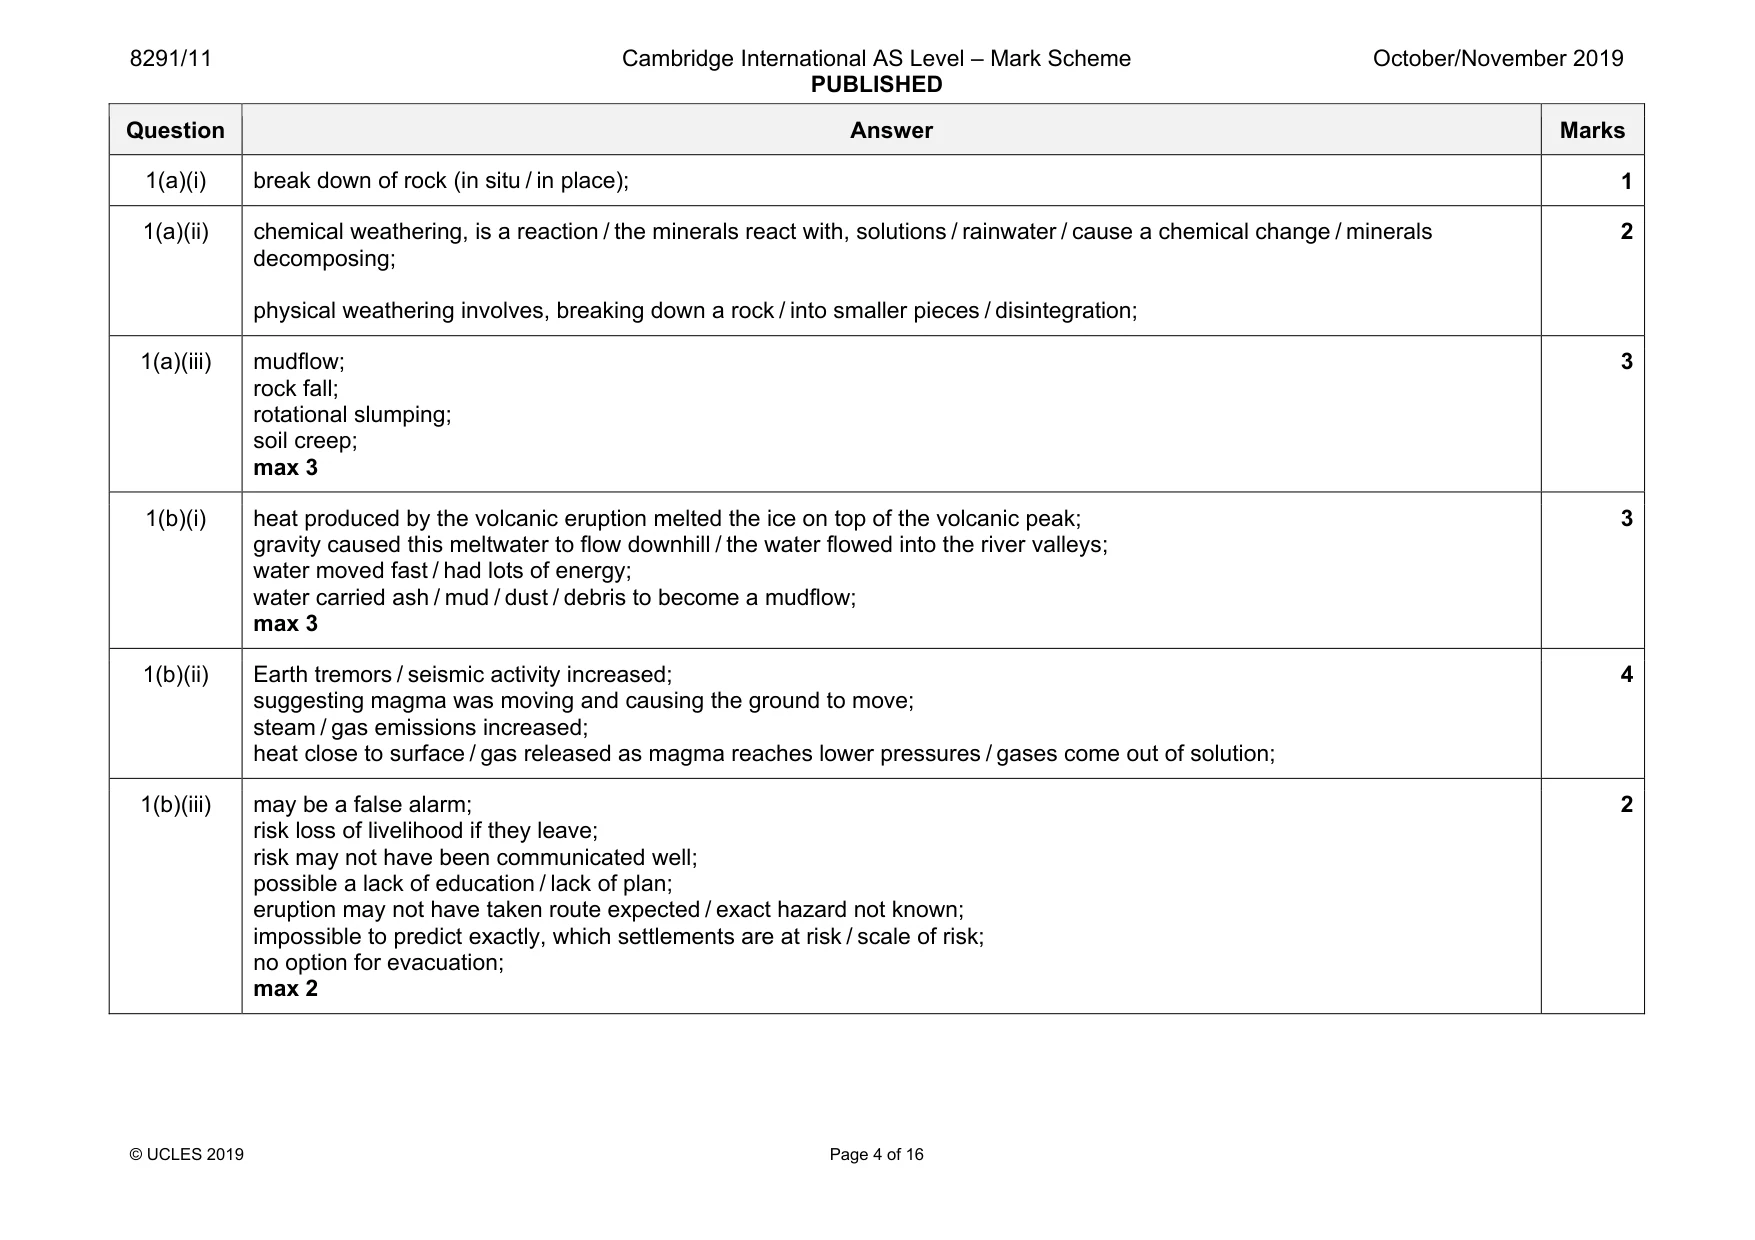
8291/11 Cambridge International AS Level – Mark Scheme PUBLISHED October/November 2019 © UCLES 2019 Page 4 of 16 Question Answer Marks 1(a)(i) break down of rock (in situ / in place); 1 1(a)(ii) chemical weathering, is a reaction / the minerals react with, solutions / rainwater / cause a chemical change / minerals decomposing; physical weathering involves, breaking down a rock / into smaller pieces / disintegration; 2 1(a)(iii) mudflow; rock fall; rotational slumping; soil creep; max 3 3 1(b)(i) heat produced by the volcanic eruption melted the ice on top of the volcanic peak; gravity caused this meltwater to flow downhill / the water flowed into the river valleys; water moved fast / had lots of energy; water carried ash / mud / dust / debris to become a mudflow; max 3 3 1(b)(ii) Earth tremors / seismic activity increased; suggesting magma was moving and causing the ground to move; steam / gas emissions increased; heat close to surface / gas released as magma reaches lower pressures / gases come out of solution; 4 1(b)(iii) may be a false alarm; risk loss of livelihood if they leave; risk may not have been communicated well; possible a lack of education / lack of plan; eruption may not have taken route expected / exact hazard not known; impossible to predict exactly, which settlements are at risk / scale of risk; no option for evacuation; max 2 2
Mark scheme, page 5
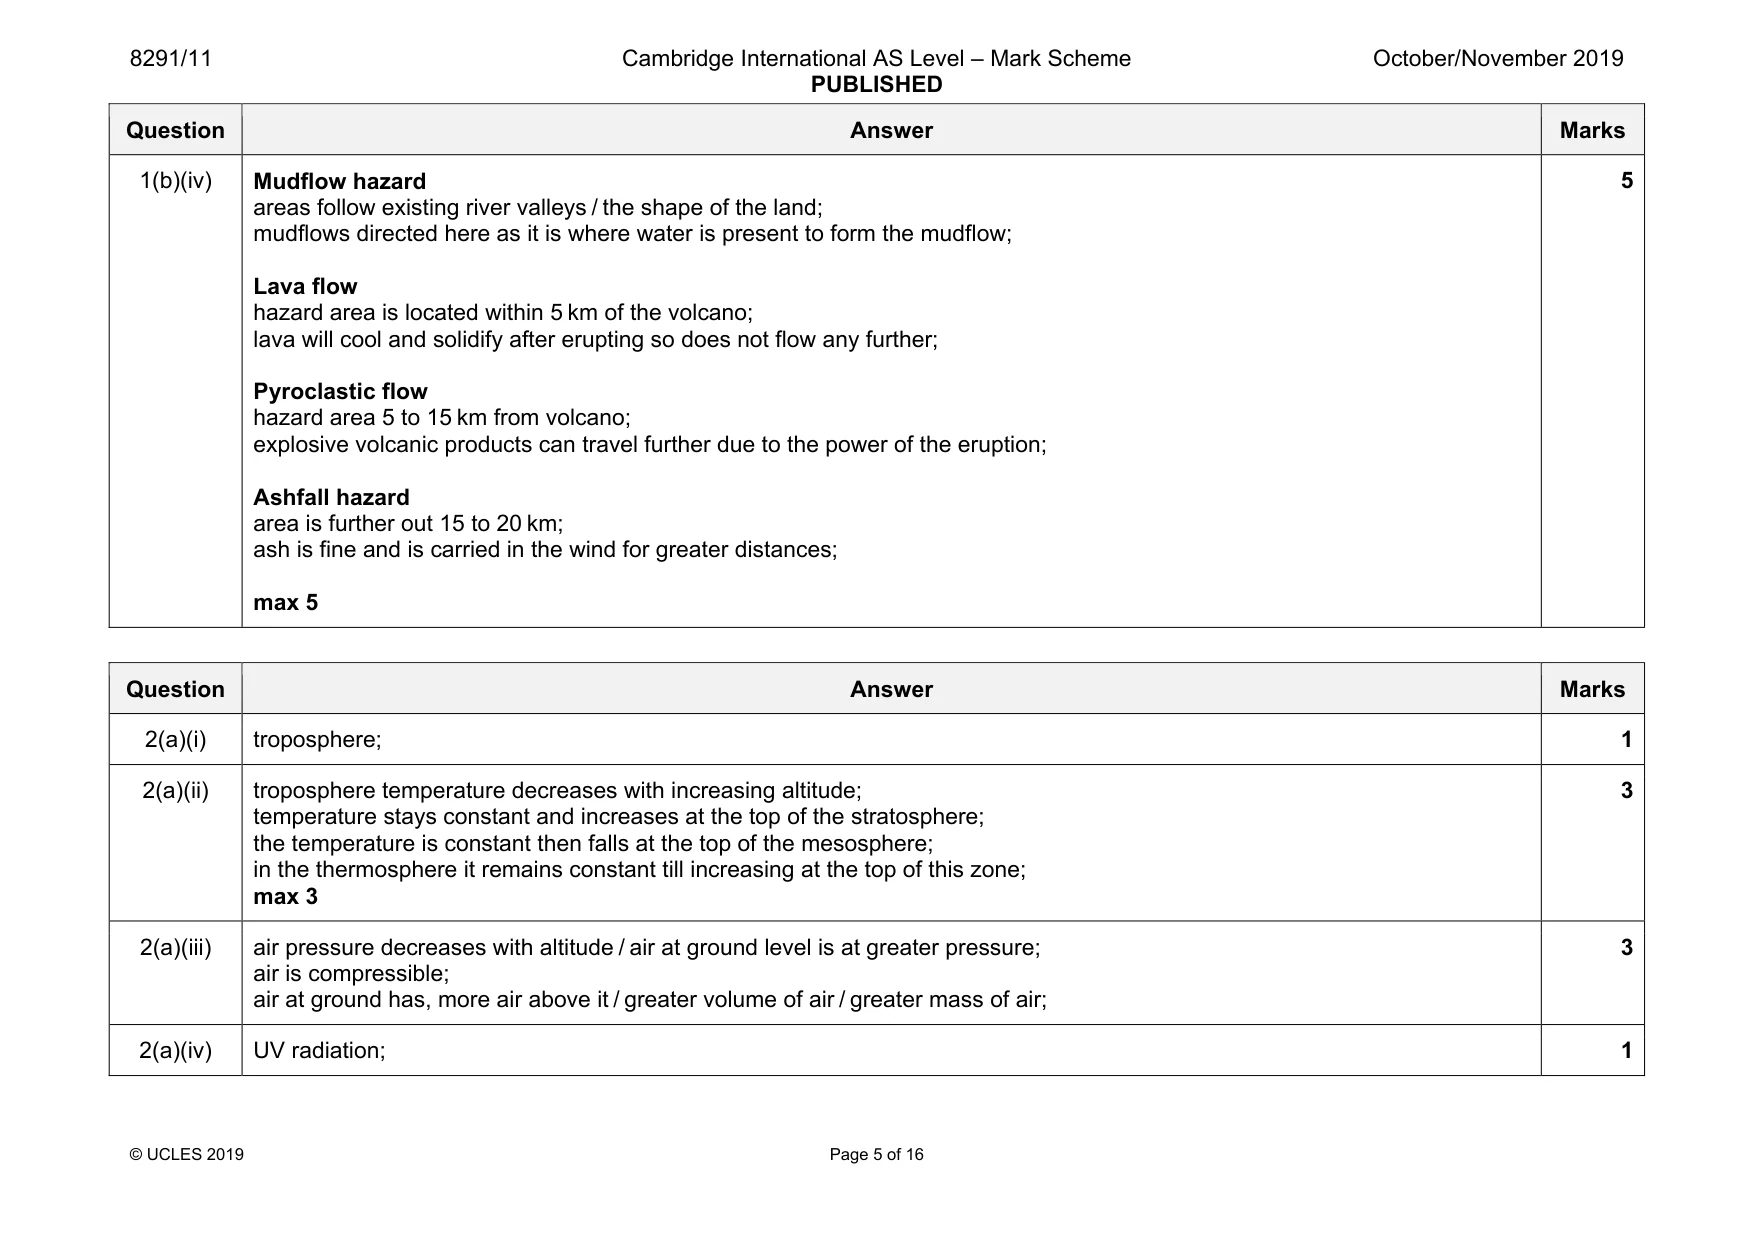
8291/11 Cambridge International AS Level – Mark Scheme PUBLISHED October/November 2019 © UCLES 2019 Page 5 of 16 Question Answer Marks 1(b)(iv) Mudflow hazard areas follow existing river valleys / the shape of the land; mudflows directed here as it is where water is present to form the mudflow; Lava flow hazard area is located within 5 km of the volcano; lava will cool and solidify after erupting so does not flow any further; Pyroclastic flow hazard area 5 to 15 km from volcano; explosive volcanic products can travel further due to the power of the eruption; Ashfall hazard area is further out 15 to 20 km; ash is fine and is carried in the wind for greater distances; max 5 5 Question Answer Marks 2(a)(i) troposphere; 1 2(a)(ii) troposphere temperature decreases with increasing altitude; temperature stays constant and increases at the top of the stratosphere; the temperature is constant then falls at the top of the mesosphere; in the thermosphere it remains constant till increasing at the top of this zone; max 3 3 2(a)(iii) air pressure decreases with altitude / air at ground level is at greater pressure; air is compressible; air at ground has, more air above it / greater volume of air / greater mass of air; 3 2(a)(iv) UV radiation; 1
Mark scheme, page 6
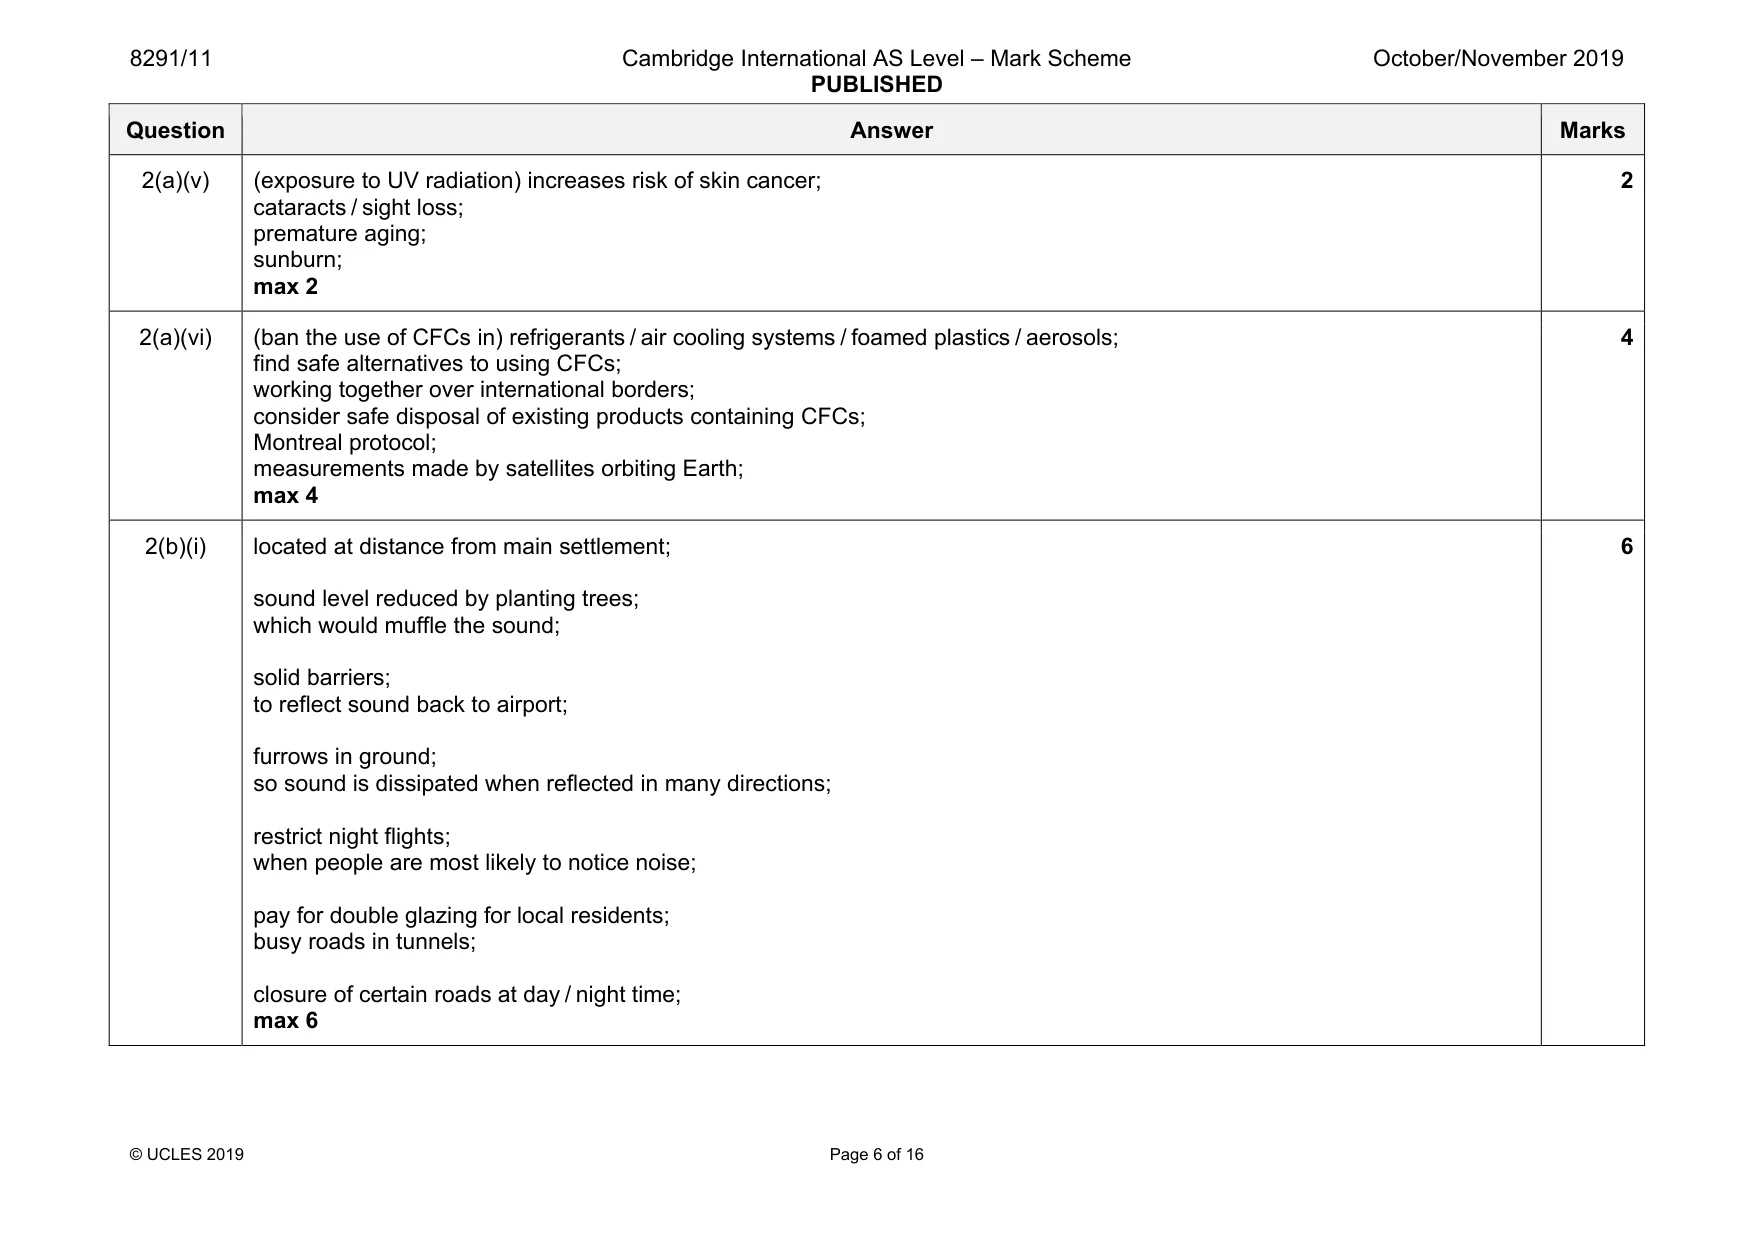
8291/11 Cambridge International AS Level – Mark Scheme PUBLISHED October/November 2019 © UCLES 2019 Page 6 of 16 Question Answer Marks 2(a)(v) (exposure to UV radiation) increases risk of skin cancer; cataracts / sight loss; premature aging; sunburn; max 2 2 2(a)(vi) (ban the use of CFCs in) refrigerants / air cooling systems / foamed plastics / aerosols; find safe alternatives to using CFCs; working together over international borders; consider safe disposal of existing products containing CFCs; Montreal protocol; measurements made by satellites orbiting Earth; max 4 4 2(b)(i) located at distance from main settlement; sound level reduced by planting trees; which would muffle the sound; solid barriers; to reflect sound back to airport; furrows in ground; so sound is dissipated when reflected in many directions; restrict night flights; when people are most likely to notice noise; pay for double glazing for local residents; busy roads in tunnels; closure of certain roads at day / night time; max 6 6
Mark scheme, page 7
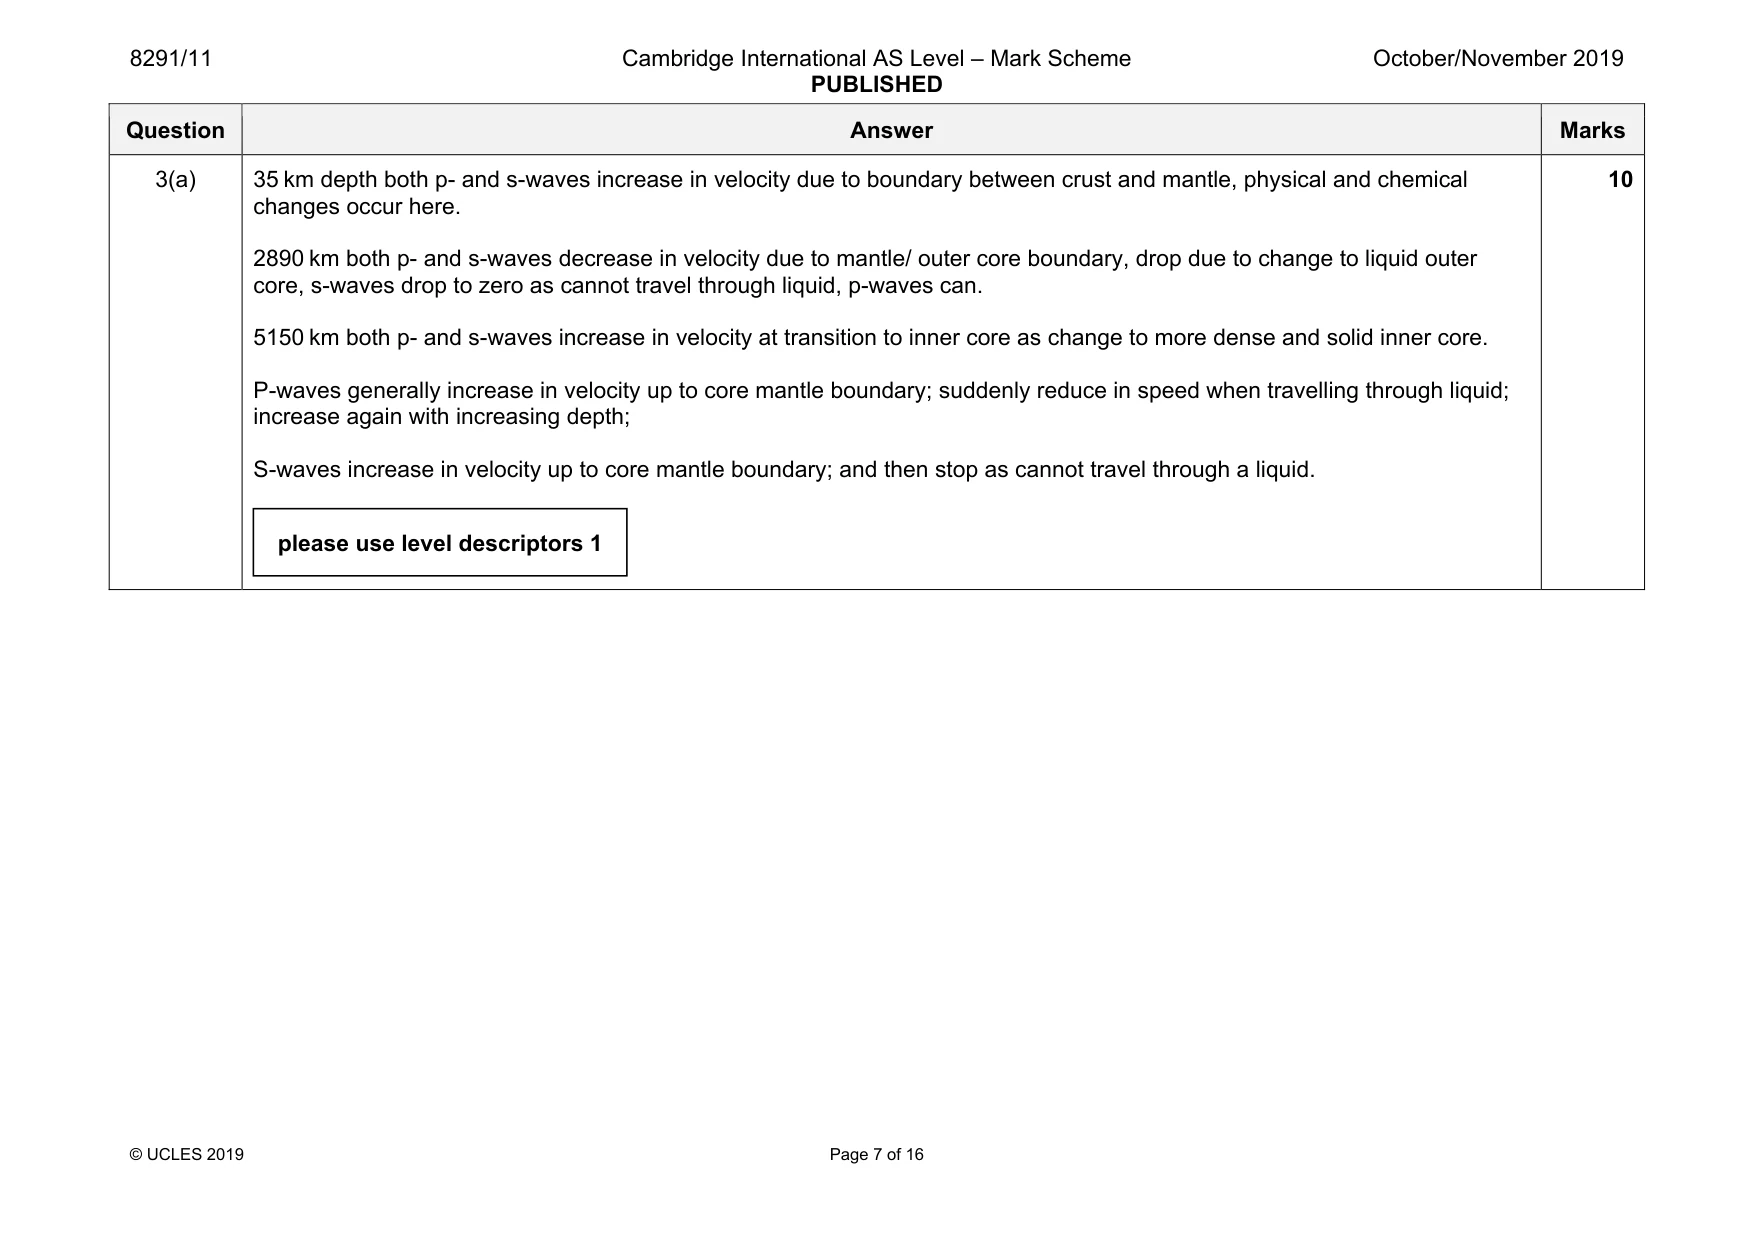
8291/11 Cambridge International AS Level – Mark Scheme PUBLISHED October/November 2019 © UCLES 2019 Page 7 of 16 Question Answer Marks 3(a) 35 km depth both p- and s-waves increase in velocity due to boundary between crust and mantle, physical and chemical changes occur here. 2890 km both p- and s-waves decrease in velocity due to mantle/ outer core boundary, drop due to change to liquid outer core, s-waves drop to zero as cannot travel through liquid, p-waves can. 5150 km both p- and s-waves increase in velocity at transition to inner core as change to more dense and solid inner core. P-waves generally increase in velocity up to core mantle boundary; suddenly reduce in speed when travelling through liquid; increase again with increasing depth; S-waves increase in velocity up to core mantle boundary; and then stop as cannot travel through a liquid. 10 please use level descriptors 1
Mark scheme, page 8
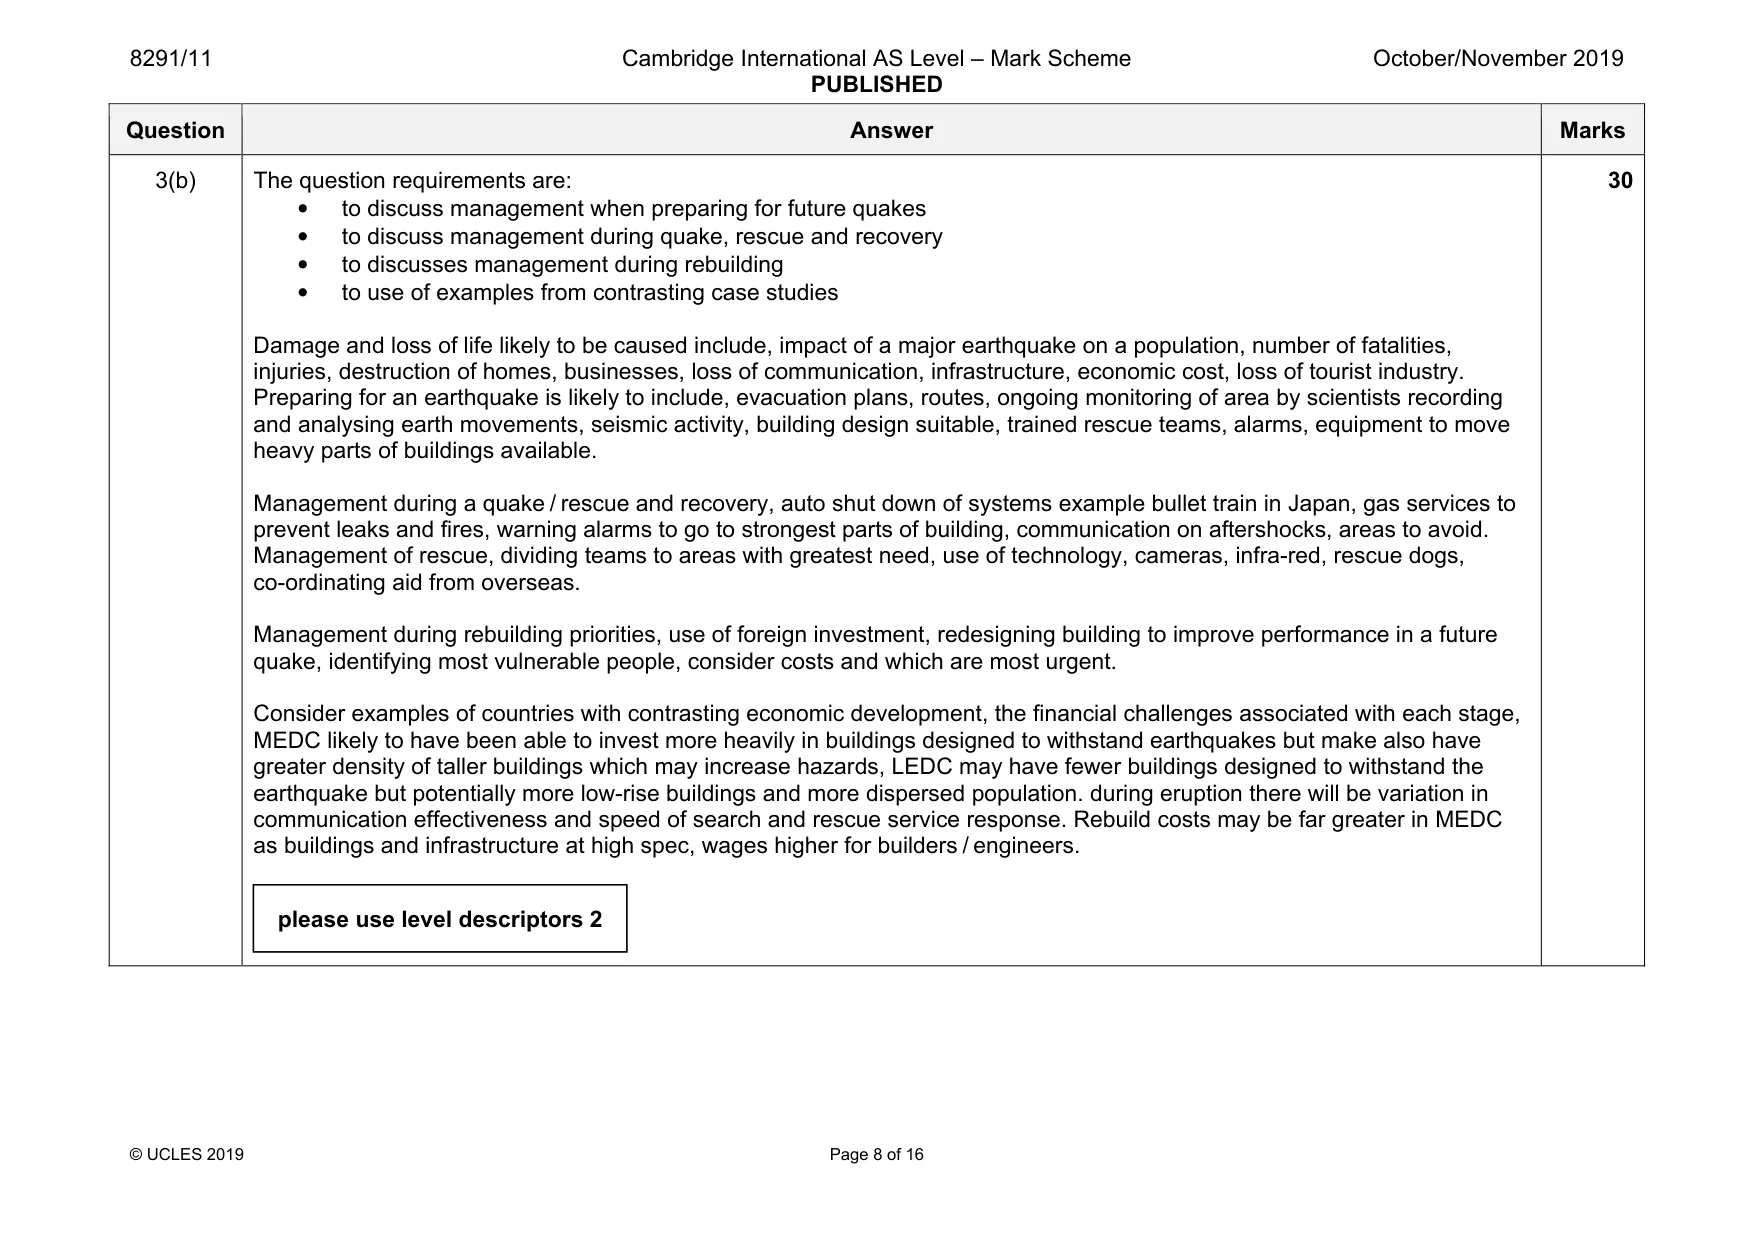
8291/11 Cambridge International AS Level – Mark Scheme PUBLISHED October/November 2019 © UCLES 2019 Page 8 of 16 Question Answer Marks 3(b) The question requirements are: • to discuss management when preparing for future quakes • to discuss management during quake, rescue and recovery • to discusses management during rebuilding • to use of examples from contrasting case studies Damage and loss of life likely to be caused include, impact of a major earthquake on a population, number of fatalities, injuries, destruction of homes, businesses, loss of communication, infrastructure, economic cost, loss of tourist industry. Preparing for an earthquake is likely to include, evacuation plans, routes, ongoing monitoring of area by scientists recording and analysing earth movements, seismic activity, building design suitable, trained rescue teams, alarms, equipment to move heavy parts of buildings available. Management during a quake / rescue and recovery, auto shut down of systems example bullet train in Japan, gas services to prevent leaks and fires, warning alarms to go to strongest parts of building, communication on aftershocks, areas to avoid. Management of rescue, dividing teams to areas with greatest need, use of technology, cameras, infra-red, rescue dogs, co-ordinating aid from overseas. Management during rebuilding priorities, use of foreign investment, redesigning building to improve performance in a future quake, identifying most vulnerable people, consider costs and which are most urgent. Consider examples of countries with contrasting economic development, the financial challenges associated with each stage, MEDC likely to have been able to invest more heavily in buildings designed to withstand earthquakes but make also have greater density of taller buildings which may increase hazards, LEDC may have fewer buildings designed to withstand the earthquake but potentially more low-rise buildings and more dispersed population. during eruption there will be variation in communication effectiveness and speed of search and rescue service response. Rebuild costs may be far greater in MEDC as buildings and infrastructure at high spec, wages higher for builders / engineers. 30 please use level descriptors 2
Mark scheme, page 9
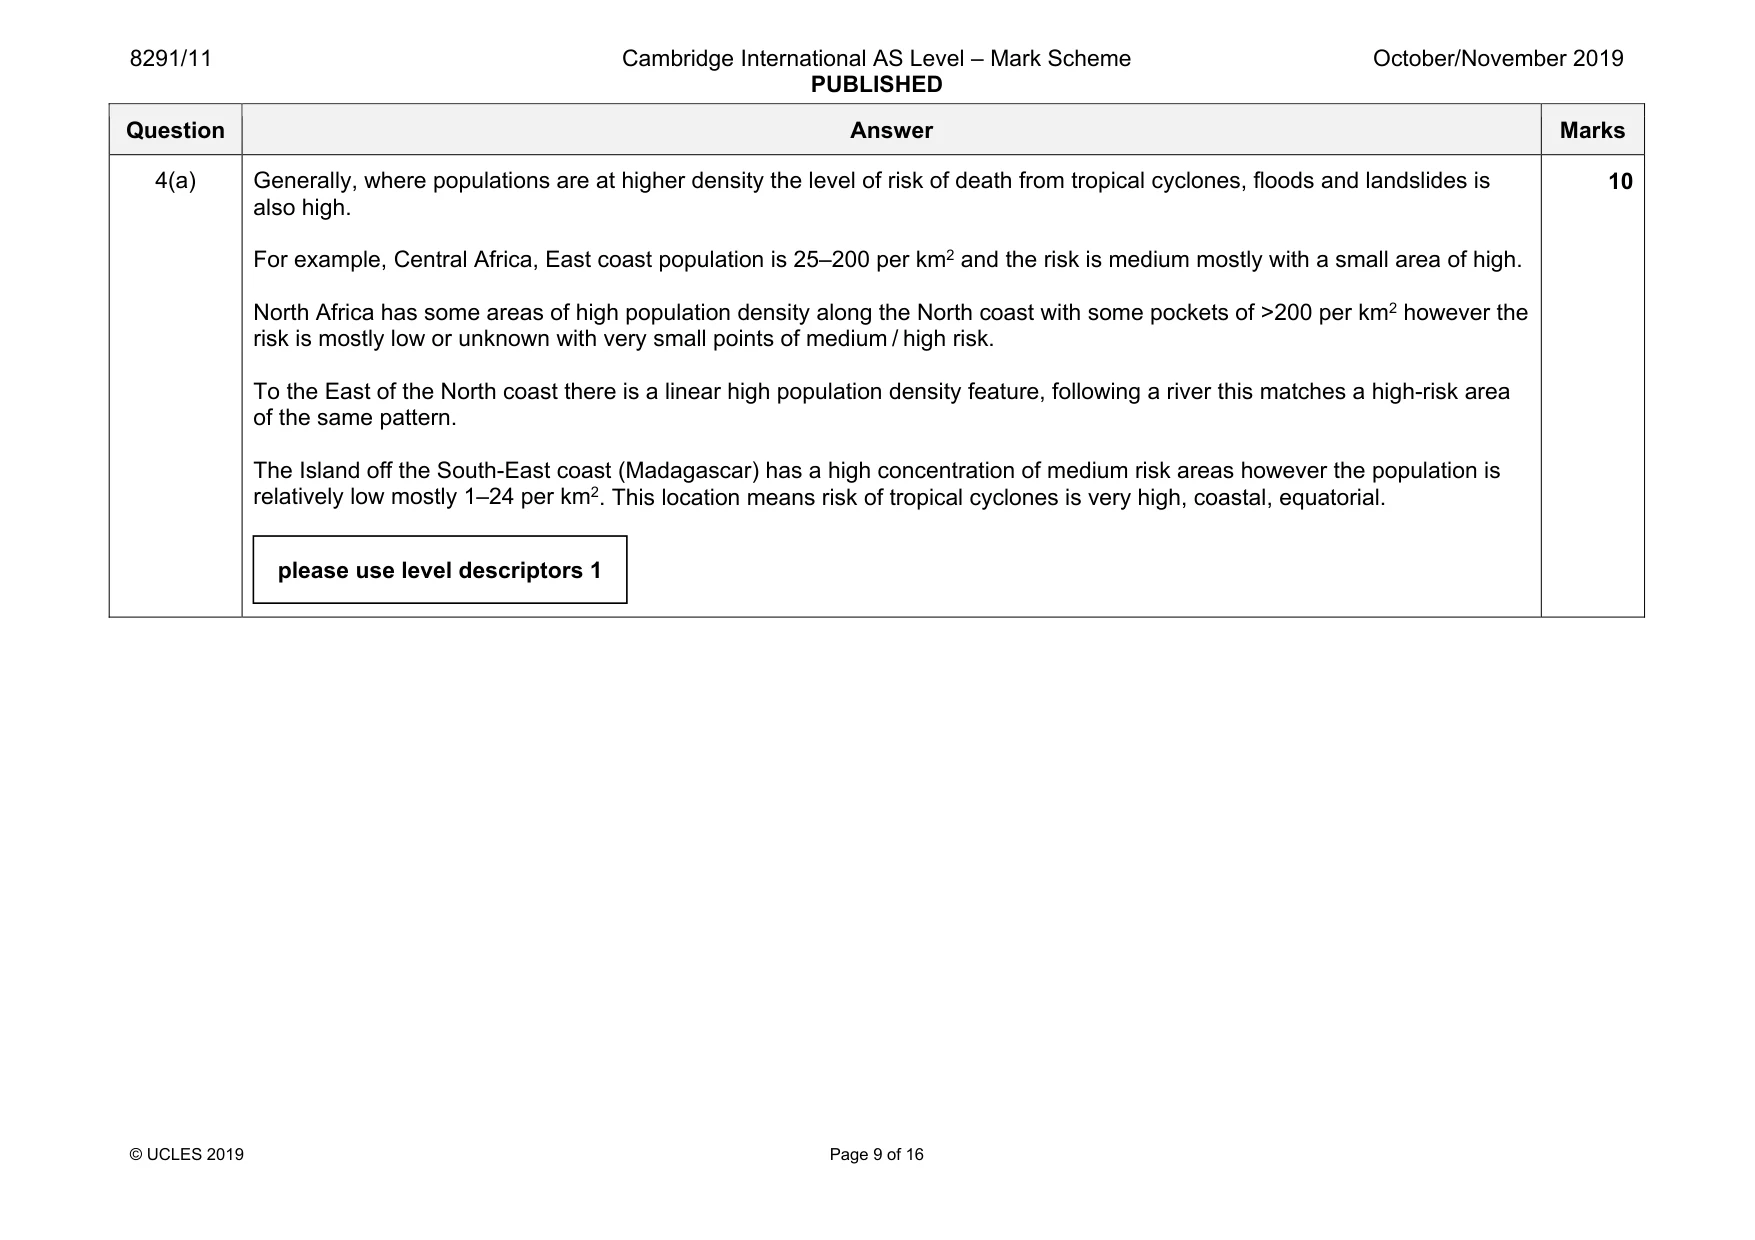
8291/11 Cambridge International AS Level – Mark Scheme PUBLISHED October/November 2019 © UCLES 2019 Page 9 of 16 Question Answer Marks 4(a) Generally, where populations are at higher density the level of risk of death from tropical cyclones, floods and landslides is also high. For example, Central Africa, East coast population is 25–200 per km2 and the risk is medium mostly with a small area of high. North Africa has some areas of high population density along the North coast with some pockets of >200 per km2 however the risk is mostly low or unknown with very small points of medium / high risk. To the East of the North coast there is a linear high population density feature, following a river this matches a high-risk area of the same pattern. The Island off the South-East coast (Madagascar) has a high concentration of medium risk areas however the population is relatively low mostly 1–24 per km2. This location means risk of tropical cyclones is very high, coastal, equatorial. 10 please use level descriptors 1
Mark scheme, page 10
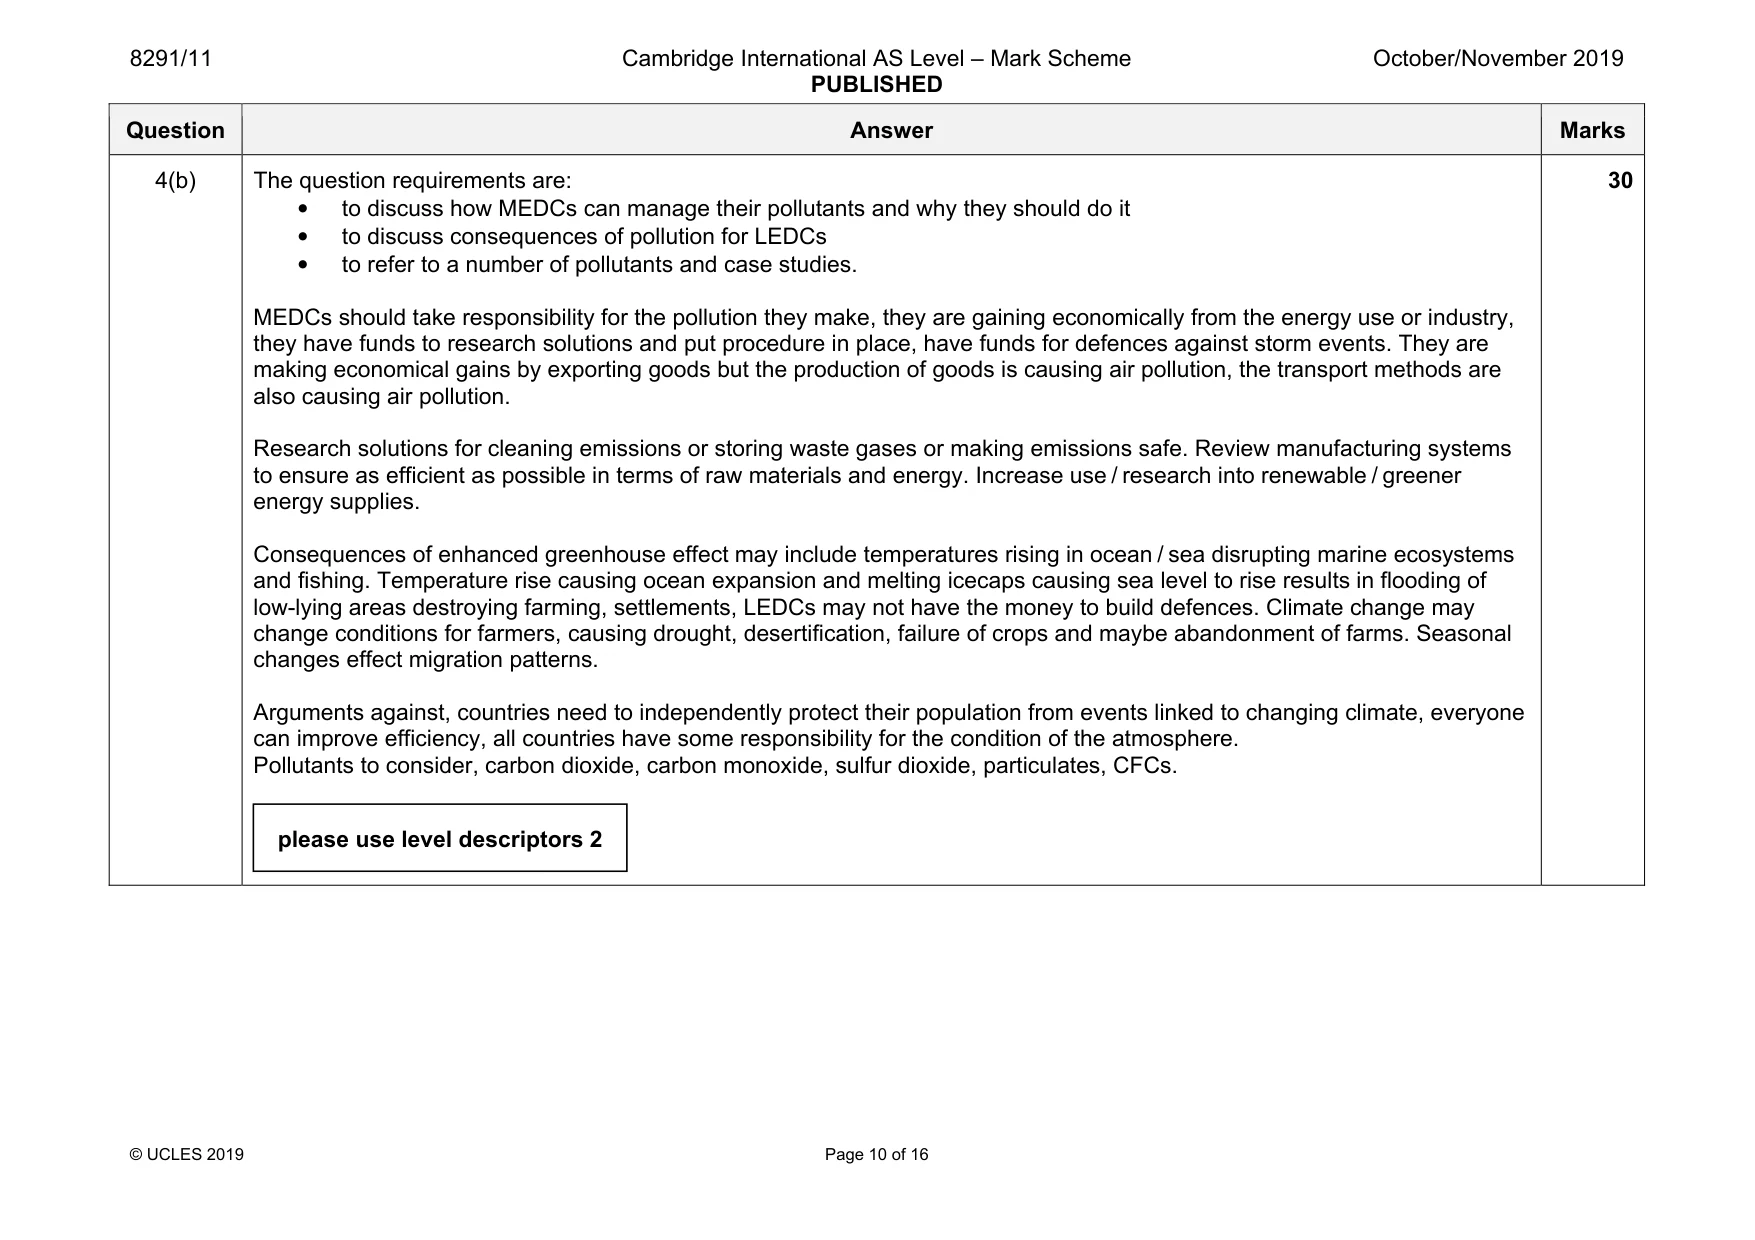
8291/11 Cambridge International AS Level – Mark Scheme PUBLISHED October/November 2019 © UCLES 2019 Page 10 of 16 Question Answer Marks 4(b) The question requirements are: • to discuss how MEDCs can manage their pollutants and why they should do it • to discuss consequences of pollution for LEDCs • to refer to a number of pollutants and case studies. MEDCs should take responsibility for the pollution they make, they are gaining economically from the energy use or industry, they have funds to research solutions and put procedure in place, have funds for defences against storm events. They are making economical gains by exporting goods but the production of goods is causing air pollution, the transport methods are also causing air pollution. Research solutions for cleaning emissions or storing waste gases or making emissions safe. Review manufacturing systems to ensure as efficient as possible in terms of raw materials and energy. Increase use / research into renewable / greener energy supplies. Consequences of enhanced greenhouse effect may include temperatures rising in ocean / sea disrupting marine ecosystems and fishing. Temperature rise causing ocean expansion and melting icecaps causing sea level to rise results in flooding of low-lying areas destroying farming, settlements, LEDCs may not have the money to build defences. Climate change may change conditions for farmers, causing drought, desertification, failure of crops and maybe abandonment of farms. Seasonal changes effect migration patterns. Arguments against, countries need to independently protect their population from events linked to changing climate, everyone can improve efficiency, all countries have some responsibility for the condition of the atmosphere. Pollutants to consider, carbon dioxide, carbon monoxide, sulfur dioxide, particulates, CFCs. 30 please use level descriptors 2
Mark scheme, page 11
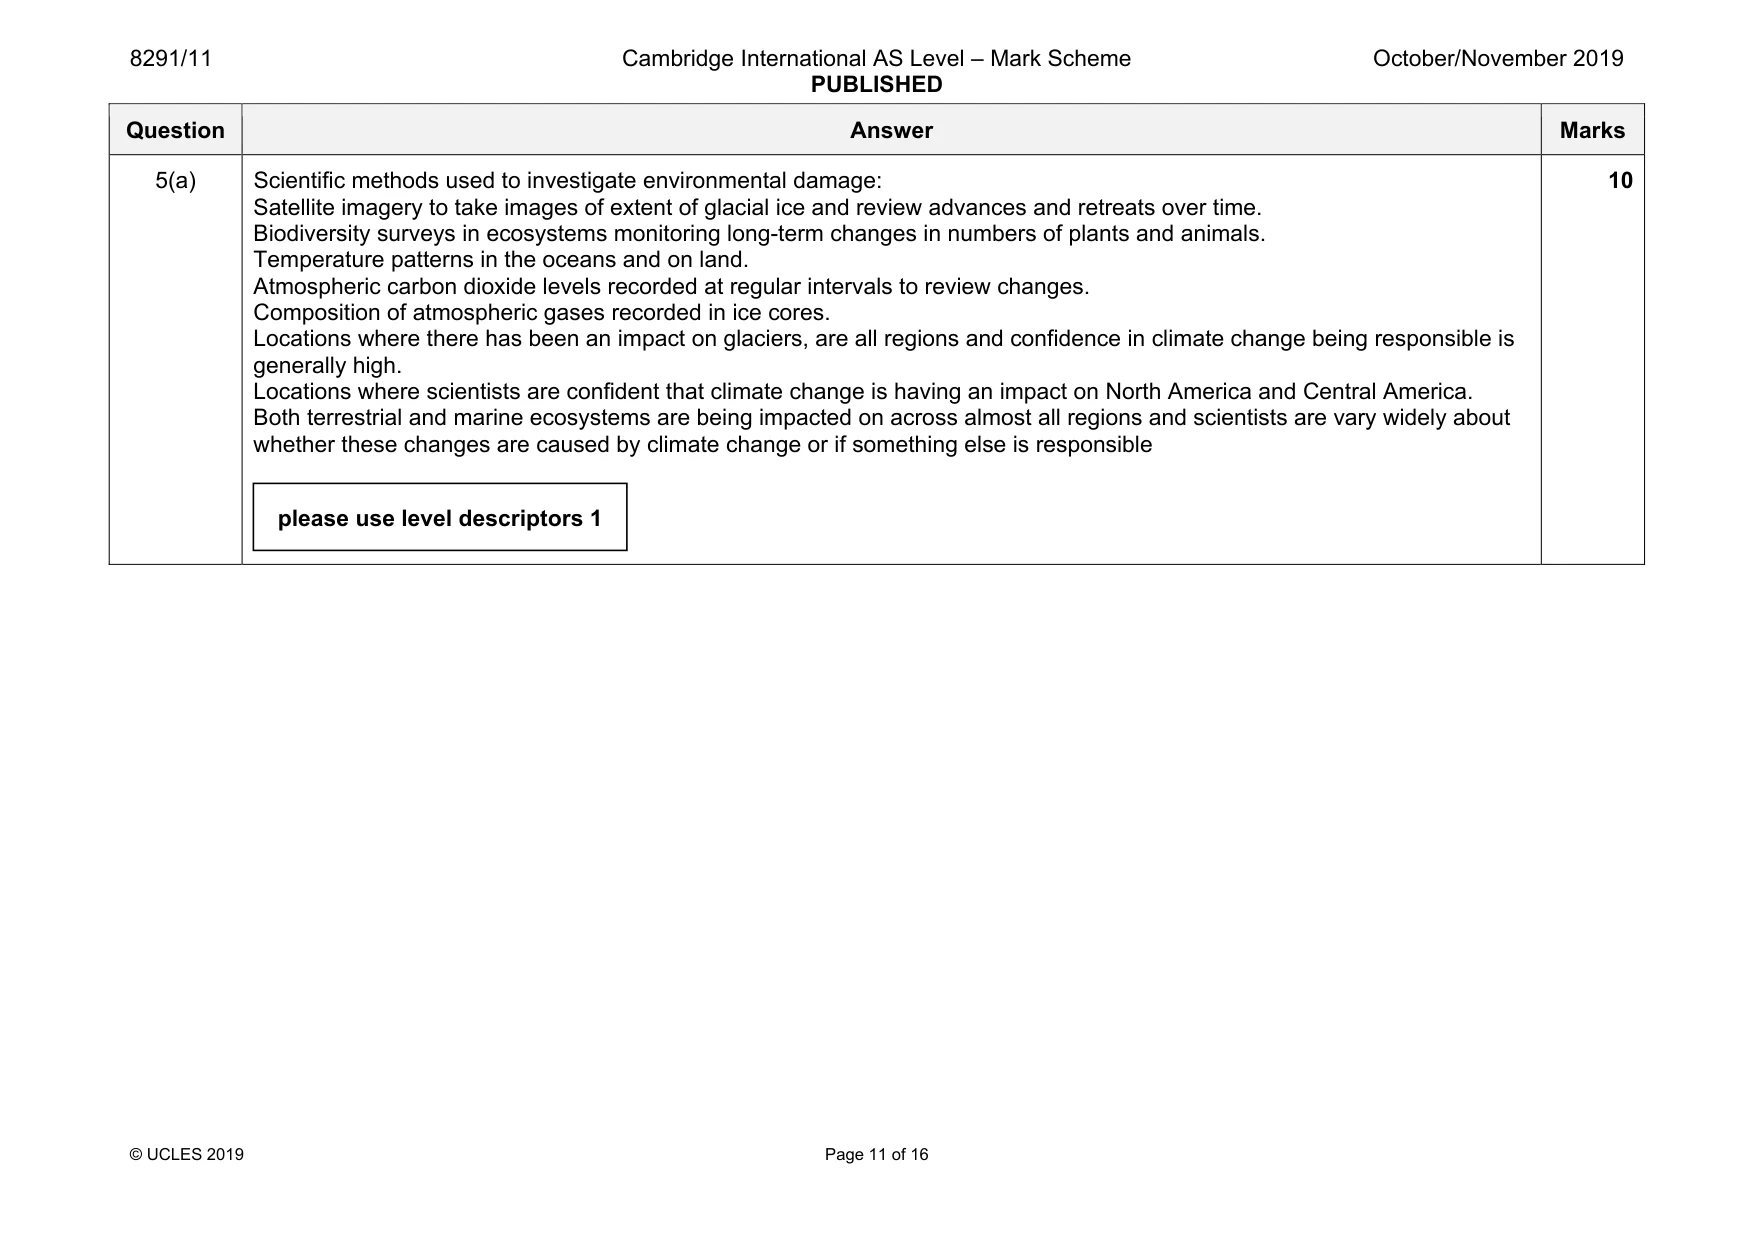
8291/11 Cambridge International AS Level – Mark Scheme PUBLISHED October/November 2019 © UCLES 2019 Page 11 of 16 Question Answer Marks 5(a) Scientific methods used to investigate environmental damage: Satellite imagery to take images of extent of glacial ice and review advances and retreats over time. Biodiversity surveys in ecosystems monitoring long-term changes in numbers of plants and animals. Temperature patterns in the oceans and on land. Atmospheric carbon dioxide levels recorded at regular intervals to review changes. Composition of atmospheric gases recorded in ice cores. Locations where there has been an impact on glaciers, are all regions and confidence in climate change being responsible is generally high. Locations where scientists are confident that climate change is having an impact on North America and Central America. Both terrestrial and marine ecosystems are being impacted on across almost all regions and scientists are vary widely about whether these changes are caused by climate change or if something else is responsible 10 please use level descriptors 1
Mark scheme, page 12
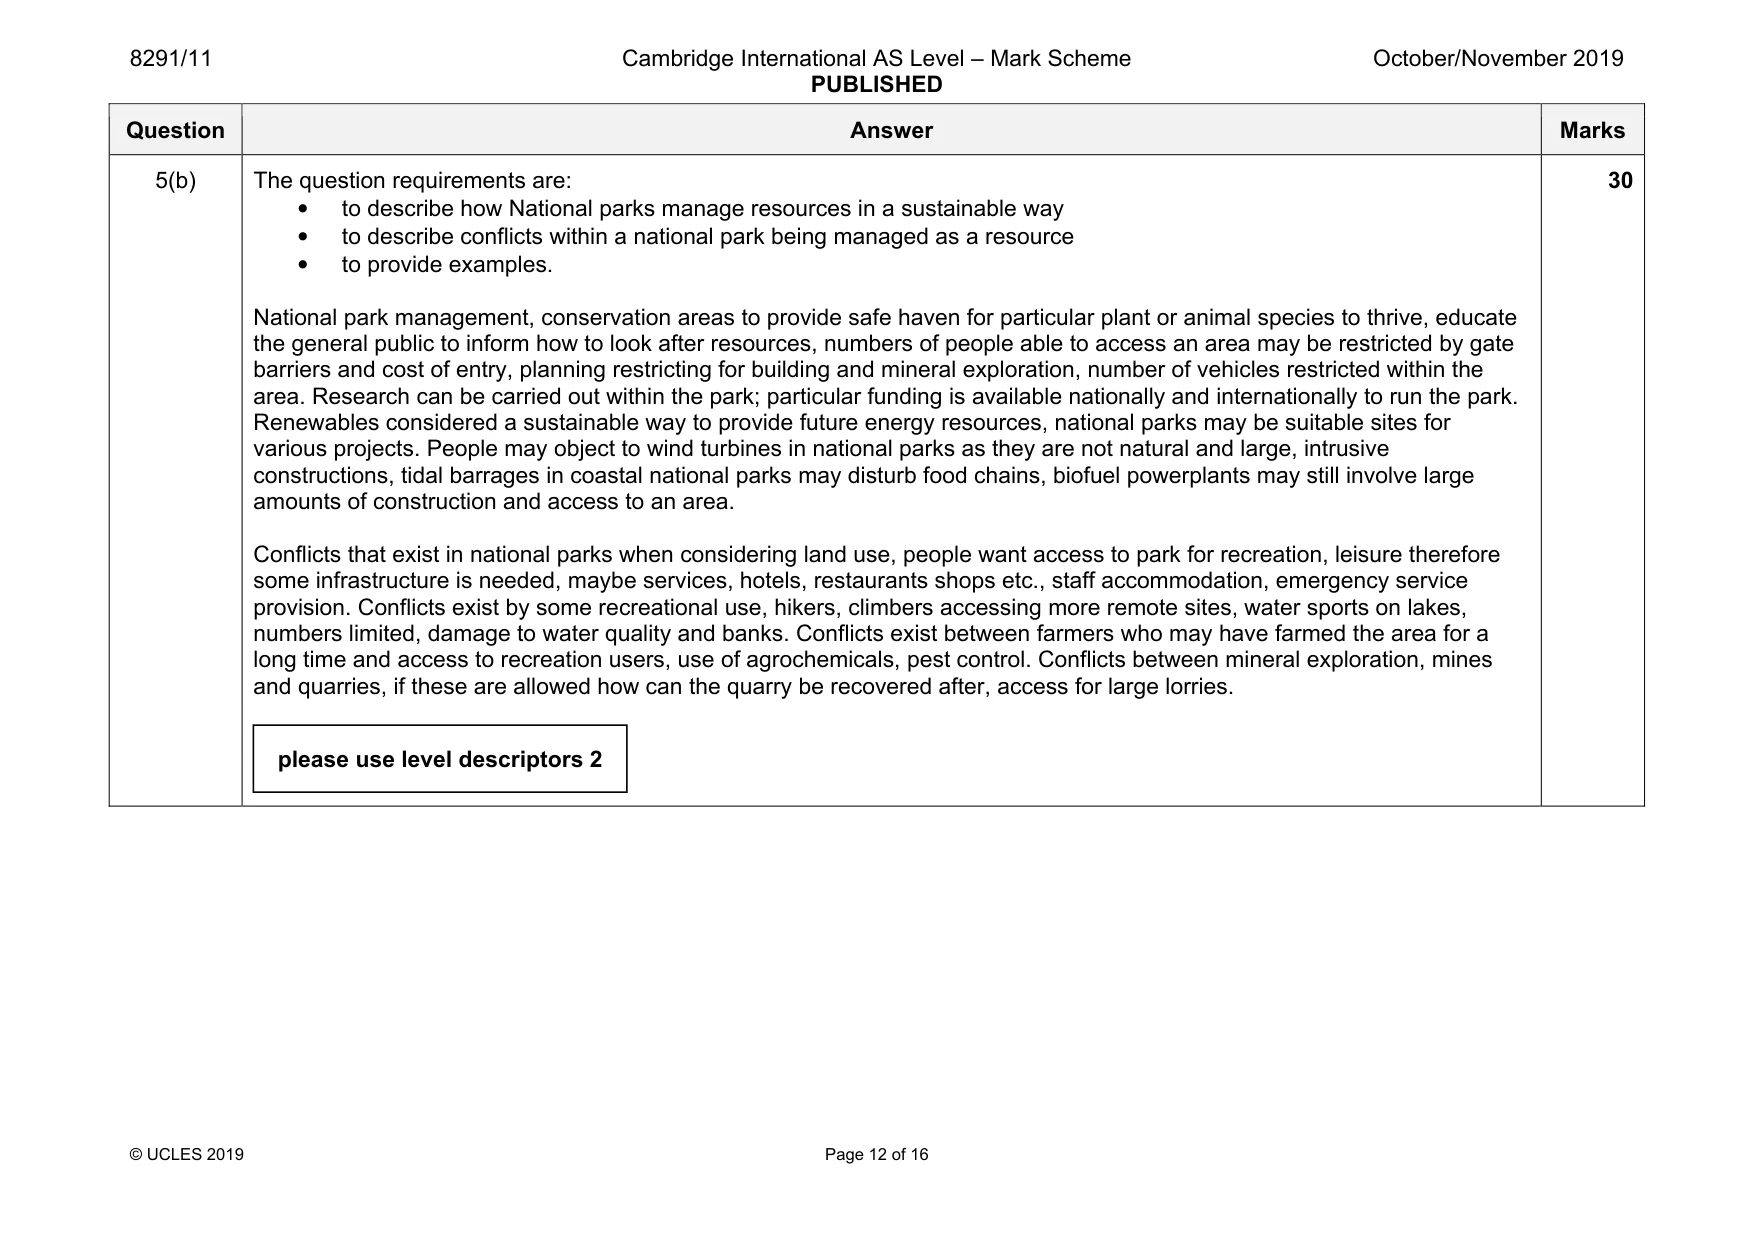
8291/11 Cambridge International AS Level – Mark Scheme PUBLISHED October/November 2019 © UCLES 2019 Page 12 of 16 Question Answer Marks 5(b) The question requirements are: • to describe how National parks manage resources in a sustainable way • to describe conflicts within a national park being managed as a resource • to provide examples. National park management, conservation areas to provide safe haven for particular plant or animal species to thrive, educate the general public to inform how to look after resources, numbers of people able to access an area may be restricted by gate barriers and cost of entry, planning restricting for building and mineral exploration, number of vehicles restricted within the area. Research can be carried out within the park; particular funding is available nationally and internationally to run the park. Renewables considered a sustainable way to provide future energy resources, national parks may be suitable sites for various projects. People may object to wind turbines in national parks as they are not natural and large, intrusive constructions, tidal barrages in coastal national parks may disturb food chains, biofuel powerplants may still involve large amounts of construction and access to an area. Conflicts that exist in national parks when considering land use, people want access to park for recreation, leisure therefore some infrastructure is needed, maybe services, hotels, restaurants shops etc., staff accommodation, emergency service provision. Conflicts exist by some recreational use, hikers, climbers accessing more remote sites, water sports on lakes, numbers limited, damage to water quality and banks. Conflicts exist between farmers who may have farmed the area for a long time and access to recreation users, use of agrochemicals, pest control. Conflicts between mineral exploration, mines and quarries, if these are allowed how can the quarry be recovered after, access for large lorries. 30 please use level descriptors 2
Mark scheme, page 13
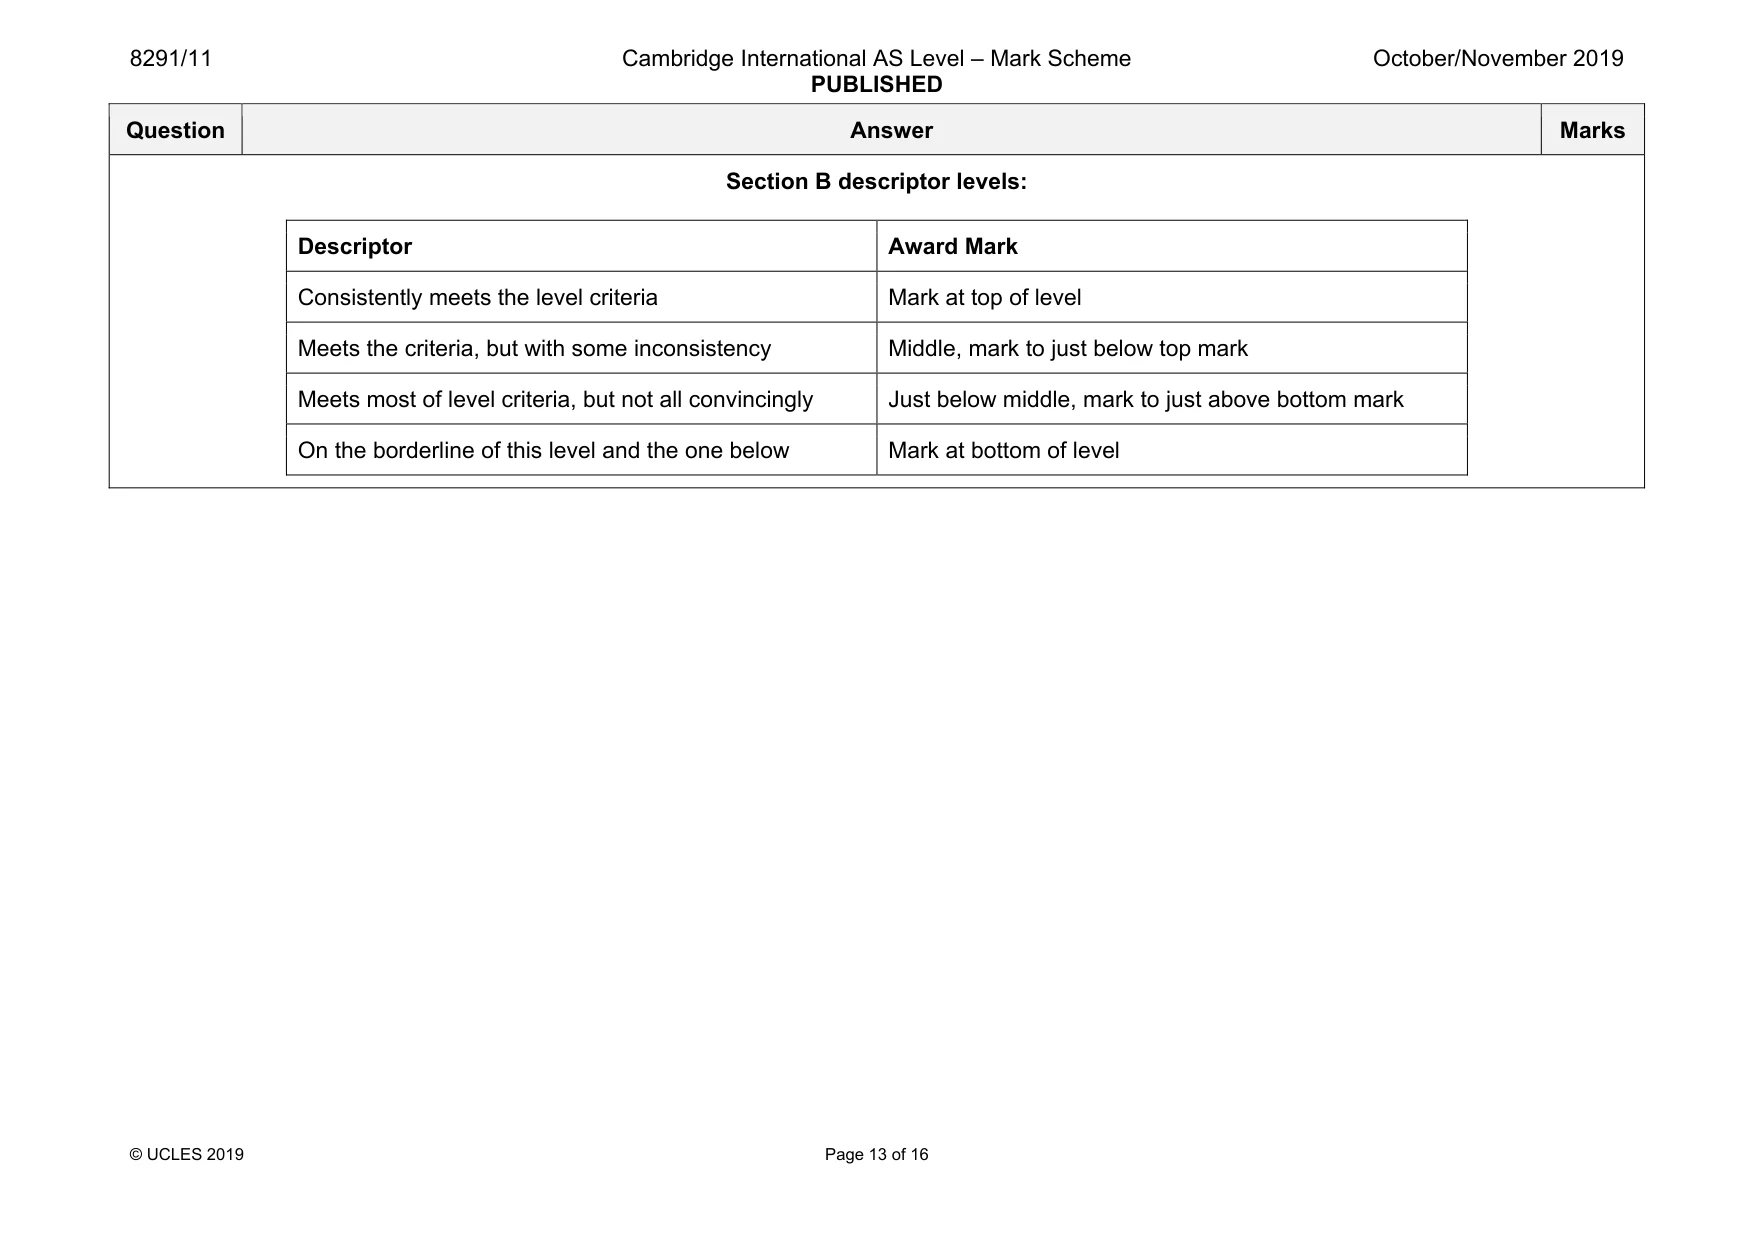
8291/11 Cambridge International AS Level – Mark Scheme PUBLISHED October/November 2019 © UCLES 2019 Page 13 of 16 Question Answer Marks Section B descriptor levels: Descriptor Award Mark Consistently meets the level criteria Mark at top of level Meets the criteria, but with some inconsistency Middle, mark to just below top mark Meets most of level criteria, but not all convincingly Just below middle, mark to just above bottom mark On the borderline of this level and the one below Mark at bottom of level
Mark scheme, page 14
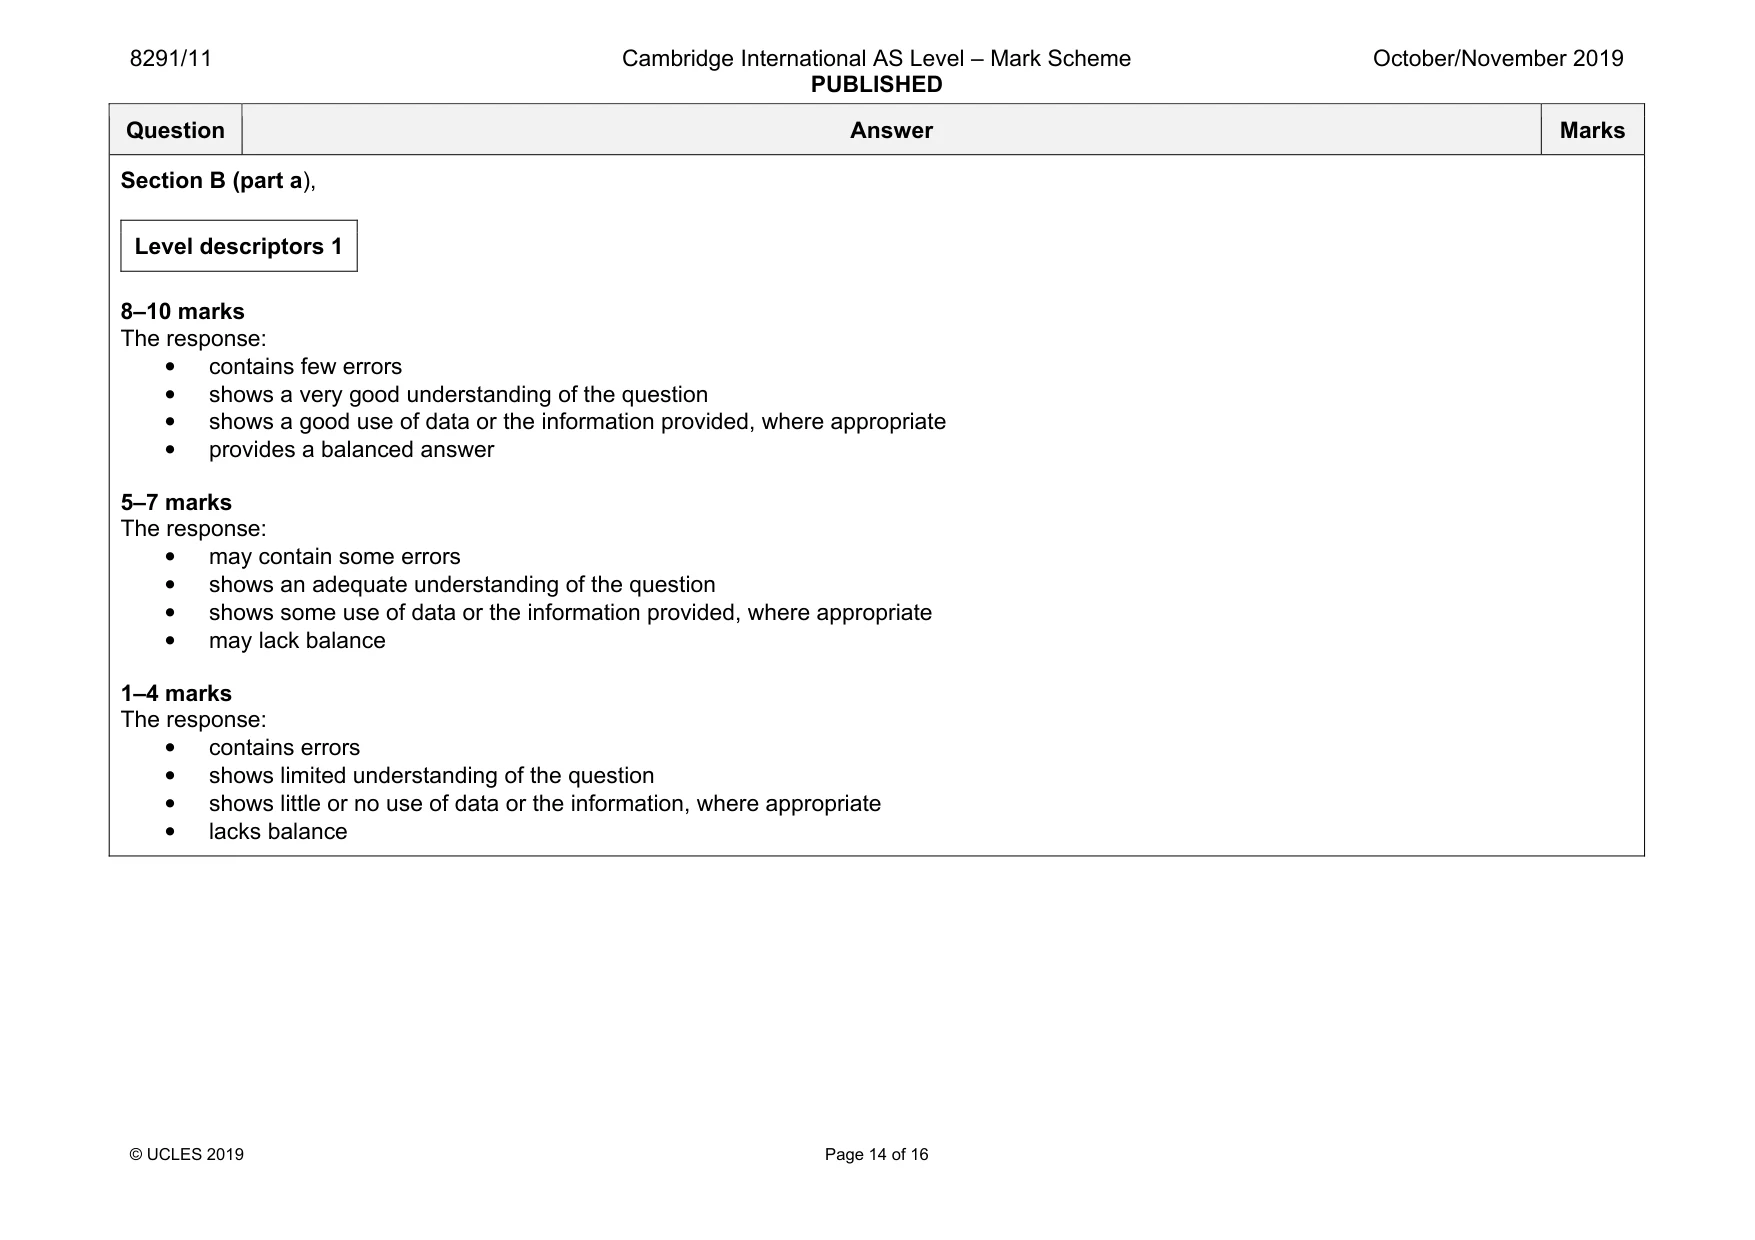
8291/11 Cambridge International AS Level – Mark Scheme PUBLISHED October/November 2019 © UCLES 2019 Page 14 of 16 Question Answer Marks Section B (part a), Level descriptors 1 8–10 marks The response: • contains few errors • shows a very good understanding of the question • shows a good use of data or the information provided, where appropriate • provides a balanced answer 5–7 marks The response: • may contain some errors • shows an adequate understanding of the question • shows some use of data or the information provided, where appropriate • may lack balance 1–4 marks The response: • contains errors • shows limited understanding of the question • shows little or no use of data or the information, where appropriate • lacks balance
Mark scheme, page 15
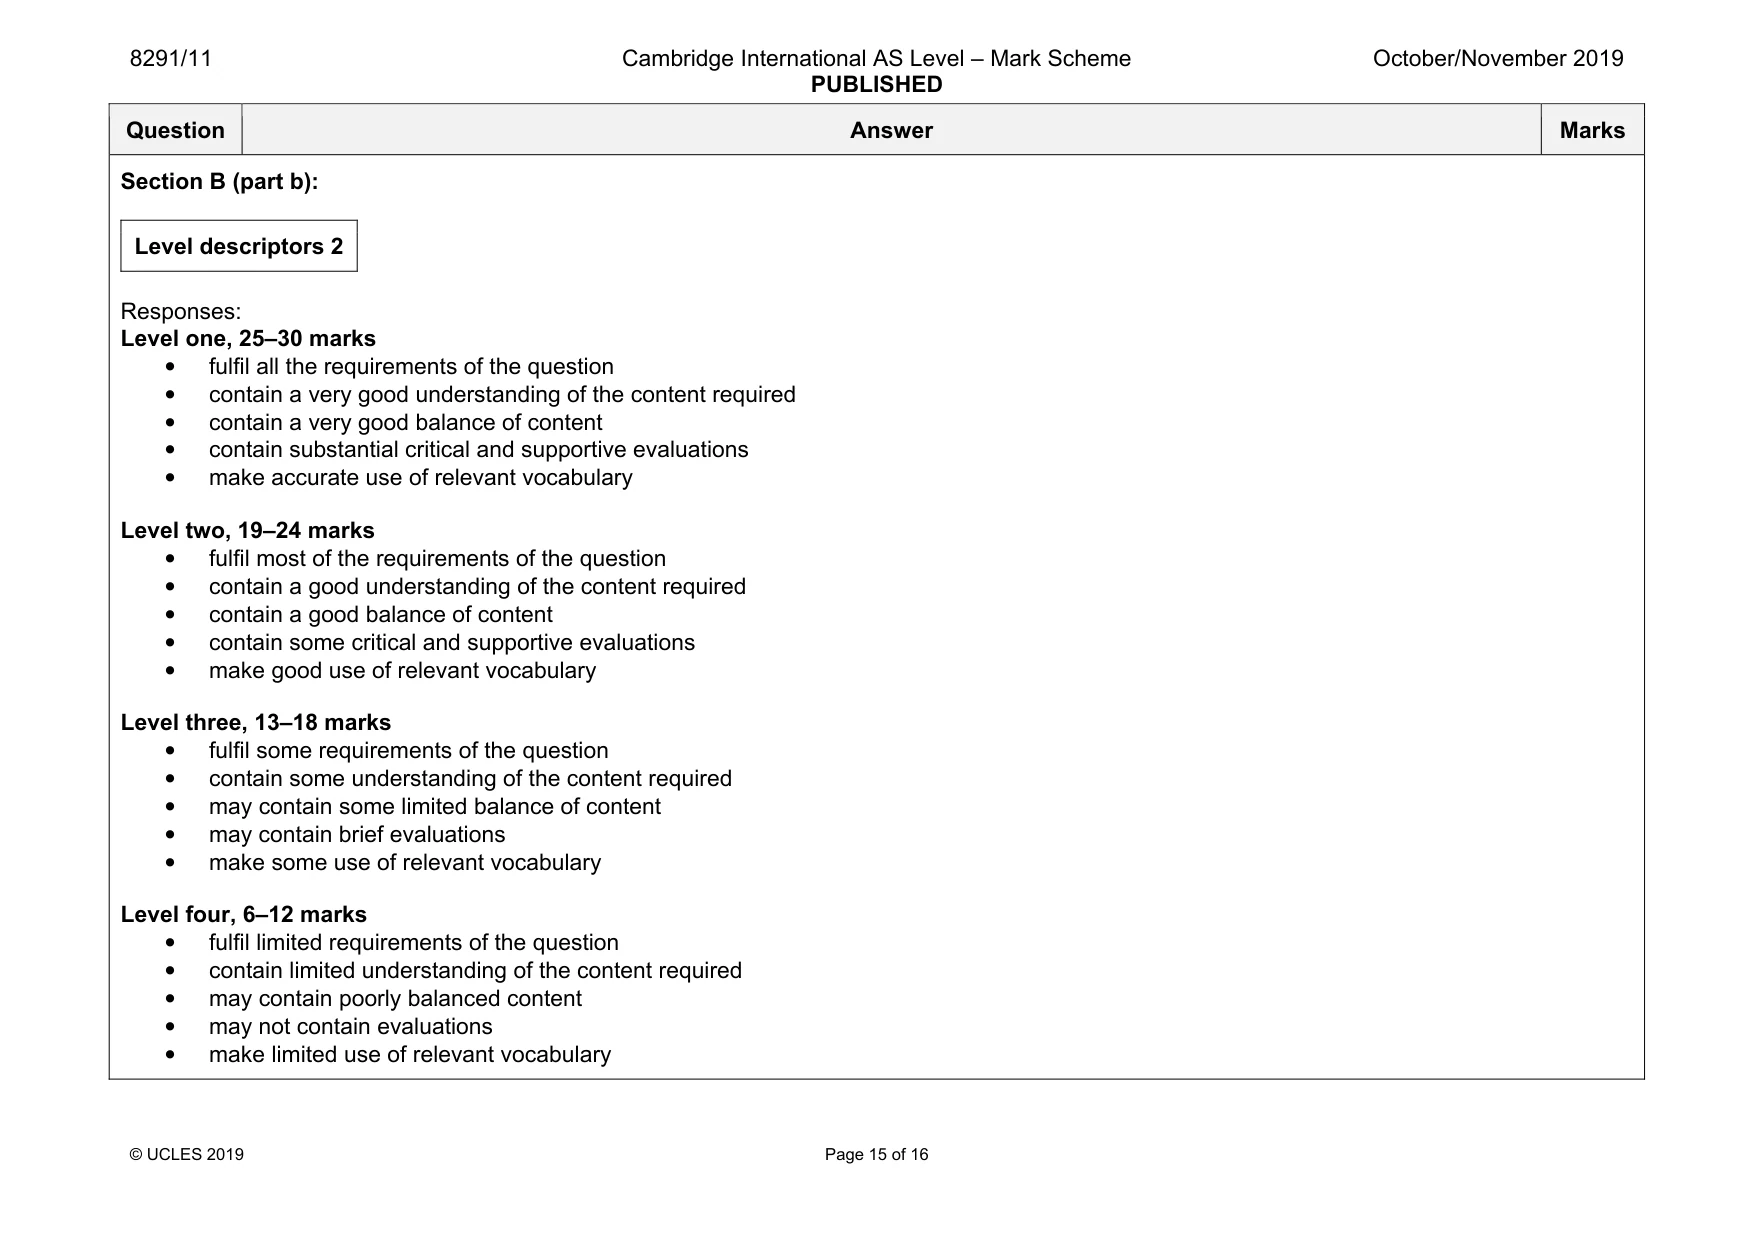
8291/11 Cambridge International AS Level – Mark Scheme PUBLISHED October/November 2019 © UCLES 2019 Page 15 of 16 Question Answer Marks Section B (part b): Level descriptors 2 Responses: Level one, 25–30 marks • fulfil all the requirements of the question • contain a very good understanding of the content required • contain a very good balance of content • contain substantial critical and supportive evaluations • make accurate use of relevant vocabulary Level two, 19–24 marks • fulfil most of the requirements of the question • contain a good understanding of the content required • contain a good balance of content • contain some critical and supportive evaluations • make good use of relevant vocabulary Level three, 13–18 marks • fulfil some requirements of the question • contain some understanding of the content required • may contain some limited balance of content • may contain brief evaluations • make some use of relevant vocabulary Level four, 6–12 marks • fulfil limited requirements of the question • contain limited understanding of the content required • may contain poorly balanced content • may not contain evaluations • make limited use of relevant vocabulary
Mark scheme, page 16
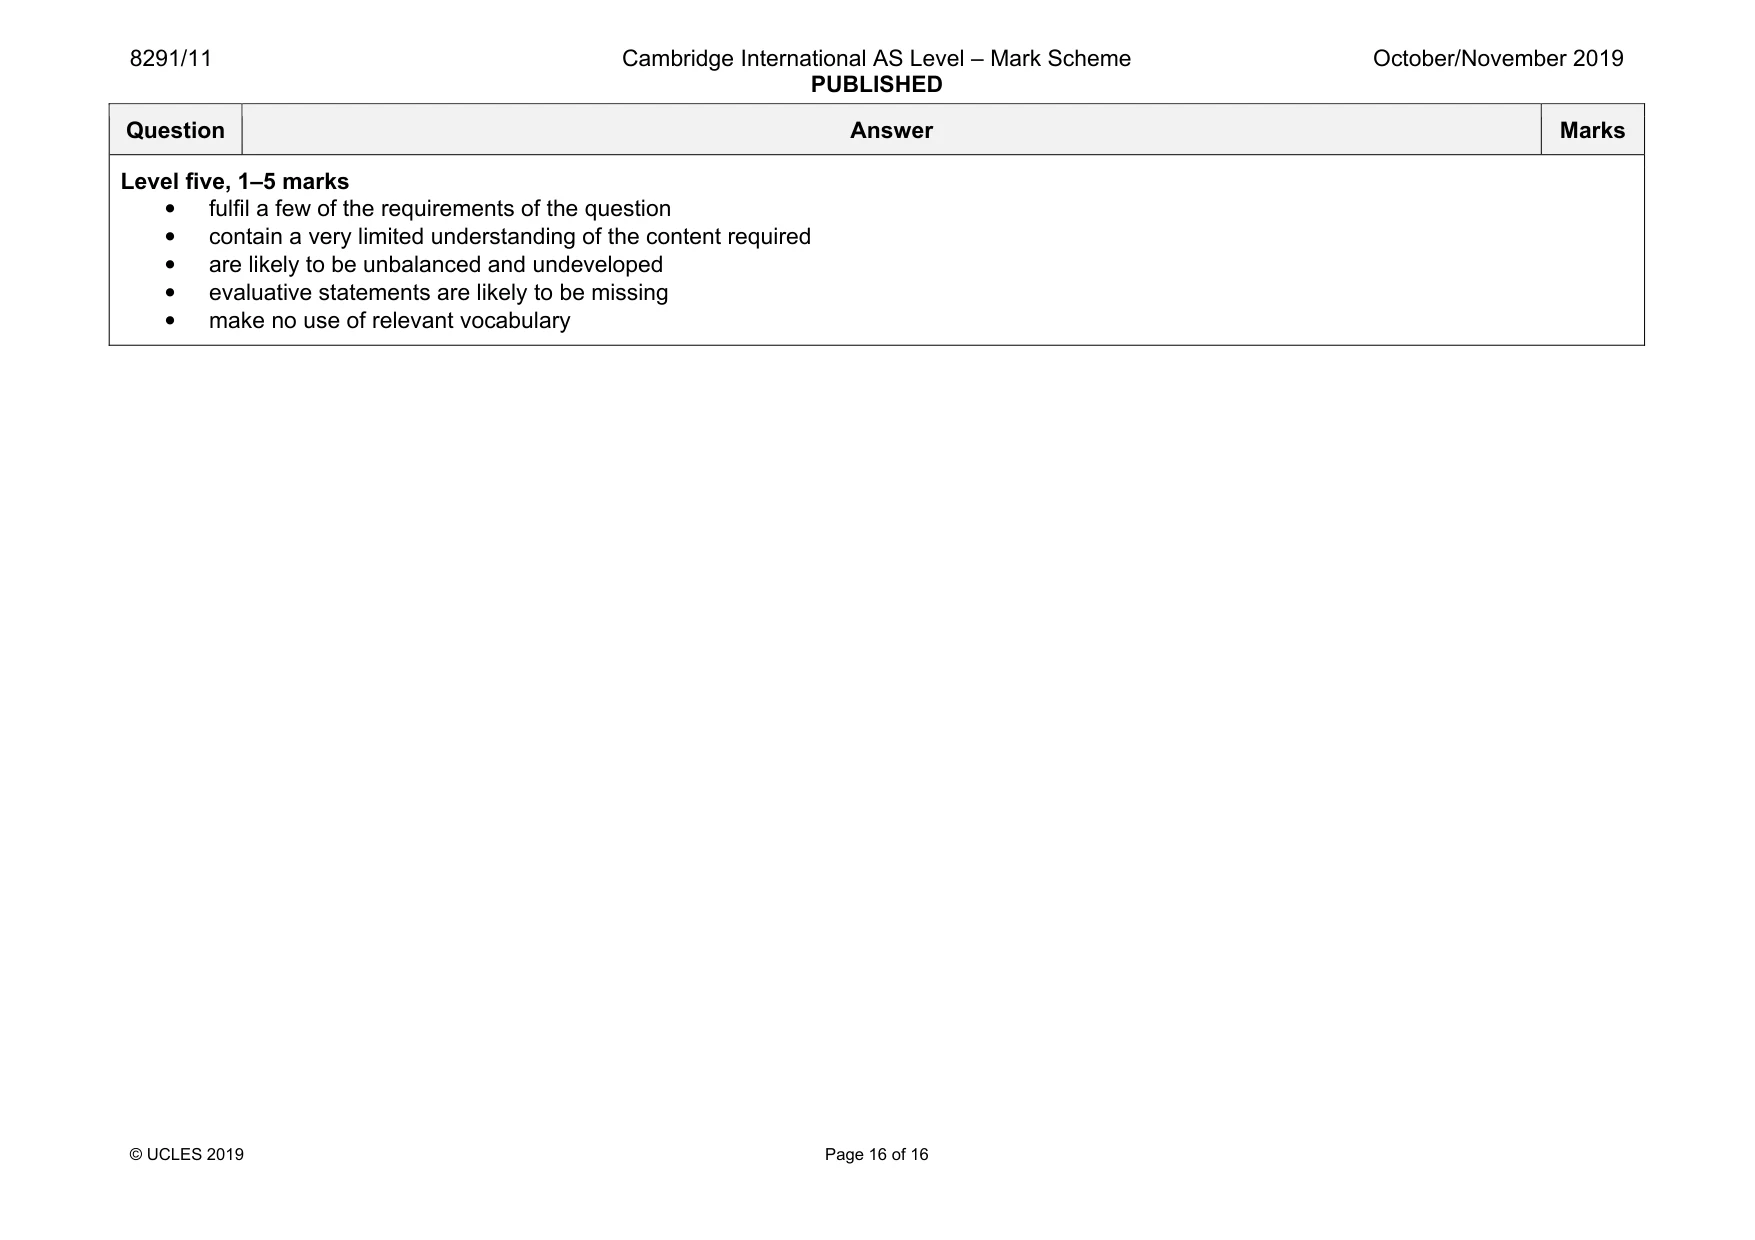
8291/11 Cambridge International AS Level – Mark Scheme PUBLISHED October/November 2019 © UCLES 2019 Page 16 of 16 Question Answer Marks Level five, 1–5 marks • fulfil a few of the requirements of the question • contain a very limited understanding of the content required • are likely to be unbalanced and undeveloped • evaluative statements are likely to be missing • make no use of relevant vocabulary
What you needed in this session
Cambridge’s own grade thresholds for 2019 Oct/Nov, Paper 1 · Variant 1. A higher threshold means an easier paper — the bar moves with how the cohort did.