Cambridge A Level Environmental Management (AS only) 8291 — 2019 Oct/Nov Paper 1 · Variant 2
8291/12/O/N/19 · 80 marks · ≈90 min
The question paper and its mark scheme, free to read here and free to download. This is Cambridge’s own paper, exactly as it was sat.
Question paper12 pages

Mark scheme16 pages
Answers below. Sit the paper first if you are practising.
Paper as text
Question paper, page 1
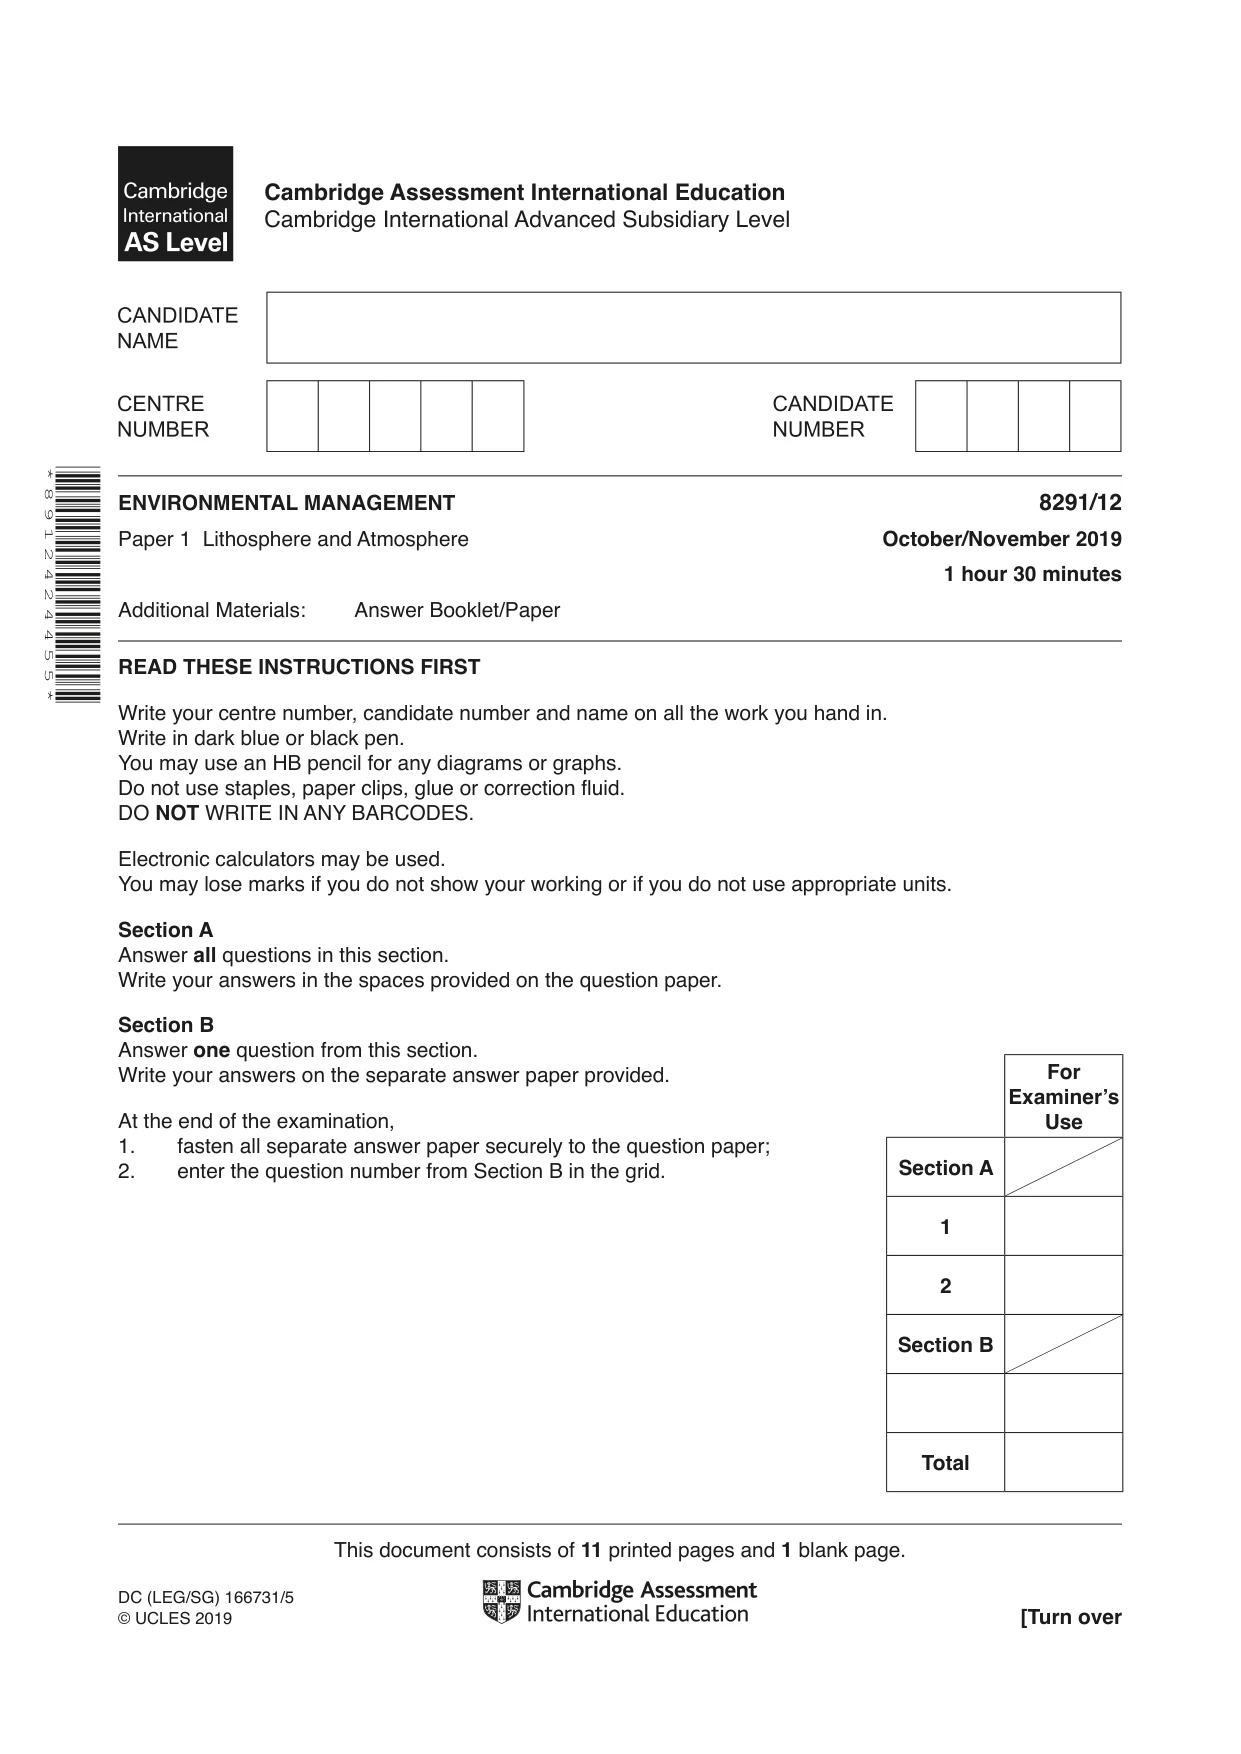
This document consists of 11 printed pages and 1 blank page. DC (LEG/SG) 166731/5 © UCLES 2019 [Turn over * 8 9 1 2 4 2 4 4 5 5 * ENVIRONMENTAL MANAGEMENT 8291/12 Paper 1 Lithosphere and Atmosphere October/November 2019 1 hour 30 minutes Additional Materials: Answer Booklet/Paper READ THESE INSTRUCTIONS FIRST Write your centre number, candidate number and name on all the work you hand in. Write in dark blue or black pen. You may use an HB pencil for any diagrams or graphs. Do not use staples, paper clips, glue or correction fluid. DO NOT WRITE IN ANY BARCODES. Electronic calculators may be used. You may lose marks if you do not show your working or if you do not use appropriate units. Section A Answer all questions in this section. Write your answers in the spaces provided on the question paper. Section B Answer one question from this section. Write your answers on the separate answer paper provided. At the end of the examination, 1. fasten all separate answer paper securely to the question paper; 2. enter the question number from Section B in the grid. Cambridge Assessment International Education Cambridge International Advanced Subsidiary Level For Examiner’s Use Section A 1 2 Section B Total
Question paper, page 2
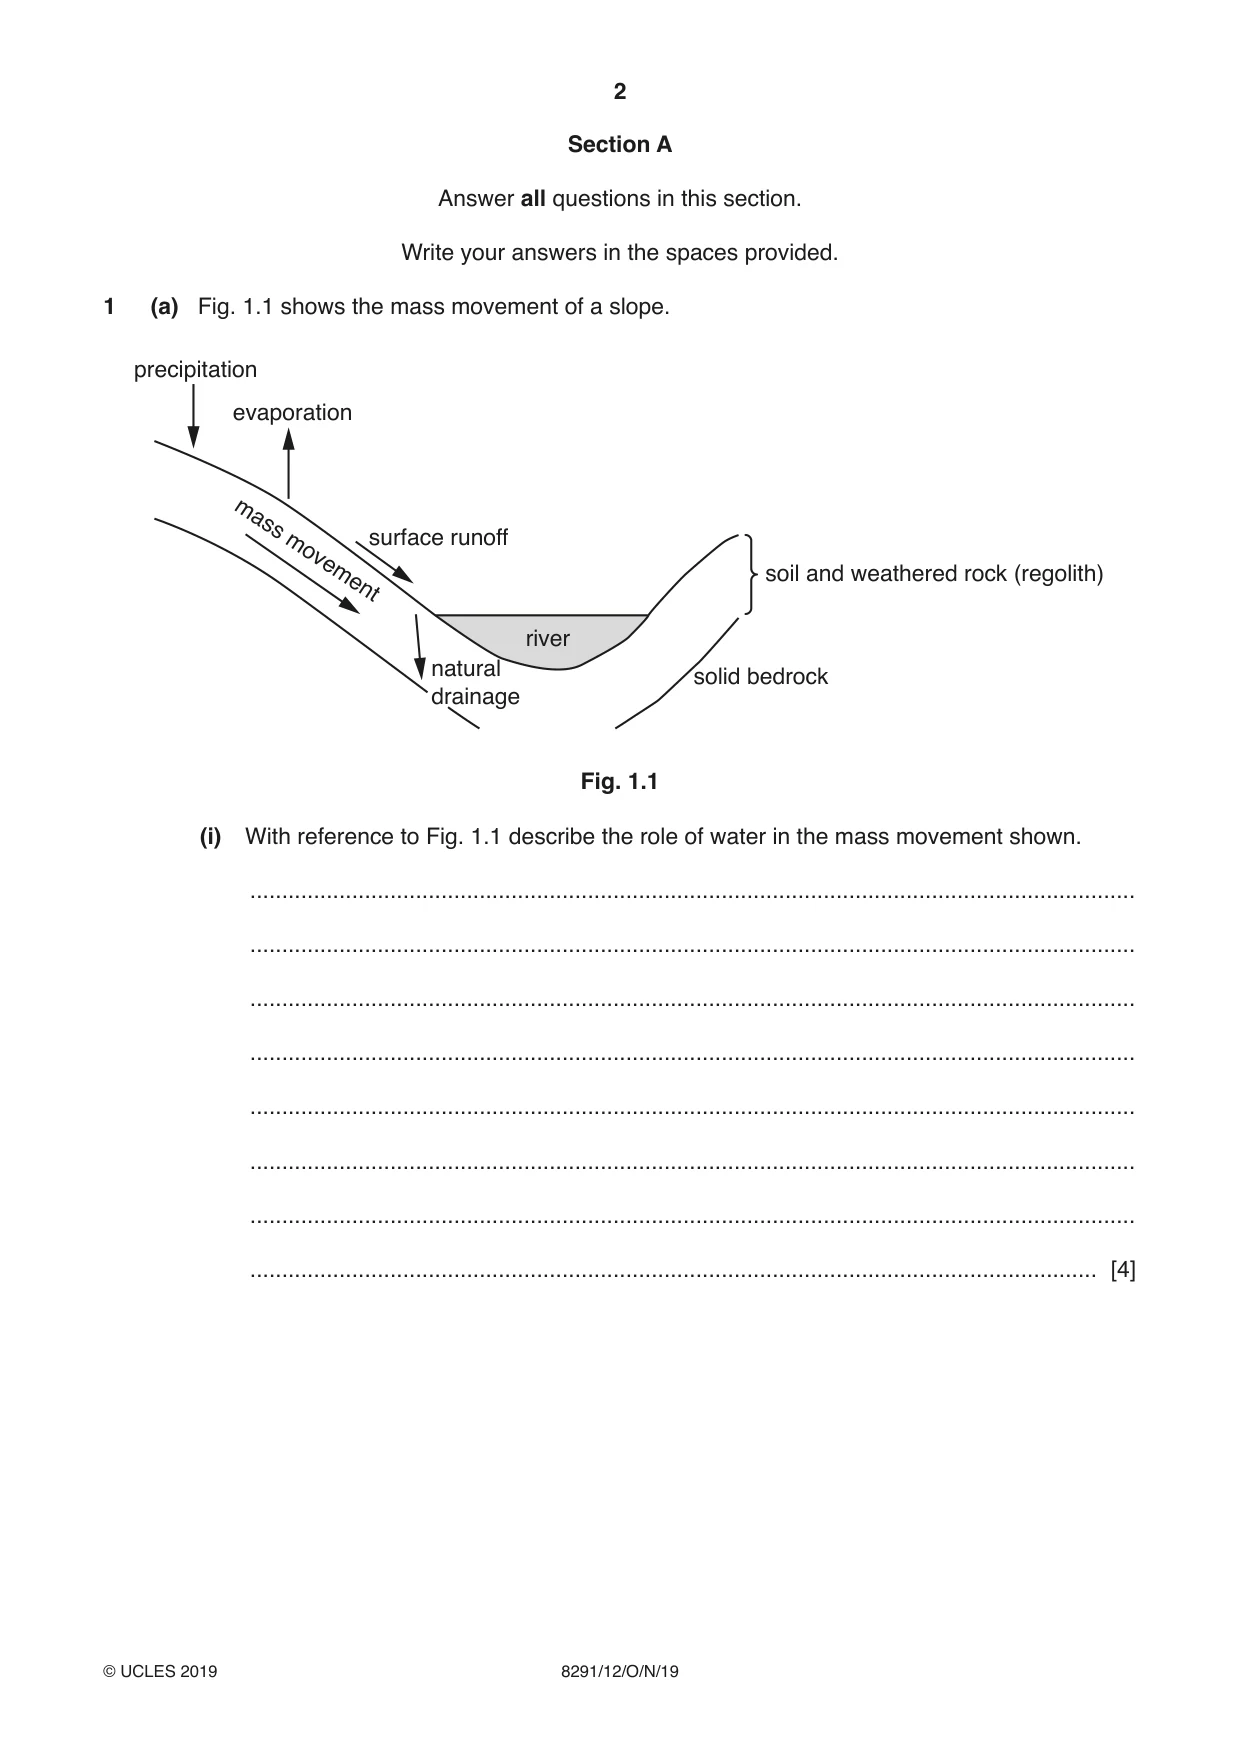
2 8291/12/O/N/19 © UCLES 2019 Section A Answer all questions in this section. Write your answers in the spaces provided. 1 (a) Fig. 1.1 shows the mass movement of a slope. precipitation evaporation surface runoff river solid bedrock natural drainage mass movement soil and weathered rock (regolith) Fig. 1.1 (i) With reference to Fig. 1.1 describe the role of water in the mass movement shown. … … … … … … … … [4]
Question paper, page 3
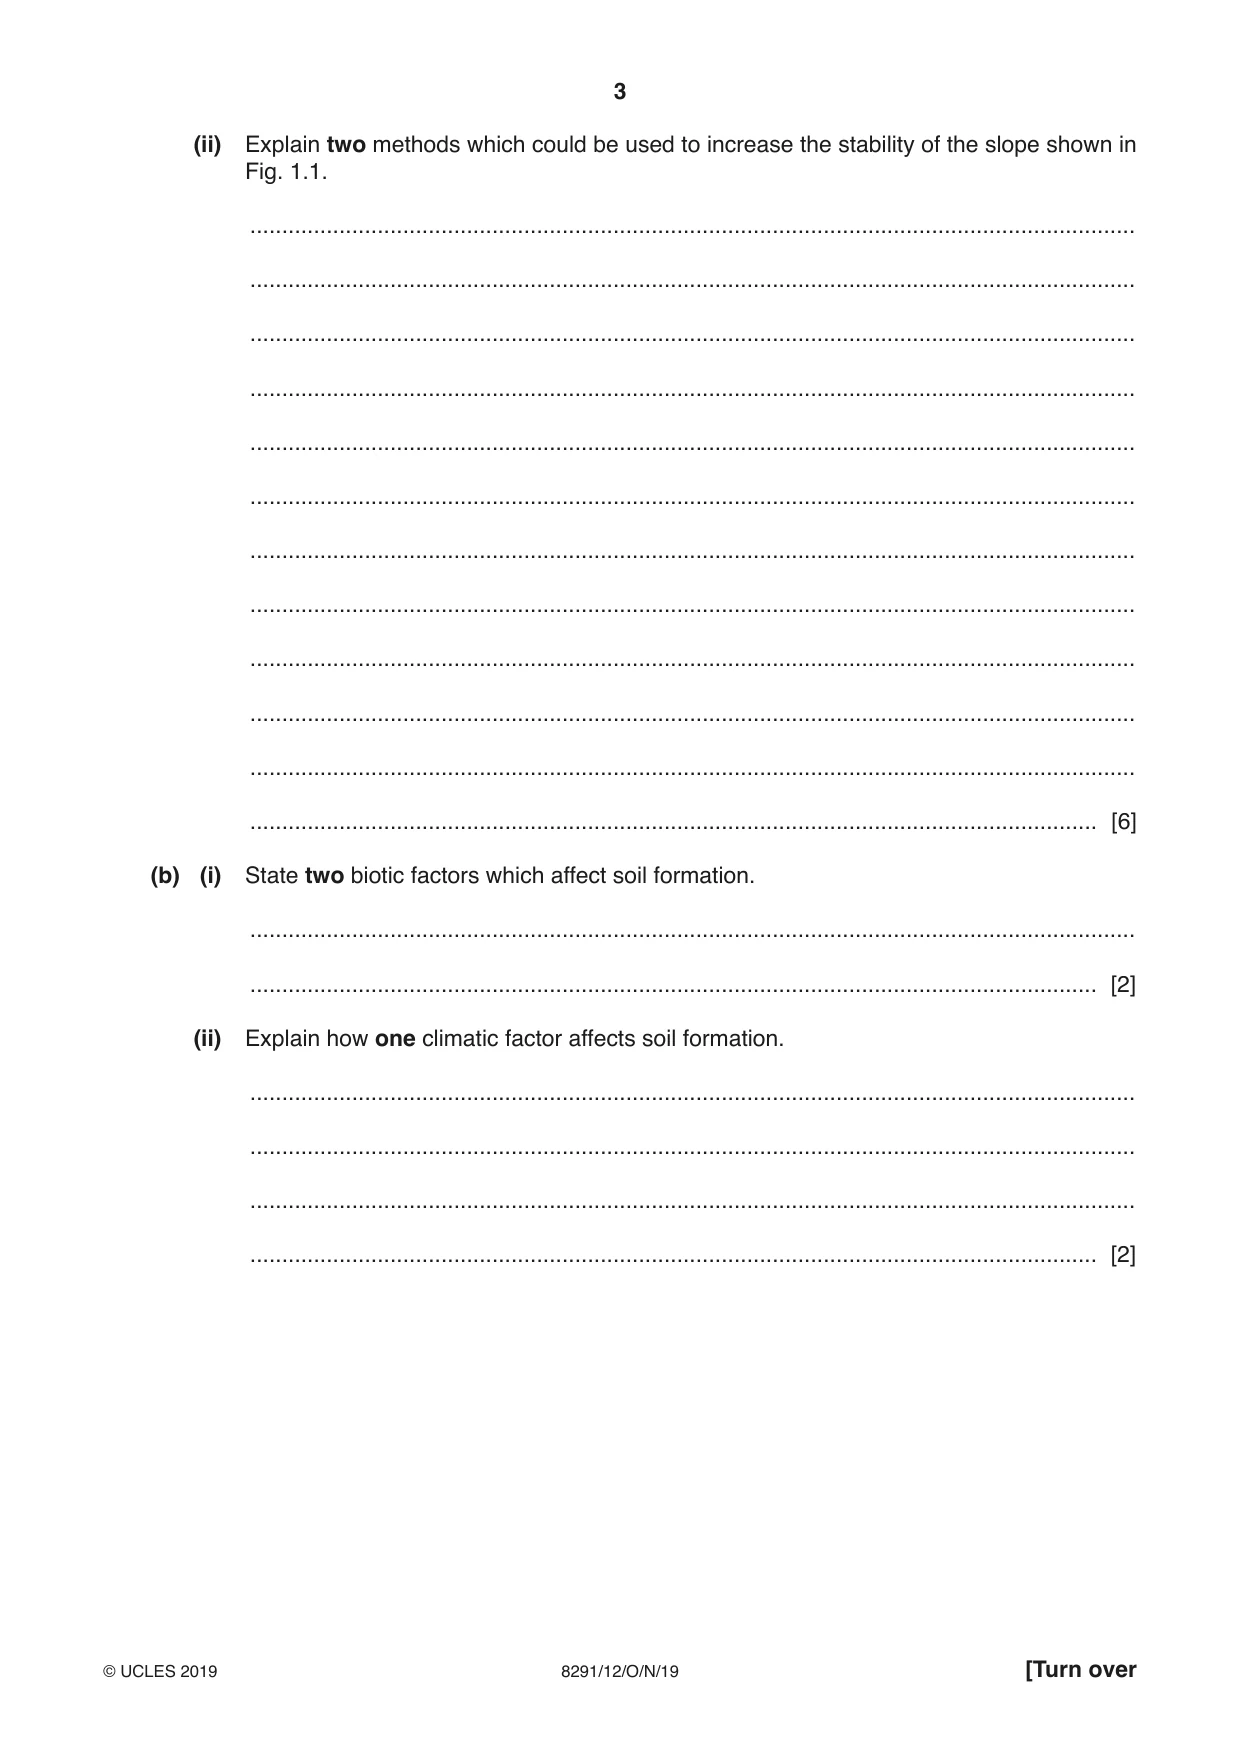
3 8291/12/O/N/19 © UCLES 2019 [Turn over (ii) Explain two methods which could be used to increase the stability of the slope shown in Fig. 1.1. … … … … … … … … … … … … [6] (b) (i) State two biotic factors which affect soil formation. … … [2] (ii) Explain how one climatic factor affects soil formation. … … … … [2]
Question paper, page 4
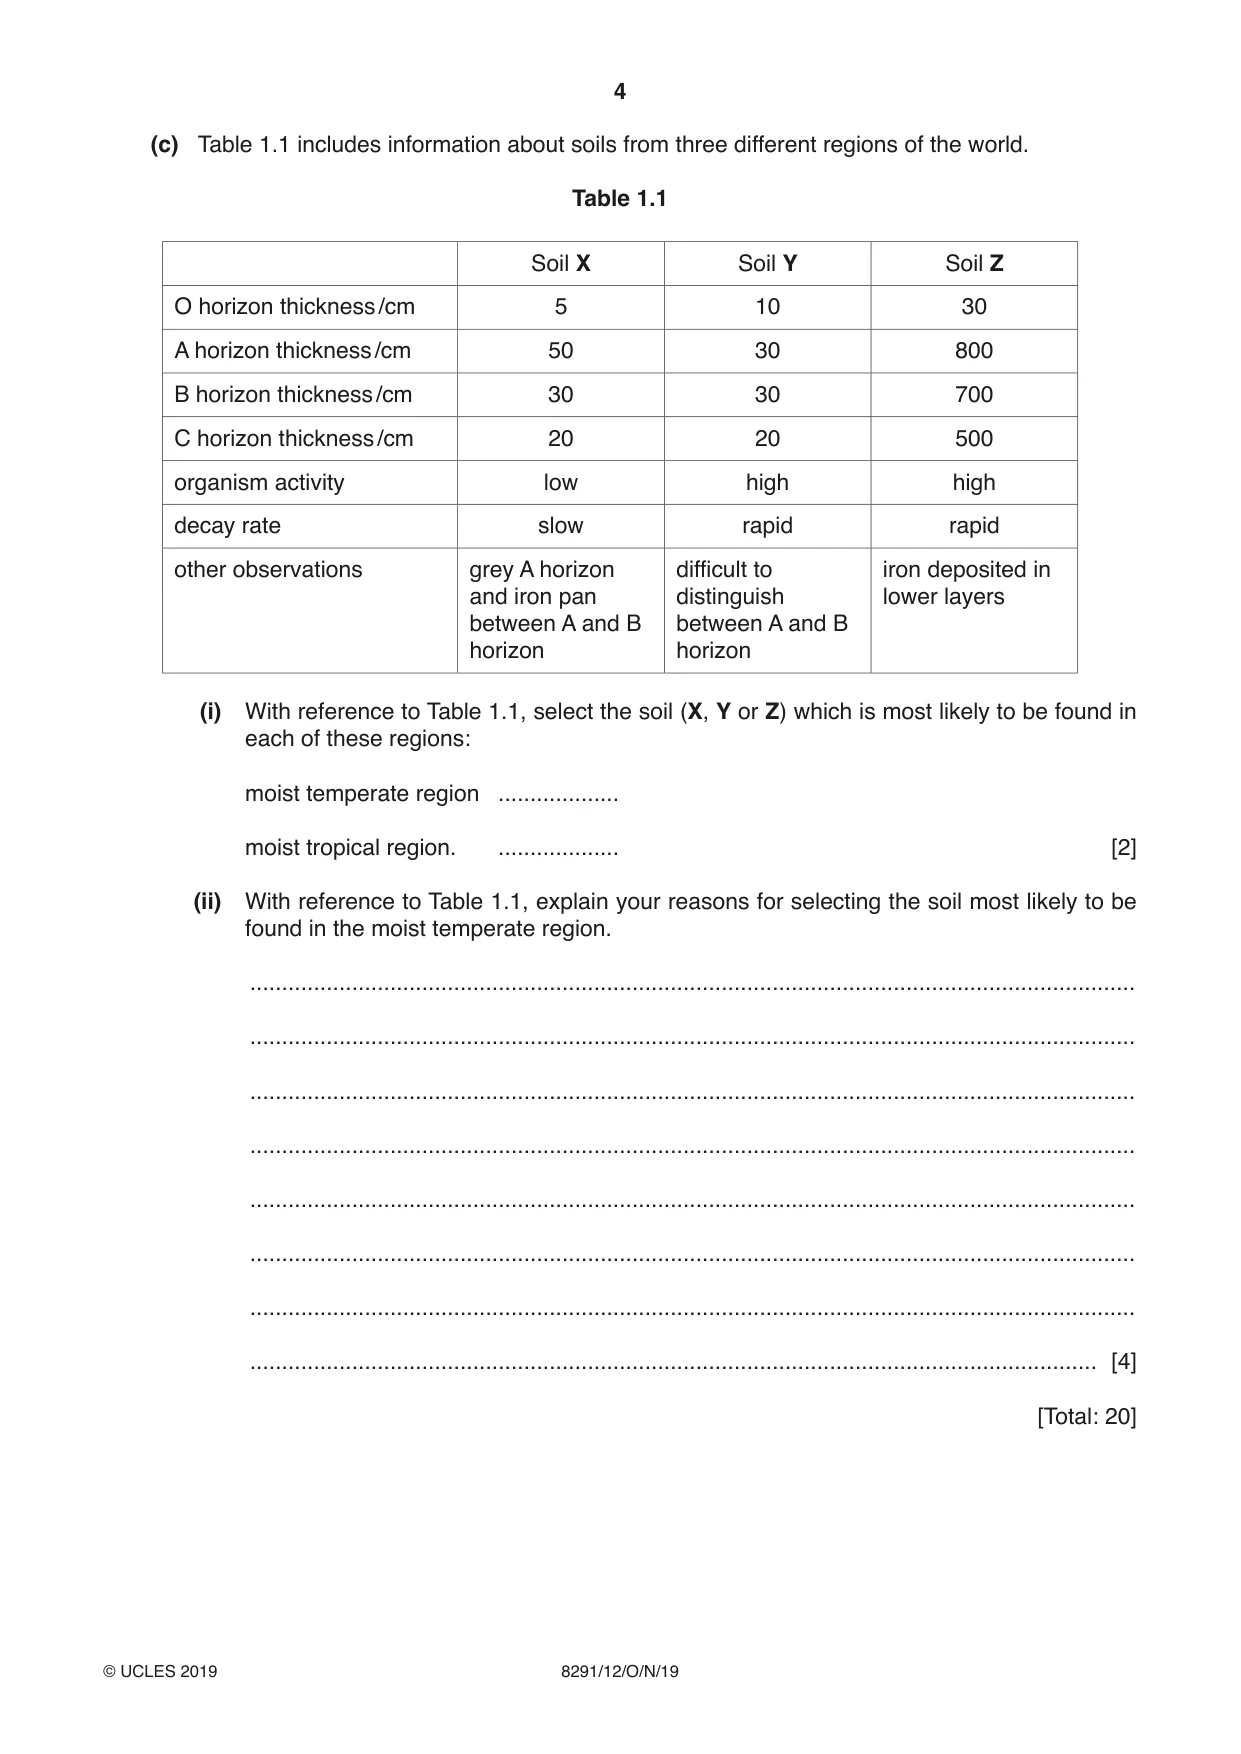
4 8291/12/O/N/19 © UCLES 2019 (c) Table 1.1 includes information about soils from three different regions of the world. Table 1.1 Soil X Soil Y Soil Z O horizon thickness /cm 5 10 30 A horizon thickness /cm 50 30 800 B horizon thickness /cm 30 30 700 C horizon thickness /cm 20 20 500 organism activity low high high decay rate slow rapid rapid other observations grey A horizon and iron pan between A and B horizon difficult to distinguish between A and B horizon iron deposited in lower layers (i) With reference to Table 1.1, select the soil (X, Y or Z) which is most likely to be found in each of these regions: moist temperate region … moist tropical region. … [2] (ii) With reference to Table 1.1, explain your reasons for selecting the soil most likely to be found in the moist temperate region. … … … … … … … … [4] [Total: 20]
Question paper, page 5
5 8291/12/O/N/19 © UCLES 2019 [Turn over BLANK PAGE
Question paper, page 6
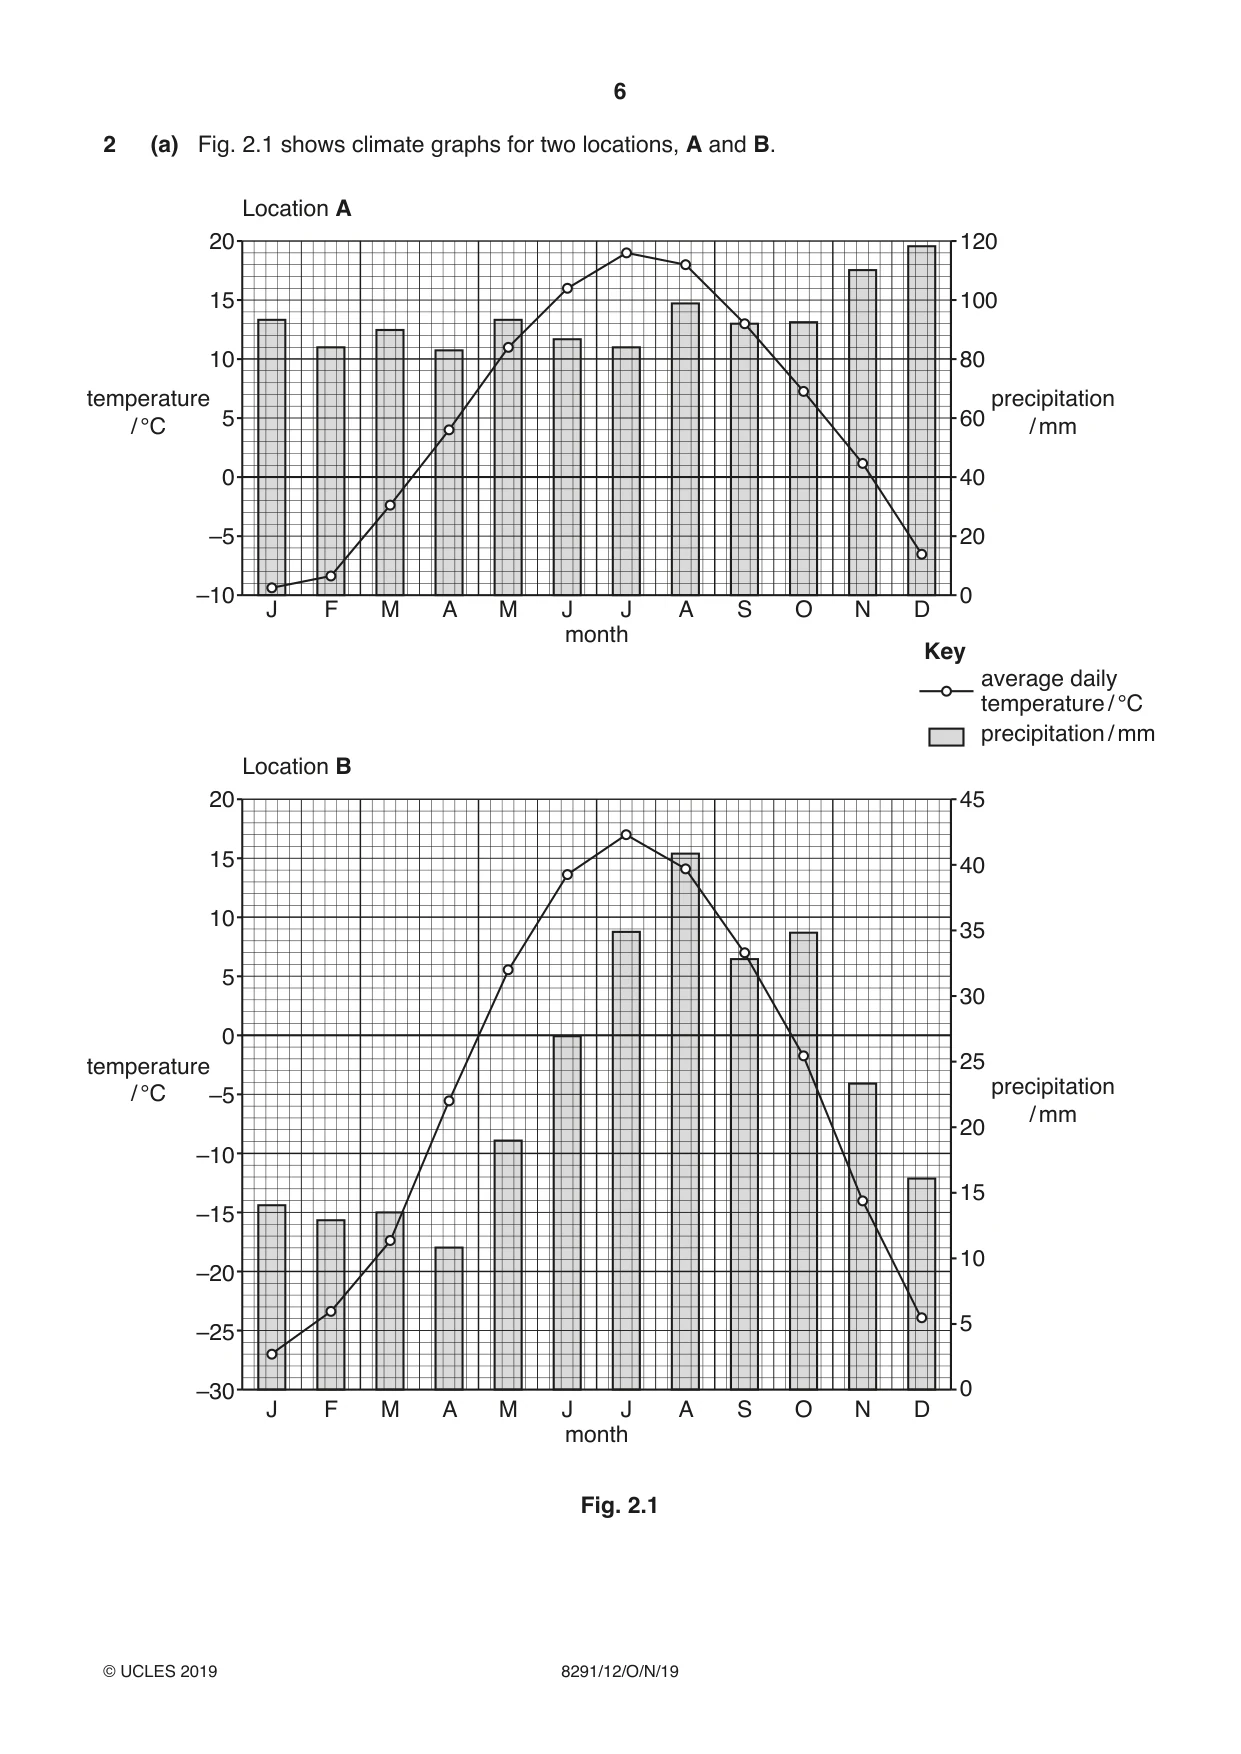
6 8291/12/O/N/19 © UCLES 2019 2 (a) Fig. 2.1 shows climate graphs for two locations, A and B. Location B precipitation / mm average daily temperature / °C Location A Key 20 15 10 5 0 –5 –30 –25 –20 –15 –10 45 40 35 30 25 20 15 10 5 0 temperature / °C precipitation / mm 20 15 10 5 0 –5 –10 120 100 80 60 40 20 0 temperature / °C precipitation / mm F J M A M month J J A S O N D J F M A M month J J A S O N D Fig. 2.1
Question paper, page 7
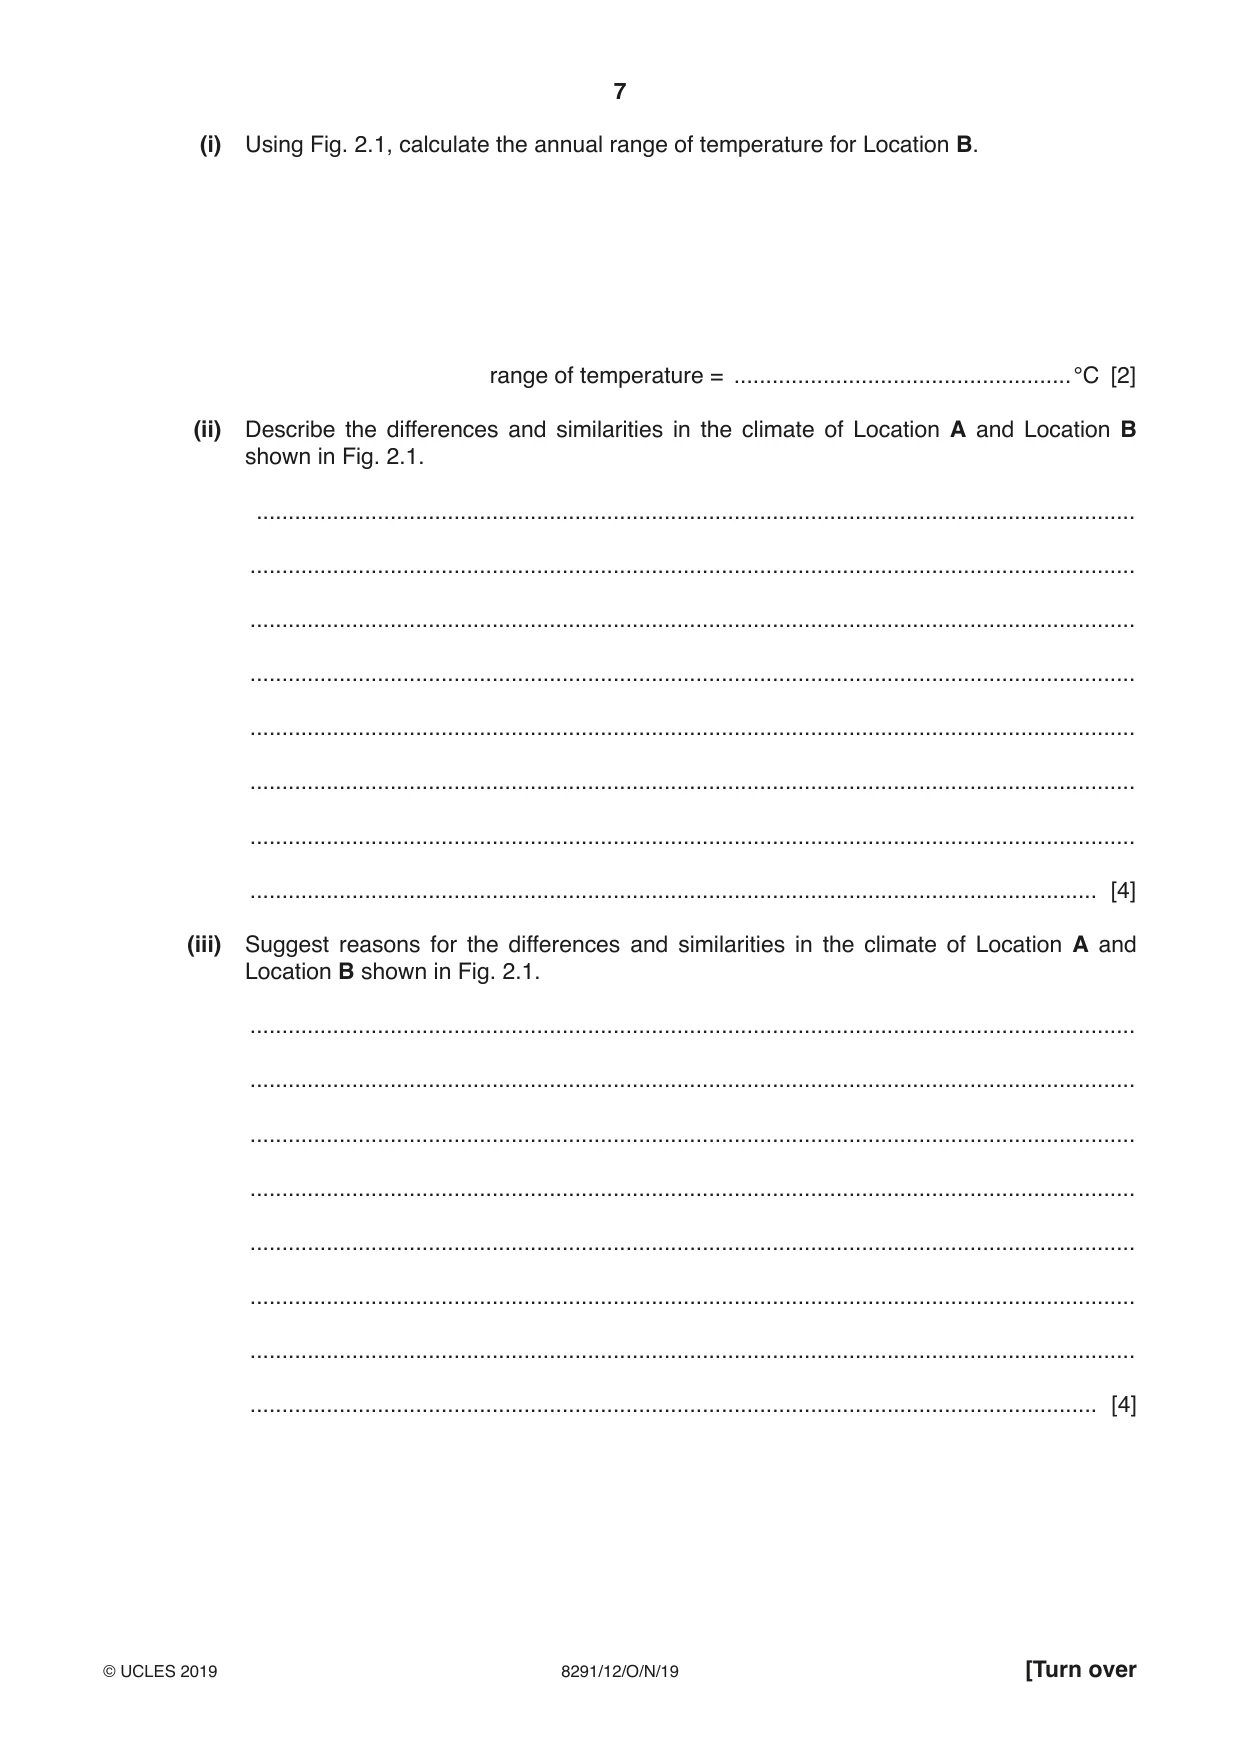
7 8291/12/O/N/19 © UCLES 2019 [Turn over (i) Using Fig. 2.1, calculate the annual range of temperature for Location B. range of temperature = …°C [2] (ii) Describe the differences and similarities in the climate of Location A and Location B shown in Fig. 2.1. … … … … … … … … [4] (iii) Suggest reasons for the differences and similarities in the climate of Location A and Location B shown in Fig. 2.1. … … … … … … … … [4]
Question paper, page 8
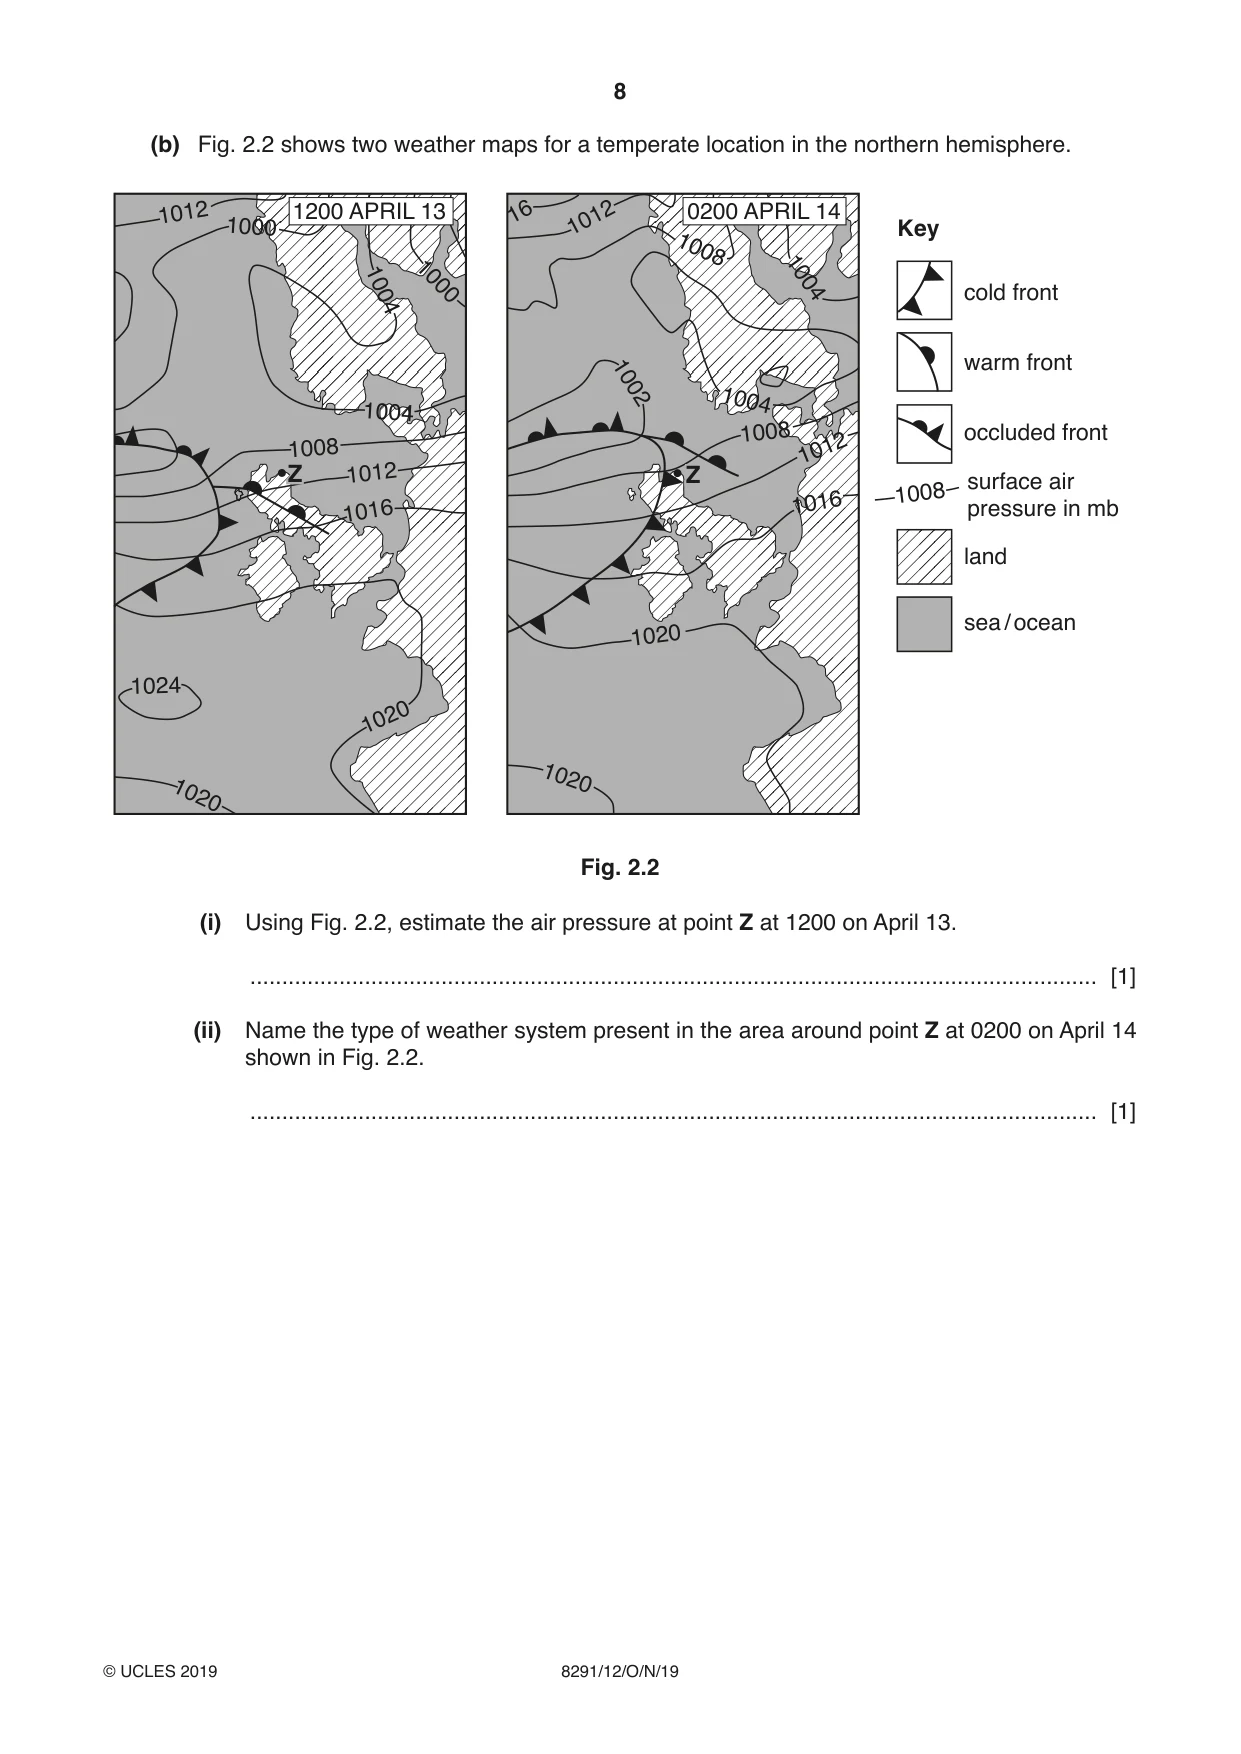
8 8291/12/O/N/19 © UCLES 2019 (b) Fig. 2.2 shows two weather maps for a temperate location in the northern hemisphere. 1012 1004 1000 1008 1012 1020 1020 1016 1000 1024 Z 1004 1012 16 1004 1004 1008 1012 1008 1020 1016 1020 1002 Z 1200 APRIL 13 0200 APRIL 14 Key cold front warm front occluded front land sea / ocean 1008 surface air pressure in mb Fig. 2.2 (i) Using Fig. 2.2, estimate the air pressure at point Z at 1200 on April 13. … [1] (ii) Name the type of weather system present in the area around point Z at 0200 on April 14 shown in Fig. 2.2. … [1]
Question paper, page 9
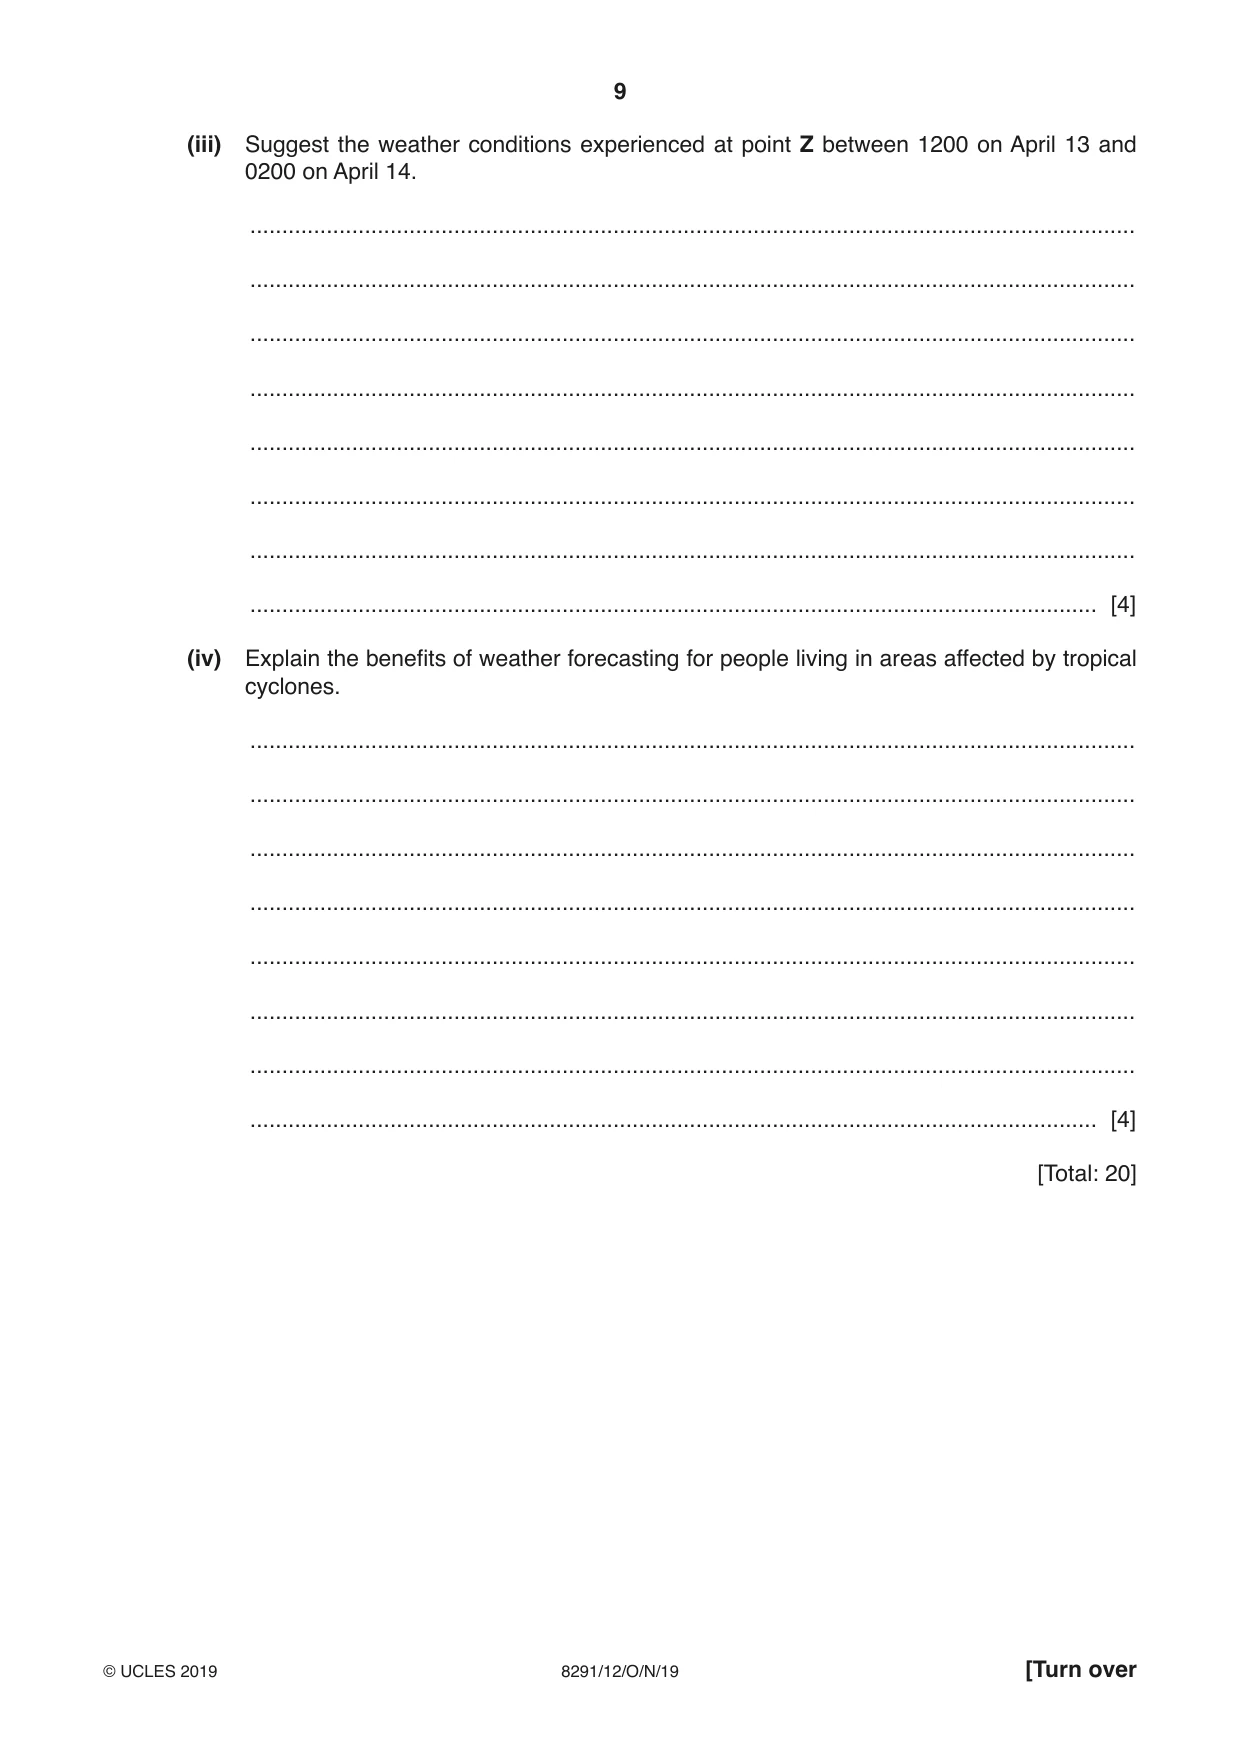
9 8291/12/O/N/19 © UCLES 2019 [Turn over (iii) Suggest the weather conditions experienced at point Z between 1200 on April 13 and 0200 on April 14. … … … … … … … … [4] (iv) Explain the benefits of weather forecasting for people living in areas affected by tropical cyclones. … … … … … … … … [4] [Total: 20]
Question paper, page 10
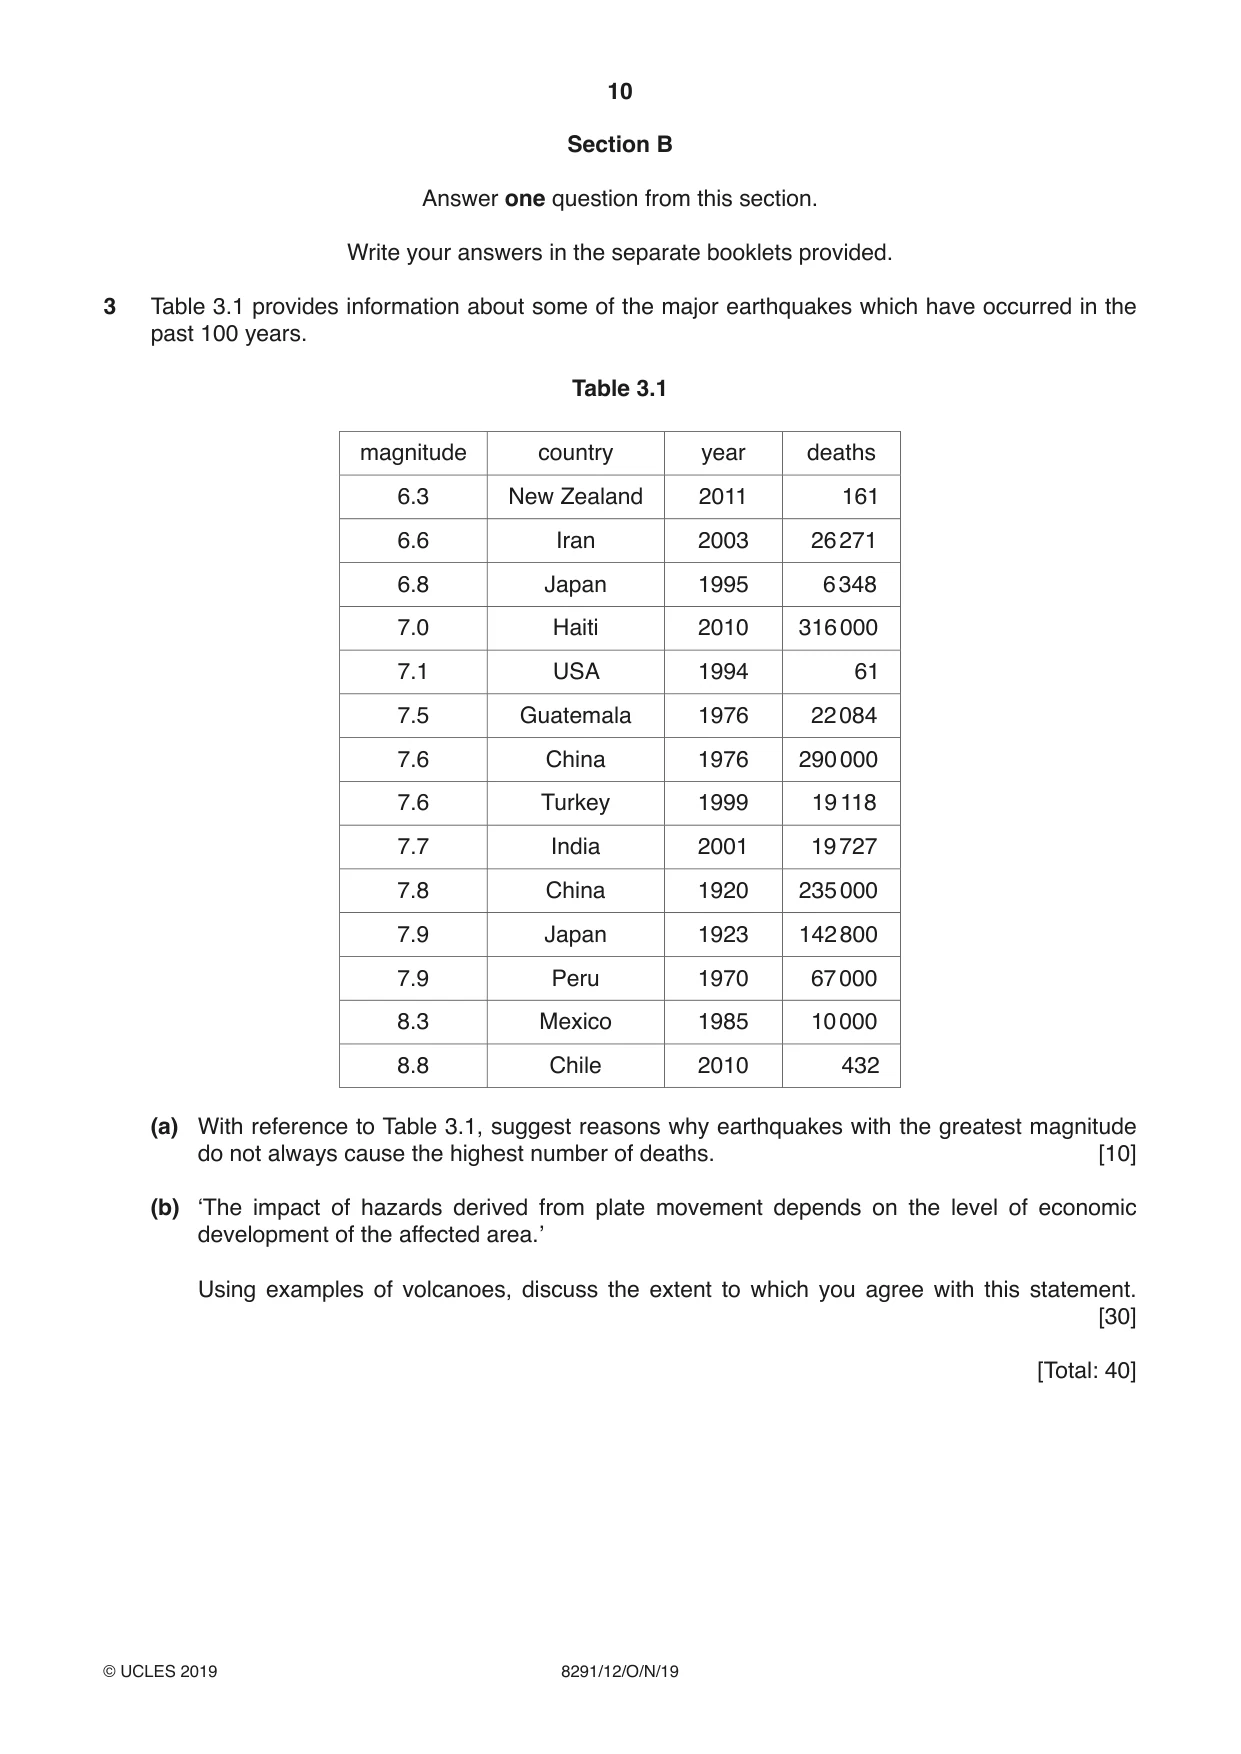
10 8291/12/O/N/19 © UCLES 2019 Section B Answer one question from this section. Write your answers in the separate booklets provided. 3 Table 3.1 provides information about some of the major earthquakes which have occurred in the past 100 years. Table 3.1 magnitude country year deaths 6.3 New Zealand 2011 161 6.6 Iran 2003 26 271 6.8 Japan 1995 6 348 7.0 Haiti 2010 316 000 7.1 USA 1994 61 7.5 Guatemala 1976 22 084 7.6 China 1976 290 000 7.6 Turkey 1999 19 118 7.7 India 2001 19 727 7.8 China 1920 235 000 7.9 Japan 1923 142 800 7.9 Peru 1970 67 000 8.3 Mexico 1985 10 000 8.8 Chile 2010 432 (a) With reference to Table 3.1, suggest reasons why earthquakes with the greatest magnitude do not always cause the highest number of deaths. [10] (b) ‘The impact of hazards derived from plate movement depends on the level of economic development of the affected area.’ Using examples of volcanoes, discuss the extent to which you agree with this statement. [30] [Total: 40]
Question paper, page 11
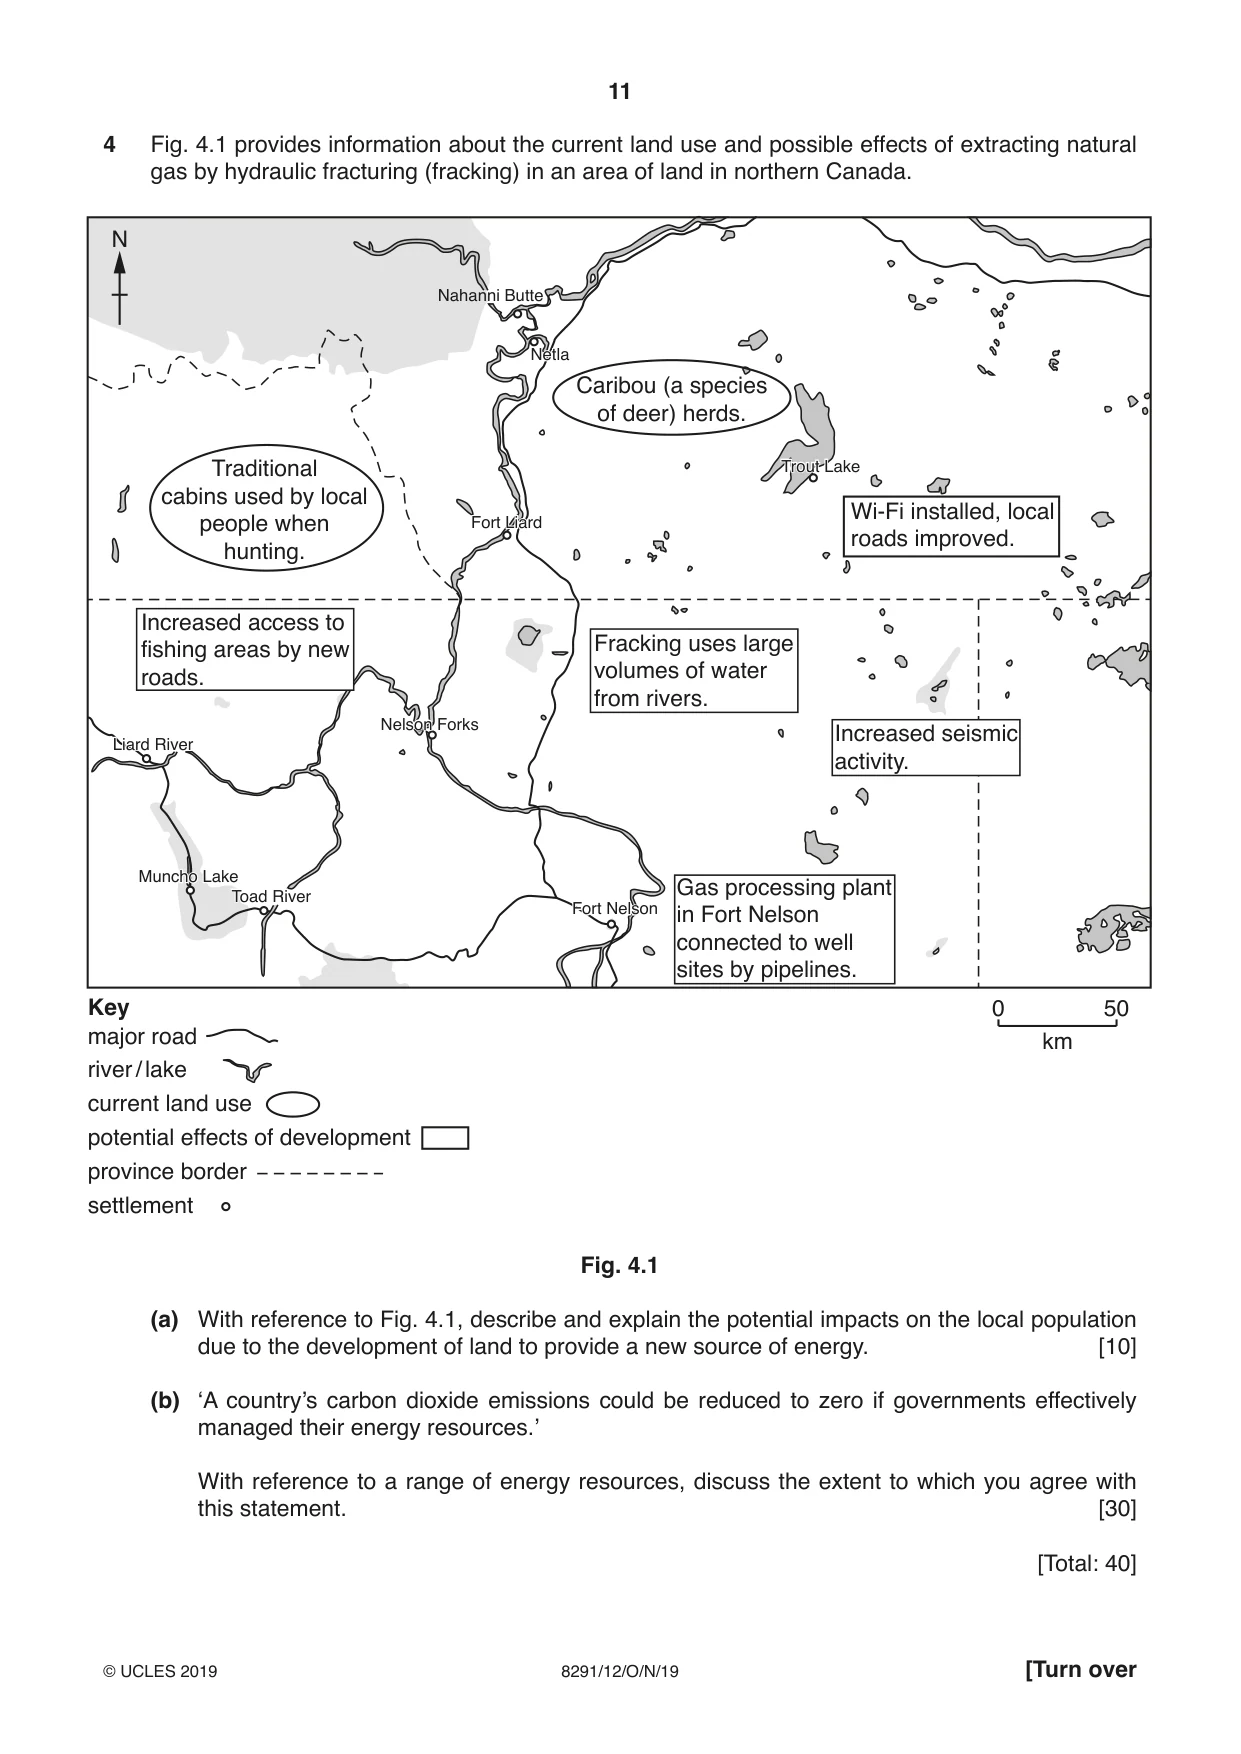
11 8291/12/O/N/19 © UCLES 2019 [Turn over 4 Fig. 4.1 provides information about the current land use and possible effects of extracting natural gas by hydraulic fracturing (fracking) in an area of land in northern Canada. 50 0 km Nahanni Butte Fort Liard Fort Liard Liard River Liard River Liard River Netla Netla Muncho Lake Muncho Lake Toad River Toad River Trout Lake Trout Lake Fort Nelson Fort Nelson Traditional cabins used by local people when hunting. Caribou (a species of deer) herds. Wi-Fi installed, local roads improved. Fracking uses large volumes of water from rivers. Increased seismic activity. Increased access to fishing areas by new roads. Gas processing plant in Fort Nelson connected to well sites by pipelines. Key major road province border settlement river / lake current land use potential effects of development N Nelson Forks Nelson Forks Fig. 4.1 (a) With reference to Fig. 4.1, describe and explain the potential impacts on the local population due to the development of land to provide a new source of energy. [10] (b) ‘A country’s carbon dioxide emissions could be reduced to zero if governments effectively managed their energy resources.’ With reference to a range of energy resources, discuss the extent to which you agree with this statement. [30] [Total: 40]
Question paper, page 12
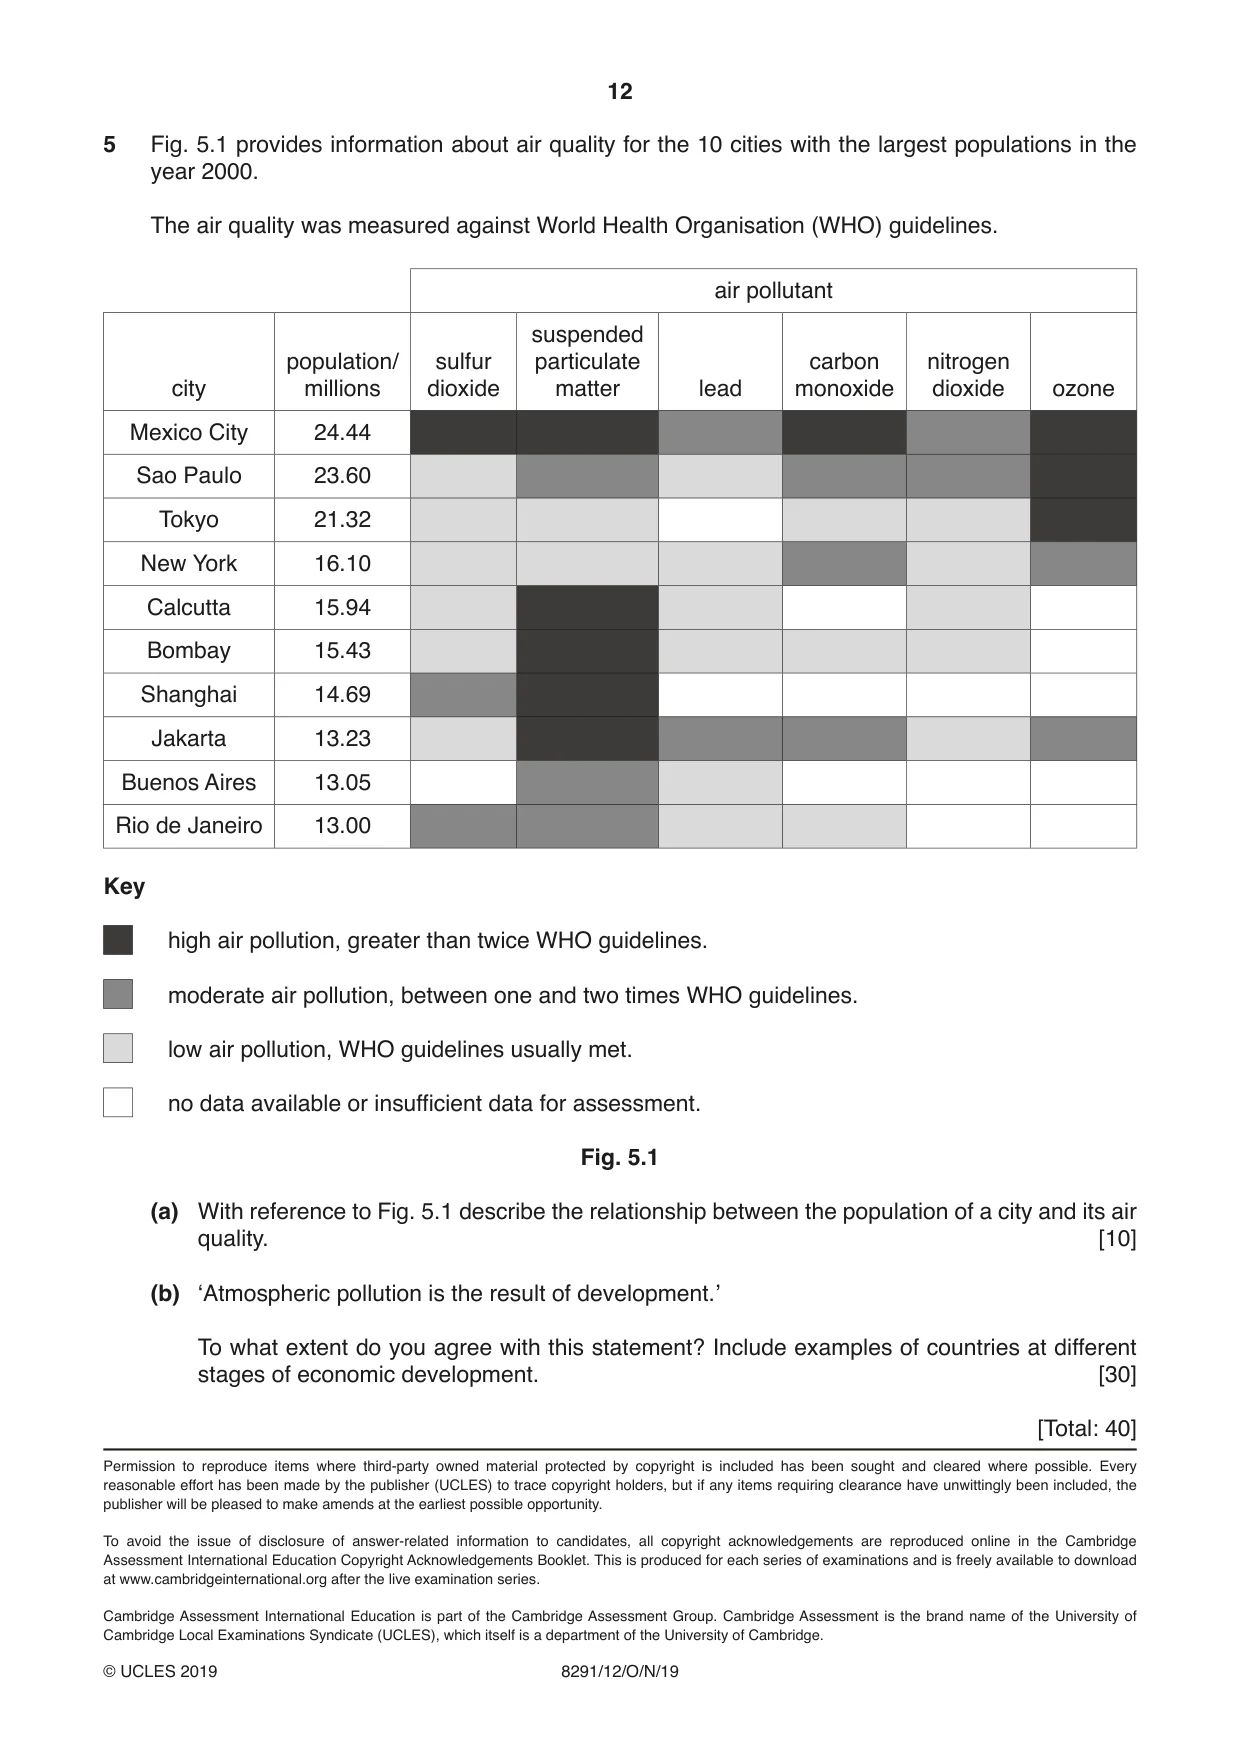
12 8291/12/O/N/19 © UCLES 2019 5 Fig. 5.1 provides information about air quality for the 10 cities with the largest populations in the year 2000. The air quality was measured against World Health Organisation (WHO) guidelines. air pollutant city population/ millions sulfur dioxide suspended particulate matter lead carbon monoxide nitrogen dioxide ozone Mexico City 24.44 Sao Paulo 23.60 Tokyo 21.32 New York 16.10 Calcutta 15.94 Bombay 15.43 Shanghai 14.69 Jakarta 13.23 Buenos Aires 13.05 Rio de Janeiro 13.00 Key high air pollution, greater than twice WHO guidelines. moderate air pollution, between one and two times WHO guidelines. low air pollution, WHO guidelines usually met. no data available or insufficient data for assessment. Fig. 5.1 (a) With reference to Fig. 5.1 describe the relationship between the population of a city and its air quality. [10] (b) ‘Atmospheric pollution is the result of development.’ To what extent do you agree with this statement? Include examples of countries at different stages of economic development. [30] [Total: 40] Permission to reproduce items where third-party owned material protected by copyright is included has been sought and cleared where possible. Every reasonable effort has been made by the publisher (UCLES) to trace copyright holders, but if any items requiring clearance have unwittingly been included, the publisher will be pleased to make amends at the earliest possible opportunity. To avoid the issue of disclosure of answer-related information to candidates, all copyright acknowledgements are reproduced online in the Cambridge Assessment International Education Copyright Acknowledgements Booklet. This is produced for each series of examinations and is freely available to download at www.cambridgeinternational.org after the live examination series. Cambridge Assessment International Education is part of the Cambridge Assessment Group. Cambridge Assessment is the brand name of the University of Cambridge Local Examinations Syndicate (UCLES), which itself is a department of the University of Cambridge.
Mark scheme, page 1
This document consists of 16 printed pages. © UCLES 2019 [Turn over Cambridge Assessment International Education Cambridge International Advanced Subsidiary Level ENVIRONMENTAL MANAGEMENT 8291/12 Paper 1 October/November 2019 MARK SCHEME Maximum Mark: 80 Published This mark scheme is published as an aid to teachers and candidates, to indicate the requirements of the examination. It shows the basis on which Examiners were instructed to award marks. It does not indicate the details of the discussions that took place at an Examiners’ meeting before marking began, which would have considered the acceptability of alternative answers. Mark schemes should be read in conjunction with the question paper and the Principal Examiner Report for Teachers. Cambridge International will not enter into discussions about these mark schemes. Cambridge International is publishing the mark schemes for the October/November 2019 series for most Cambridge IGCSE™, Cambridge International A and AS Level components and some Cambridge O Level components.
Mark scheme, page 2
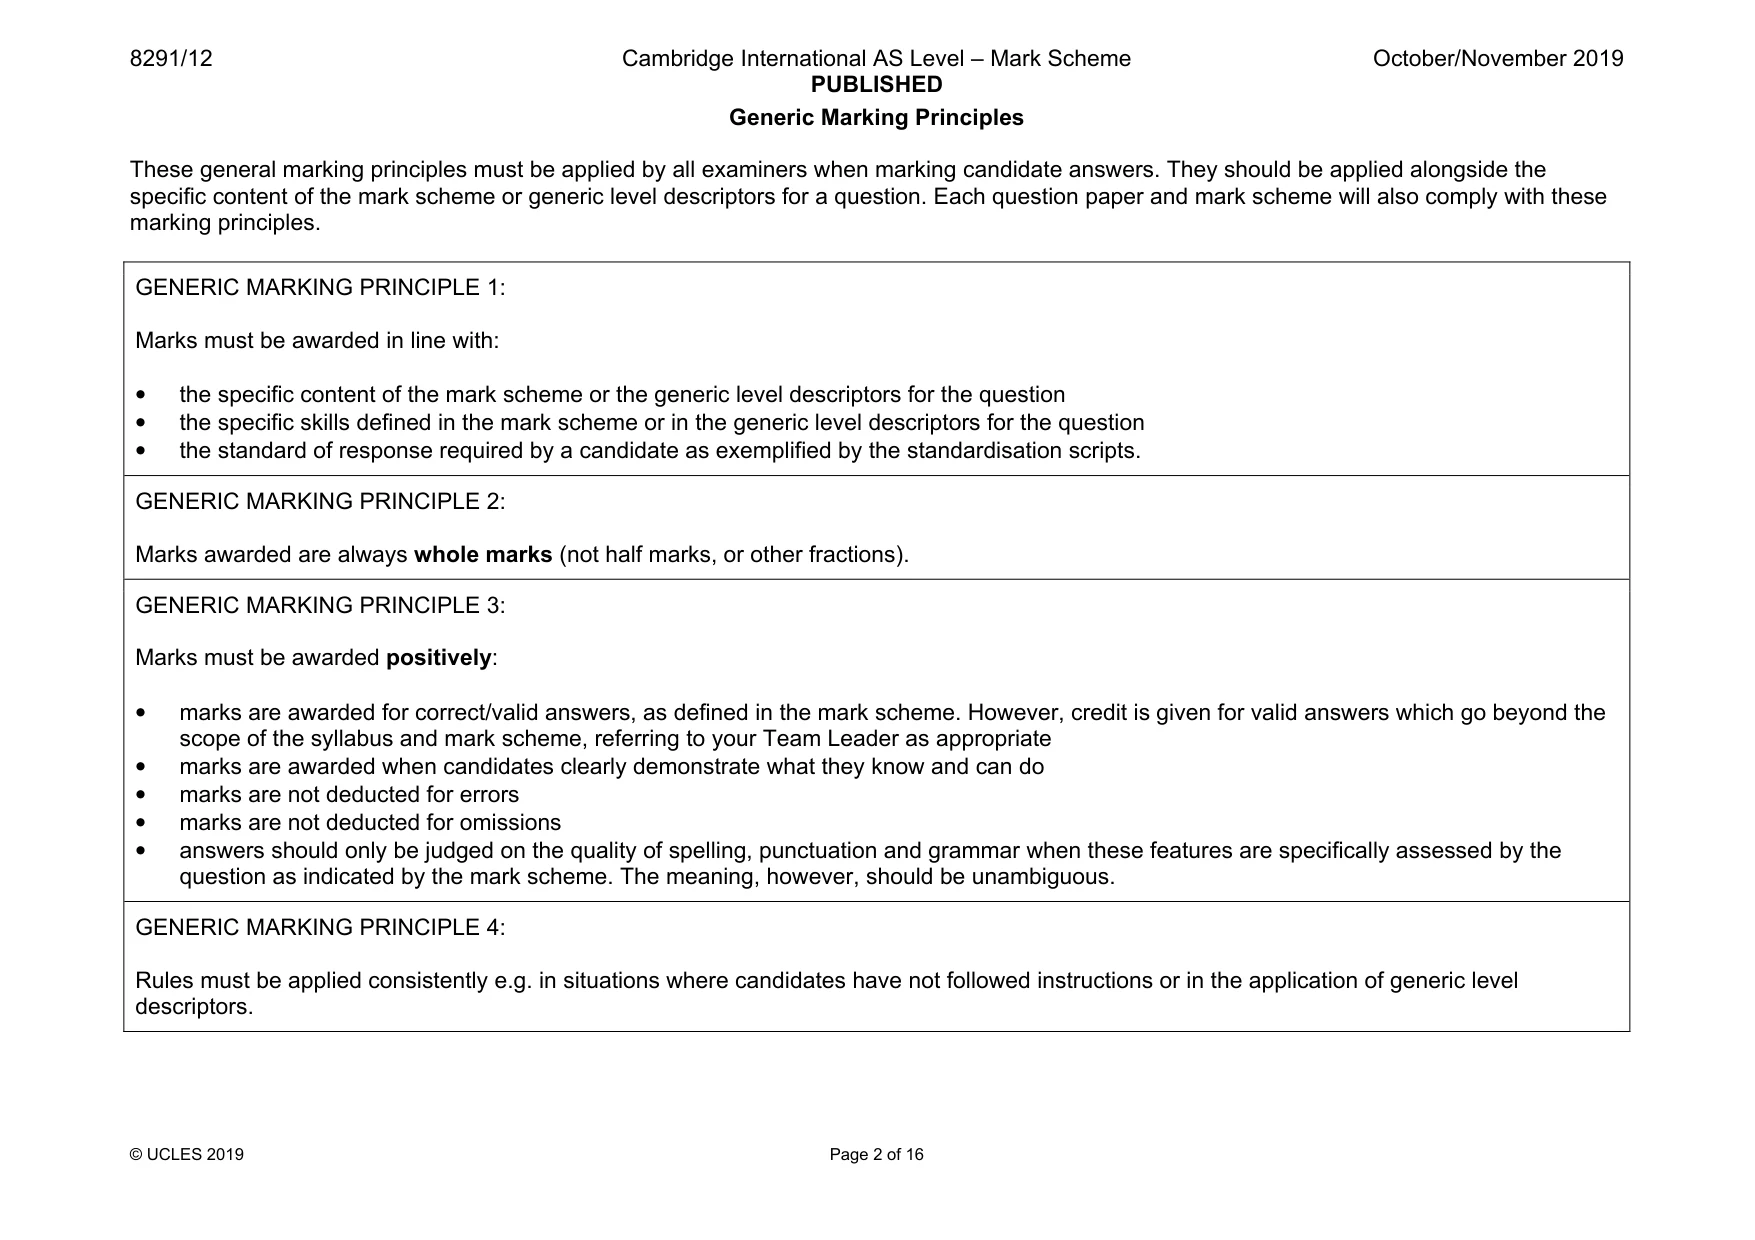
8291/12 Cambridge International AS Level – Mark Scheme PUBLISHED October/November 2019 © UCLES 2019 Page 2 of 16 Generic Marking Principles These general marking principles must be applied by all examiners when marking candidate answers. They should be applied alongside the specific content of the mark scheme or generic level descriptors for a question. Each question paper and mark scheme will also comply with these marking principles. GENERIC MARKING PRINCIPLE 1: Marks must be awarded in line with: • the specific content of the mark scheme or the generic level descriptors for the question • the specific skills defined in the mark scheme or in the generic level descriptors for the question • the standard of response required by a candidate as exemplified by the standardisation scripts. GENERIC MARKING PRINCIPLE 2: Marks awarded are always whole marks (not half marks, or other fractions). GENERIC MARKING PRINCIPLE 3: Marks must be awarded positively: • marks are awarded for correct/valid answers, as defined in the mark scheme. However, credit is given for valid answers which go beyond the scope of the syllabus and mark scheme, referring to your Team Leader as appropriate • marks are awarded when candidates clearly demonstrate what they know and can do • marks are not deducted for errors • marks are not deducted for omissions • answers should only be judged on the quality of spelling, punctuation and grammar when these features are specifically assessed by the question as indicated by the mark scheme. The meaning, however, should be unambiguous. GENERIC MARKING PRINCIPLE 4: Rules must be applied consistently e.g. in situations where candidates have not followed instructions or in the application of generic level descriptors.
Mark scheme, page 3
8291/12 Cambridge International AS Level – Mark Scheme PUBLISHED October/November 2019 © UCLES 2019 Page 3 of 16 GENERIC MARKING PRINCIPLE 5: Marks should be awarded using the full range of marks defined in the mark scheme for the question (however; the use of the full mark range may be limited according to the quality of the candidate responses seen). GENERIC MARKING PRINCIPLE 6: Marks awarded are based solely on the requirements as defined in the mark scheme. Marks should not be awarded with grade thresholds or grade descriptors in mind.
Mark scheme, page 4
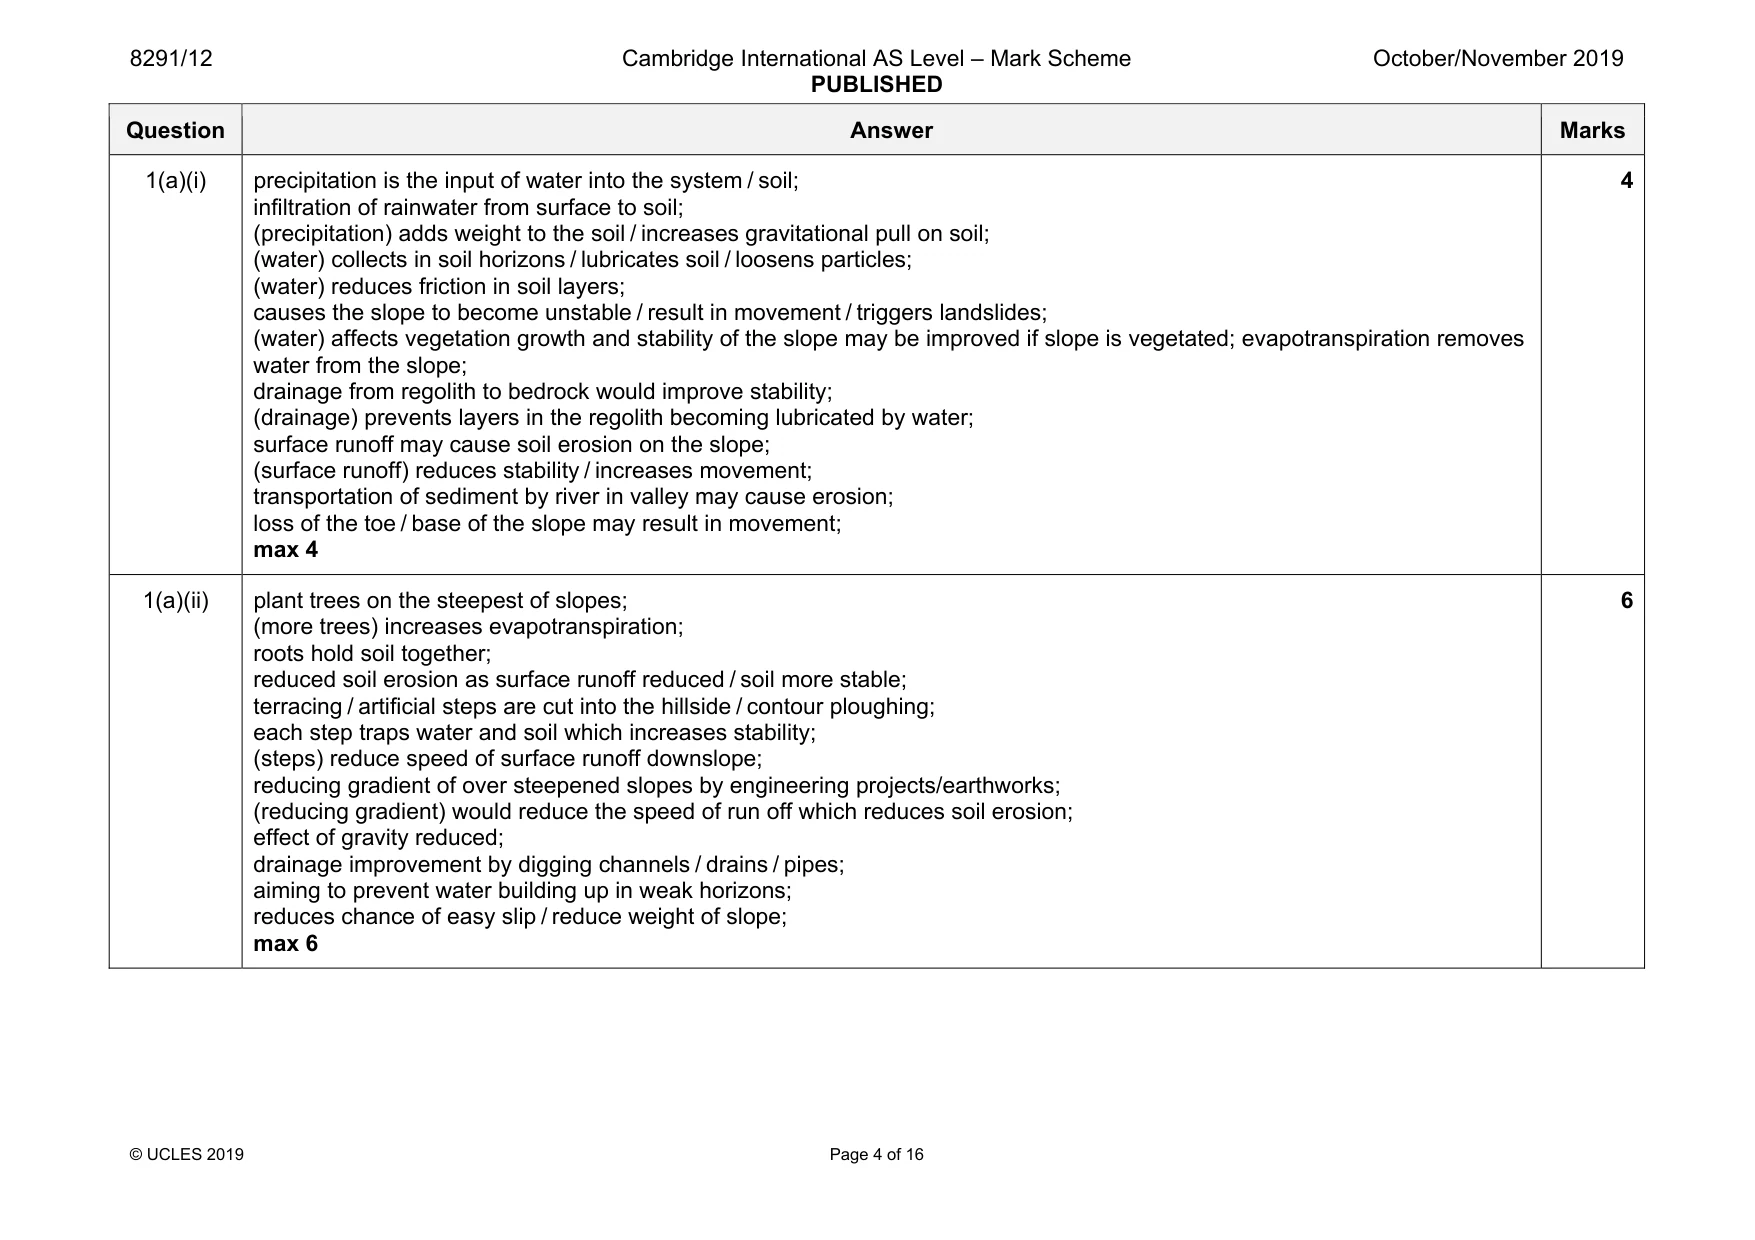
8291/12 Cambridge International AS Level – Mark Scheme PUBLISHED October/November 2019 © UCLES 2019 Page 4 of 16 Question Answer Marks 1(a)(i) precipitation is the input of water into the system / soil; infiltration of rainwater from surface to soil; (precipitation) adds weight to the soil / increases gravitational pull on soil; (water) collects in soil horizons / lubricates soil / loosens particles; (water) reduces friction in soil layers; causes the slope to become unstable / result in movement / triggers landslides; (water) affects vegetation growth and stability of the slope may be improved if slope is vegetated; evapotranspiration removes water from the slope; drainage from regolith to bedrock would improve stability; (drainage) prevents layers in the regolith becoming lubricated by water; surface runoff may cause soil erosion on the slope; (surface runoff) reduces stability / increases movement; transportation of sediment by river in valley may cause erosion; loss of the toe / base of the slope may result in movement; max 4 4 1(a)(ii) plant trees on the steepest of slopes; (more trees) increases evapotranspiration; roots hold soil together; reduced soil erosion as surface runoff reduced / soil more stable; terracing / artificial steps are cut into the hillside / contour ploughing; each step traps water and soil which increases stability; (steps) reduce speed of surface runoff downslope; reducing gradient of over steepened slopes by engineering projects/earthworks; (reducing gradient) would reduce the speed of run off which reduces soil erosion; effect of gravity reduced; drainage improvement by digging channels / drains / pipes; aiming to prevent water building up in weak horizons; reduces chance of easy slip / reduce weight of slope; max 6 6
Mark scheme, page 5
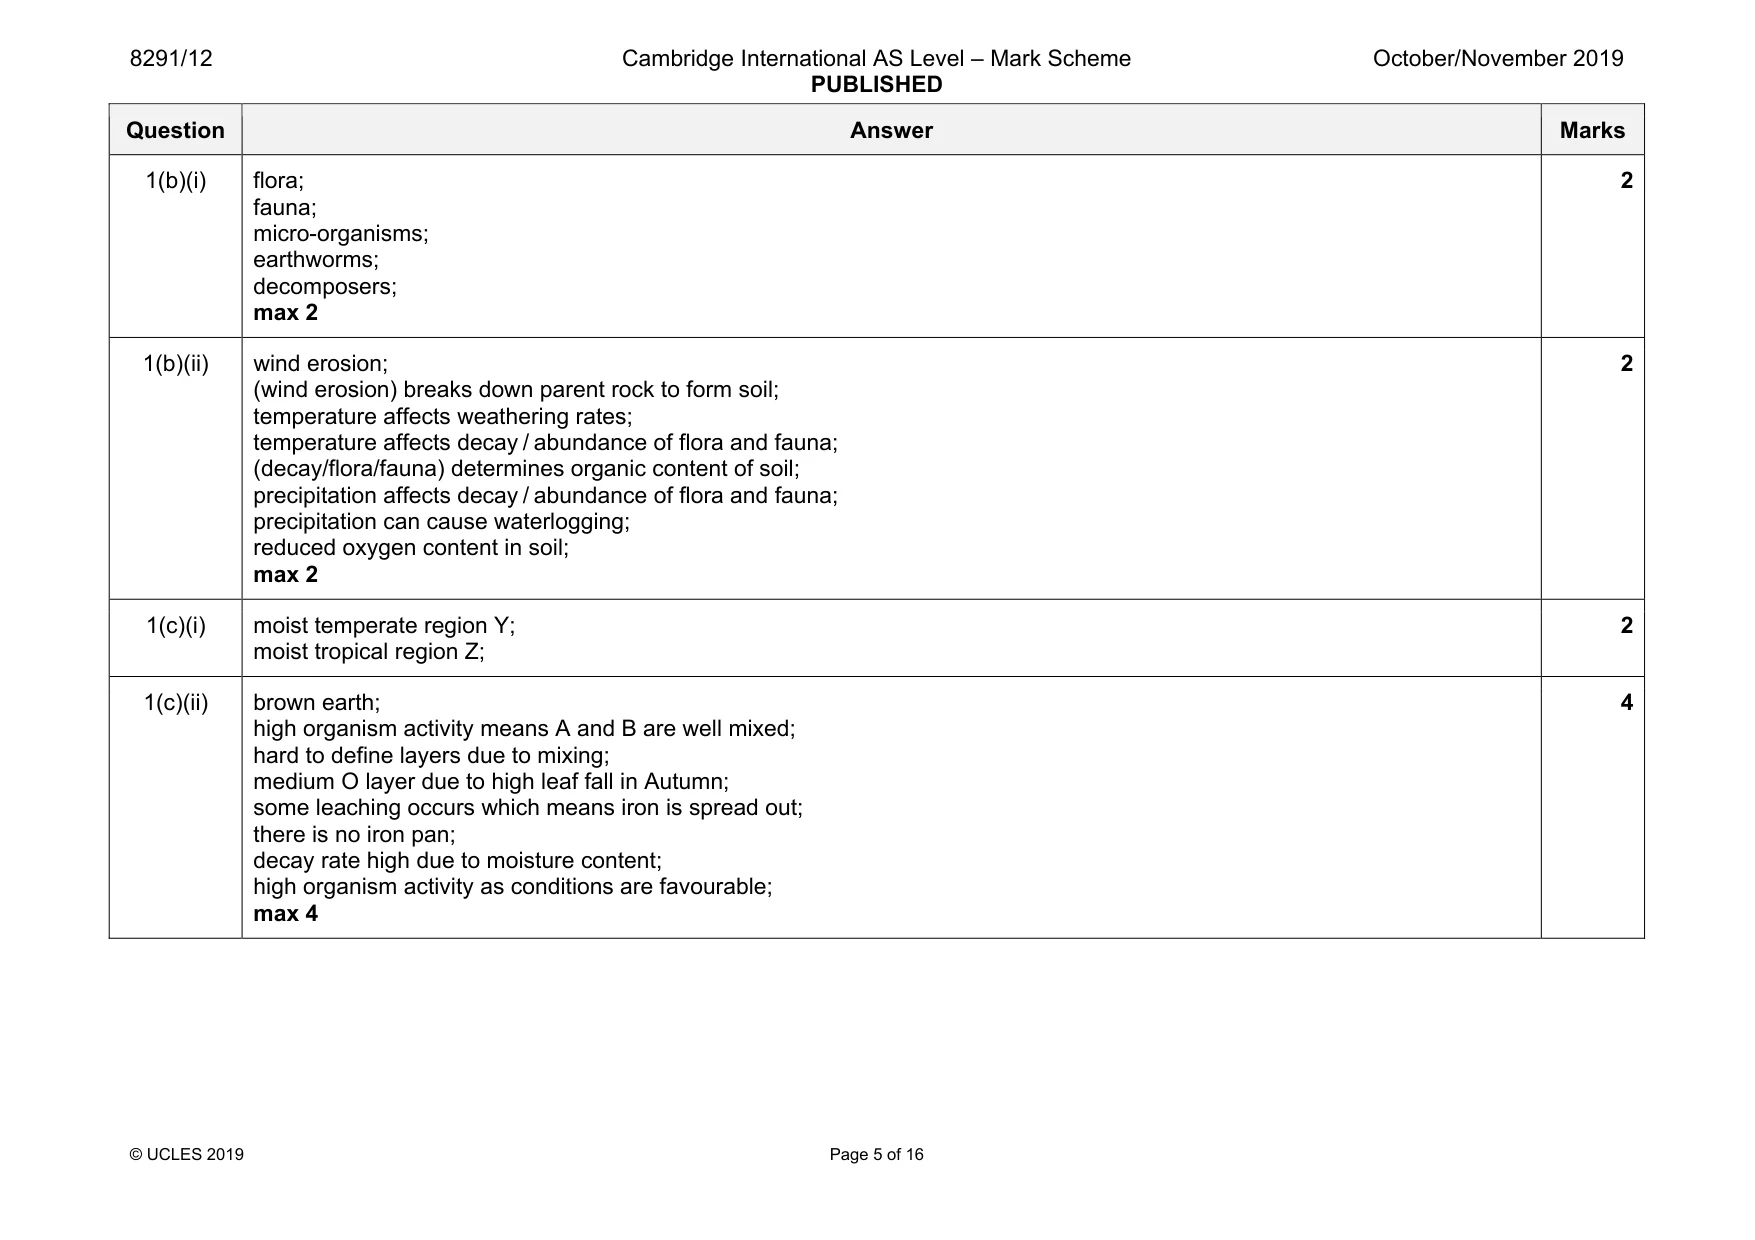
8291/12 Cambridge International AS Level – Mark Scheme PUBLISHED October/November 2019 © UCLES 2019 Page 5 of 16 Question Answer Marks 1(b)(i) flora; fauna; micro-organisms; earthworms; decomposers; max 2 2 1(b)(ii) wind erosion; (wind erosion) breaks down parent rock to form soil; temperature affects weathering rates; temperature affects decay / abundance of flora and fauna; (decay/flora/fauna) determines organic content of soil; precipitation affects decay / abundance of flora and fauna; precipitation can cause waterlogging; reduced oxygen content in soil; max 2 2 1(c)(i) moist temperate region Y; moist tropical region Z; 2 1(c)(ii) brown earth; high organism activity means A and B are well mixed; hard to define layers due to mixing; medium O layer due to high leaf fall in Autumn; some leaching occurs which means iron is spread out; there is no iron pan; decay rate high due to moisture content; high organism activity as conditions are favourable; max 4 4
Mark scheme, page 6
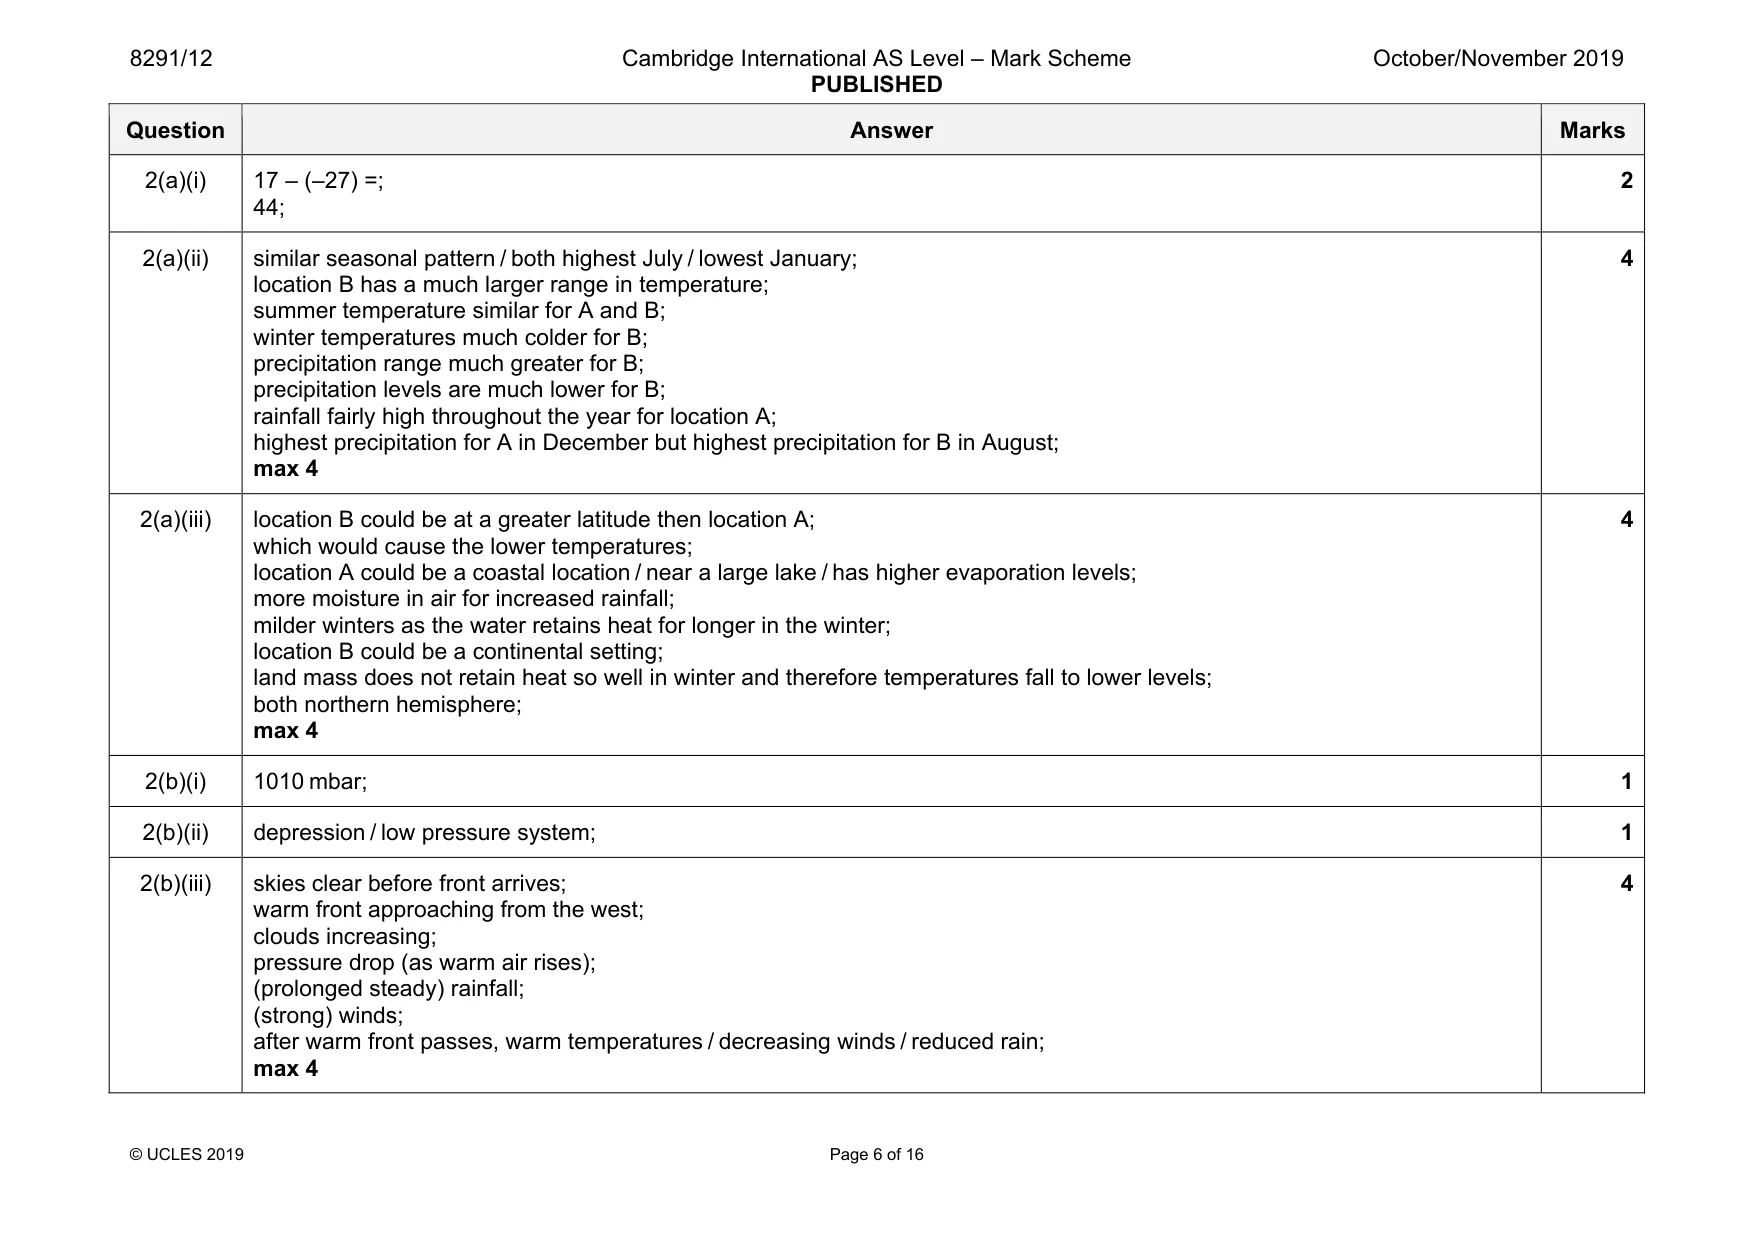
8291/12 Cambridge International AS Level – Mark Scheme PUBLISHED October/November 2019 © UCLES 2019 Page 6 of 16 Question Answer Marks 2(a)(i) 17 – (–27) =; 44; 2 2(a)(ii) similar seasonal pattern / both highest July / lowest January; location B has a much larger range in temperature; summer temperature similar for A and B; winter temperatures much colder for B; precipitation range much greater for B; precipitation levels are much lower for B; rainfall fairly high throughout the year for location A; highest precipitation for A in December but highest precipitation for B in August; max 4 4 2(a)(iii) location B could be at a greater latitude then location A; which would cause the lower temperatures; location A could be a coastal location / near a large lake / has higher evaporation levels; more moisture in air for increased rainfall; milder winters as the water retains heat for longer in the winter; location B could be a continental setting; land mass does not retain heat so well in winter and therefore temperatures fall to lower levels; both northern hemisphere; max 4 4 2(b)(i) 1010 mbar; 1 2(b)(ii) depression / low pressure system; 1 2(b)(iii) skies clear before front arrives; warm front approaching from the west; clouds increasing; pressure drop (as warm air rises); (prolonged steady) rainfall; (strong) winds; after warm front passes, warm temperatures / decreasing winds / reduced rain; max 4 4
Mark scheme, page 7
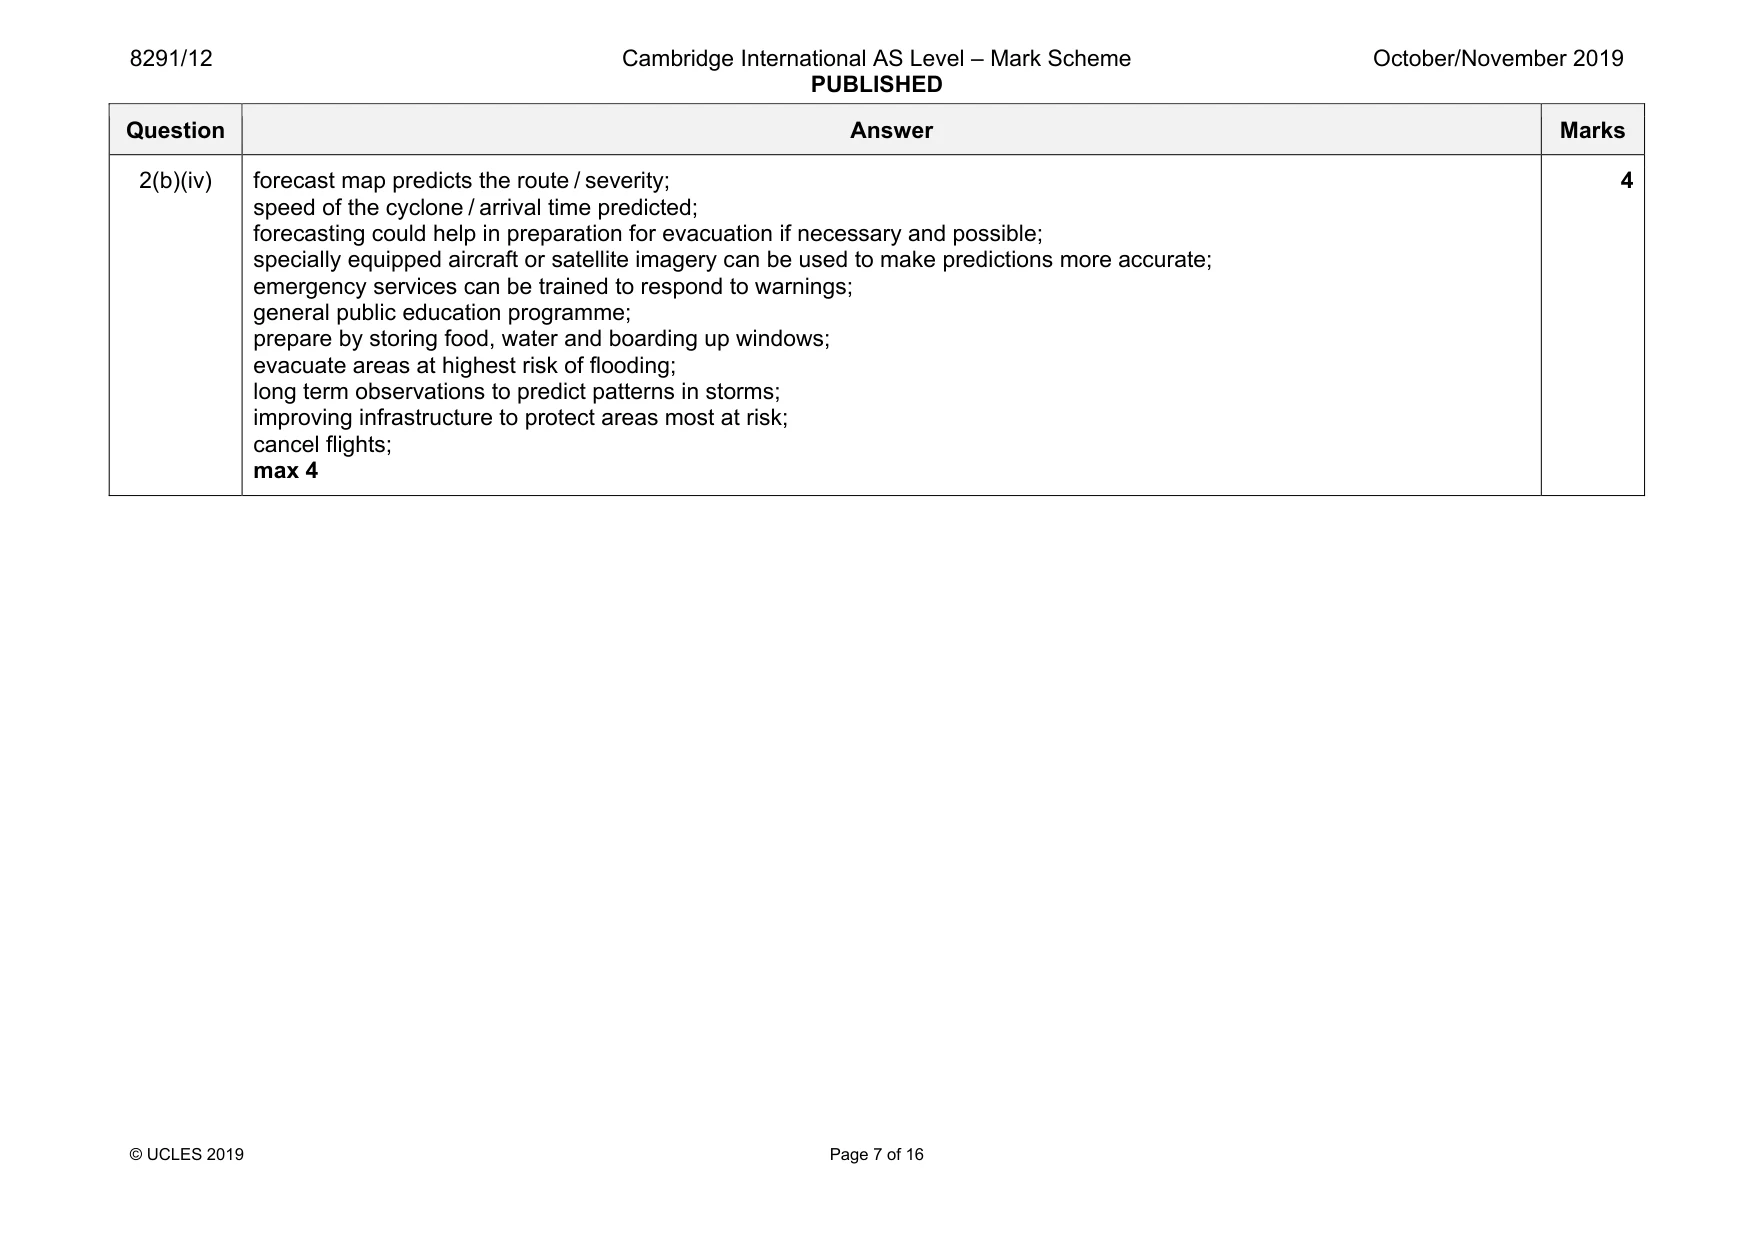
8291/12 Cambridge International AS Level – Mark Scheme PUBLISHED October/November 2019 © UCLES 2019 Page 7 of 16 Question Answer Marks 2(b)(iv) forecast map predicts the route / severity; speed of the cyclone / arrival time predicted; forecasting could help in preparation for evacuation if necessary and possible; specially equipped aircraft or satellite imagery can be used to make predictions more accurate; emergency services can be trained to respond to warnings; general public education programme; prepare by storing food, water and boarding up windows; evacuate areas at highest risk of flooding; long term observations to predict patterns in storms; improving infrastructure to protect areas most at risk; cancel flights; max 4 4
Mark scheme, page 8
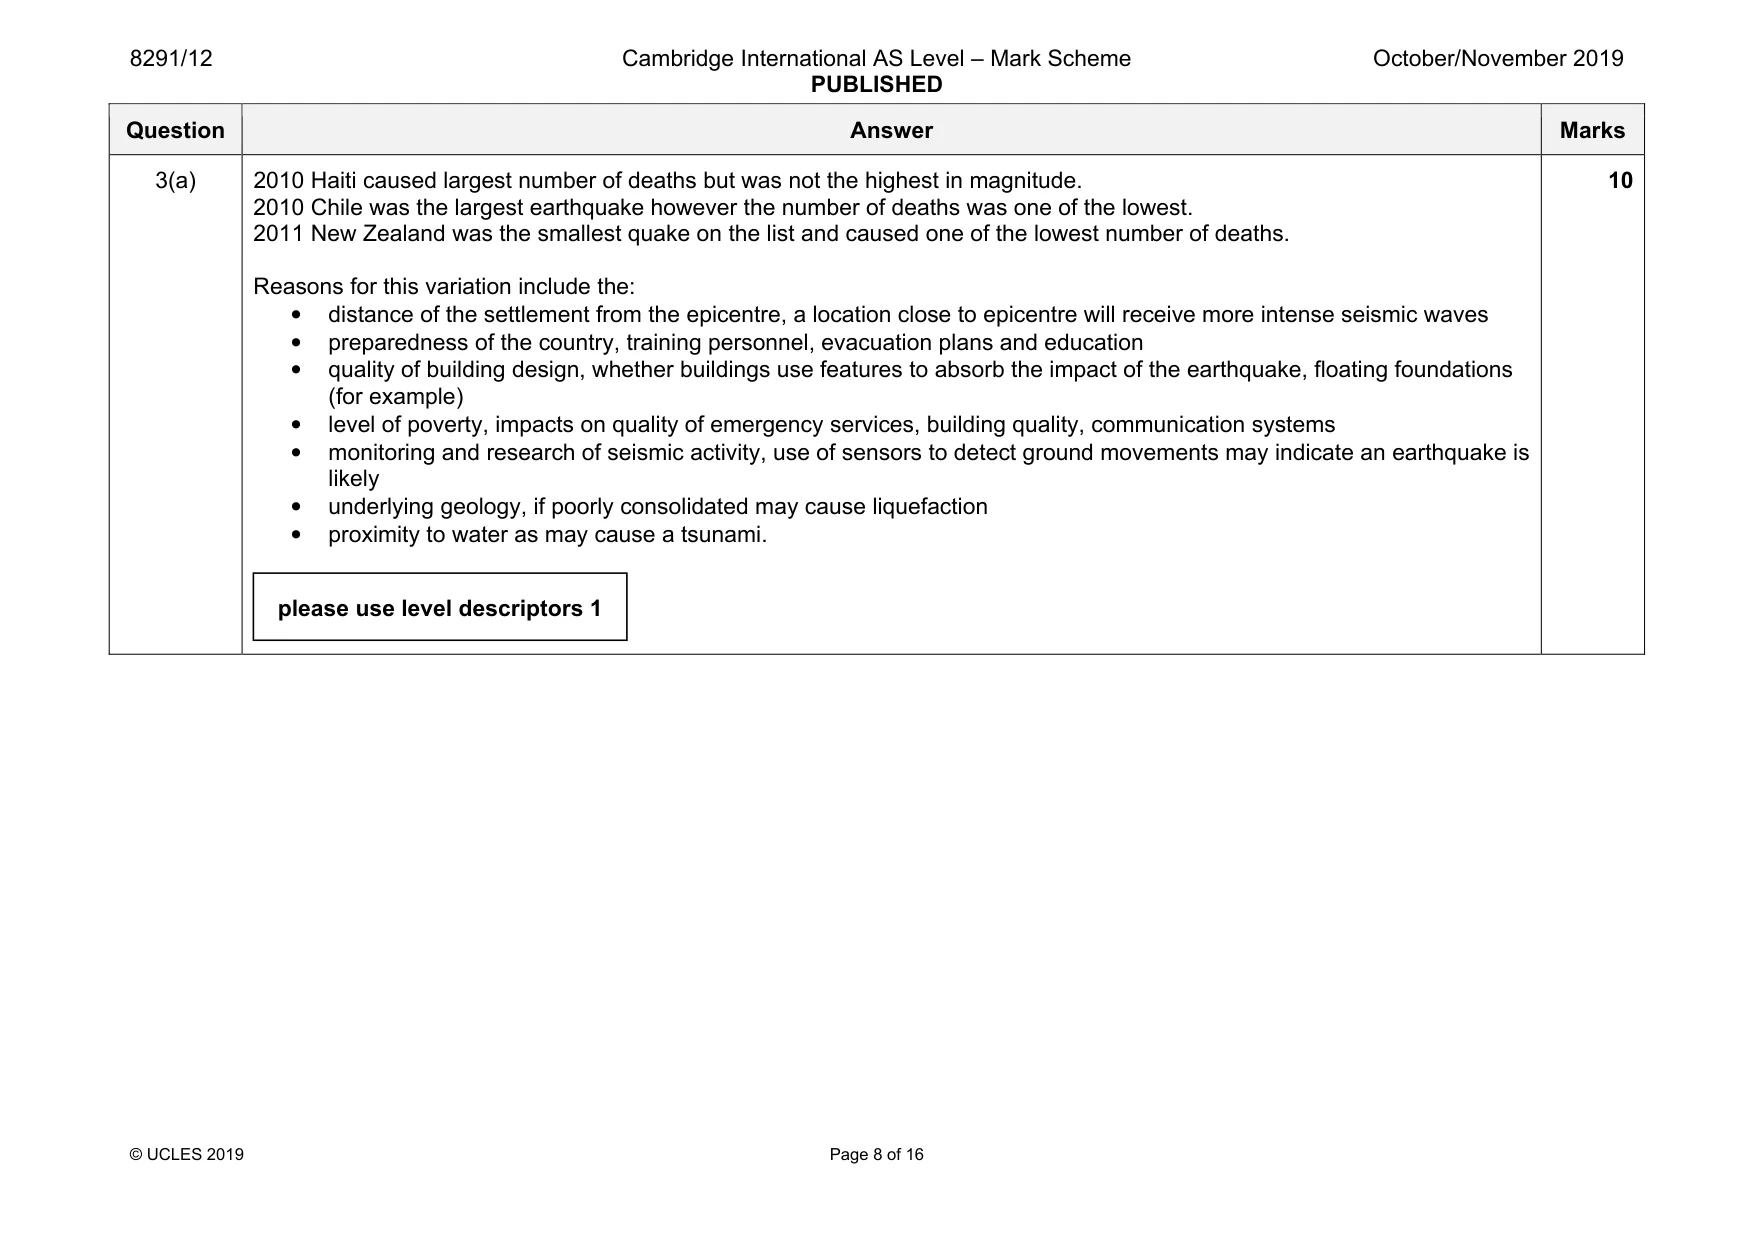
8291/12 Cambridge International AS Level – Mark Scheme PUBLISHED October/November 2019 © UCLES 2019 Page 8 of 16 Question Answer Marks 3(a) 2010 Haiti caused largest number of deaths but was not the highest in magnitude. 2010 Chile was the largest earthquake however the number of deaths was one of the lowest. 2011 New Zealand was the smallest quake on the list and caused one of the lowest number of deaths. Reasons for this variation include the: • distance of the settlement from the epicentre, a location close to epicentre will receive more intense seismic waves • preparedness of the country, training personnel, evacuation plans and education • quality of building design, whether buildings use features to absorb the impact of the earthquake, floating foundations (for example) • level of poverty, impacts on quality of emergency services, building quality, communication systems • monitoring and research of seismic activity, use of sensors to detect ground movements may indicate an earthquake is likely • underlying geology, if poorly consolidated may cause liquefaction • proximity to water as may cause a tsunami. 10 please use level descriptors 1
Mark scheme, page 9
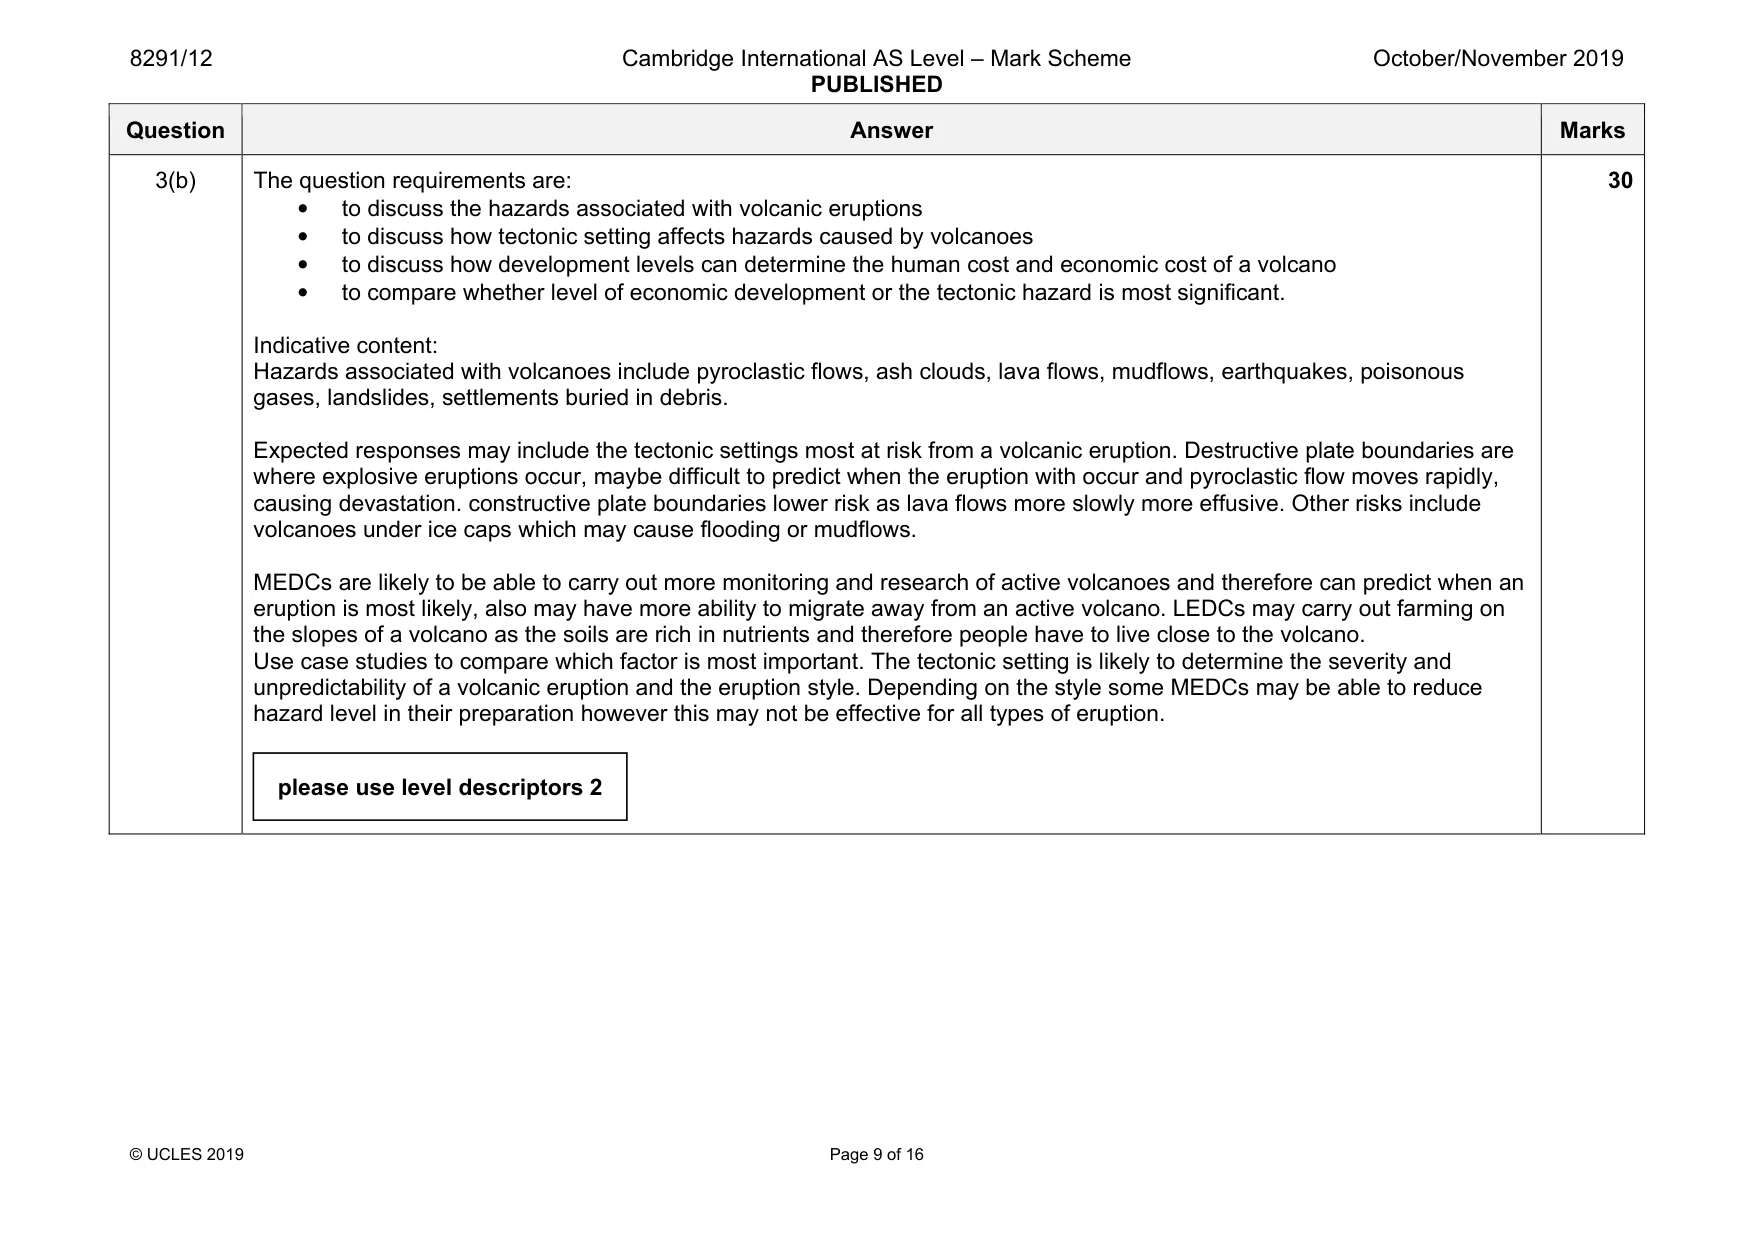
8291/12 Cambridge International AS Level – Mark Scheme PUBLISHED October/November 2019 © UCLES 2019 Page 9 of 16 Question Answer Marks 3(b) The question requirements are: • to discuss the hazards associated with volcanic eruptions • to discuss how tectonic setting affects hazards caused by volcanoes • to discuss how development levels can determine the human cost and economic cost of a volcano • to compare whether level of economic development or the tectonic hazard is most significant. Indicative content: Hazards associated with volcanoes include pyroclastic flows, ash clouds, lava flows, mudflows, earthquakes, poisonous gases, landslides, settlements buried in debris. Expected responses may include the tectonic settings most at risk from a volcanic eruption. Destructive plate boundaries are where explosive eruptions occur, maybe difficult to predict when the eruption with occur and pyroclastic flow moves rapidly, causing devastation. constructive plate boundaries lower risk as lava flows more slowly more effusive. Other risks include volcanoes under ice caps which may cause flooding or mudflows. MEDCs are likely to be able to carry out more monitoring and research of active volcanoes and therefore can predict when an eruption is most likely, also may have more ability to migrate away from an active volcano. LEDCs may carry out farming on the slopes of a volcano as the soils are rich in nutrients and therefore people have to live close to the volcano. Use case studies to compare which factor is most important. The tectonic setting is likely to determine the severity and unpredictability of a volcanic eruption and the eruption style. Depending on the style some MEDCs may be able to reduce hazard level in their preparation however this may not be effective for all types of eruption. 30 please use level descriptors 2
Mark scheme, page 10
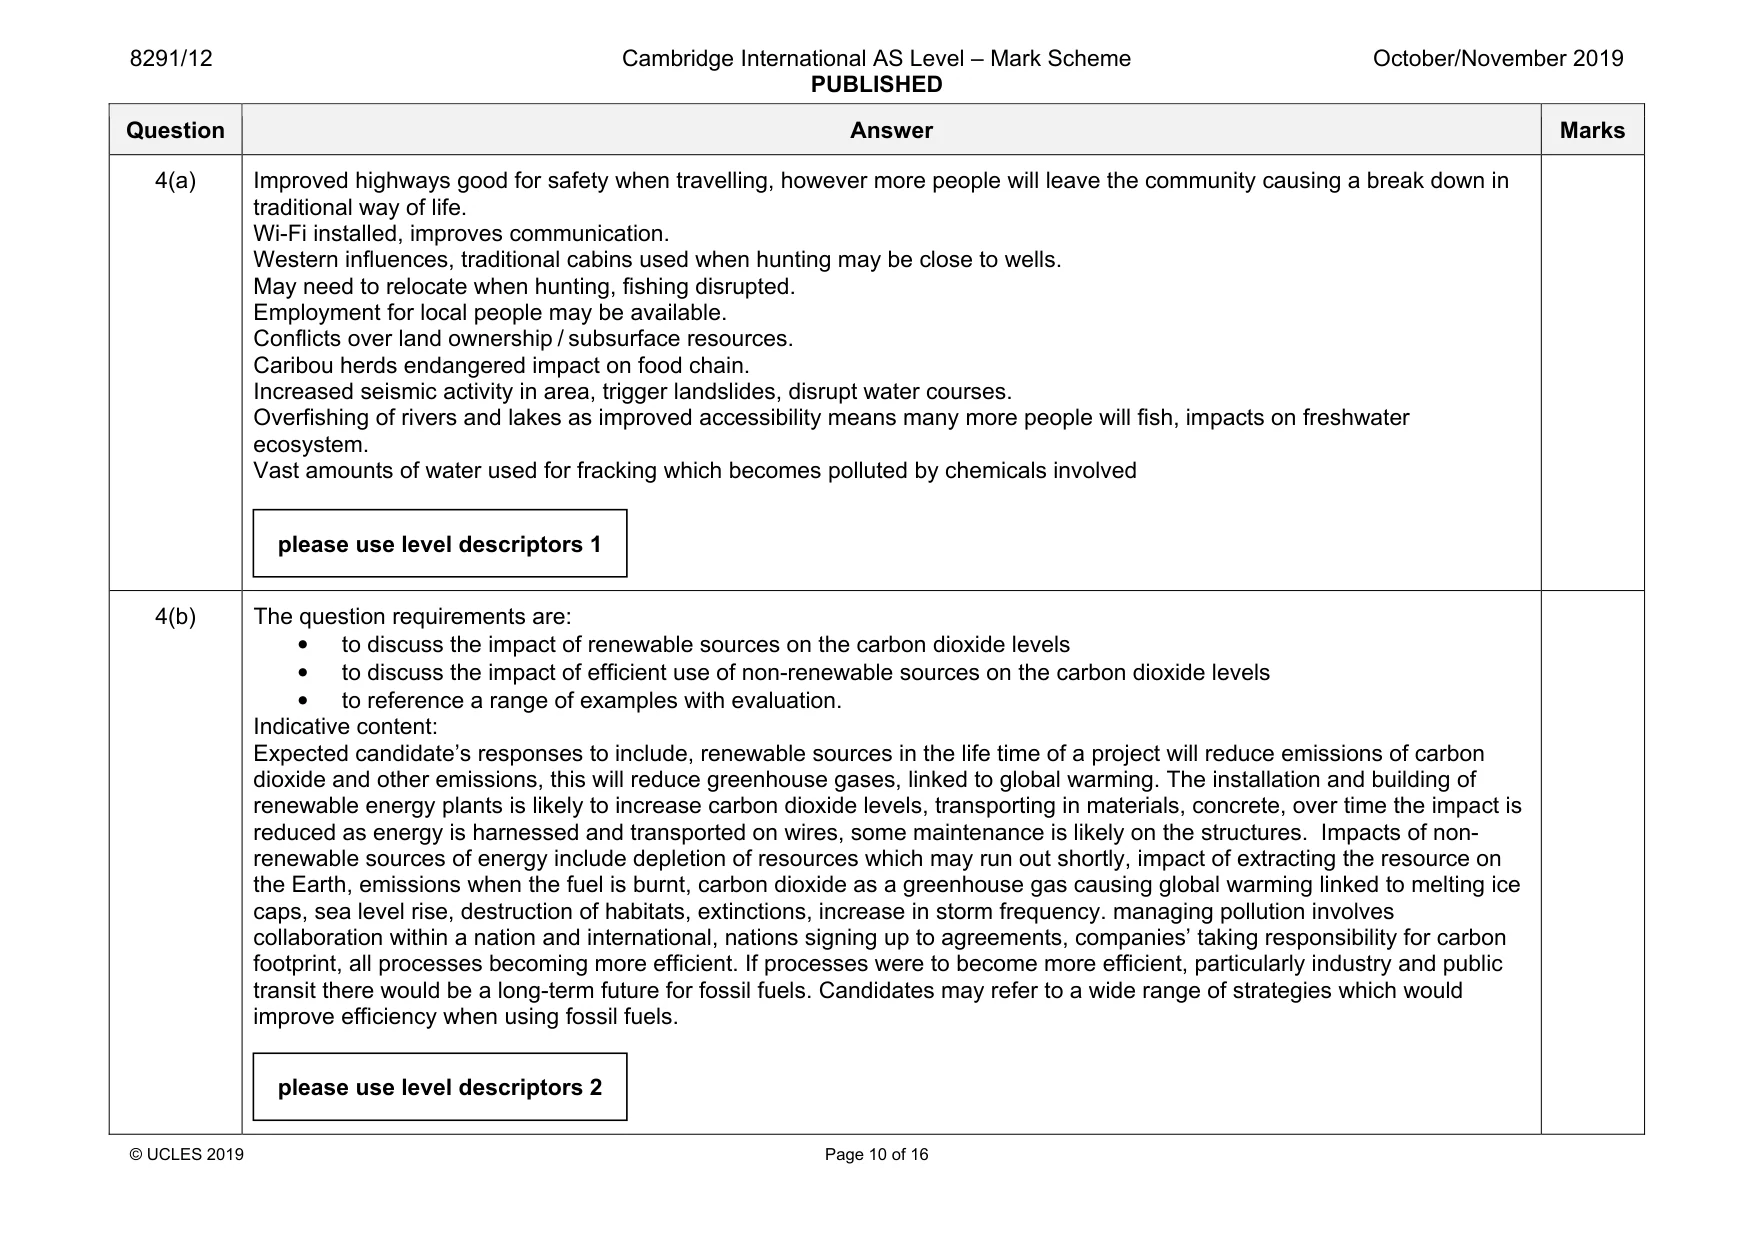
8291/12 Cambridge International AS Level – Mark Scheme PUBLISHED October/November 2019 © UCLES 2019 Page 10 of 16 Question Answer Marks 4(a) Improved highways good for safety when travelling, however more people will leave the community causing a break down in traditional way of life. Wi-Fi installed, improves communication. Western influences, traditional cabins used when hunting may be close to wells. May need to relocate when hunting, fishing disrupted. Employment for local people may be available. Conflicts over land ownership / subsurface resources. Caribou herds endangered impact on food chain. Increased seismic activity in area, trigger landslides, disrupt water courses. Overfishing of rivers and lakes as improved accessibility means many more people will fish, impacts on freshwater ecosystem. Vast amounts of water used for fracking which becomes polluted by chemicals involved 4(b) The question requirements are: • to discuss the impact of renewable sources on the carbon dioxide levels • to discuss the impact of efficient use of non-renewable sources on the carbon dioxide levels • to reference a range of examples with evaluation. Indicative content: Expected candidate’s responses to include, renewable sources in the life time of a project will reduce emissions of carbon dioxide and other emissions, this will reduce greenhouse gases, linked to global warming. The installation and building of renewable energy plants is likely to increase carbon dioxide levels, transporting in materials, concrete, over time the impact is reduced as energy is harnessed and transported on wires, some maintenance is likely on the structures. Impacts of non- renewable sources of energy include depletion of resources which may run out shortly, impact of extracting the resource on the Earth, emissions when the fuel is burnt, carbon dioxide as a greenhouse gas causing global warming linked to melting ice caps, sea level rise, destruction of habitats, extinctions, increase in storm frequency. managing pollution involves collaboration within a nation and international, nations signing up to agreements, companies’ taking responsibility for carbon footprint, all processes becoming more efficient. If processes were to become more efficient, particularly industry and public transit there would be a long-term future for fossil fuels. Candidates may refer to a wide range of strategies which would improve efficiency when using fossil fuels. please use level descriptors 1 please use level descriptors 2
Mark scheme, page 11
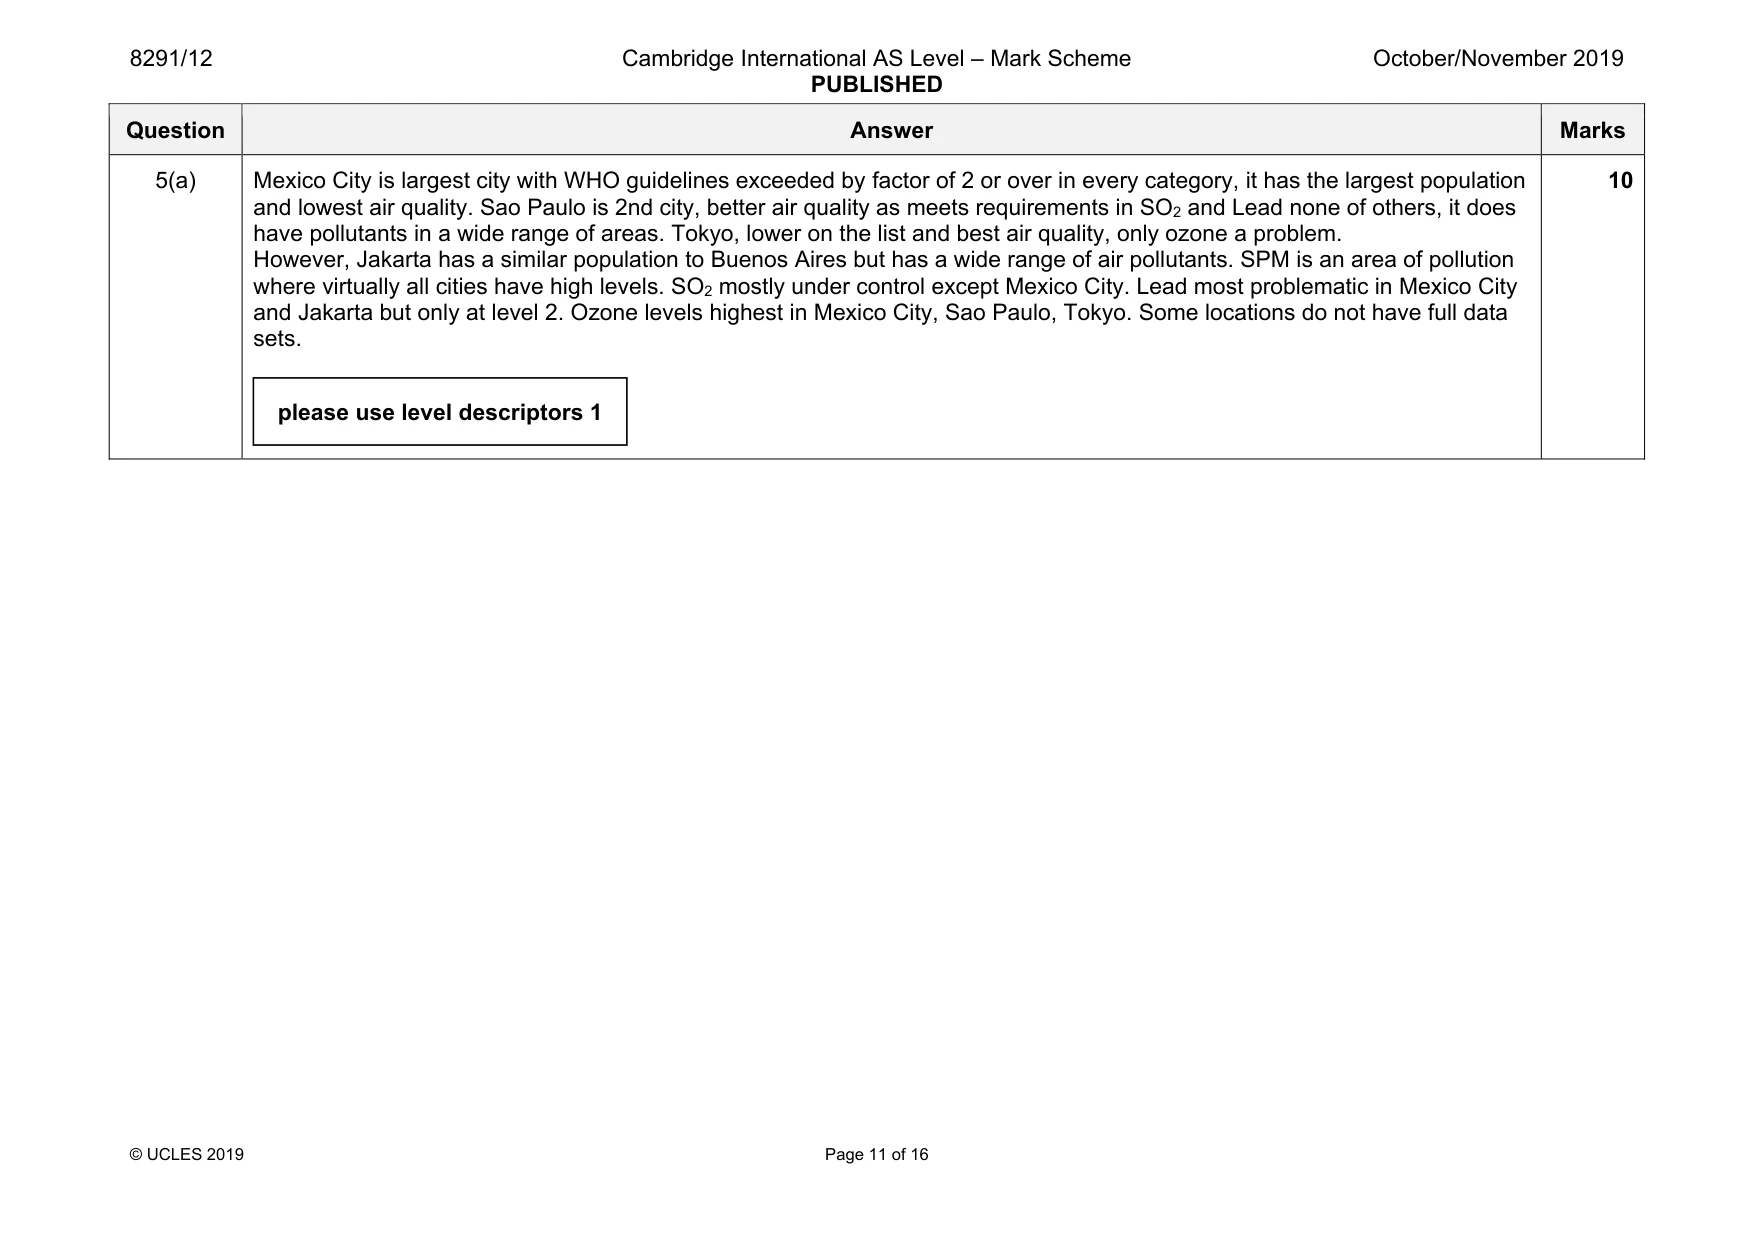
8291/12 Cambridge International AS Level – Mark Scheme PUBLISHED October/November 2019 © UCLES 2019 Page 11 of 16 Question Answer Marks 5(a) Mexico City is largest city with WHO guidelines exceeded by factor of 2 or over in every category, it has the largest population and lowest air quality. Sao Paulo is 2nd city, better air quality as meets requirements in SO2 and Lead none of others, it does have pollutants in a wide range of areas. Tokyo, lower on the list and best air quality, only ozone a problem. However, Jakarta has a similar population to Buenos Aires but has a wide range of air pollutants. SPM is an area of pollution where virtually all cities have high levels. SO2 mostly under control except Mexico City. Lead most problematic in Mexico City and Jakarta but only at level 2. Ozone levels highest in Mexico City, Sao Paulo, Tokyo. Some locations do not have full data sets. 10 please use level descriptors 1
Mark scheme, page 12
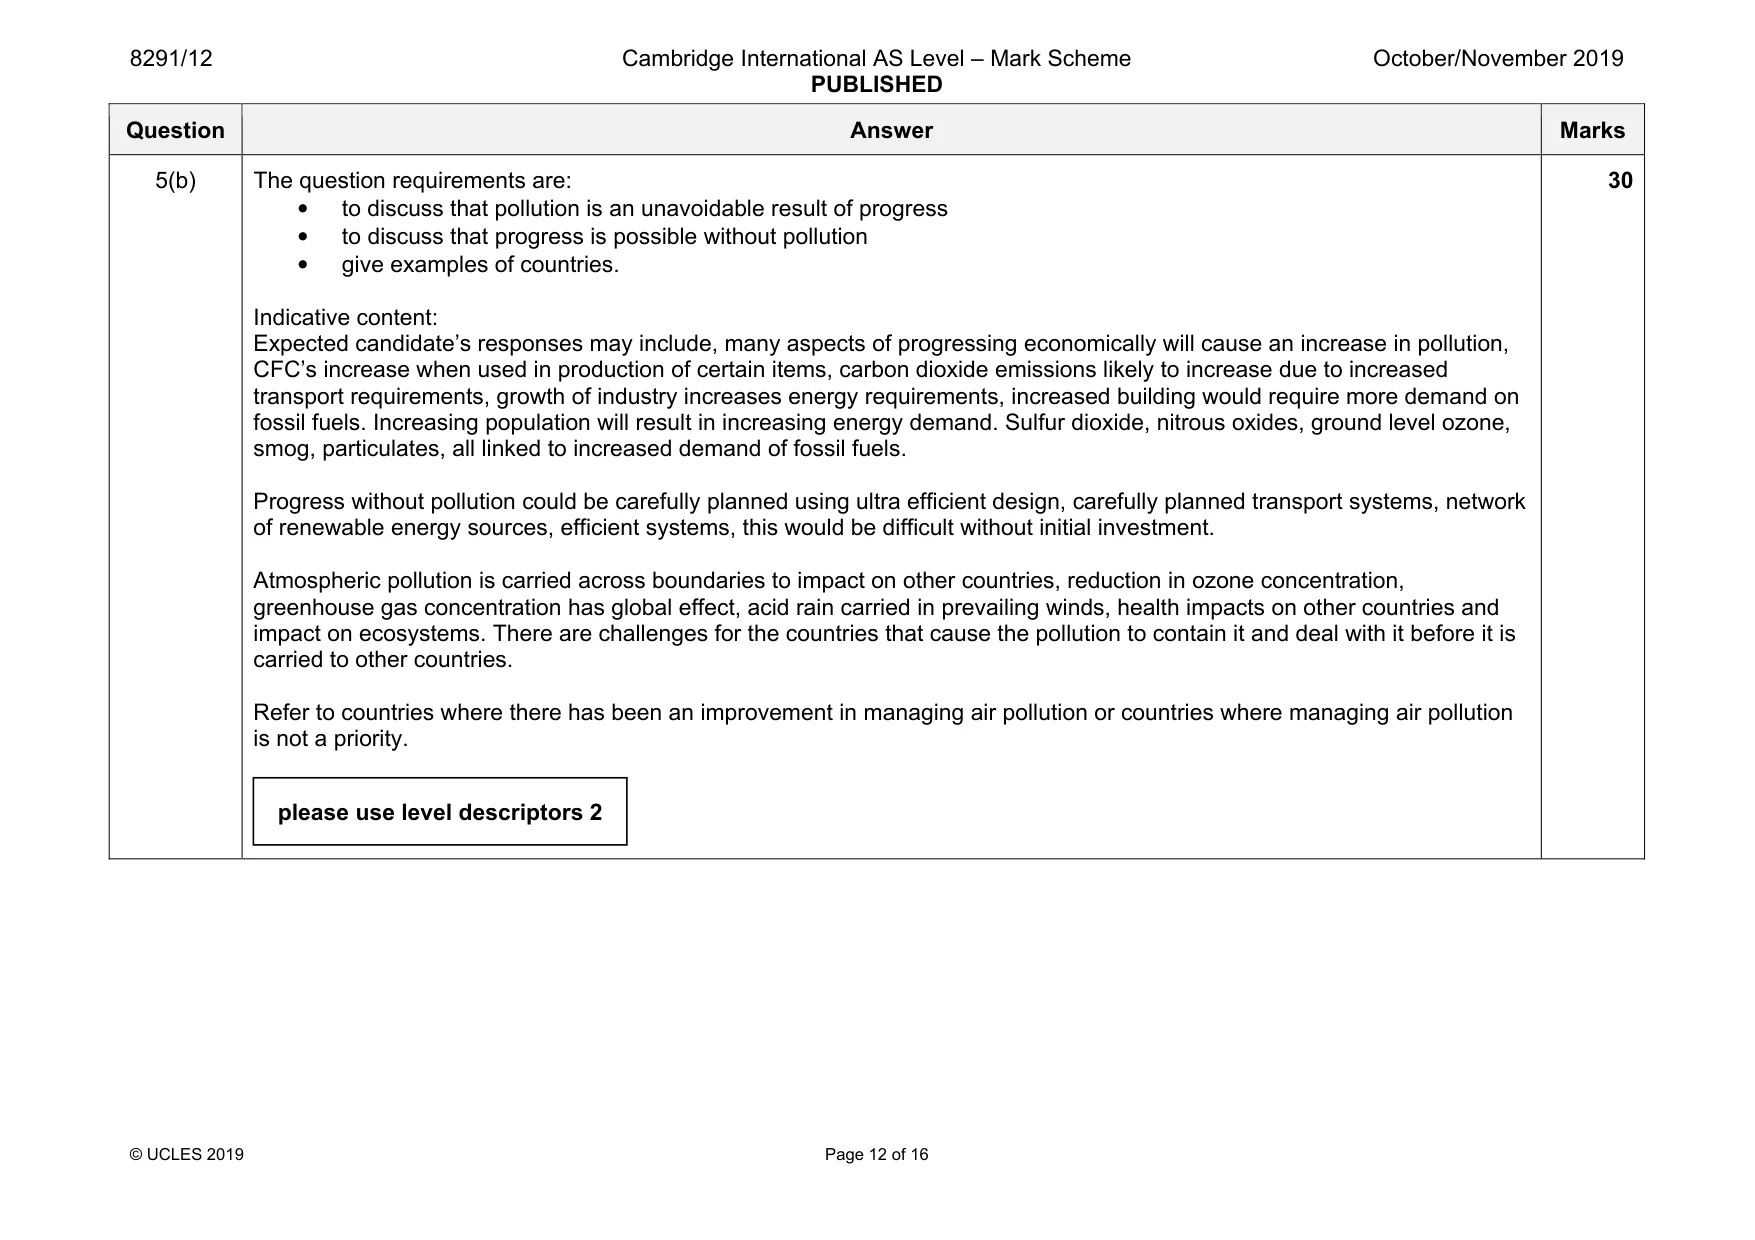
8291/12 Cambridge International AS Level – Mark Scheme PUBLISHED October/November 2019 © UCLES 2019 Page 12 of 16 Question Answer Marks 5(b) The question requirements are: • to discuss that pollution is an unavoidable result of progress • to discuss that progress is possible without pollution • give examples of countries. Indicative content: Expected candidate’s responses may include, many aspects of progressing economically will cause an increase in pollution, CFC’s increase when used in production of certain items, carbon dioxide emissions likely to increase due to increased transport requirements, growth of industry increases energy requirements, increased building would require more demand on fossil fuels. Increasing population will result in increasing energy demand. Sulfur dioxide, nitrous oxides, ground level ozone, smog, particulates, all linked to increased demand of fossil fuels. Progress without pollution could be carefully planned using ultra efficient design, carefully planned transport systems, network of renewable energy sources, efficient systems, this would be difficult without initial investment. Atmospheric pollution is carried across boundaries to impact on other countries, reduction in ozone concentration, greenhouse gas concentration has global effect, acid rain carried in prevailing winds, health impacts on other countries and impact on ecosystems. There are challenges for the countries that cause the pollution to contain it and deal with it before it is carried to other countries. Refer to countries where there has been an improvement in managing air pollution or countries where managing air pollution is not a priority. 30 please use level descriptors 2
Mark scheme, page 13
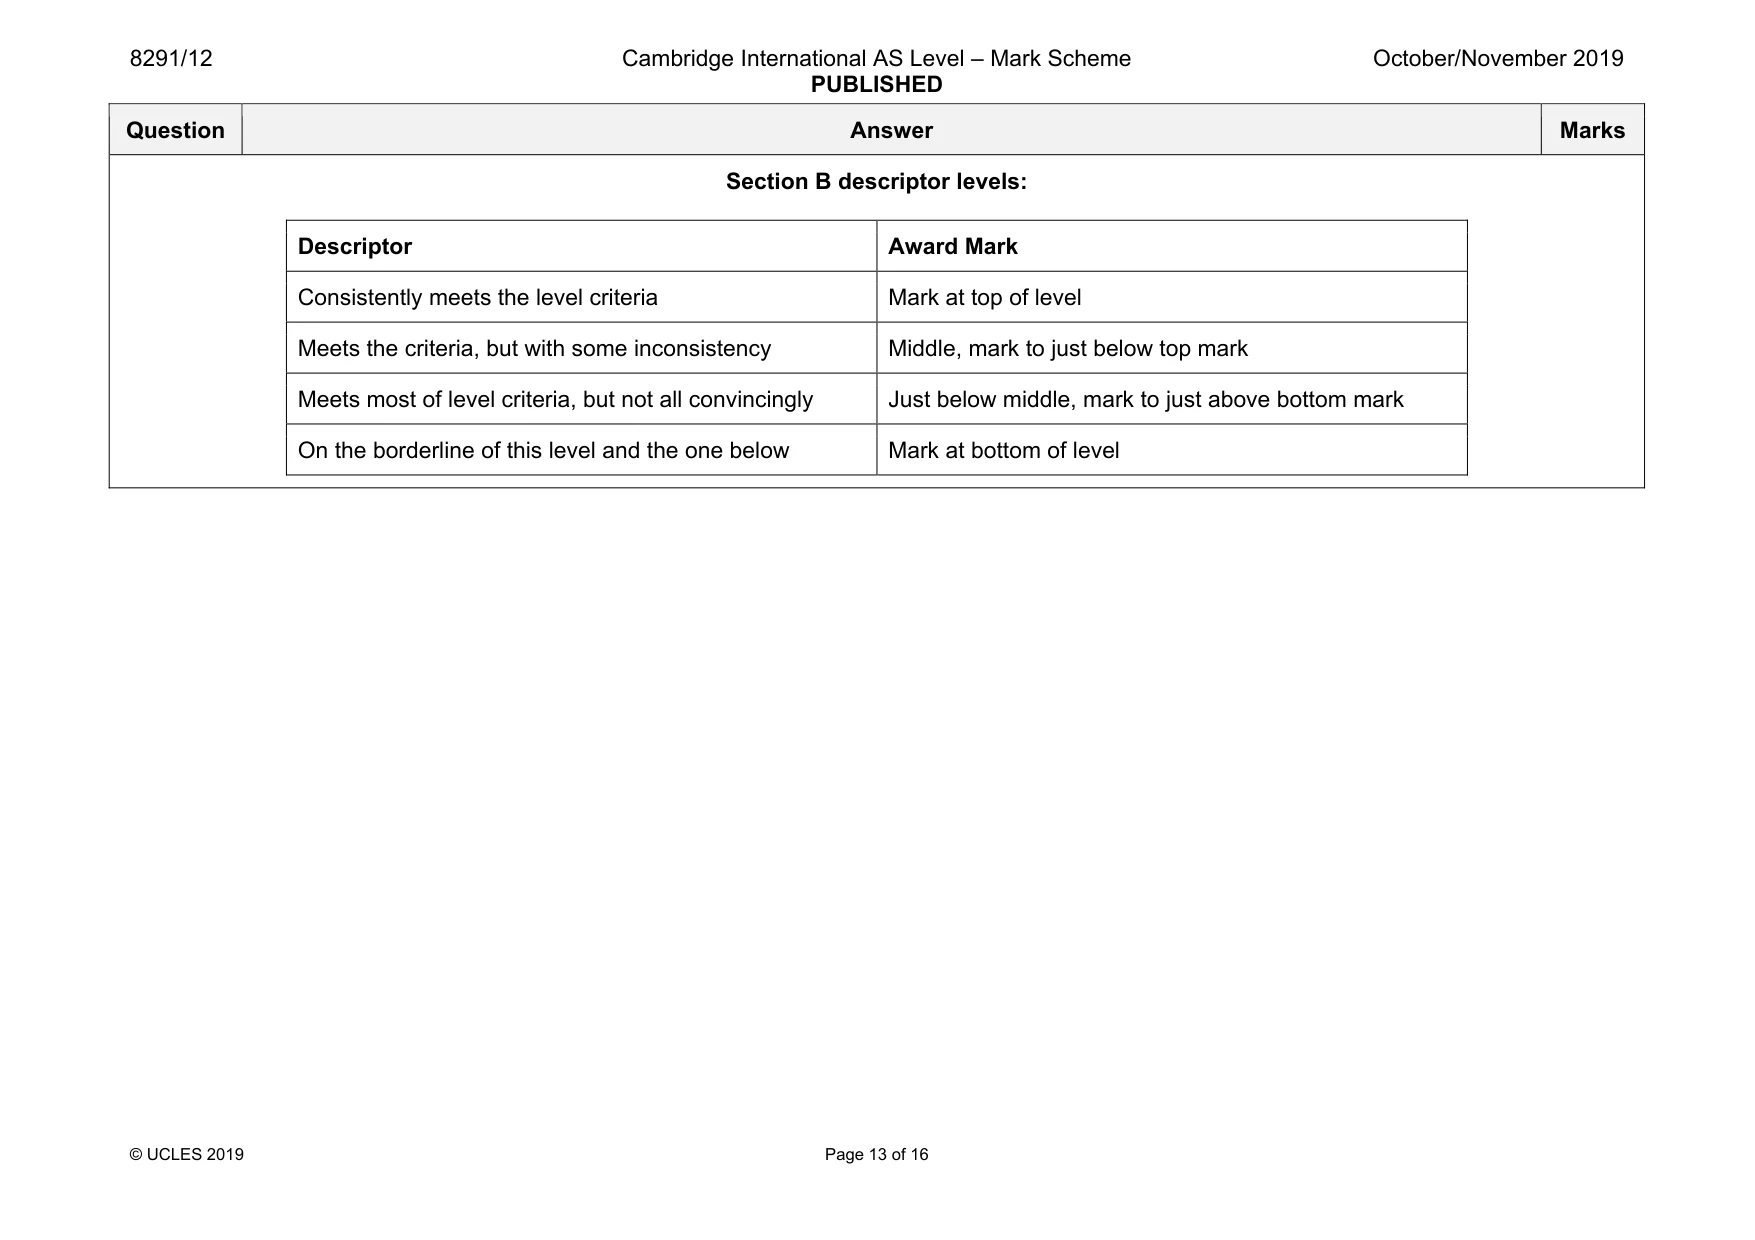
8291/12 Cambridge International AS Level – Mark Scheme PUBLISHED October/November 2019 © UCLES 2019 Page 13 of 16 Question Answer Marks Section B descriptor levels: Descriptor Award Mark Consistently meets the level criteria Mark at top of level Meets the criteria, but with some inconsistency Middle, mark to just below top mark Meets most of level criteria, but not all convincingly Just below middle, mark to just above bottom mark On the borderline of this level and the one below Mark at bottom of level
Mark scheme, page 14
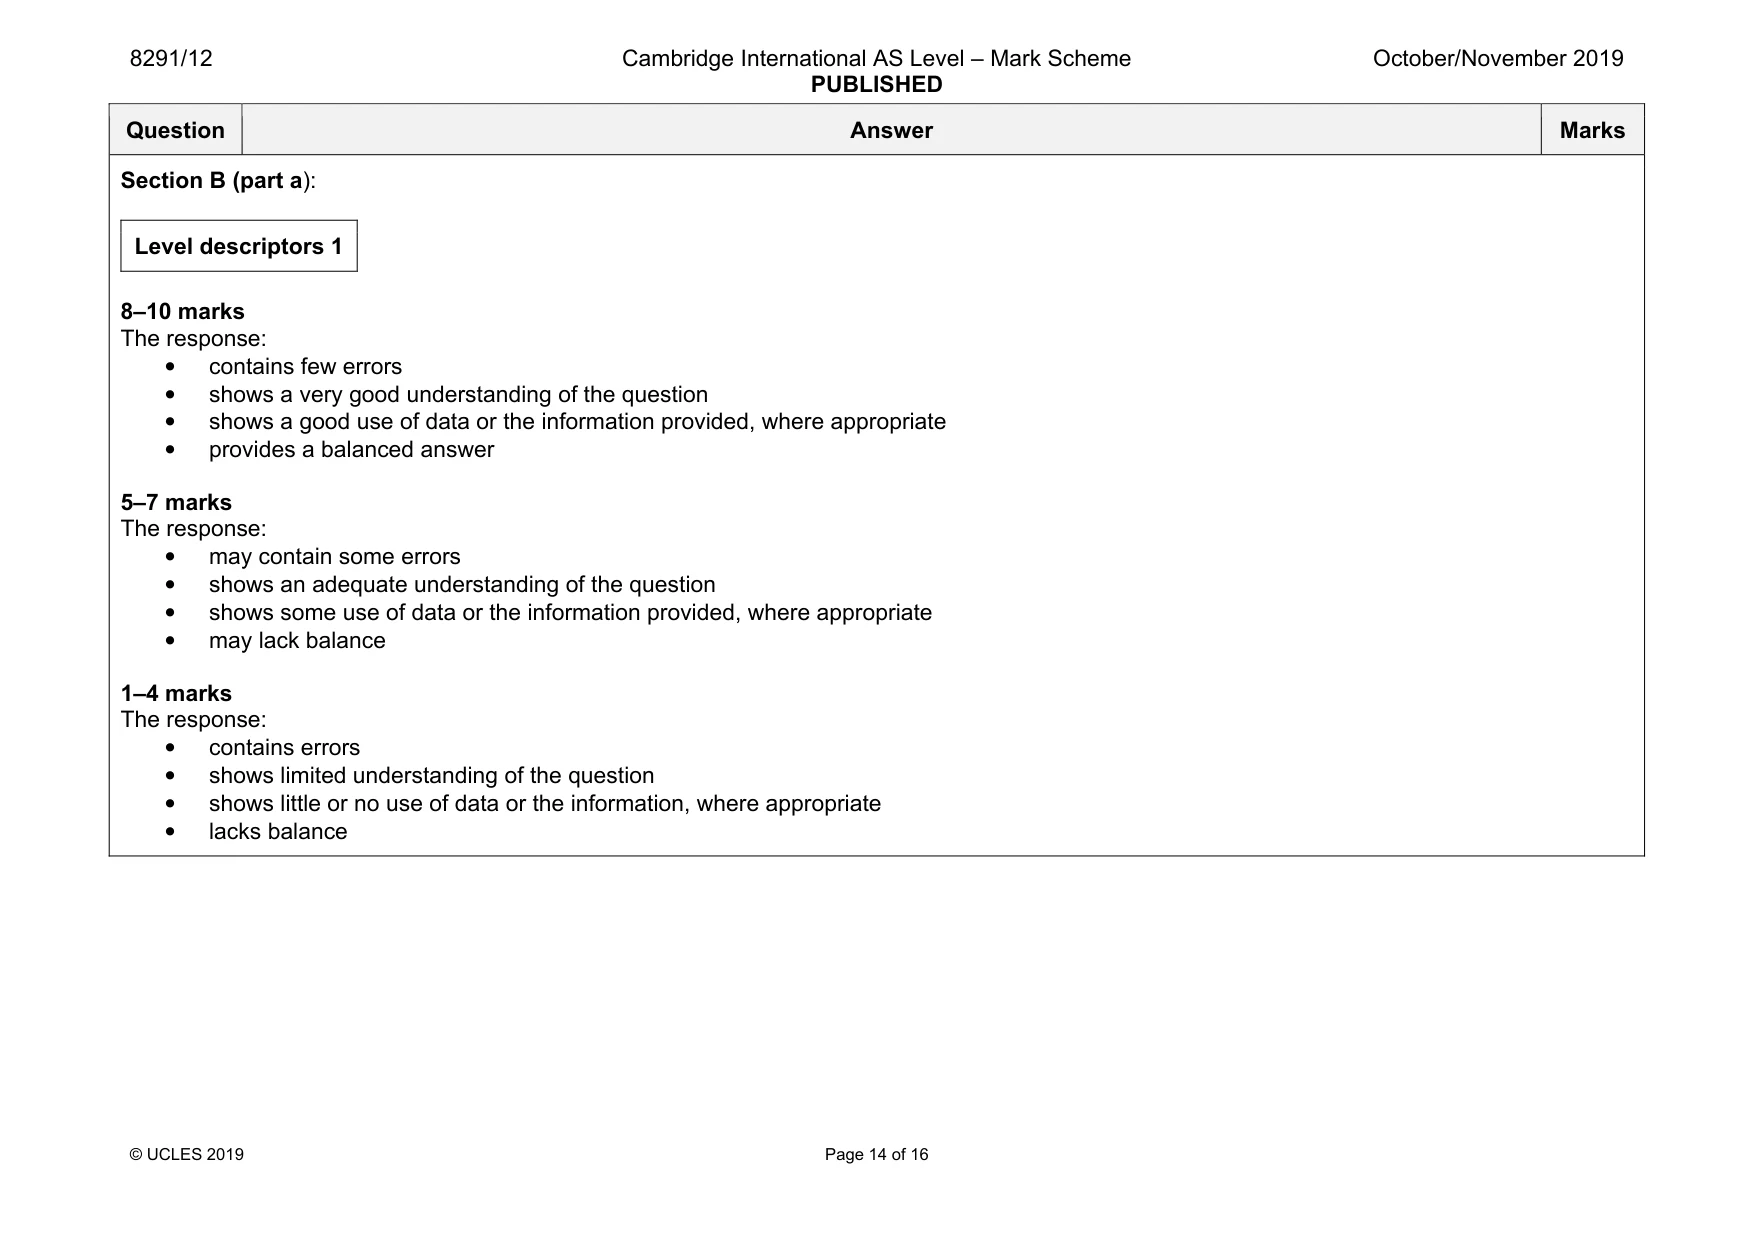
8291/12 Cambridge International AS Level – Mark Scheme PUBLISHED October/November 2019 © UCLES 2019 Page 14 of 16 Question Answer Marks Section B (part a): Level descriptors 1 8–10 marks The response: • contains few errors • shows a very good understanding of the question • shows a good use of data or the information provided, where appropriate • provides a balanced answer 5–7 marks The response: • may contain some errors • shows an adequate understanding of the question • shows some use of data or the information provided, where appropriate • may lack balance 1–4 marks The response: • contains errors • shows limited understanding of the question • shows little or no use of data or the information, where appropriate • lacks balance
Mark scheme, page 15
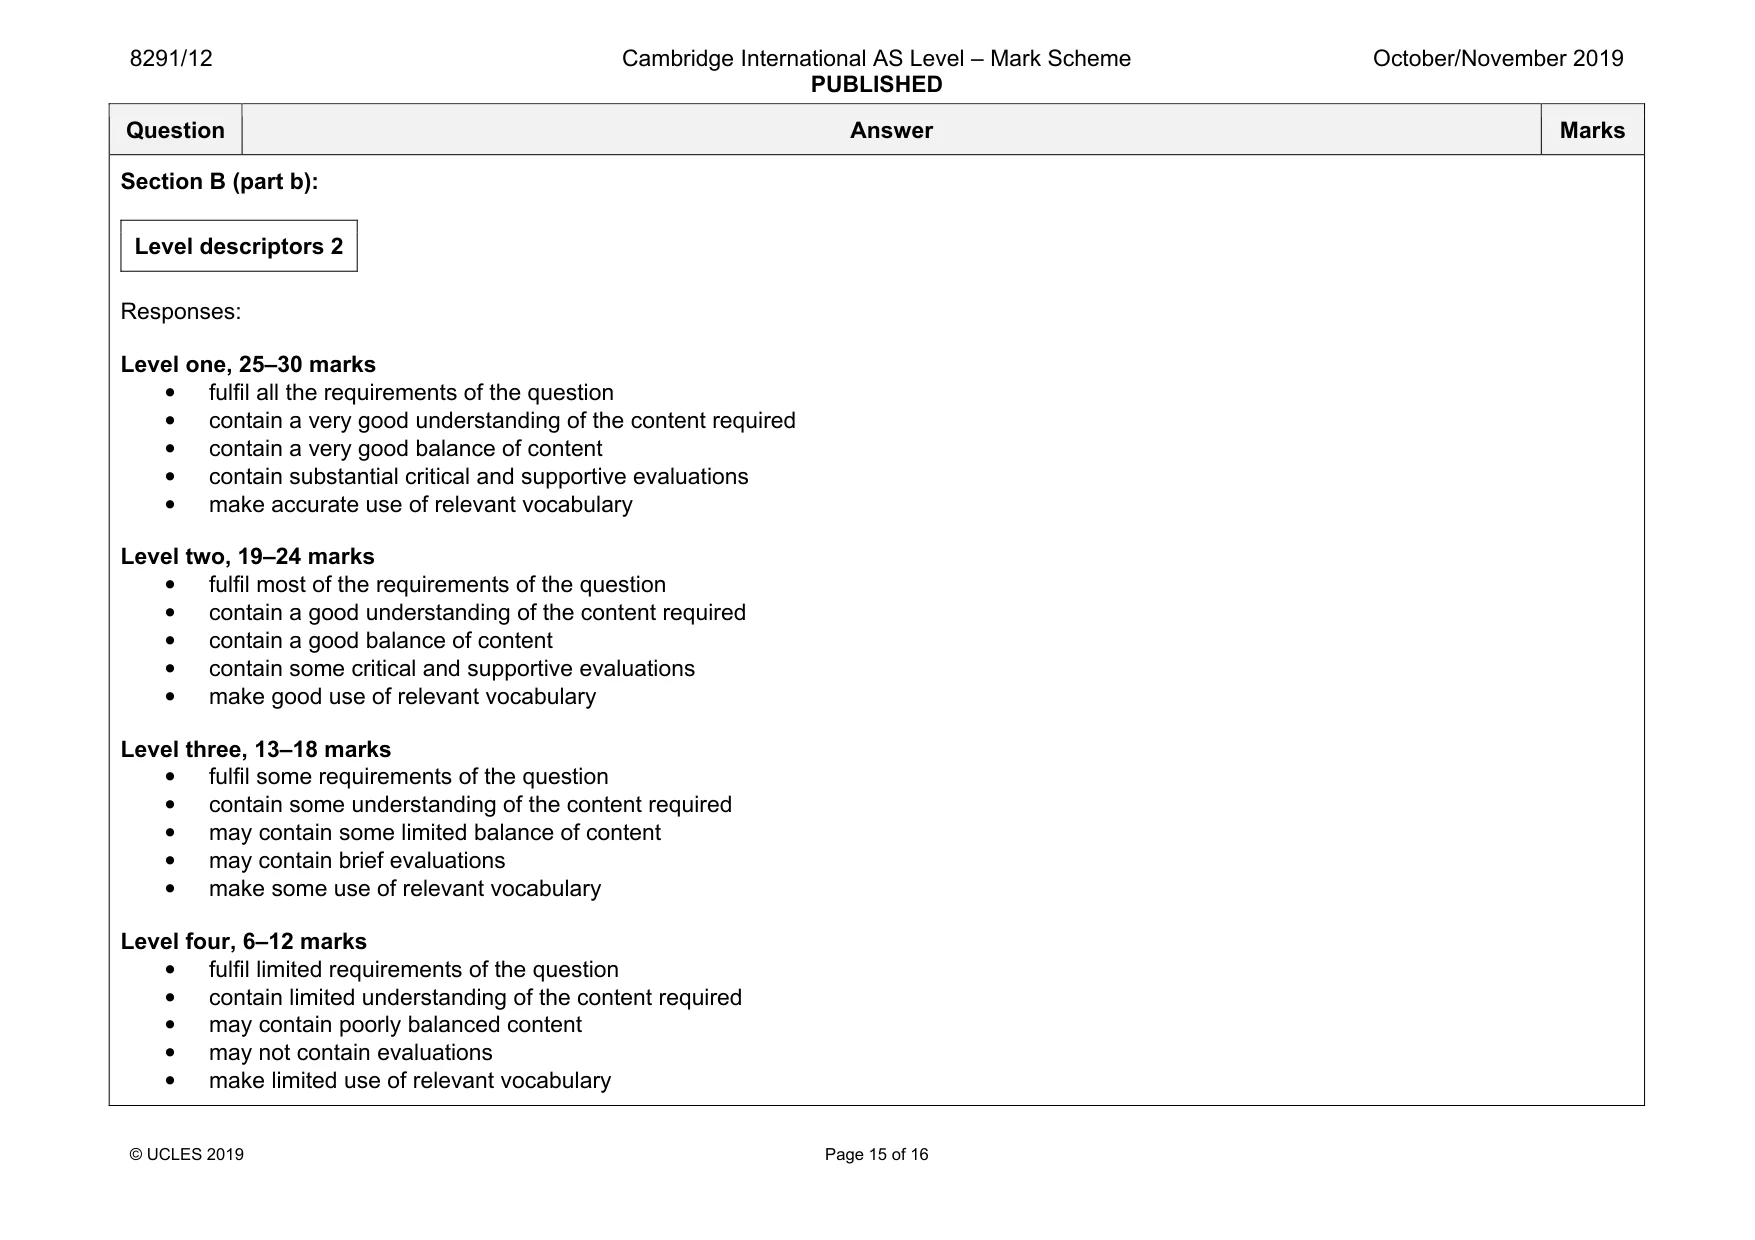
8291/12 Cambridge International AS Level – Mark Scheme PUBLISHED October/November 2019 © UCLES 2019 Page 15 of 16 Question Answer Marks Section B (part b): Level descriptors 2 Responses: Level one, 25–30 marks • fulfil all the requirements of the question • contain a very good understanding of the content required • contain a very good balance of content • contain substantial critical and supportive evaluations • make accurate use of relevant vocabulary Level two, 19–24 marks • fulfil most of the requirements of the question • contain a good understanding of the content required • contain a good balance of content • contain some critical and supportive evaluations • make good use of relevant vocabulary Level three, 13–18 marks • fulfil some requirements of the question • contain some understanding of the content required • may contain some limited balance of content • may contain brief evaluations • make some use of relevant vocabulary Level four, 6–12 marks • fulfil limited requirements of the question • contain limited understanding of the content required • may contain poorly balanced content • may not contain evaluations • make limited use of relevant vocabulary
Mark scheme, page 16
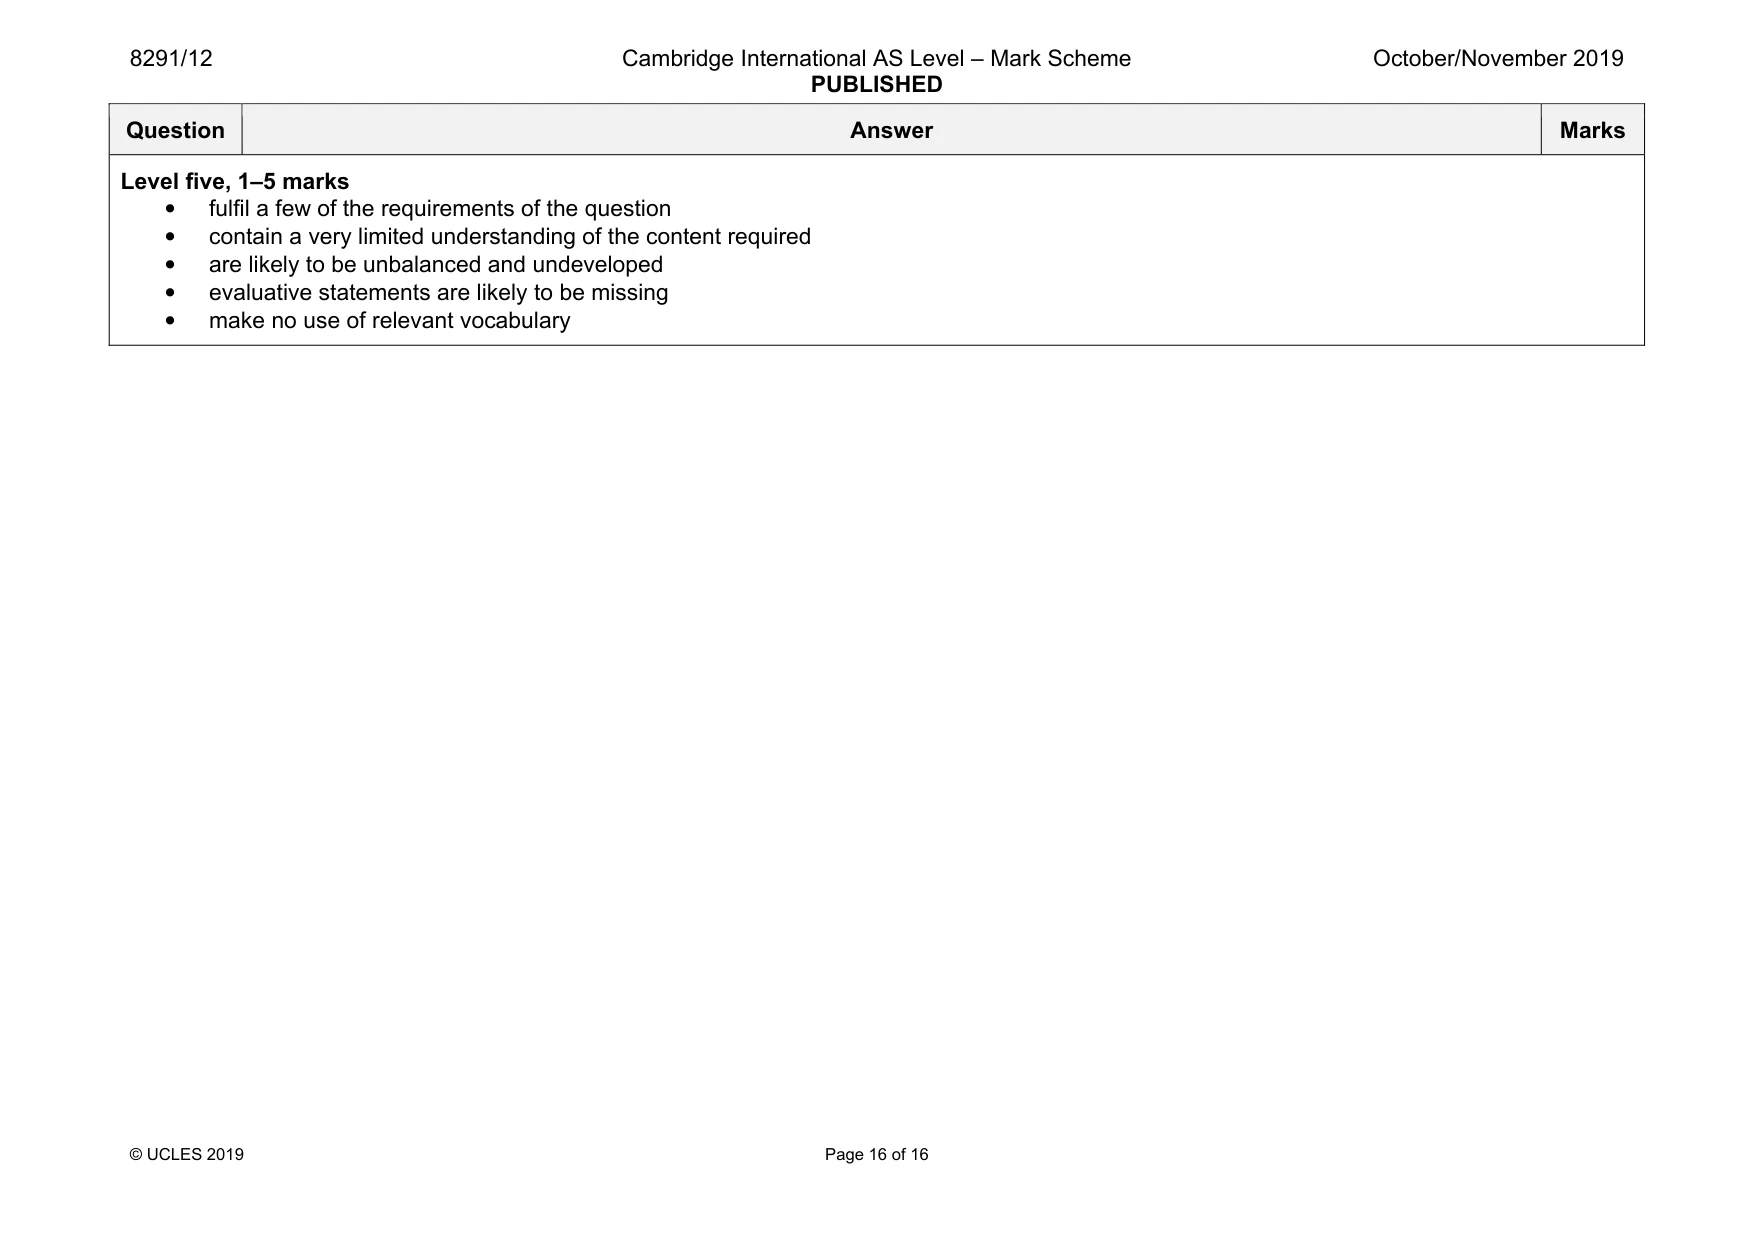
8291/12 Cambridge International AS Level – Mark Scheme PUBLISHED October/November 2019 © UCLES 2019 Page 16 of 16 Question Answer Marks Level five, 1–5 marks • fulfil a few of the requirements of the question • contain a very limited understanding of the content required • are likely to be unbalanced and undeveloped • evaluative statements are likely to be missing • make no use of relevant vocabulary
What you needed in this session
Cambridge’s own grade thresholds for 2019 Oct/Nov, Paper 1 · Variant 2. A higher threshold means an easier paper — the bar moves with how the cohort did.