Cambridge A Level Environmental Management (AS only) 8291 — 2019 May/June Paper 1 · Variant 1
8291/11/M/J/19 · 80 marks · ≈90 min
The question paper and its mark scheme, free to read here and free to download. This is Cambridge’s own paper, exactly as it was sat.
Question paper16 pages



Mark scheme16 pages
Answers below. Sit the paper first if you are practising.
Paper as text
Question paper, page 1
This document consists of 13 printed pages and 3 blank pages. DC (RW/CB) 166239/4 © UCLES 2019 [Turn over * 6 4 5 2 7 8 0 7 3 6 * ENVIRONMENTAL MANAGEMENT 8291/11 Paper 1 Lithosphere and Atmosphere May/June 2019 1 hour 30 minutes Additional Materials: Answer Booklet/Paper READ THESE INSTRUCTIONS FIRST Write your centre number, candidate number and name on all the work you hand in. Write in dark blue or black pen. You may use an HB pencil for any diagrams or graphs. Do not use staples, paper clips, glue or correction fluid. DO NOT WRITE IN ANY BARCODES. Electronic calculators may be used. You may lose marks if you do not show your working or if you do not use appropriate units. Section A Answer all questions in this section. Write your answers in the spaces provided on the question paper. Section B Answer one question from this section. Write your answers on the separate answer paper provided. At the end of the examination, 1. fasten all separate answer paper securely to the question paper; 2. enter the question number from Section B in the grid. Cambridge Assessment International Education Cambridge International Advanced Subsidiary Level For Examiner’s Use Section A 1 2 Section B Total
Question paper, page 2
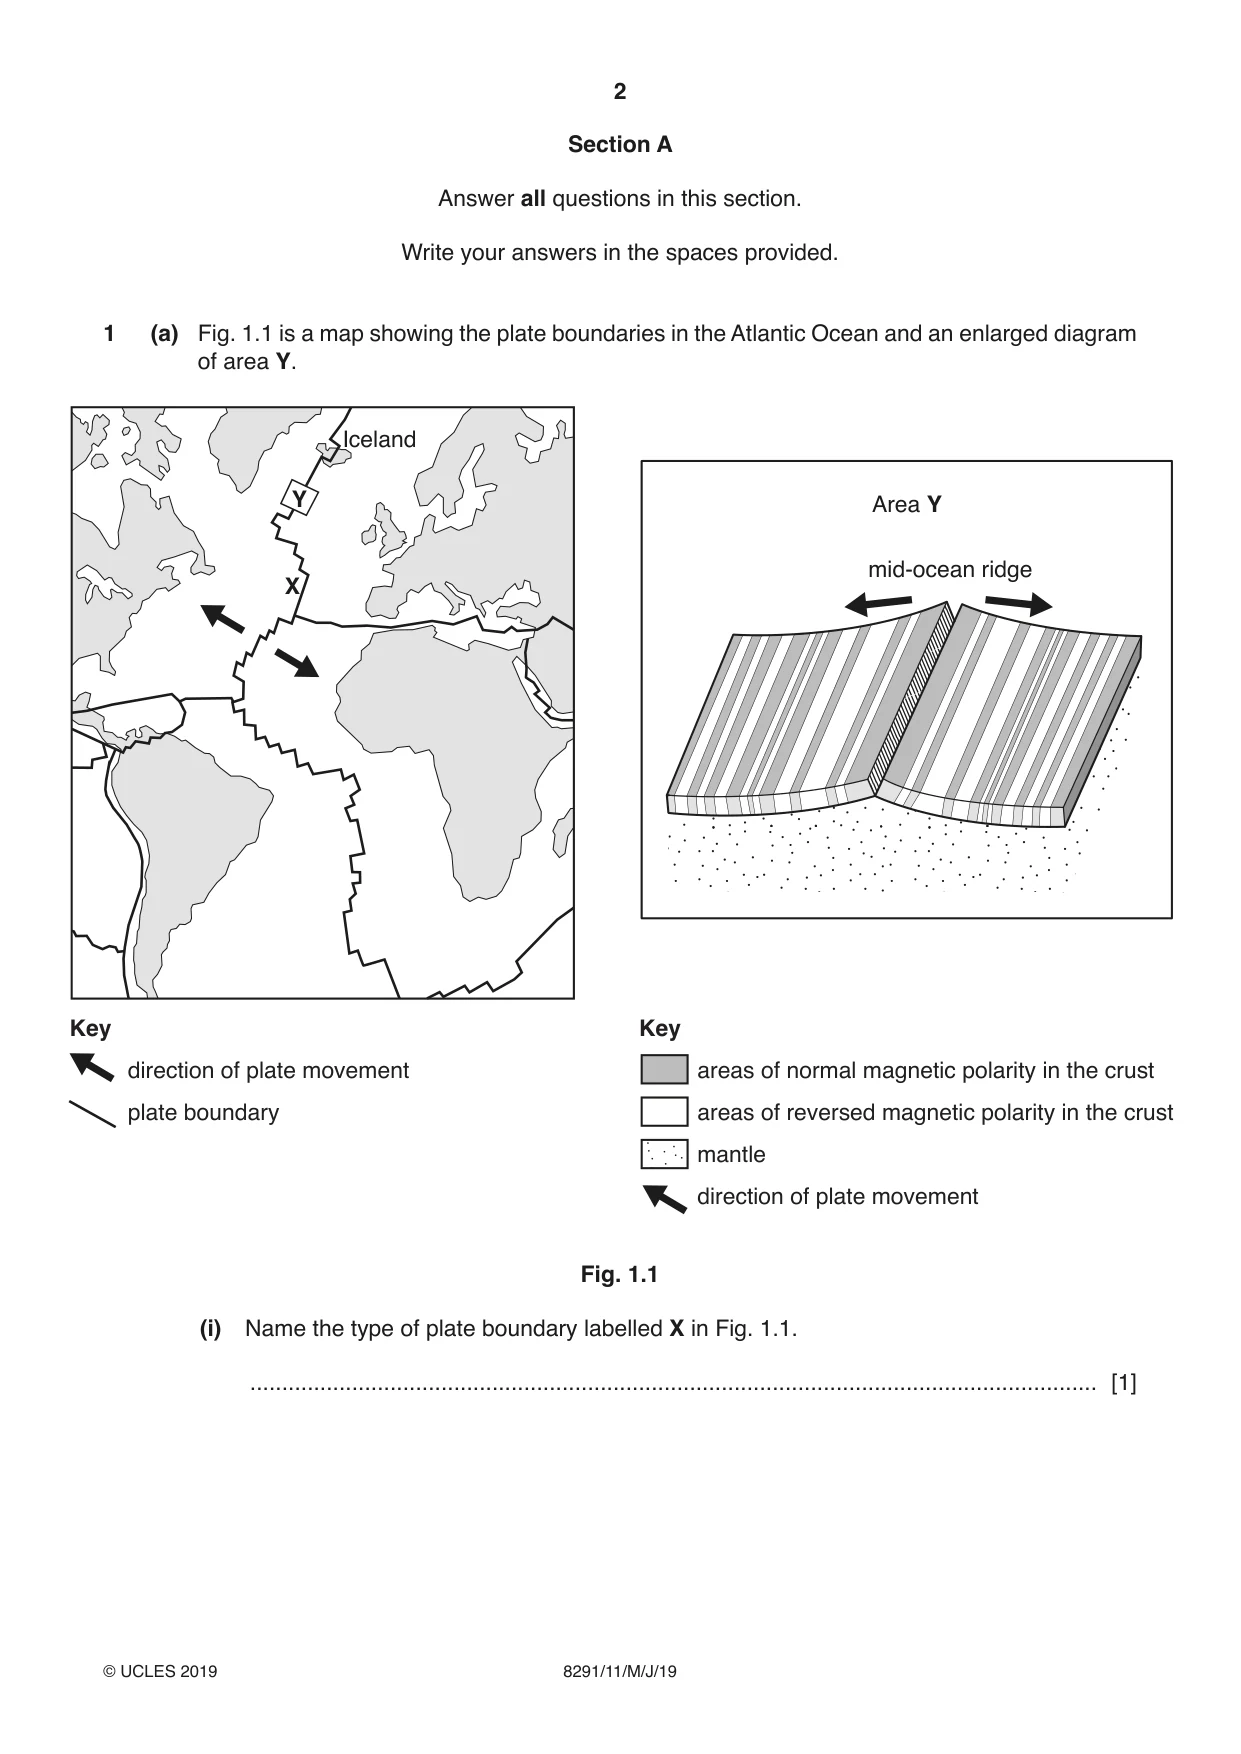
2 8291/11/M/J/19 © UCLES 2019 Section A Answer all questions in this section. Write your answers in the spaces provided. 1 (a) Fig. 1.1 is a map showing the plate boundaries in the Atlantic Ocean and an enlarged diagram of area Y. Iceland Area Y mid-ocean ridge Y X Key direction of plate movement plate boundary Key areas of normal magnetic polarity in the crust areas of reversed magnetic polarity in the crust mantle direction of plate movement Fig. 1.1 (i) Name the type of plate boundary labelled X in Fig. 1.1. … [1]
Question paper, page 3
3 8291/11/M/J/19 © UCLES 2019 [Turn over (ii) Describe the processes which occur that cause ocean floor spreading. … … … … … … [3] (iii) Explain how the pattern of magnetic reversals shown in Fig. 1.1 provides evidence for ocean floor spreading. … … … … … … … … [4]
Question paper, page 4
4 8291/11/M/J/19 © UCLES 2019 BLANK PAGE
Question paper, page 5
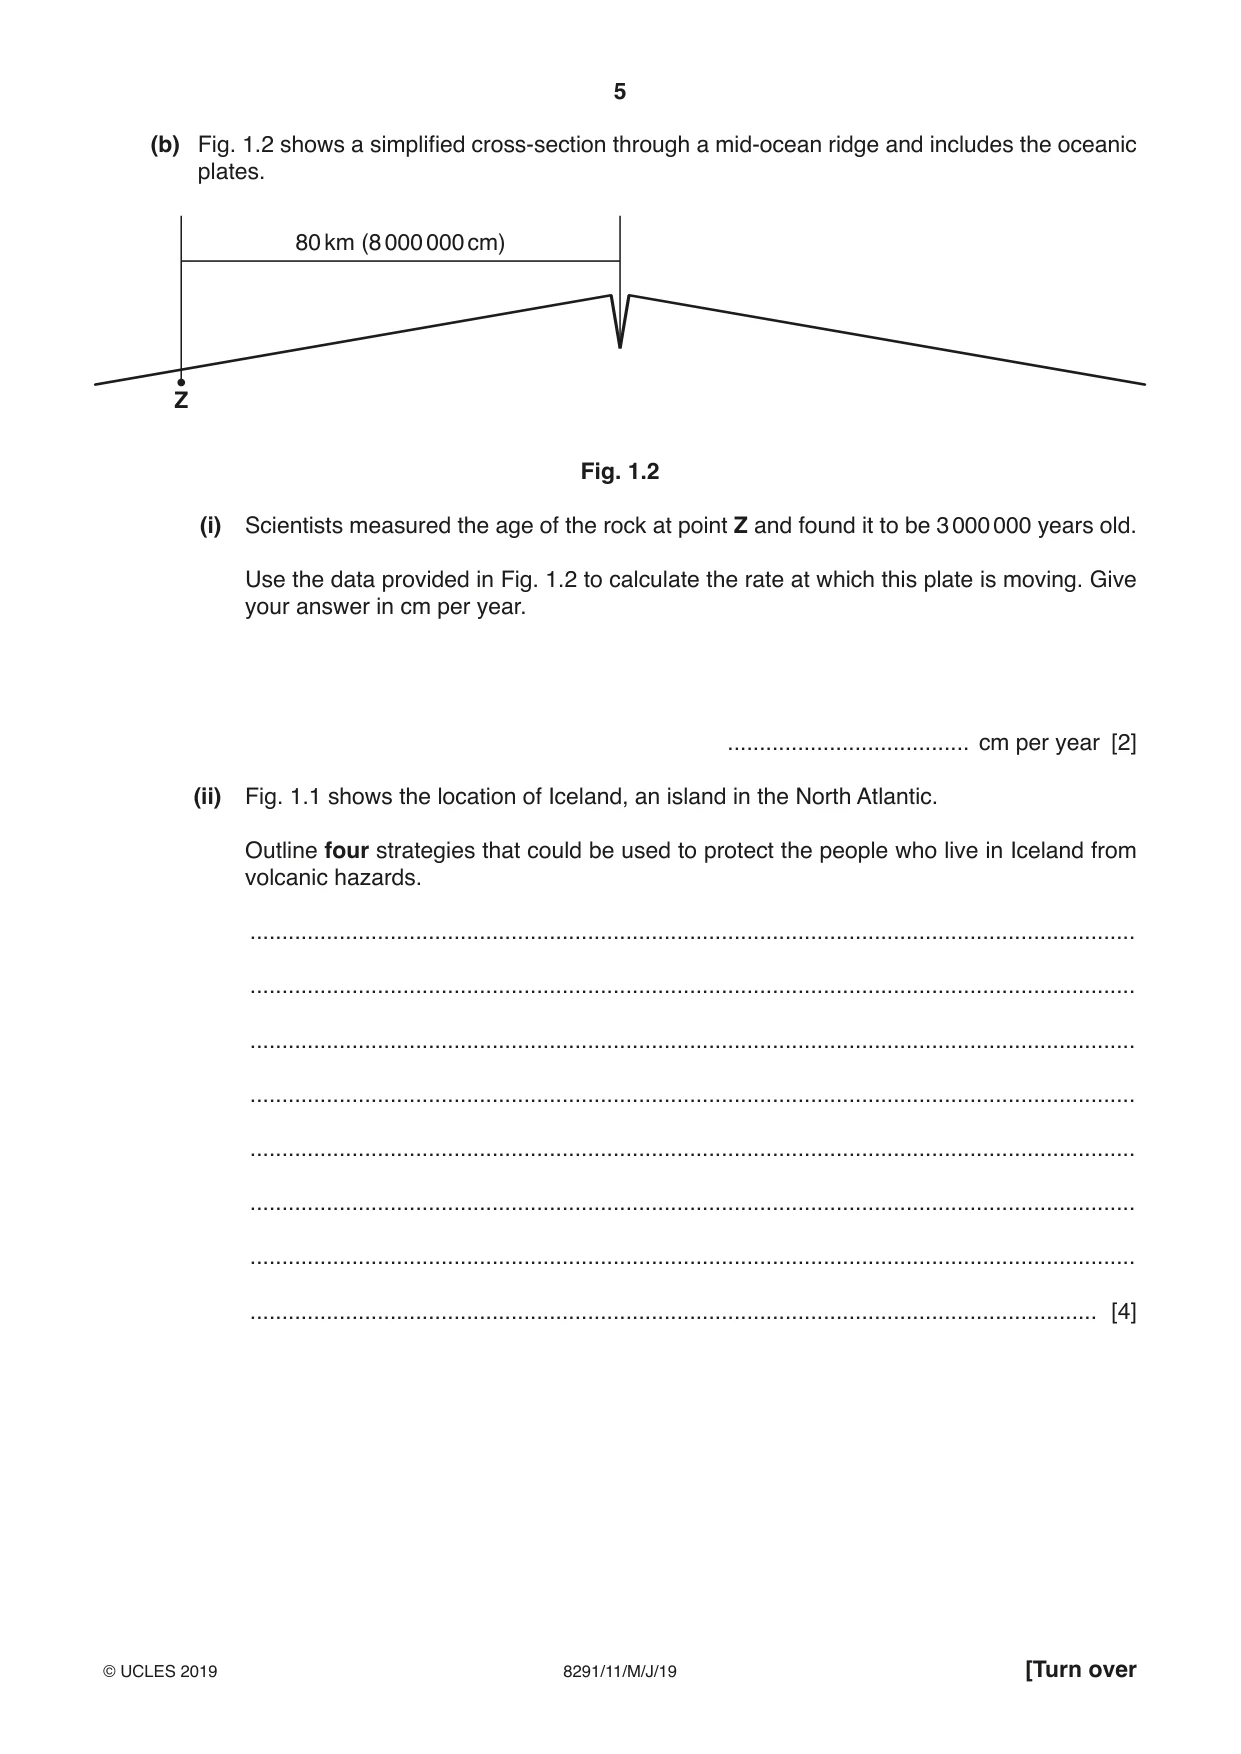
5 8291/11/M/J/19 © UCLES 2019 [Turn over (b) Fig. 1.2 shows a simplified cross‑section through a mid‑ocean ridge and includes the oceanic plates. 80 km (8 000 000 cm) Z Fig. 1.2 (i) Scientists measured the age of the rock at point Z and found it to be 3 000 000 years old. Use the data provided in Fig. 1.2 to calculate the rate at which this plate is moving. Give your answer in cm per year. … cm per year [2] (ii) Fig. 1.1 shows the location of Iceland, an island in the North Atlantic. Outline four strategies that could be used to protect the people who live in Iceland from volcanic hazards. … … … … … … … … [4]
Question paper, page 6
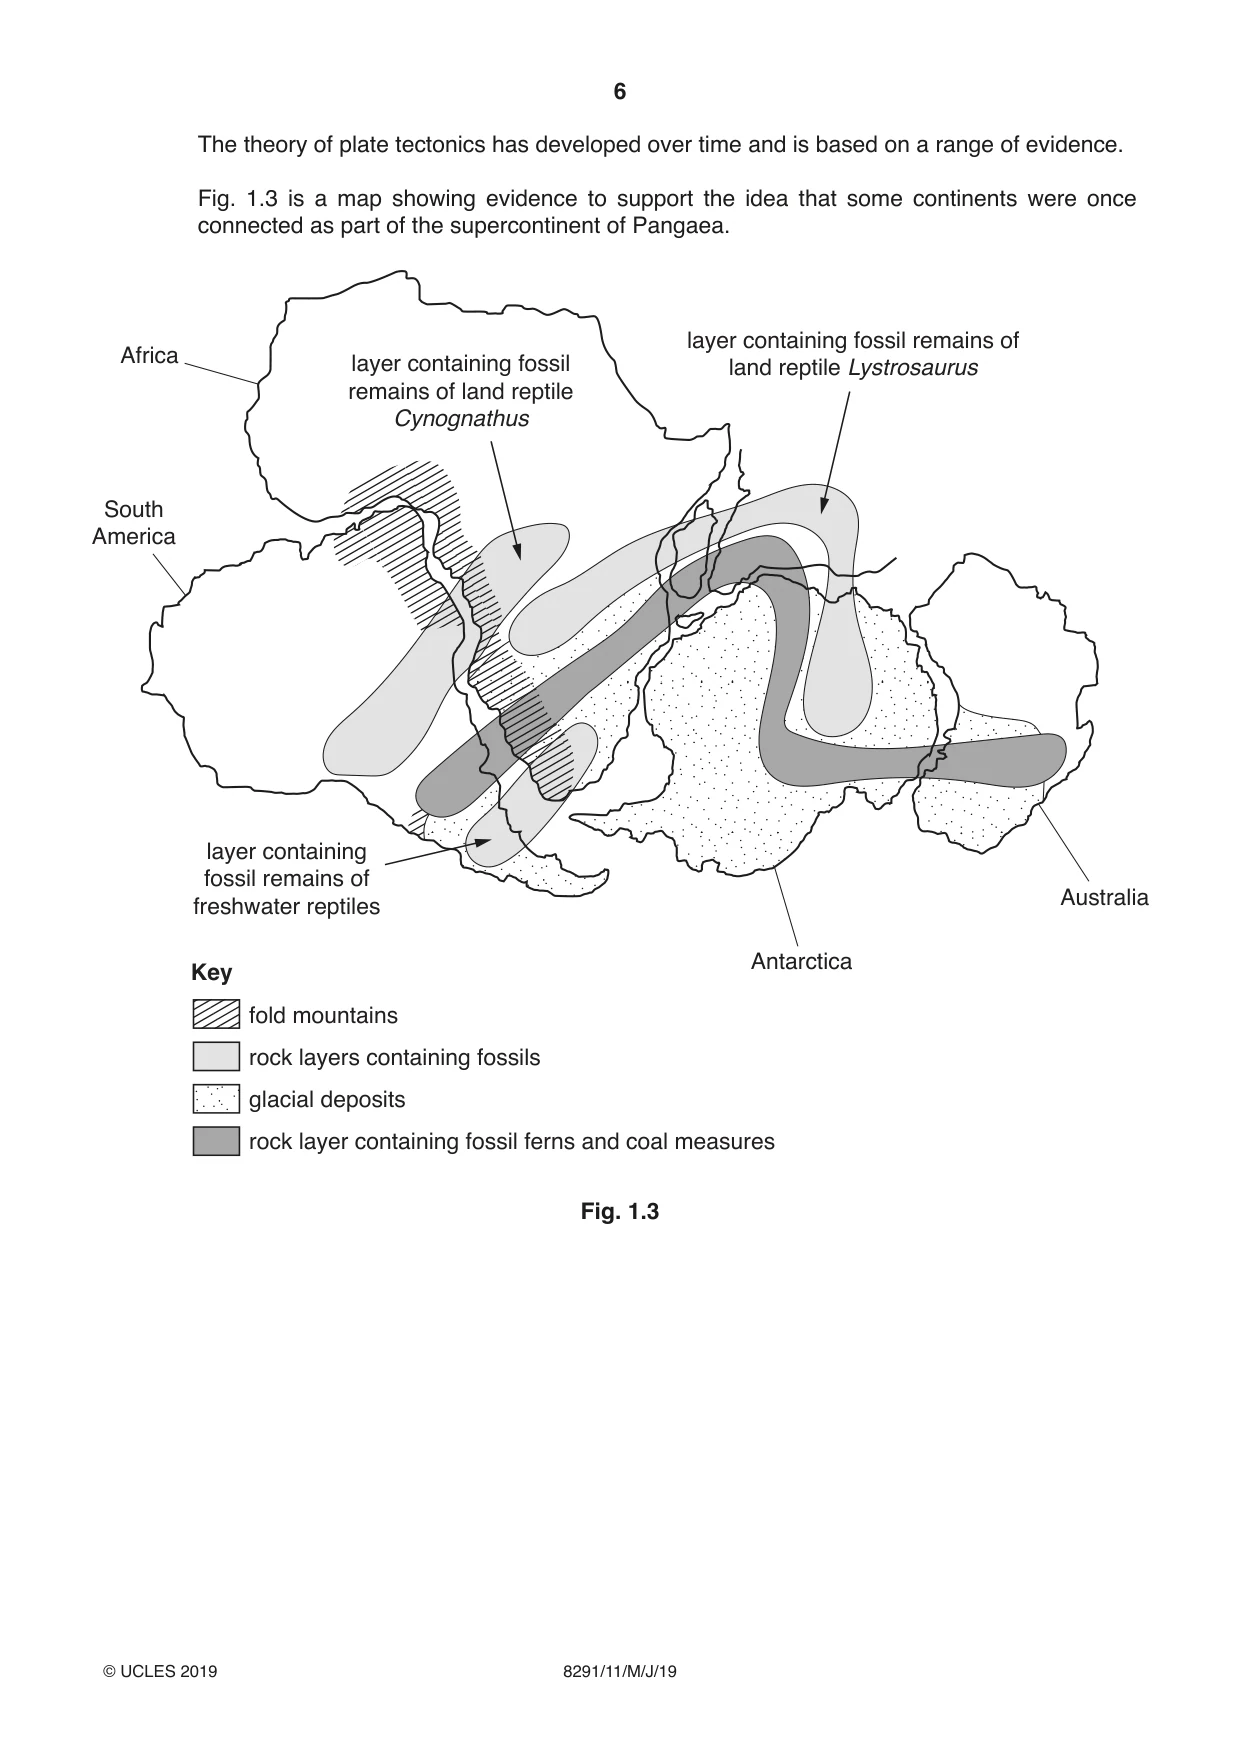
6 8291/11/M/J/19 © UCLES 2019 The theory of plate tectonics has developed over time and is based on a range of evidence. Fig. 1.3 is a map showing evidence to support the idea that some continents were once connected as part of the supercontinent of Pangaea. Key fold mountains rock layers containing fossils glacial deposits rock layer containing fossil ferns and coal measures layer containing fossil remains of freshwater reptiles layer containing fossil remains of land reptile Cynognathus layer containing fossil remains of land reptile Lystrosaurus Africa Antarctica Australia South America Fig. 1.3
Question paper, page 7
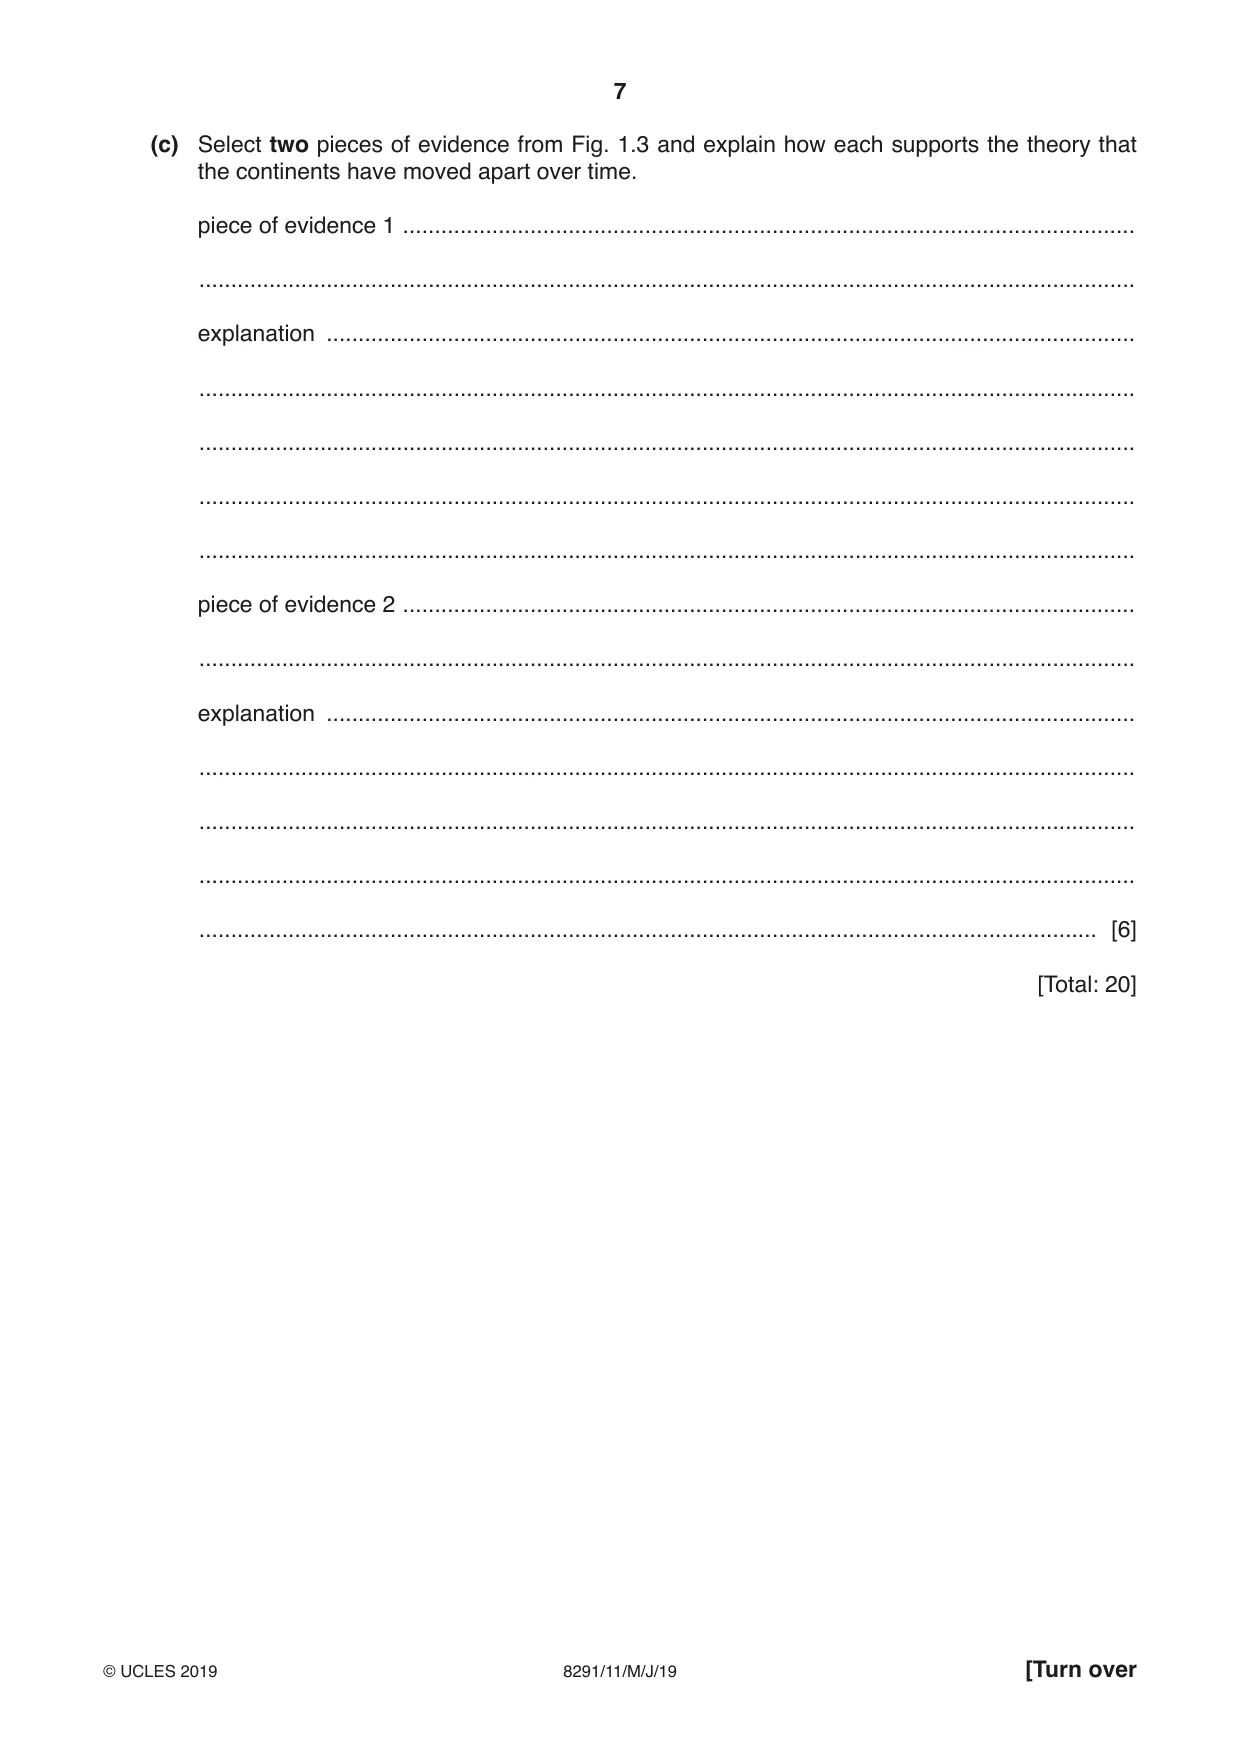
7 8291/11/M/J/19 © UCLES 2019 [Turn over (c) Select two pieces of evidence from Fig. 1.3 and explain how each supports the theory that the continents have moved apart over time. piece of evidence 1 … … explanation … … … … … piece of evidence 2 … … explanation … … … … … [6] [Total: 20]
Question paper, page 8
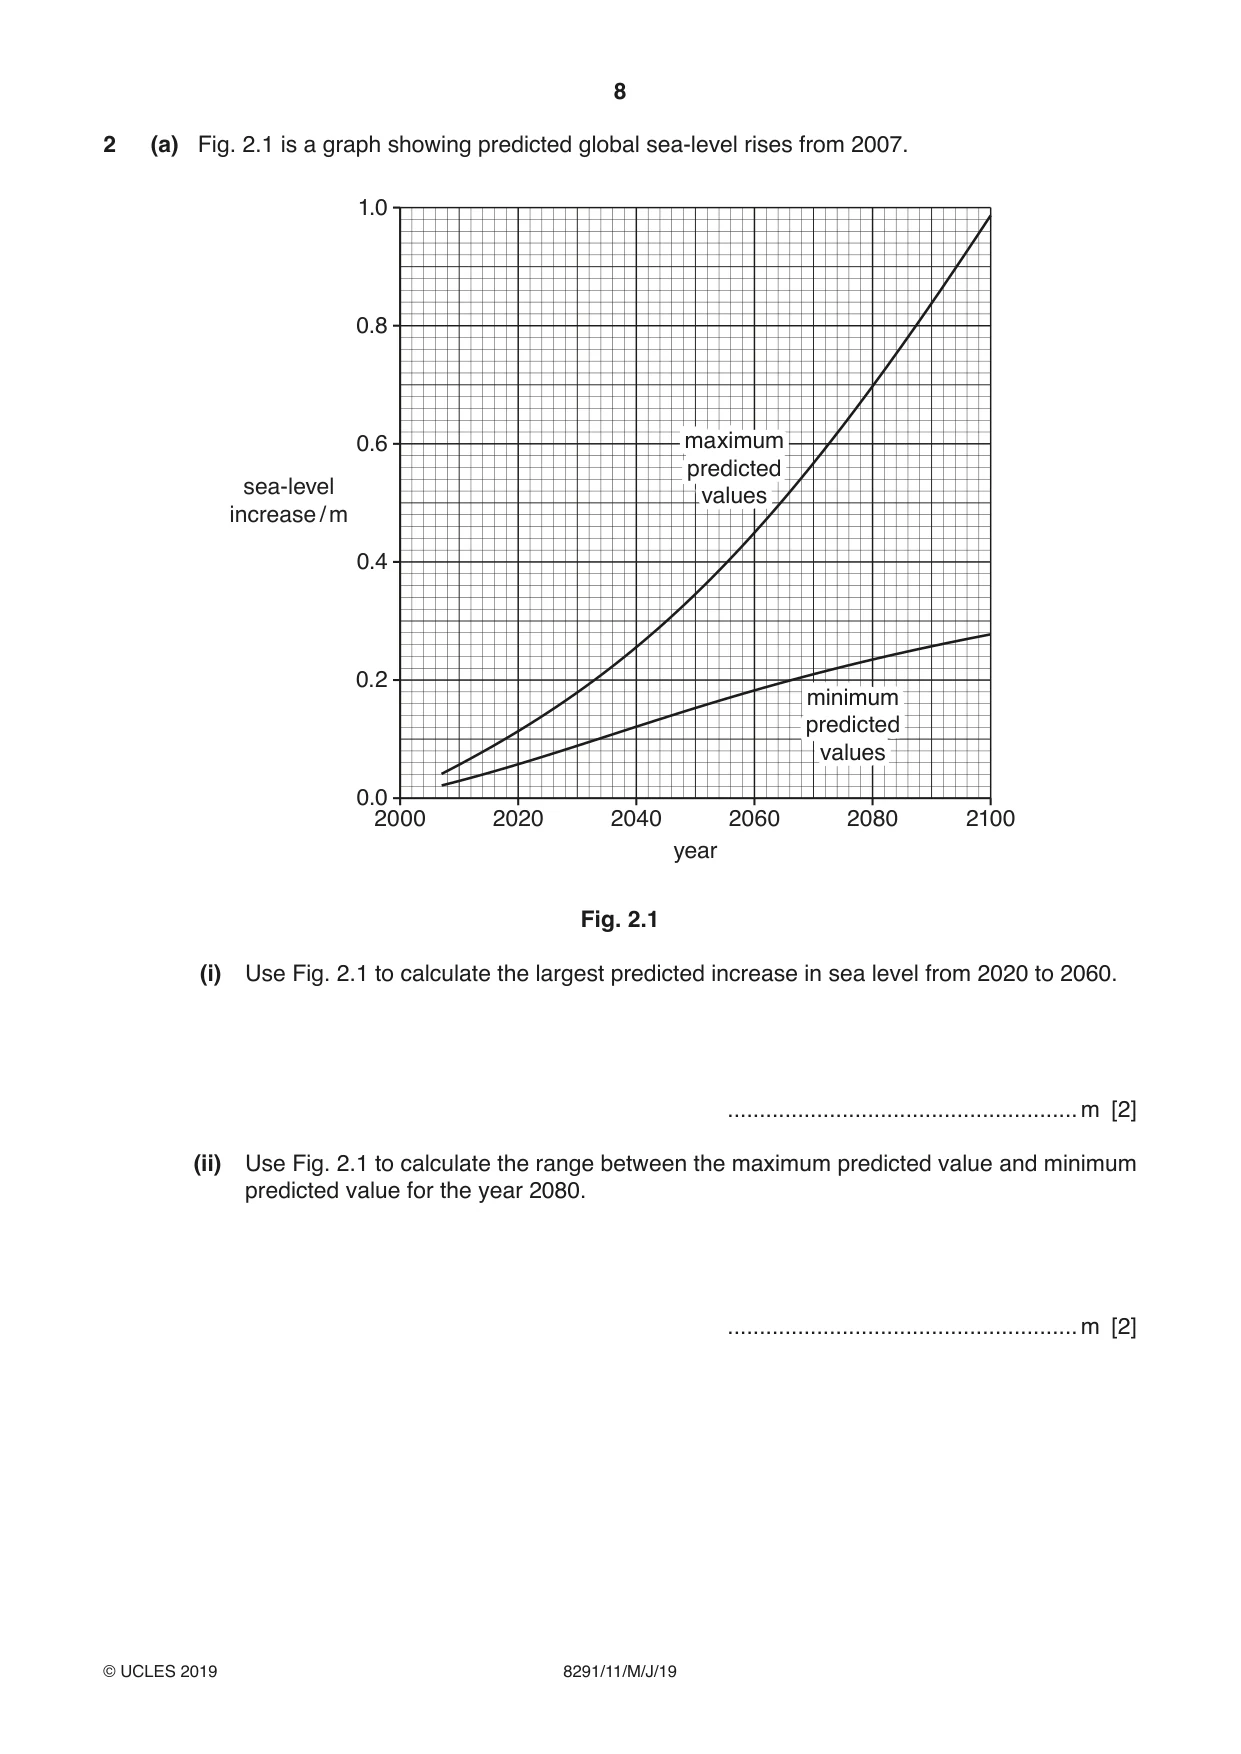
8 8291/11/M/J/19 © UCLES 2019 2 (a) Fig. 2.1 is a graph showing predicted global sea‑level rises from 2007. 2000 0.0 0.2 0.4 0.6 0.8 1.0 2020 2040 2060 year sea-level increase / m maximum predicted values minimum predicted values 2080 2100 Fig. 2.1 (i) Use Fig. 2.1 to calculate the largest predicted increase in sea level from 2020 to 2060. …m [2] (ii) Use Fig. 2.1 to calculate the range between the maximum predicted value and minimum predicted value for the year 2080. …m [2]
Question paper, page 9
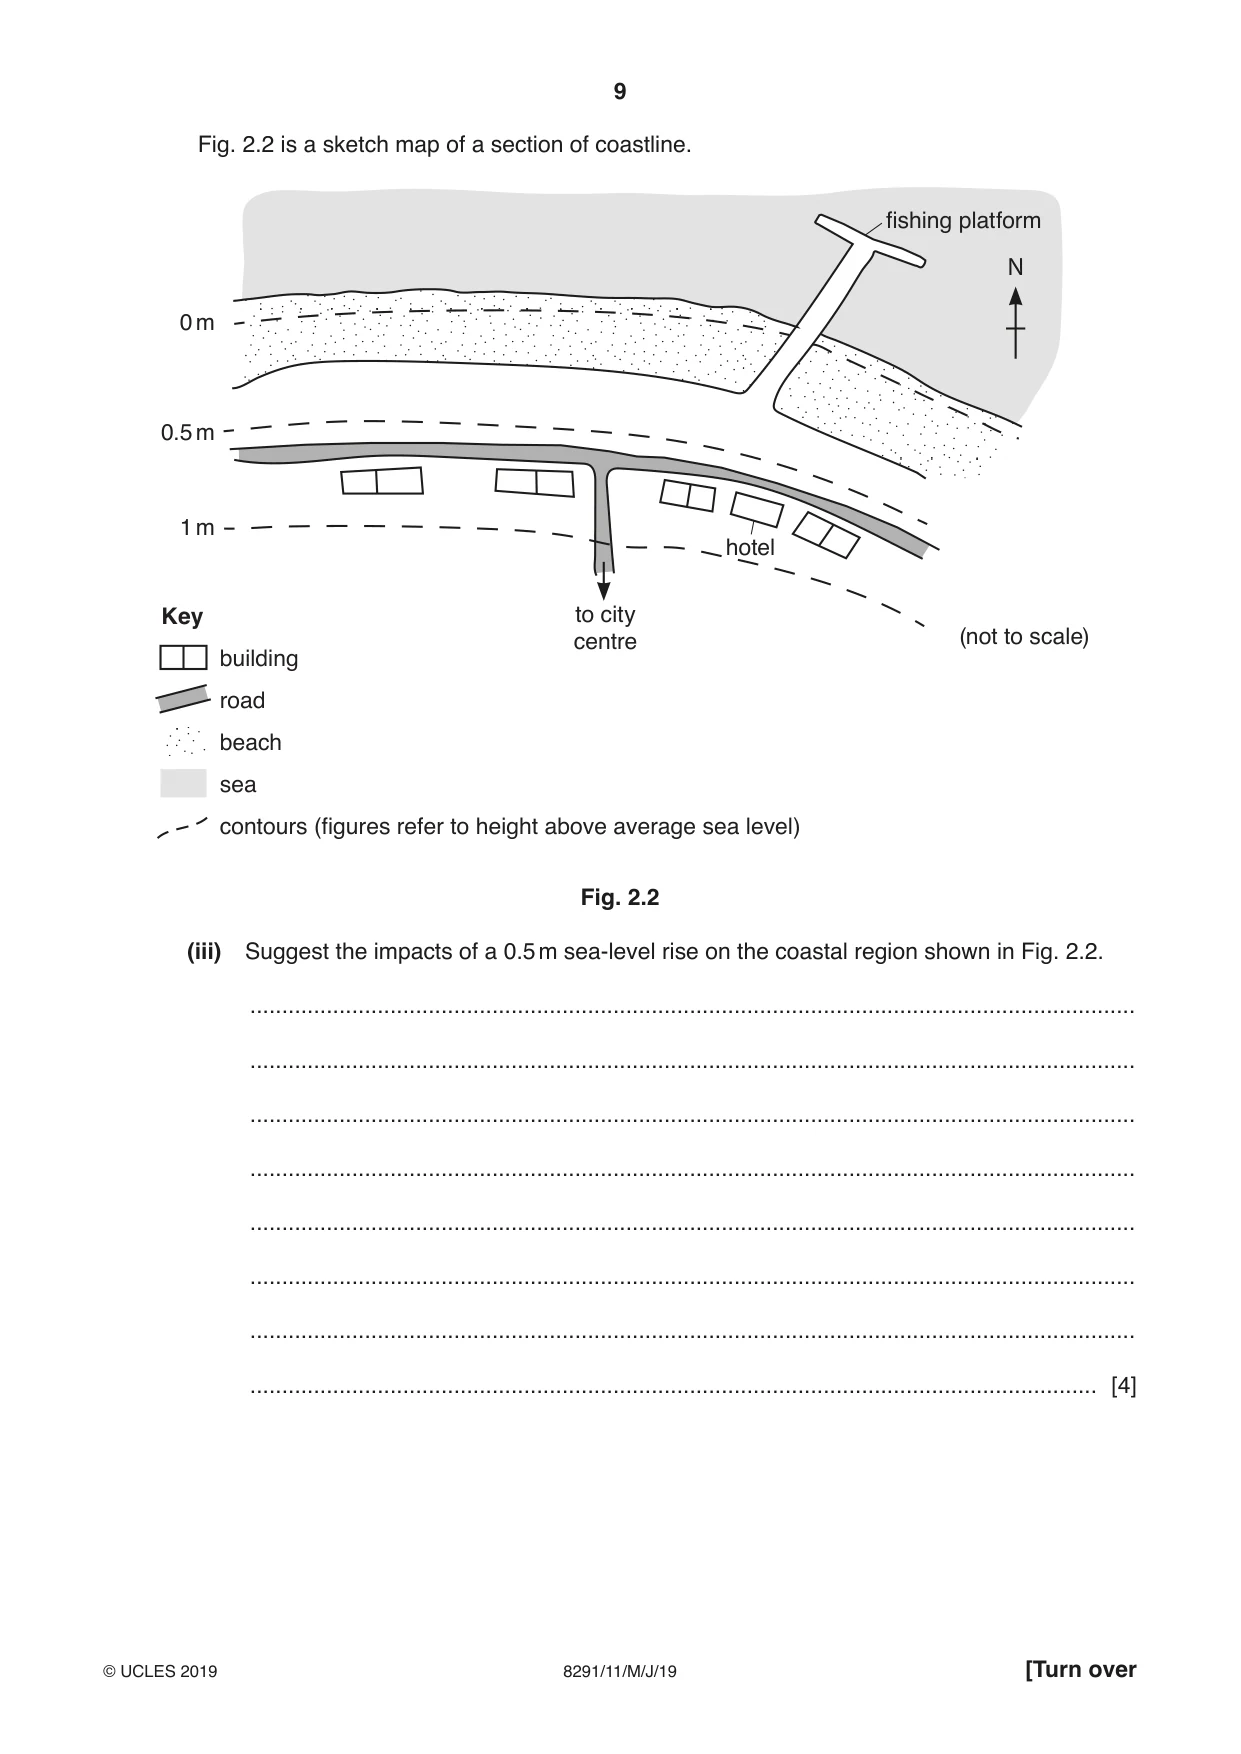
9 8291/11/M/J/19 © UCLES 2019 [Turn over Fig. 2.2 is a sketch map of a section of coastline. fishing platform to city centre hotel (not to scale) 0 m 0.5 m 1 m Key building road beach sea contours (figures refer to height above average sea level) N Fig. 2.2 (iii) Suggest the impacts of a 0.5 m sea‑level rise on the coastal region shown in Fig. 2.2. … … … … … … … … [4]
Question paper, page 10
10 8291/11/M/J/19 © UCLES 2019 (iv) Outline how emissions from human activity can cause an enhanced greenhouse effect, leading to a global sea‑level rise. … … … … … … … … [4] (v) Describe what is meant by the term afforestation and explain how afforestation could reduce the effect of emissions that contribute to the enhanced greenhouse effect. … … … … … … … … [4]
Question paper, page 11
11 8291/11/M/J/19 © UCLES 2019 [Turn over (vi) Suggest reasons why it is difficult to monitor the atmospheric changes caused by human activity. … … … … … … … … [4] [Total: 20]
Question paper, page 12
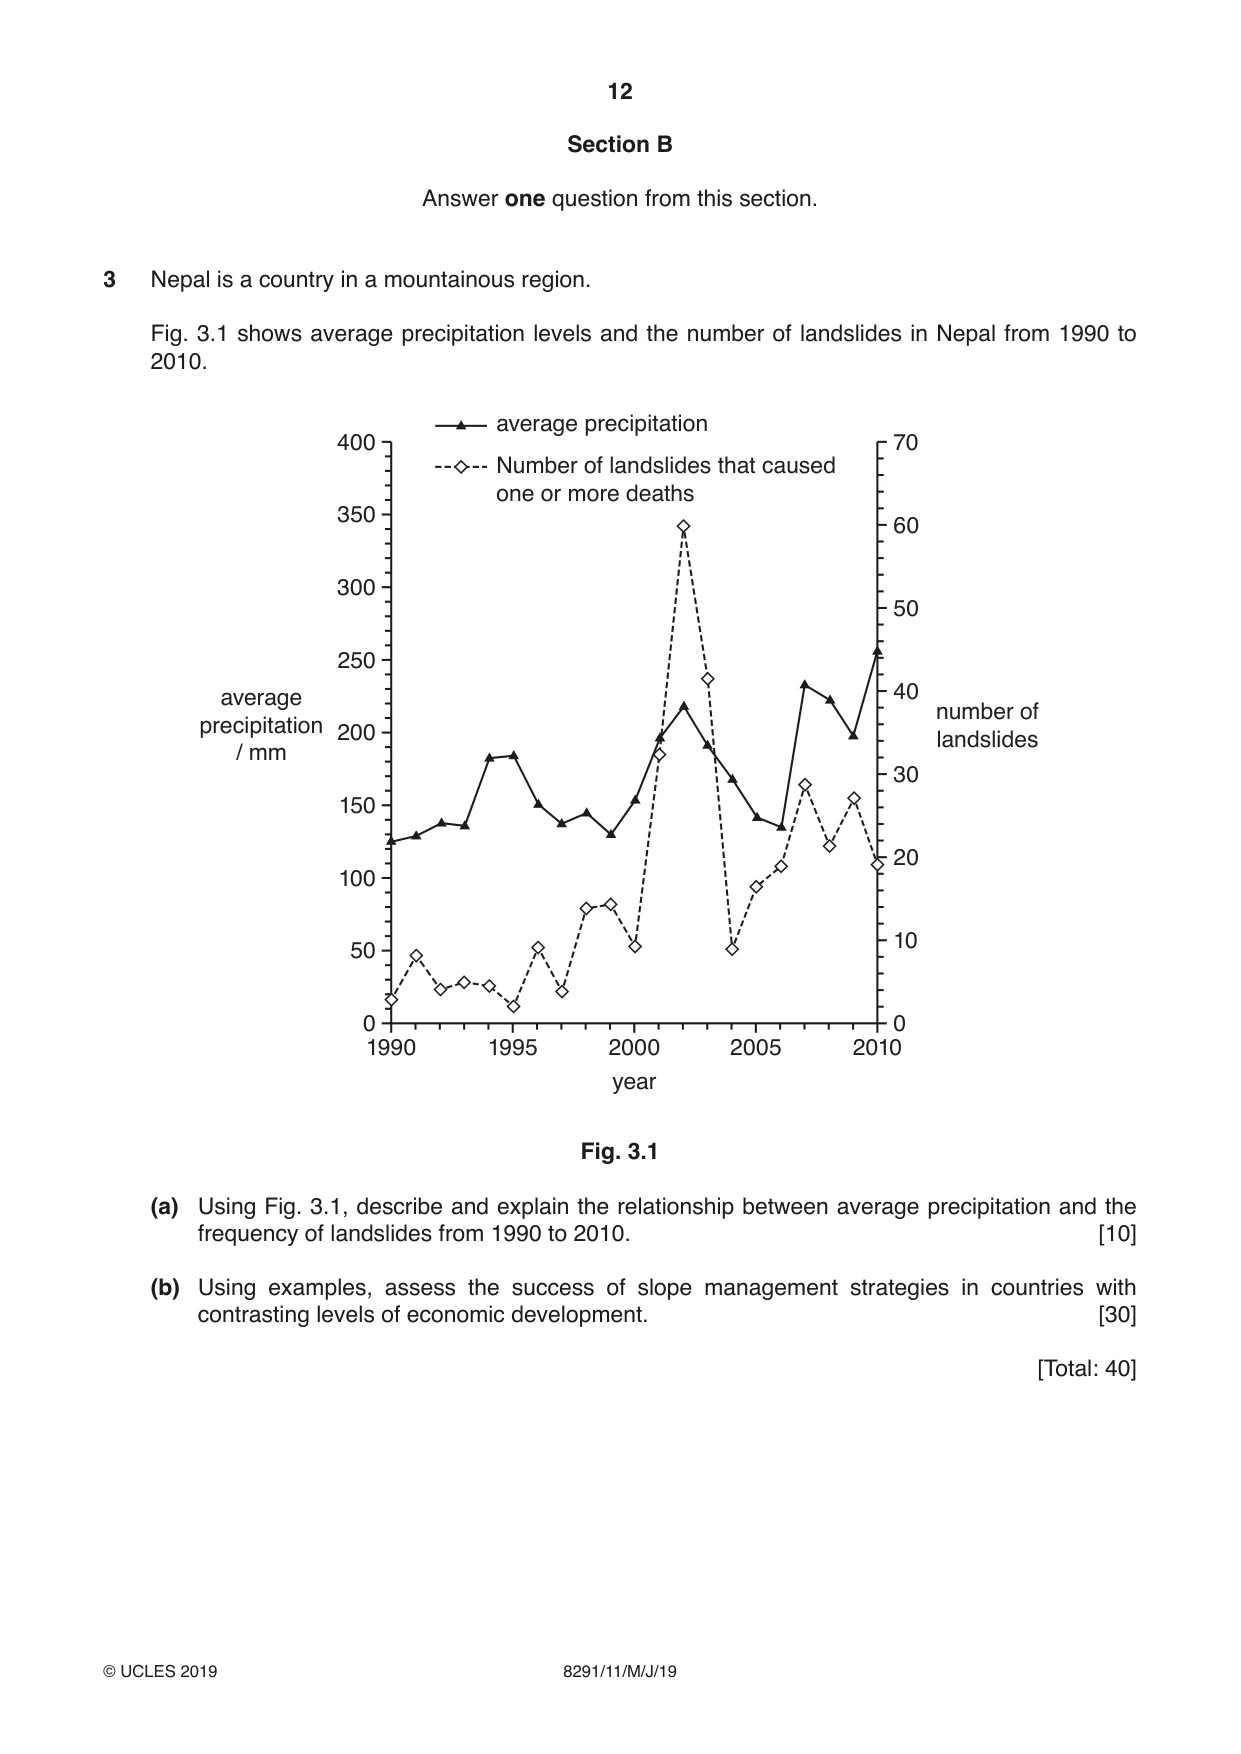
12 8291/11/M/J/19 © UCLES 2019 Section B Answer one question from this section. 3 Nepal is a country in a mountainous region. Fig. 3.1 shows average precipitation levels and the number of landslides in Nepal from 1990 to 2010. 1990 0 50 100 150 200 average precipitation / mm number of landslides average precipitation Number of landslides that caused one or more deaths 250 300 350 400 0 10 20 30 40 50 60 70 1995 2000 year 2005 2010 Fig. 3.1 (a) Using Fig. 3.1, describe and explain the relationship between average precipitation and the frequency of landslides from 1990 to 2010. [10] (b) Using examples, assess the success of slope management strategies in countries with contrasting levels of economic development. [30] [Total: 40]
Question paper, page 13
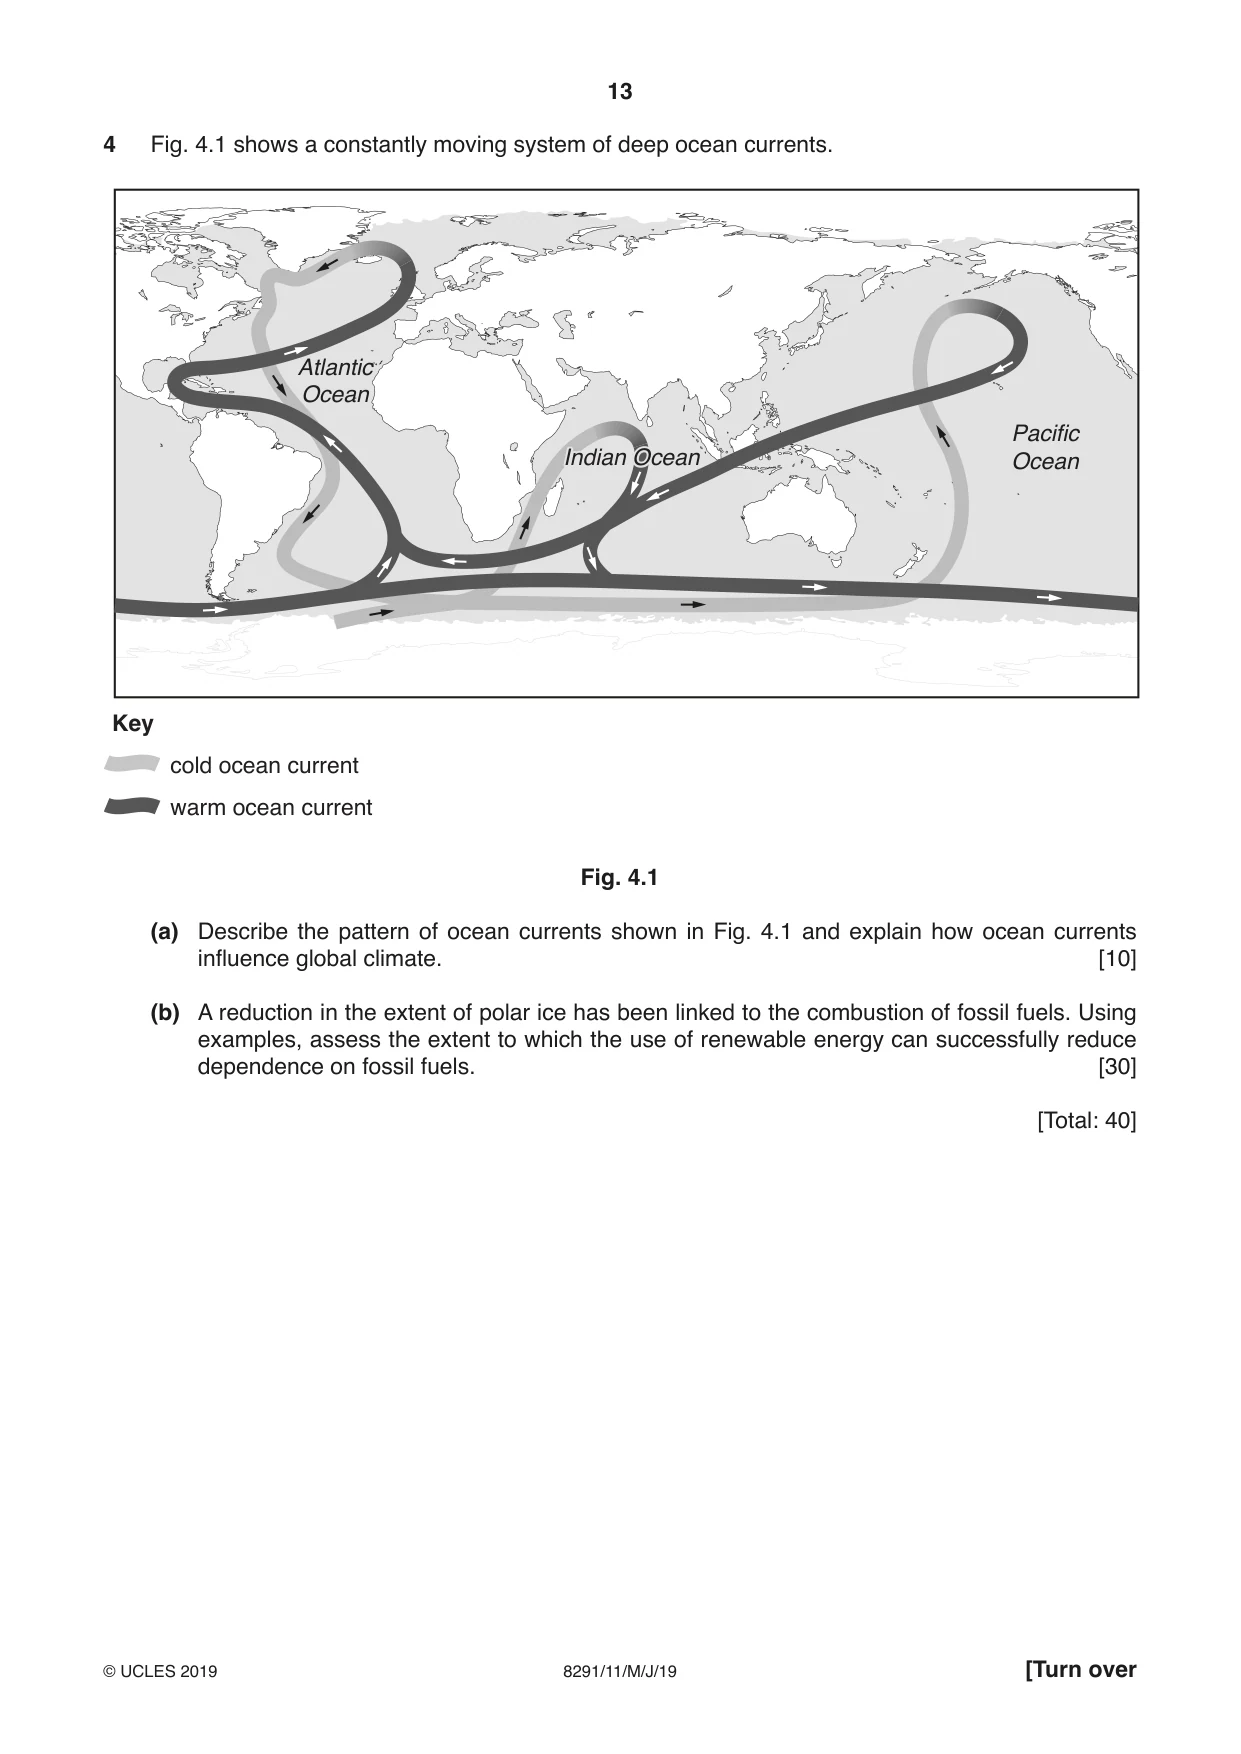
13 8291/11/M/J/19 © UCLES 2019 [Turn over 4 Fig. 4.1 shows a constantly moving system of deep ocean currents. Key cold ocean current warm ocean current Atlantic Ocean Indian Ocean Pacific Ocean Fig. 4.1 (a) Describe the pattern of ocean currents shown in Fig. 4.1 and explain how ocean currents influence global climate. [10] (b) A reduction in the extent of polar ice has been linked to the combustion of fossil fuels. Using examples, assess the extent to which the use of renewable energy can successfully reduce dependence on fossil fuels. [30] [Total: 40]
Question paper, page 14
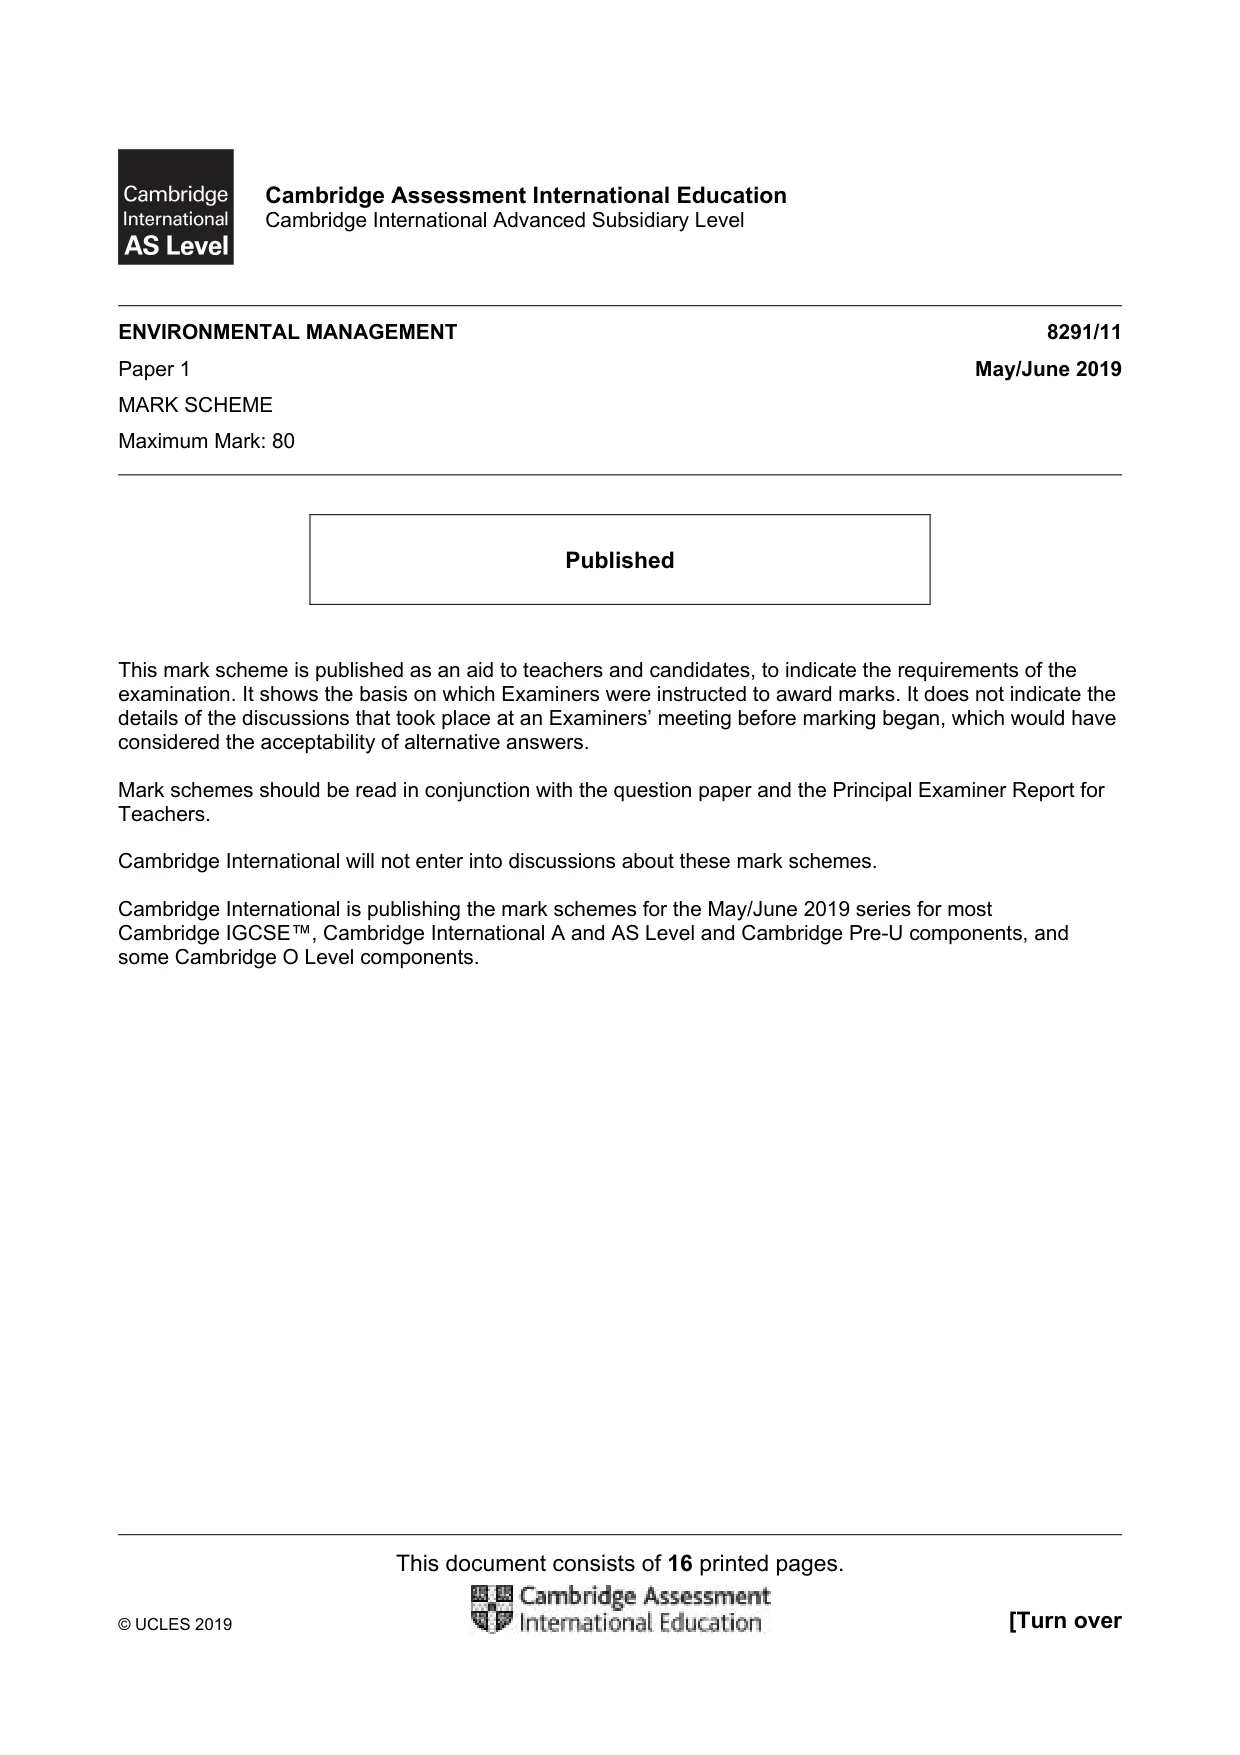
14 8291/11/M/J/19 © UCLES 2019 5 Fig. 5.1 is a diagram of the coastal island of Samso, Denmark and information about the renewable energy projects on the island. The island relies entirely on renewable energy sources. Renewable Energy Projects Wind – There are 11 onshore and 10 offshore wind turbines. Solar – There is a 880 m2 solar panel field which preheats water before it is transported to the straw‑fired power station. Power station – There are 3 power stations that are fuelled by wheat and rye straw which produce heat and electricity. Population In 2017, the total population was 3724. Agriculture During milk production heat exchangers harness the heat from fresh milk when it is cooled. Tractors are adapted to use biofuel (ethanol). Transport All cars are electric cars. There is a network of cycle paths. Fig. 5.1 (a) With reference to Fig. 5.1, describe and explain the challenges of relying entirely on renewable energy sources. [10] (b) With reference to examples from countries at different stages of economic development, discuss the factors that governments must consider when planning a country’s energy policy. [30] [Total: 40]
Question paper, page 15
15 8291/11/M/J/19 © UCLES 2019 BLANK PAGE
Question paper, page 16
16 8291/11/M/J/19 © UCLES 2019 Permission to reproduce items where third‑party owned material protected by copyright is included has been sought and cleared where possible. Every reasonable effort has been made by the publisher (UCLES) to trace copyright holders, but if any items requiring clearance have unwittingly been included, the publisher will be pleased to make amends at the earliest possible opportunity. To avoid the issue of disclosure of answer‑related information to candidates, all copyright acknowledgements are reproduced online in the Cambridge Assessment International Education Copyright Acknowledgements Booklet. This is produced for each series of examinations and is freely available to download at www.cambridgeinternational.org after the live examination series. Cambridge Assessment International Education is part of the Cambridge Assessment Group. Cambridge Assessment is the brand name of the University of Cambridge Local Examinations Syndicate (UCLES), which itself is a department of the University of Cambridge. BLANK PAGE
Mark scheme, page 1
This document consists of 16 printed pages. © UCLES 2019 [Turn over Cambridge Assessment International Education Cambridge International Advanced Subsidiary Level ENVIRONMENTAL MANAGEMENT 8291/11 Paper 1 May/June 2019 MARK SCHEME Maximum Mark: 80 Published This mark scheme is published as an aid to teachers and candidates, to indicate the requirements of the examination. It shows the basis on which Examiners were instructed to award marks. It does not indicate the details of the discussions that took place at an Examiners’ meeting before marking began, which would have considered the acceptability of alternative answers. Mark schemes should be read in conjunction with the question paper and the Principal Examiner Report for Teachers. Cambridge International will not enter into discussions about these mark schemes. Cambridge International is publishing the mark schemes for the May/June 2019 series for most Cambridge IGCSE™, Cambridge International A and AS Level and Cambridge Pre-U components, and some Cambridge O Level components.
Mark scheme, page 2
8291/11 Cambridge International AS Level – Mark Scheme PUBLISHED May/June 2019 © UCLES 2019 Page 2 of 16 Generic Marking Principles These general marking principles must be applied by all examiners when marking candidate answers. They should be applied alongside the specific content of the mark scheme or generic level descriptors for a question. Each question paper and mark scheme will also comply with these marking principles. GENERIC MARKING PRINCIPLE 1: Marks must be awarded in line with: • the specific content of the mark scheme or the generic level descriptors for the question • the specific skills defined in the mark scheme or in the generic level descriptors for the question • the standard of response required by a candidate as exemplified by the standardisation scripts. GENERIC MARKING PRINCIPLE 2: Marks awarded are always whole marks (not half marks, or other fractions). GENERIC MARKING PRINCIPLE 3: Marks must be awarded positively: • marks are awarded for correct / valid answers, as defined in the mark scheme. However, credit is given for valid answers which go beyond the scope of the syllabus and mark scheme, referring to your Team Leader as appropriate • marks are awarded when candidates clearly demonstrate what they know and can do • marks are not deducted for errors • marks are not deducted for omissions • answers should only be judged on the quality of spelling, punctuation and grammar when these features are specifically assessed by the question as indicated by the mark scheme. The meaning, however, should be unambiguous. GENERIC MARKING PRINCIPLE 4: Rules must be applied consistently e.g. in situations where candidates have not followed instructions or in the application of generic level descriptors.
Mark scheme, page 3
8291/11 Cambridge International AS Level – Mark Scheme PUBLISHED May/June 2019 © UCLES 2019 Page 3 of 16 GENERIC MARKING PRINCIPLE 5: Marks should be awarded using the full range of marks defined in the mark scheme for the question (however; the use of the full mark range may be limited according to the quality of the candidate responses seen). GENERIC MARKING PRINCIPLE 6: Marks awarded are based solely on the requirements as defined in the mark scheme. Marks should not be awarded with grade thresholds or grade descriptors in mind.
Mark scheme, page 4
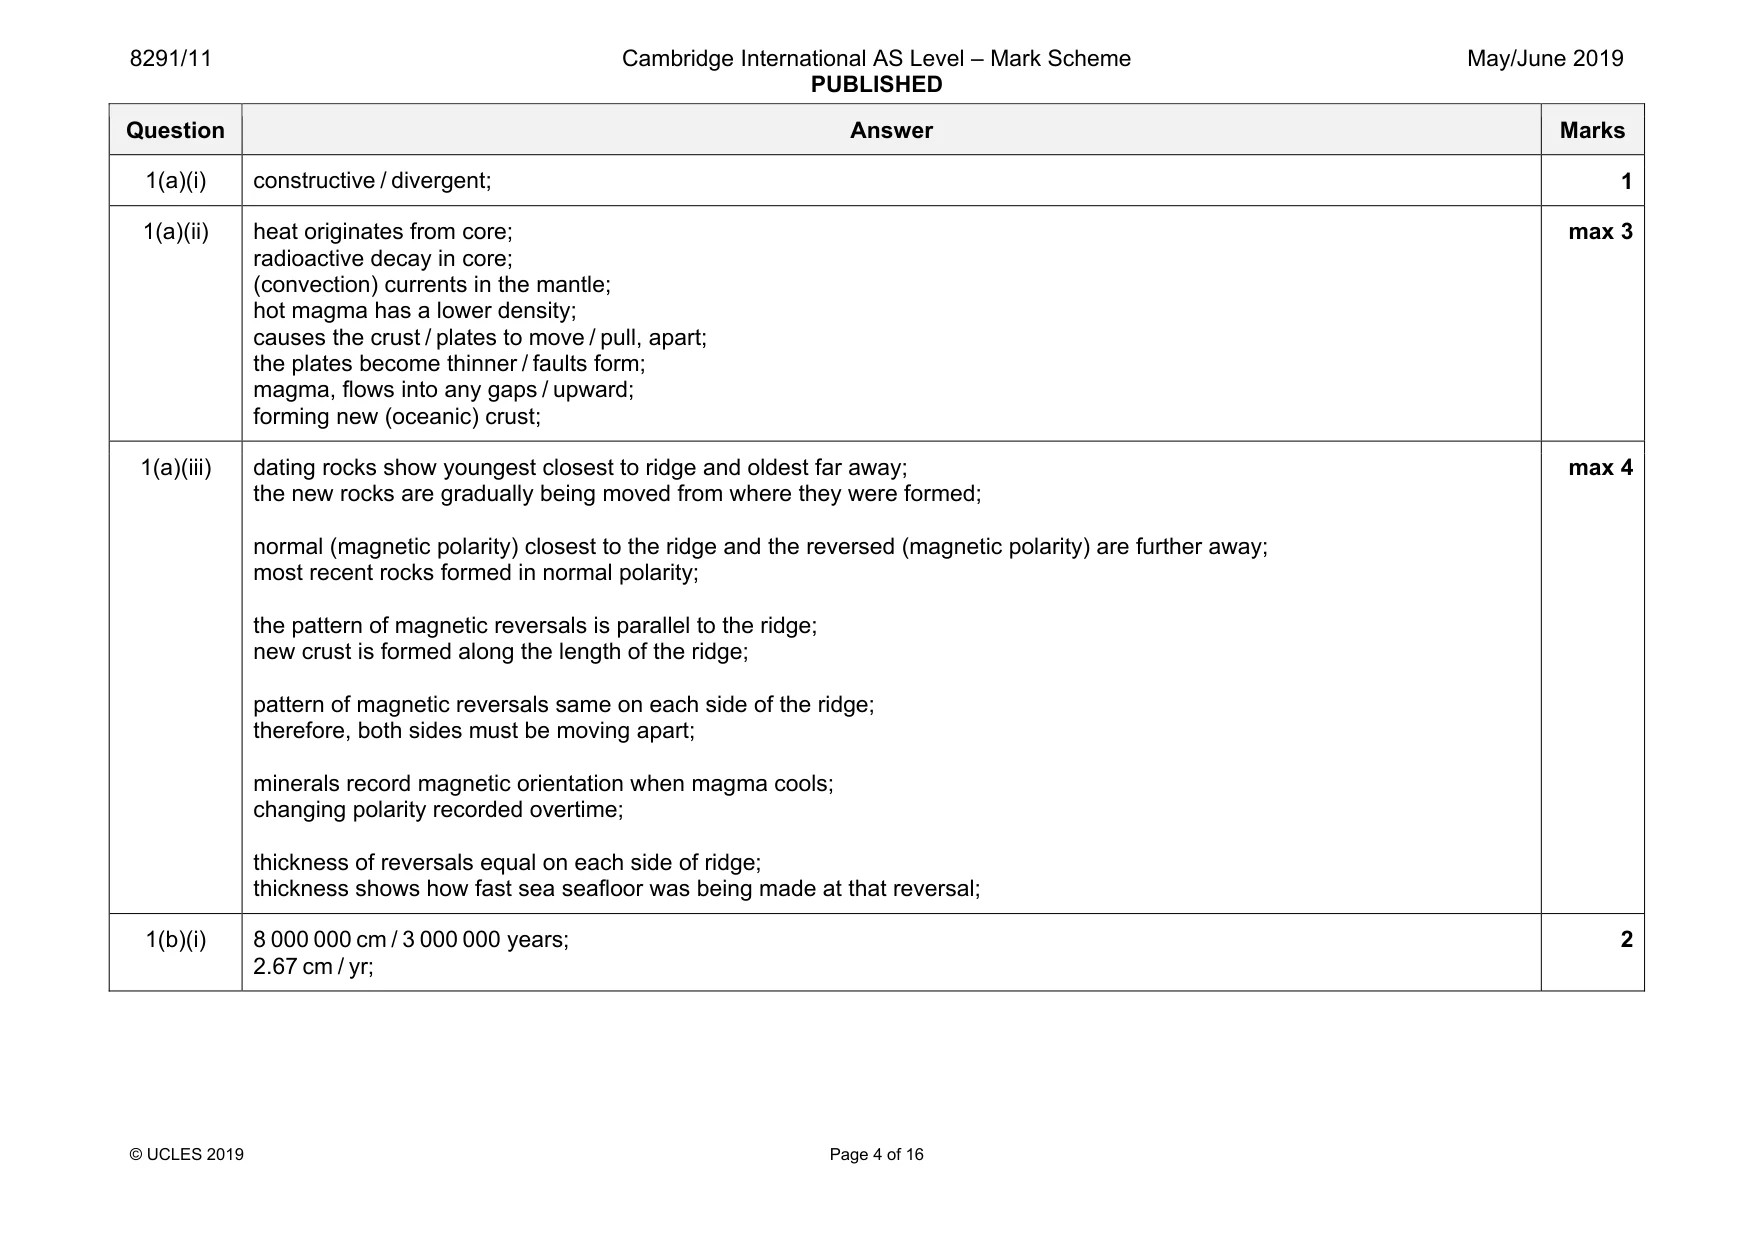
8291/11 Cambridge International AS Level – Mark Scheme PUBLISHED May/June 2019 © UCLES 2019 Page 4 of 16 Question Answer Marks 1(a)(i) constructive / divergent; 1 1(a)(ii) heat originates from core; radioactive decay in core; (convection) currents in the mantle; hot magma has a lower density; causes the crust / plates to move / pull, apart; the plates become thinner / faults form; magma, flows into any gaps / upward; forming new (oceanic) crust; max 3 1(a)(iii) dating rocks show youngest closest to ridge and oldest far away; the new rocks are gradually being moved from where they were formed; normal (magnetic polarity) closest to the ridge and the reversed (magnetic polarity) are further away; most recent rocks formed in normal polarity; the pattern of magnetic reversals is parallel to the ridge; new crust is formed along the length of the ridge; pattern of magnetic reversals same on each side of the ridge; therefore, both sides must be moving apart; minerals record magnetic orientation when magma cools; changing polarity recorded overtime; thickness of reversals equal on each side of ridge; thickness shows how fast sea seafloor was being made at that reversal; max 4 1(b)(i) 8 000 000 cm / 3 000 000 years; 2.67 cm / yr; 2
Mark scheme, page 5
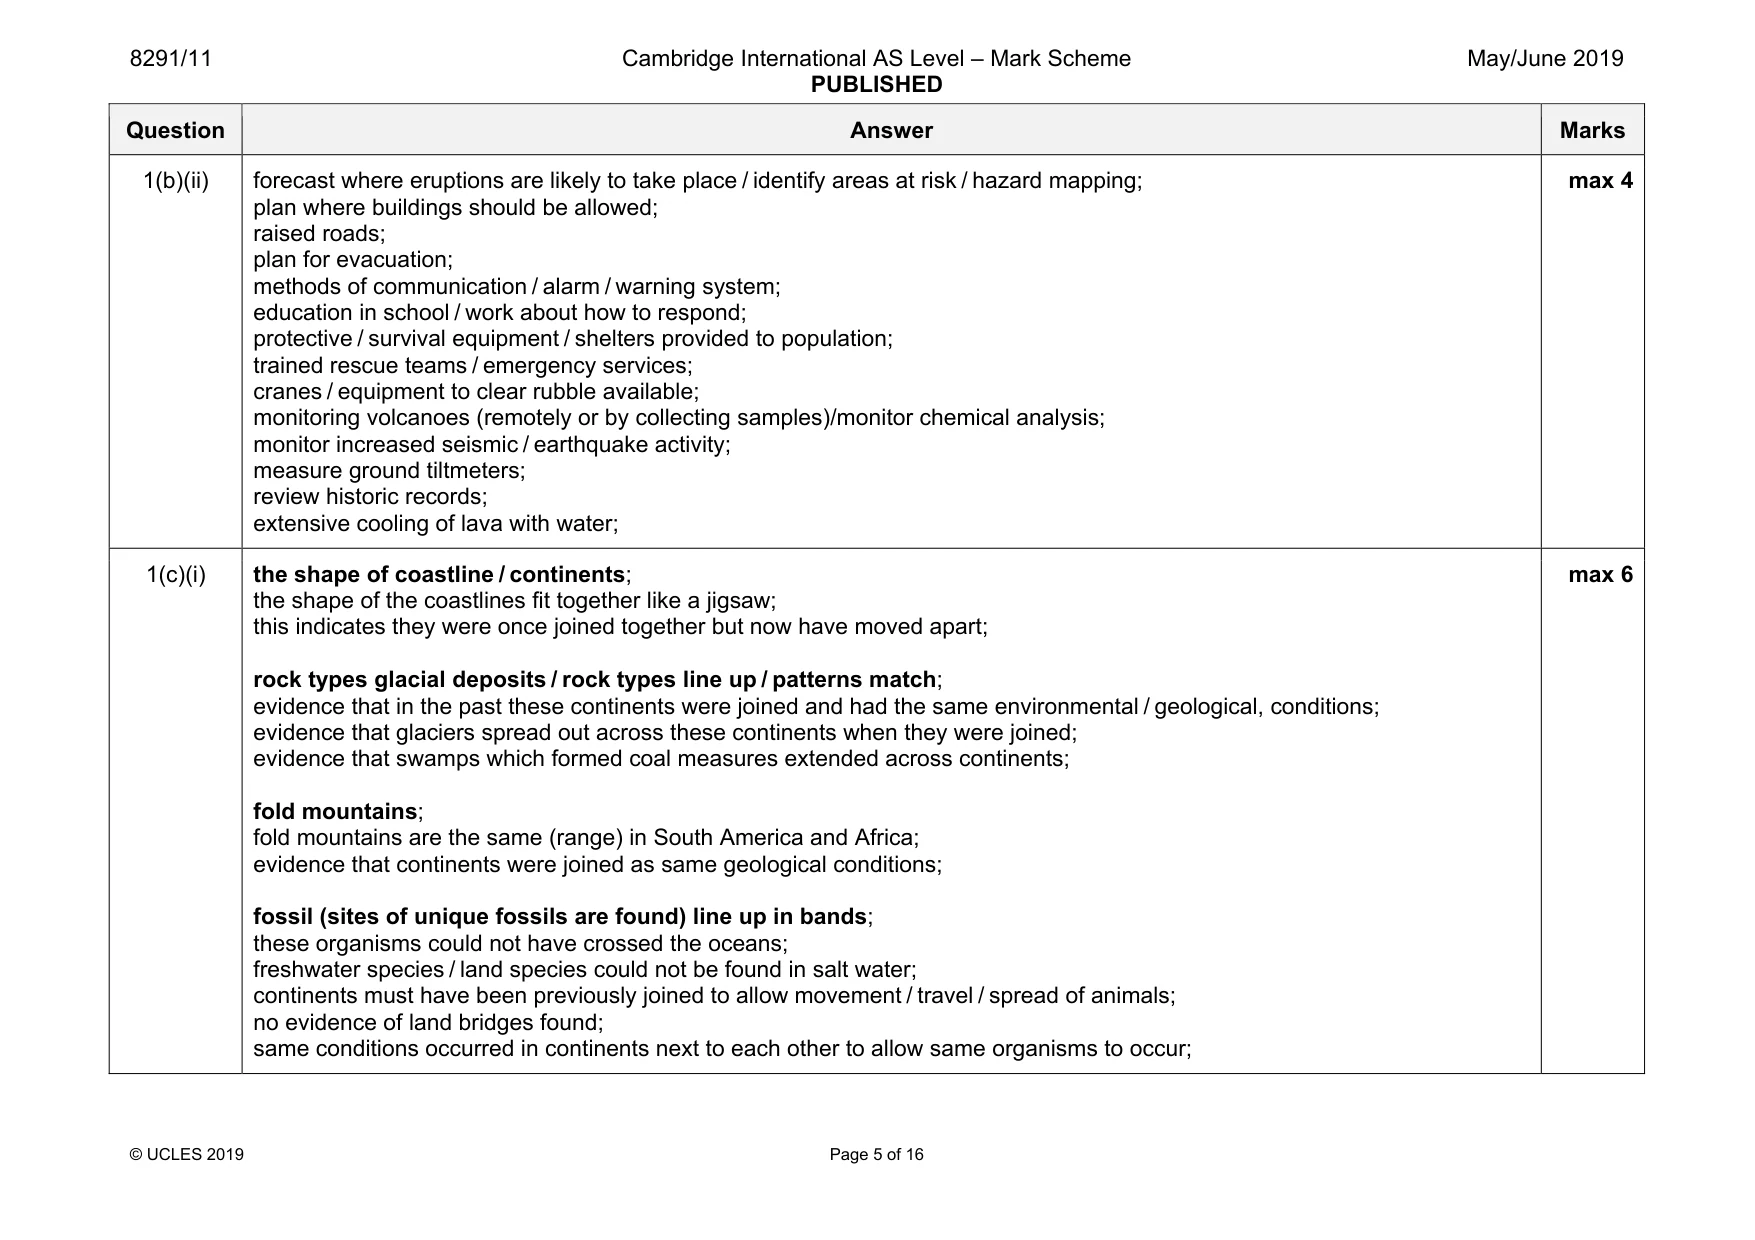
8291/11 Cambridge International AS Level – Mark Scheme PUBLISHED May/June 2019 © UCLES 2019 Page 5 of 16 Question Answer Marks 1(b)(ii) forecast where eruptions are likely to take place / identify areas at risk / hazard mapping; plan where buildings should be allowed; raised roads; plan for evacuation; methods of communication / alarm / warning system; education in school / work about how to respond; protective / survival equipment / shelters provided to population; trained rescue teams / emergency services; cranes / equipment to clear rubble available; monitoring volcanoes (remotely or by collecting samples)/monitor chemical analysis; monitor increased seismic / earthquake activity; measure ground tiltmeters; review historic records; extensive cooling of lava with water; max 4 1(c)(i) the shape of coastline / continents; the shape of the coastlines fit together like a jigsaw; this indicates they were once joined together but now have moved apart; rock types glacial deposits / rock types line up / patterns match; evidence that in the past these continents were joined and had the same environmental / geological, conditions; evidence that glaciers spread out across these continents when they were joined; evidence that swamps which formed coal measures extended across continents; fold mountains; fold mountains are the same (range) in South America and Africa; evidence that continents were joined as same geological conditions; fossil (sites of unique fossils are found) line up in bands; these organisms could not have crossed the oceans; freshwater species / land species could not be found in salt water; continents must have been previously joined to allow movement / travel / spread of animals; no evidence of land bridges found; same conditions occurred in continents next to each other to allow same organisms to occur; max 6
Mark scheme, page 6
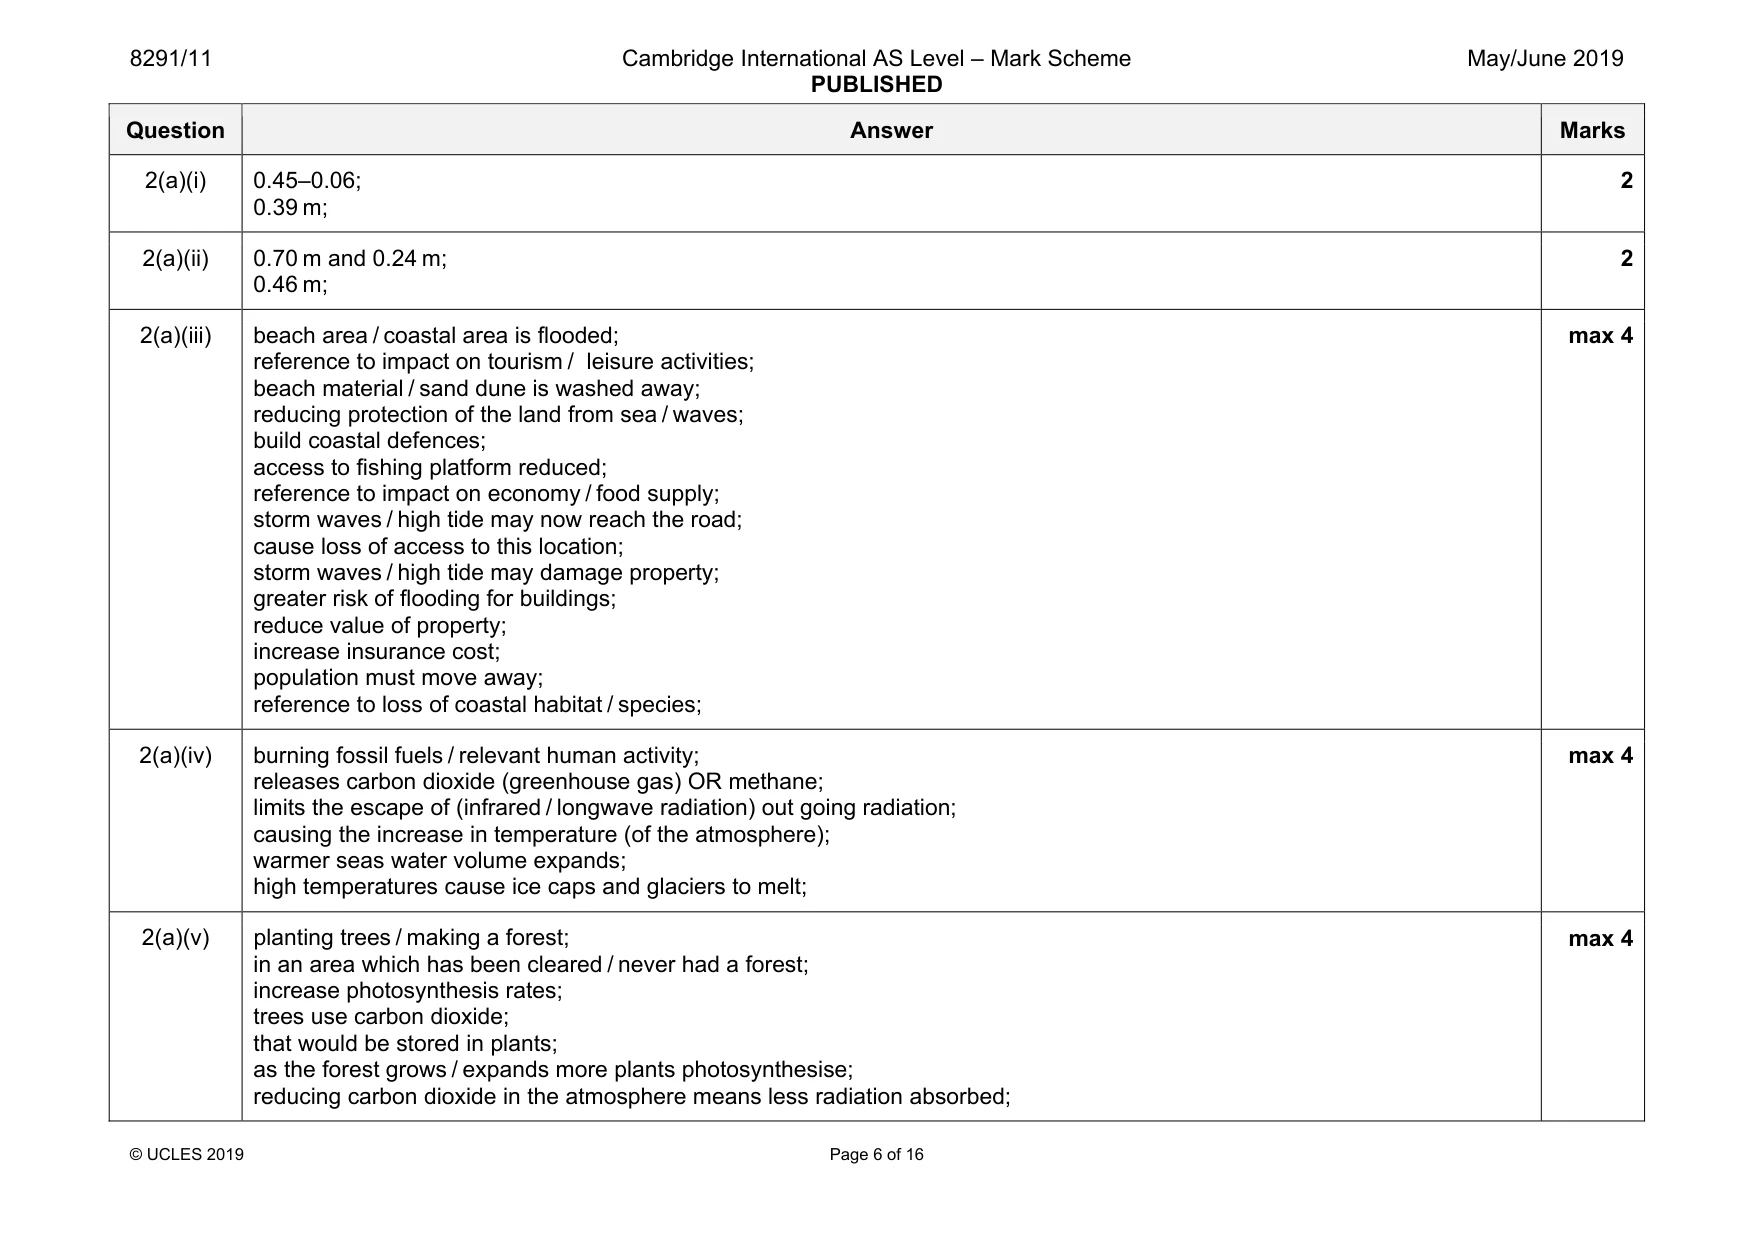
8291/11 Cambridge International AS Level – Mark Scheme PUBLISHED May/June 2019 © UCLES 2019 Page 6 of 16 Question Answer Marks 2(a)(i) 0.45–0.06; 0.39 m; 2 2(a)(ii) 0.70 m and 0.24 m; 0.46 m; 2 2(a)(iii) beach area / coastal area is flooded; reference to impact on tourism / leisure activities; beach material / sand dune is washed away; reducing protection of the land from sea / waves; build coastal defences; access to fishing platform reduced; reference to impact on economy / food supply; storm waves / high tide may now reach the road; cause loss of access to this location; storm waves / high tide may damage property; greater risk of flooding for buildings; reduce value of property; increase insurance cost; population must move away; reference to loss of coastal habitat / species; max 4 2(a)(iv) burning fossil fuels / relevant human activity; releases carbon dioxide (greenhouse gas) OR methane; limits the escape of (infrared / longwave radiation) out going radiation; causing the increase in temperature (of the atmosphere); warmer seas water volume expands; high temperatures cause ice caps and glaciers to melt; max 4 2(a)(v) planting trees / making a forest; in an area which has been cleared / never had a forest; increase photosynthesis rates; trees use carbon dioxide; that would be stored in plants; as the forest grows / expands more plants photosynthesise; reducing carbon dioxide in the atmosphere means less radiation absorbed; max 4
Mark scheme, page 7
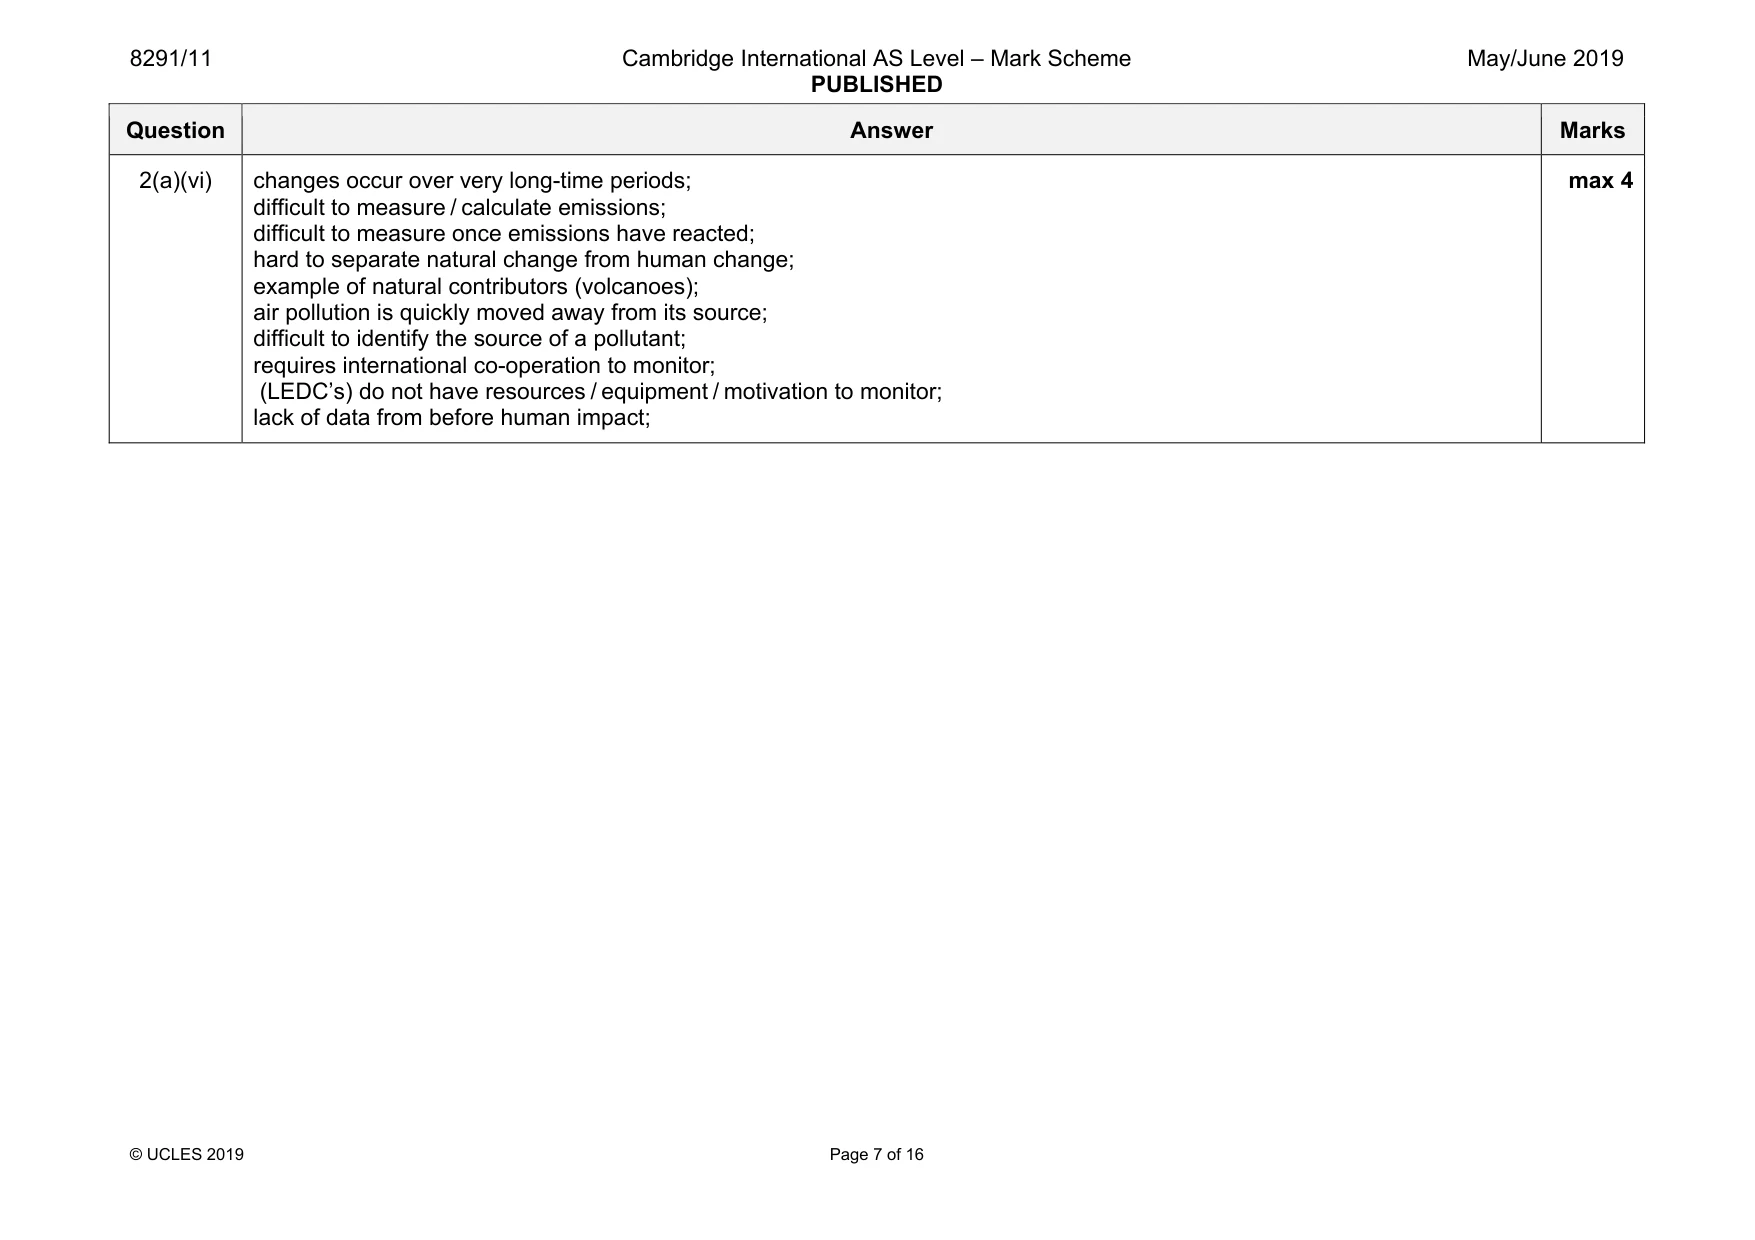
8291/11 Cambridge International AS Level – Mark Scheme PUBLISHED May/June 2019 © UCLES 2019 Page 7 of 16 Question Answer Marks 2(a)(vi) changes occur over very long-time periods; difficult to measure / calculate emissions; difficult to measure once emissions have reacted; hard to separate natural change from human change; example of natural contributors (volcanoes); air pollution is quickly moved away from its source; difficult to identify the source of a pollutant; requires international co-operation to monitor; (LEDC’s) do not have resources / equipment / motivation to monitor; lack of data from before human impact; max 4
Mark scheme, page 8
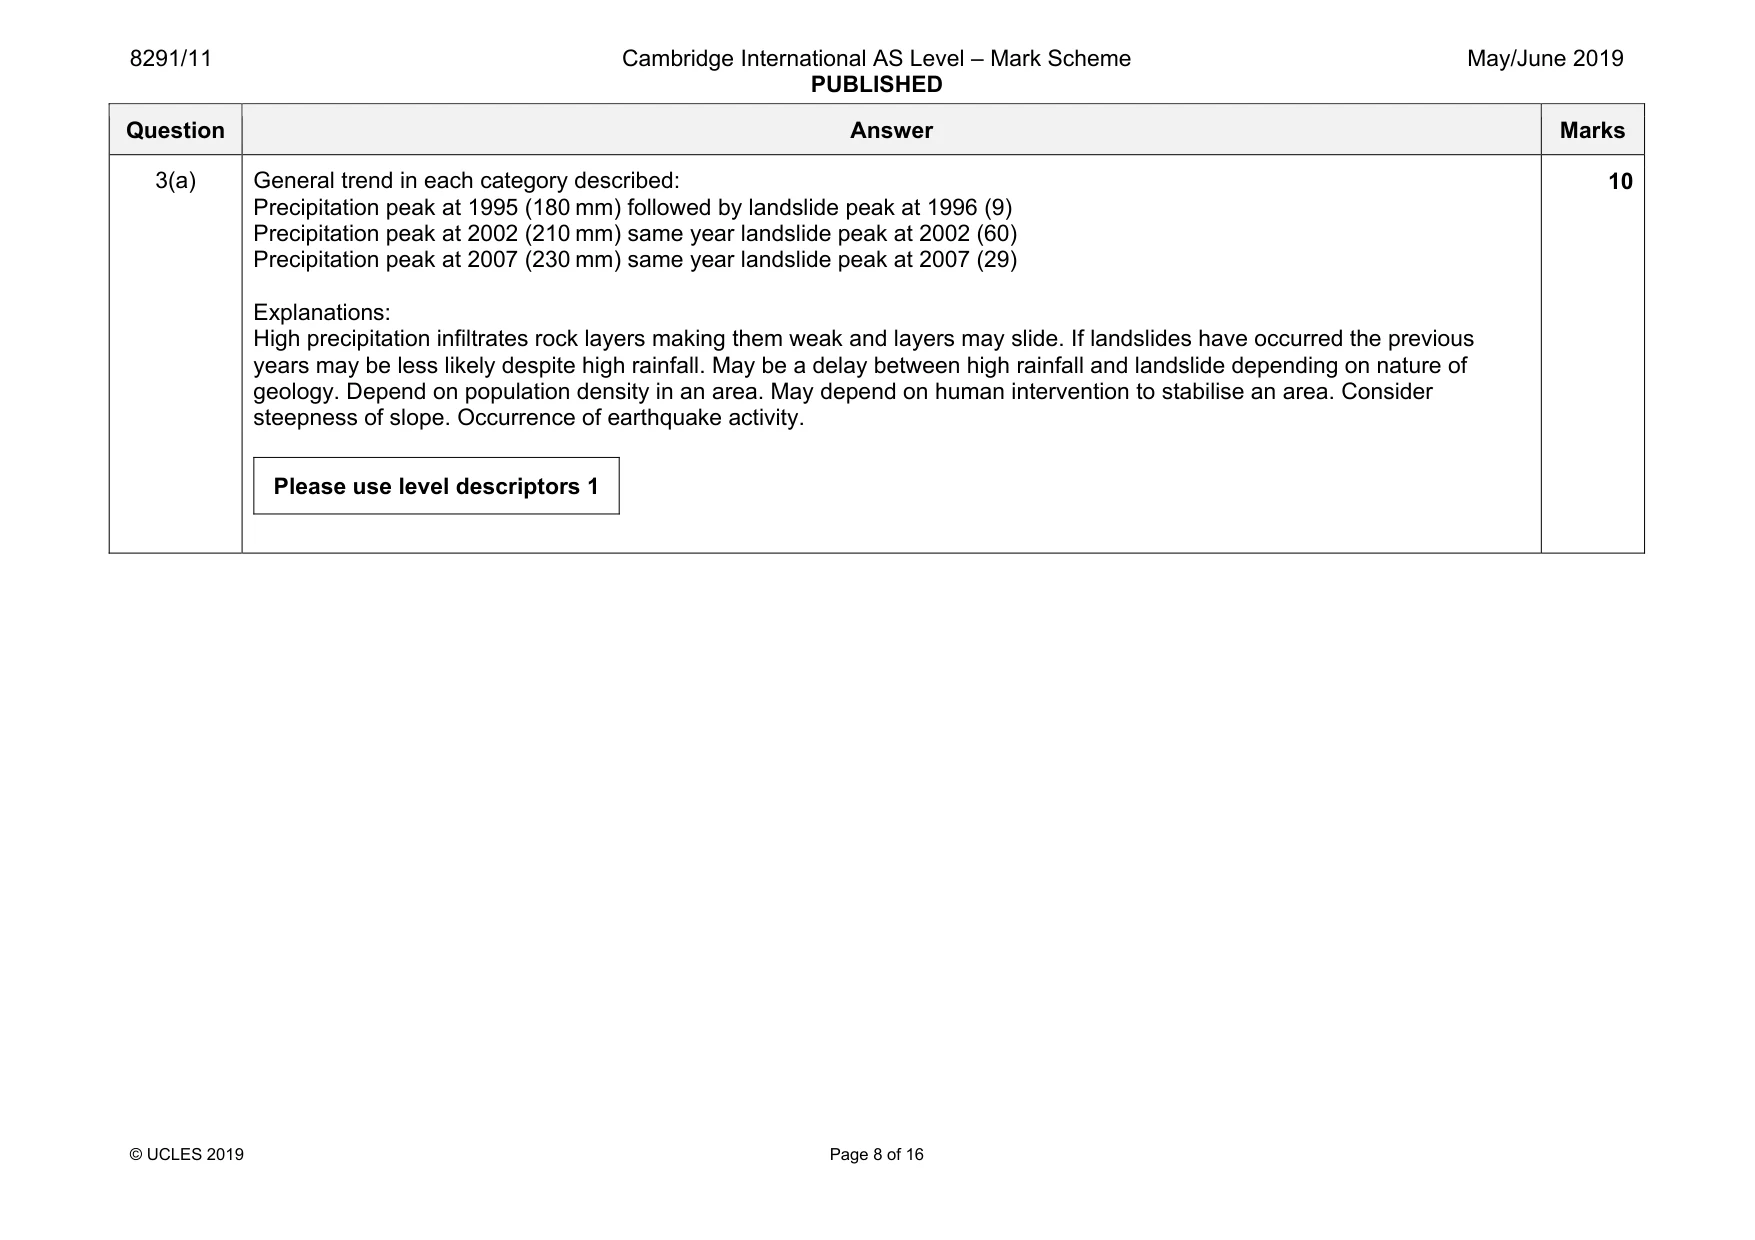
8291/11 Cambridge International AS Level – Mark Scheme PUBLISHED May/June 2019 © UCLES 2019 Page 8 of 16 Question Answer Marks 3(a) General trend in each category described: Precipitation peak at 1995 (180 mm) followed by landslide peak at 1996 (9) Precipitation peak at 2002 (210 mm) same year landslide peak at 2002 (60) Precipitation peak at 2007 (230 mm) same year landslide peak at 2007 (29) Explanations: High precipitation infiltrates rock layers making them weak and layers may slide. If landslides have occurred the previous years may be less likely despite high rainfall. May be a delay between high rainfall and landslide depending on nature of geology. Depend on population density in an area. May depend on human intervention to stabilise an area. Consider steepness of slope. Occurrence of earthquake activity. Please use level descriptors 1 10
Mark scheme, page 9
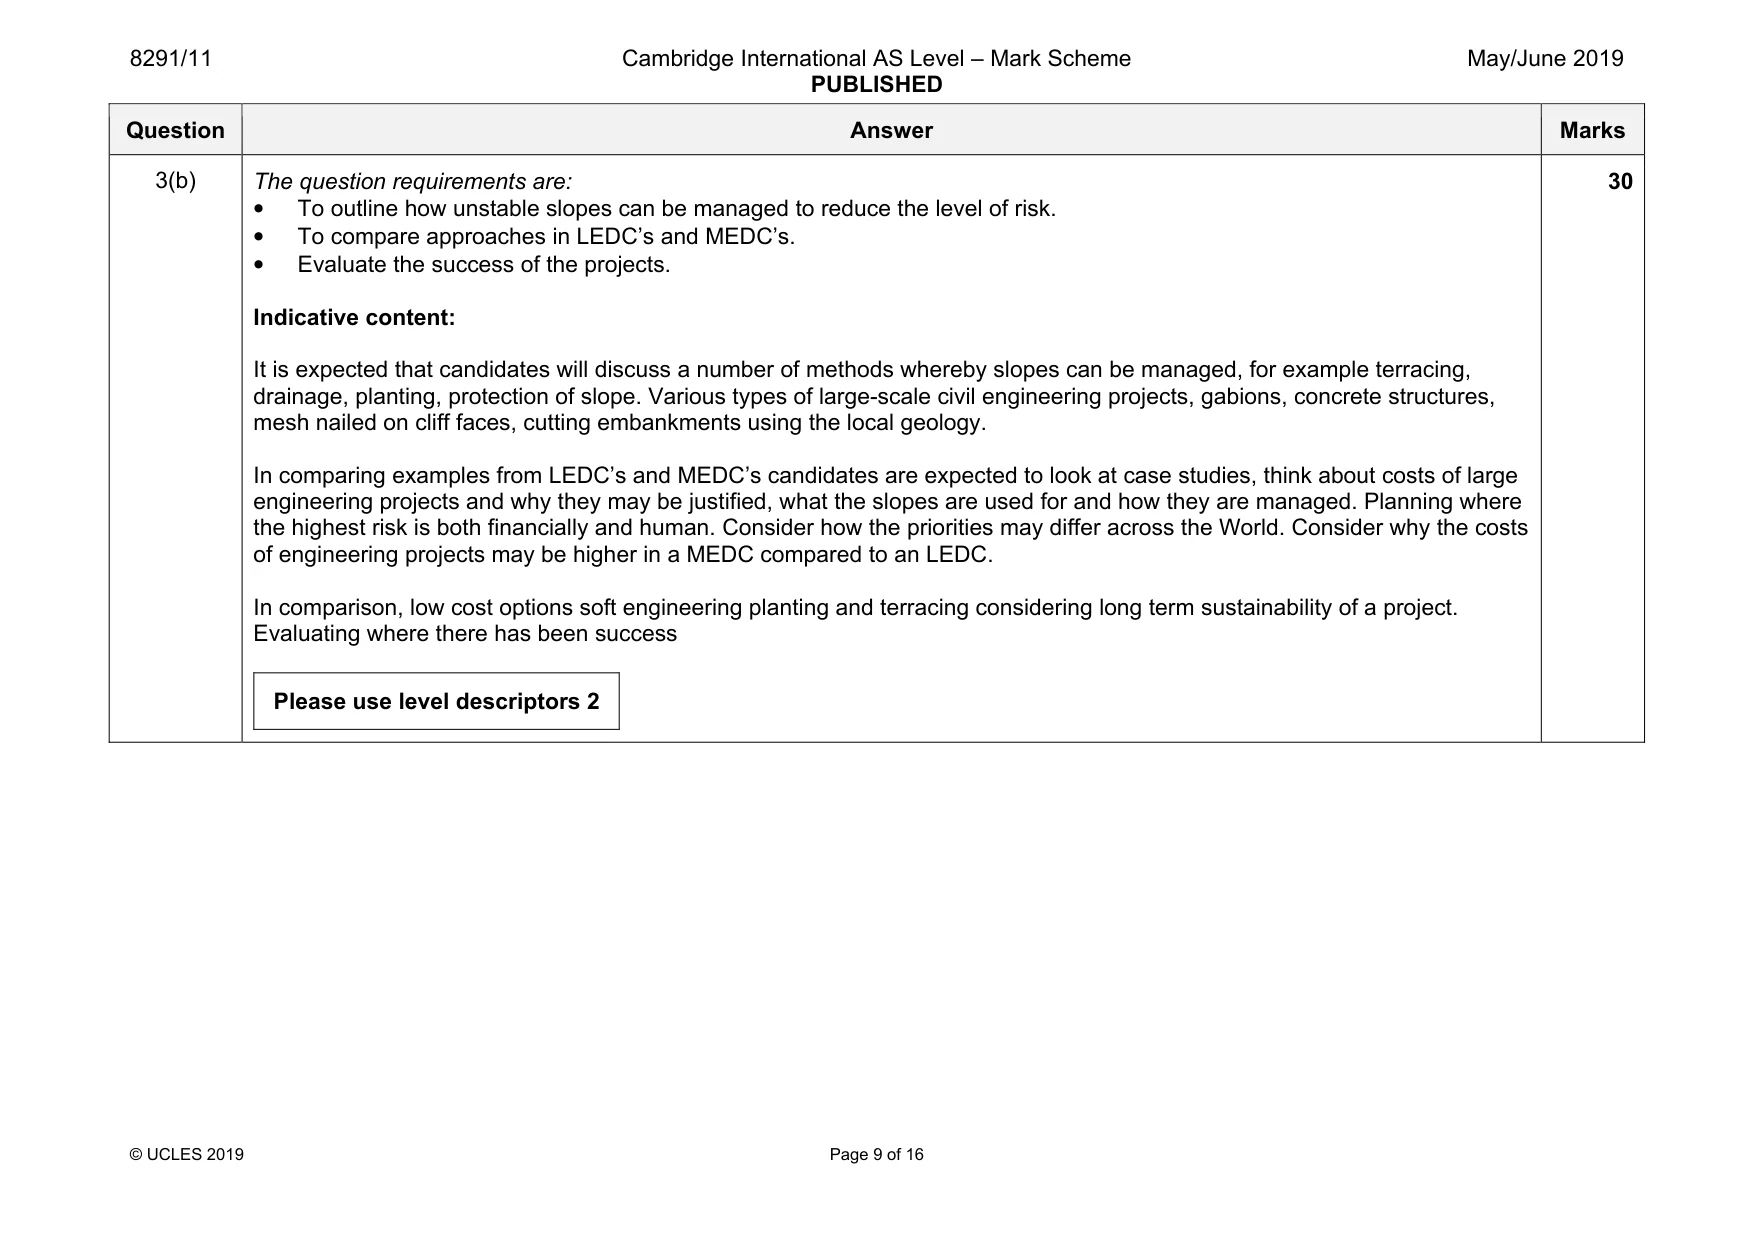
8291/11 Cambridge International AS Level – Mark Scheme PUBLISHED May/June 2019 © UCLES 2019 Page 9 of 16 Question Answer Marks 3(b) The question requirements are: • To outline how unstable slopes can be managed to reduce the level of risk. • To compare approaches in LEDC’s and MEDC’s. • Evaluate the success of the projects. Indicative content: It is expected that candidates will discuss a number of methods whereby slopes can be managed, for example terracing, drainage, planting, protection of slope. Various types of large-scale civil engineering projects, gabions, concrete structures, mesh nailed on cliff faces, cutting embankments using the local geology. In comparing examples from LEDC’s and MEDC’s candidates are expected to look at case studies, think about costs of large engineering projects and why they may be justified, what the slopes are used for and how they are managed. Planning where the highest risk is both financially and human. Consider how the priorities may differ across the World. Consider why the costs of engineering projects may be higher in a MEDC compared to an LEDC. In comparison, low cost options soft engineering planting and terracing considering long term sustainability of a project. Evaluating where there has been success Please use level descriptors 2 30
Mark scheme, page 10
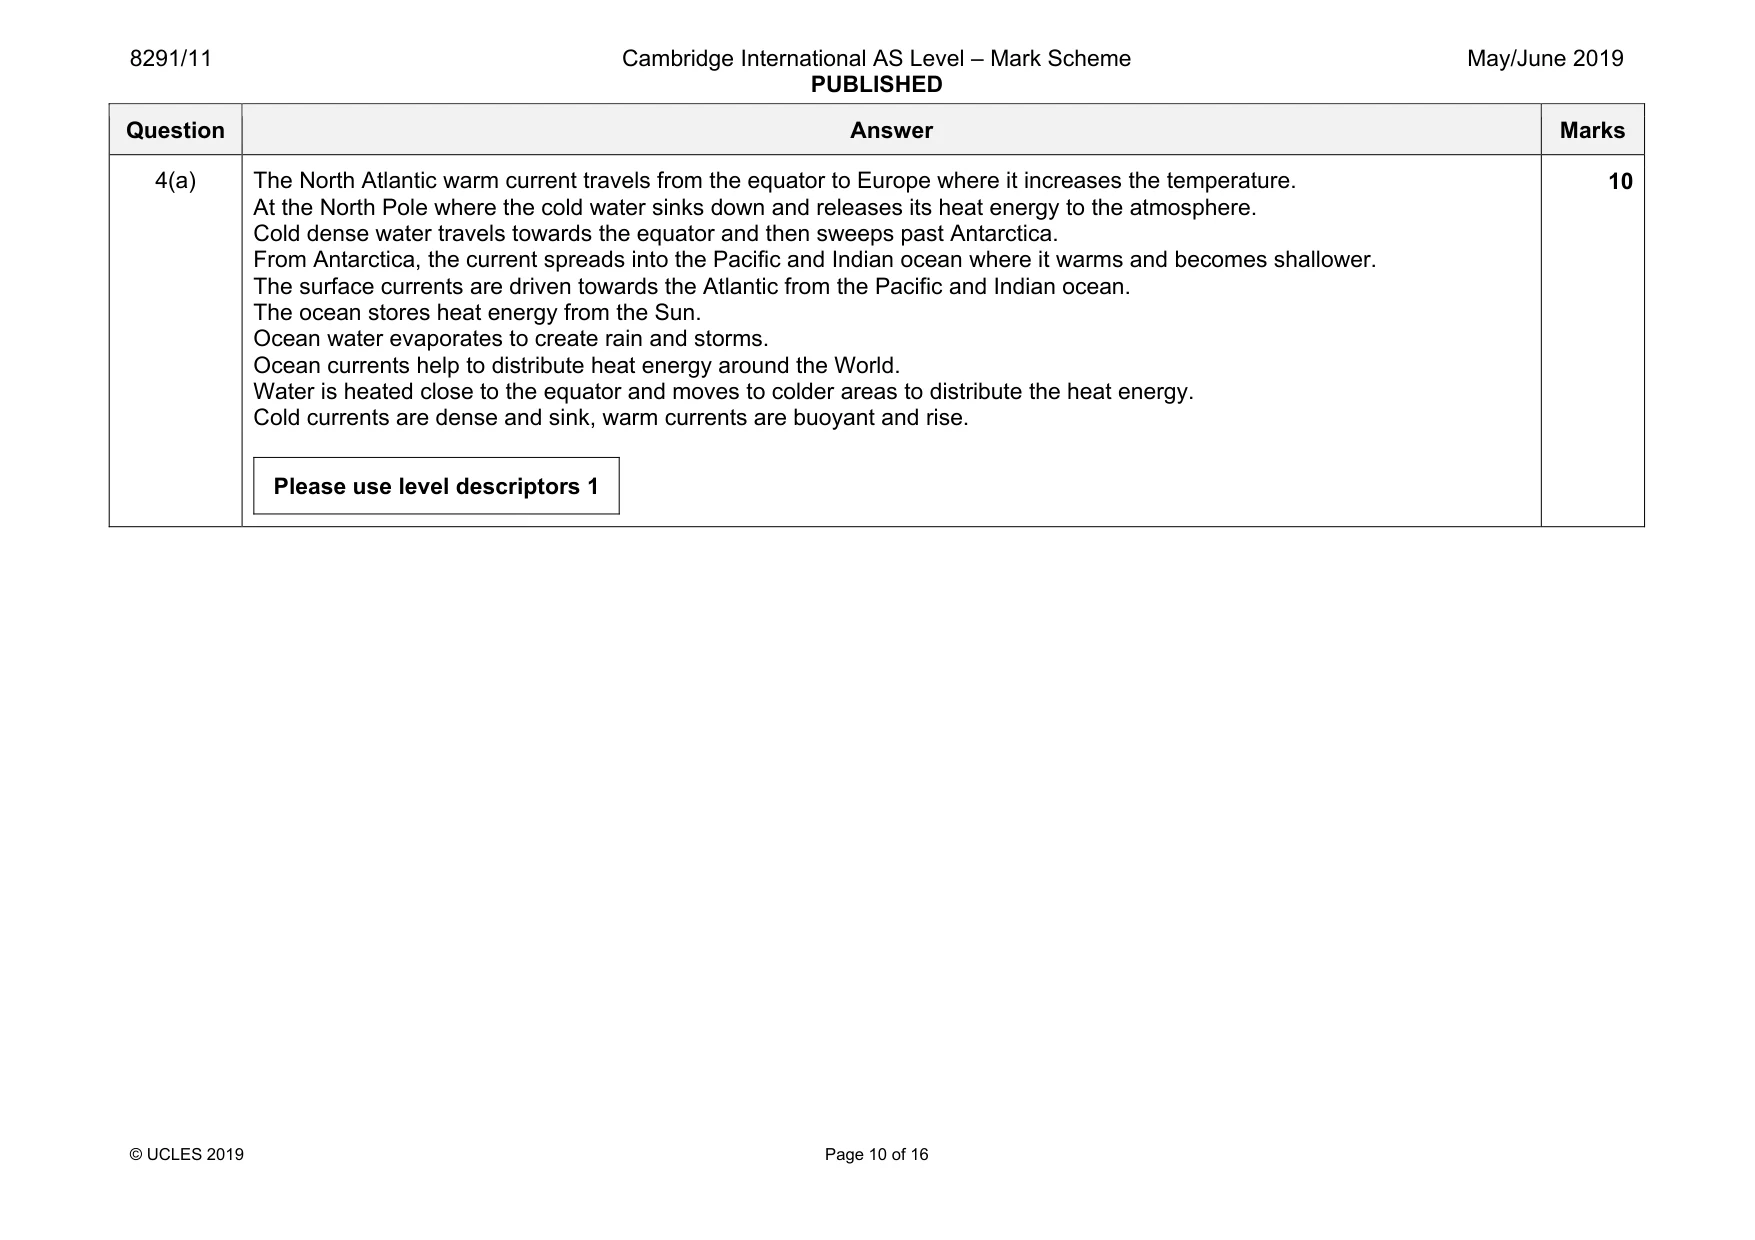
8291/11 Cambridge International AS Level – Mark Scheme PUBLISHED May/June 2019 © UCLES 2019 Page 10 of 16 Question Answer Marks 4(a) The North Atlantic warm current travels from the equator to Europe where it increases the temperature. At the North Pole where the cold water sinks down and releases its heat energy to the atmosphere. Cold dense water travels towards the equator and then sweeps past Antarctica. From Antarctica, the current spreads into the Pacific and Indian ocean where it warms and becomes shallower. The surface currents are driven towards the Atlantic from the Pacific and Indian ocean. The ocean stores heat energy from the Sun. Ocean water evaporates to create rain and storms. Ocean currents help to distribute heat energy around the World. Water is heated close to the equator and moves to colder areas to distribute the heat energy. Cold currents are dense and sink, warm currents are buoyant and rise. Please use level descriptors 1 10
Mark scheme, page 11
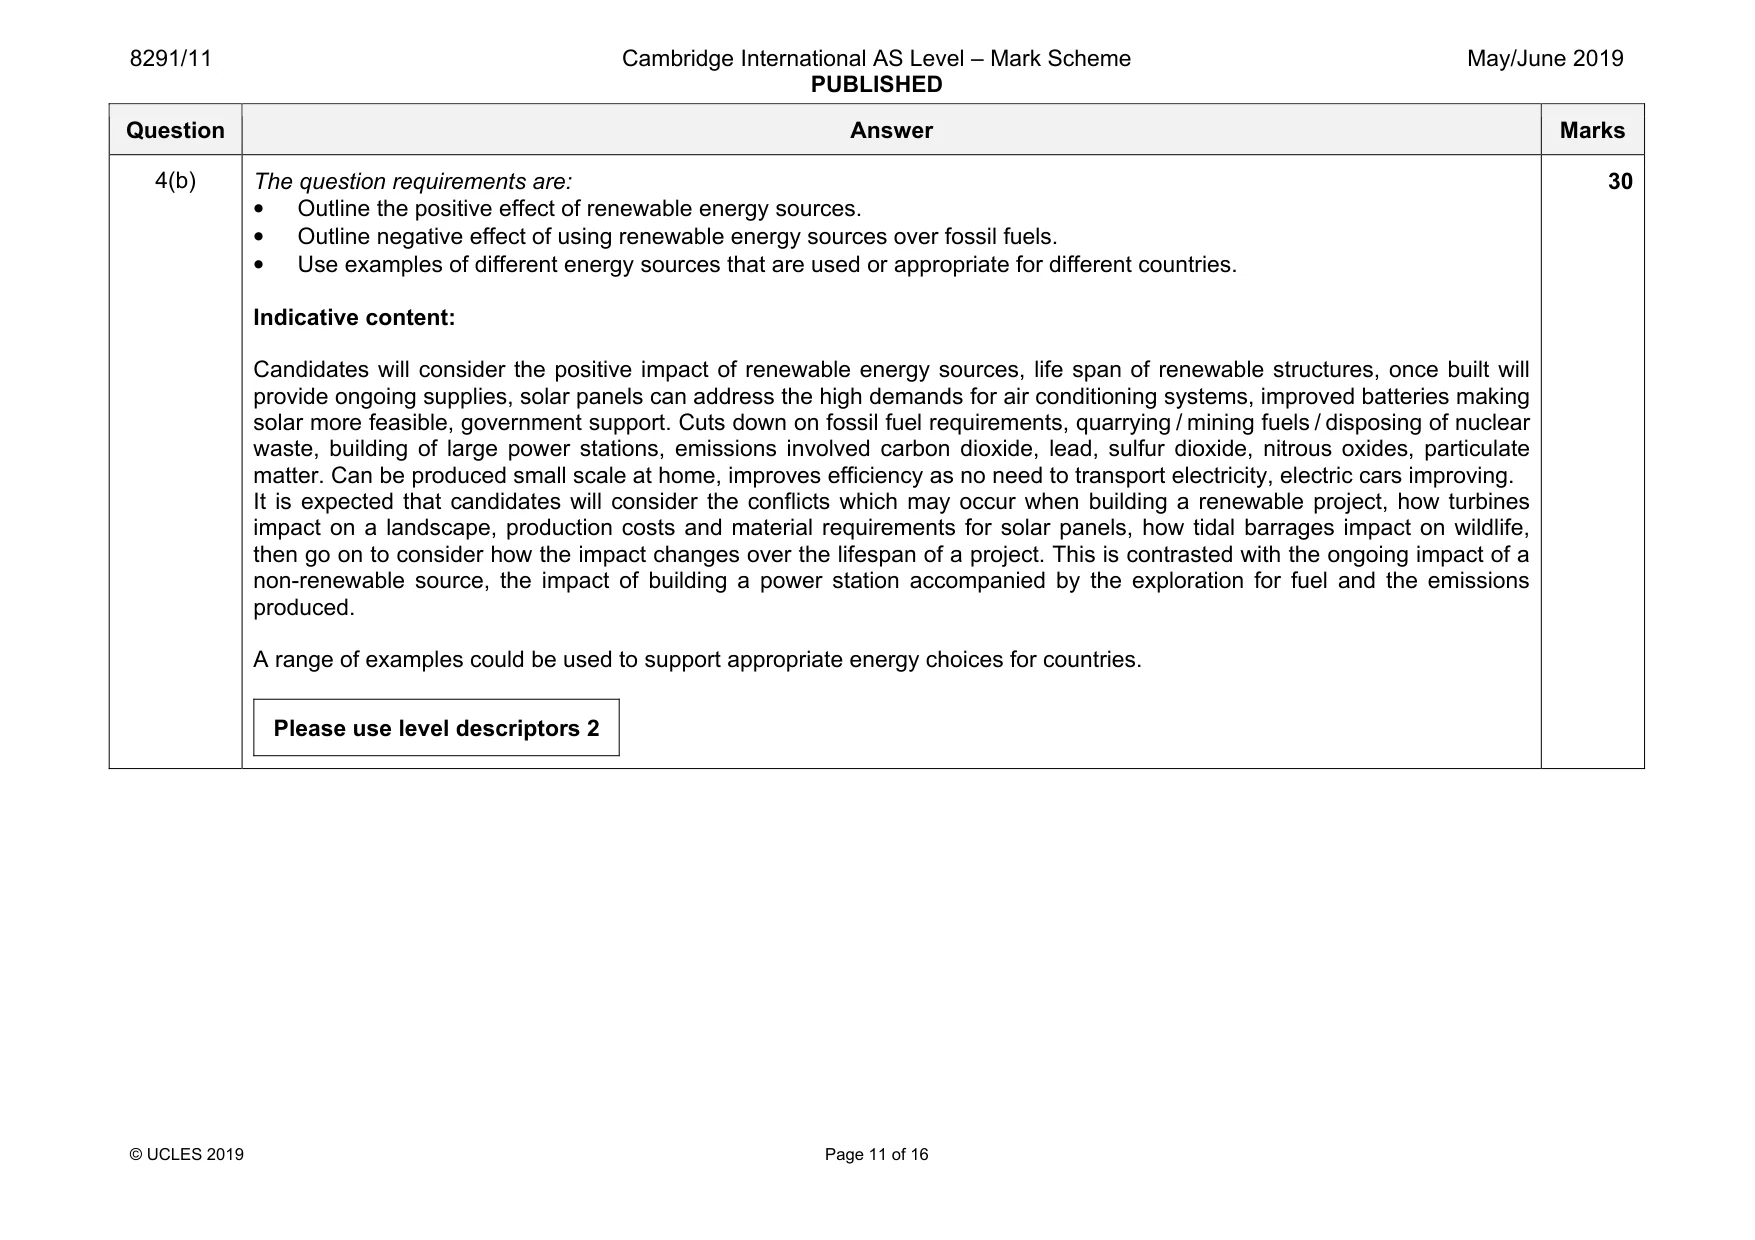
8291/11 Cambridge International AS Level – Mark Scheme PUBLISHED May/June 2019 © UCLES 2019 Page 11 of 16 Question Answer Marks 4(b) The question requirements are: • Outline the positive effect of renewable energy sources. • Outline negative effect of using renewable energy sources over fossil fuels. • Use examples of different energy sources that are used or appropriate for different countries. Indicative content: Candidates will consider the positive impact of renewable energy sources, life span of renewable structures, once built will provide ongoing supplies, solar panels can address the high demands for air conditioning systems, improved batteries making solar more feasible, government support. Cuts down on fossil fuel requirements, quarrying / mining fuels / disposing of nuclear waste, building of large power stations, emissions involved carbon dioxide, lead, sulfur dioxide, nitrous oxides, particulate matter. Can be produced small scale at home, improves efficiency as no need to transport electricity, electric cars improving. It is expected that candidates will consider the conflicts which may occur when building a renewable project, how turbines impact on a landscape, production costs and material requirements for solar panels, how tidal barrages impact on wildlife, then go on to consider how the impact changes over the lifespan of a project. This is contrasted with the ongoing impact of a non-renewable source, the impact of building a power station accompanied by the exploration for fuel and the emissions produced. A range of examples could be used to support appropriate energy choices for countries. Please use level descriptors 2 30
Mark scheme, page 12
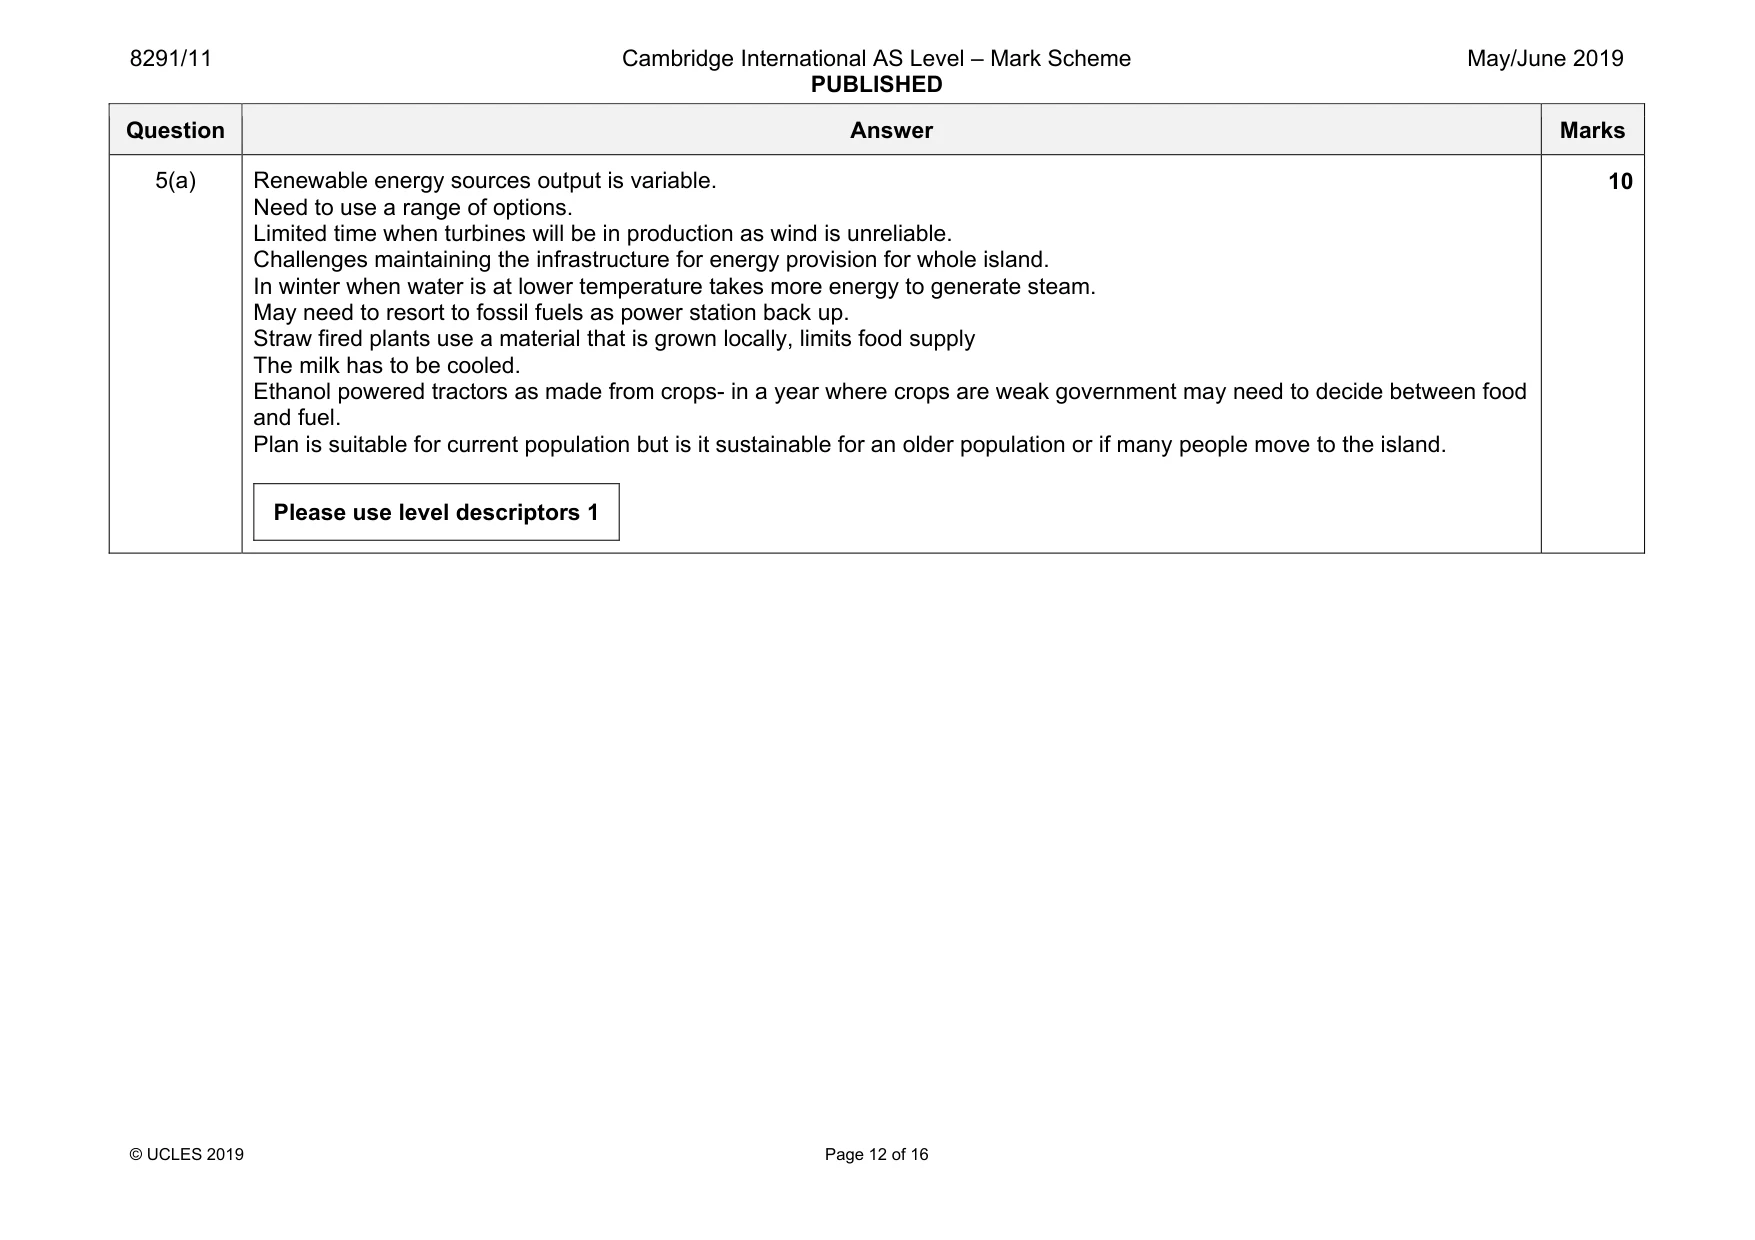
8291/11 Cambridge International AS Level – Mark Scheme PUBLISHED May/June 2019 © UCLES 2019 Page 12 of 16 Question Answer Marks 5(a) Renewable energy sources output is variable. Need to use a range of options. Limited time when turbines will be in production as wind is unreliable. Challenges maintaining the infrastructure for energy provision for whole island. In winter when water is at lower temperature takes more energy to generate steam. May need to resort to fossil fuels as power station back up. Straw fired plants use a material that is grown locally, limits food supply The milk has to be cooled. Ethanol powered tractors as made from crops- in a year where crops are weak government may need to decide between food and fuel. Plan is suitable for current population but is it sustainable for an older population or if many people move to the island. Please use level descriptors 1 10
Mark scheme, page 13
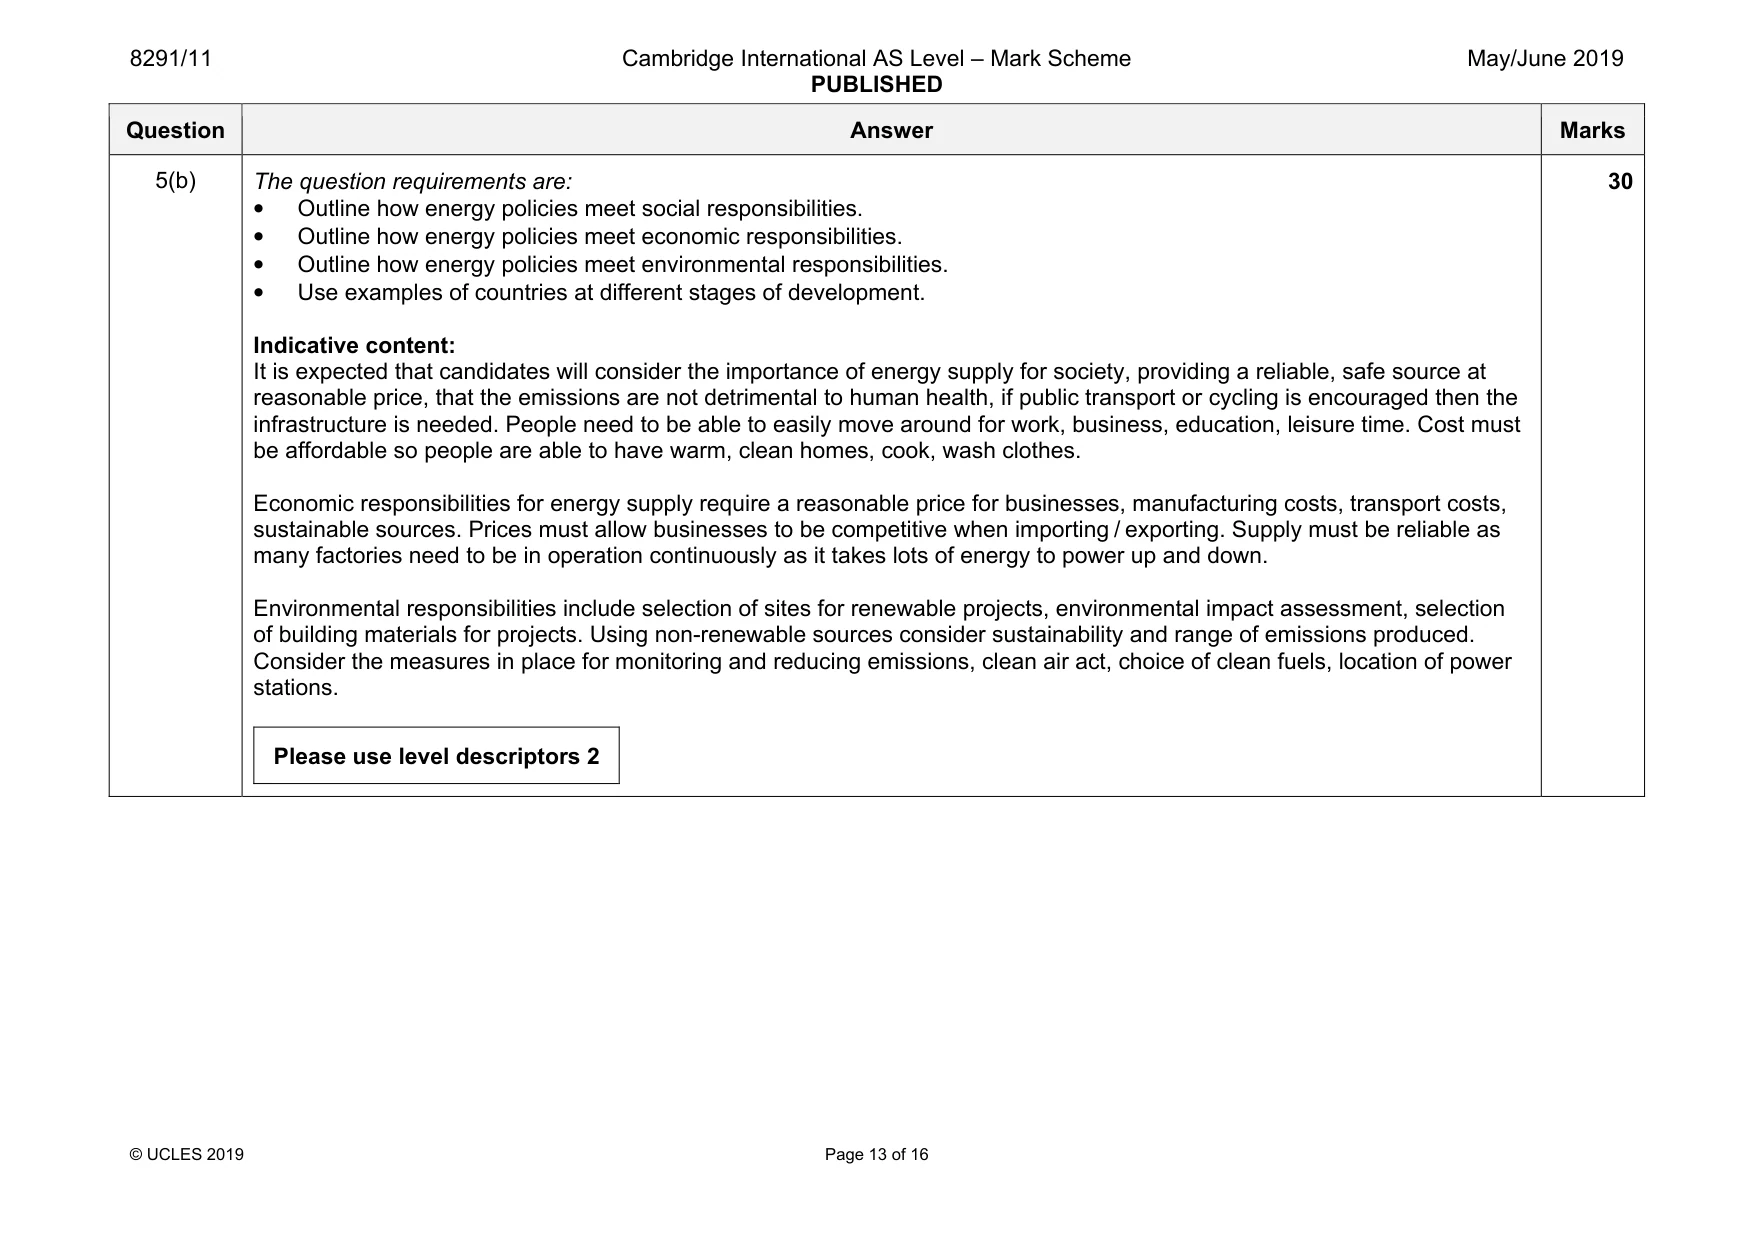
8291/11 Cambridge International AS Level – Mark Scheme PUBLISHED May/June 2019 © UCLES 2019 Page 13 of 16 Question Answer Marks 5(b) The question requirements are: • Outline how energy policies meet social responsibilities. • Outline how energy policies meet economic responsibilities. • Outline how energy policies meet environmental responsibilities. • Use examples of countries at different stages of development. Indicative content: It is expected that candidates will consider the importance of energy supply for society, providing a reliable, safe source at reasonable price, that the emissions are not detrimental to human health, if public transport or cycling is encouraged then the infrastructure is needed. People need to be able to easily move around for work, business, education, leisure time. Cost must be affordable so people are able to have warm, clean homes, cook, wash clothes. Economic responsibilities for energy supply require a reasonable price for businesses, manufacturing costs, transport costs, sustainable sources. Prices must allow businesses to be competitive when importing / exporting. Supply must be reliable as many factories need to be in operation continuously as it takes lots of energy to power up and down. Environmental responsibilities include selection of sites for renewable projects, environmental impact assessment, selection of building materials for projects. Using non-renewable sources consider sustainability and range of emissions produced. Consider the measures in place for monitoring and reducing emissions, clean air act, choice of clean fuels, location of power stations. Please use level descriptors 2 30
Mark scheme, page 14
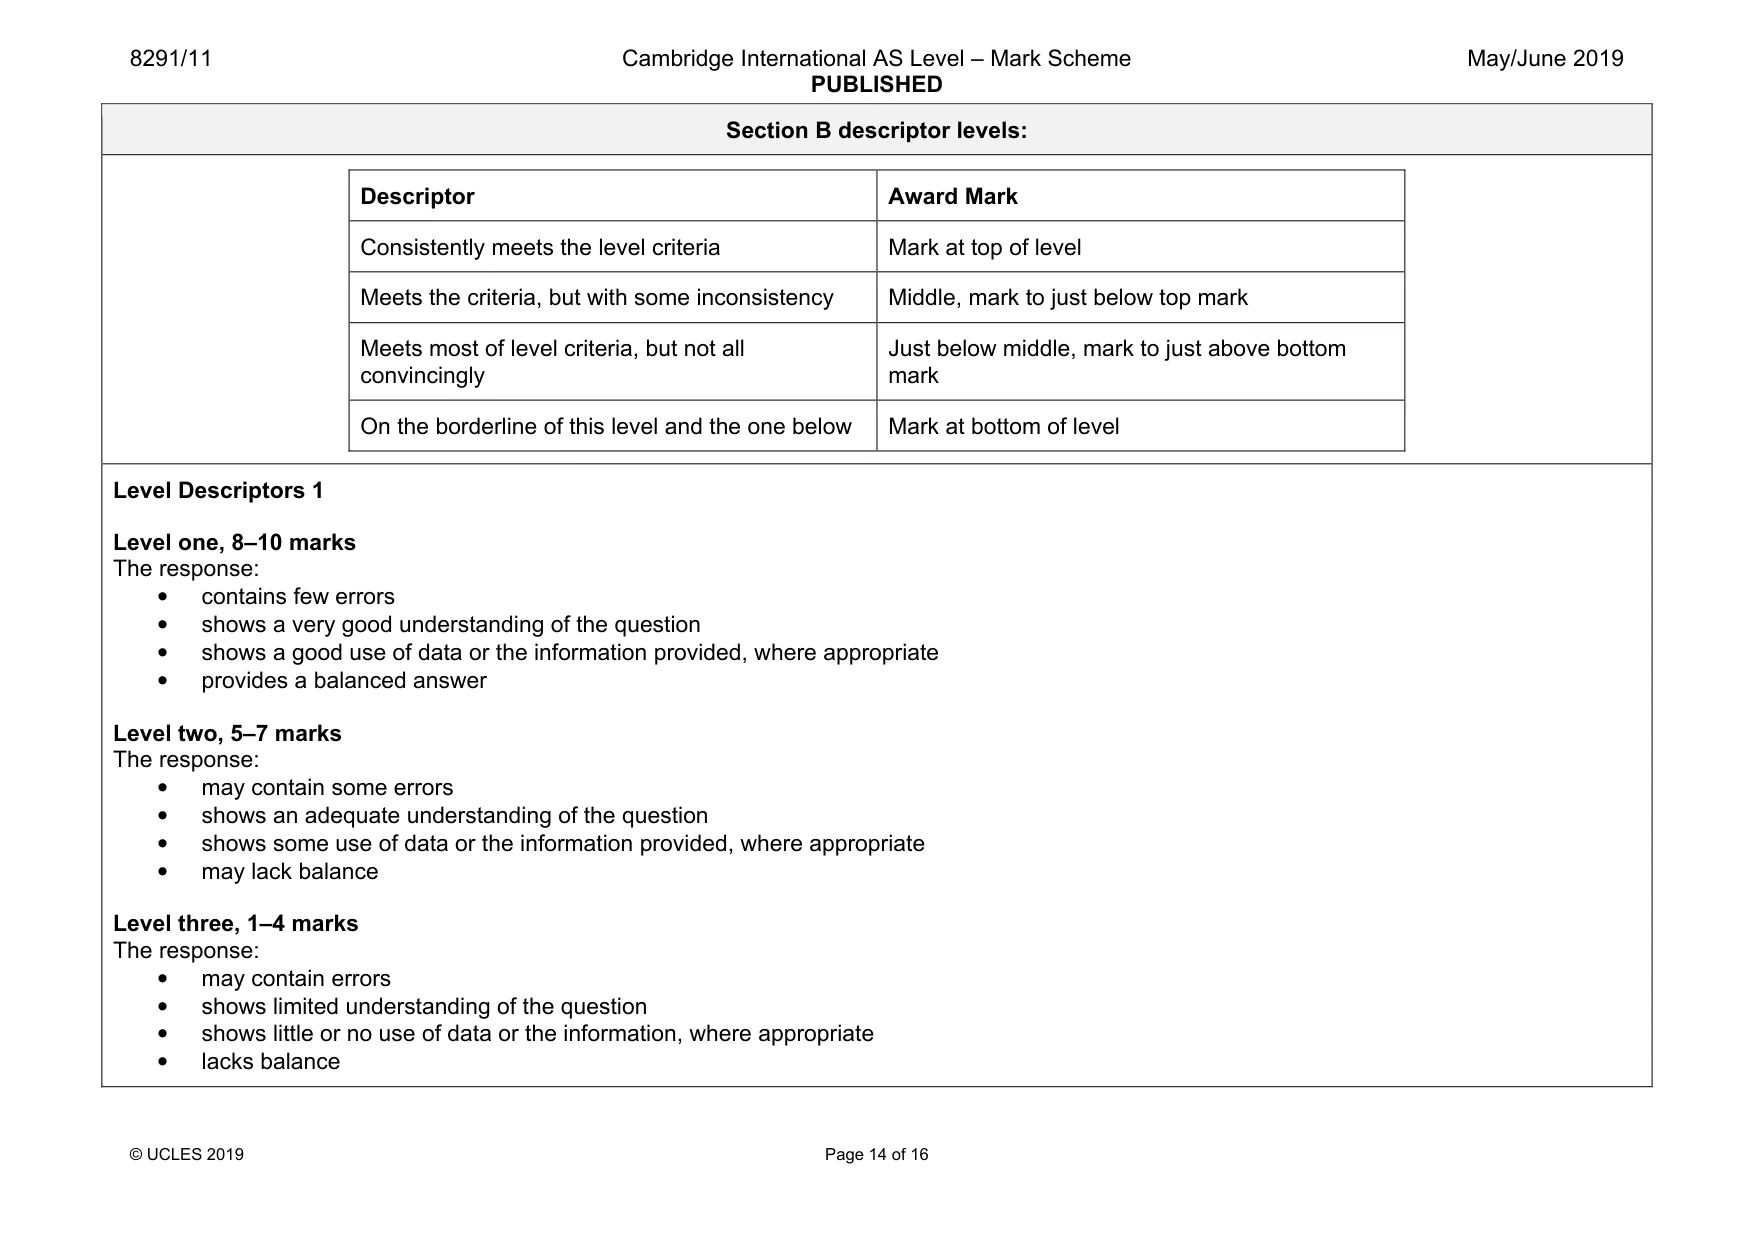
8291/11 Cambridge International AS Level – Mark Scheme PUBLISHED May/June 2019 © UCLES 2019 Page 14 of 16 Section B descriptor levels: Descriptor Award Mark Consistently meets the level criteria Mark at top of level Meets the criteria, but with some inconsistency Middle, mark to just below top mark Meets most of level criteria, but not all convincingly Just below middle, mark to just above bottom mark On the borderline of this level and the one below Mark at bottom of level Level Descriptors 1 Level one, 8–10 marks The response: • contains few errors • shows a very good understanding of the question • shows a good use of data or the information provided, where appropriate • provides a balanced answer Level two, 5–7 marks The response: • may contain some errors • shows an adequate understanding of the question • shows some use of data or the information provided, where appropriate • may lack balance Level three, 1–4 marks The response: • may contain errors • shows limited understanding of the question • shows little or no use of data or the information, where appropriate • lacks balance
Mark scheme, page 15
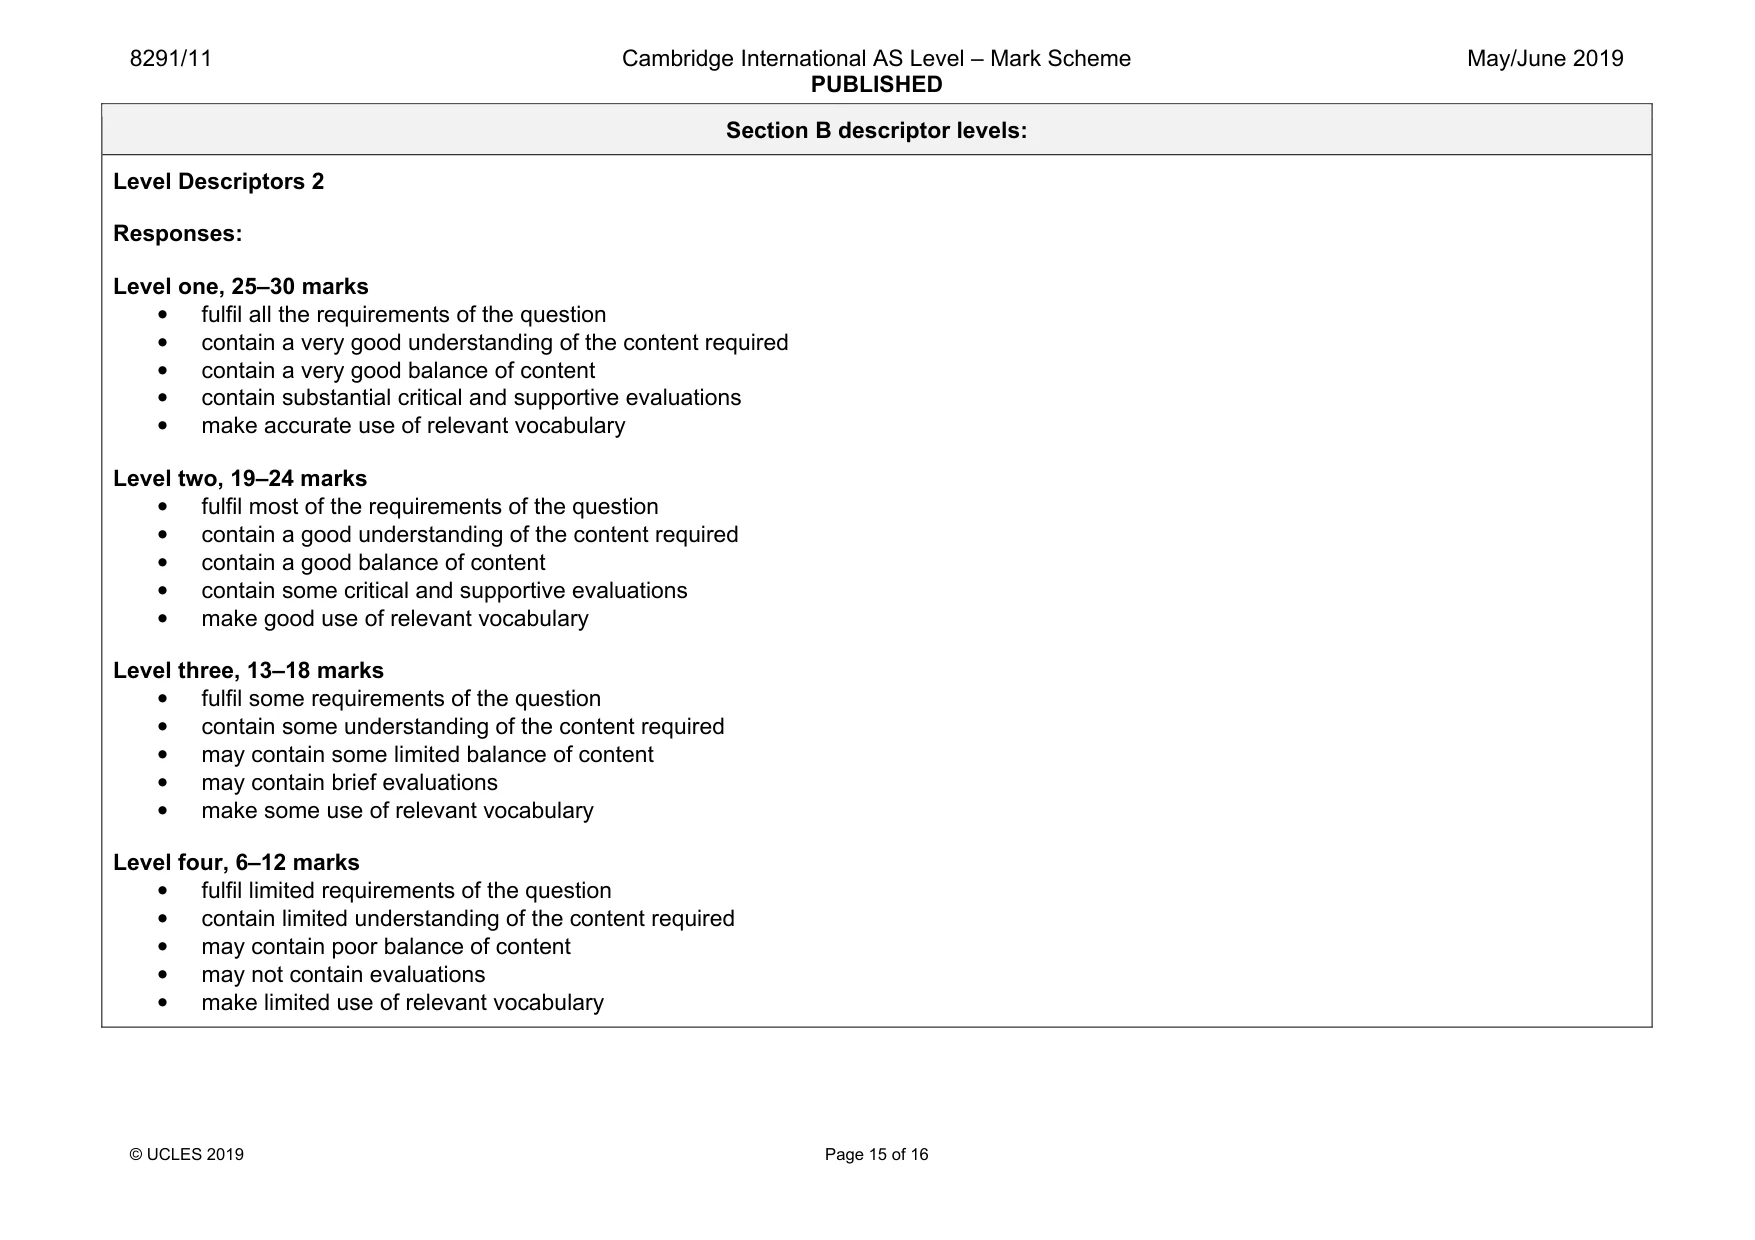
8291/11 Cambridge International AS Level – Mark Scheme PUBLISHED May/June 2019 © UCLES 2019 Page 15 of 16 Section B descriptor levels: Level Descriptors 2 Responses: Level one, 25–30 marks • fulfil all the requirements of the question • contain a very good understanding of the content required • contain a very good balance of content • contain substantial critical and supportive evaluations • make accurate use of relevant vocabulary Level two, 19–24 marks • fulfil most of the requirements of the question • contain a good understanding of the content required • contain a good balance of content • contain some critical and supportive evaluations • make good use of relevant vocabulary Level three, 13–18 marks • fulfil some requirements of the question • contain some understanding of the content required • may contain some limited balance of content • may contain brief evaluations • make some use of relevant vocabulary Level four, 6–12 marks • fulfil limited requirements of the question • contain limited understanding of the content required • may contain poor balance of content • may not contain evaluations • make limited use of relevant vocabulary
Mark scheme, page 16
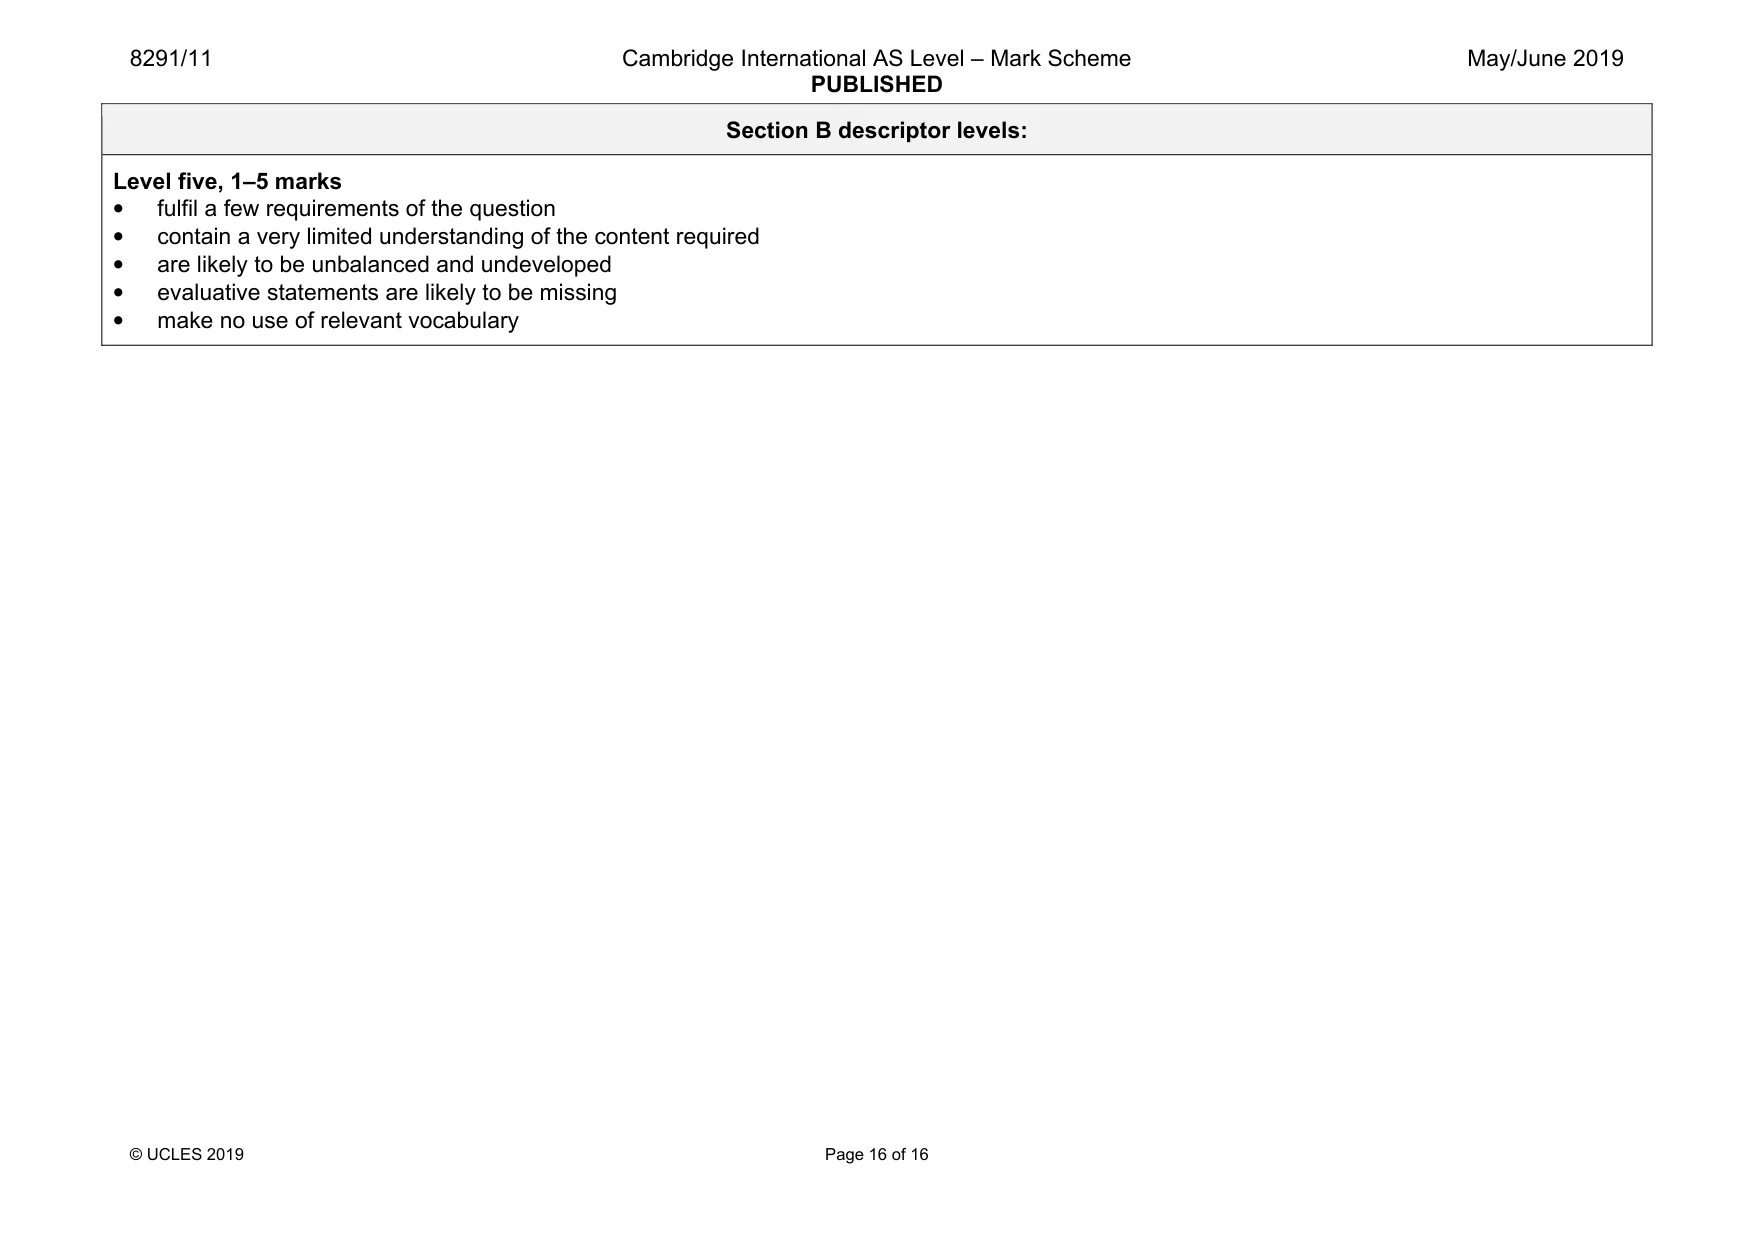
8291/11 Cambridge International AS Level – Mark Scheme PUBLISHED May/June 2019 © UCLES 2019 Page 16 of 16 Section B descriptor levels: Level five, 1–5 marks • fulfil a few requirements of the question • contain a very limited understanding of the content required • are likely to be unbalanced and undeveloped • evaluative statements are likely to be missing • make no use of relevant vocabulary
What you needed in this session
Cambridge’s own grade thresholds for 2019 May/June, Paper 1 · Variant 1. A higher threshold means an easier paper — the bar moves with how the cohort did.