Cambridge A Level Environmental Management (AS only) 8291 — 2019 May/June Paper 1 · Variant 2
8291/12/M/J/19 · 80 marks · ≈90 min
The question paper and its mark scheme, free to read here and free to download. This is Cambridge’s own paper, exactly as it was sat.
Question paper12 pages

Mark scheme16 pages
Answers below. Sit the paper first if you are practising.
Paper as text
Question paper, page 1
This document consists of 11 printed pages and 1 blank page. DC (RW/SW) 166240/4 © UCLES 2019 [Turn over * 4 6 6 1 6 4 7 2 8 2 * ENVIRONMENTAL MANAGEMENT 8291/12 Paper 1 Lithosphere and Atmosphere May/June 2019 1 hour 30 minutes Additional Materials: Answer Booklet/Paper READ THESE INSTRUCTIONS FIRST Write your centre number, candidate number and name on all the work you hand in. Write in dark blue or black pen. You may use an HB pencil for any diagrams or graphs. Do not use staples, paper clips, glue or correction fluid. DO NOT WRITE IN ANY BARCODES. Electronic calculators may be used. You may lose marks if you do not show your working or if you do not use appropriate units. Section A Answer all questions in this section. Write your answers in the spaces provided on the question paper. Section B Answer one question from this section. Write your answers on the separate answer paper provided. At the end of the examination, 1. fasten all separate answer paper securely to the question paper; 2. enter the question number from Section B in the grid. Cambridge Assessment International Education Cambridge International Advanced Subsidiary Level For Examiner’s Use Section A 1 2 Section B Total
Question paper, page 2
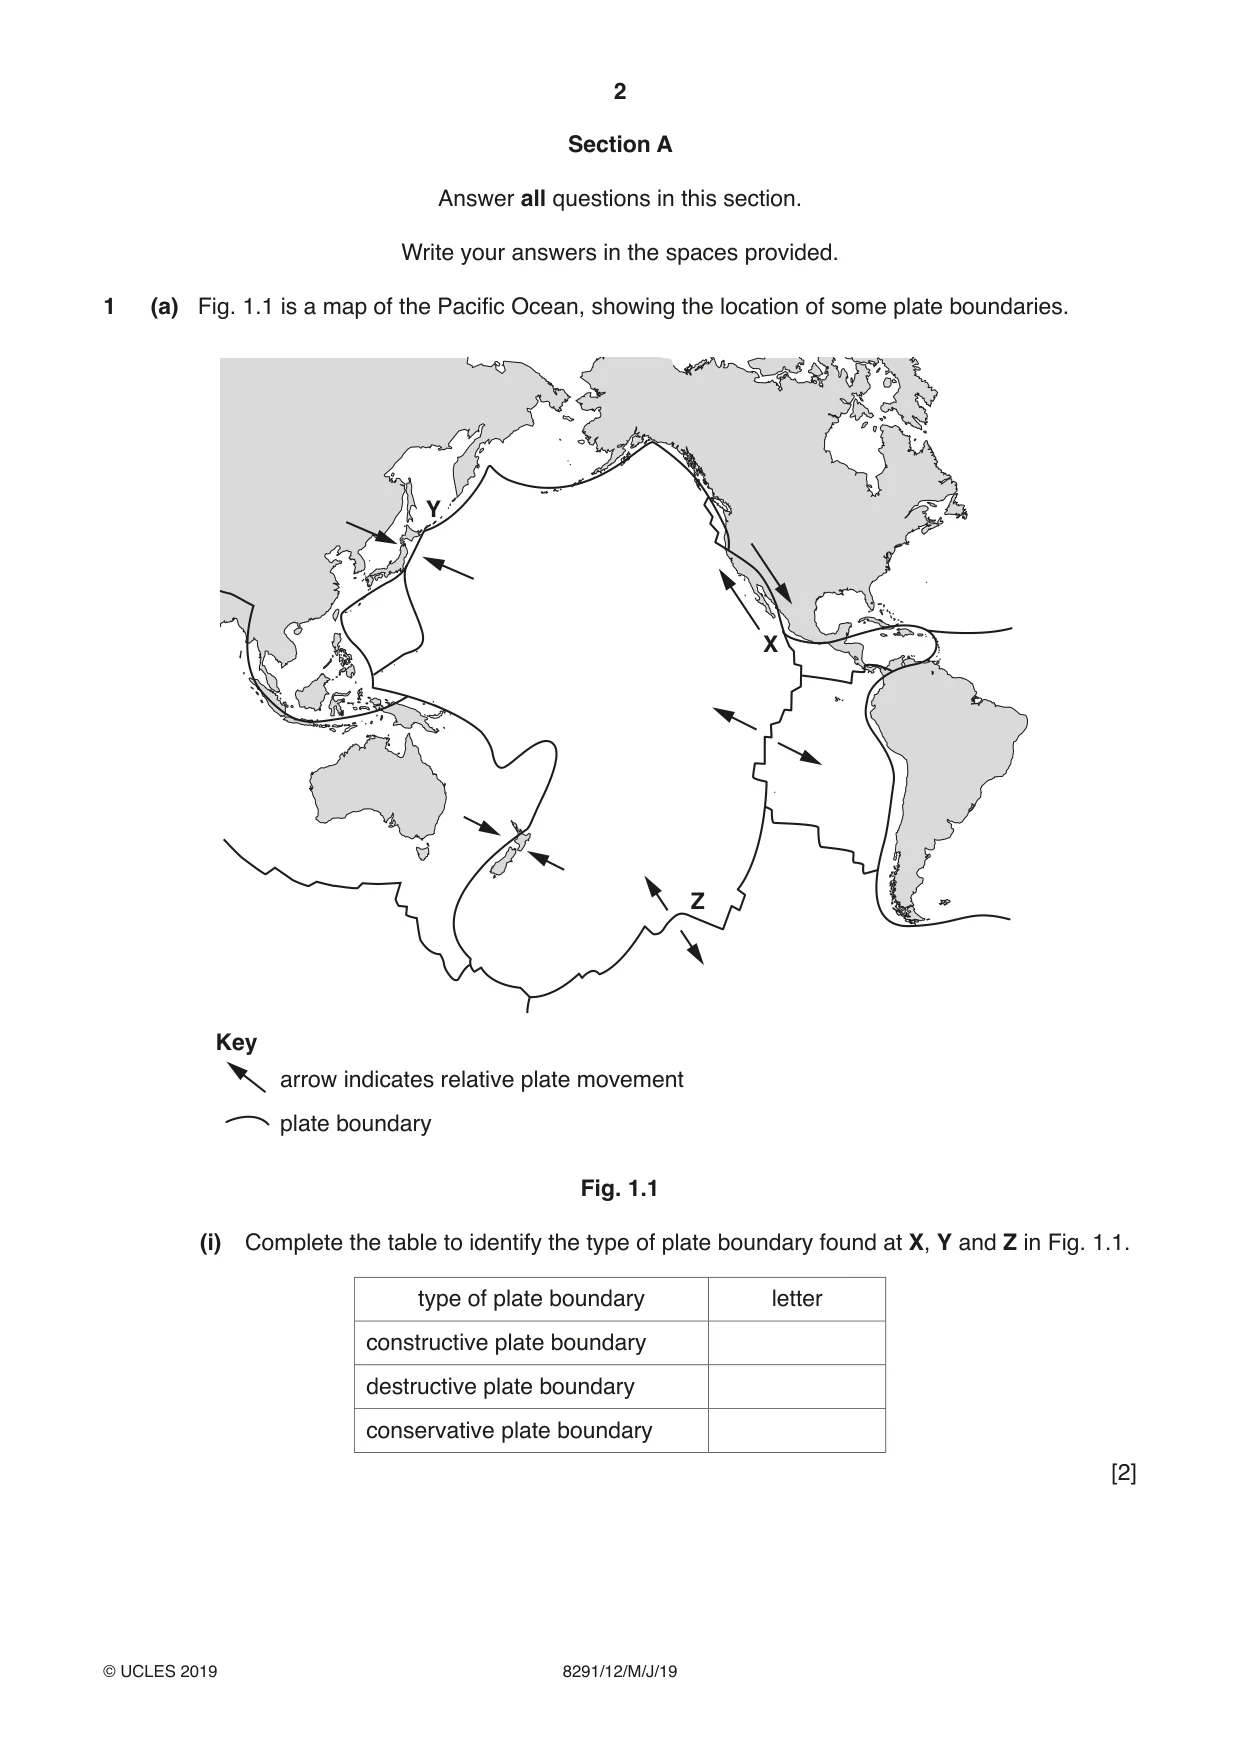
2 8291/12/M/J/19 © UCLES 2019 Section A Answer all questions in this section. Write your answers in the spaces provided. 1 (a) Fig. 1.1 is a map of the Pacific Ocean, showing the location of some plate boundaries. Z Y X arrow indicates relative plate movement plate boundary Key Fig. 1.1 (i) Complete the table to identify the type of plate boundary found at X, Y and Z in Fig. 1.1. type of plate boundary letter constructive plate boundary destructive plate boundary conservative plate boundary [2]
Question paper, page 3
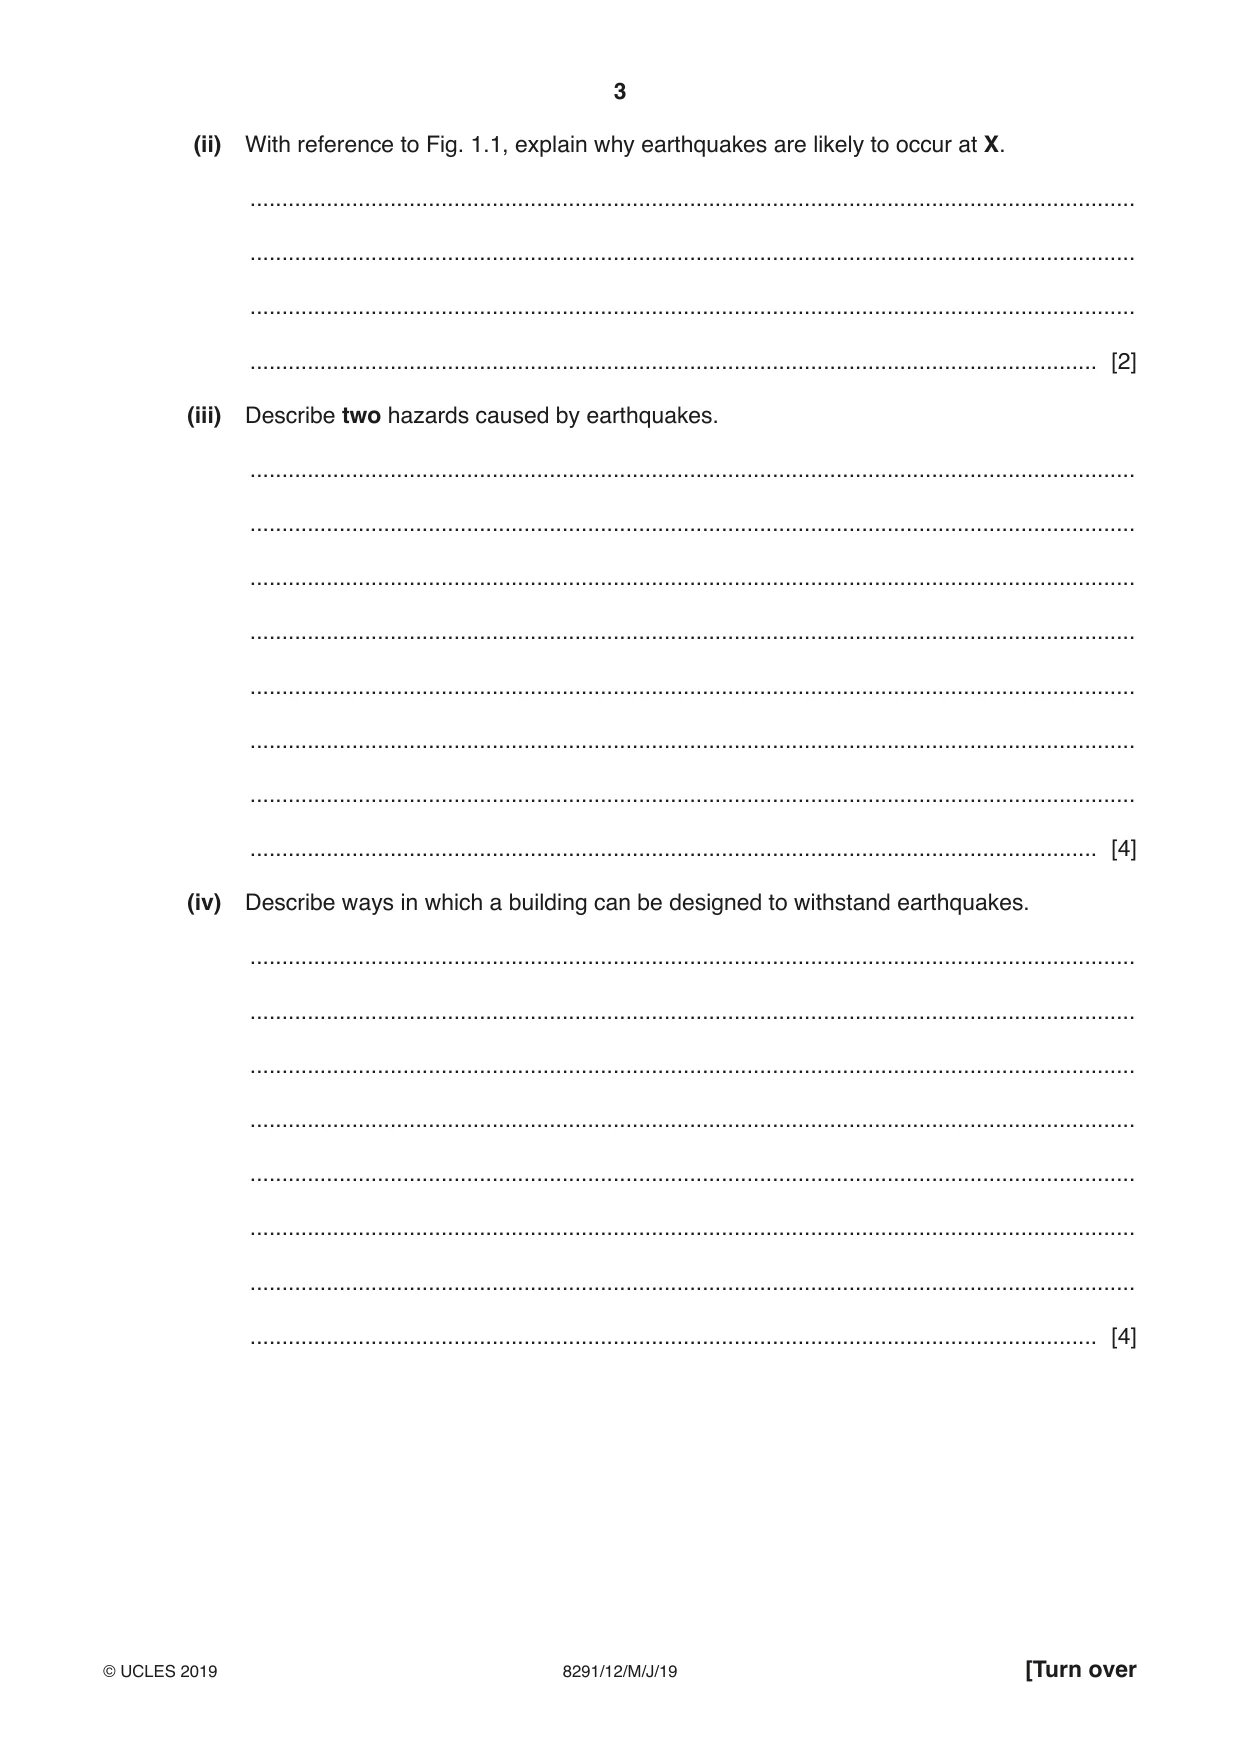
3 8291/12/M/J/19 © UCLES 2019 [Turn over (ii) With reference to Fig. 1.1, explain why earthquakes are likely to occur at X. … … … … [2] (iii) Describe two hazards caused by earthquakes. … … … … … … … … [4] (iv) Describe ways in which a building can be designed to withstand earthquakes. … … … … … … … … [4]
Question paper, page 4
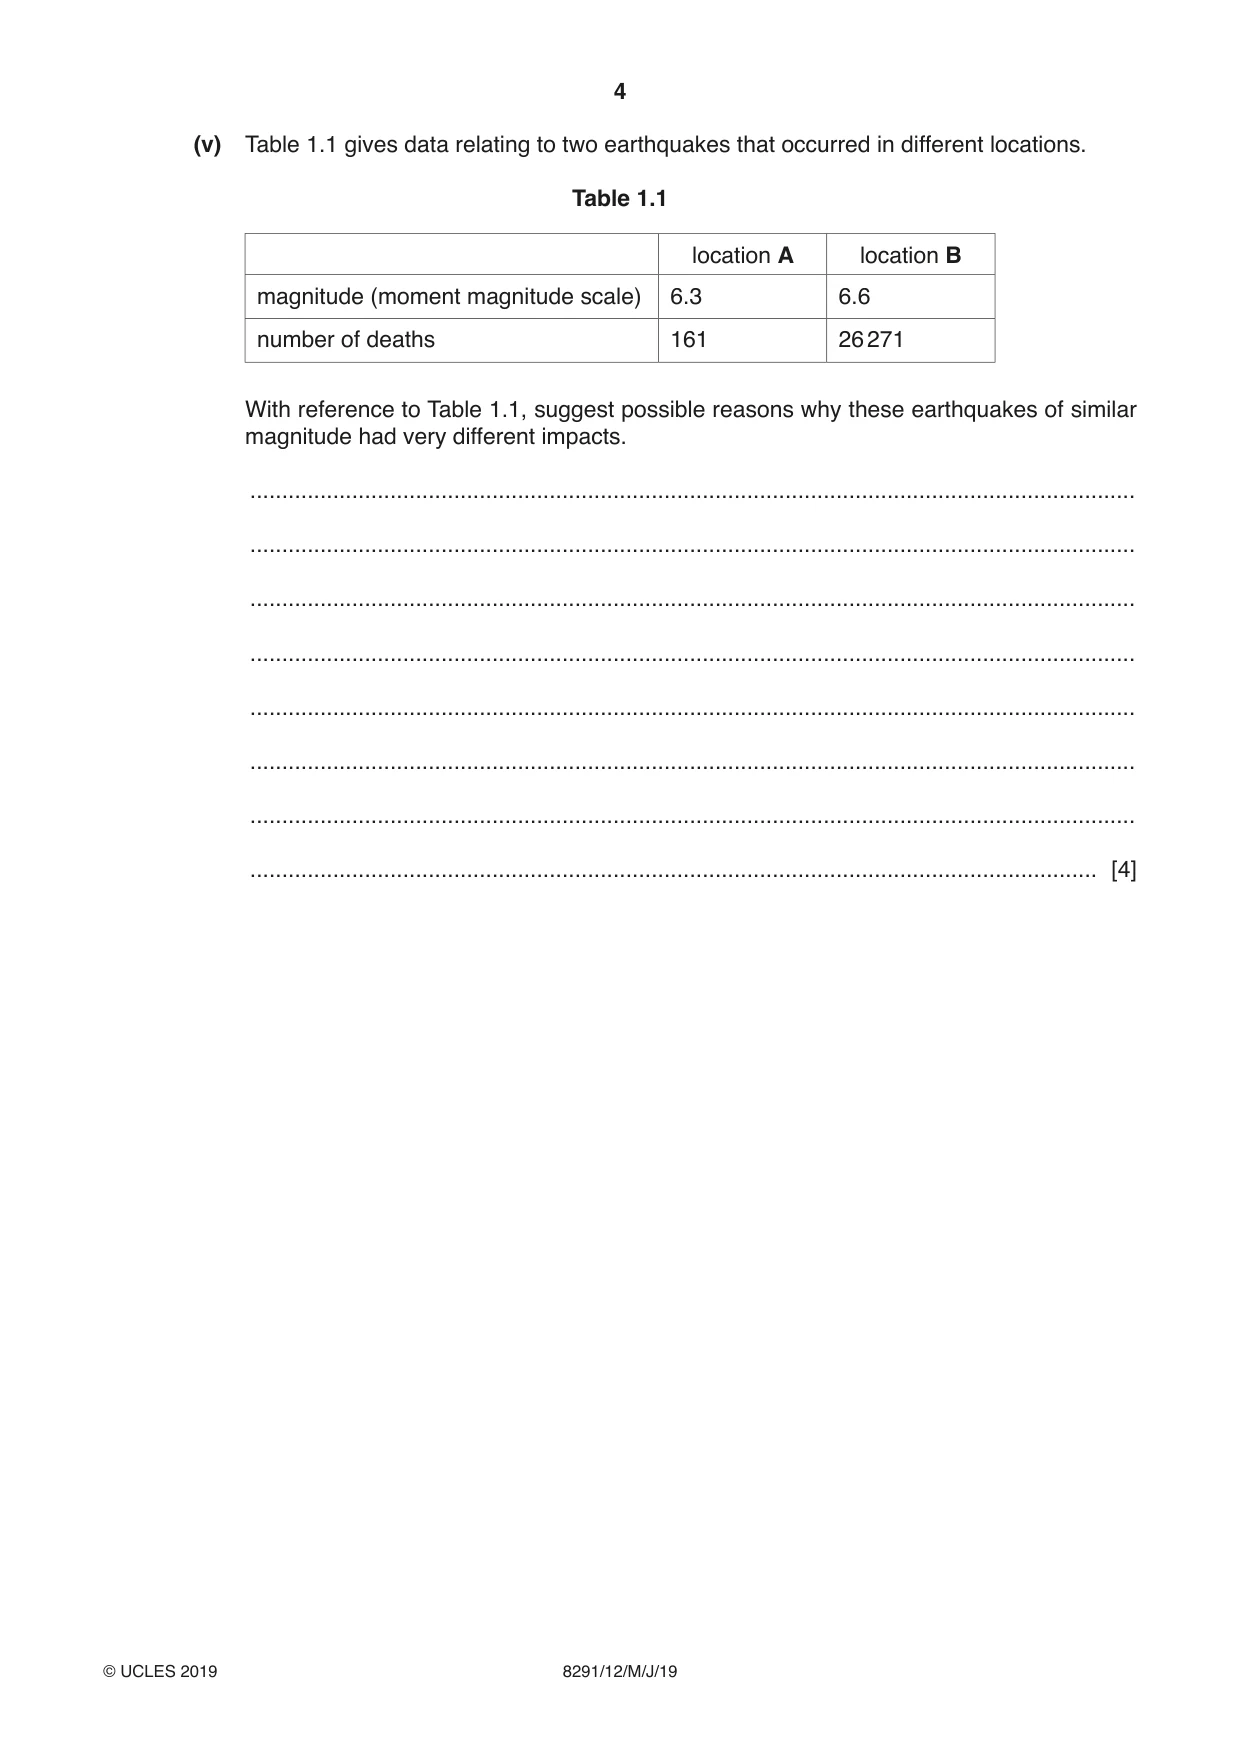
4 8291/12/M/J/19 © UCLES 2019 (v) Table 1.1 gives data relating to two earthquakes that occurred in different locations. Table 1.1 location A location B magnitude (moment magnitude scale) 6.3 6.6 number of deaths 161 26 271 With reference to Table 1.1, suggest possible reasons why these earthquakes of similar magnitude had very different impacts. … … … … … … … … [4]
Question paper, page 5
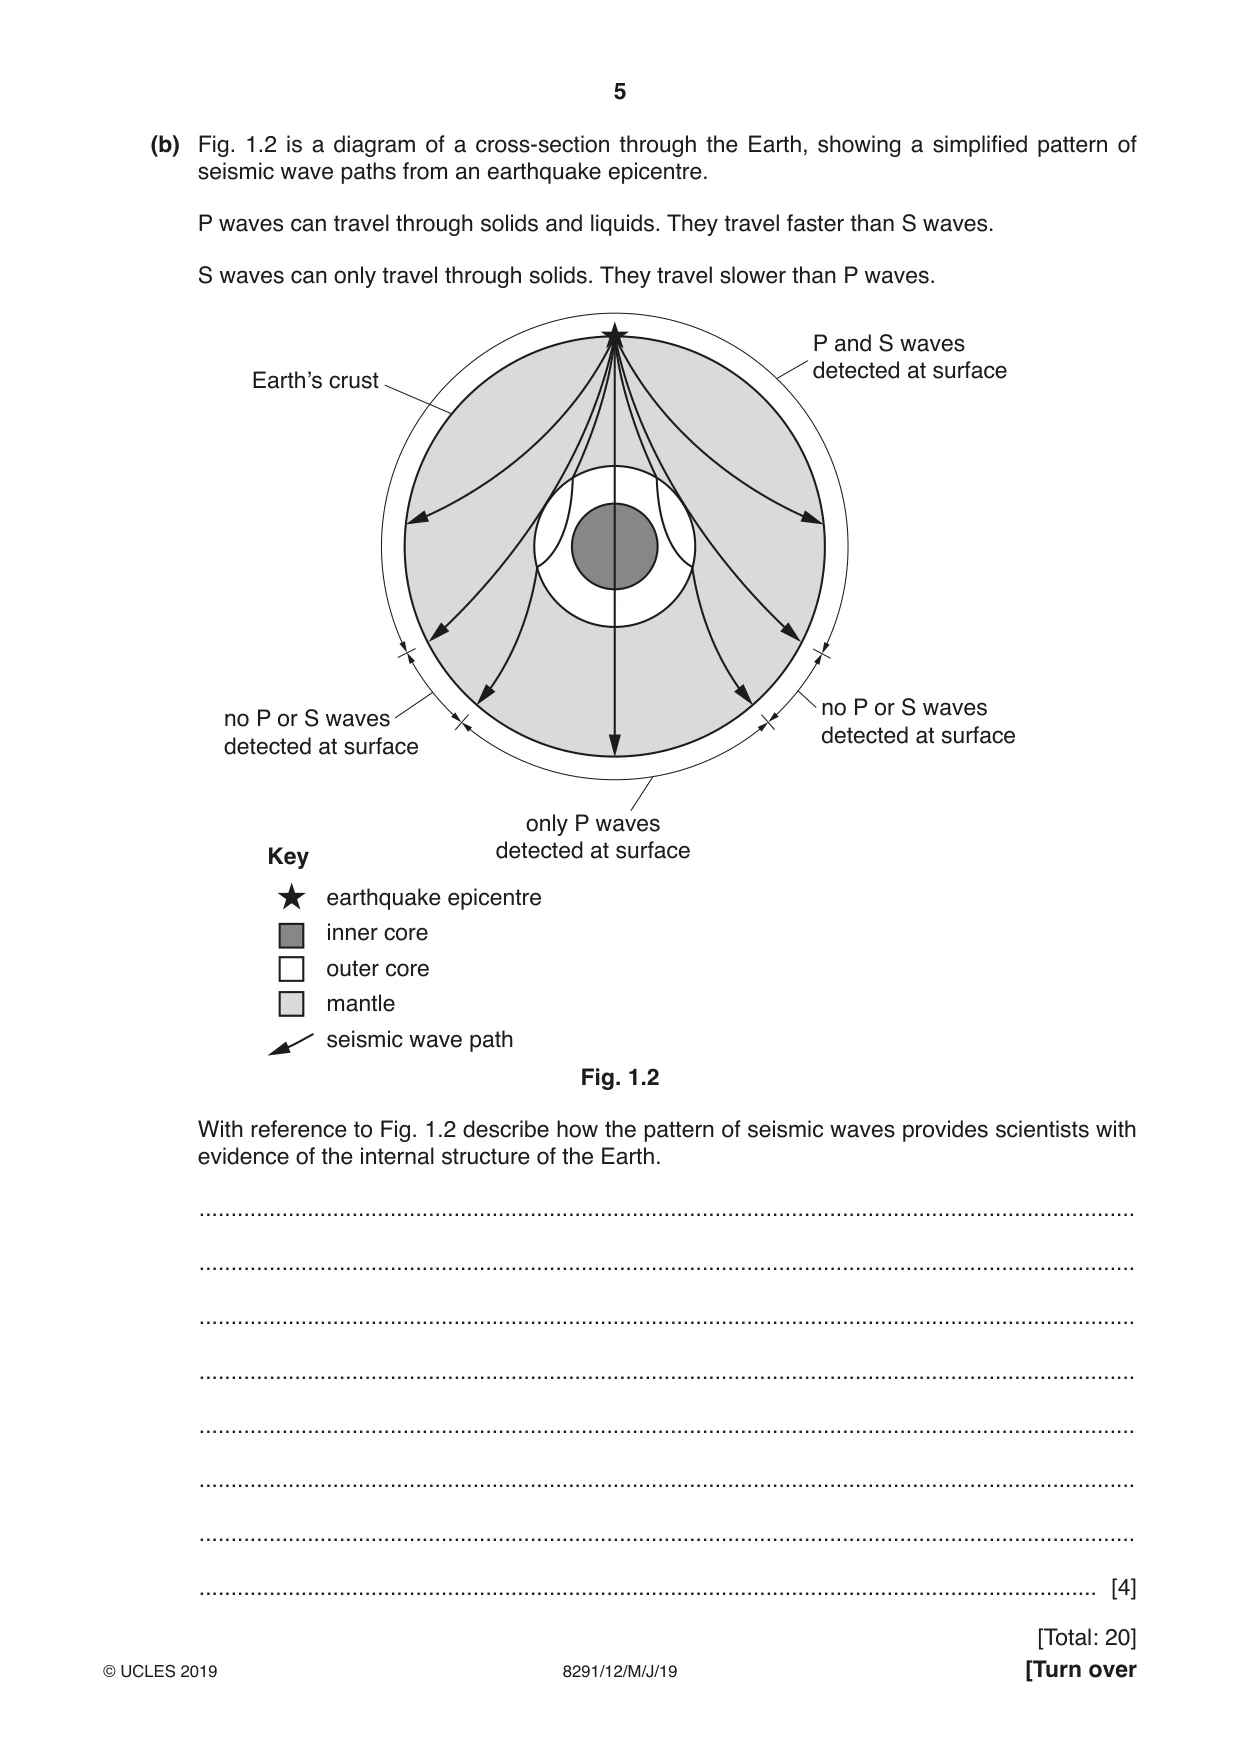
5 8291/12/M/J/19 © UCLES 2019 [Turn over (b) Fig. 1.2 is a diagram of a cross‑section through the Earth, showing a simplified pattern of seismic wave paths from an earthquake epicentre. P waves can travel through solids and liquids. They travel faster than S waves. S waves can only travel through solids. They travel slower than P waves. P and S waves detected at surface no P or S waves detected at surface no P or S waves detected at surface Earth’s crust only P waves detected at surface earthquake epicentre inner core outer core mantle seismic wave path Key Fig. 1.2 With reference to Fig. 1.2 describe how the pattern of seismic waves provides scientists with evidence of the internal structure of the Earth. … … … … … … … … [4] [Total: 20]
Question paper, page 6
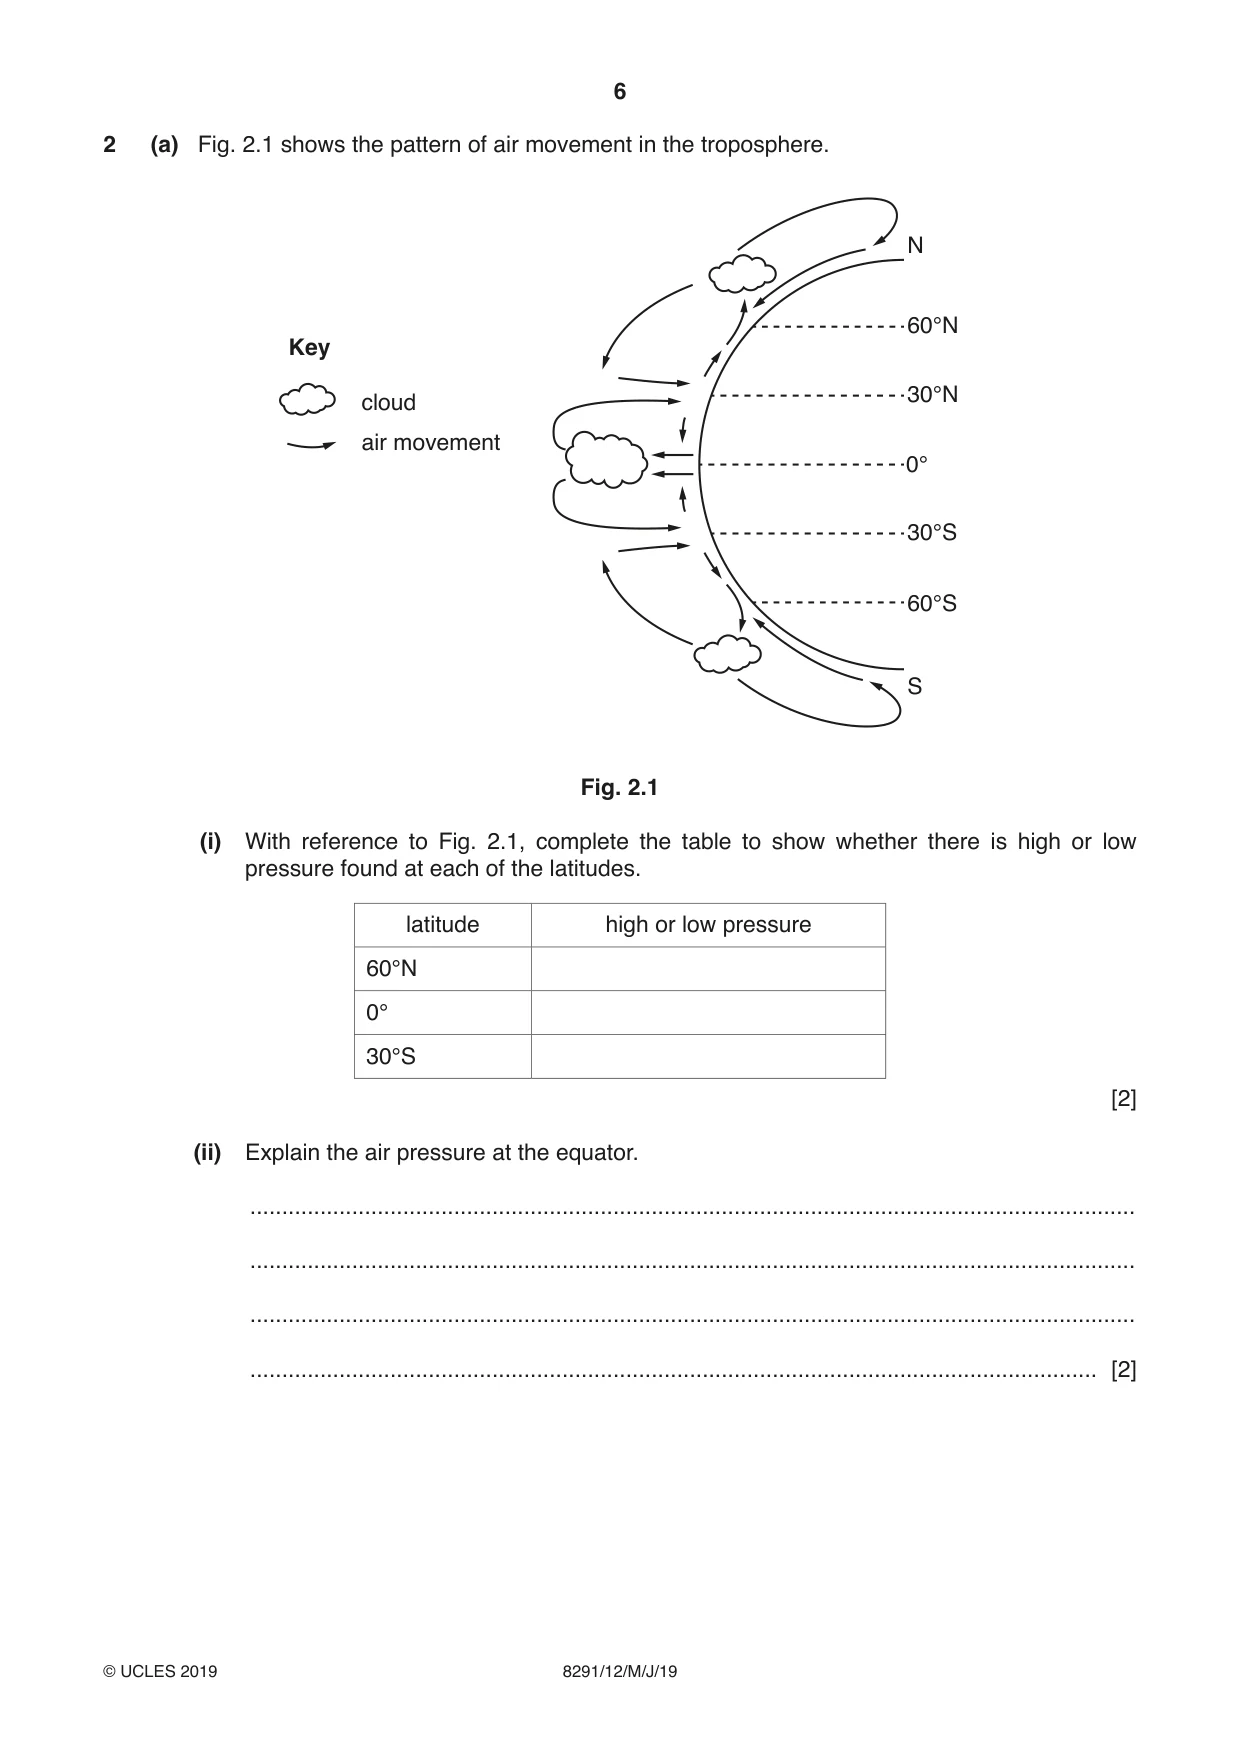
6 8291/12/M/J/19 © UCLES 2019 2 (a) Fig. 2.1 shows the pattern of air movement in the troposphere. 60°N Key cloud air movement N S 30°N 0° 30°S 60°S Fig. 2.1 (i) With reference to Fig. 2.1, complete the table to show whether there is high or low pressure found at each of the latitudes. latitude high or low pressure 60°N 0° 30°S [2] (ii) Explain the air pressure at the equator. … … … … [2]
Question paper, page 7
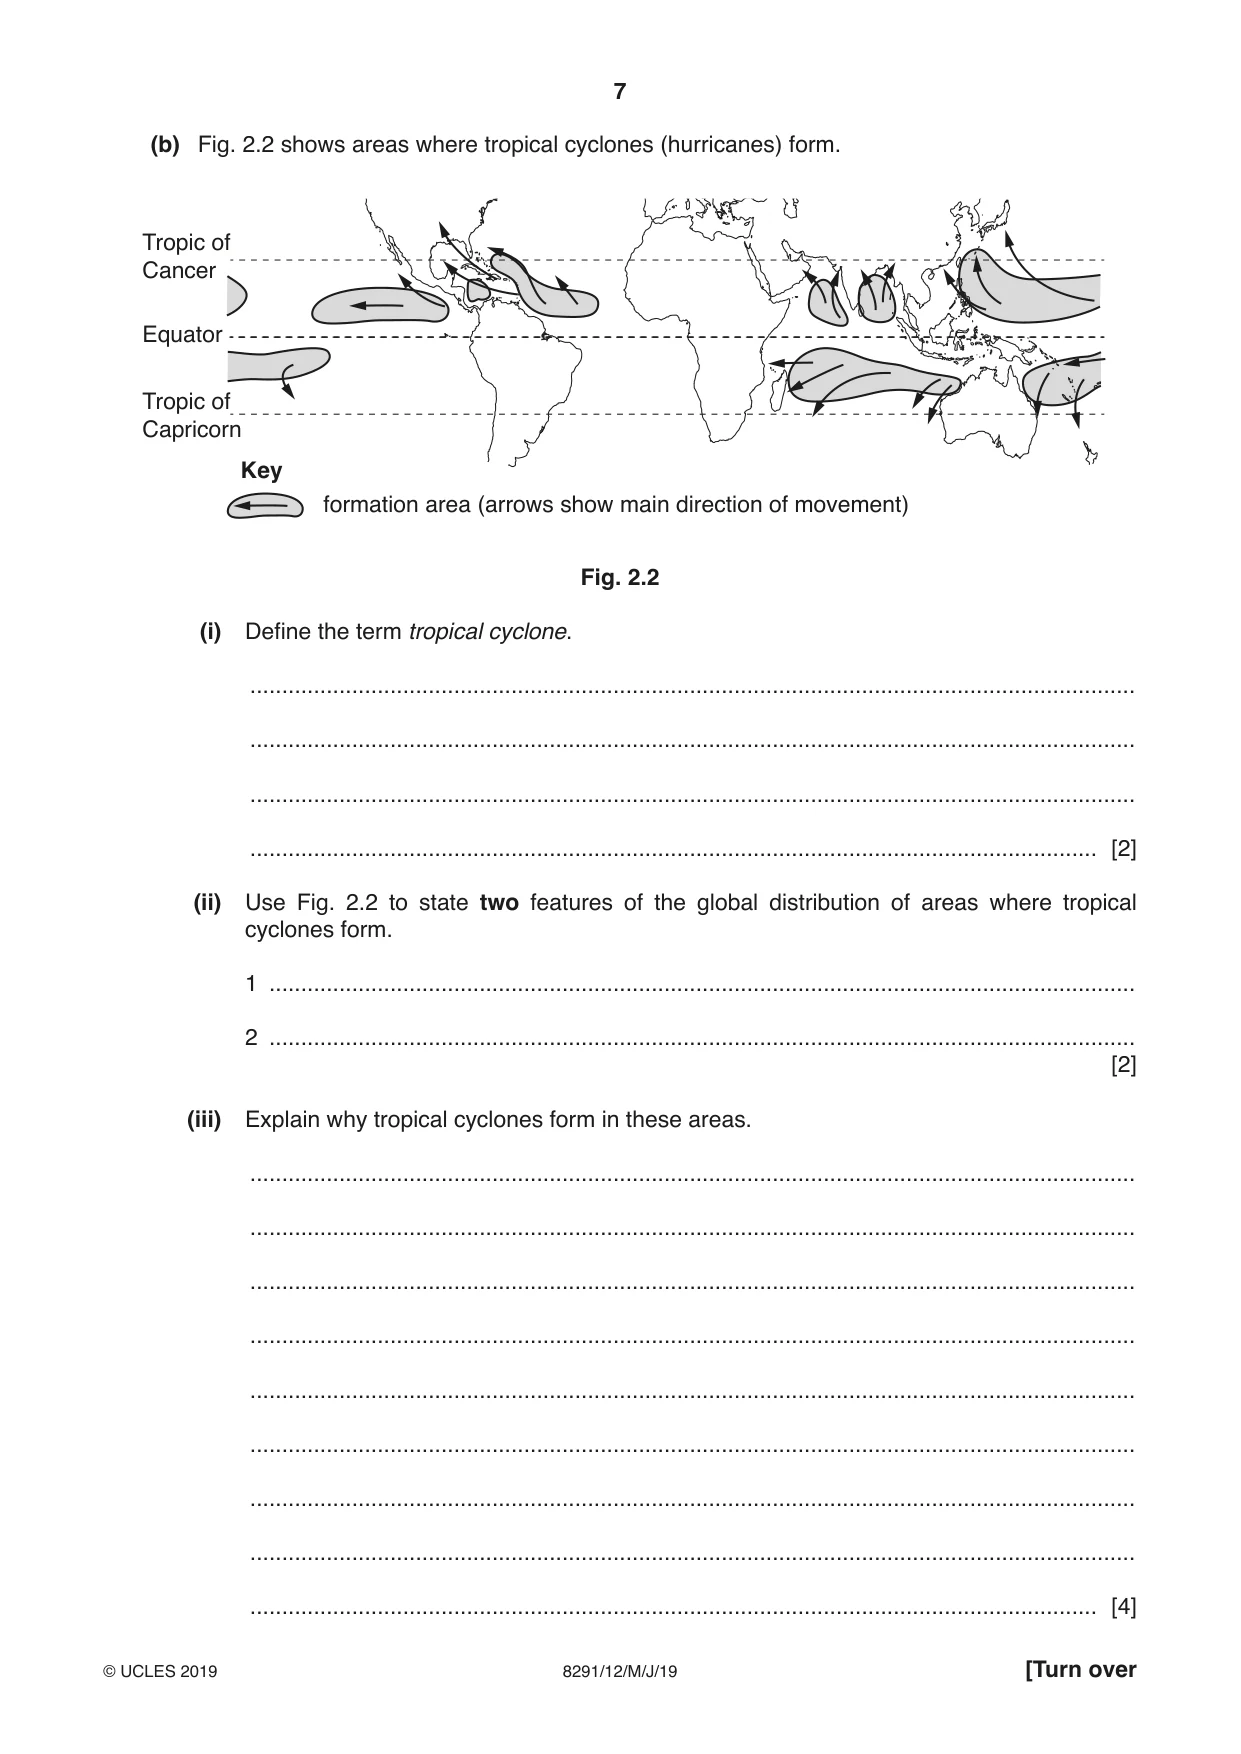
7 8291/12/M/J/19 © UCLES 2019 [Turn over (b) Fig. 2.2 shows areas where tropical cyclones (hurricanes) form. Key formation area (arrows show main direction of movement) Tropic of Cancer Tropic of Capricorn Equator Fig. 2.2 (i) Define the term tropical cyclone. … … … … [2] (ii) Use Fig. 2.2 to state two features of the global distribution of areas where tropical cyclones form. 1 … 2 … [2] (iii) Explain why tropical cyclones form in these areas. … … … … … … … … … [4]
Question paper, page 8
8 8291/12/M/J/19 © UCLES 2019 (iv) Describe the characteristic weather associated with a tropical cyclone. … … … … … … … … [4] (v) Describe the impacts that a tropical cyclone can have on a low‑lying coastal settlement. … … … … … … … … [4] [Total: 20]
Question paper, page 9
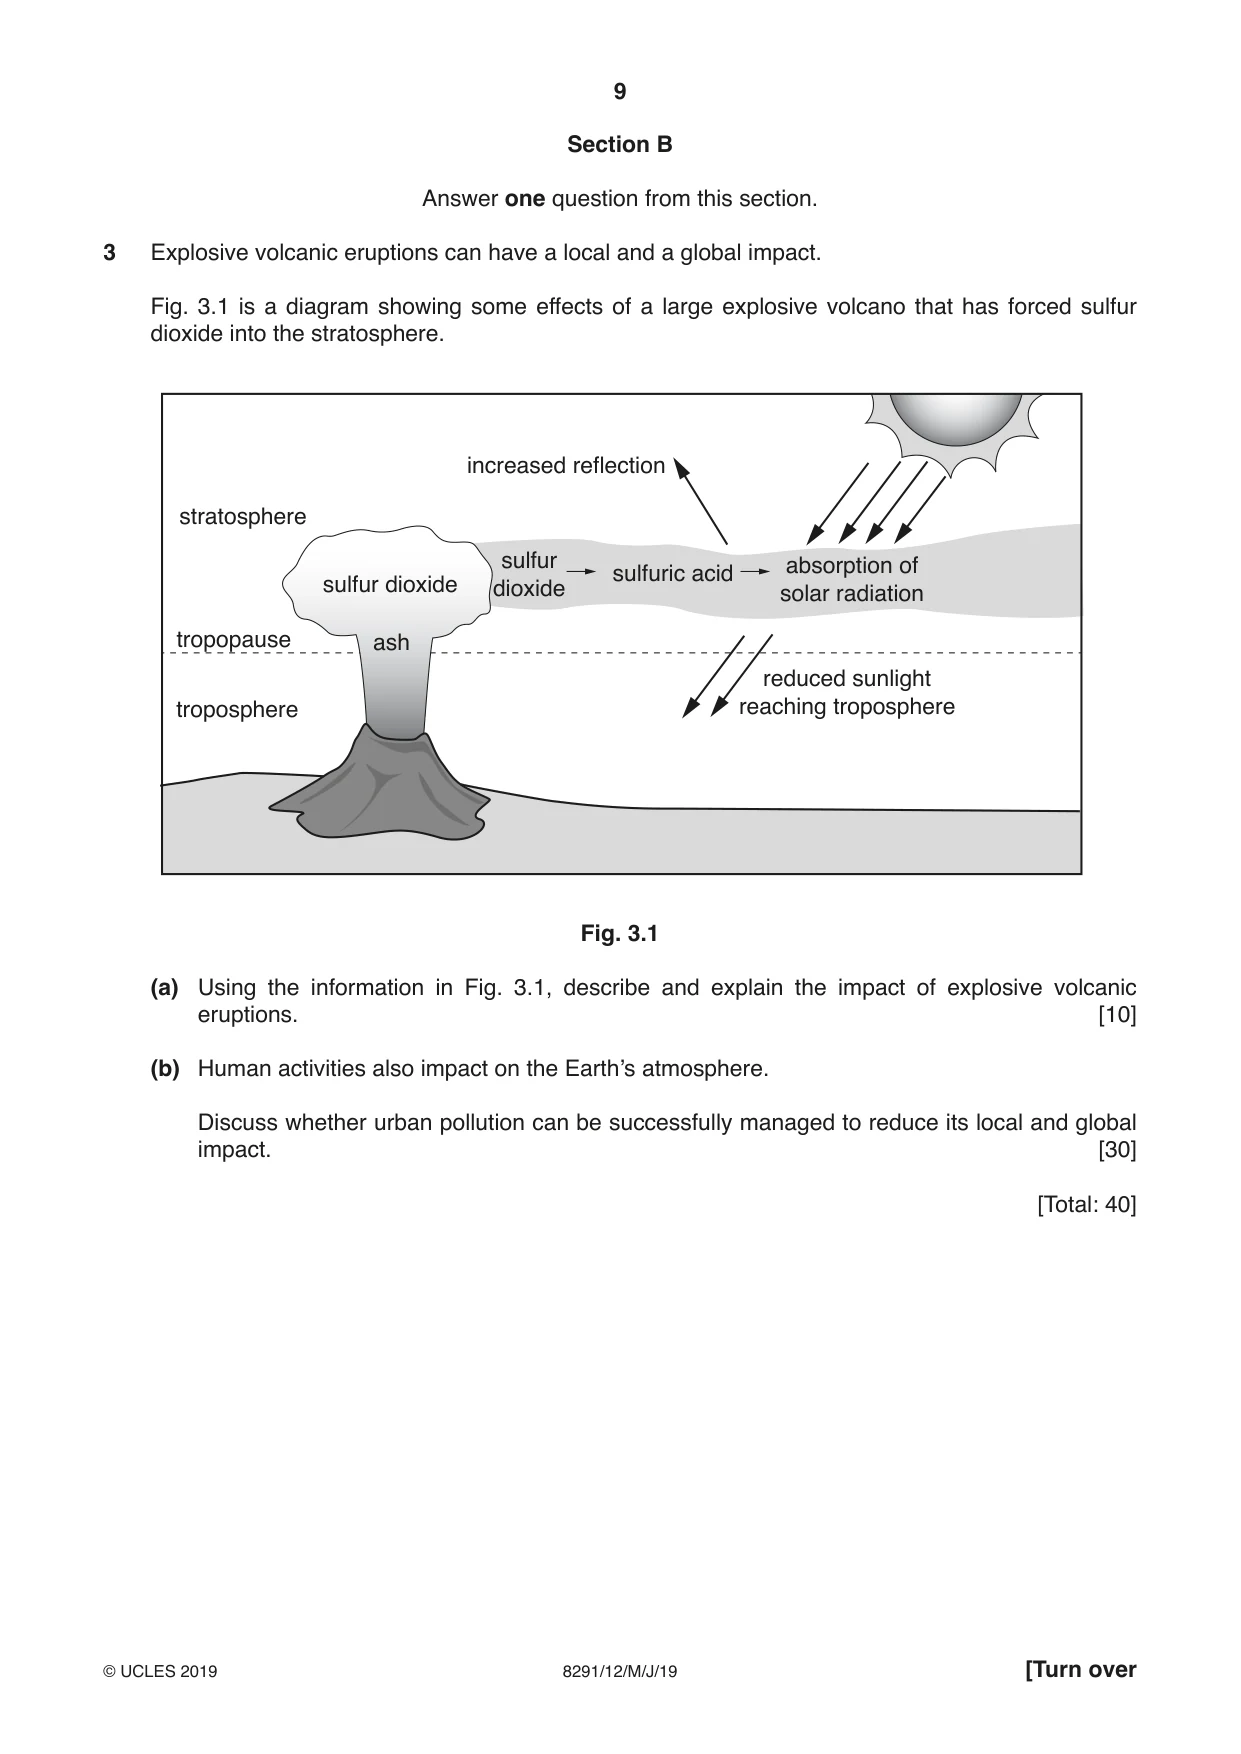
9 8291/12/M/J/19 © UCLES 2019 [Turn over Section B Answer one question from this section. 3 Explosive volcanic eruptions can have a local and a global impact. Fig. 3.1 is a diagram showing some effects of a large explosive volcano that has forced sulfur dioxide into the stratosphere. sulfur dioxide sulfur dioxide ash stratosphere increased reflection reduced sunlight reaching troposphere troposphere tropopause sulfuric acid absorption of solar radiation Fig. 3.1 (a) Using the information in Fig. 3.1, describe and explain the impact of explosive volcanic eruptions. [10] (b) Human activities also impact on the Earth’s atmosphere. Discuss whether urban pollution can be successfully managed to reduce its local and global impact. [30] [Total: 40]
Question paper, page 10
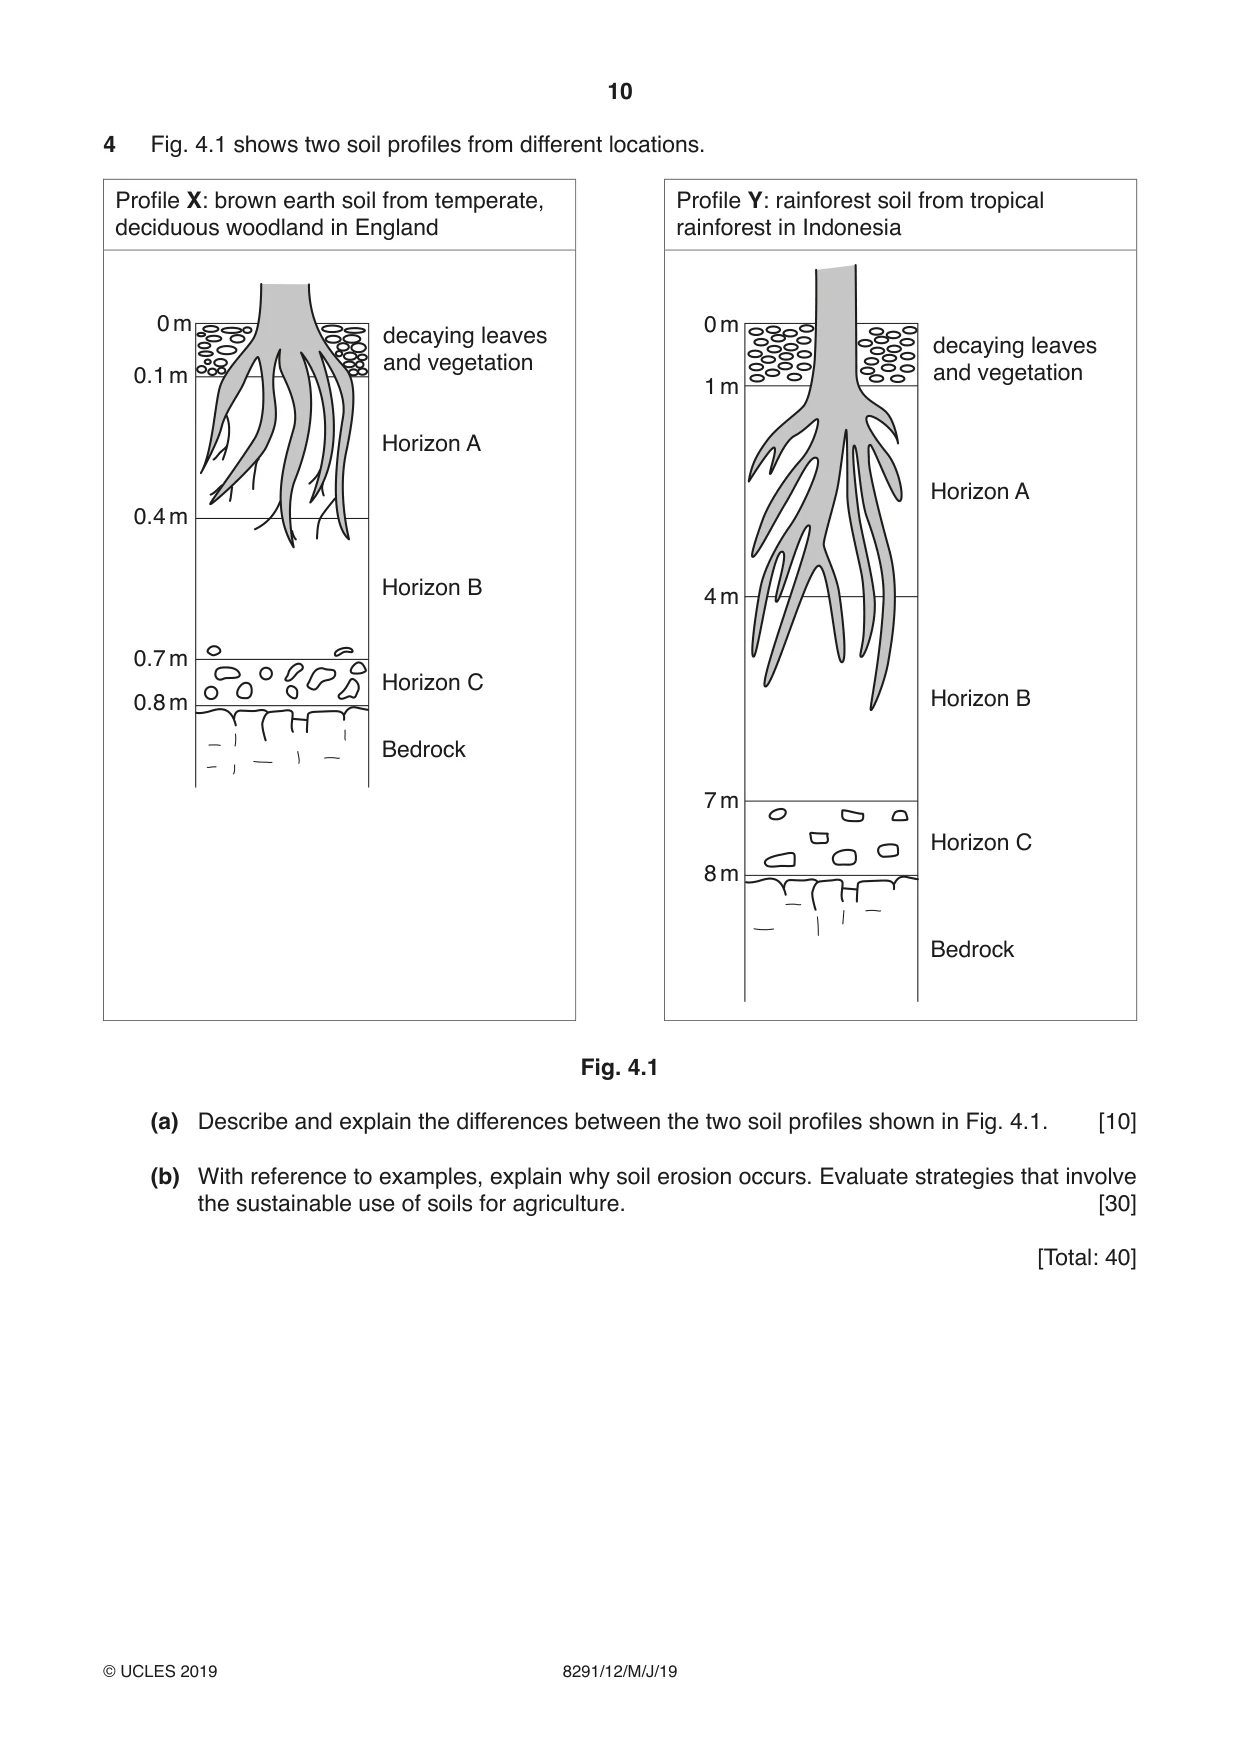
10 8291/12/M/J/19 © UCLES 2019 4 Fig. 4.1 shows two soil profiles from different locations. Profile X: brown earth soil from temperate, deciduous woodland in England Profile Y: rainforest soil from tropical rainforest in Indonesia 0 m 0.1 m Horizon A decaying leaves and vegetation Horizon B Horizon C Bedrock 0.4 m 0.7 m 0.8 m decaying leaves and vegetation Horizon A Horizon B Horizon C Bedrock 0 m 1 m 4 m 7 m 8 m Fig. 4.1 (a) Describe and explain the differences between the two soil profiles shown in Fig. 4.1. [10] (b) With reference to examples, explain why soil erosion occurs. Evaluate strategies that involve the sustainable use of soils for agriculture. [30] [Total: 40]
Question paper, page 11
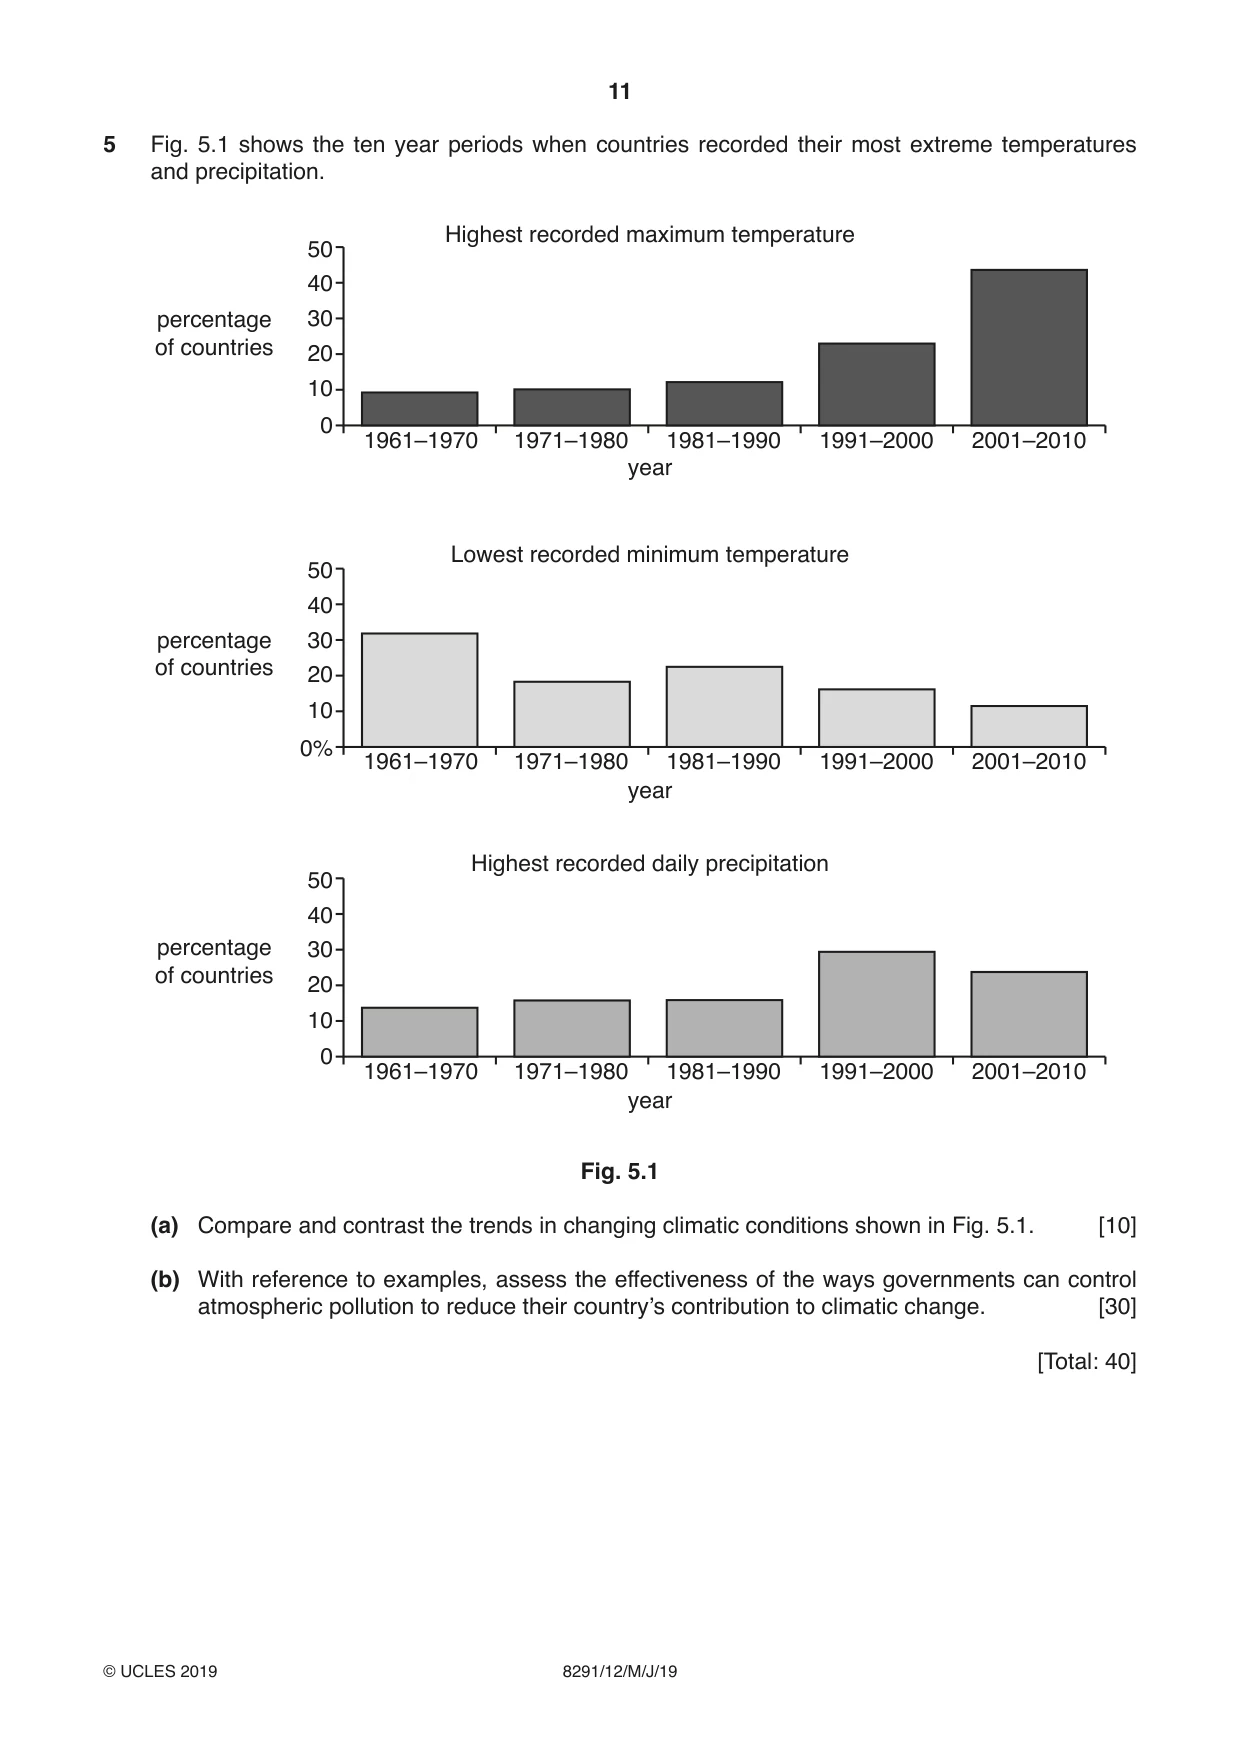
11 8291/12/M/J/19 © UCLES 2019 5 Fig. 5.1 shows the ten year periods when countries recorded their most extreme temperatures and precipitation. 50 40 30 20 10 0 1961–1970 1971–1980 1981–1990 Highest recorded maximum temperature Lowest recorded minimum temperature year year year Highest recorded daily precipitation 1991–2000 2001–2010 1961–1970 1971–1980 1981–1990 1991–2000 2001–2010 1961–1970 1971–1980 1981–1990 1991–2000 2001–2010 50 40 30 percentage of countries percentage of countries percentage of countries 20 10 0% 50 40 30 20 10 0 Fig. 5.1 (a) Compare and contrast the trends in changing climatic conditions shown in Fig. 5.1. [10] (b) With reference to examples, assess the effectiveness of the ways governments can control atmospheric pollution to reduce their country’s contribution to climatic change. [30] [Total: 40]
Question paper, page 12
12 8291/12/M/J/19 © UCLES 2019 Permission to reproduce items where third‑party owned material protected by copyright is included has been sought and cleared where possible. Every reasonable effort has been made by the publisher (UCLES) to trace copyright holders, but if any items requiring clearance have unwittingly been included, the publisher will be pleased to make amends at the earliest possible opportunity. To avoid the issue of disclosure of answer‑related information to candidates, all copyright acknowledgements are reproduced online in the Cambridge Assessment International Education Copyright Acknowledgements Booklet. This is produced for each series of examinations and is freely available to download at www.cambridgeinternational.org after the live examination series. Cambridge Assessment International Education is part of the Cambridge Assessment Group. Cambridge Assessment is the brand name of the University of Cambridge Local Examinations Syndicate (UCLES), which itself is a department of the University of Cambridge. BLANK PAGE
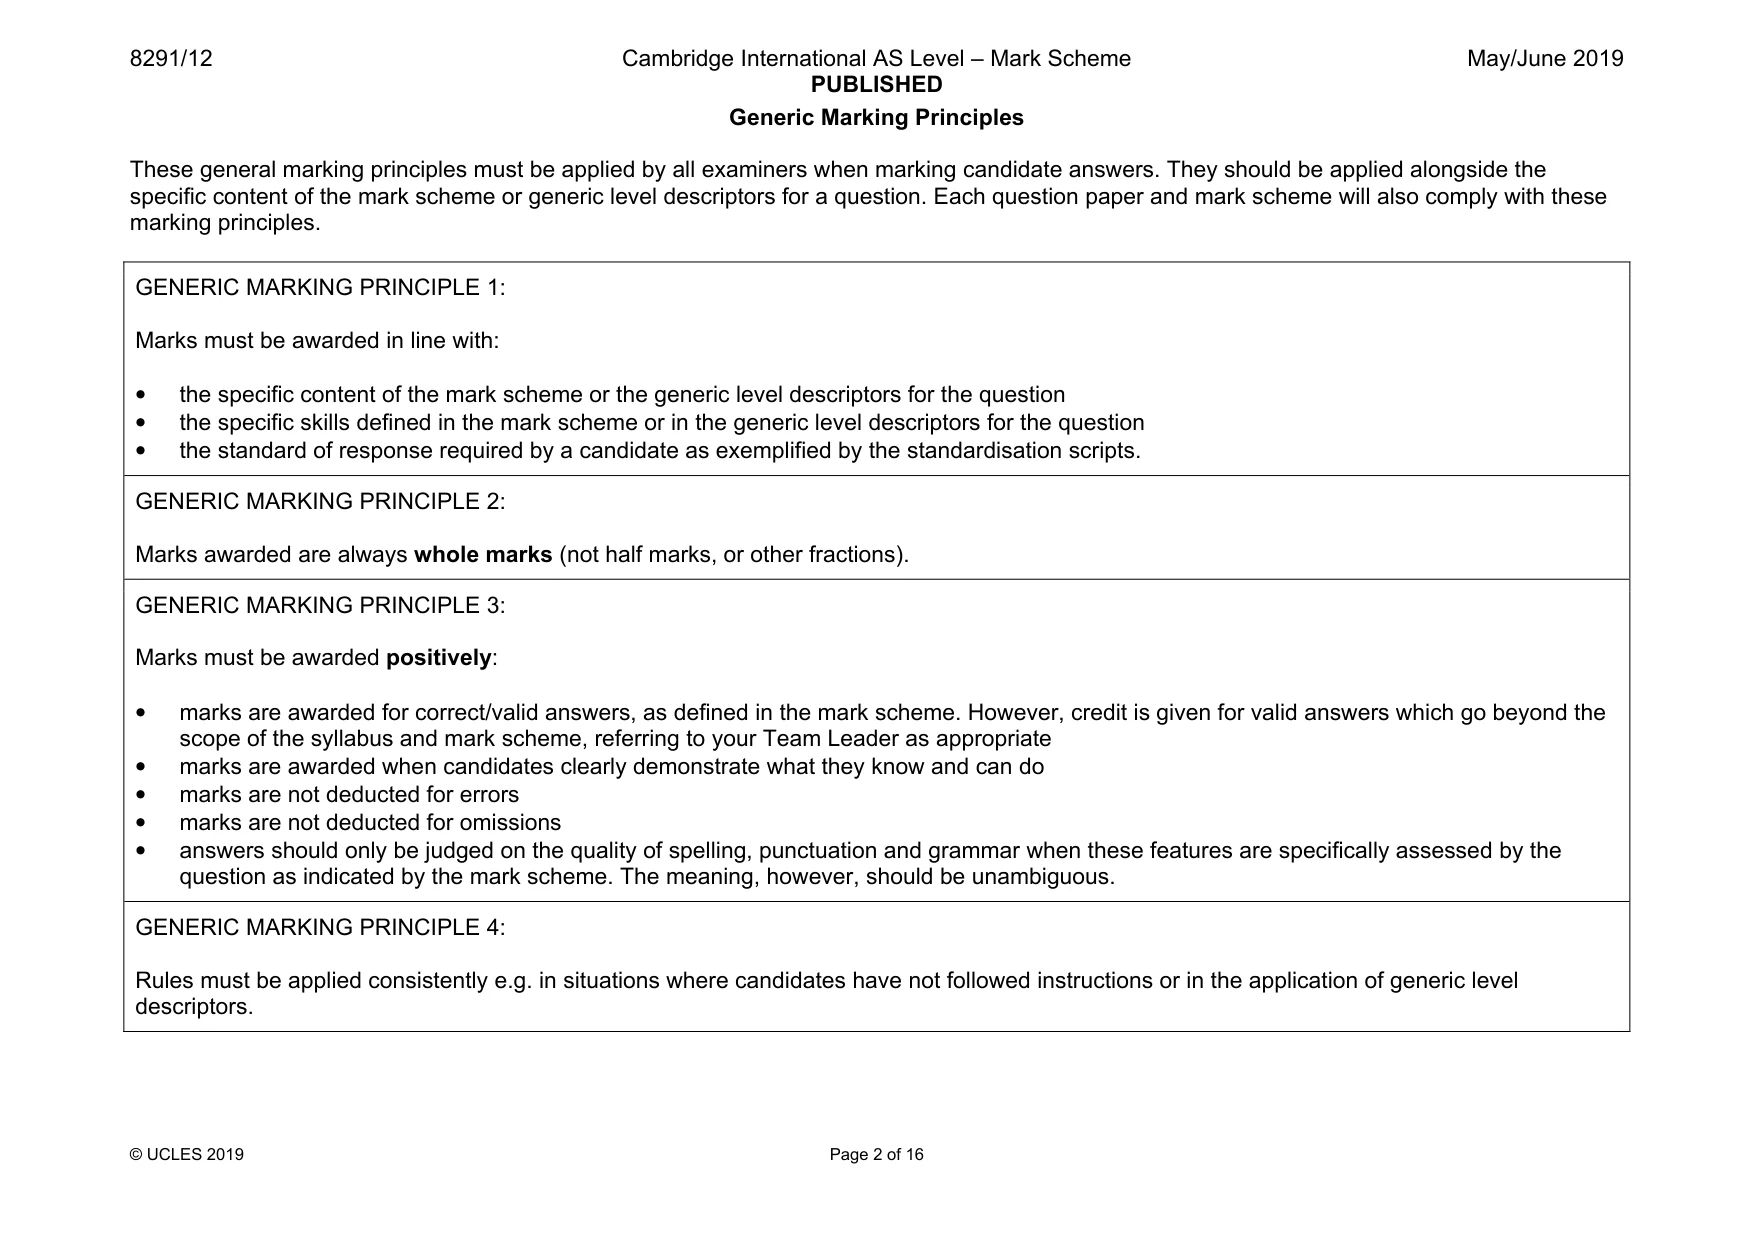
Mark scheme, page 1
This document consists of 16 printed pages. © UCLES 2019 [Turn over Cambridge Assessment International Education Cambridge International Advanced Subsidiary Level ENVIRONMENTAL MANAGEMENT 8291/12 Paper 1 May/June 2019 MARK SCHEME Maximum Mark: 80 Published This mark scheme is published as an aid to teachers and candidates, to indicate the requirements of the examination. It shows the basis on which Examiners were instructed to award marks. It does not indicate the details of the discussions that took place at an Examiners’ meeting before marking began, which would have considered the acceptability of alternative answers. Mark schemes should be read in conjunction with the question paper and the Principal Examiner Report for Teachers. Cambridge International will not enter into discussions about these mark schemes. Cambridge International is publishing the mark schemes for the May/June 2019 series for most Cambridge IGCSE™, Cambridge International A and AS Level and Cambridge Pre-U components, and some Cambridge O Level components.
Mark scheme, page 2
8291/12 Cambridge International AS Level – Mark Scheme PUBLISHED May/June 2019 © UCLES 2019 Page 2 of 16 Generic Marking Principles These general marking principles must be applied by all examiners when marking candidate answers. They should be applied alongside the specific content of the mark scheme or generic level descriptors for a question. Each question paper and mark scheme will also comply with these marking principles. GENERIC MARKING PRINCIPLE 1: Marks must be awarded in line with: • the specific content of the mark scheme or the generic level descriptors for the question • the specific skills defined in the mark scheme or in the generic level descriptors for the question • the standard of response required by a candidate as exemplified by the standardisation scripts. GENERIC MARKING PRINCIPLE 2: Marks awarded are always whole marks (not half marks, or other fractions). GENERIC MARKING PRINCIPLE 3: Marks must be awarded positively: • marks are awarded for correct/valid answers, as defined in the mark scheme. However, credit is given for valid answers which go beyond the scope of the syllabus and mark scheme, referring to your Team Leader as appropriate • marks are awarded when candidates clearly demonstrate what they know and can do • marks are not deducted for errors • marks are not deducted for omissions • answers should only be judged on the quality of spelling, punctuation and grammar when these features are specifically assessed by the question as indicated by the mark scheme. The meaning, however, should be unambiguous. GENERIC MARKING PRINCIPLE 4: Rules must be applied consistently e.g. in situations where candidates have not followed instructions or in the application of generic level descriptors.
Mark scheme, page 3
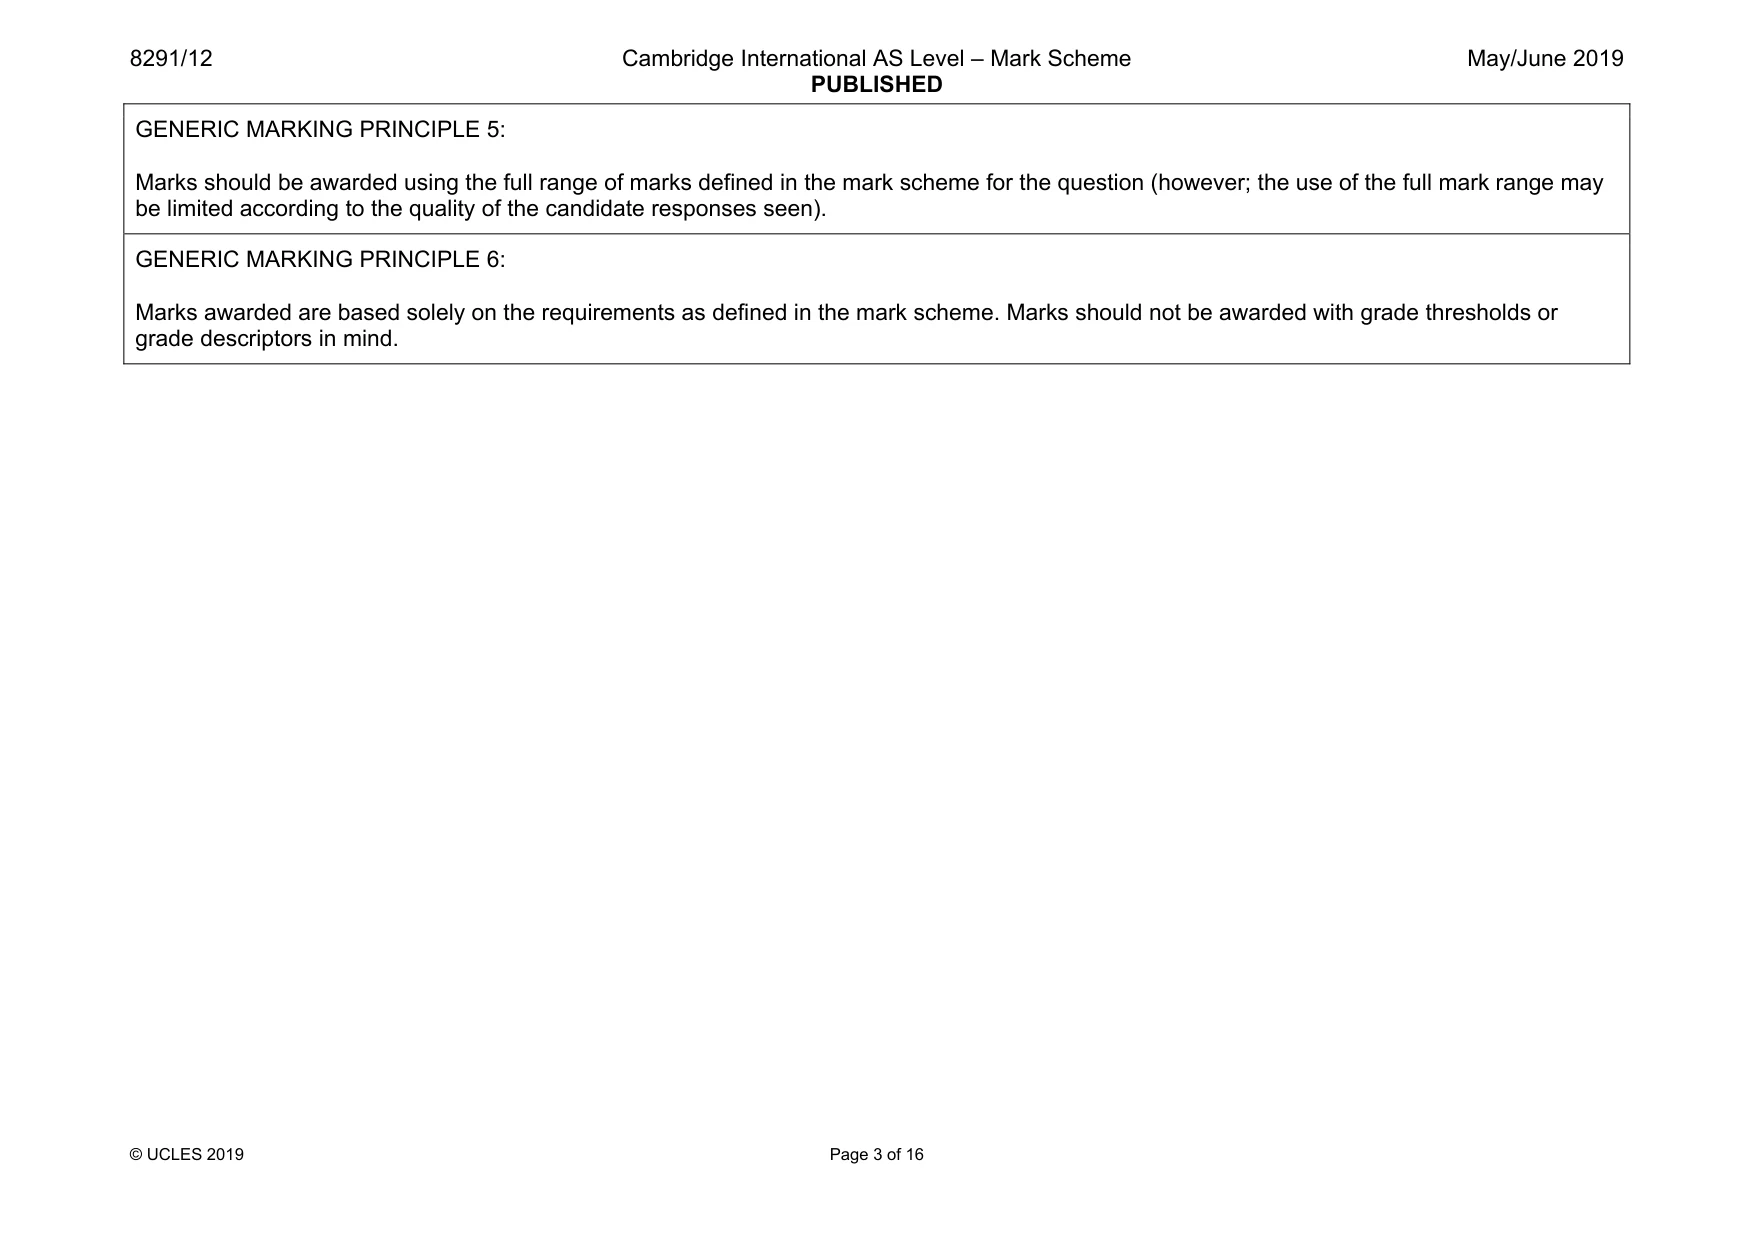
8291/12 Cambridge International AS Level – Mark Scheme PUBLISHED May/June 2019 © UCLES 2019 Page 3 of 16 GENERIC MARKING PRINCIPLE 5: Marks should be awarded using the full range of marks defined in the mark scheme for the question (however; the use of the full mark range may be limited according to the quality of the candidate responses seen). GENERIC MARKING PRINCIPLE 6: Marks awarded are based solely on the requirements as defined in the mark scheme. Marks should not be awarded with grade thresholds or grade descriptors in mind.
Mark scheme, page 4
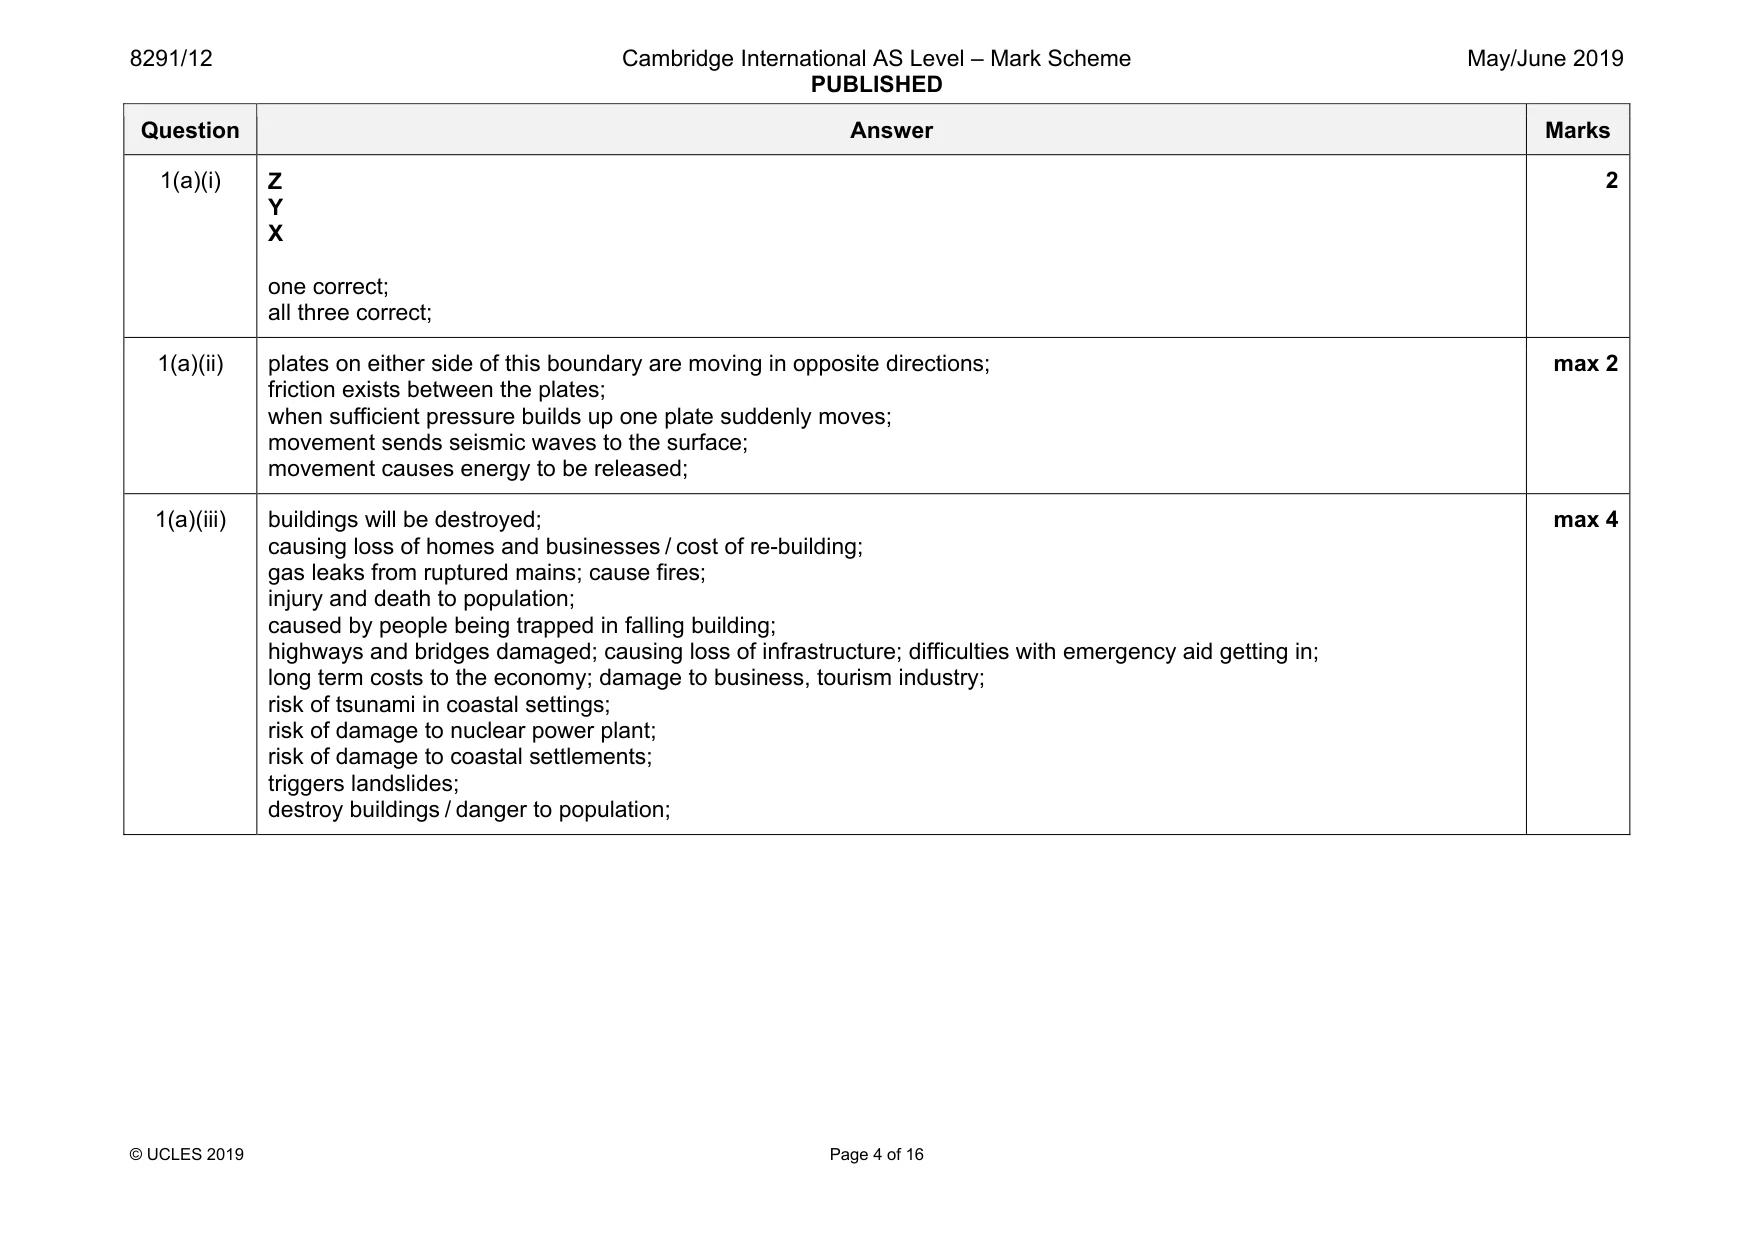
8291/12 Cambridge International AS Level – Mark Scheme PUBLISHED May/June 2019 © UCLES 2019 Page 4 of 16 Question Answer Marks 1(a)(i) Z Y X one correct; all three correct; 2 1(a)(ii) plates on either side of this boundary are moving in opposite directions; friction exists between the plates; when sufficient pressure builds up one plate suddenly moves; movement sends seismic waves to the surface; movement causes energy to be released; max 2 1(a)(iii) buildings will be destroyed; causing loss of homes and businesses / cost of re-building; gas leaks from ruptured mains; cause fires; injury and death to population; caused by people being trapped in falling building; highways and bridges damaged; causing loss of infrastructure; difficulties with emergency aid getting in; long term costs to the economy; damage to business, tourism industry; risk of tsunami in coastal settings; risk of damage to nuclear power plant; risk of damage to coastal settlements; triggers landslides; destroy buildings / danger to population; max 4
Mark scheme, page 5
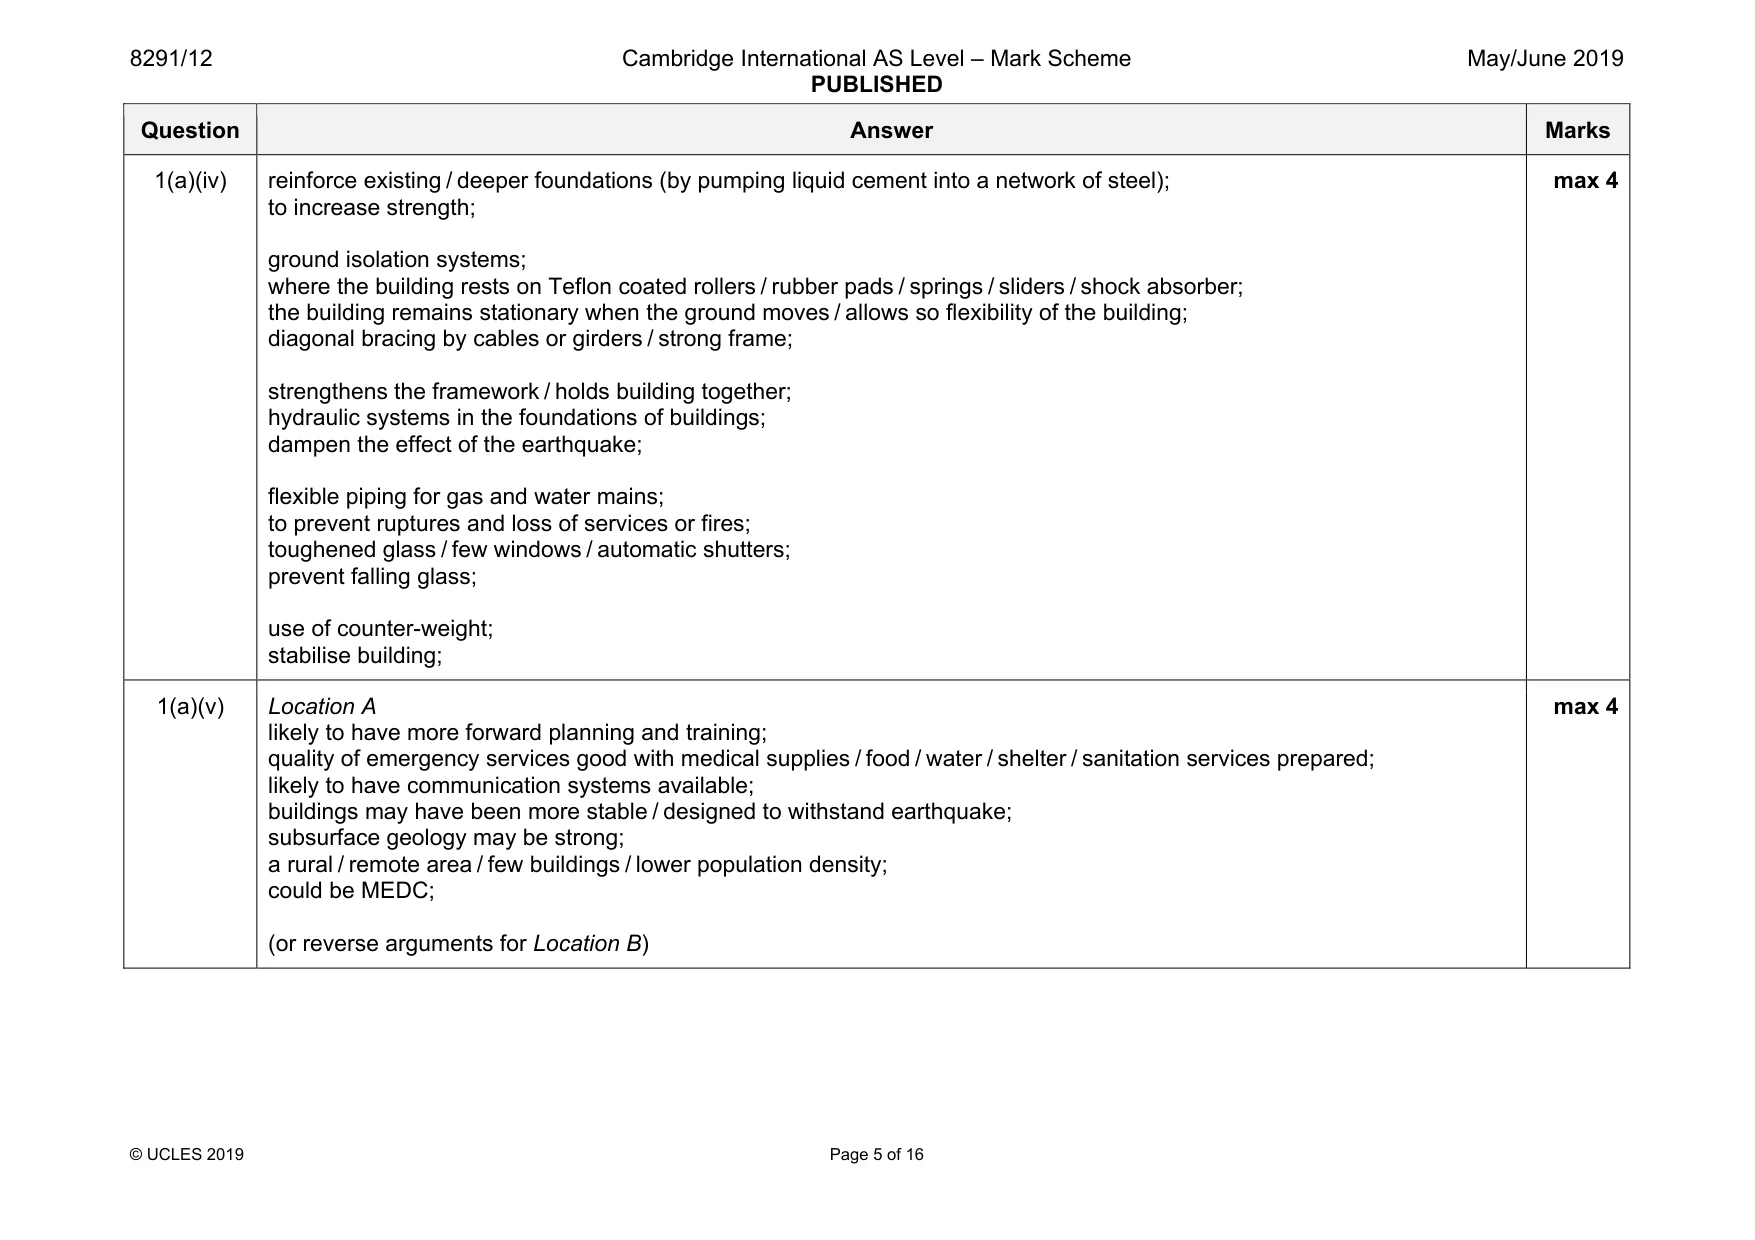
8291/12 Cambridge International AS Level – Mark Scheme PUBLISHED May/June 2019 © UCLES 2019 Page 5 of 16 Question Answer Marks 1(a)(iv) reinforce existing / deeper foundations (by pumping liquid cement into a network of steel); to increase strength; ground isolation systems; where the building rests on Teflon coated rollers / rubber pads / springs / sliders / shock absorber; the building remains stationary when the ground moves / allows so flexibility of the building; diagonal bracing by cables or girders / strong frame; strengthens the framework / holds building together; hydraulic systems in the foundations of buildings; dampen the effect of the earthquake; flexible piping for gas and water mains; to prevent ruptures and loss of services or fires; toughened glass / few windows / automatic shutters; prevent falling glass; use of counter-weight; stabilise building; max 4 1(a)(v) Location A likely to have more forward planning and training; quality of emergency services good with medical supplies / food / water / shelter / sanitation services prepared; likely to have communication systems available; buildings may have been more stable / designed to withstand earthquake; subsurface geology may be strong; a rural / remote area / few buildings / lower population density; could be MEDC; (or reverse arguments for Location B) max 4
Mark scheme, page 6
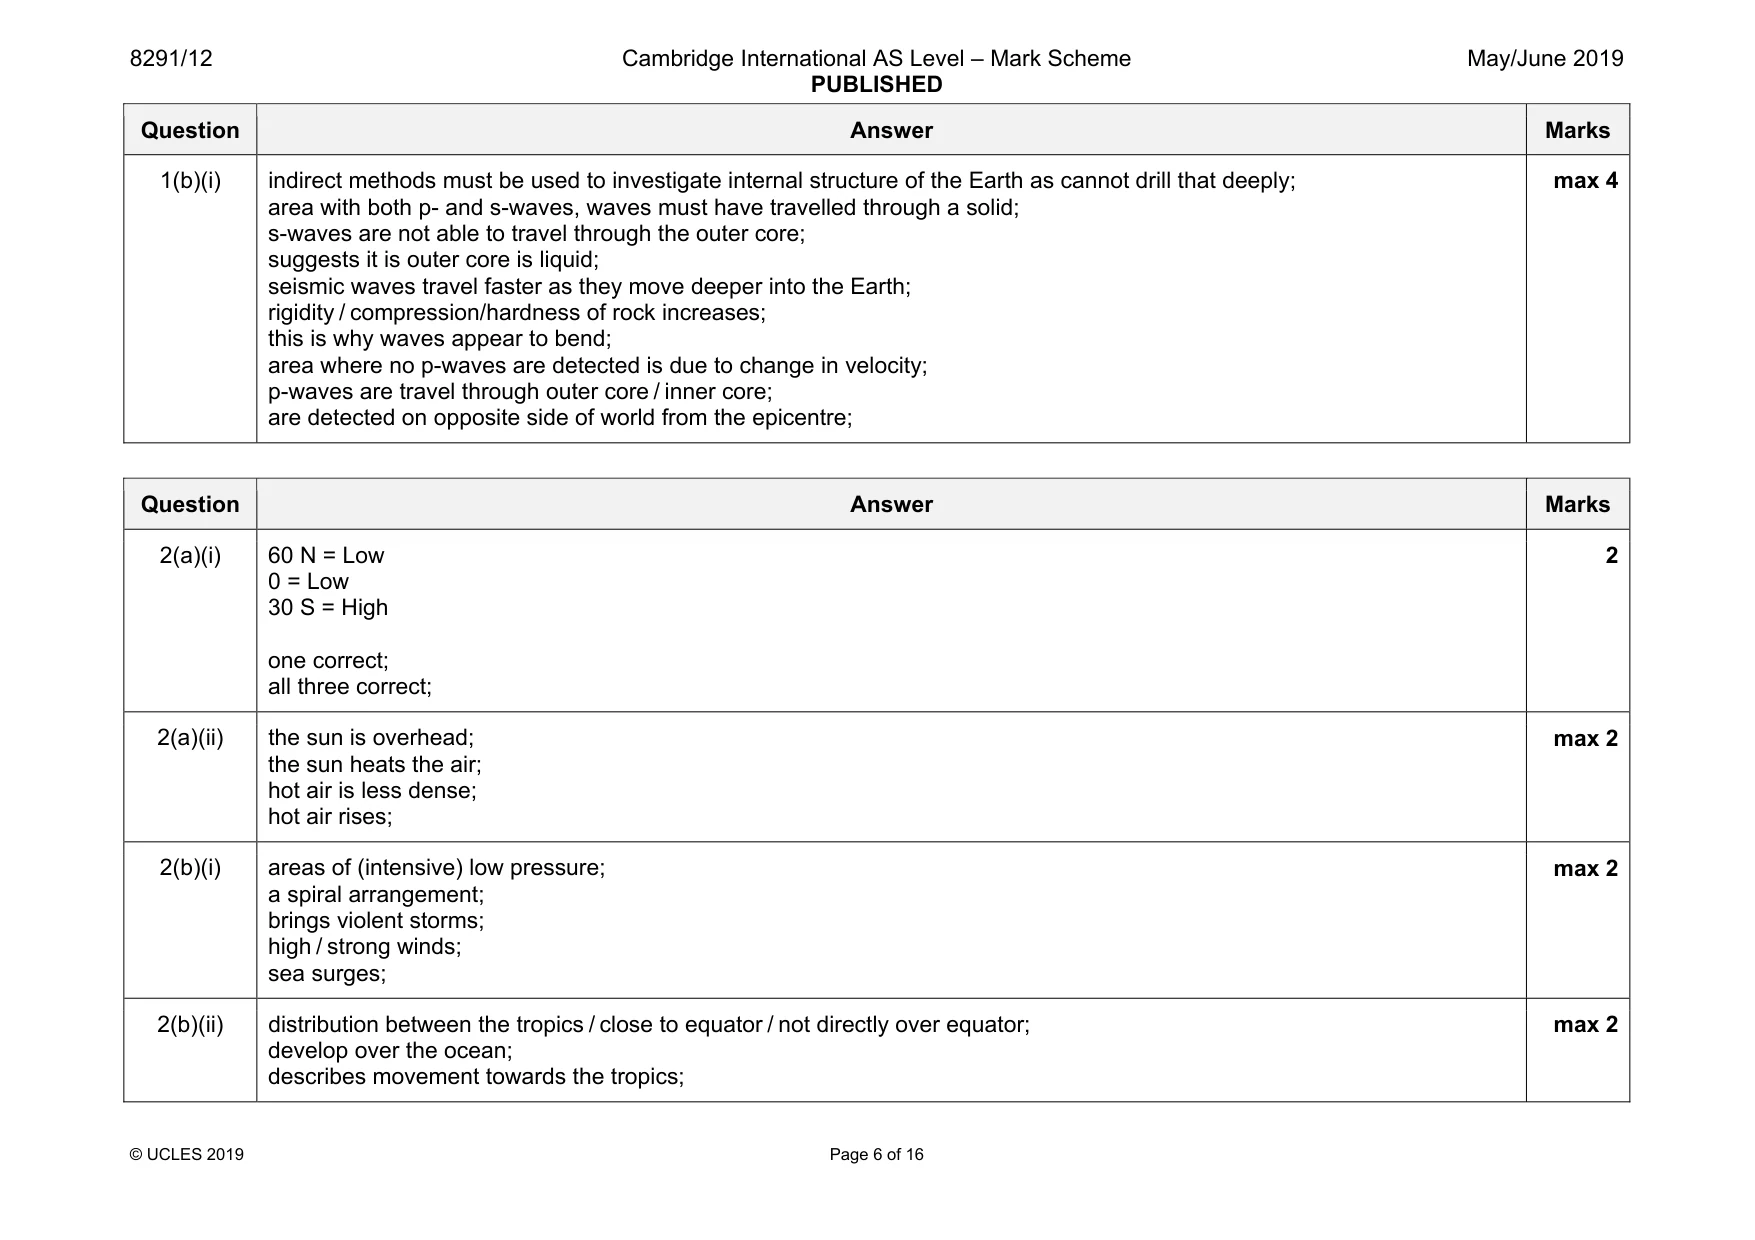
8291/12 Cambridge International AS Level – Mark Scheme PUBLISHED May/June 2019 © UCLES 2019 Page 6 of 16 Question Answer Marks 1(b)(i) indirect methods must be used to investigate internal structure of the Earth as cannot drill that deeply; area with both p- and s-waves, waves must have travelled through a solid; s-waves are not able to travel through the outer core; suggests it is outer core is liquid; seismic waves travel faster as they move deeper into the Earth; rigidity / compression/hardness of rock increases; this is why waves appear to bend; area where no p-waves are detected is due to change in velocity; p-waves are travel through outer core / inner core; are detected on opposite side of world from the epicentre; max 4 Question Answer Marks 2(a)(i) 60 N = Low 0 = Low 30 S = High one correct; all three correct; 2 2(a)(ii) the sun is overhead; the sun heats the air; hot air is less dense; hot air rises; max 2 2(b)(i) areas of (intensive) low pressure; a spiral arrangement; brings violent storms; high / strong winds; sea surges; max 2 2(b)(ii) distribution between the tropics / close to equator / not directly over equator; develop over the ocean; describes movement towards the tropics; max 2
Mark scheme, page 7
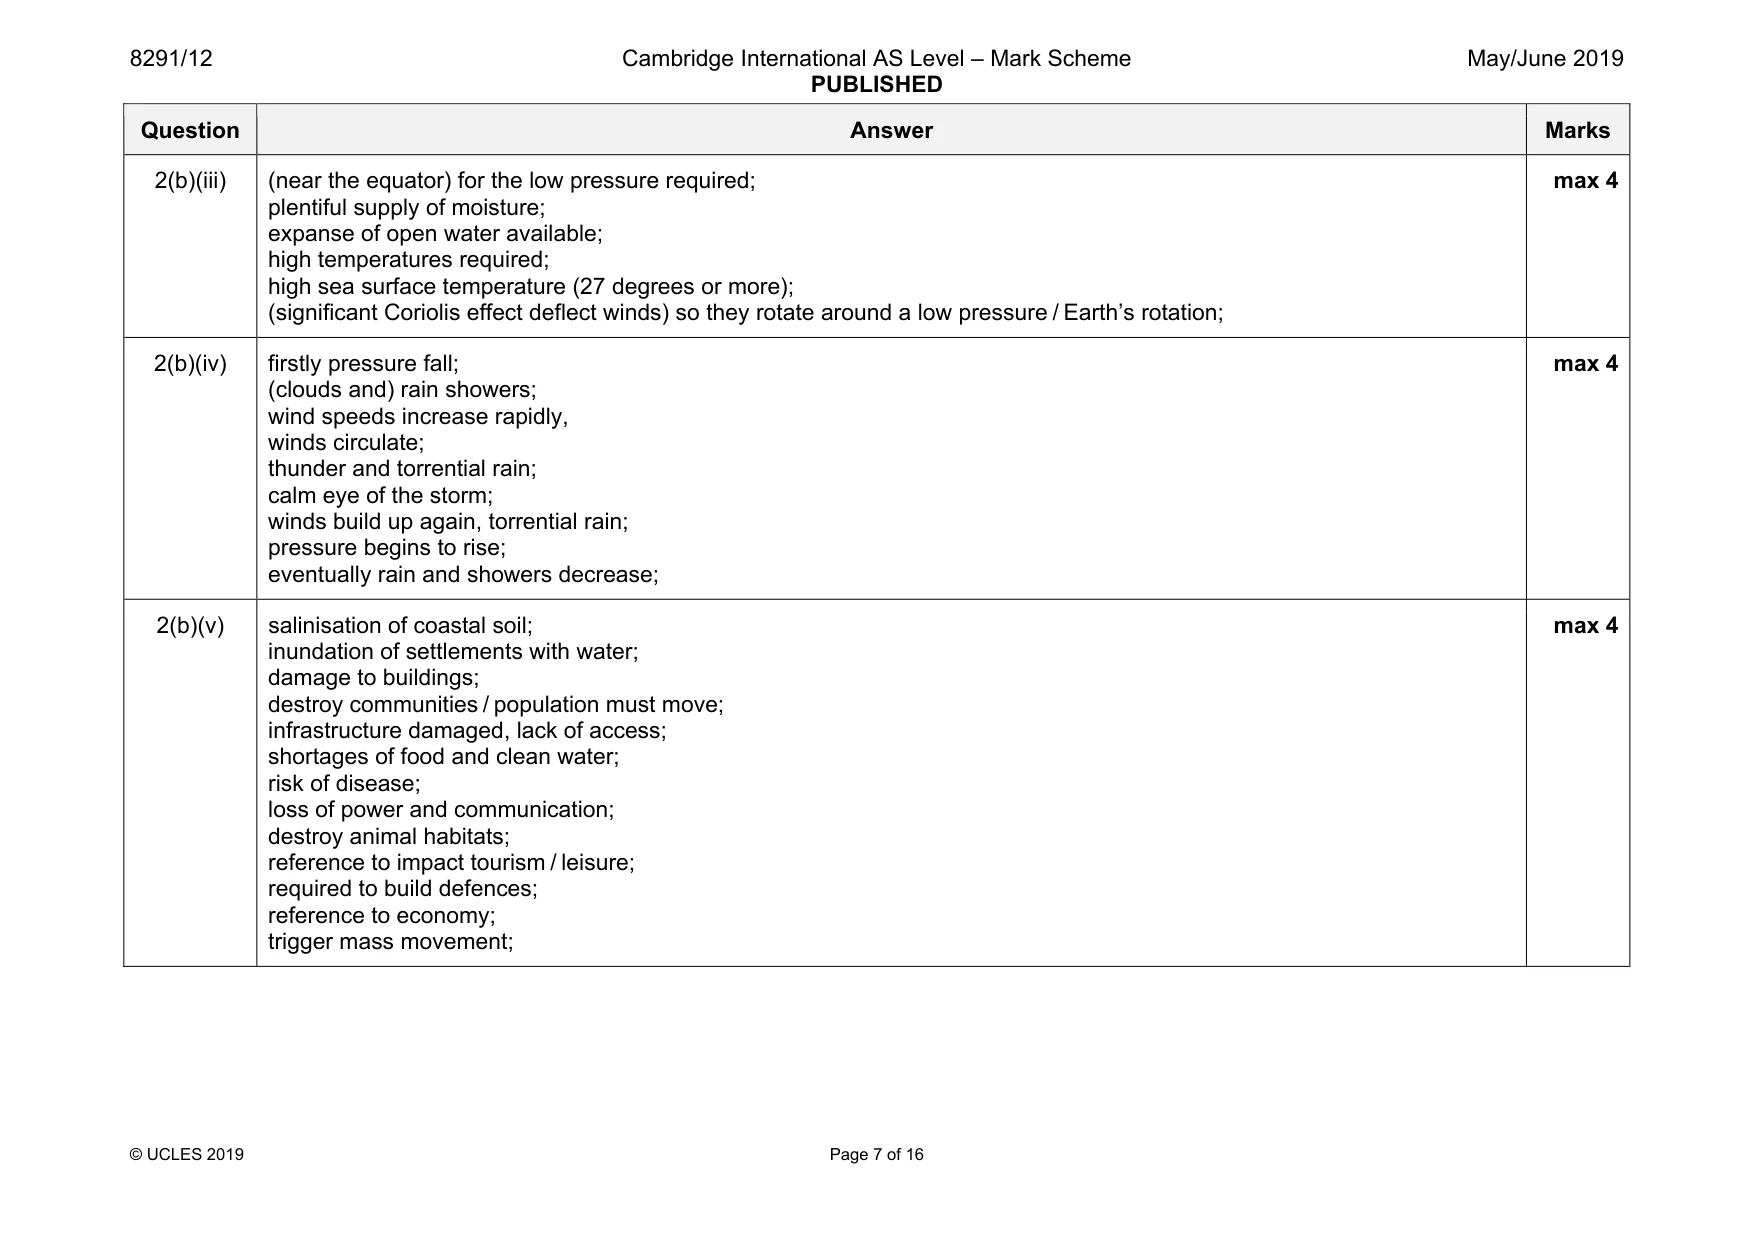
8291/12 Cambridge International AS Level – Mark Scheme PUBLISHED May/June 2019 © UCLES 2019 Page 7 of 16 Question Answer Marks 2(b)(iii) (near the equator) for the low pressure required; plentiful supply of moisture; expanse of open water available; high temperatures required; high sea surface temperature (27 degrees or more); (significant Coriolis effect deflect winds) so they rotate around a low pressure / Earth’s rotation; max 4 2(b)(iv) firstly pressure fall; (clouds and) rain showers; wind speeds increase rapidly, winds circulate; thunder and torrential rain; calm eye of the storm; winds build up again, torrential rain; pressure begins to rise; eventually rain and showers decrease; max 4 2(b)(v) salinisation of coastal soil; inundation of settlements with water; damage to buildings; destroy communities / population must move; infrastructure damaged, lack of access; shortages of food and clean water; risk of disease; loss of power and communication; destroy animal habitats; reference to impact tourism / leisure; required to build defences; reference to economy; trigger mass movement; max 4
Mark scheme, page 8
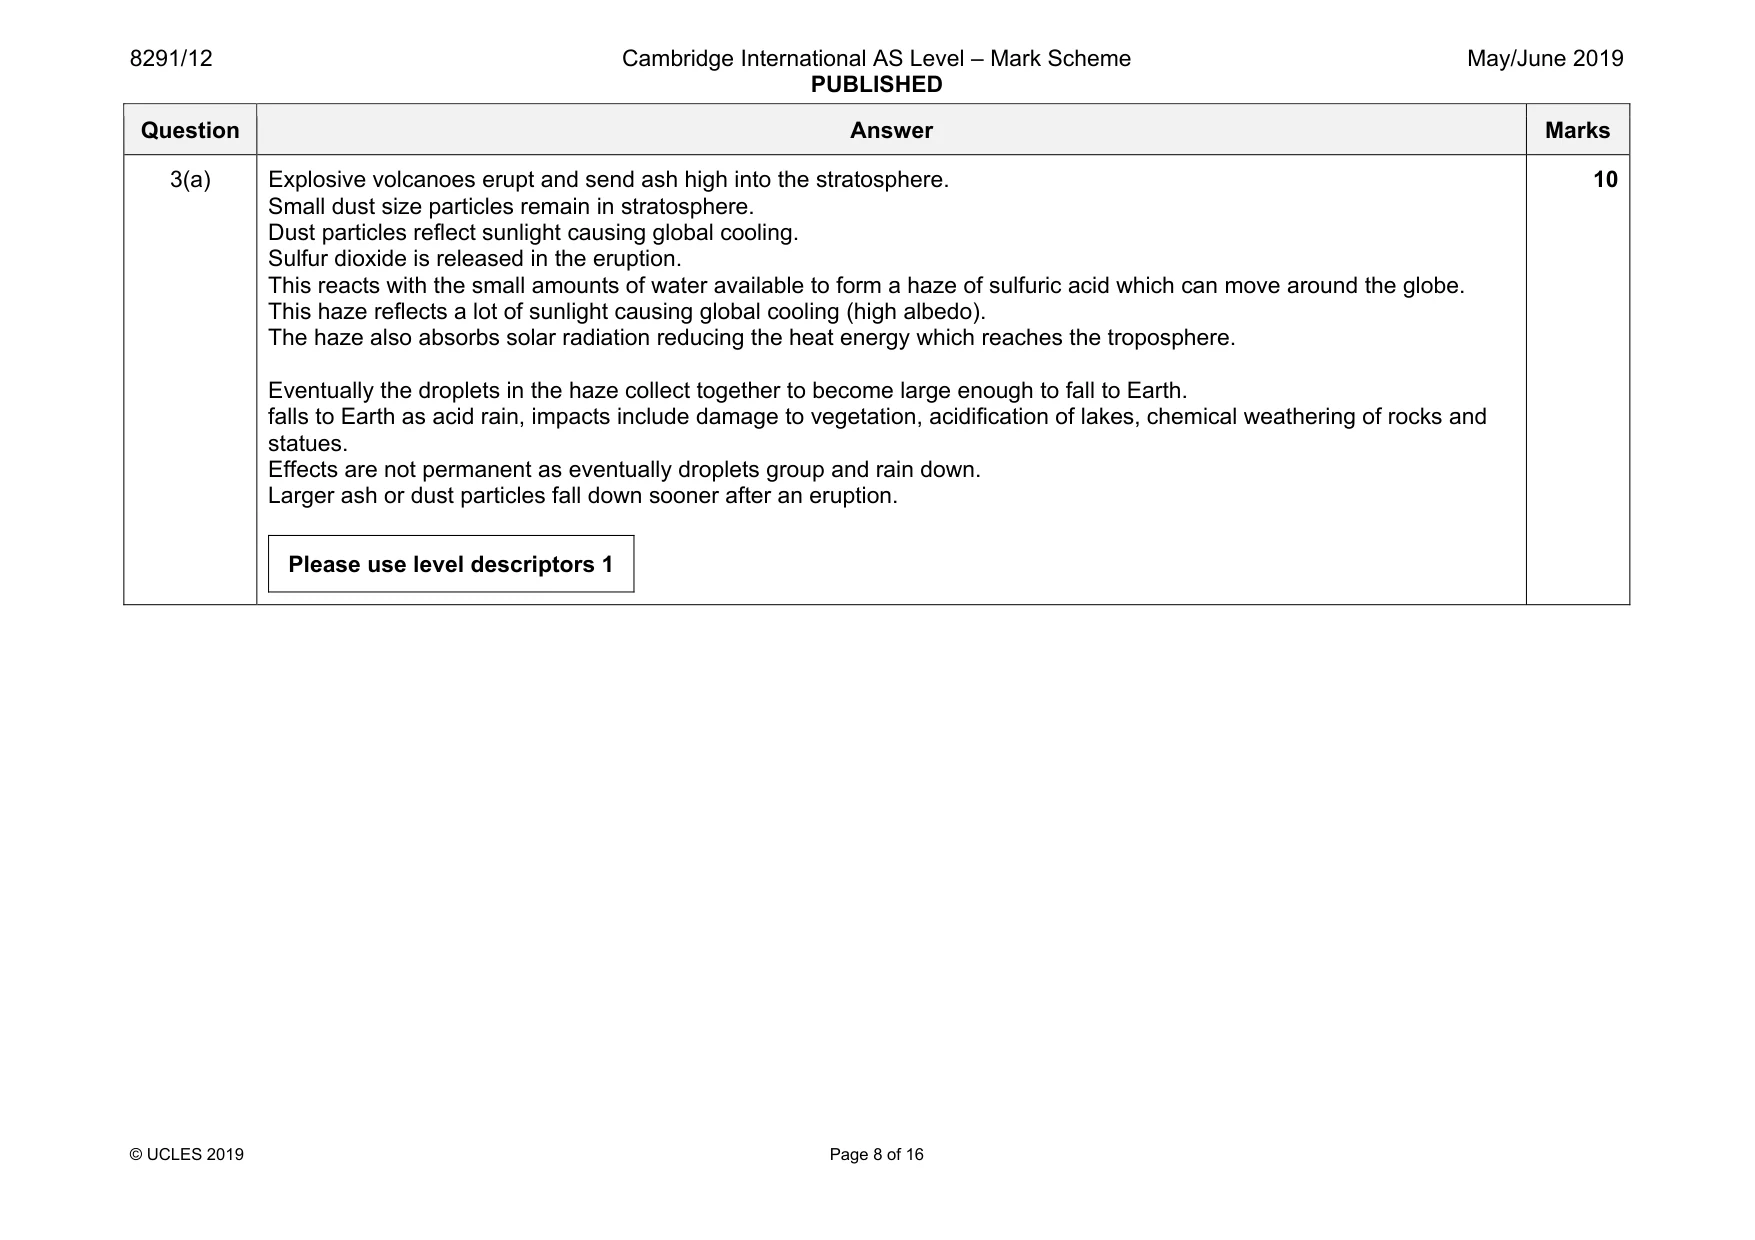
8291/12 Cambridge International AS Level – Mark Scheme PUBLISHED May/June 2019 © UCLES 2019 Page 8 of 16 Question Answer Marks 3(a) Explosive volcanoes erupt and send ash high into the stratosphere. Small dust size particles remain in stratosphere. Dust particles reflect sunlight causing global cooling. Sulfur dioxide is released in the eruption. This reacts with the small amounts of water available to form a haze of sulfuric acid which can move around the globe. This haze reflects a lot of sunlight causing global cooling (high albedo). The haze also absorbs solar radiation reducing the heat energy which reaches the troposphere. Eventually the droplets in the haze collect together to become large enough to fall to Earth. falls to Earth as acid rain, impacts include damage to vegetation, acidification of lakes, chemical weathering of rocks and statues. Effects are not permanent as eventually droplets group and rain down. Larger ash or dust particles fall down sooner after an eruption. Please use level descriptors 1 10
Mark scheme, page 9
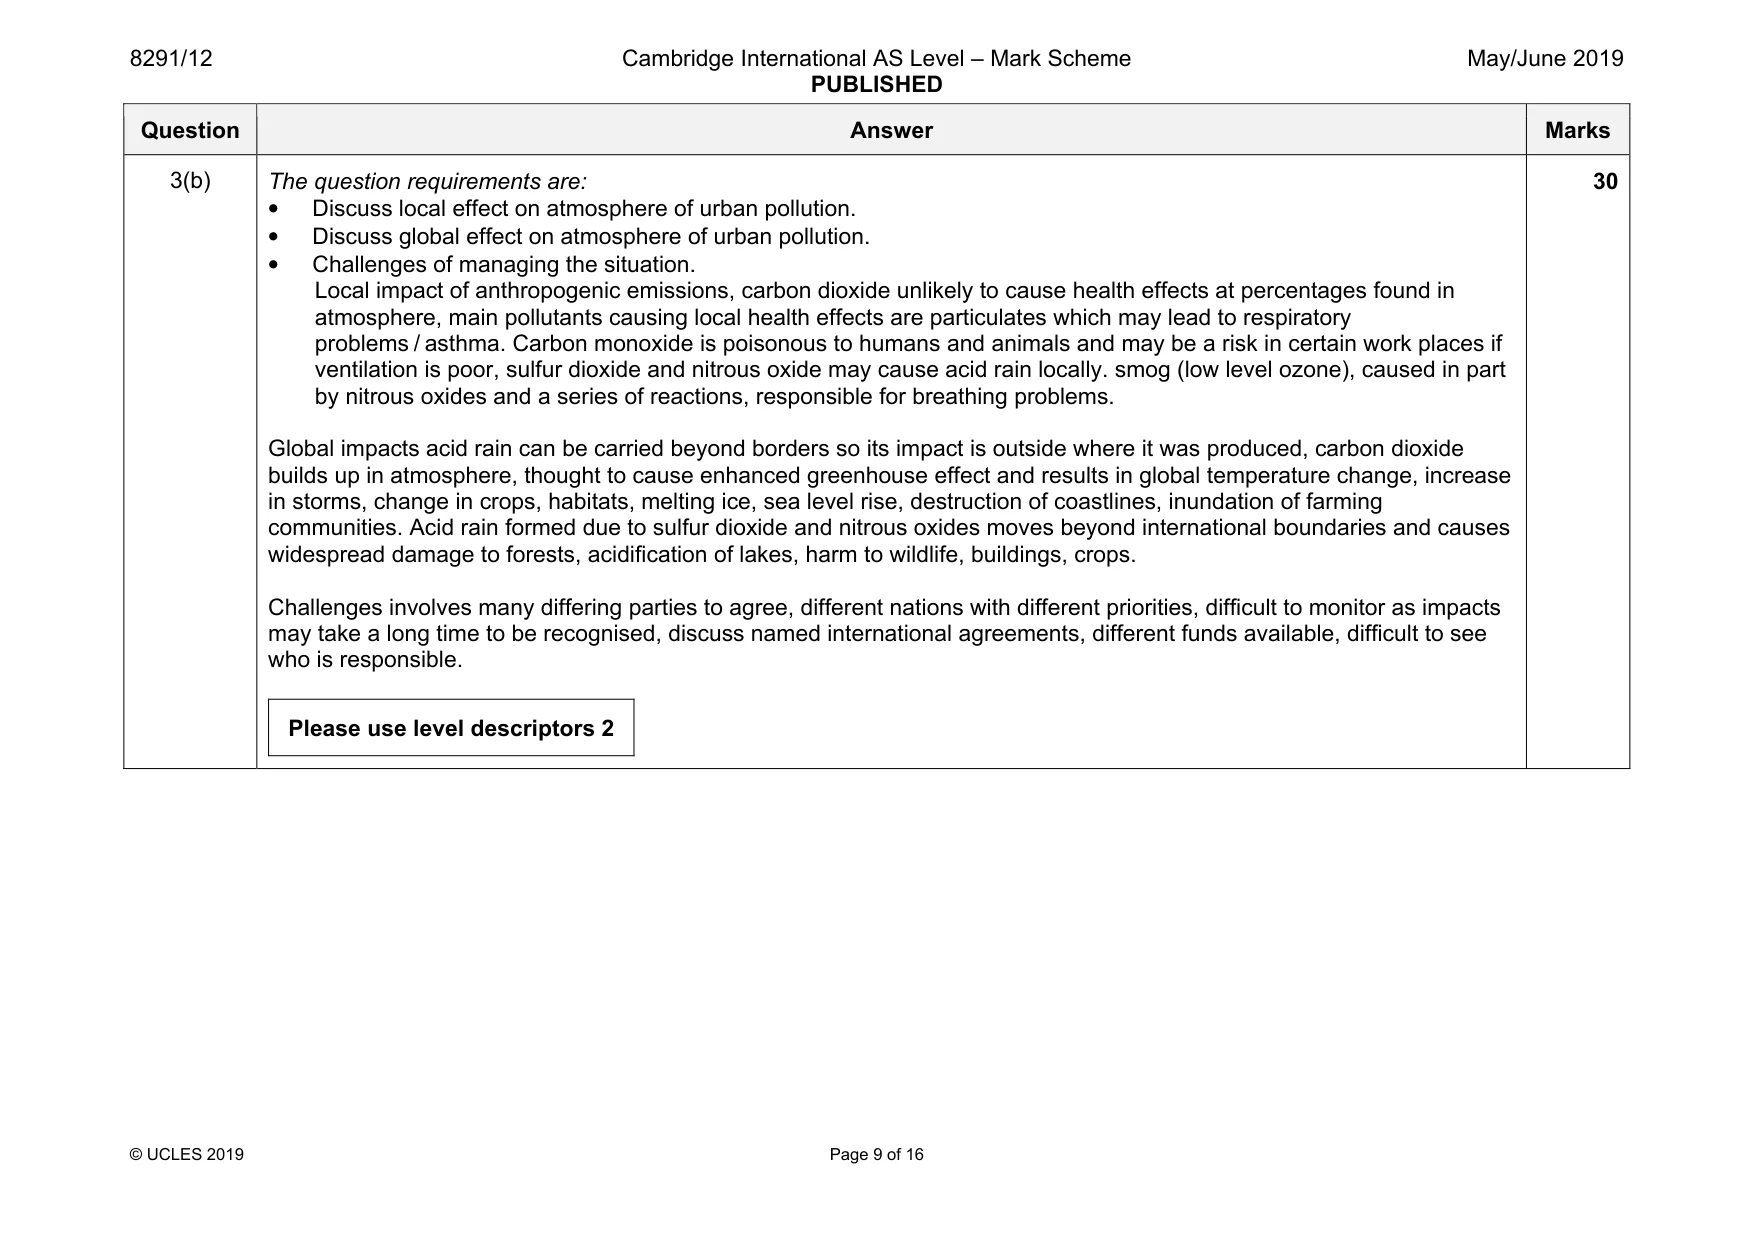
8291/12 Cambridge International AS Level – Mark Scheme PUBLISHED May/June 2019 © UCLES 2019 Page 9 of 16 Question Answer Marks 3(b) The question requirements are: • Discuss local effect on atmosphere of urban pollution. • Discuss global effect on atmosphere of urban pollution. • Challenges of managing the situation. Local impact of anthropogenic emissions, carbon dioxide unlikely to cause health effects at percentages found in atmosphere, main pollutants causing local health effects are particulates which may lead to respiratory problems / asthma. Carbon monoxide is poisonous to humans and animals and may be a risk in certain work places if ventilation is poor, sulfur dioxide and nitrous oxide may cause acid rain locally. smog (low level ozone), caused in part by nitrous oxides and a series of reactions, responsible for breathing problems. Global impacts acid rain can be carried beyond borders so its impact is outside where it was produced, carbon dioxide builds up in atmosphere, thought to cause enhanced greenhouse effect and results in global temperature change, increase in storms, change in crops, habitats, melting ice, sea level rise, destruction of coastlines, inundation of farming communities. Acid rain formed due to sulfur dioxide and nitrous oxides moves beyond international boundaries and causes widespread damage to forests, acidification of lakes, harm to wildlife, buildings, crops. Challenges involves many differing parties to agree, different nations with different priorities, difficult to monitor as impacts may take a long time to be recognised, discuss named international agreements, different funds available, difficult to see who is responsible. Please use level descriptors 2 30
Mark scheme, page 10
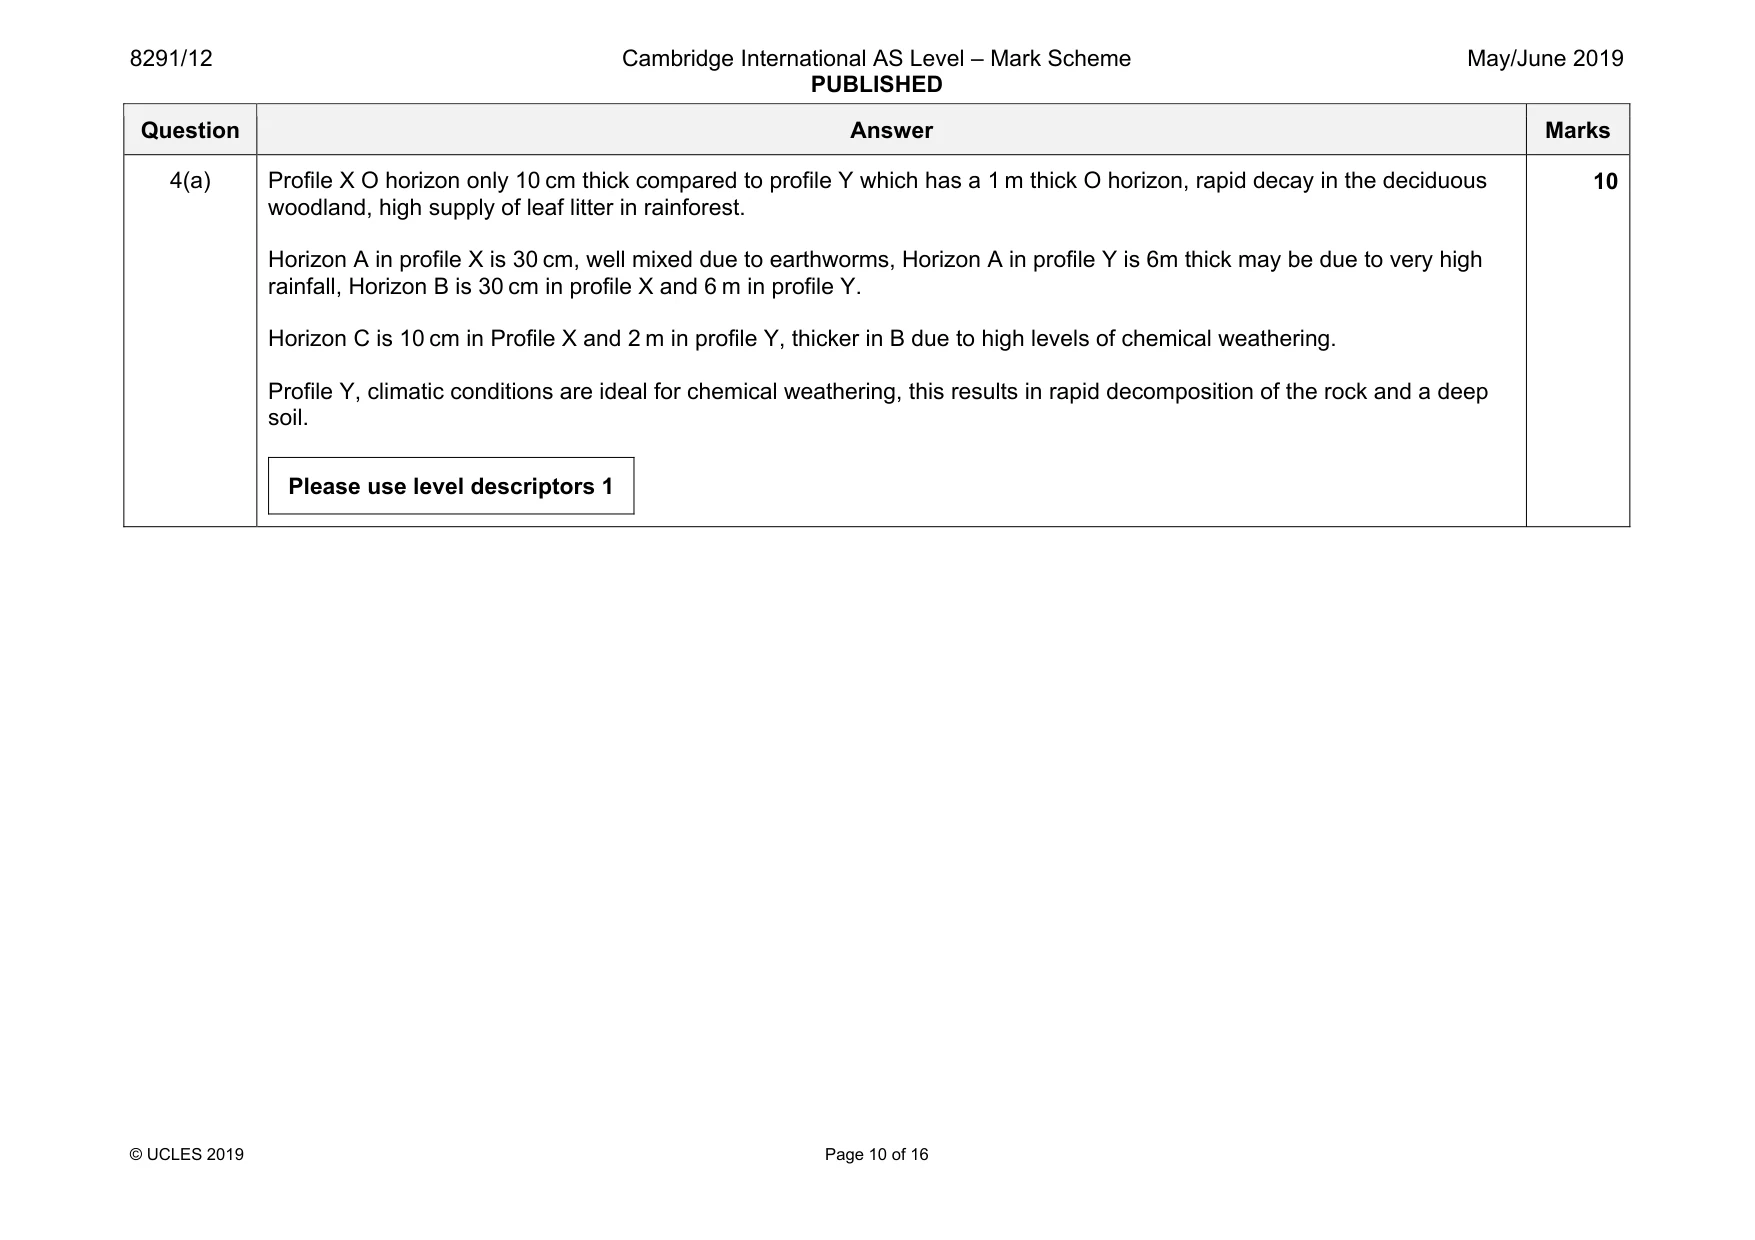
8291/12 Cambridge International AS Level – Mark Scheme PUBLISHED May/June 2019 © UCLES 2019 Page 10 of 16 Question Answer Marks 4(a) Profile X O horizon only 10 cm thick compared to profile Y which has a 1 m thick O horizon, rapid decay in the deciduous woodland, high supply of leaf litter in rainforest. Horizon A in profile X is 30 cm, well mixed due to earthworms, Horizon A in profile Y is 6m thick may be due to very high rainfall, Horizon B is 30 cm in profile X and 6 m in profile Y. Horizon C is 10 cm in Profile X and 2 m in profile Y, thicker in B due to high levels of chemical weathering. Profile Y, climatic conditions are ideal for chemical weathering, this results in rapid decomposition of the rock and a deep soil. Please use level descriptors 1 10
Mark scheme, page 11
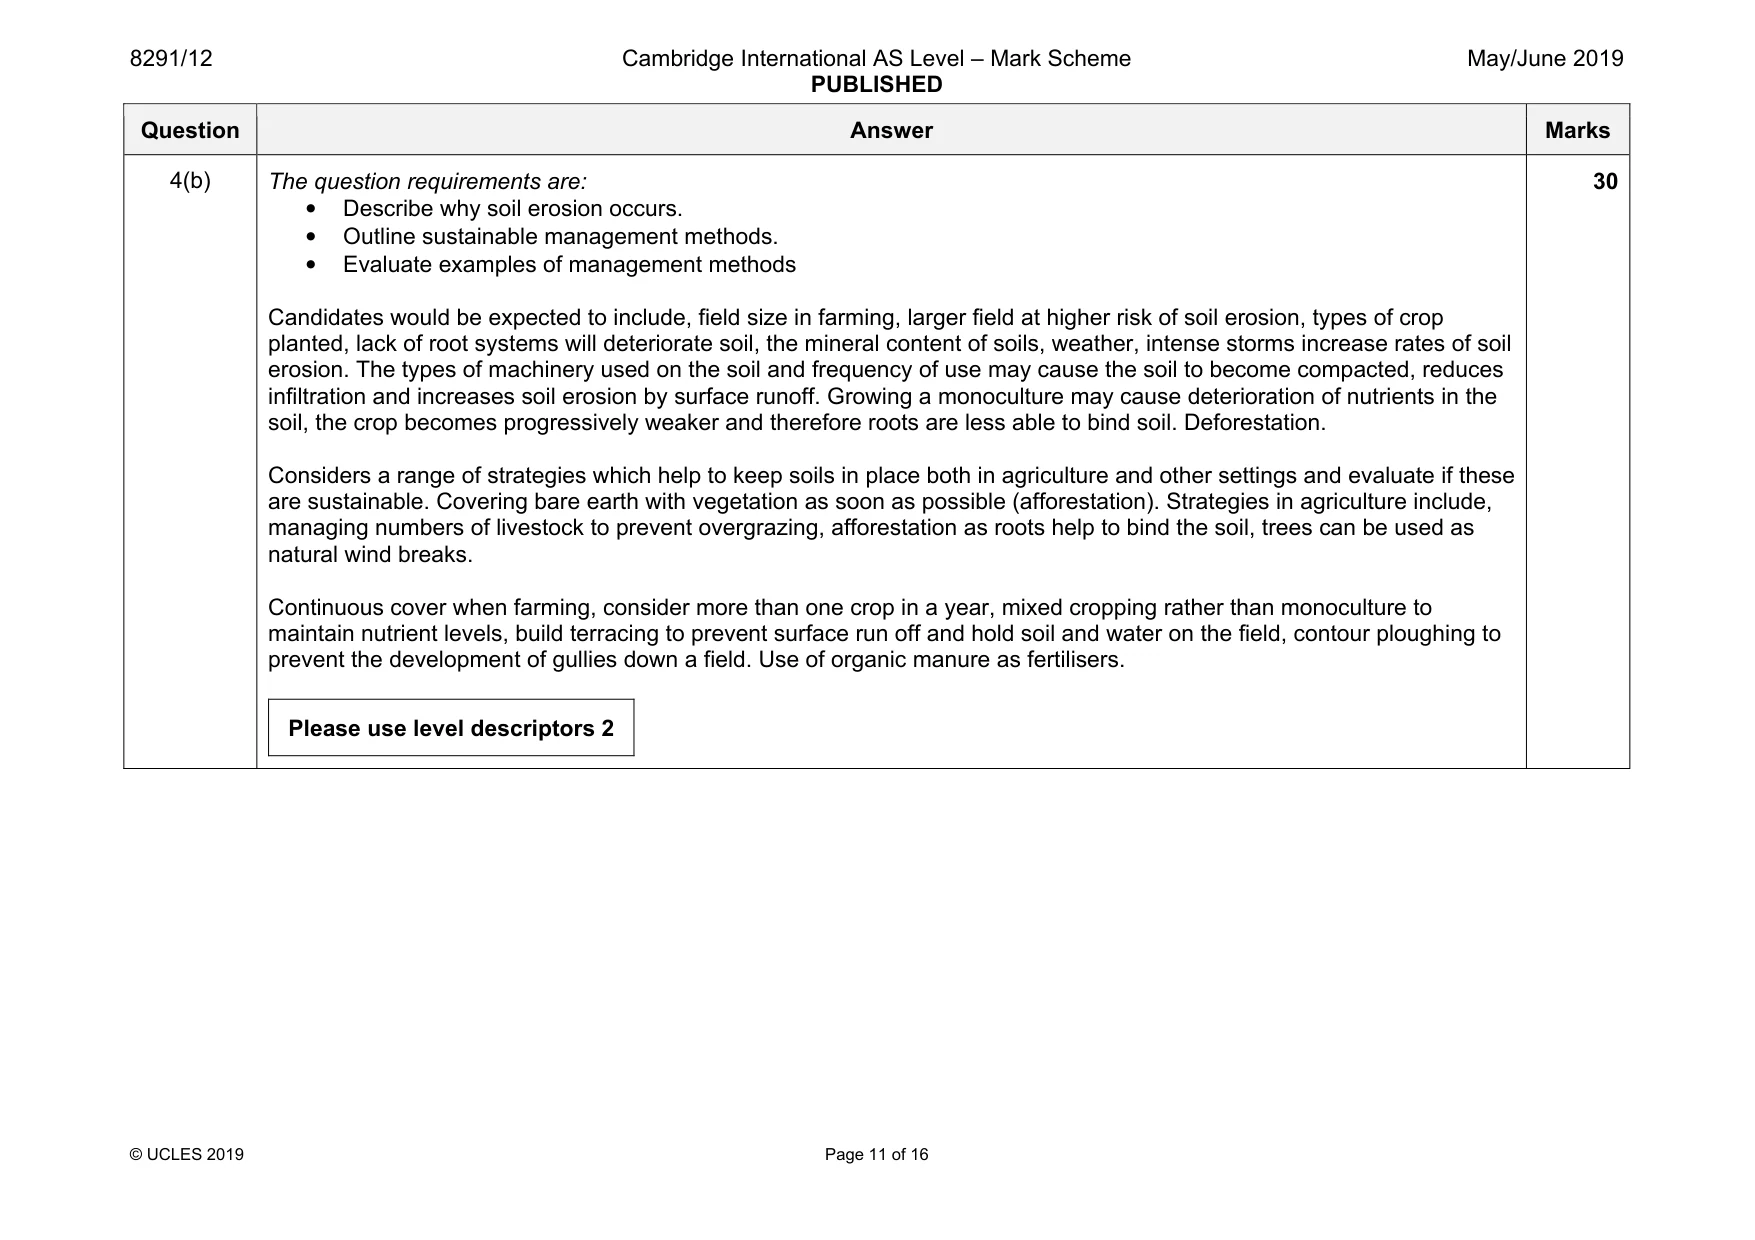
8291/12 Cambridge International AS Level – Mark Scheme PUBLISHED May/June 2019 © UCLES 2019 Page 11 of 16 Question Answer Marks 4(b) The question requirements are: • Describe why soil erosion occurs. • Outline sustainable management methods. • Evaluate examples of management methods Candidates would be expected to include, field size in farming, larger field at higher risk of soil erosion, types of crop planted, lack of root systems will deteriorate soil, the mineral content of soils, weather, intense storms increase rates of soil erosion. The types of machinery used on the soil and frequency of use may cause the soil to become compacted, reduces infiltration and increases soil erosion by surface runoff. Growing a monoculture may cause deterioration of nutrients in the soil, the crop becomes progressively weaker and therefore roots are less able to bind soil. Deforestation. Considers a range of strategies which help to keep soils in place both in agriculture and other settings and evaluate if these are sustainable. Covering bare earth with vegetation as soon as possible (afforestation). Strategies in agriculture include, managing numbers of livestock to prevent overgrazing, afforestation as roots help to bind the soil, trees can be used as natural wind breaks. Continuous cover when farming, consider more than one crop in a year, mixed cropping rather than monoculture to maintain nutrient levels, build terracing to prevent surface run off and hold soil and water on the field, contour ploughing to prevent the development of gullies down a field. Use of organic manure as fertilisers. Please use level descriptors 2 30
Mark scheme, page 12
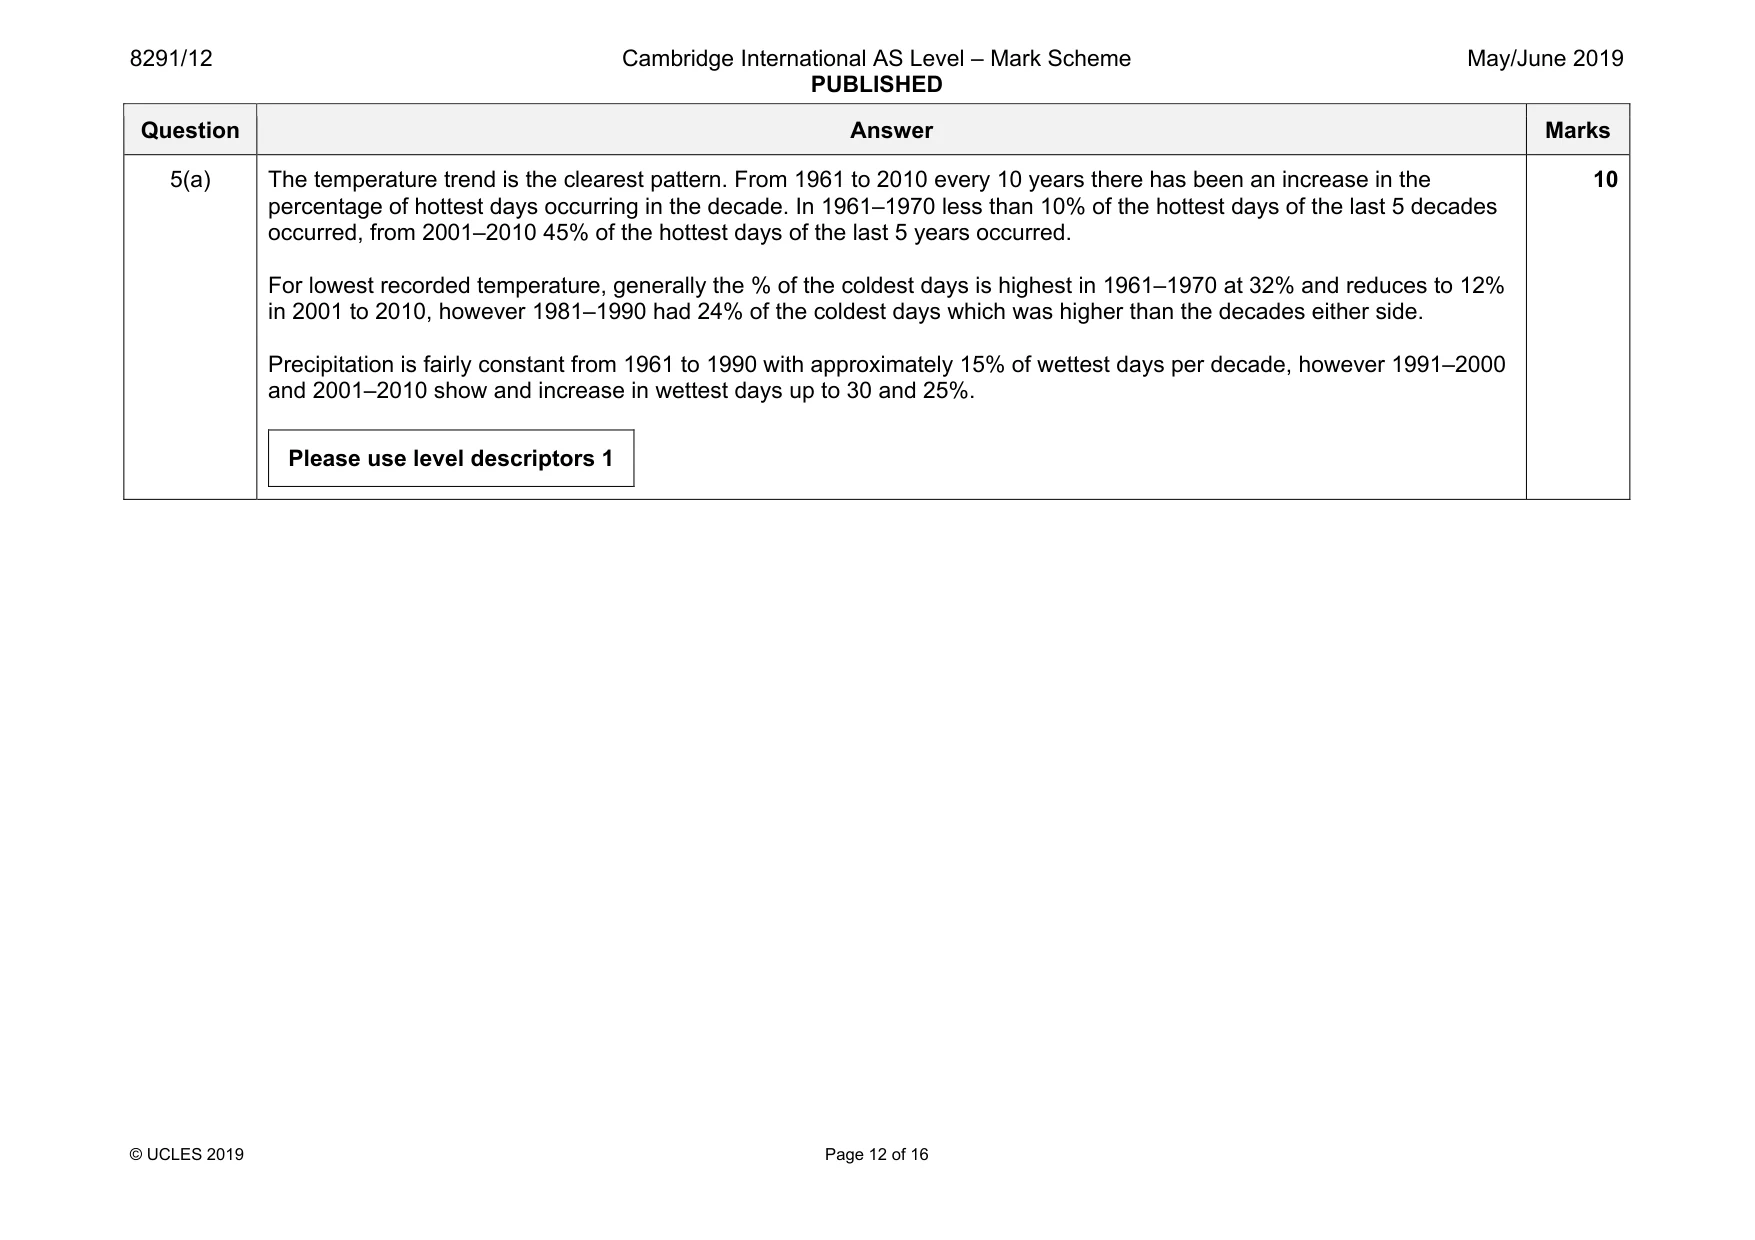
8291/12 Cambridge International AS Level – Mark Scheme PUBLISHED May/June 2019 © UCLES 2019 Page 12 of 16 Question Answer Marks 5(a) The temperature trend is the clearest pattern. From 1961 to 2010 every 10 years there has been an increase in the percentage of hottest days occurring in the decade. In 1961–1970 less than 10% of the hottest days of the last 5 decades occurred, from 2001–2010 45% of the hottest days of the last 5 years occurred. For lowest recorded temperature, generally the % of the coldest days is highest in 1961–1970 at 32% and reduces to 12% in 2001 to 2010, however 1981–1990 had 24% of the coldest days which was higher than the decades either side. Precipitation is fairly constant from 1961 to 1990 with approximately 15% of wettest days per decade, however 1991–2000 and 2001–2010 show and increase in wettest days up to 30 and 25%. Please use level descriptors 1 10
Mark scheme, page 13
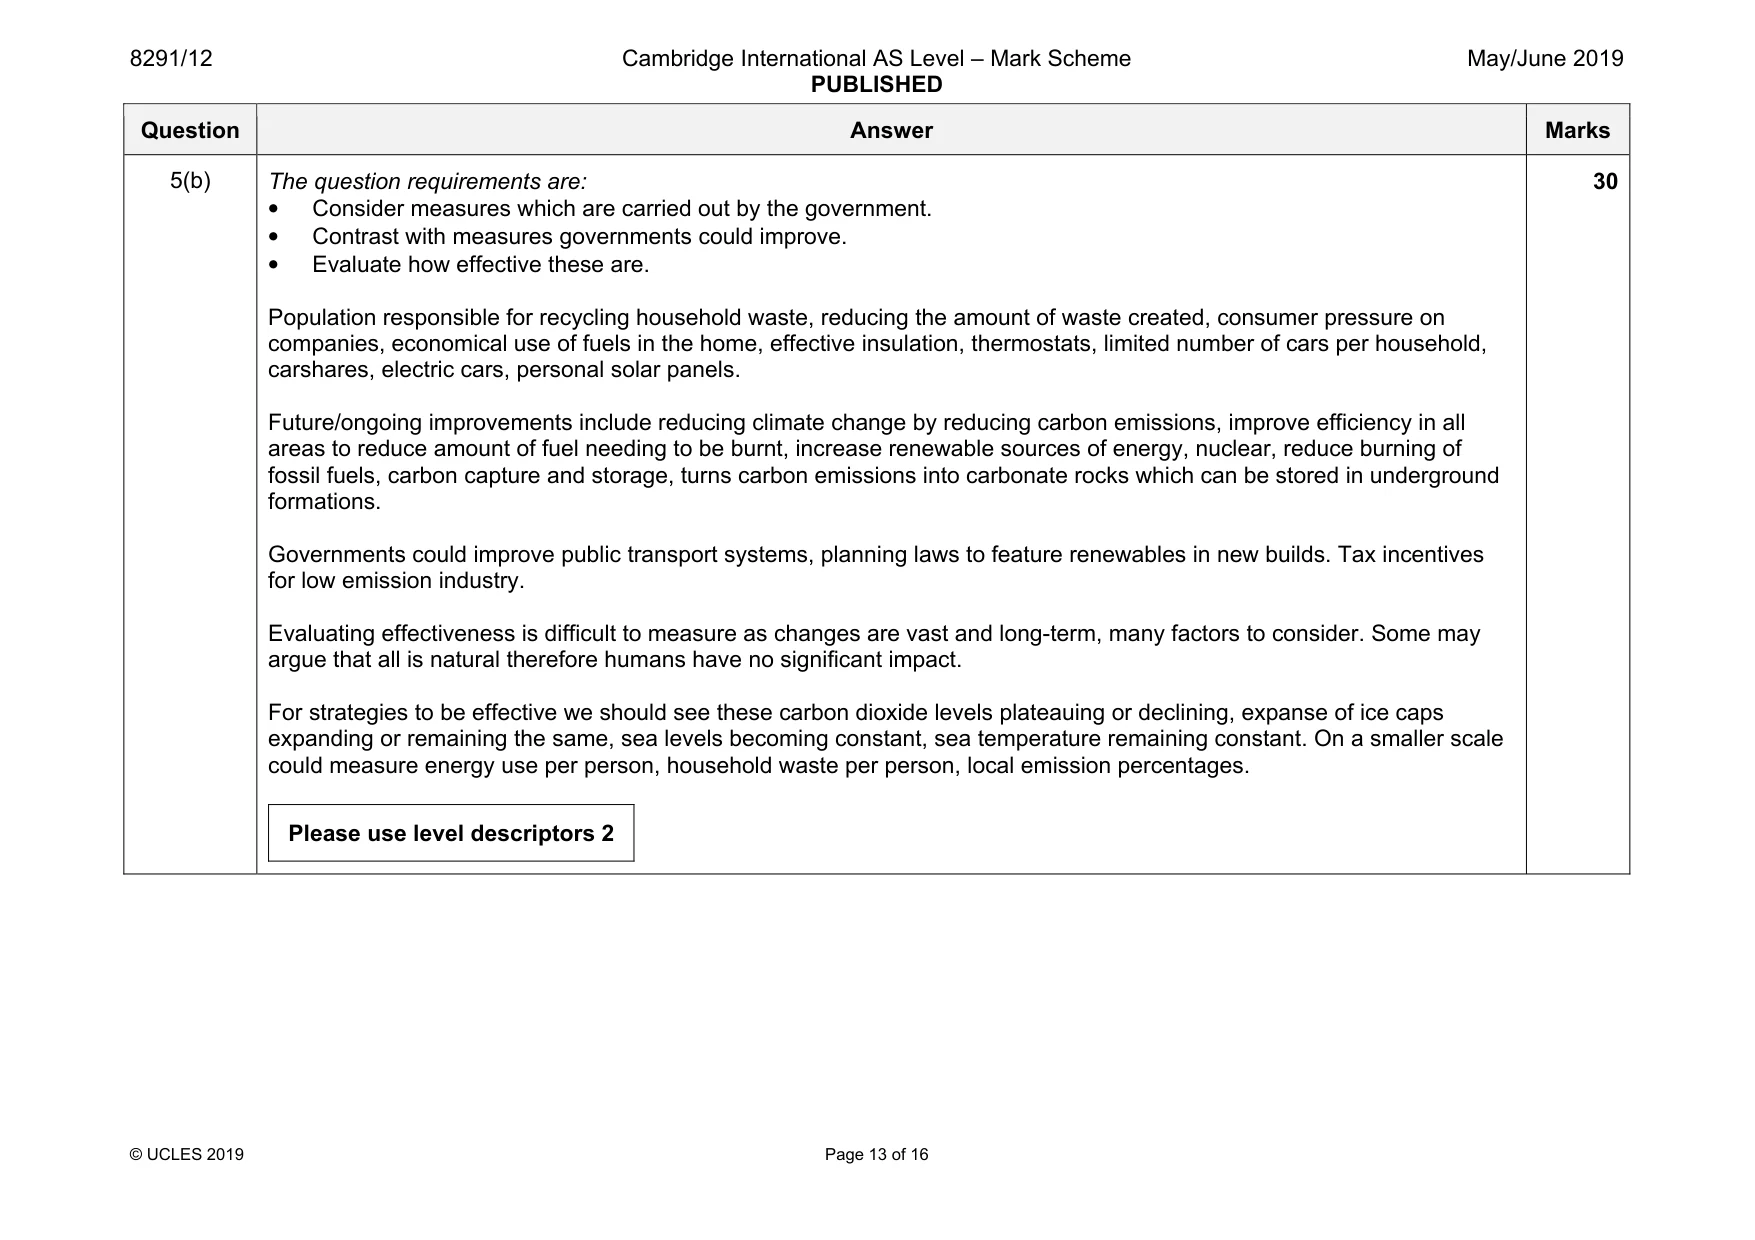
8291/12 Cambridge International AS Level – Mark Scheme PUBLISHED May/June 2019 © UCLES 2019 Page 13 of 16 Question Answer Marks 5(b) The question requirements are: • Consider measures which are carried out by the government. • Contrast with measures governments could improve. • Evaluate how effective these are. Population responsible for recycling household waste, reducing the amount of waste created, consumer pressure on companies, economical use of fuels in the home, effective insulation, thermostats, limited number of cars per household, carshares, electric cars, personal solar panels. Future/ongoing improvements include reducing climate change by reducing carbon emissions, improve efficiency in all areas to reduce amount of fuel needing to be burnt, increase renewable sources of energy, nuclear, reduce burning of fossil fuels, carbon capture and storage, turns carbon emissions into carbonate rocks which can be stored in underground formations. Governments could improve public transport systems, planning laws to feature renewables in new builds. Tax incentives for low emission industry. Evaluating effectiveness is difficult to measure as changes are vast and long-term, many factors to consider. Some may argue that all is natural therefore humans have no significant impact. For strategies to be effective we should see these carbon dioxide levels plateauing or declining, expanse of ice caps expanding or remaining the same, sea levels becoming constant, sea temperature remaining constant. On a smaller scale could measure energy use per person, household waste per person, local emission percentages. Please use level descriptors 2 30
Mark scheme, page 14
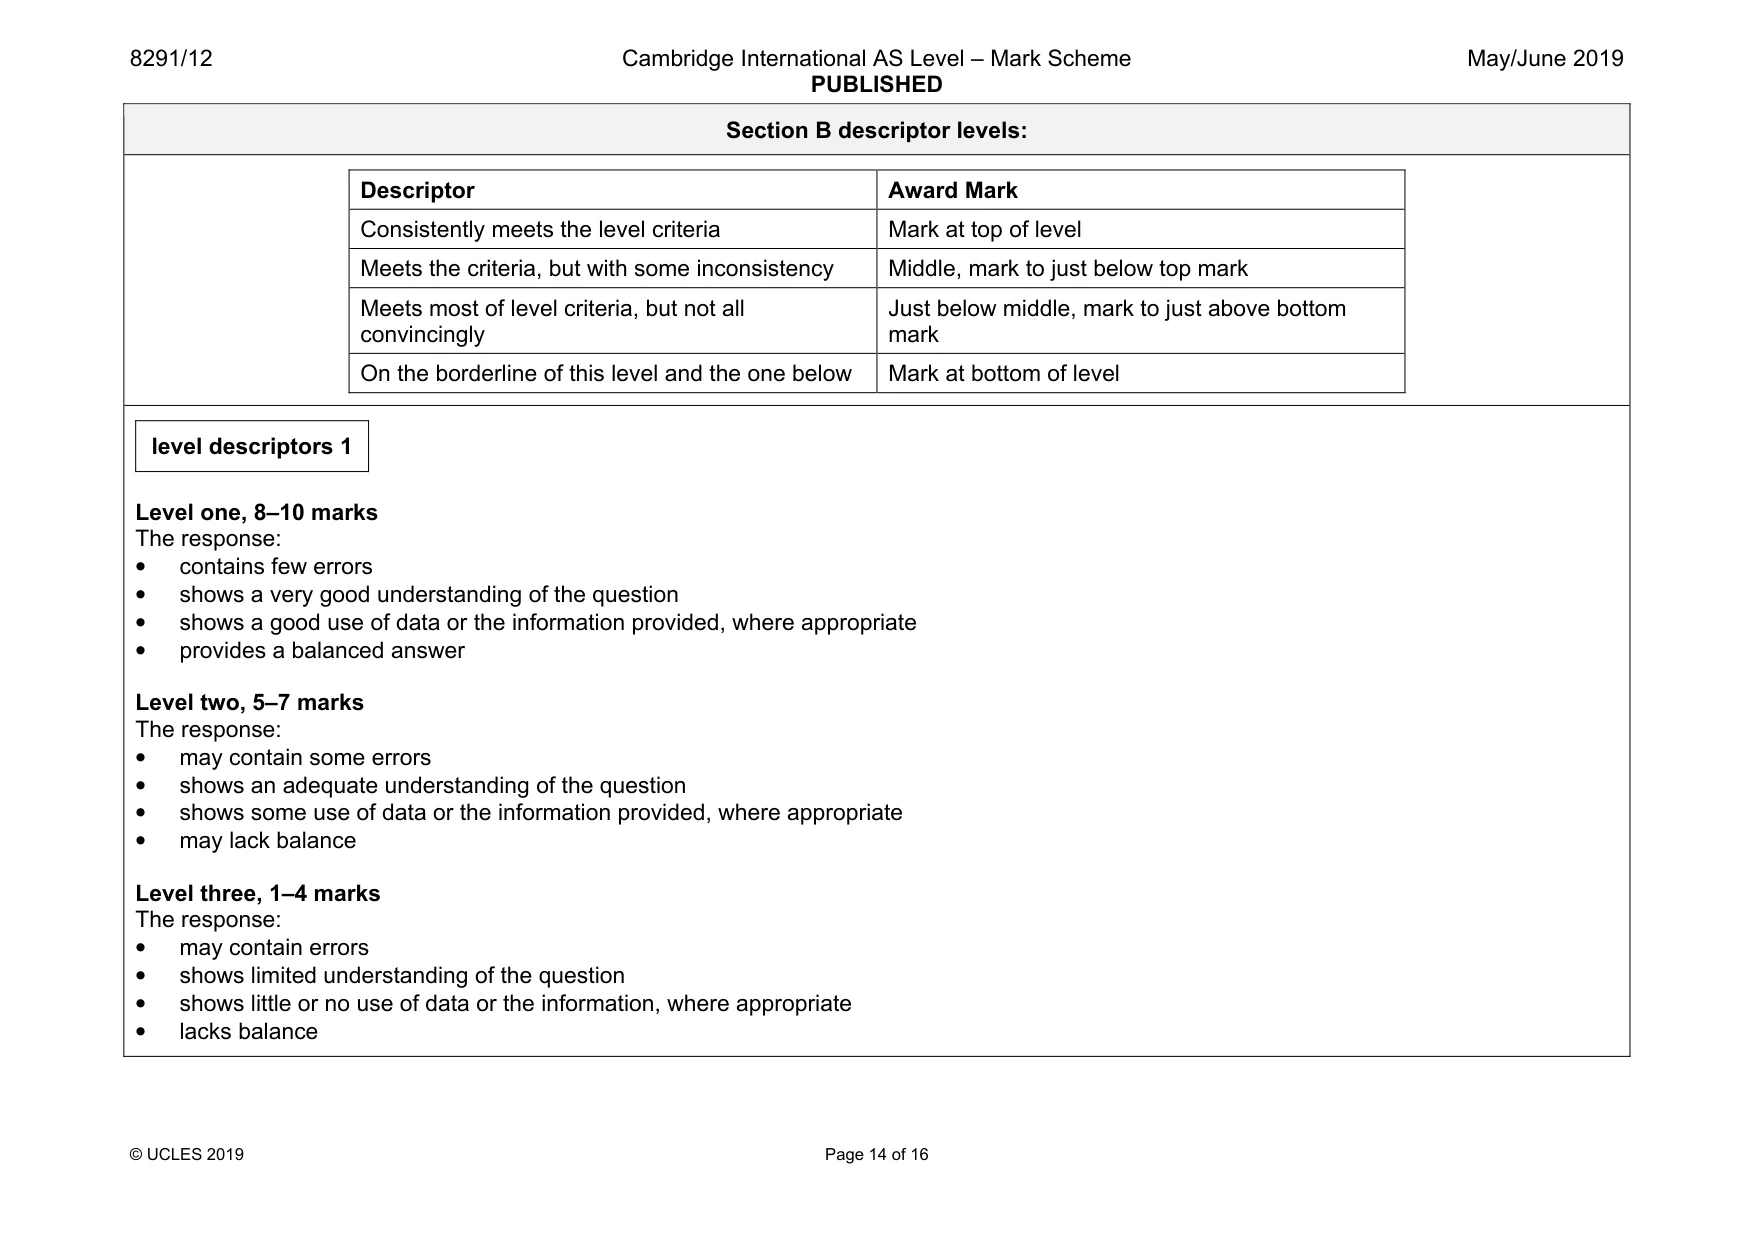
8291/12 Cambridge International AS Level – Mark Scheme PUBLISHED May/June 2019 © UCLES 2019 Page 14 of 16 Section B descriptor levels: Descriptor Award Mark Consistently meets the level criteria Mark at top of level Meets the criteria, but with some inconsistency Middle, mark to just below top mark Meets most of level criteria, but not all convincingly Just below middle, mark to just above bottom mark On the borderline of this level and the one below Mark at bottom of level level descriptors 1 Level one, 8–10 marks The response: • contains few errors • shows a very good understanding of the question • shows a good use of data or the information provided, where appropriate • provides a balanced answer Level two, 5–7 marks The response: • may contain some errors • shows an adequate understanding of the question • shows some use of data or the information provided, where appropriate • may lack balance Level three, 1–4 marks The response: • may contain errors • shows limited understanding of the question • shows little or no use of data or the information, where appropriate • lacks balance
Mark scheme, page 15
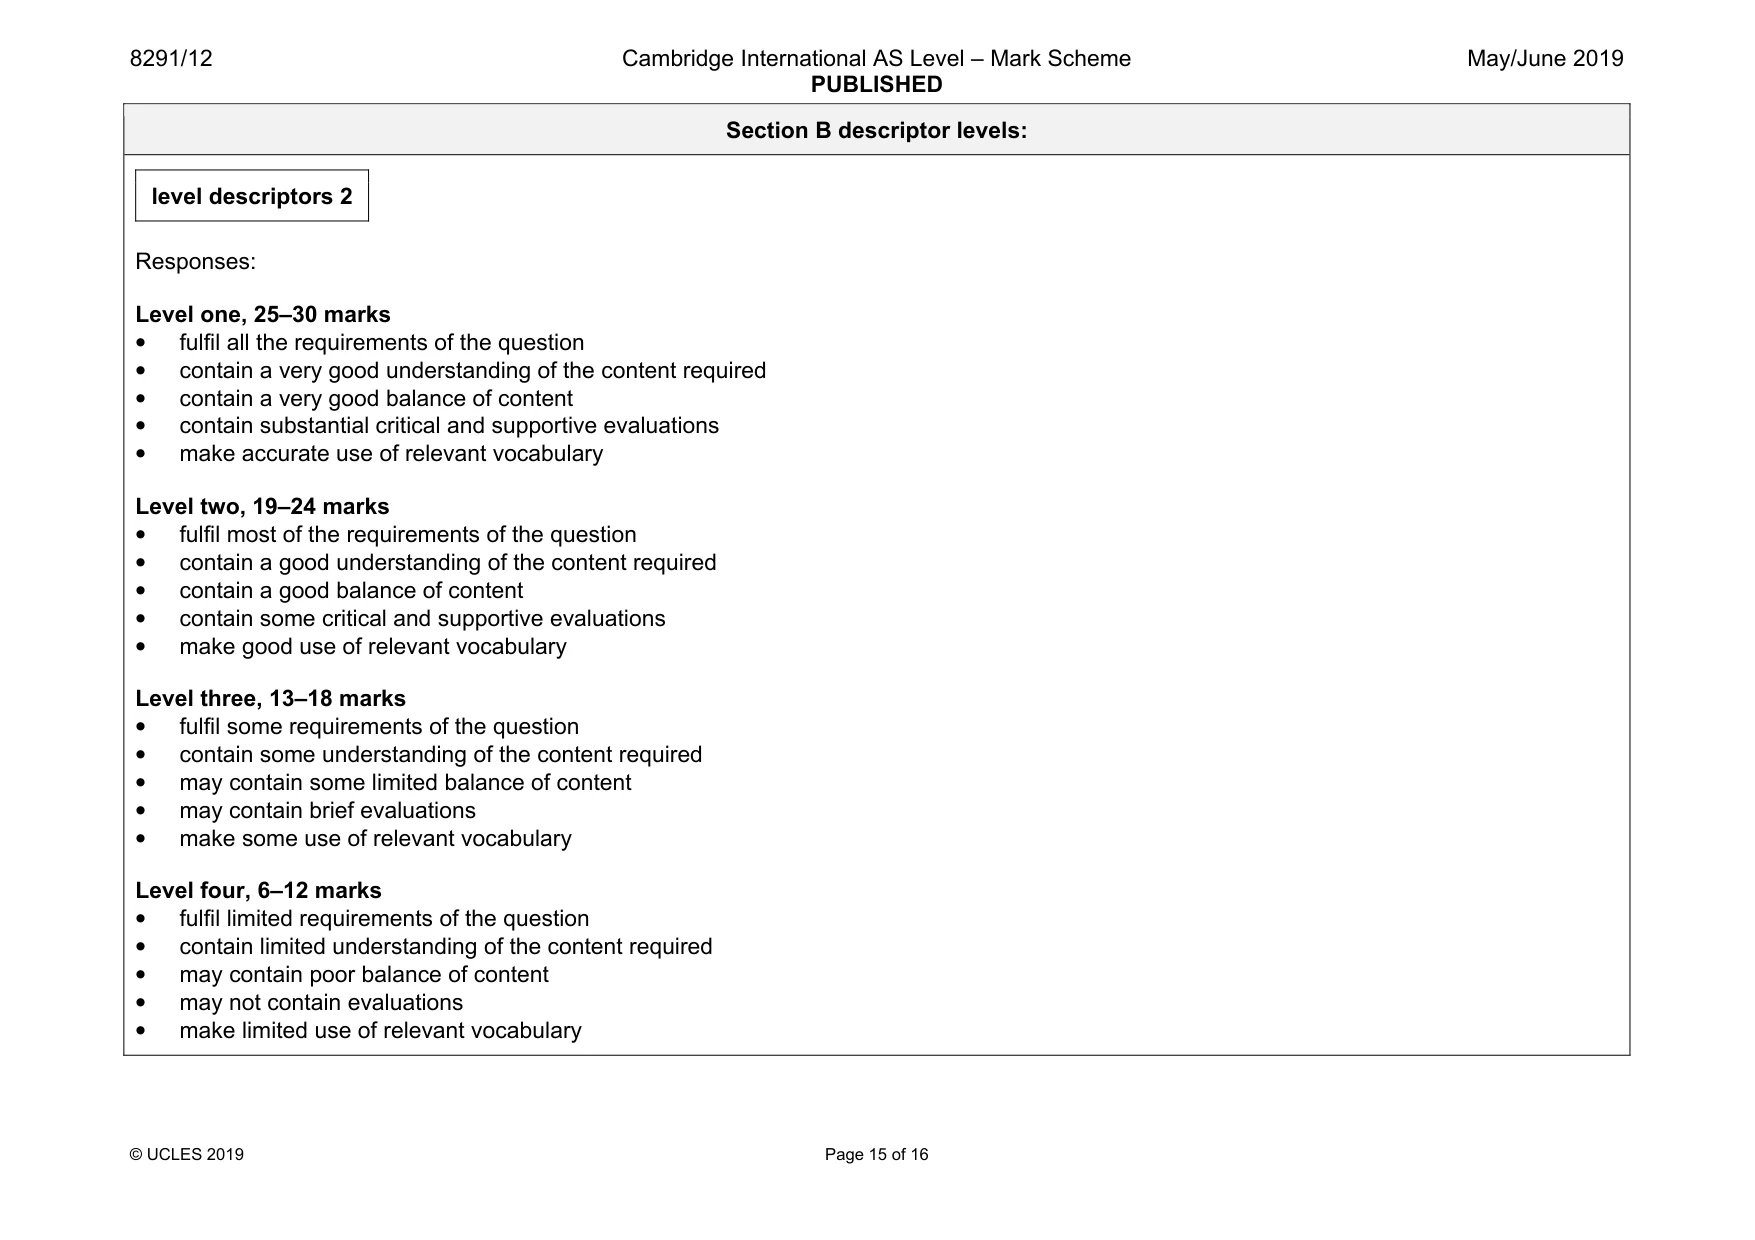
8291/12 Cambridge International AS Level – Mark Scheme PUBLISHED May/June 2019 © UCLES 2019 Page 15 of 16 Section B descriptor levels: level descriptors 2 Responses: Level one, 25–30 marks • fulfil all the requirements of the question • contain a very good understanding of the content required • contain a very good balance of content • contain substantial critical and supportive evaluations • make accurate use of relevant vocabulary Level two, 19–24 marks • fulfil most of the requirements of the question • contain a good understanding of the content required • contain a good balance of content • contain some critical and supportive evaluations • make good use of relevant vocabulary Level three, 13–18 marks • fulfil some requirements of the question • contain some understanding of the content required • may contain some limited balance of content • may contain brief evaluations • make some use of relevant vocabulary Level four, 6–12 marks • fulfil limited requirements of the question • contain limited understanding of the content required • may contain poor balance of content • may not contain evaluations • make limited use of relevant vocabulary
Mark scheme, page 16
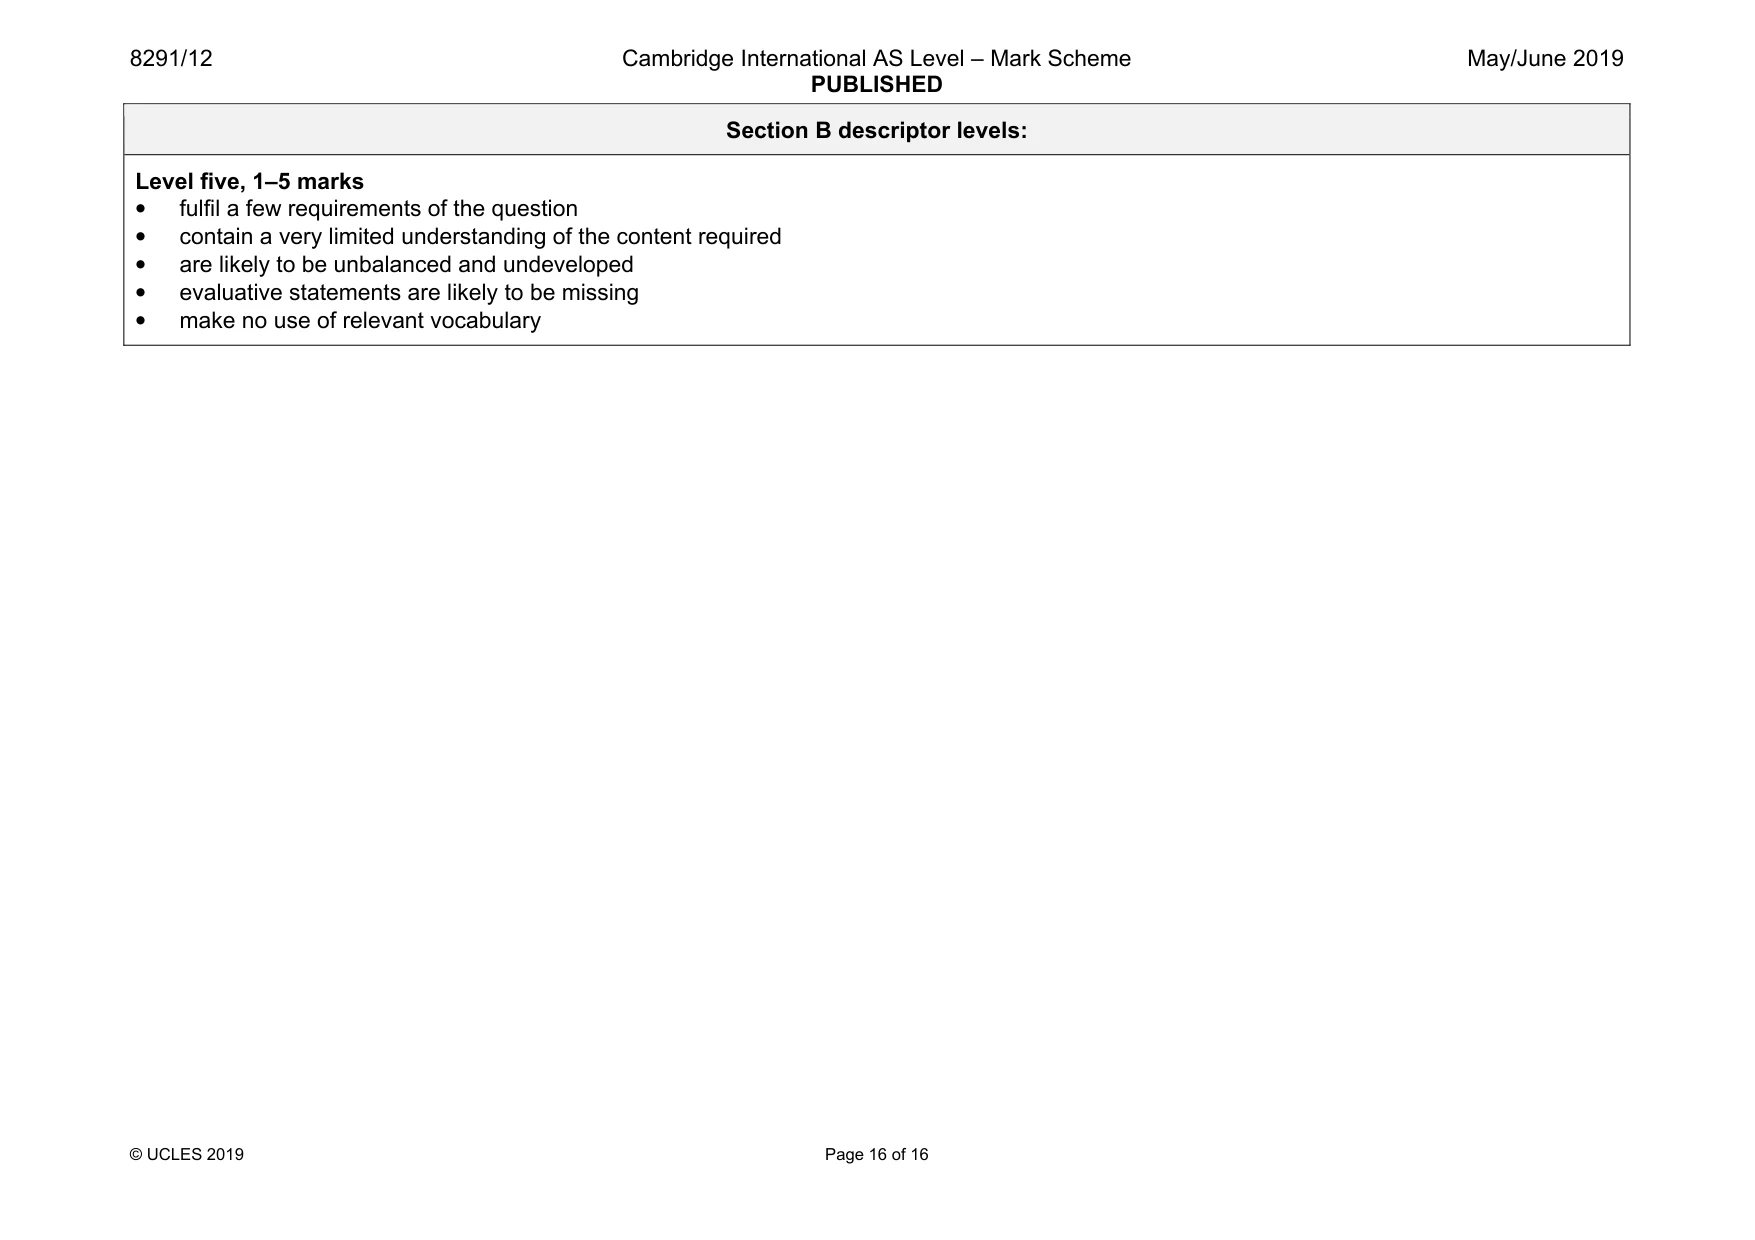
8291/12 Cambridge International AS Level – Mark Scheme PUBLISHED May/June 2019 © UCLES 2019 Page 16 of 16 Section B descriptor levels: Level five, 1–5 marks • fulfil a few requirements of the question • contain a very limited understanding of the content required • are likely to be unbalanced and undeveloped • evaluative statements are likely to be missing • make no use of relevant vocabulary
What you needed in this session
Cambridge’s own grade thresholds for 2019 May/June, Paper 1 · Variant 2. A higher threshold means an easier paper — the bar moves with how the cohort did.