Cambridge A Level Environmental Management (AS only) 8291 — 2017 Oct/Nov Paper 1 · Variant 1
8291/11/O/N/17 · 80 marks · ≈90 min
The question paper and its mark scheme, free to read here and free to download. This is Cambridge’s own paper, exactly as it was sat.
Question paper16 pages



Mark scheme13 pages
Answers below. Sit the paper first if you are practising.
Paper as text
Question paper, page 1
* 1 0 8 9 3 0 6 6 6 2 * This document consists of 14 printed pages and 2 blank pages. DC (CW/FC) 134818/3 © UCLES 2017 [Turn over Cambridge International Examinations Cambridge International Advanced Subsidiary Level ENVIRONMENTAL MANAGEMENT 8291/11 Paper 1 Lithosphere and Atmosphere October/November 2017 1 hour 30 minutes Additional Materials: Answer Booklet/Paper READ THESE INSTRUCTIONS FIRST Write your Centre number, candidate number and name on all the work you hand in. Write in dark blue or black pen. You may use an HB pencil for any diagrams or graphs. Do not use staples, paper clips, glue or correction fluid. DO NOT WRITE IN ANY BARCODES. Electronic calculators may be used. You may lose marks if you do not show your working or if you do not use appropriate units. Section A Answer all questions in this section. Write your answers in the spaces provided on the question paper. Section B Answer one question from this section. Write your answers on the separate answer paper provided. At the end of the examination, 1. fasten all separate answer paper securely to the question paper; 2. enter the question number from Section B in the grid. For Examiner’s Use Section A 1 2 Section B Total
Question paper, page 2
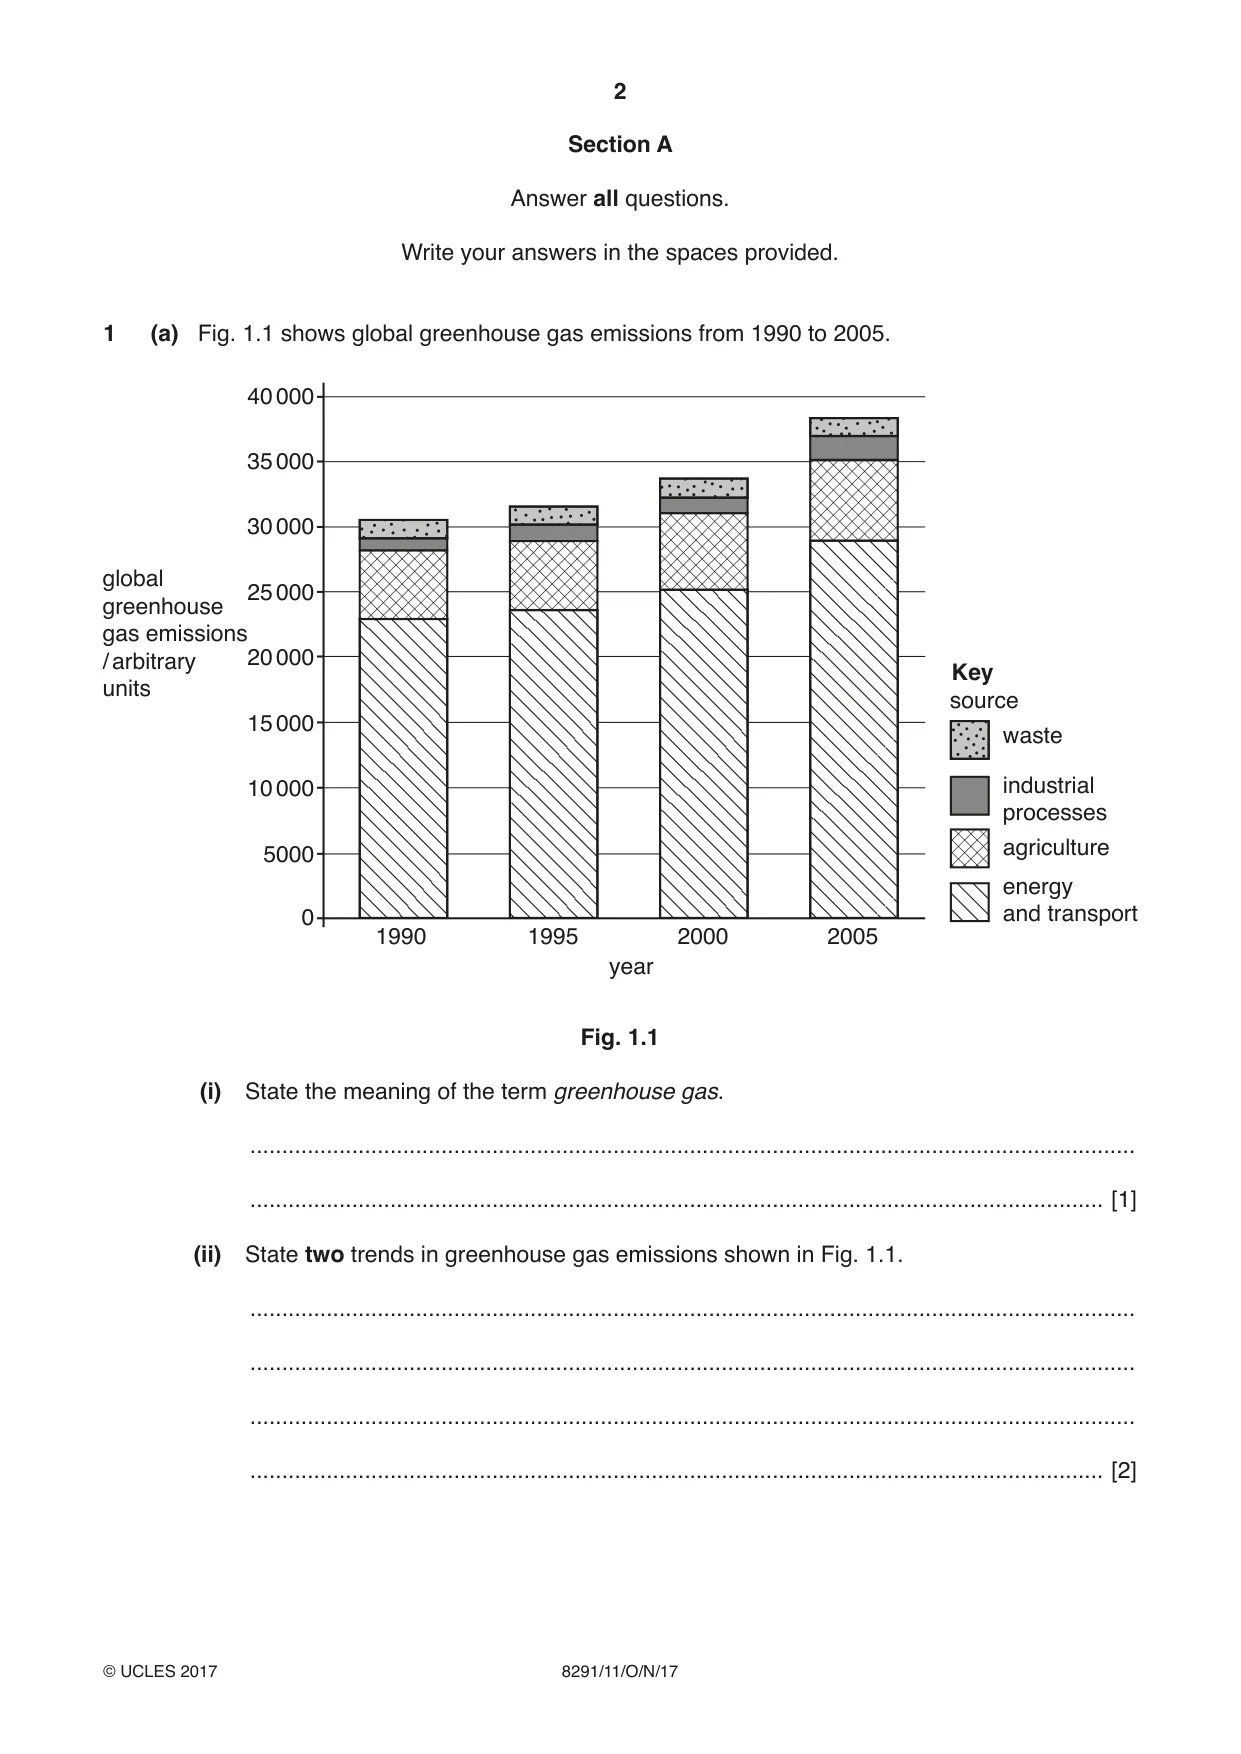
2 8291/11/O/N/17 © UCLES 2017 Section A Answer all questions. Write your answers in the spaces provided. 1 (a) Fig. 1.1 shows global greenhouse gas emissions from 1990 to 2005. 1990 1995 2000 2005 5000 0 10 000 15 000 20 000 25 000 30 000 35 000 40 000 waste agriculture energy and transport industrial processes source Key global greenhouse gas emissions / arbitrary units year Fig. 1.1 (i) State the meaning of the term greenhouse gas. … … [1] (ii) State two trends in greenhouse gas emissions shown in Fig. 1.1. … … … … [2]
Question paper, page 3
3 8291/11/O/N/17 © UCLES 2017 [Turn over (iii) The use of energy resources to generate electricity results in greenhouse gas emissions. State two reasons why. … … … … [2]
Question paper, page 4
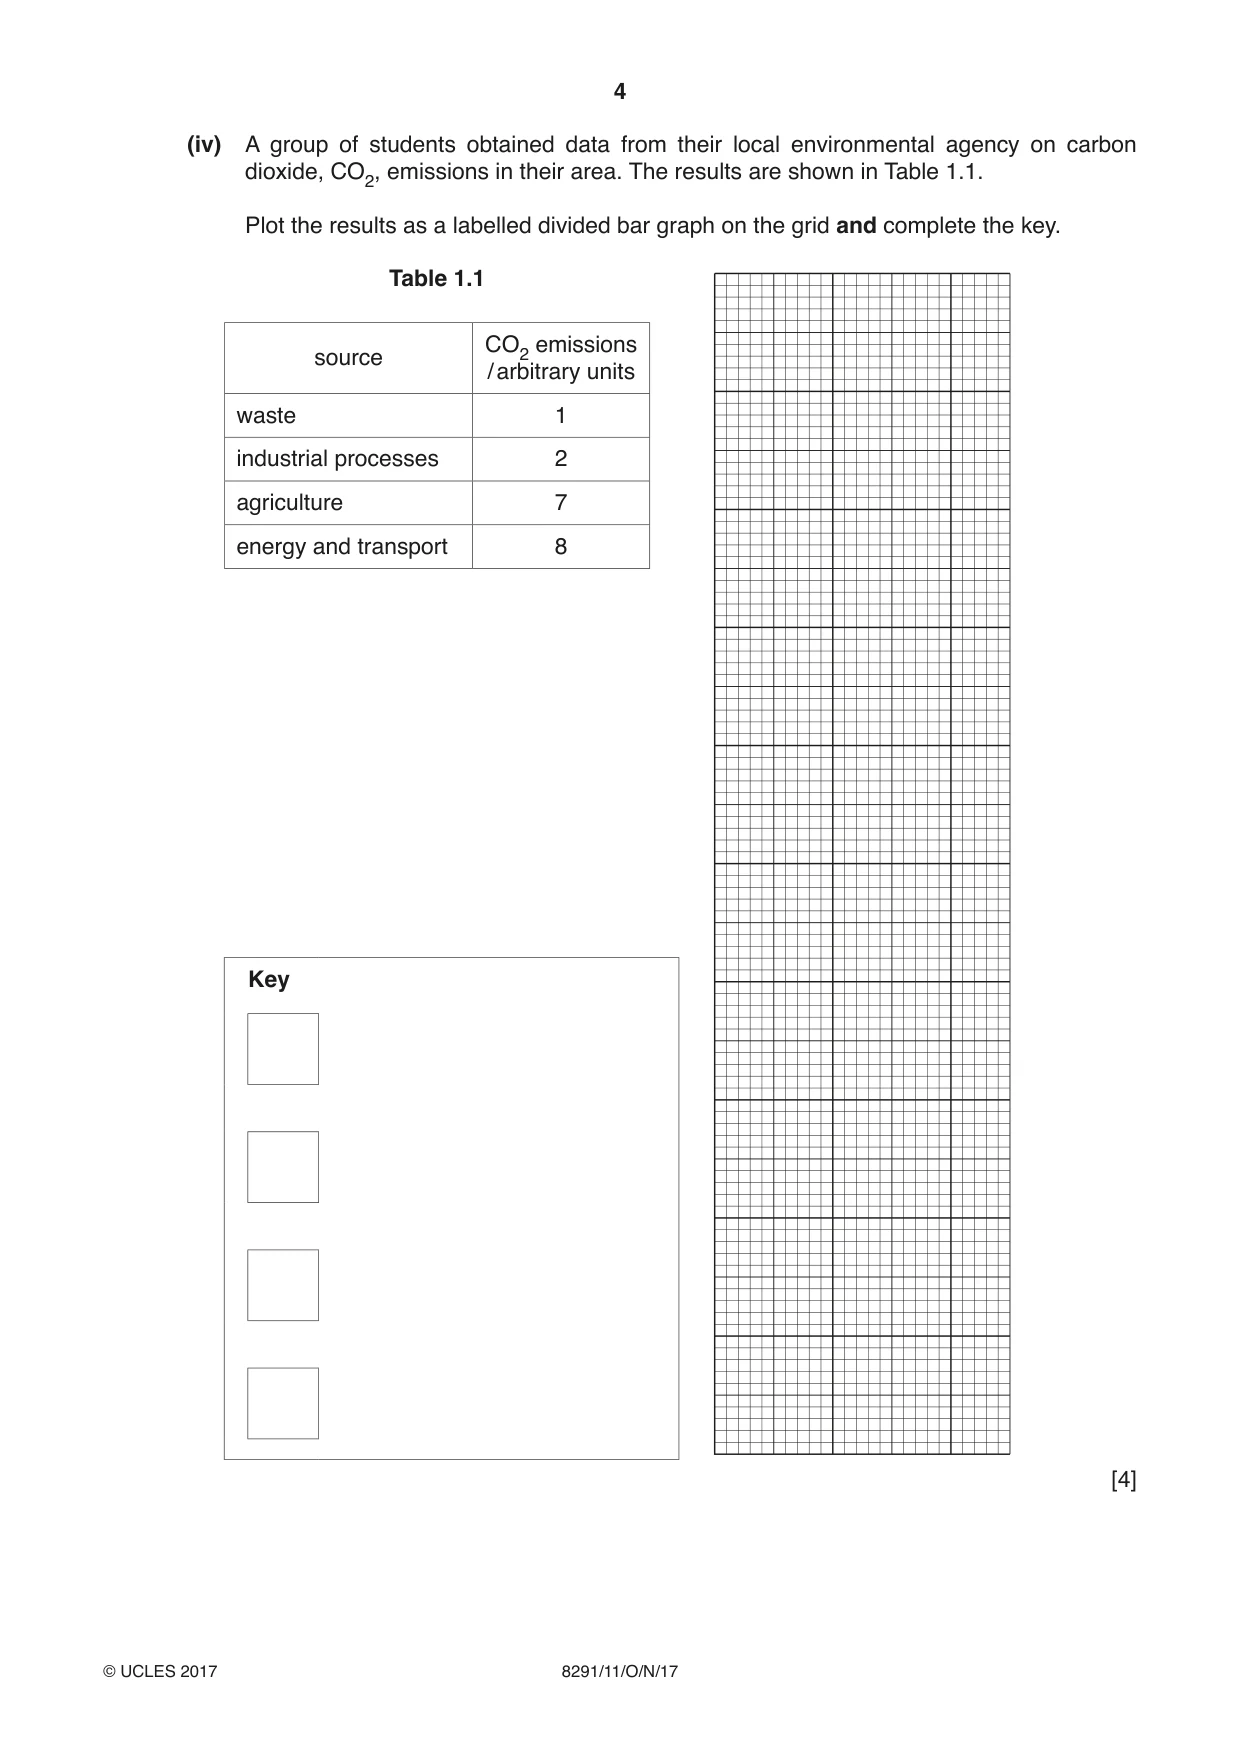
4 8291/11/O/N/17 © UCLES 2017 (iv) A group of students obtained data from their local environmental agency on carbon dioxide, CO2, emissions in their area. The results are shown in Table 1.1. Plot the results as a labelled divided bar graph on the grid and complete the key. Table 1.1 source CO2 emissions / arbitrary units waste 1 industrial processes 2 agriculture 7 energy and transport 8 Key [4]
Question paper, page 5
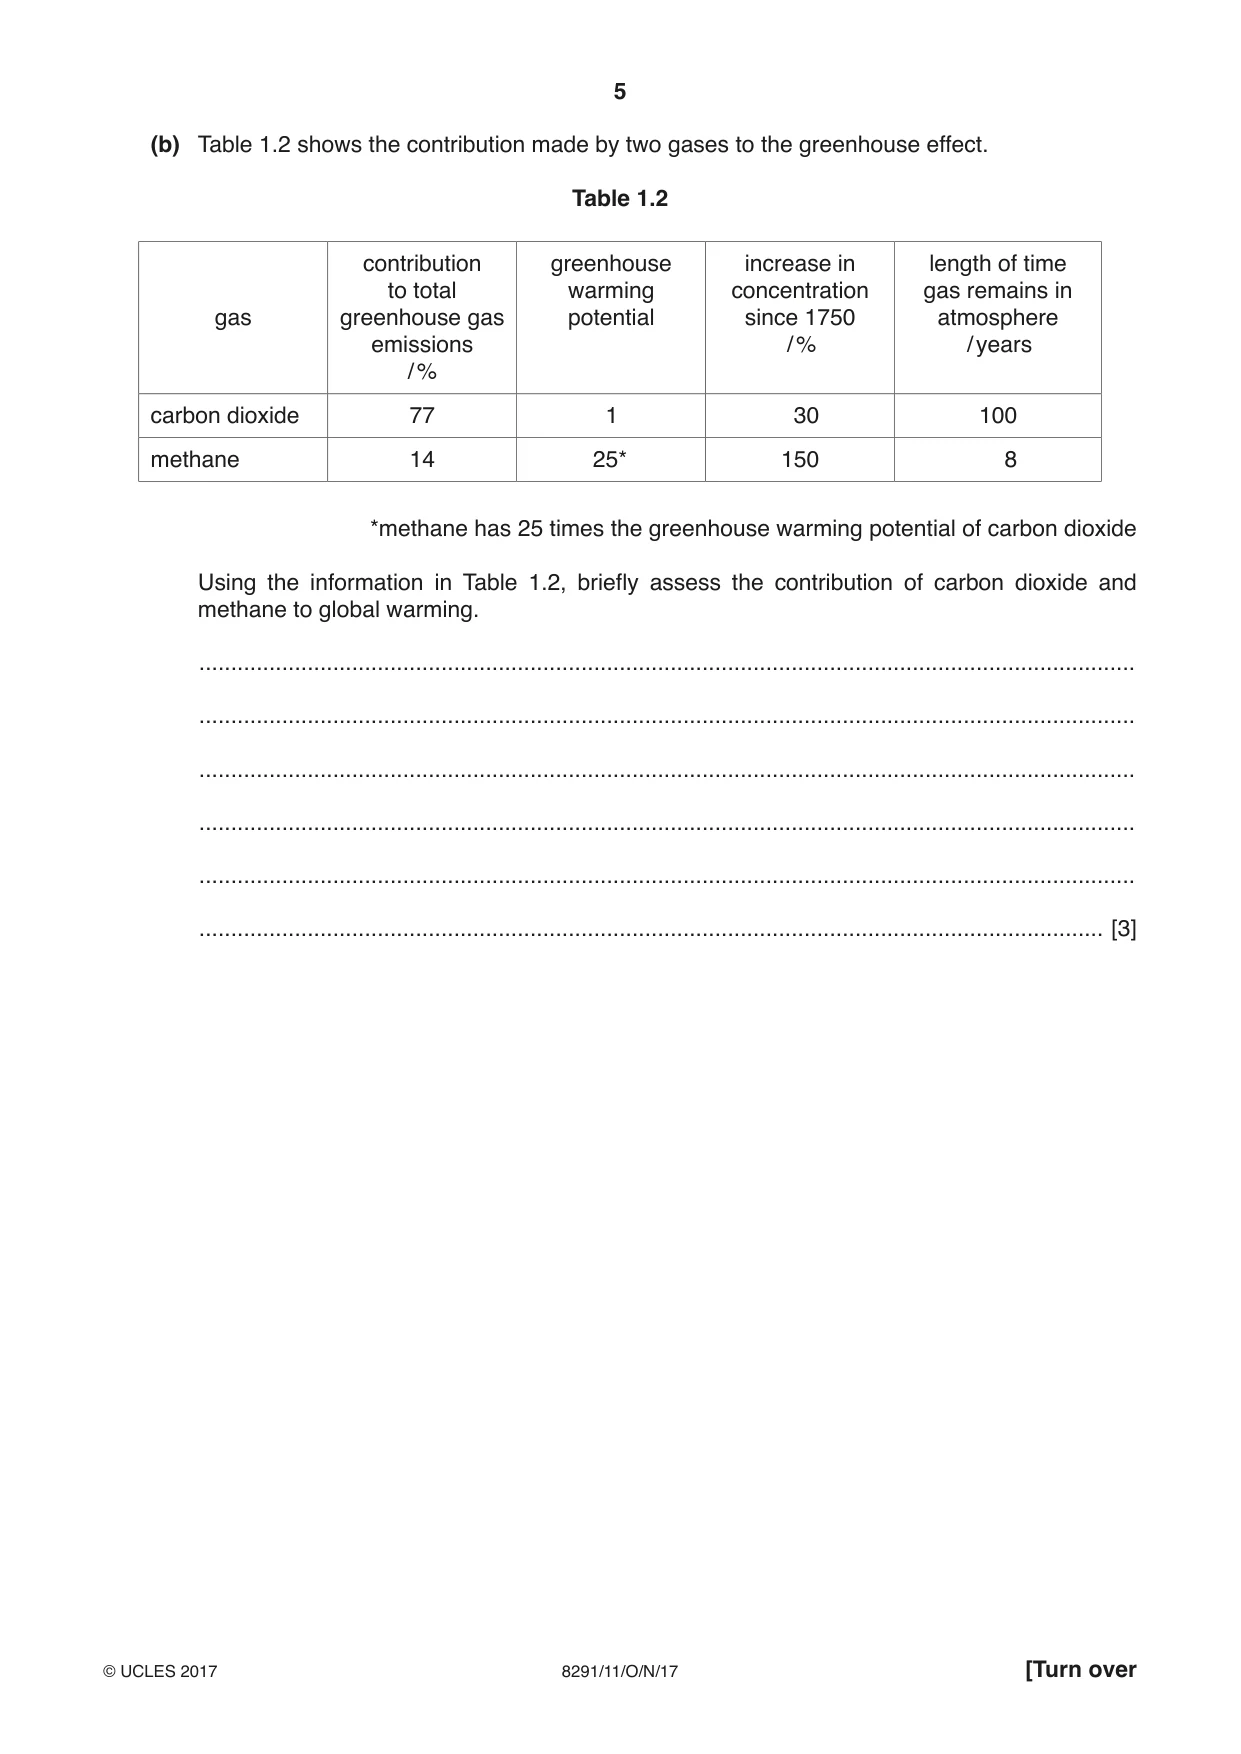
5 8291/11/O/N/17 © UCLES 2017 [Turn over (b) Table 1.2 shows the contribution made by two gases to the greenhouse effect. Table 1.2 gas contribution to total greenhouse gas emissions / % greenhouse warming potential increase in concentration since 1750 / % length of time gas remains in atmosphere / years carbon dioxide 77 1 30 100 methane 14 25* 150 8 *methane has 25 times the greenhouse warming potential of carbon dioxide Using the information in Table 1.2, briefly assess the contribution of carbon dioxide and methane to global warming. … … … … … … [3]
Question paper, page 6
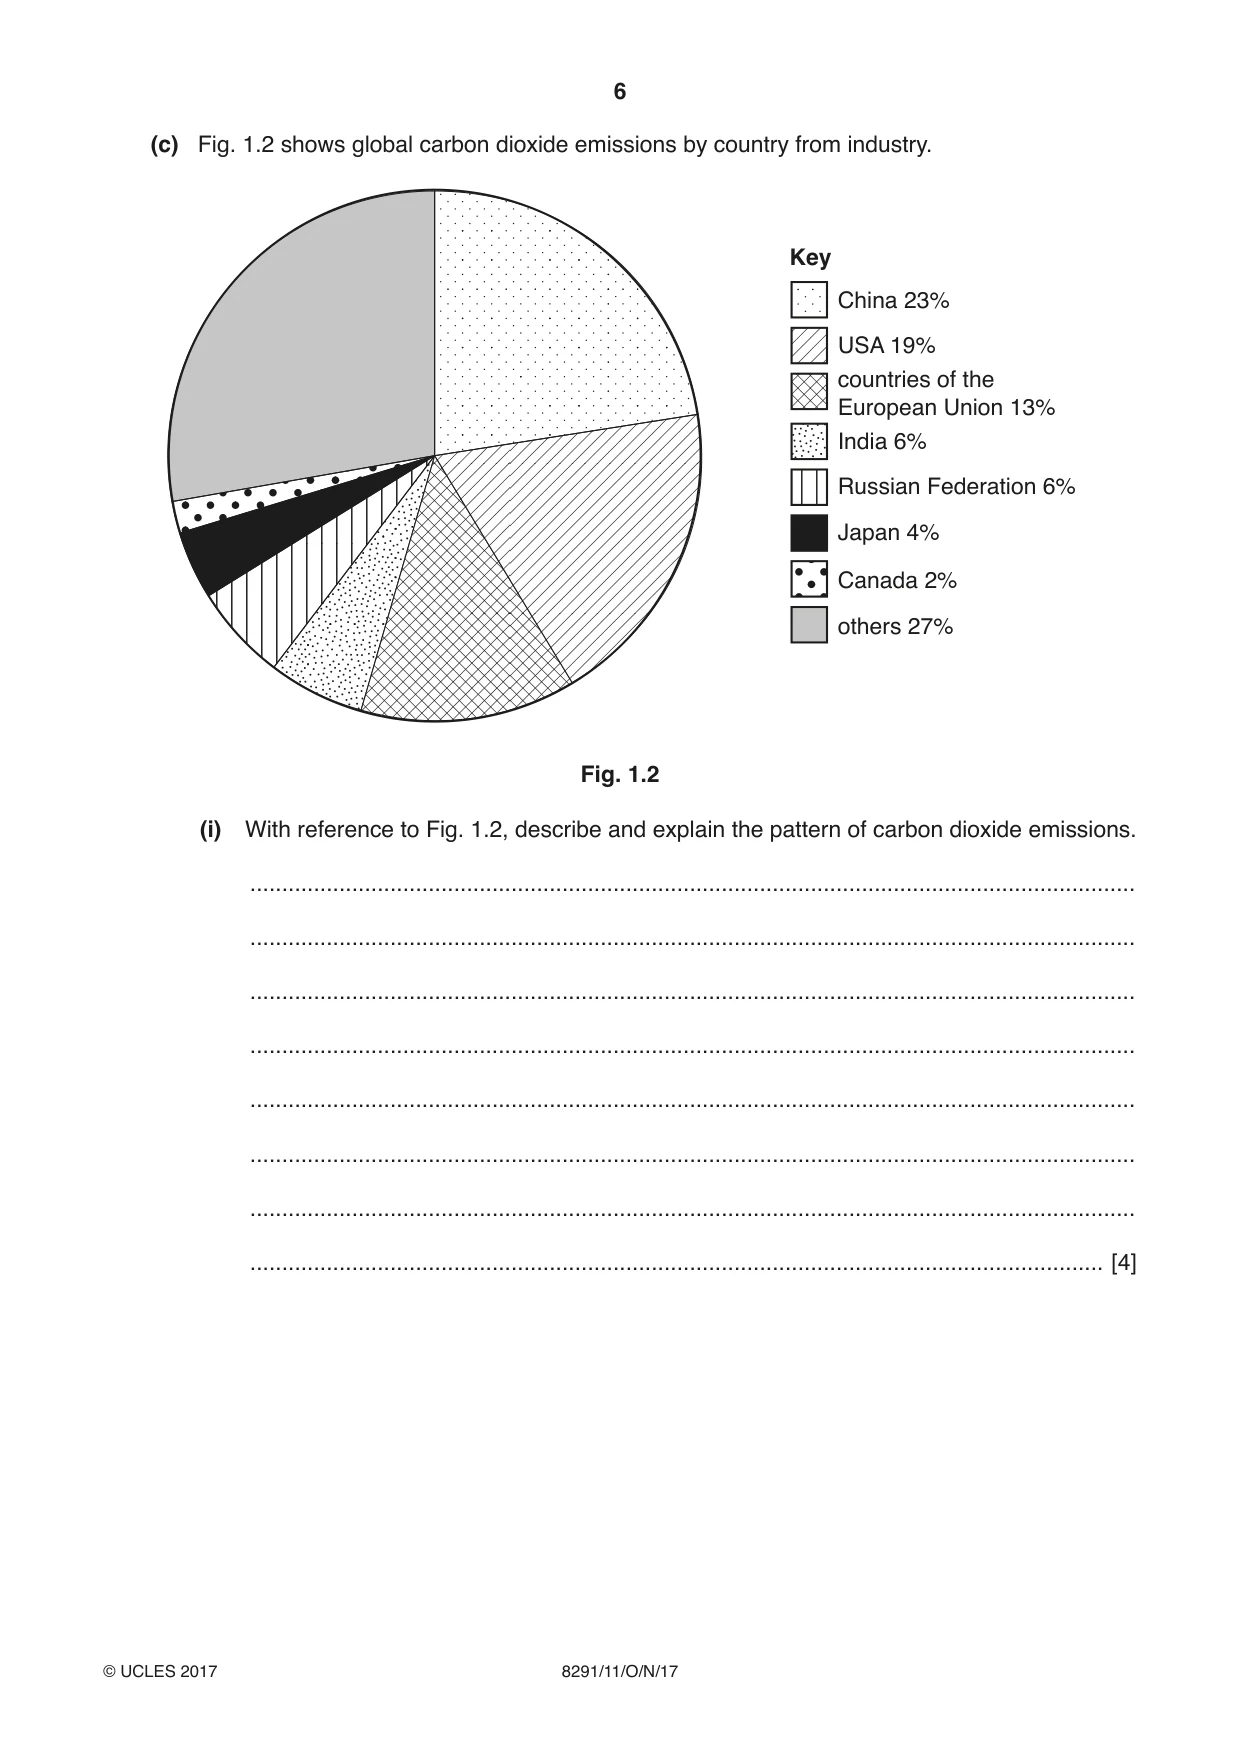
6 8291/11/O/N/17 © UCLES 2017 (c) Fig. 1.2 shows global carbon dioxide emissions by country from industry. China 23% USA 19% countries of the European Union 13% India 6% Russian Federation 6% Japan 4% Canada 2% others 27% Key Fig. 1.2 (i) With reference to Fig. 1.2, describe and explain the pattern of carbon dioxide emissions. … … … … … … … … [4]
Question paper, page 7
7 8291/11/O/N/17 © UCLES 2017 [Turn over (ii) Explain the possible impact of future greenhouse gas emissions from newly industrialised countries. … … … … … … … … [4] [Total: 20]
Question paper, page 8
8 8291/11/O/N/17 © UCLES 2017 BLANK PAGE
Question paper, page 9
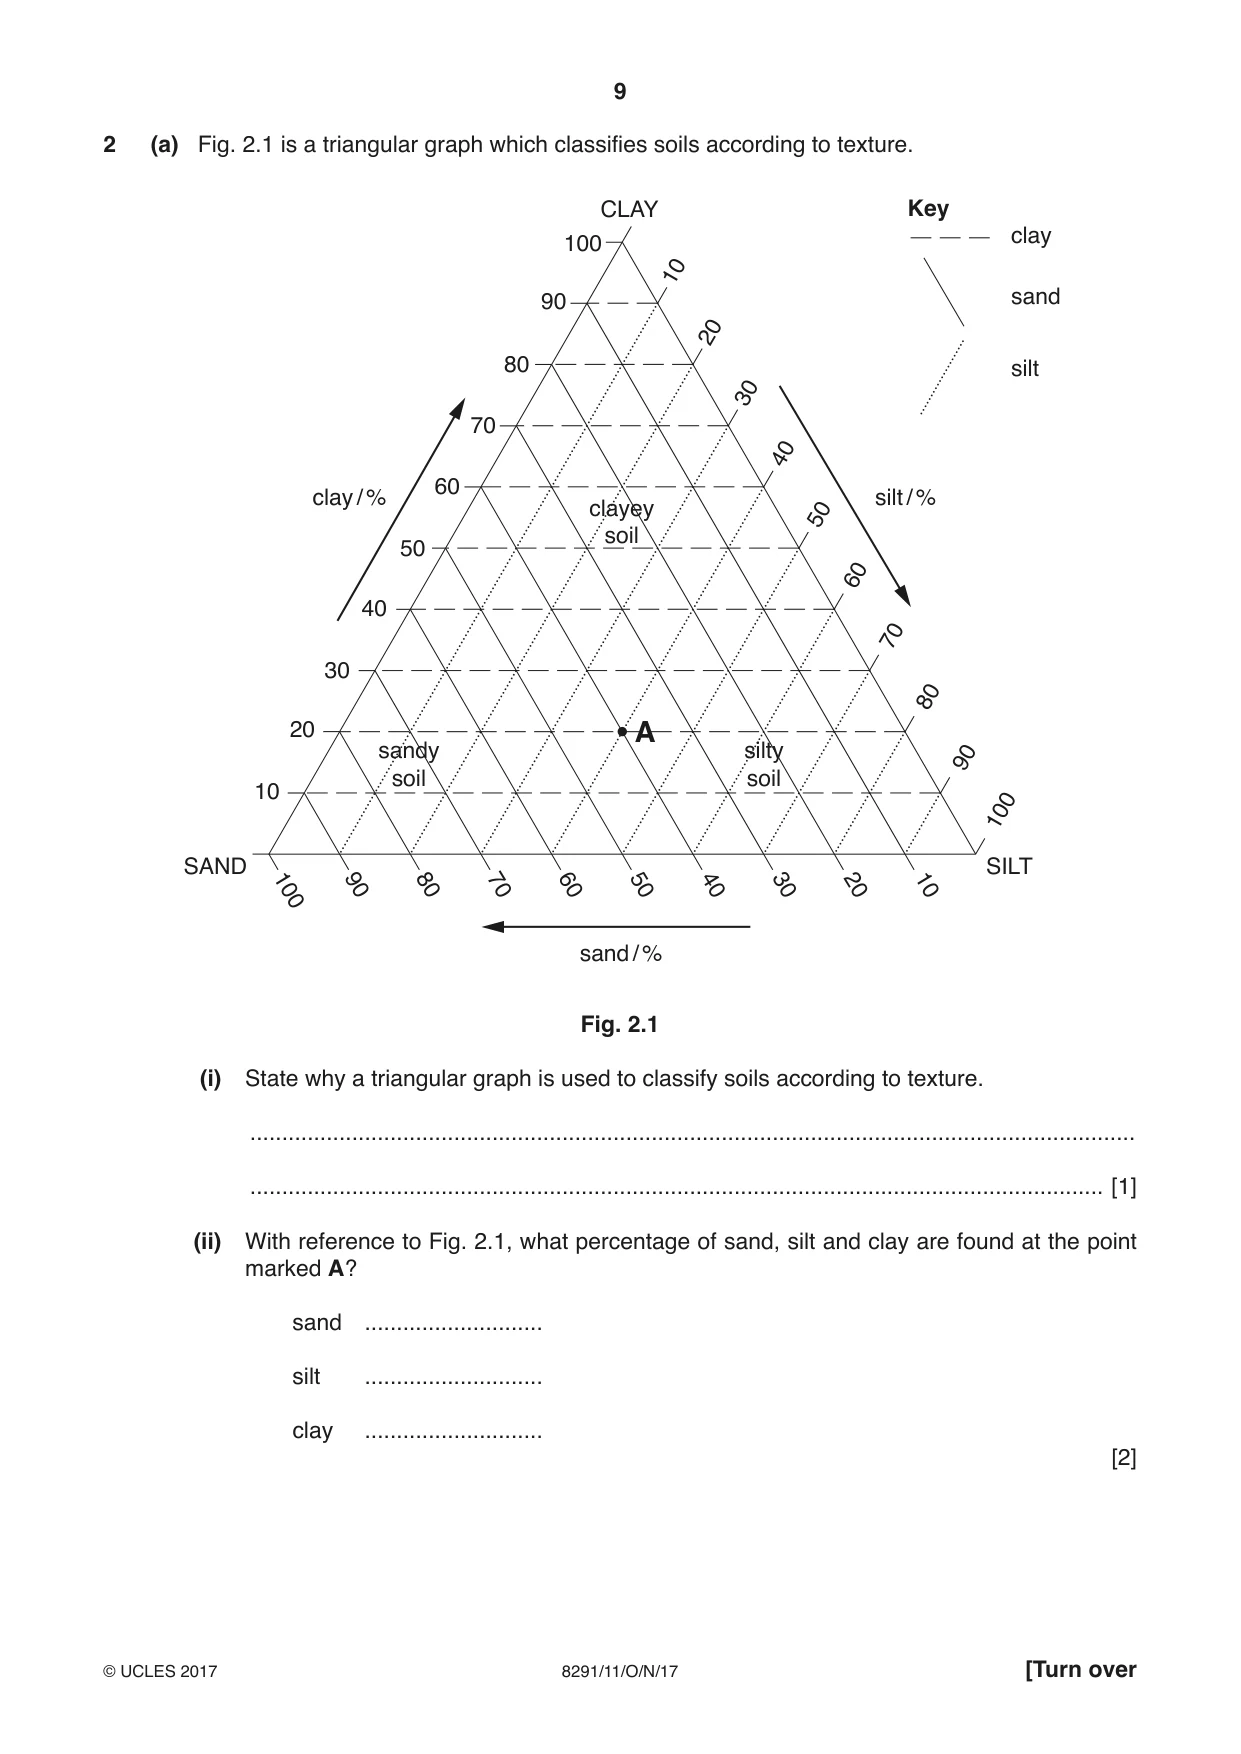
9 8291/11/O/N/17 © UCLES 2017 [Turn over 2 (a) Fig. 2.1 is a triangular graph which classifies soils according to texture. 100 10 20 30 40 50 60 70 80 90 100 90 80 70 60 50 clay / % clay sand silt clayey soil sandy soil silty soil sand / % silt / % 40 30 20 10 SAND SILT CLAY 100 90 80 70 60 50 40 30 20 10 A Key Fig. 2.1 (i) State why a triangular graph is used to classify soils according to texture. … … [1] (ii) With reference to Fig. 2.1, what percentage of sand, silt and clay are found at the point marked A? sand … silt … clay … [2]
Question paper, page 10
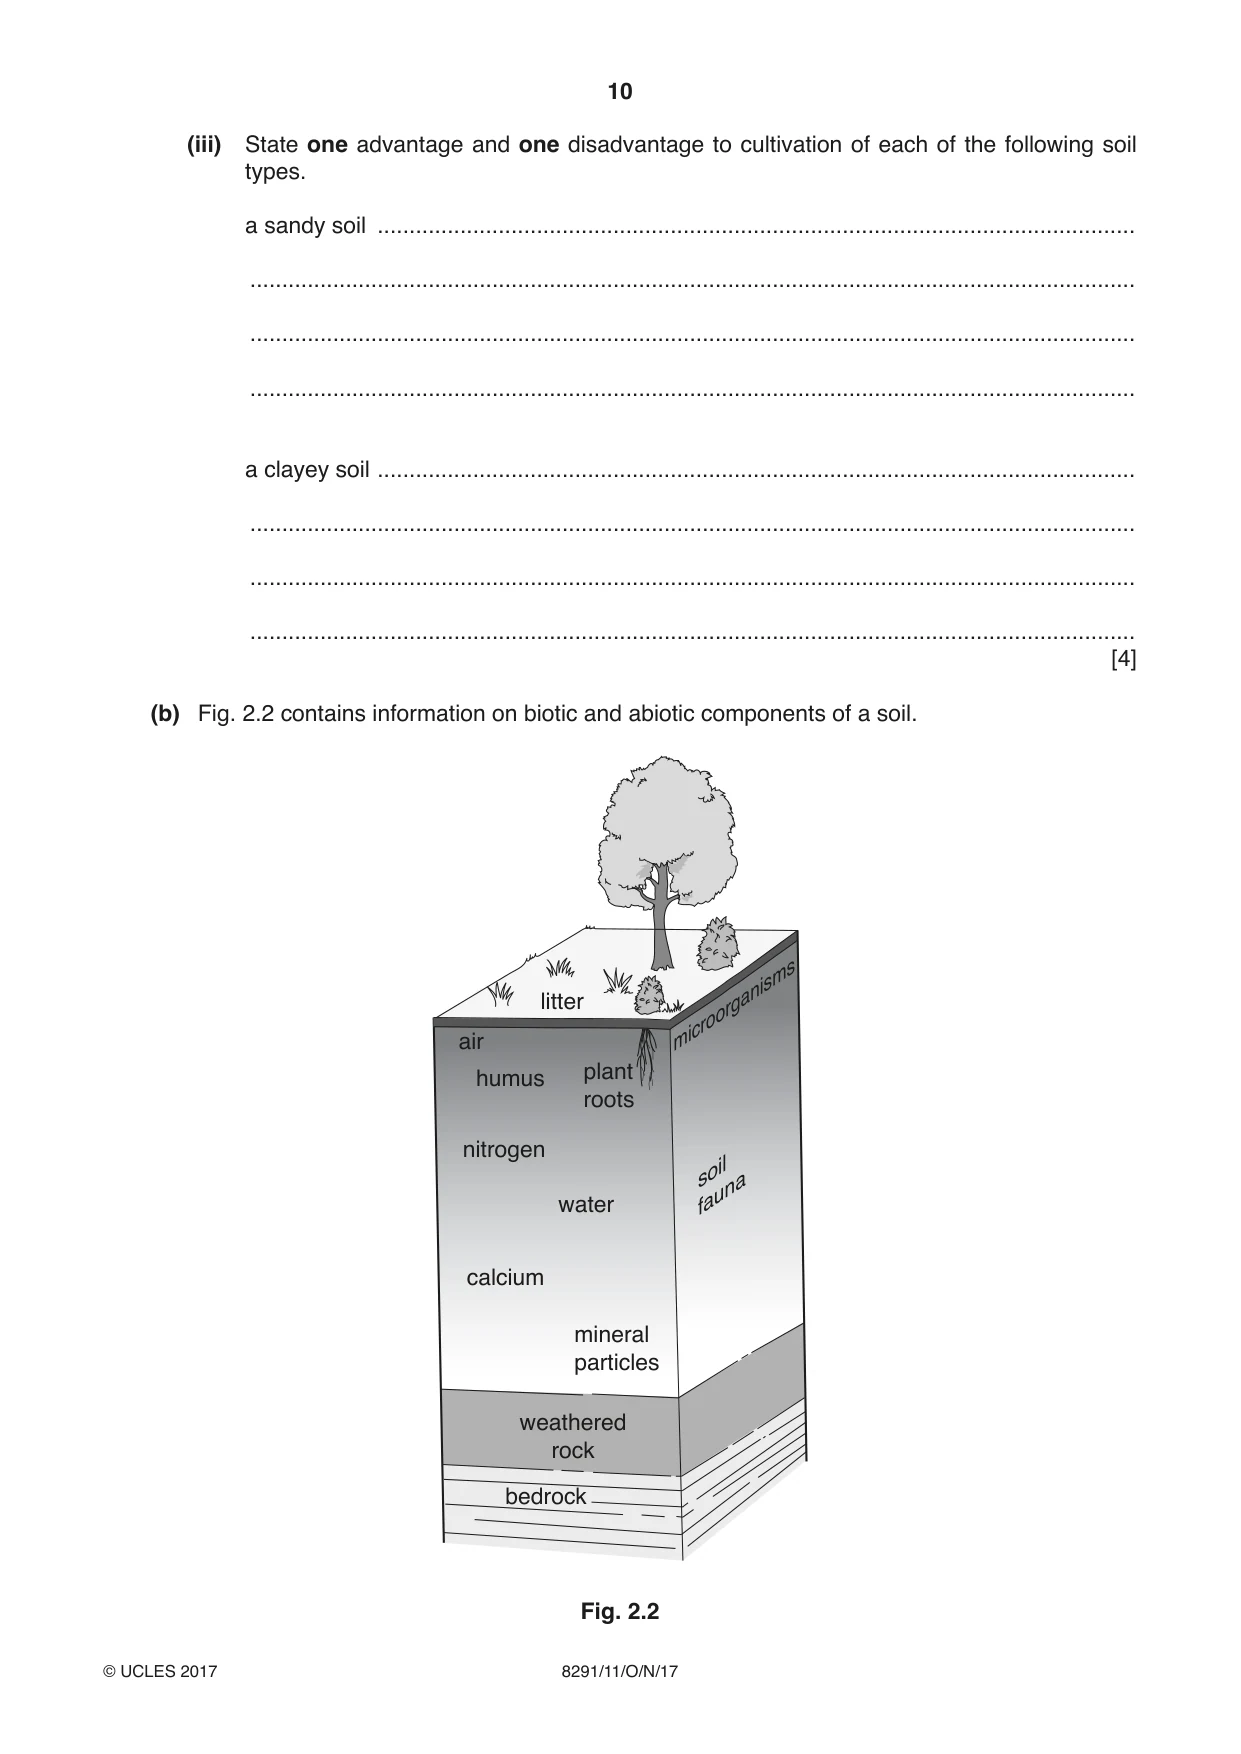
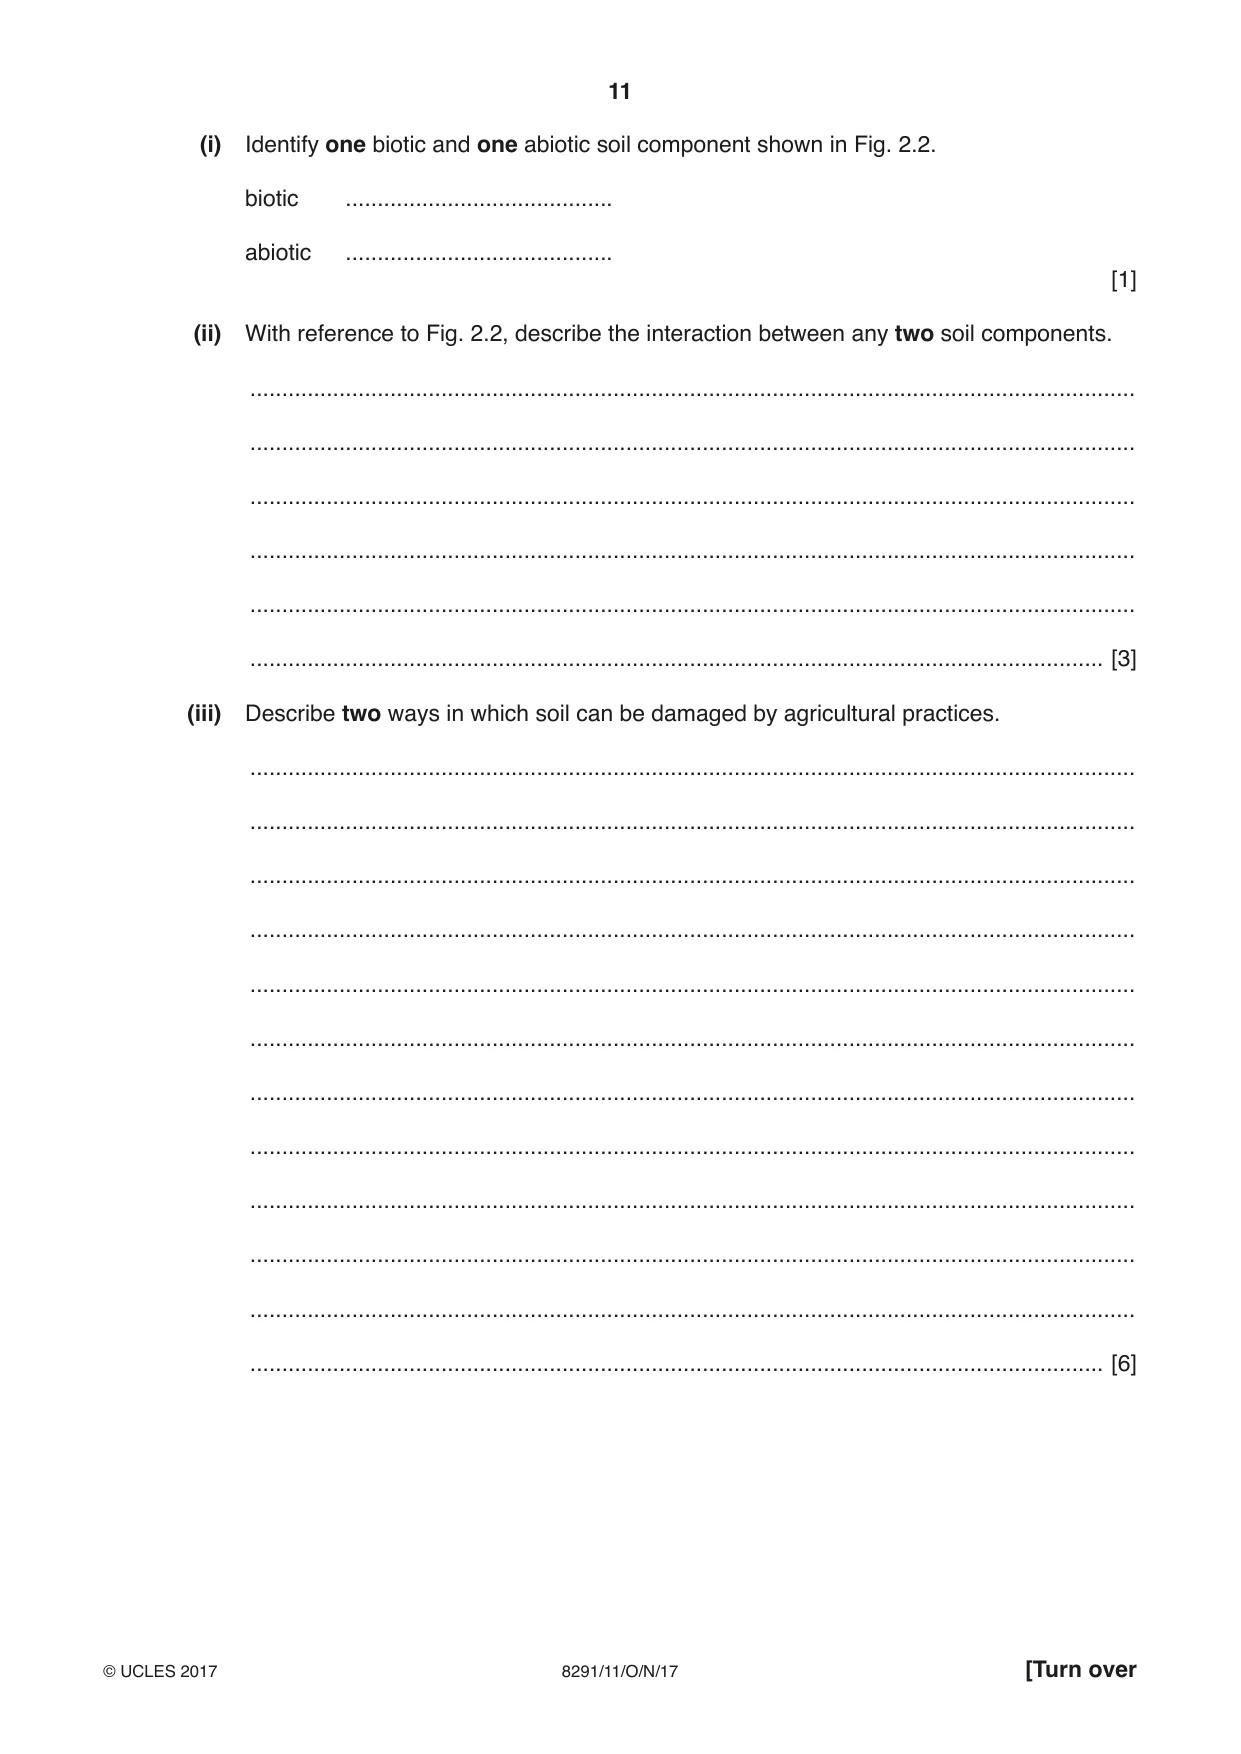
10 8291/11/O/N/17 © UCLES 2017 (iii) State one advantage and one disadvantage to cultivation of each of the following soil types. a sandy soil … … … … a clayey soil … … … … [4] (b) Fig. 2.2 contains information on biotic and abiotic components of a soil. litter air humus plant roots microorganisms soil fauna nitrogen water calcium mineral particles weathered rock bedrock Fig. 2.2
Question paper, page 11
11 8291/11/O/N/17 © UCLES 2017 [Turn over (i) Identify one biotic and one abiotic soil component shown in Fig. 2.2. biotic … abiotic … [1] (ii) With reference to Fig. 2.2, describe the interaction between any two soil components. … … … … … … [3] (iii) Describe two ways in which soil can be damaged by agricultural practices. … … … … … … … … … … … … [6]
Question paper, page 12
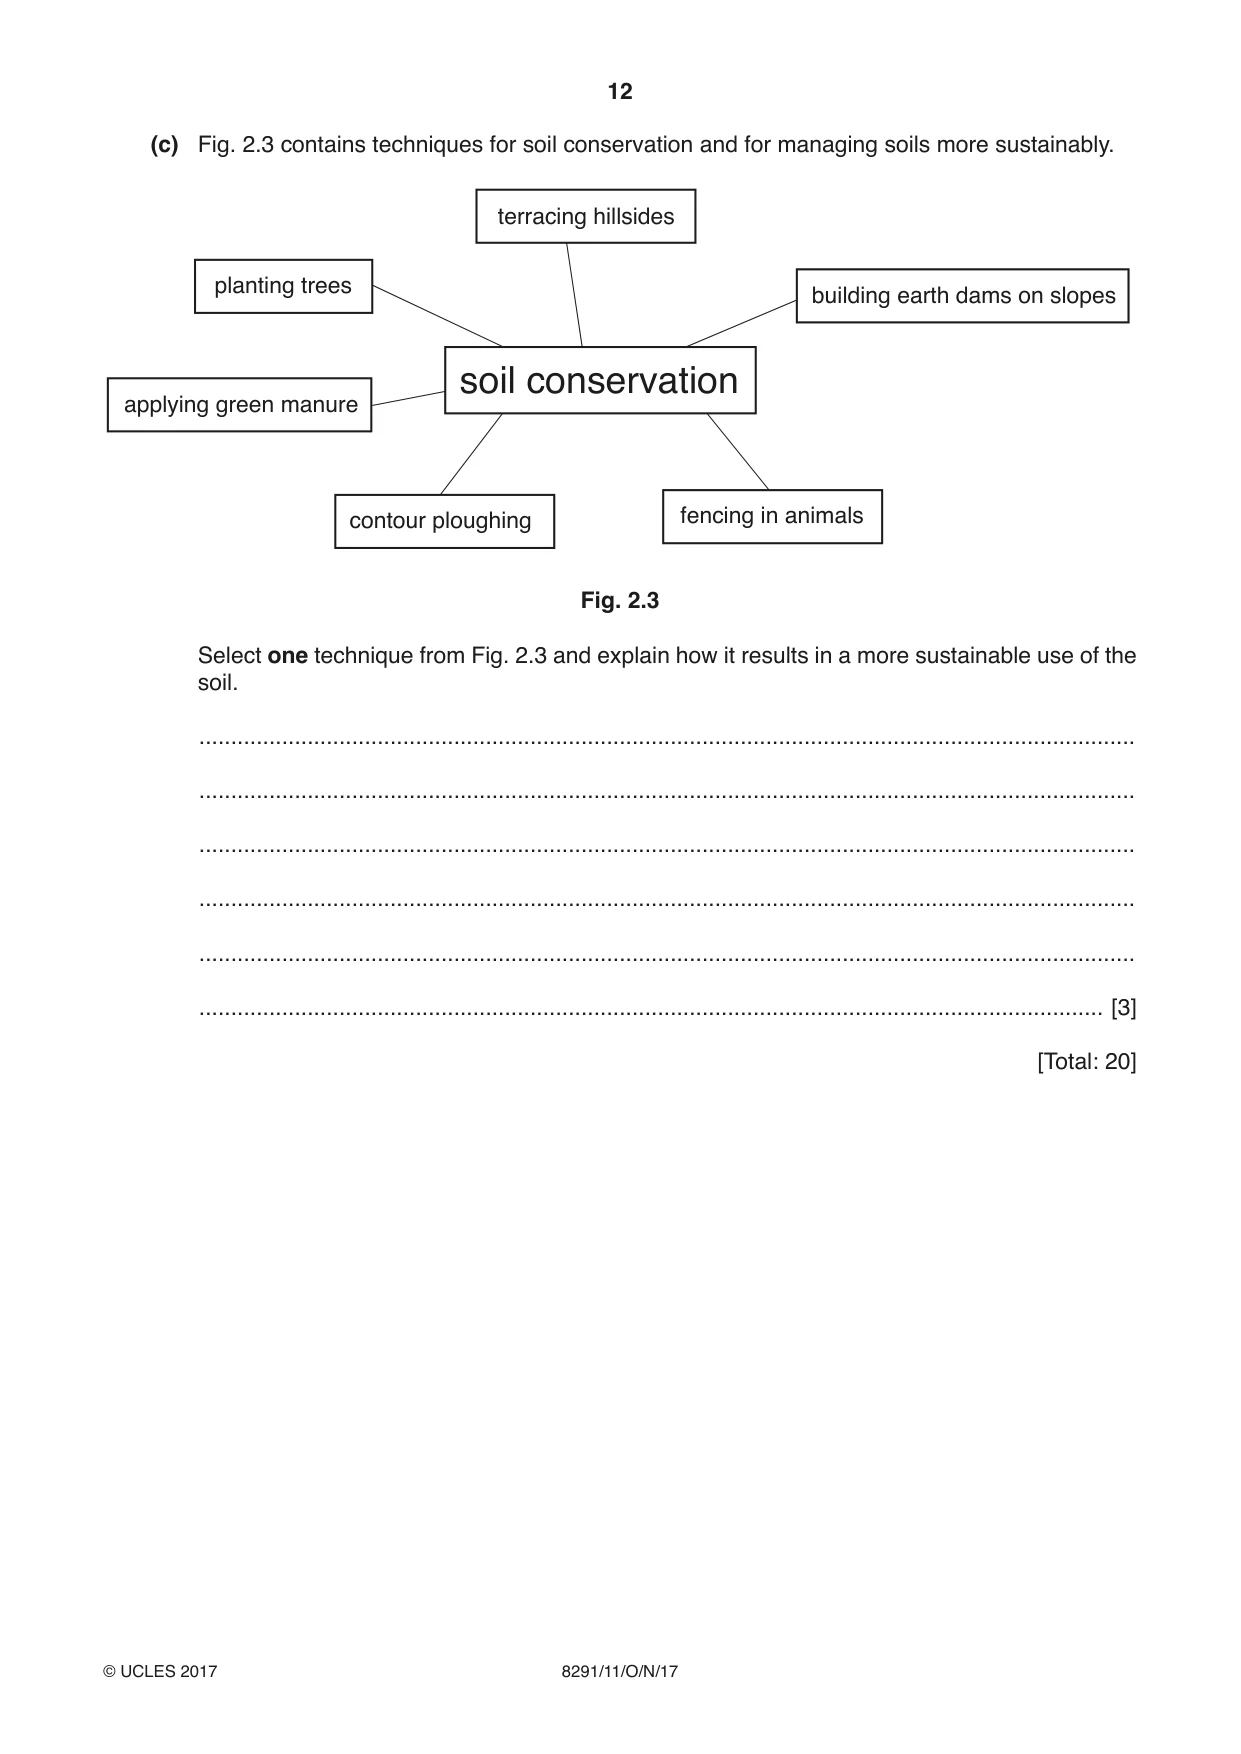
12 8291/11/O/N/17 © UCLES 2017 (c) Fig. 2.3 contains techniques for soil conservation and for managing soils more sustainably. terracing hillsides building earth dams on slopes planting trees applying green manure contour ploughing fencing in animals soil conservation Fig. 2.3 Select one technique from Fig. 2.3 and explain how it results in a more sustainable use of the soil. … … … … … … [3] [Total: 20]
Question paper, page 13
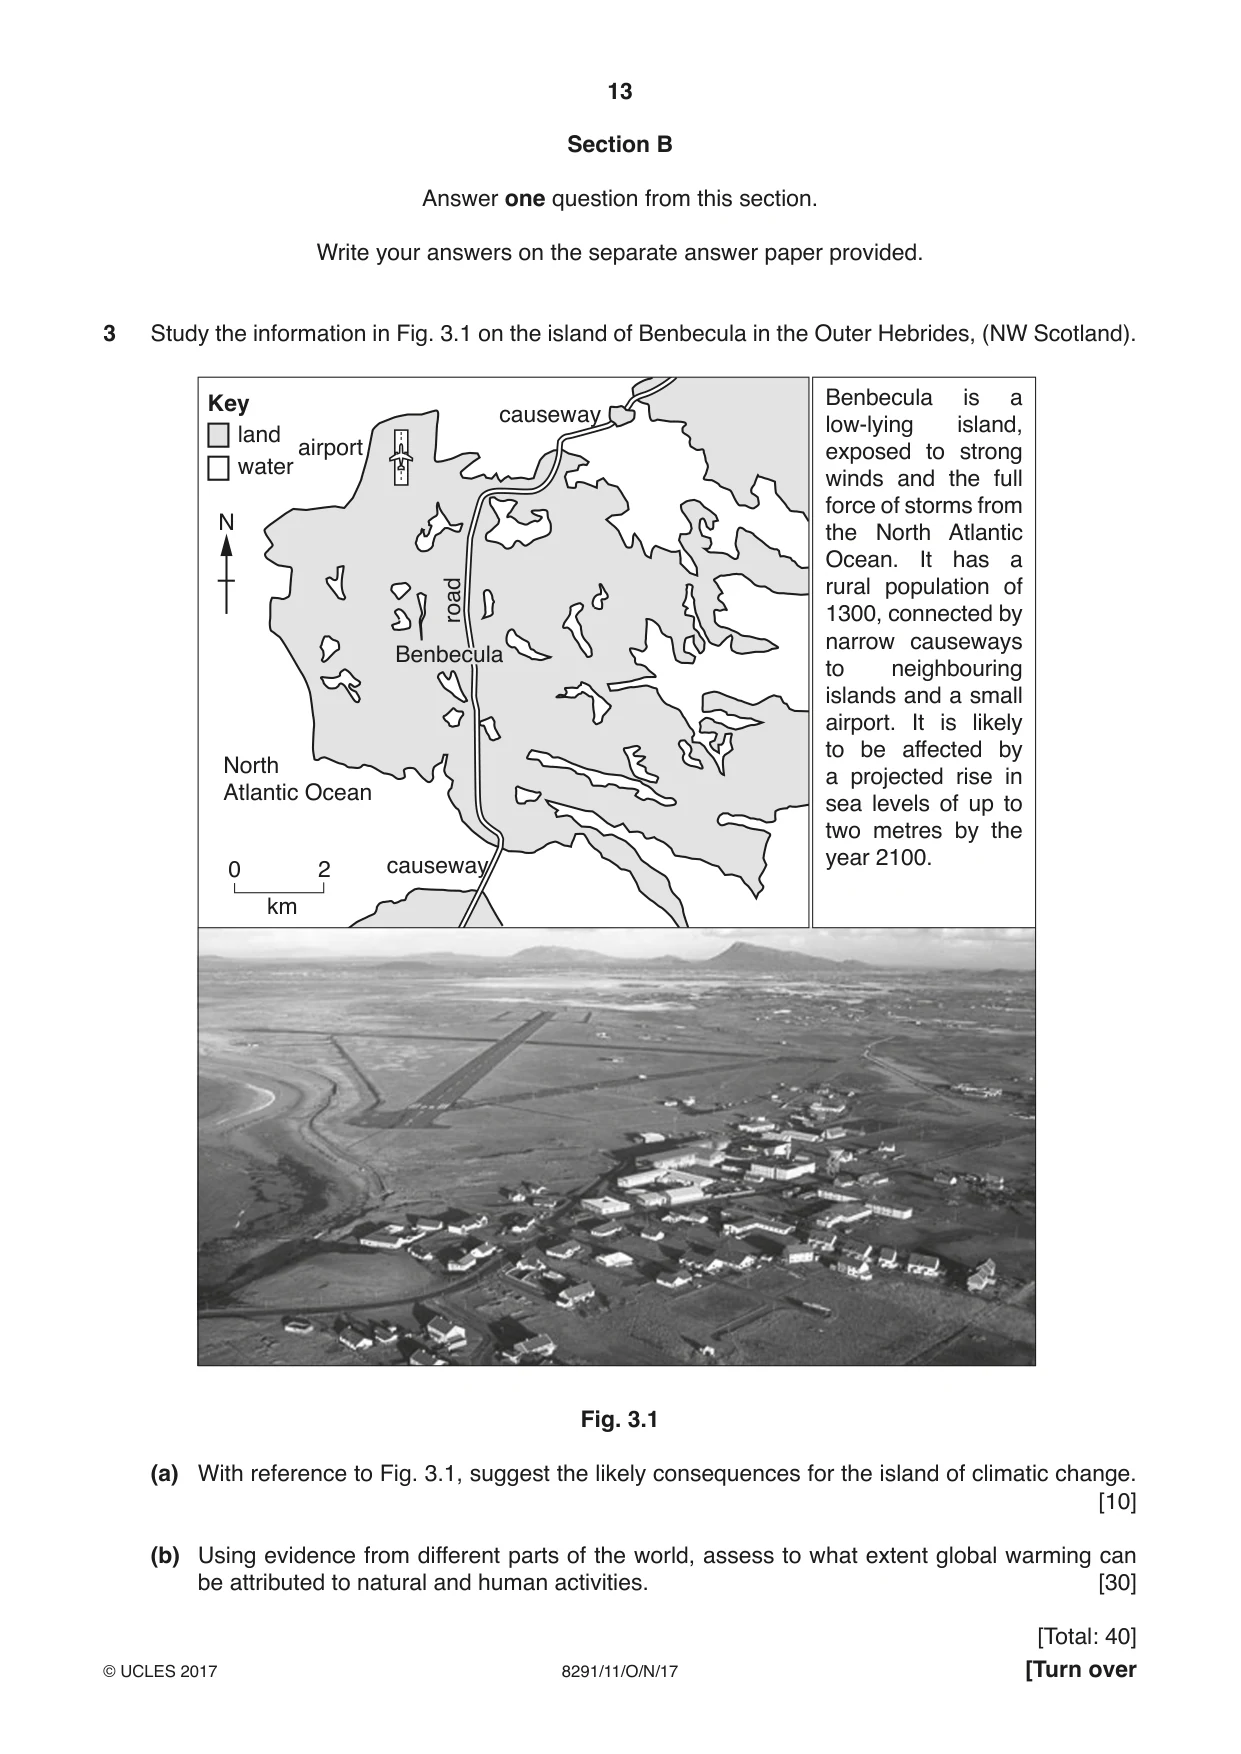
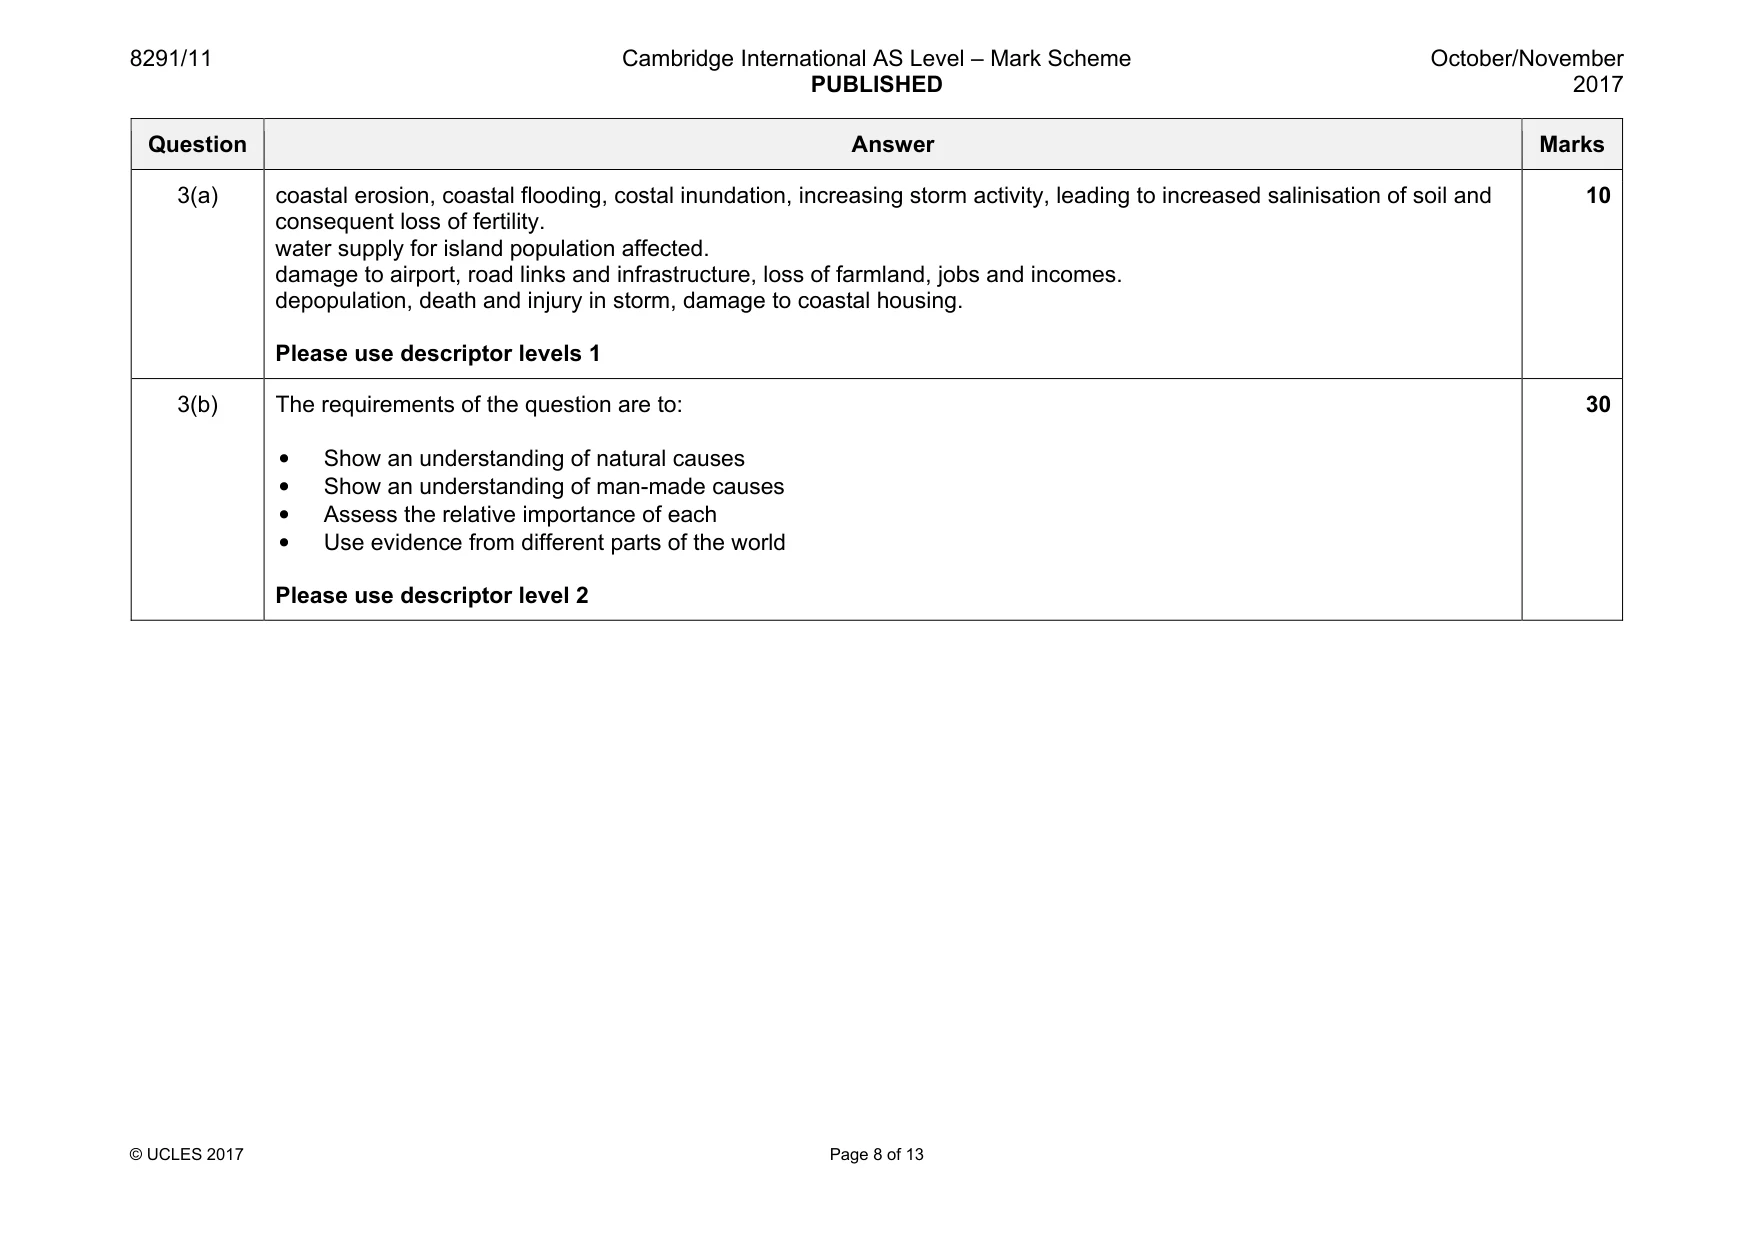
13 8291/11/O/N/17 © UCLES 2017 [Turn over Section B Answer one question from this section. Write your answers on the separate answer paper provided. 3 Study the information in Fig. 3.1 on the island of Benbecula in the Outer Hebrides, (NW Scotland). Benbecula is a low-lying island, exposed to strong winds and the full force of storms from the North Atlantic Ocean. It has a rural population of 1300, connected by narrow causeways to neighbouring islands and a small airport. It is likely to be affected by a projected rise in sea levels of up to two metres by the year 2100. N airport road causeway causeway North Atlantic Ocean 0 2 km Benbecula land water Key Fig. 3.1 (a) With reference to Fig. 3.1, suggest the likely consequences for the island of climatic change. [10] (b) Using evidence from different parts of the world, assess to what extent global warming can be attributed to natural and human activities. [30] [Total: 40]
Question paper, page 14
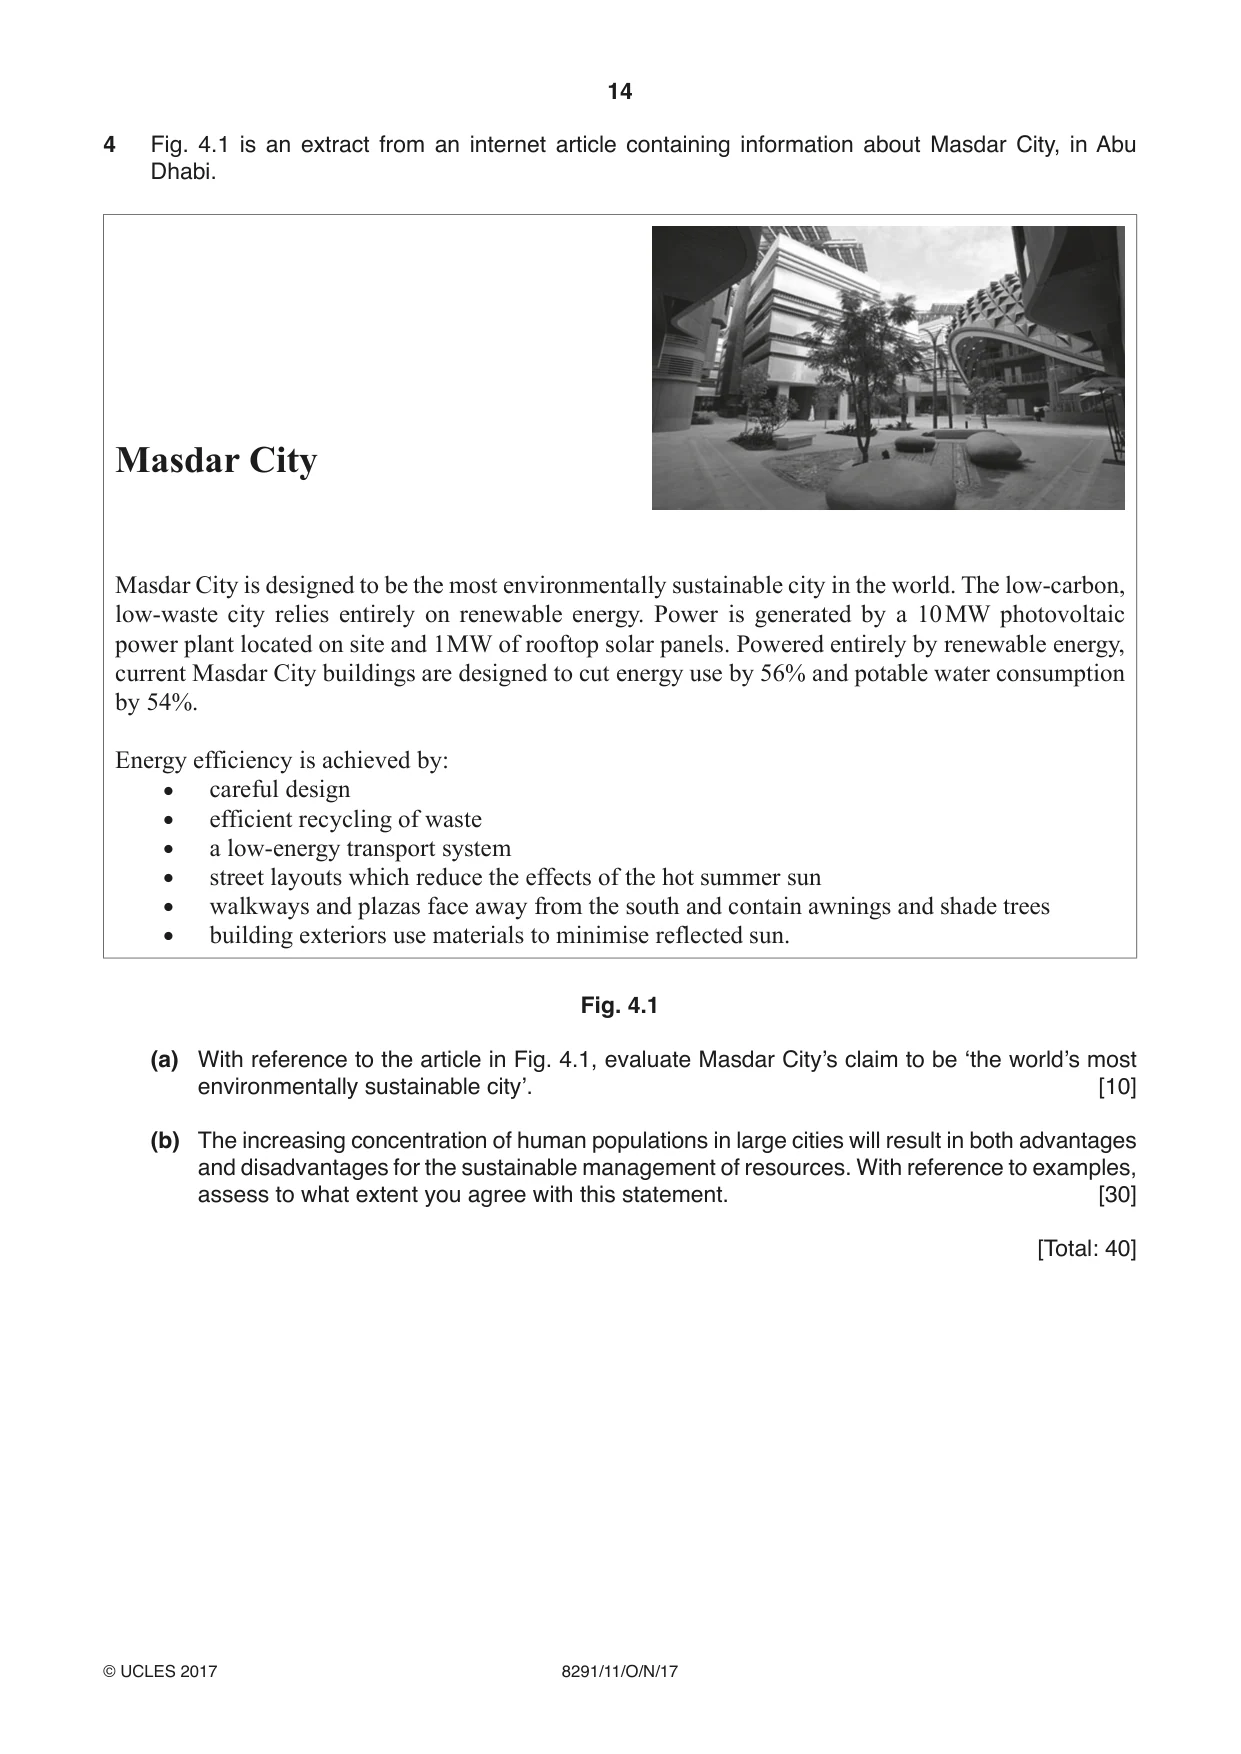
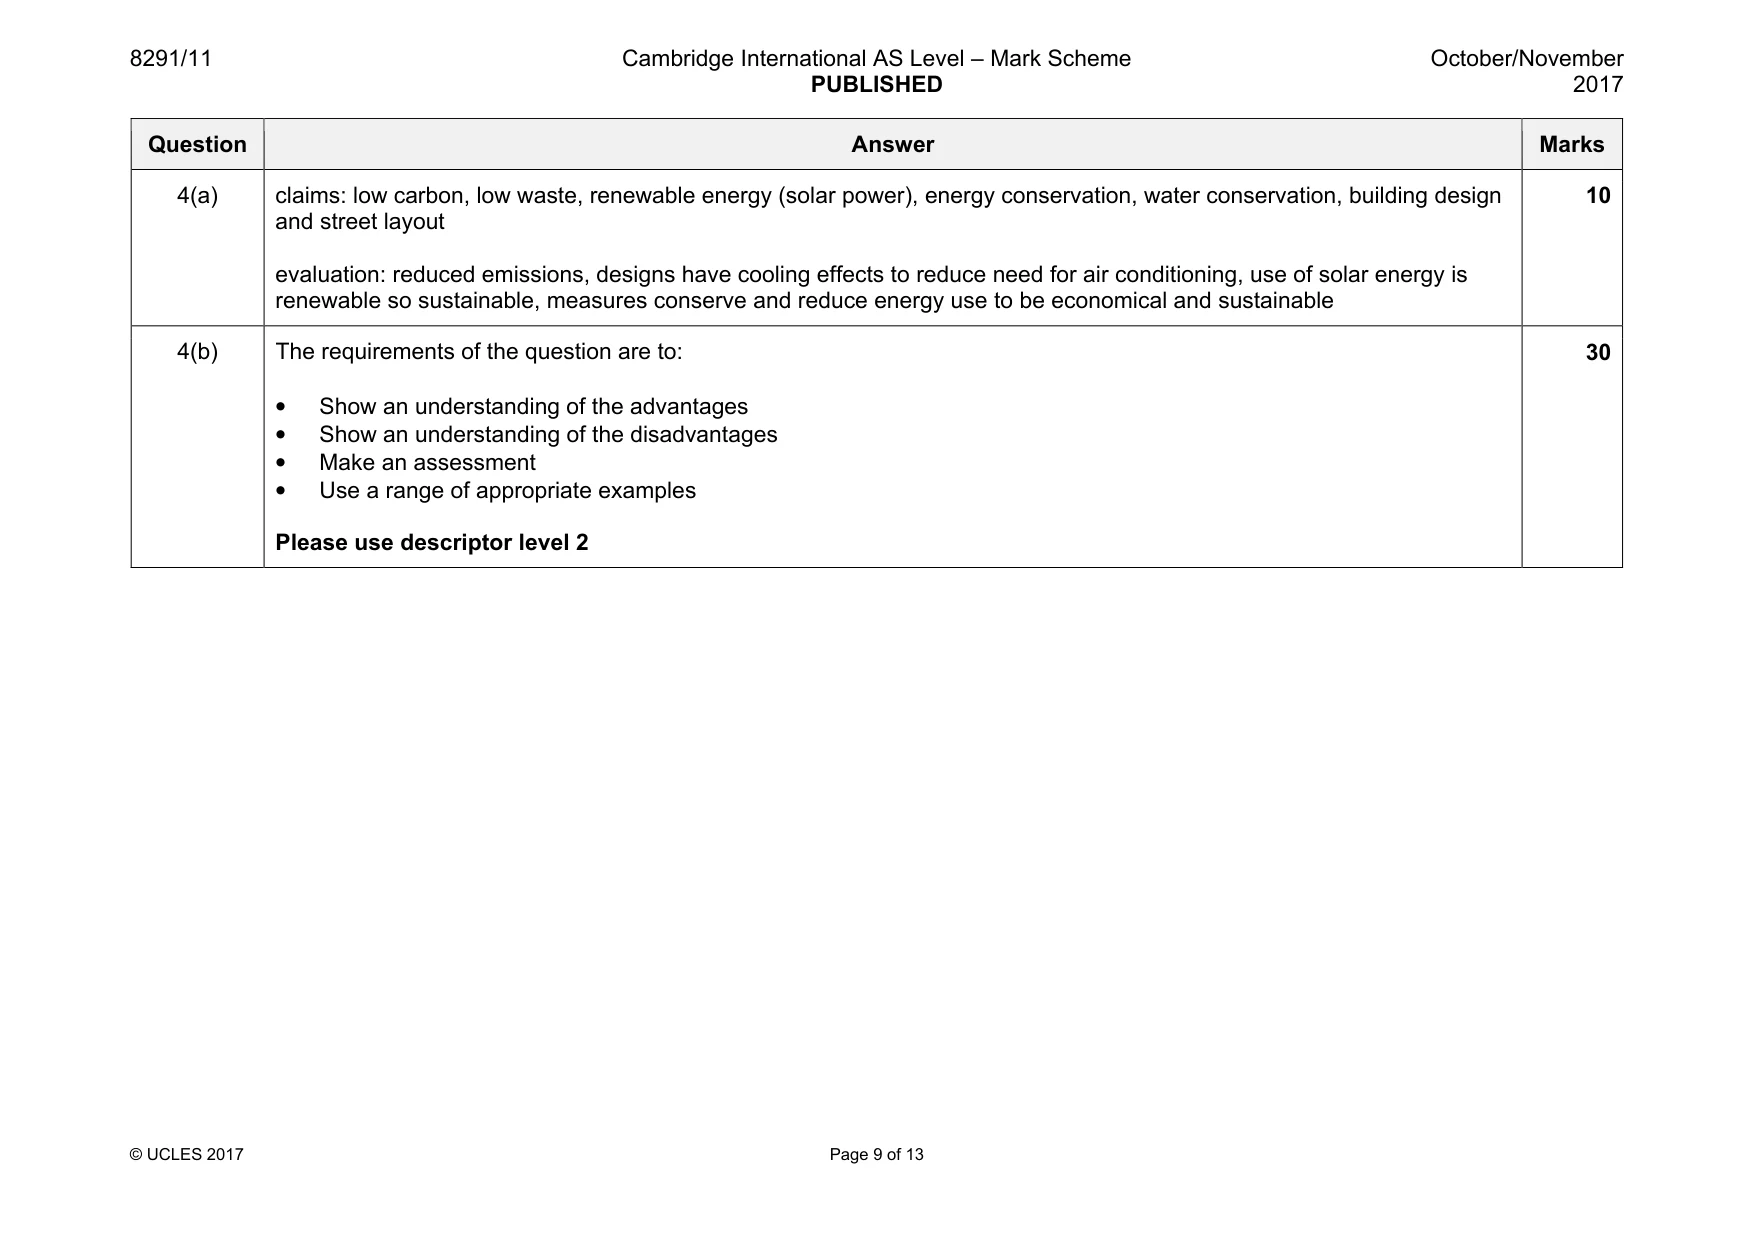
14 8291/11/O/N/17 © UCLES 2017 4 Fig. 4.1 is an extract from an internet article containing information about Masdar City, in Abu Dhabi. Masdar City Masdar City is designed to be the most environmentally sustainable city in the world. The low‑carbon, low‑waste city relies entirely on renewable energy. Power is generated by a 10 MW photovoltaic power plant located on site and 1 MW of rooftop solar panels. Powered entirely by renewable energy, current Masdar City buildings are designed to cut energy use by 56% and potable water consumption by 54%. Energy efficiency is achieved by: • careful design • efficient recycling of waste • a low‑energy transport system • street layouts which reduce the effects of the hot summer sun • walkways and plazas face away from the south and contain awnings and shade trees • building exteriors use materials to minimise reflected sun. Fig. 4.1 (a) With reference to the article in Fig. 4.1, evaluate Masdar City’s claim to be ‘the world’s most environmentally sustainable city’. [10] (b) The increasing concentration of human populations in large cities will result in both advantages and disadvantages for the sustainable management of resources. With reference to examples, assess to what extent you agree with this statement. [30] [Total: 40]
Question paper, page 15
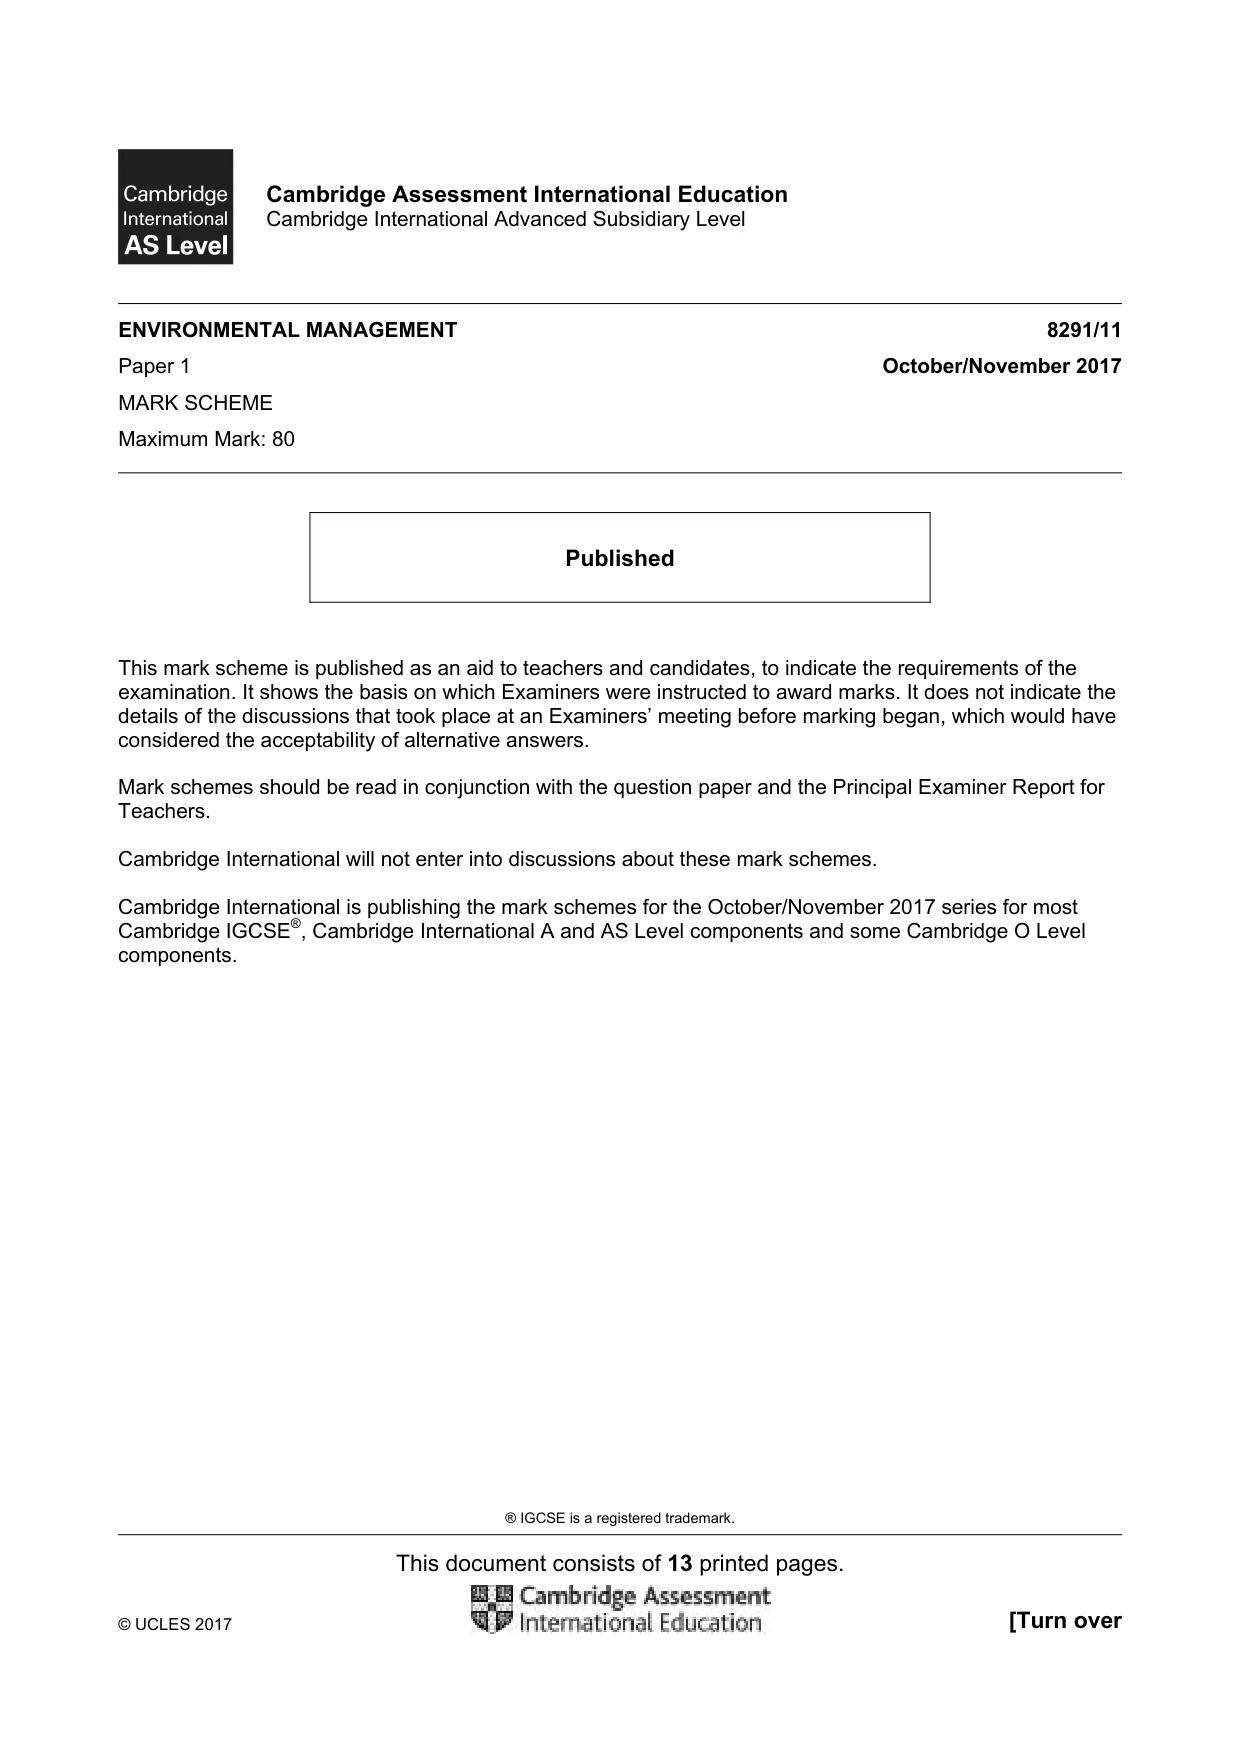
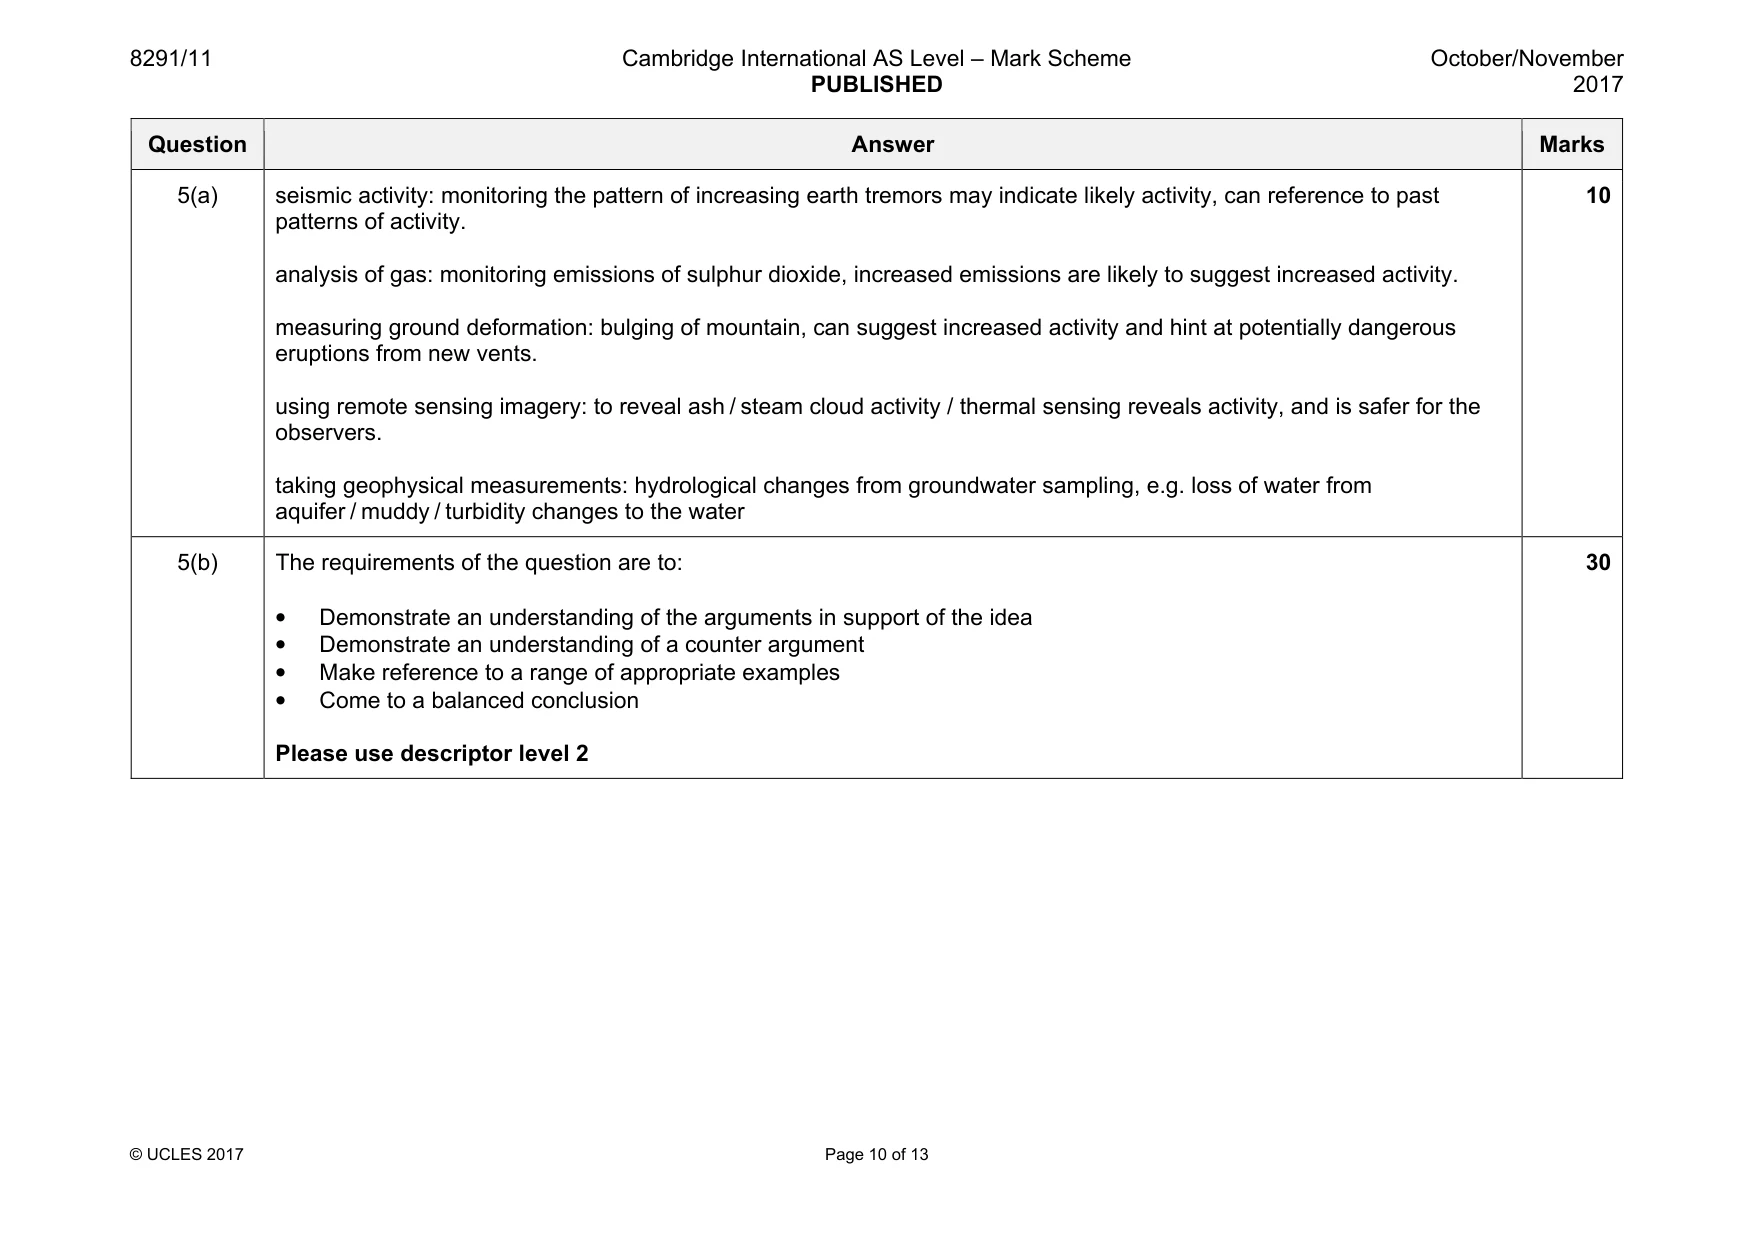
15 8291/11/O/N/17 © UCLES 2017 5 Fig. 5.1 shows a variety of methods for monitoring the level of activity within a volcano. remote sensing ground deformation seismic activity recent lava flow gas sampling groundwater sampling geological observations Fig. 5.1 (a) With reference to the methods shown in Fig. 5.1, outline how monitoring may help scientists predict volcanic eruptions. [10] (b) With reference to examples, in what ways are MEDCs better able to withstand a major tectonic hazard event than LEDCs? [30] [Total: 40]
Question paper, page 16
16 8291/11/O/N/17 © UCLES 2017 BLANK PAGE Permission to reproduce items where third-party owned material protected by copyright is included has been sought and cleared where possible. Every reasonable effort has been made by the publisher (UCLES) to trace copyright holders, but if any items requiring clearance have unwittingly been included, the publisher will be pleased to make amends at the earliest possible opportunity. To avoid the issue of disclosure of answer-related information to candidates, all copyright acknowledgements are reproduced online in the Cambridge International Examinations Copyright Acknowledgements Booklet. This is produced for each series of examinations and is freely available to download at www.cie.org.uk after the live examination series. Cambridge International Examinations is part of the Cambridge Assessment Group. Cambridge Assessment is the brand name of University of Cambridge Local Examinations Syndicate (UCLES), which is itself a department of the University of Cambridge.
Mark scheme, page 1
® IGCSE is a registered trademark. This document consists of 13 printed pages. © UCLES 2017 [Turn over Cambridge Assessment International Education Cambridge International Advanced Subsidiary Level ENVIRONMENTAL MANAGEMENT 8291/11 Paper 1 October/November 2017 MARK SCHEME Maximum Mark: 80 Published This mark scheme is published as an aid to teachers and candidates, to indicate the requirements of the examination. It shows the basis on which Examiners were instructed to award marks. It does not indicate the details of the discussions that took place at an Examiners’ meeting before marking began, which would have considered the acceptability of alternative answers. Mark schemes should be read in conjunction with the question paper and the Principal Examiner Report for Teachers. Cambridge International will not enter into discussions about these mark schemes. Cambridge International is publishing the mark schemes for the October/November 2017 series for most Cambridge IGCSE®, Cambridge International A and AS Level components and some Cambridge O Level components.
Mark scheme, page 2
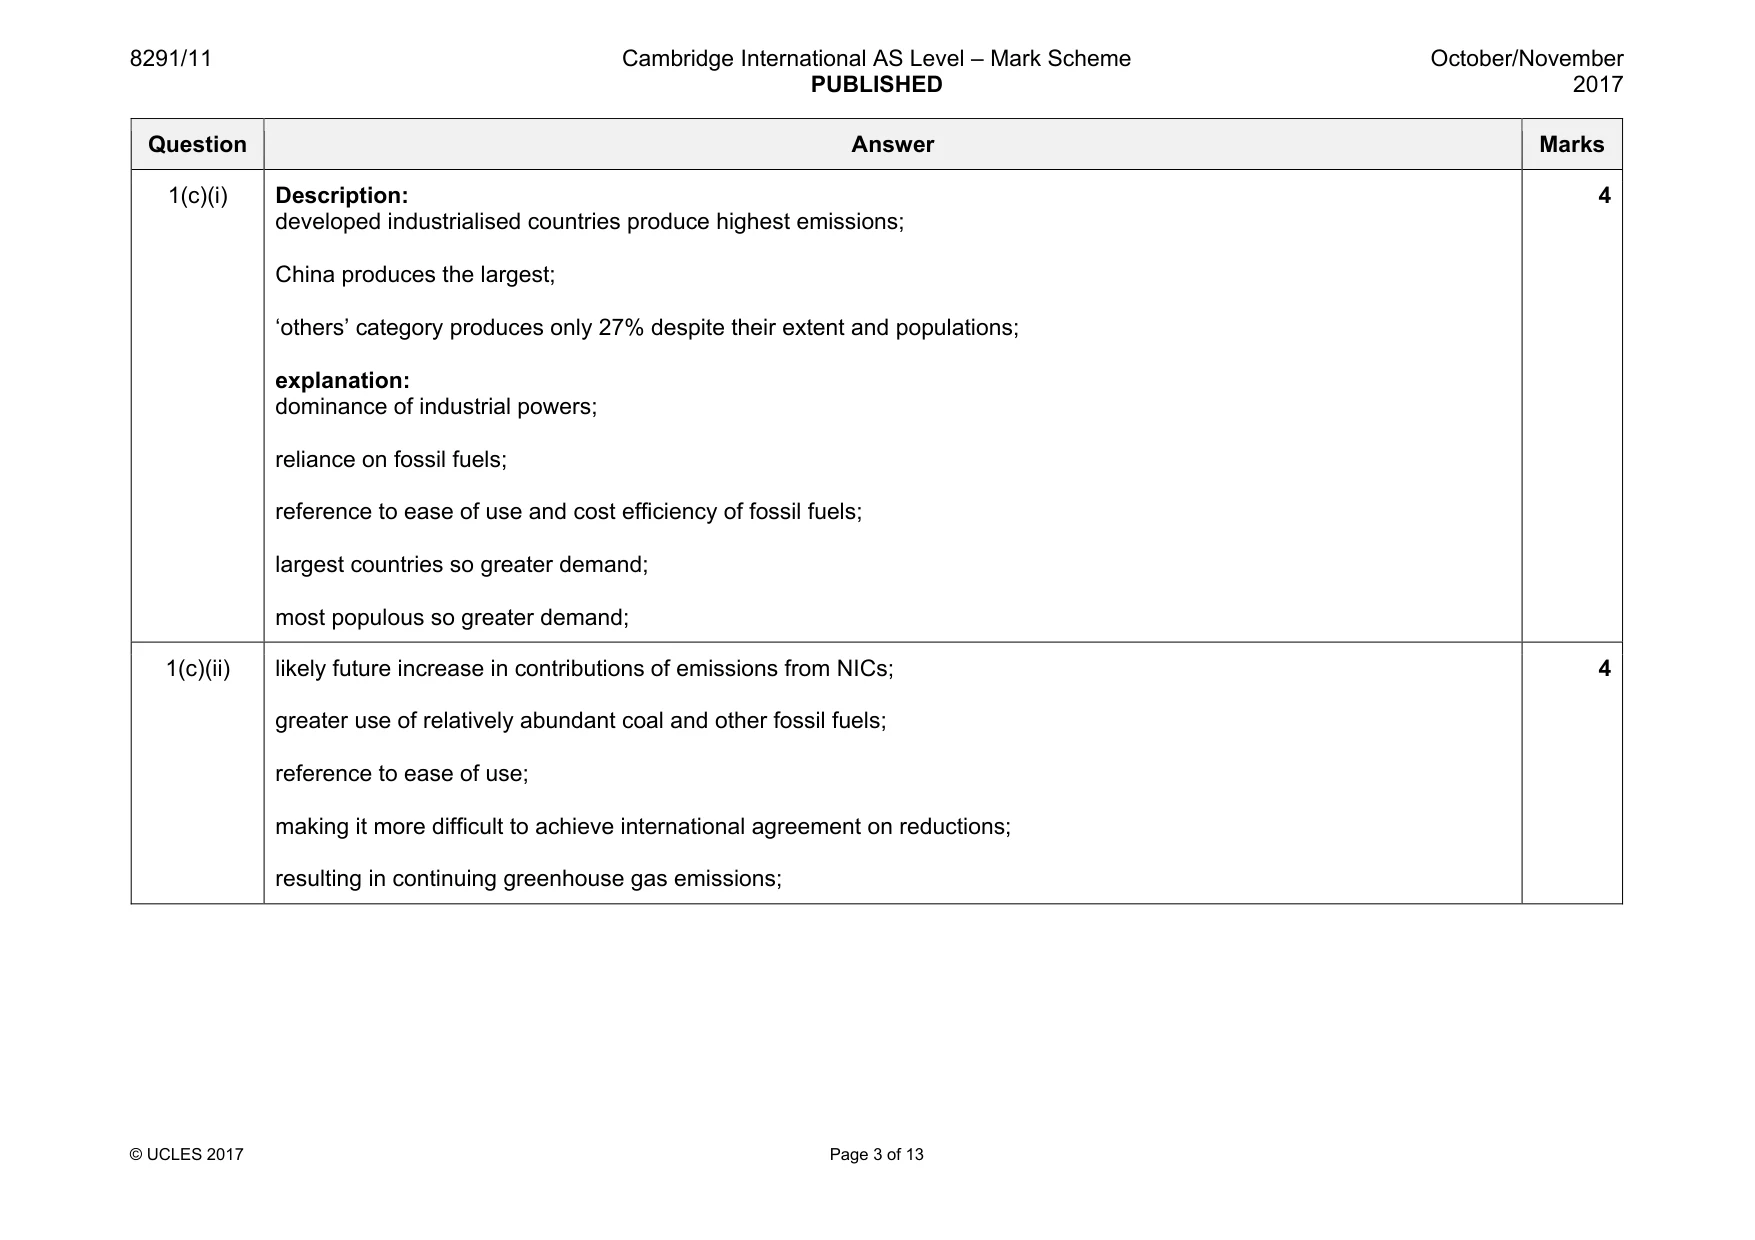
8291/11 Cambridge International AS Level – Mark Scheme PUBLISHED October/November 2017 © UCLES 2017 Page 2 of 13 Question Answer Marks 1(a)(i) a gas that absorbs infrared radiation / emits heat in the infrared region / is responsible for the greenhouse effect / traps heat in the atmosphere; 1 1(a)(ii) rising total; accelerating total; increasing contribution from energy and transport; increasing contribution from industrial processes; 2 1(a)(iii) CO2 produced by the burning of fossil fuels; in (thermal) power plants; release of methane gas; from gas and oil production processes; 2 1(a)(iv) 4 components correct (2 marks) / 3 components correct; (1 mark) correct scale and label for y axis; (1 mark) valid key; (1 mark) 4 1(b) carbon dioxide major contributor by volume / % ORA; methane most powerful / greatest warming potential ORA; methane concentration is increasing most rapidly ORA; methane contribution is shorter lived ORA; 3
Mark scheme, page 3
8291/11 Cambridge International AS Level – Mark Scheme PUBLISHED October/November 2017 © UCLES 2017 Page 3 of 13 Question Answer Marks 1(c)(i) Description: developed industrialised countries produce highest emissions; China produces the largest; ‘others’ category produces only 27% despite their extent and populations; explanation: dominance of industrial powers; reliance on fossil fuels; reference to ease of use and cost efficiency of fossil fuels; largest countries so greater demand; most populous so greater demand; 4 1(c)(ii) likely future increase in contributions of emissions from NICs; greater use of relatively abundant coal and other fossil fuels; reference to ease of use; making it more difficult to achieve international agreement on reductions; resulting in continuing greenhouse gas emissions; 4
Mark scheme, page 4
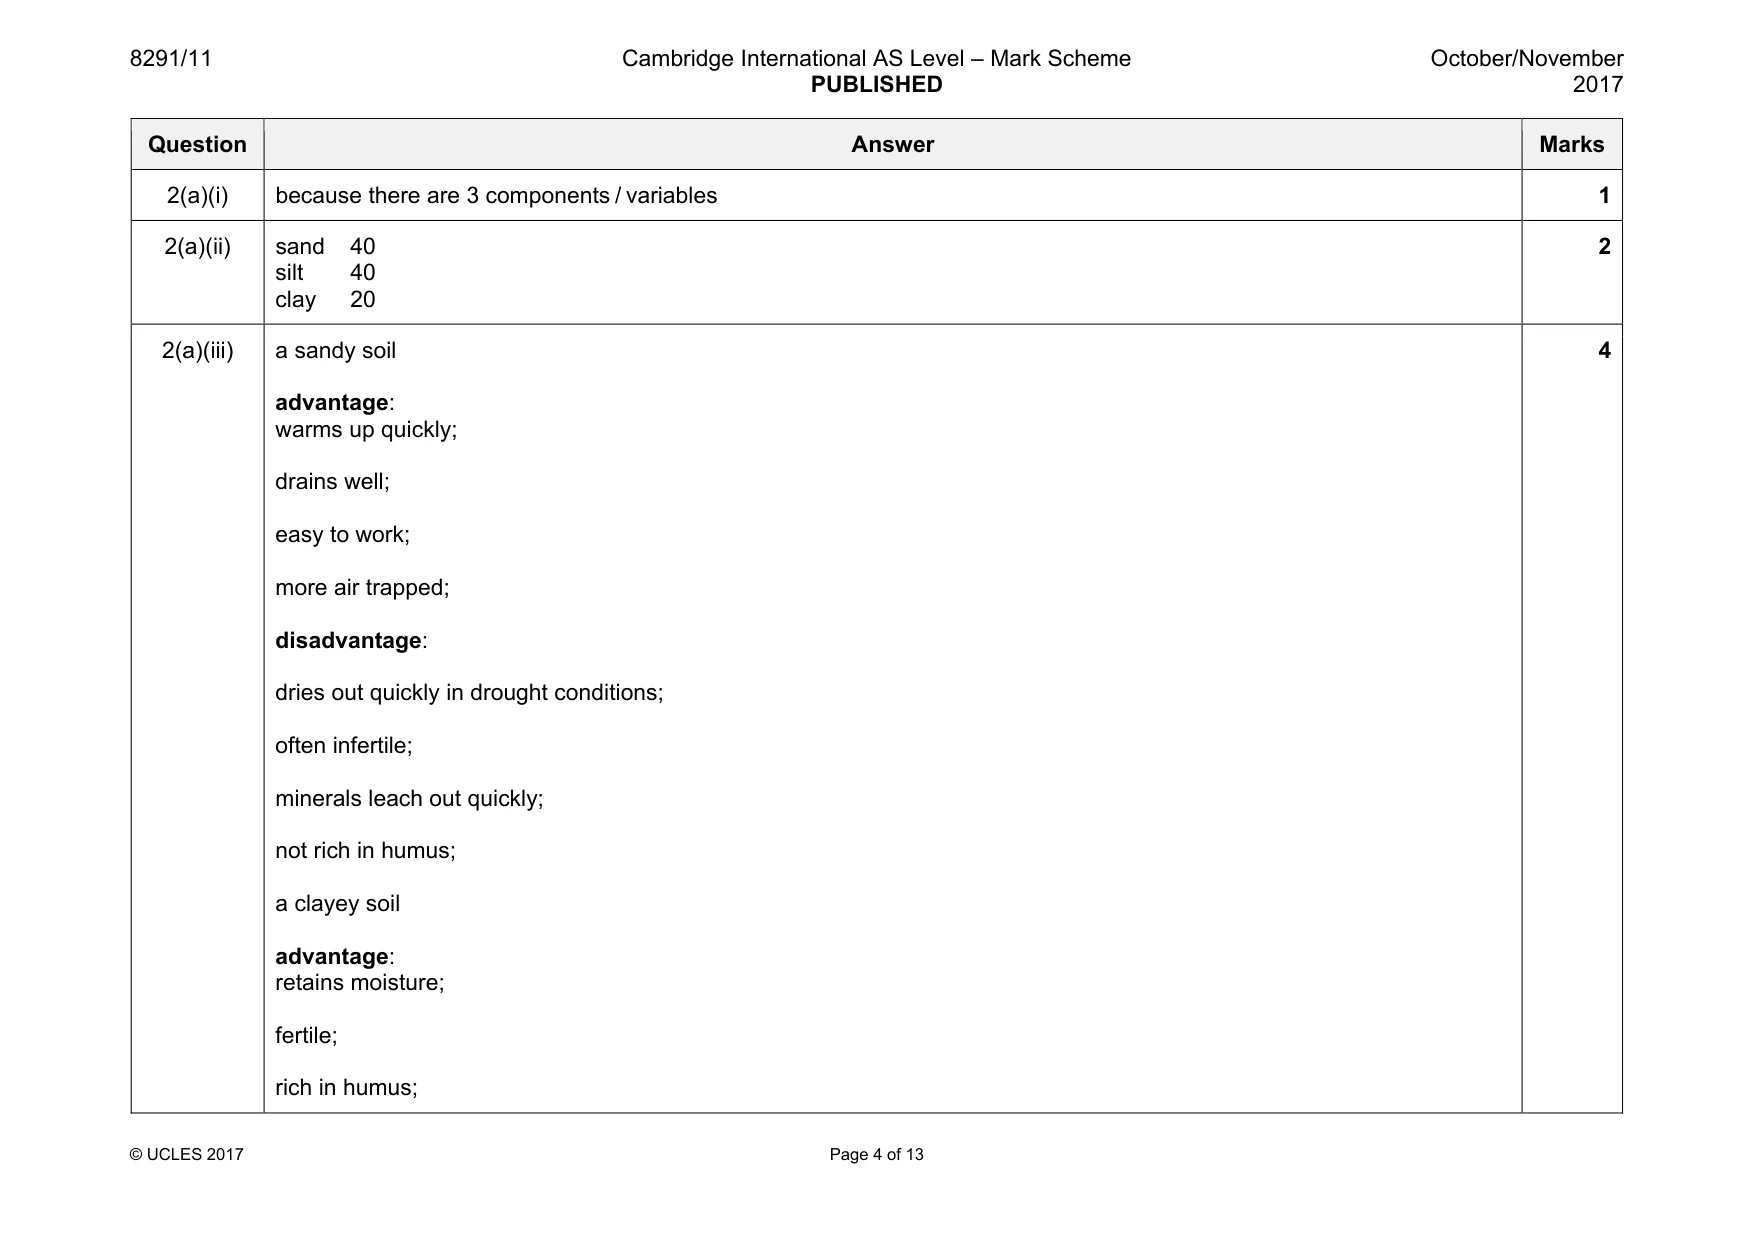
8291/11 Cambridge International AS Level – Mark Scheme PUBLISHED October/November 2017 © UCLES 2017 Page 4 of 13 Question Answer Marks 2(a)(i) because there are 3 components / variables 1 2(a)(ii) sand 40 silt 40 clay 20 2 2(a)(iii) a sandy soil advantage: warms up quickly; drains well; easy to work; more air trapped; disadvantage: dries out quickly in drought conditions; often infertile; minerals leach out quickly; not rich in humus; a clayey soil advantage: retains moisture; fertile; rich in humus; 4
Mark scheme, page 5
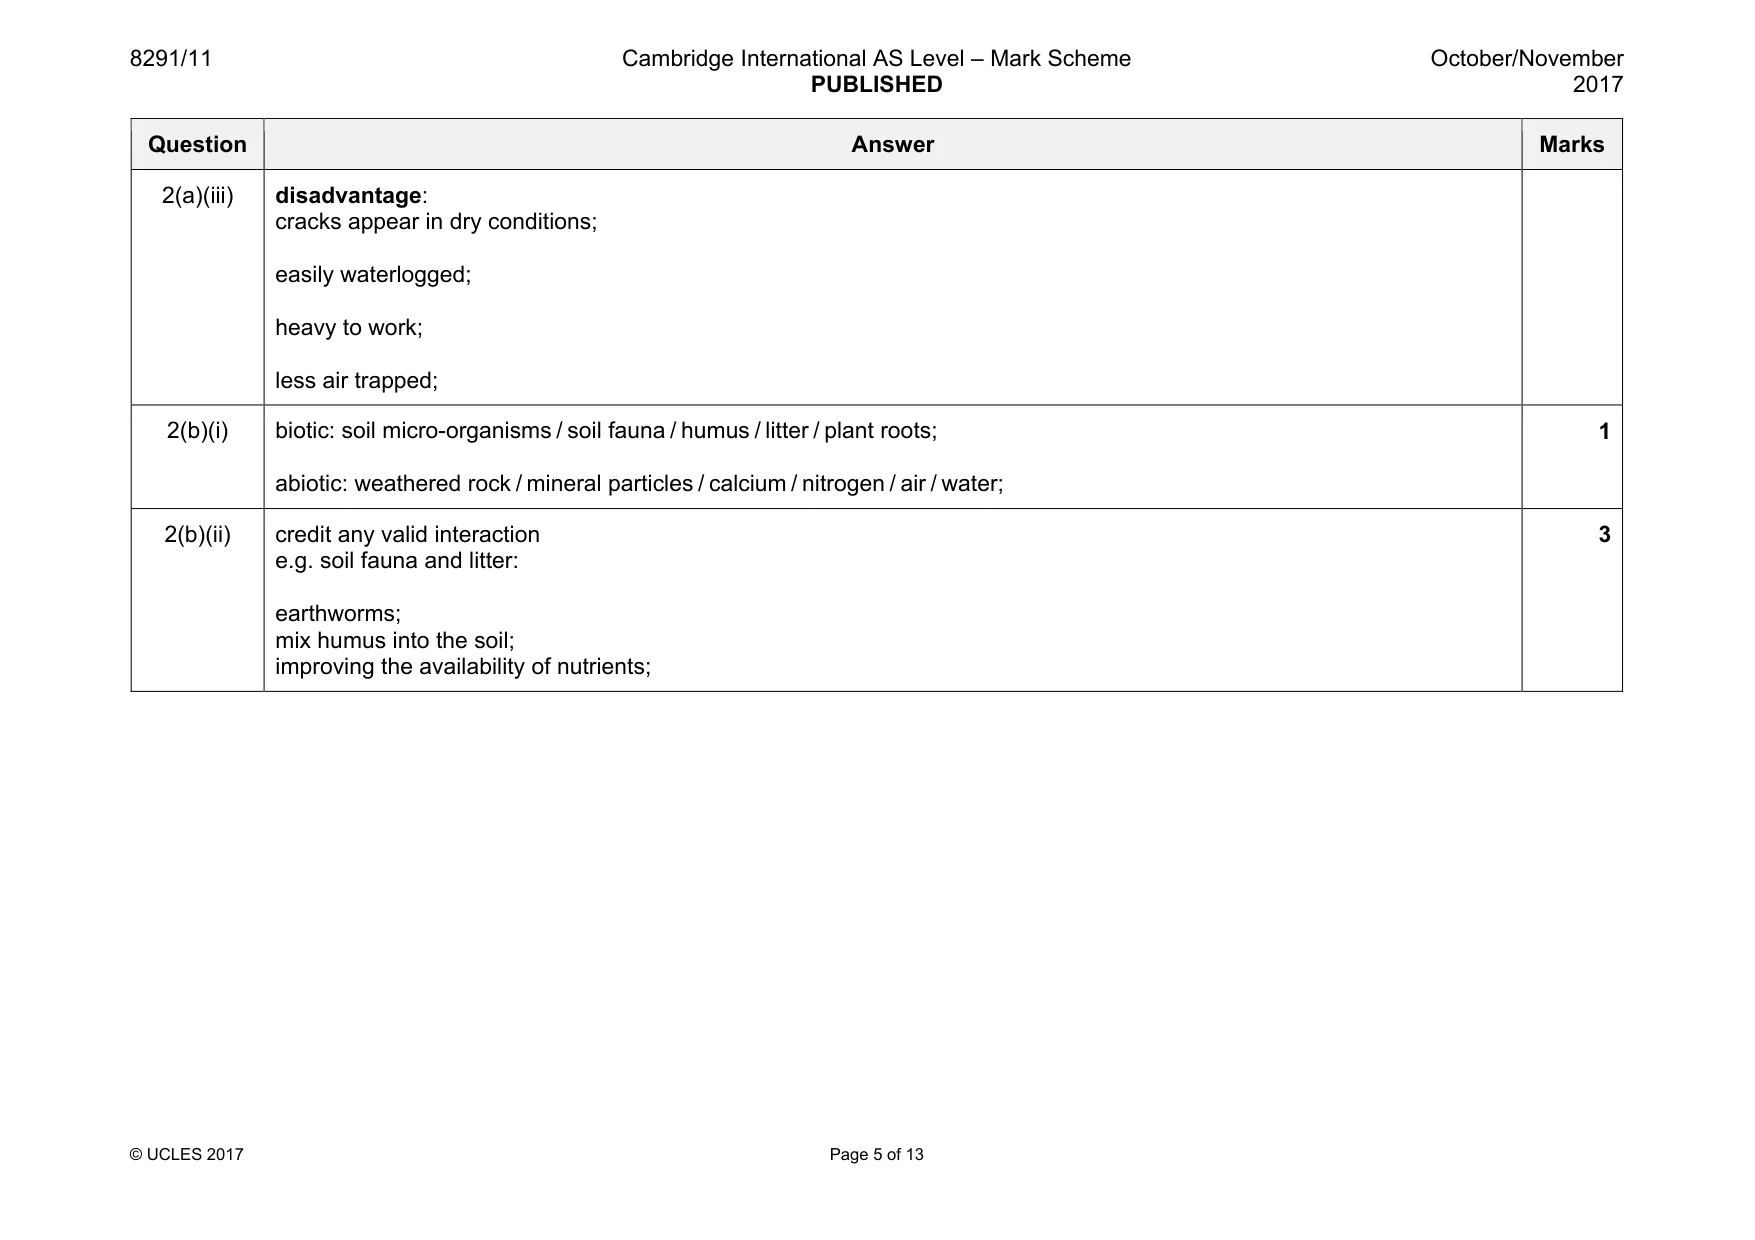
8291/11 Cambridge International AS Level – Mark Scheme PUBLISHED October/November 2017 © UCLES 2017 Page 5 of 13 Question Answer Marks 2(a)(iii) disadvantage: cracks appear in dry conditions; easily waterlogged; heavy to work; less air trapped; 2(b)(i) biotic: soil micro-organisms / soil fauna / humus / litter / plant roots; abiotic: weathered rock / mineral particles / calcium / nitrogen / air / water; 1 2(b)(ii) credit any valid interaction e.g. soil fauna and litter: earthworms; mix humus into the soil; improving the availability of nutrients; 3
Mark scheme, page 6
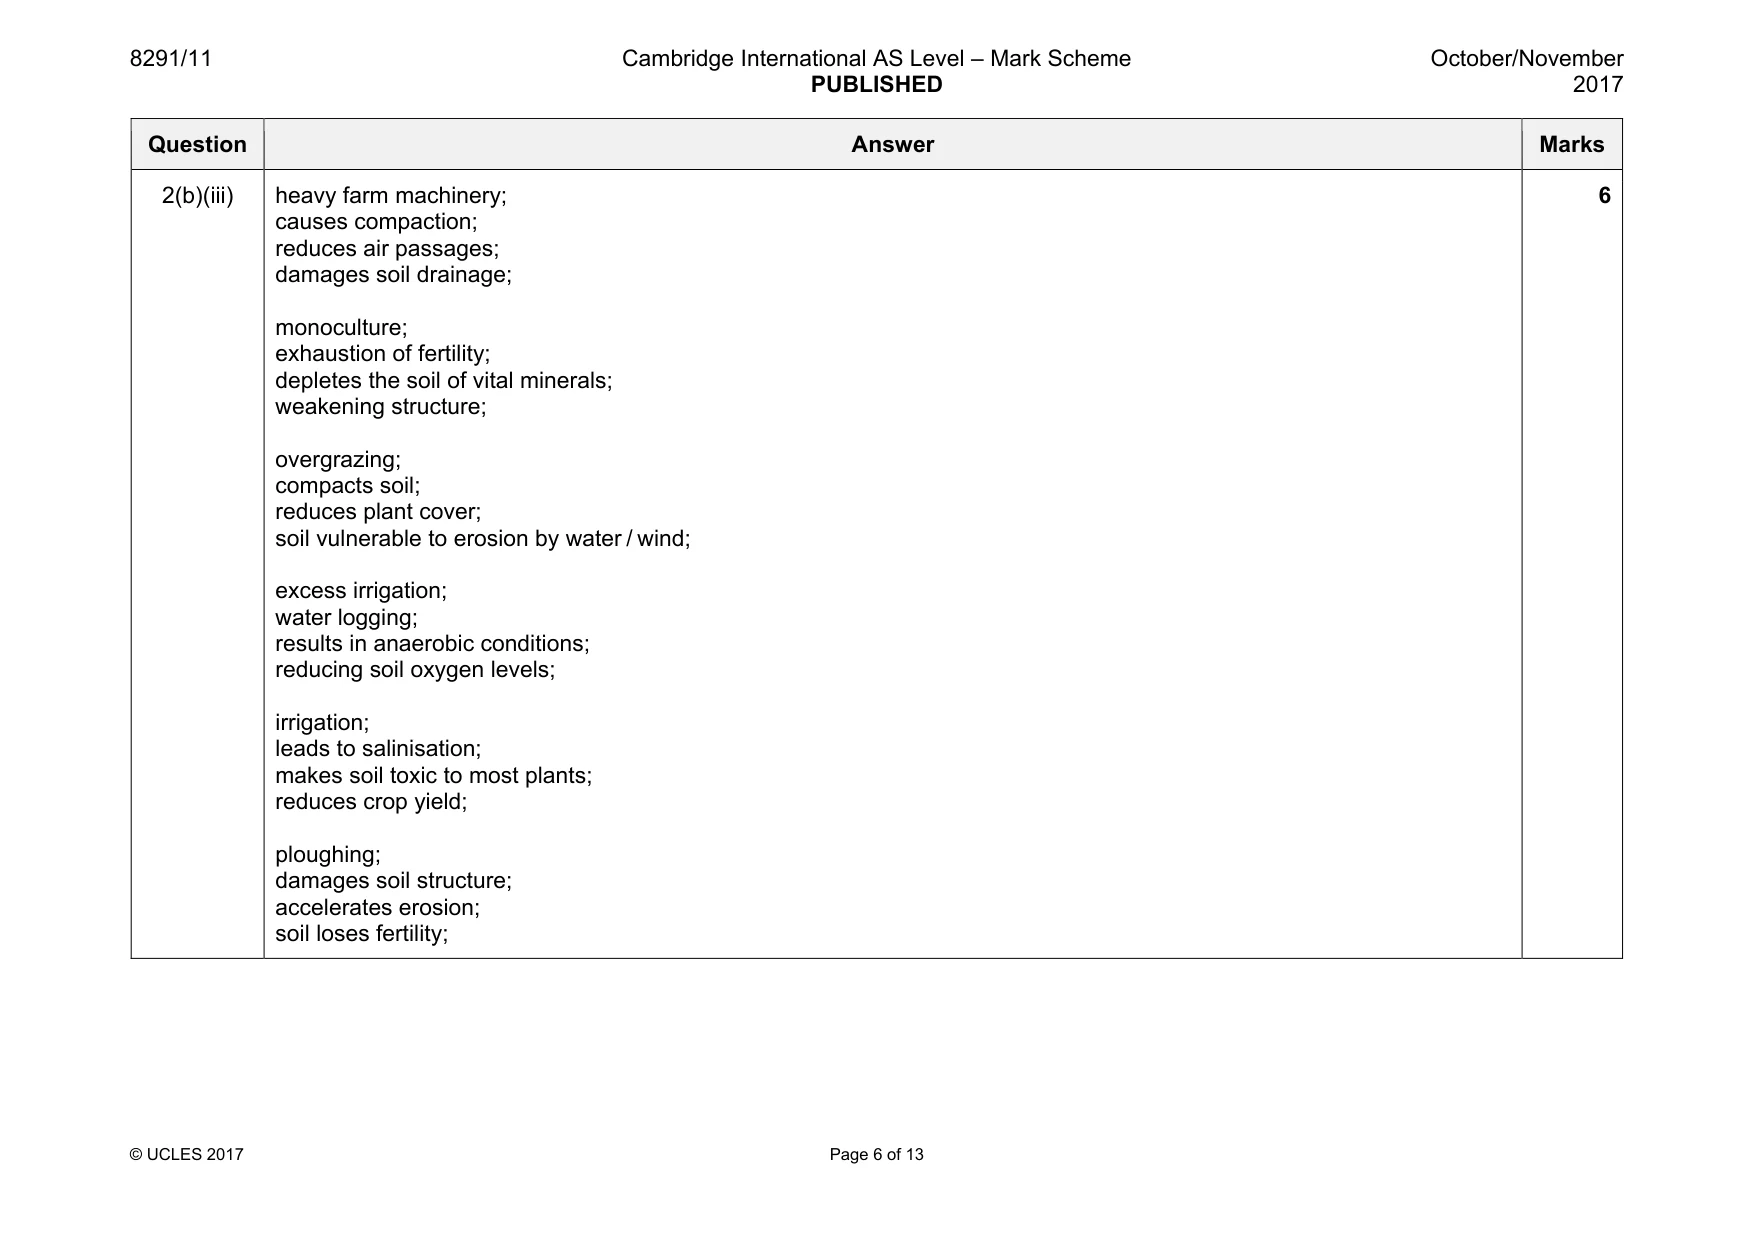
8291/11 Cambridge International AS Level – Mark Scheme PUBLISHED October/November 2017 © UCLES 2017 Page 6 of 13 Question Answer Marks 2(b)(iii) heavy farm machinery; causes compaction; reduces air passages; damages soil drainage; monoculture; exhaustion of fertility; depletes the soil of vital minerals; weakening structure; overgrazing; compacts soil; reduces plant cover; soil vulnerable to erosion by water / wind; excess irrigation; water logging; results in anaerobic conditions; reducing soil oxygen levels; irrigation; leads to salinisation; makes soil toxic to most plants; reduces crop yield; ploughing; damages soil structure; accelerates erosion; soil loses fertility; 6
Mark scheme, page 7
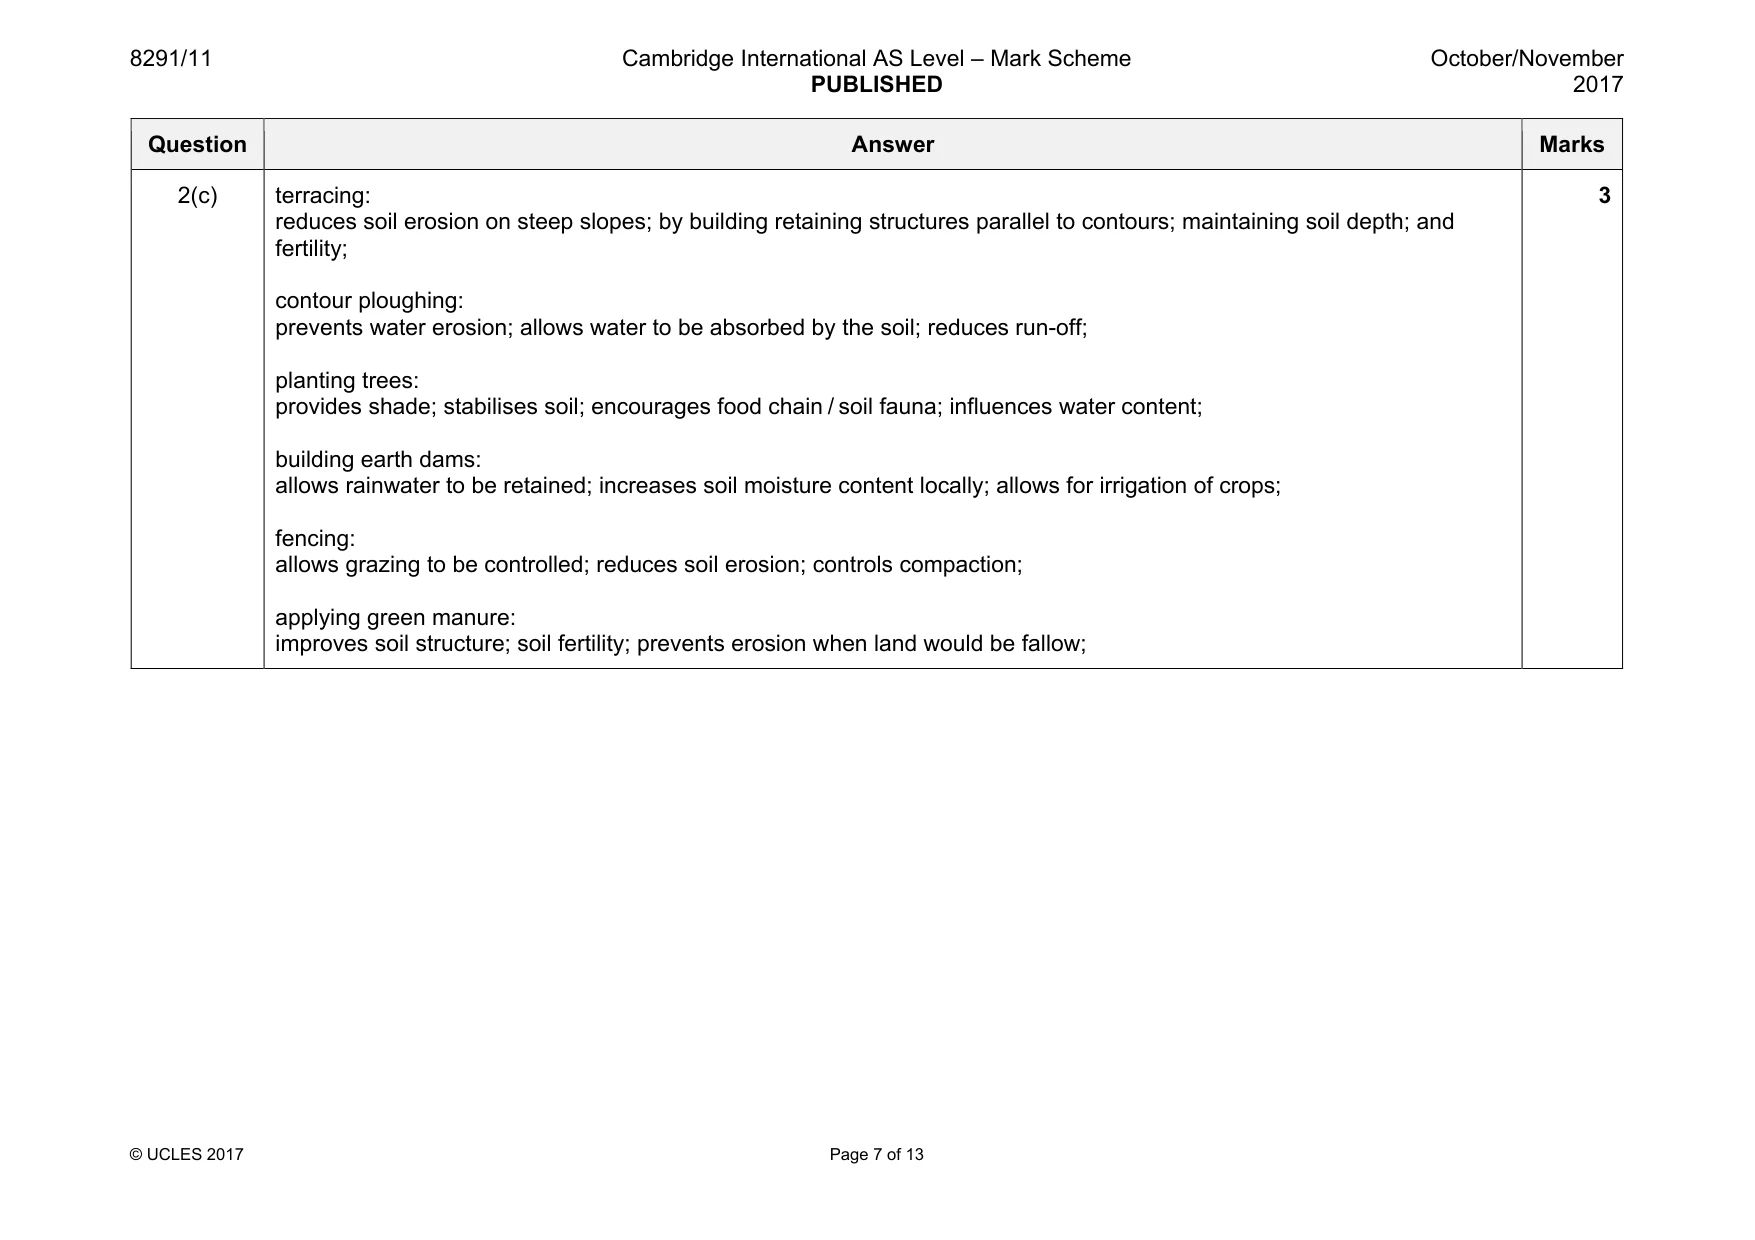
8291/11 Cambridge International AS Level – Mark Scheme PUBLISHED October/November 2017 © UCLES 2017 Page 7 of 13 Question Answer Marks 2(c) terracing: reduces soil erosion on steep slopes; by building retaining structures parallel to contours; maintaining soil depth; and fertility; contour ploughing: prevents water erosion; allows water to be absorbed by the soil; reduces run-off; planting trees: provides shade; stabilises soil; encourages food chain / soil fauna; influences water content; building earth dams: allows rainwater to be retained; increases soil moisture content locally; allows for irrigation of crops; fencing: allows grazing to be controlled; reduces soil erosion; controls compaction; applying green manure: improves soil structure; soil fertility; prevents erosion when land would be fallow; 3
Mark scheme, page 8
8291/11 Cambridge International AS Level – Mark Scheme PUBLISHED October/November 2017 © UCLES 2017 Page 8 of 13 Question Answer Marks 3(a) coastal erosion, coastal flooding, costal inundation, increasing storm activity, leading to increased salinisation of soil and consequent loss of fertility. water supply for island population affected. damage to airport, road links and infrastructure, loss of farmland, jobs and incomes. depopulation, death and injury in storm, damage to coastal housing. Please use descriptor levels 1 10 3(b) The requirements of the question are to: • Show an understanding of natural causes • Show an understanding of man-made causes • Assess the relative importance of each • Use evidence from different parts of the world Please use descriptor level 2 30
Mark scheme, page 9
8291/11 Cambridge International AS Level – Mark Scheme PUBLISHED October/November 2017 © UCLES 2017 Page 9 of 13 Question Answer Marks 4(a) claims: low carbon, low waste, renewable energy (solar power), energy conservation, water conservation, building design and street layout evaluation: reduced emissions, designs have cooling effects to reduce need for air conditioning, use of solar energy is renewable so sustainable, measures conserve and reduce energy use to be economical and sustainable 10 4(b) The requirements of the question are to: • Show an understanding of the advantages • Show an understanding of the disadvantages • Make an assessment • Use a range of appropriate examples Please use descriptor level 2 30
Mark scheme, page 10
8291/11 Cambridge International AS Level – Mark Scheme PUBLISHED October/November 2017 © UCLES 2017 Page 10 of 13 Question Answer Marks 5(a) seismic activity: monitoring the pattern of increasing earth tremors may indicate likely activity, can reference to past patterns of activity. analysis of gas: monitoring emissions of sulphur dioxide, increased emissions are likely to suggest increased activity. measuring ground deformation: bulging of mountain, can suggest increased activity and hint at potentially dangerous eruptions from new vents. using remote sensing imagery: to reveal ash / steam cloud activity / thermal sensing reveals activity, and is safer for the observers. taking geophysical measurements: hydrological changes from groundwater sampling, e.g. loss of water from aquifer / muddy / turbidity changes to the water 10 5(b) The requirements of the question are to: • Demonstrate an understanding of the arguments in support of the idea • Demonstrate an understanding of a counter argument • Make reference to a range of appropriate examples • Come to a balanced conclusion Please use descriptor level 2 30
Mark scheme, page 11
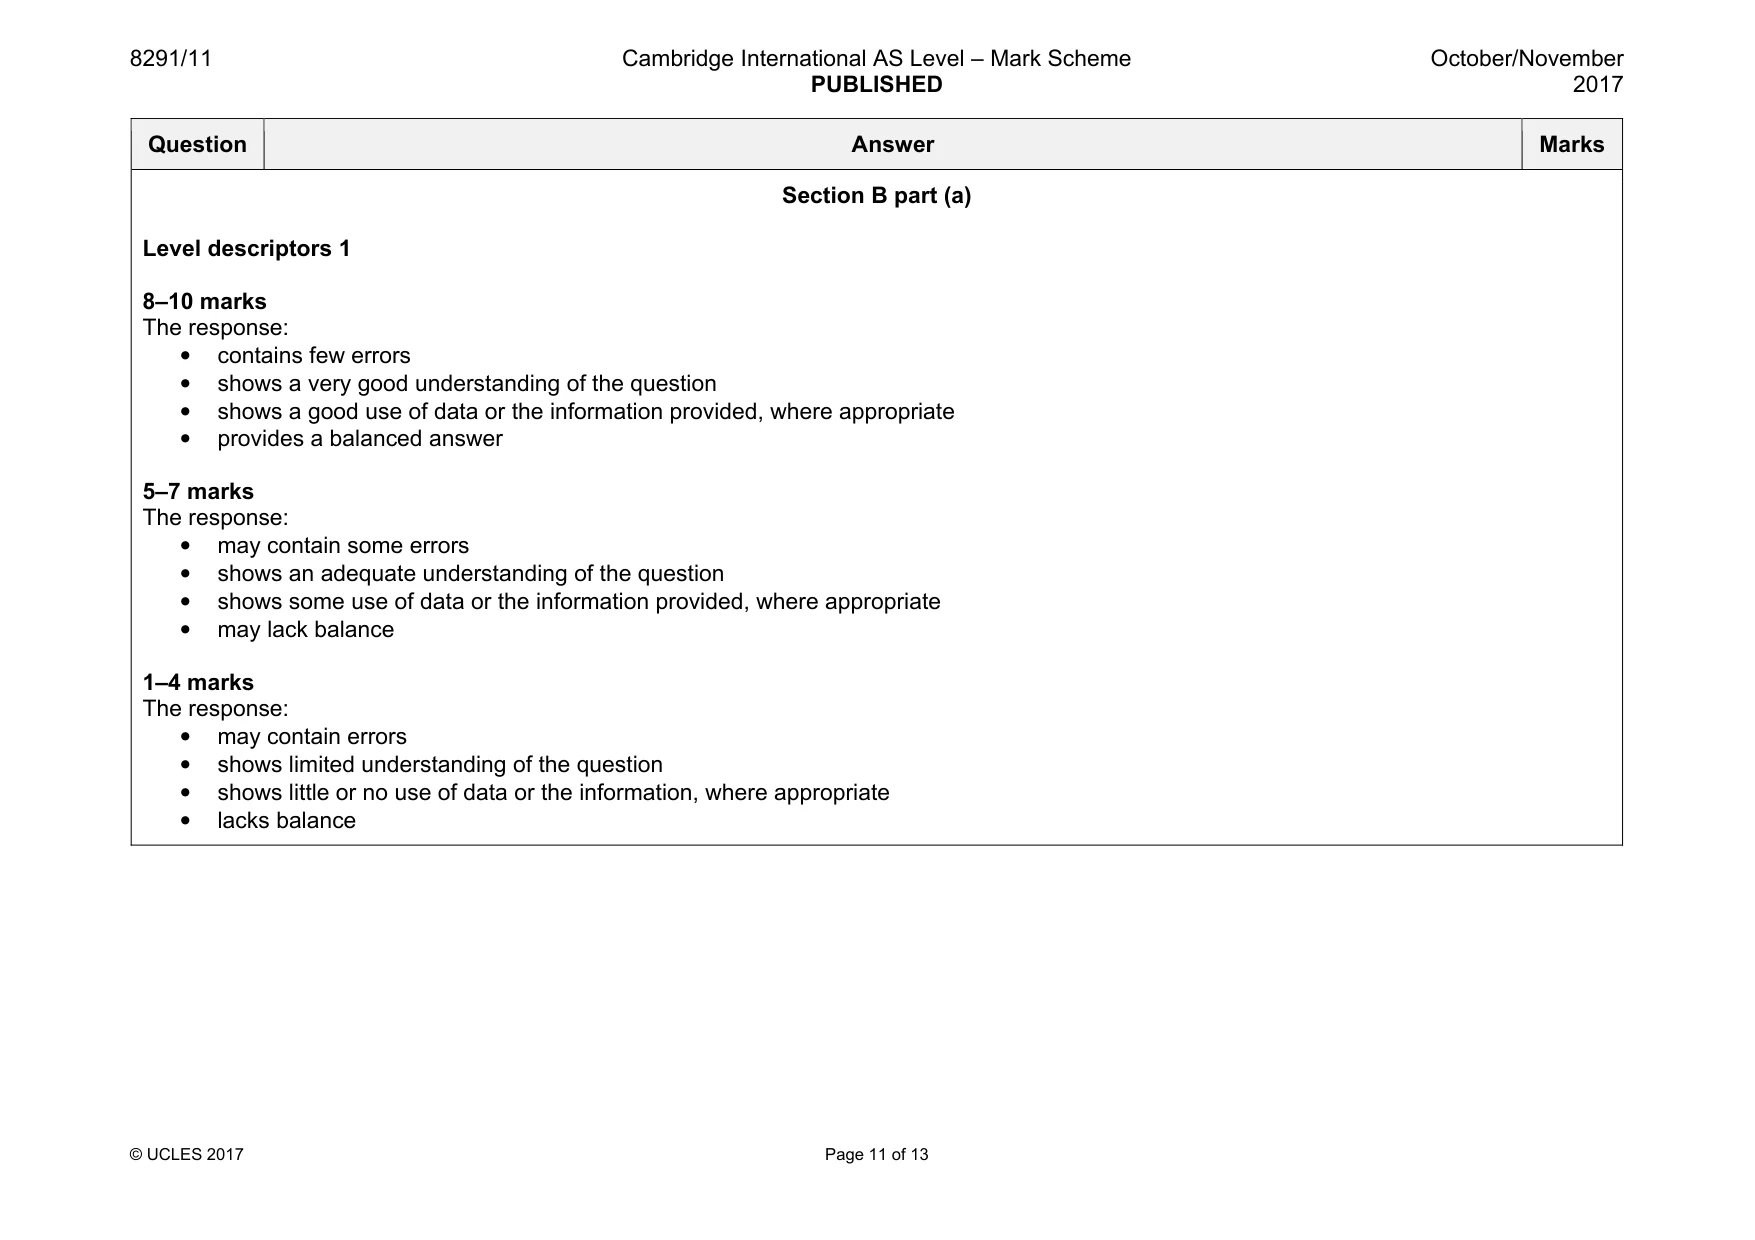
8291/11 Cambridge International AS Level – Mark Scheme PUBLISHED October/November 2017 © UCLES 2017 Page 11 of 13 Question Answer Marks Section B part (a) Level descriptors 1 8–10 marks The response: • contains few errors • shows a very good understanding of the question • shows a good use of data or the information provided, where appropriate • provides a balanced answer 5–7 marks The response: • may contain some errors • shows an adequate understanding of the question • shows some use of data or the information provided, where appropriate • may lack balance 1–4 marks The response: • may contain errors • shows limited understanding of the question • shows little or no use of data or the information, where appropriate • lacks balance
Mark scheme, page 12
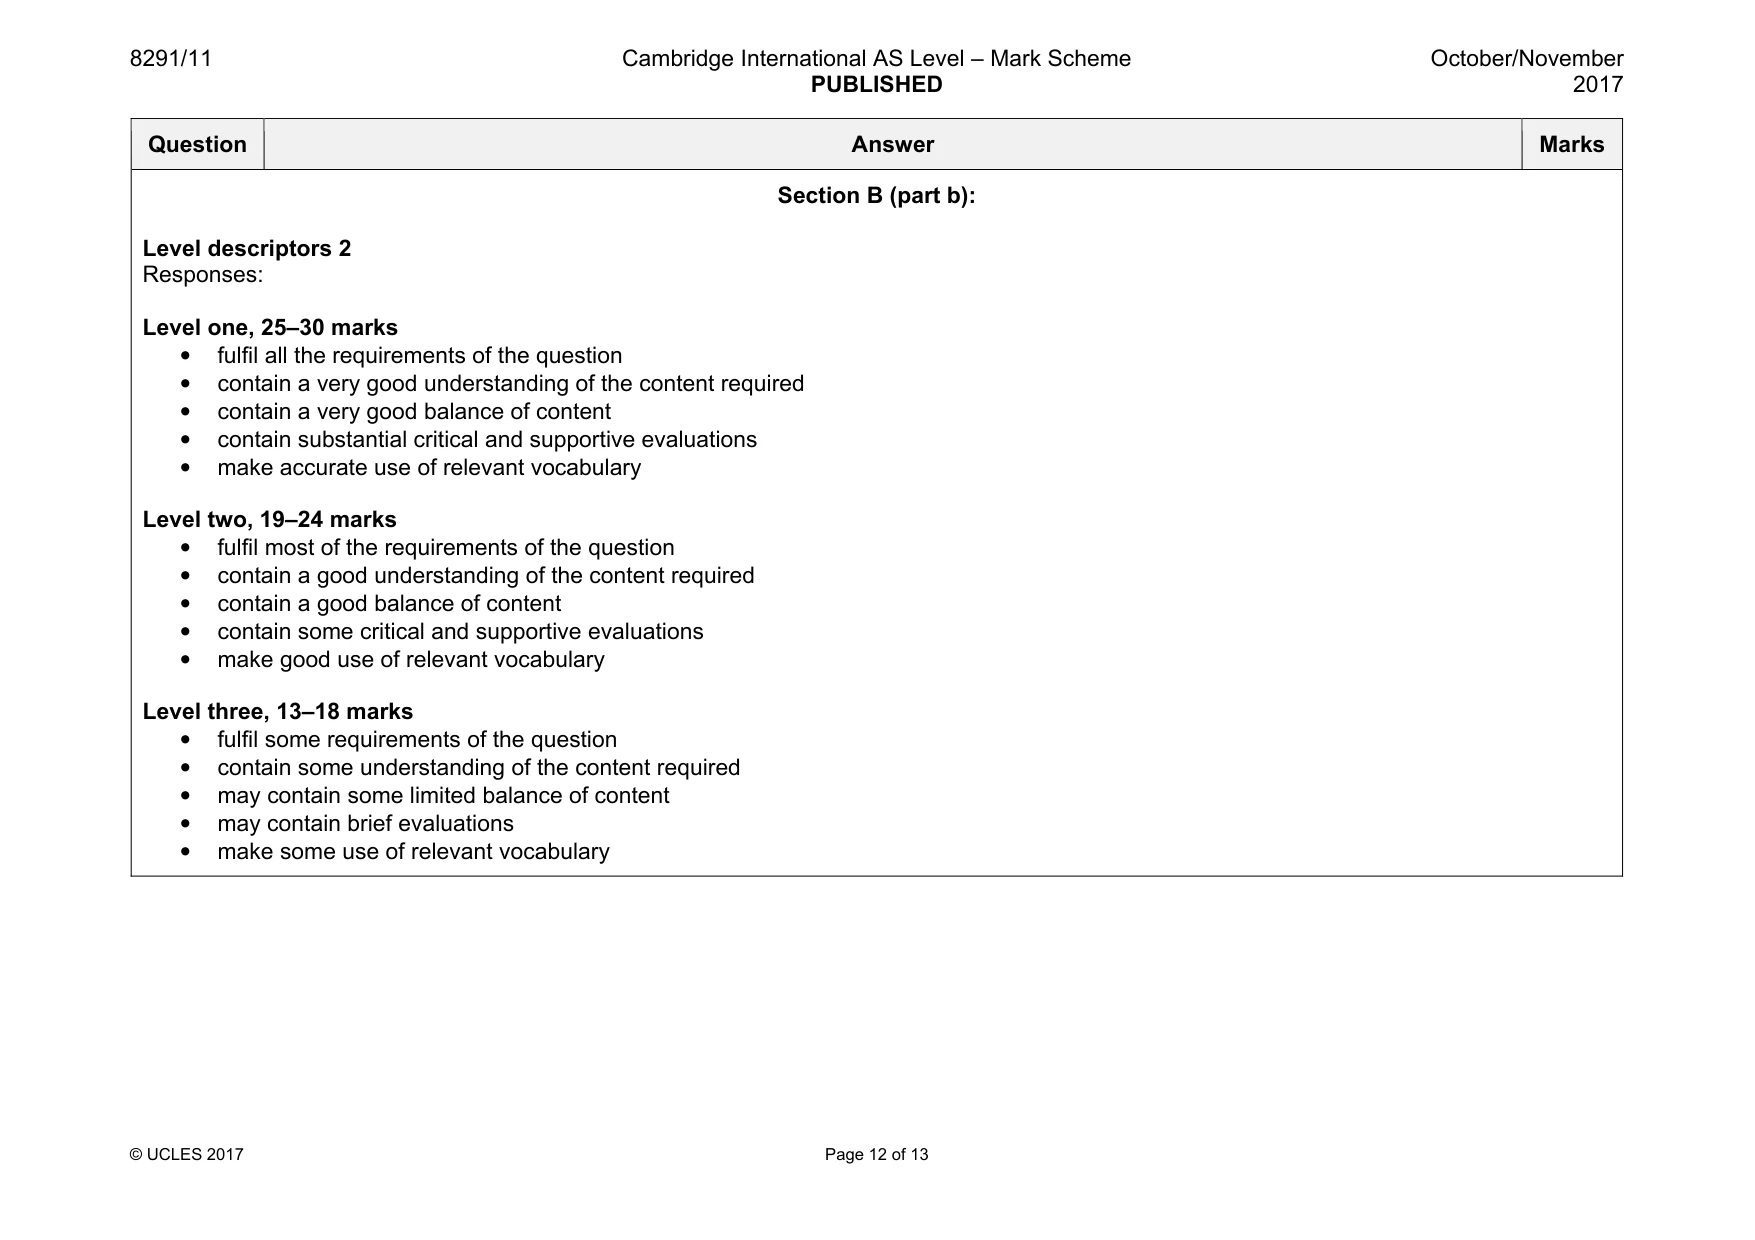
8291/11 Cambridge International AS Level – Mark Scheme PUBLISHED October/November 2017 © UCLES 2017 Page 12 of 13 Question Answer Marks Section B (part b): Level descriptors 2 Responses: Level one, 25–30 marks • fulfil all the requirements of the question • contain a very good understanding of the content required • contain a very good balance of content • contain substantial critical and supportive evaluations • make accurate use of relevant vocabulary Level two, 19–24 marks • fulfil most of the requirements of the question • contain a good understanding of the content required • contain a good balance of content • contain some critical and supportive evaluations • make good use of relevant vocabulary Level three, 13–18 marks • fulfil some requirements of the question • contain some understanding of the content required • may contain some limited balance of content • may contain brief evaluations • make some use of relevant vocabulary
Mark scheme, page 13
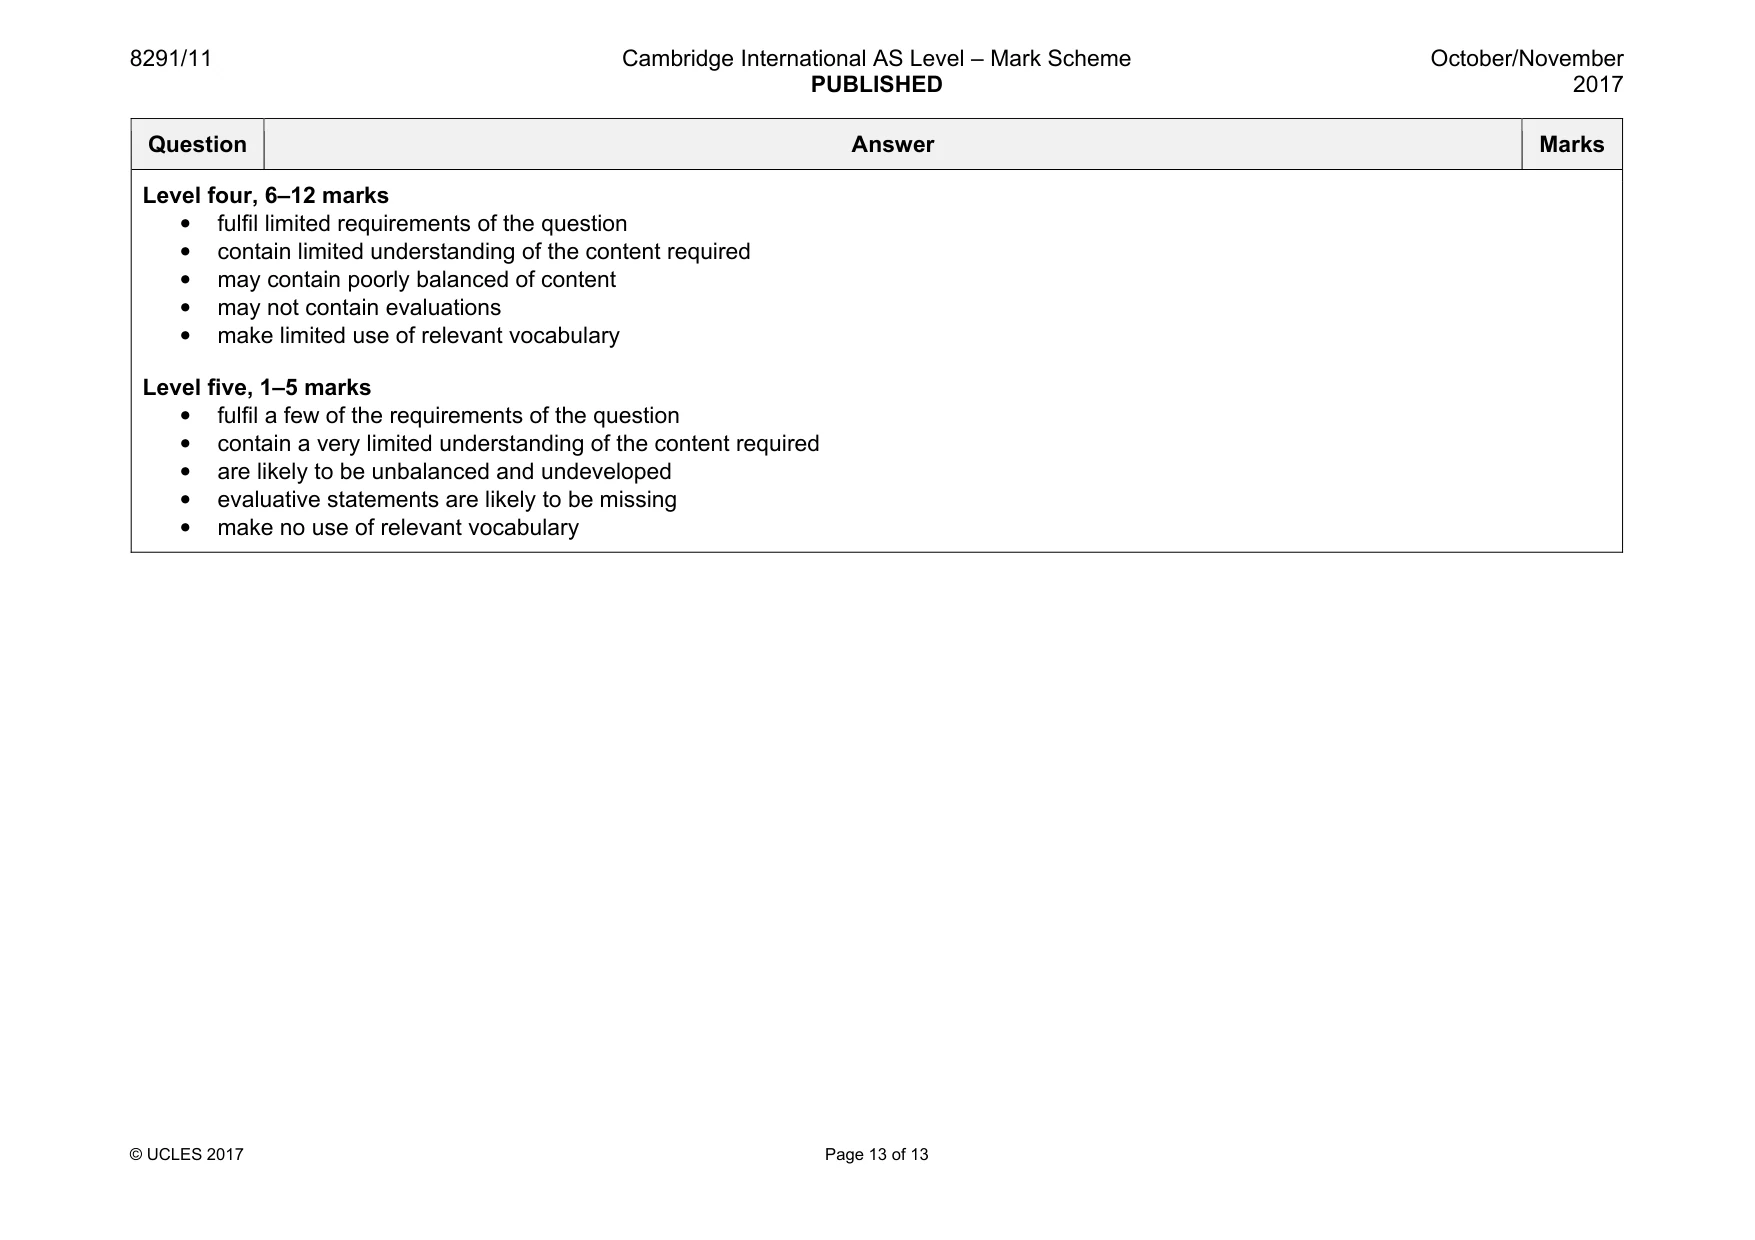
8291/11 Cambridge International AS Level – Mark Scheme PUBLISHED October/November 2017 © UCLES 2017 Page 13 of 13 Question Answer Marks Level four, 6–12 marks • fulfil limited requirements of the question • contain limited understanding of the content required • may contain poorly balanced of content • may not contain evaluations • make limited use of relevant vocabulary Level five, 1–5 marks • fulfil a few of the requirements of the question • contain a very limited understanding of the content required • are likely to be unbalanced and undeveloped • evaluative statements are likely to be missing • make no use of relevant vocabulary
What you needed in this session
Cambridge’s own grade thresholds for 2017 Oct/Nov, Paper 1 · Variant 1. A higher threshold means an easier paper — the bar moves with how the cohort did.