Cambridge A Level Environmental Management (AS only) 8291 — 2010 May/June Paper 2 · Variant 3
8291/23/M/J/10 · 80 marks · ≈90 min
The question paper and its mark scheme, free to read here and free to download. This is Cambridge’s own paper, exactly as it was sat.
Question paper12 pages

Mark scheme12 pages
Answers below. Sit the paper first if you are practising.
Paper as text
Question paper, page 1
This document consists of 11 printed pages and 1 blank page. DC (LEO/SW) 27274 © UCLES 2010 [Turn over UNIVERSITY OF CAMBRIDGE INTERNATIONAL EXAMINATIONS General Certificate of Education Advanced Subsidiary Level * 3 7 9 7 6 6 7 7 8 0 * ENVIRONMENTAL MANAGEMENT 8291/23 Paper 2 Hydrosphere and Biosphere May/June 2010 1 hour 30 minutes Additional Materials: Answer Booklet/Paper READ THESE INSTRUCTIONS FIRST Write your Centre number, candidate number and name on all the work you hand in. Write in dark blue or black pen. You may use a soft pencil for any diagrams, graphs, tables or rough working. Do not use staples, paper clips, highlighters, glue or correction fluid. DO NOT WRITE IN ANY BARCODES. Section A Answer all questions. Write your answers in the spaces provided on the question paper. Section B Answer one question from this section. Answer the question on the separate answer paper provided. At the end of the examination, 1. fasten all separate answer paper securely to the question paper; 2. enter the question number from Section B in the grid opposite. For Examiner’s Use Section A 1 2 Section B Total
Question paper, page 2
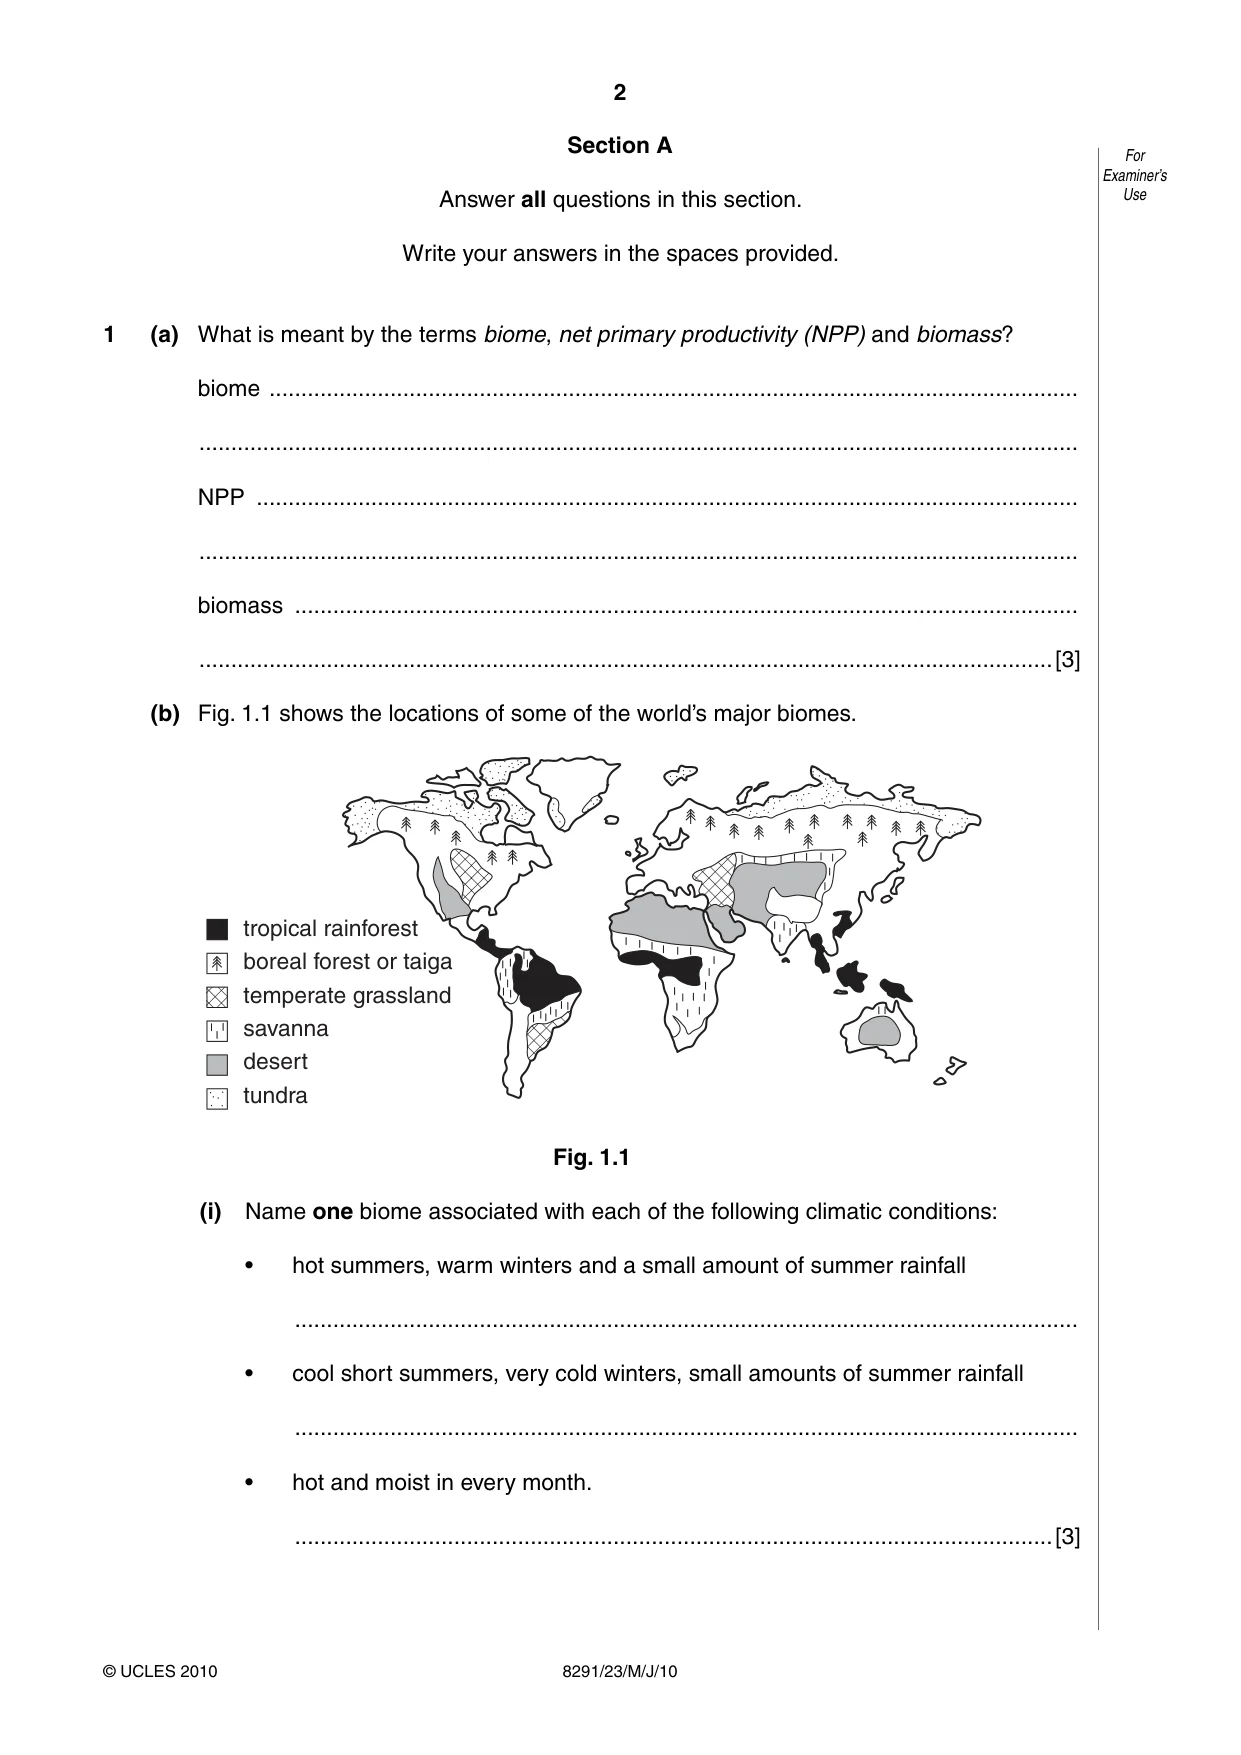
2 8291/23/M/J/10 © UCLES 2010 For Examiner’s Use Section A Answer all questions in this section. Write your answers in the spaces provided. 1 (a) What is meant by the terms biome, net primary productivity (NPP) and biomass? biome … … NPP … … biomass … …[3] (b) Fig. 1.1 shows the locations of some of the world’s major biomes. tropical rainforest boreal forest or taiga temperate grassland savanna desert tundra Fig. 1.1 (i) Name one biome associated with each of the following climatic conditions: hot summers, warm winters and a small amount of summer rainfall • … cool short summers, very cold winters, small amounts of summer rainfall • … hot and moist in every month. • …[3]
Question paper, page 3
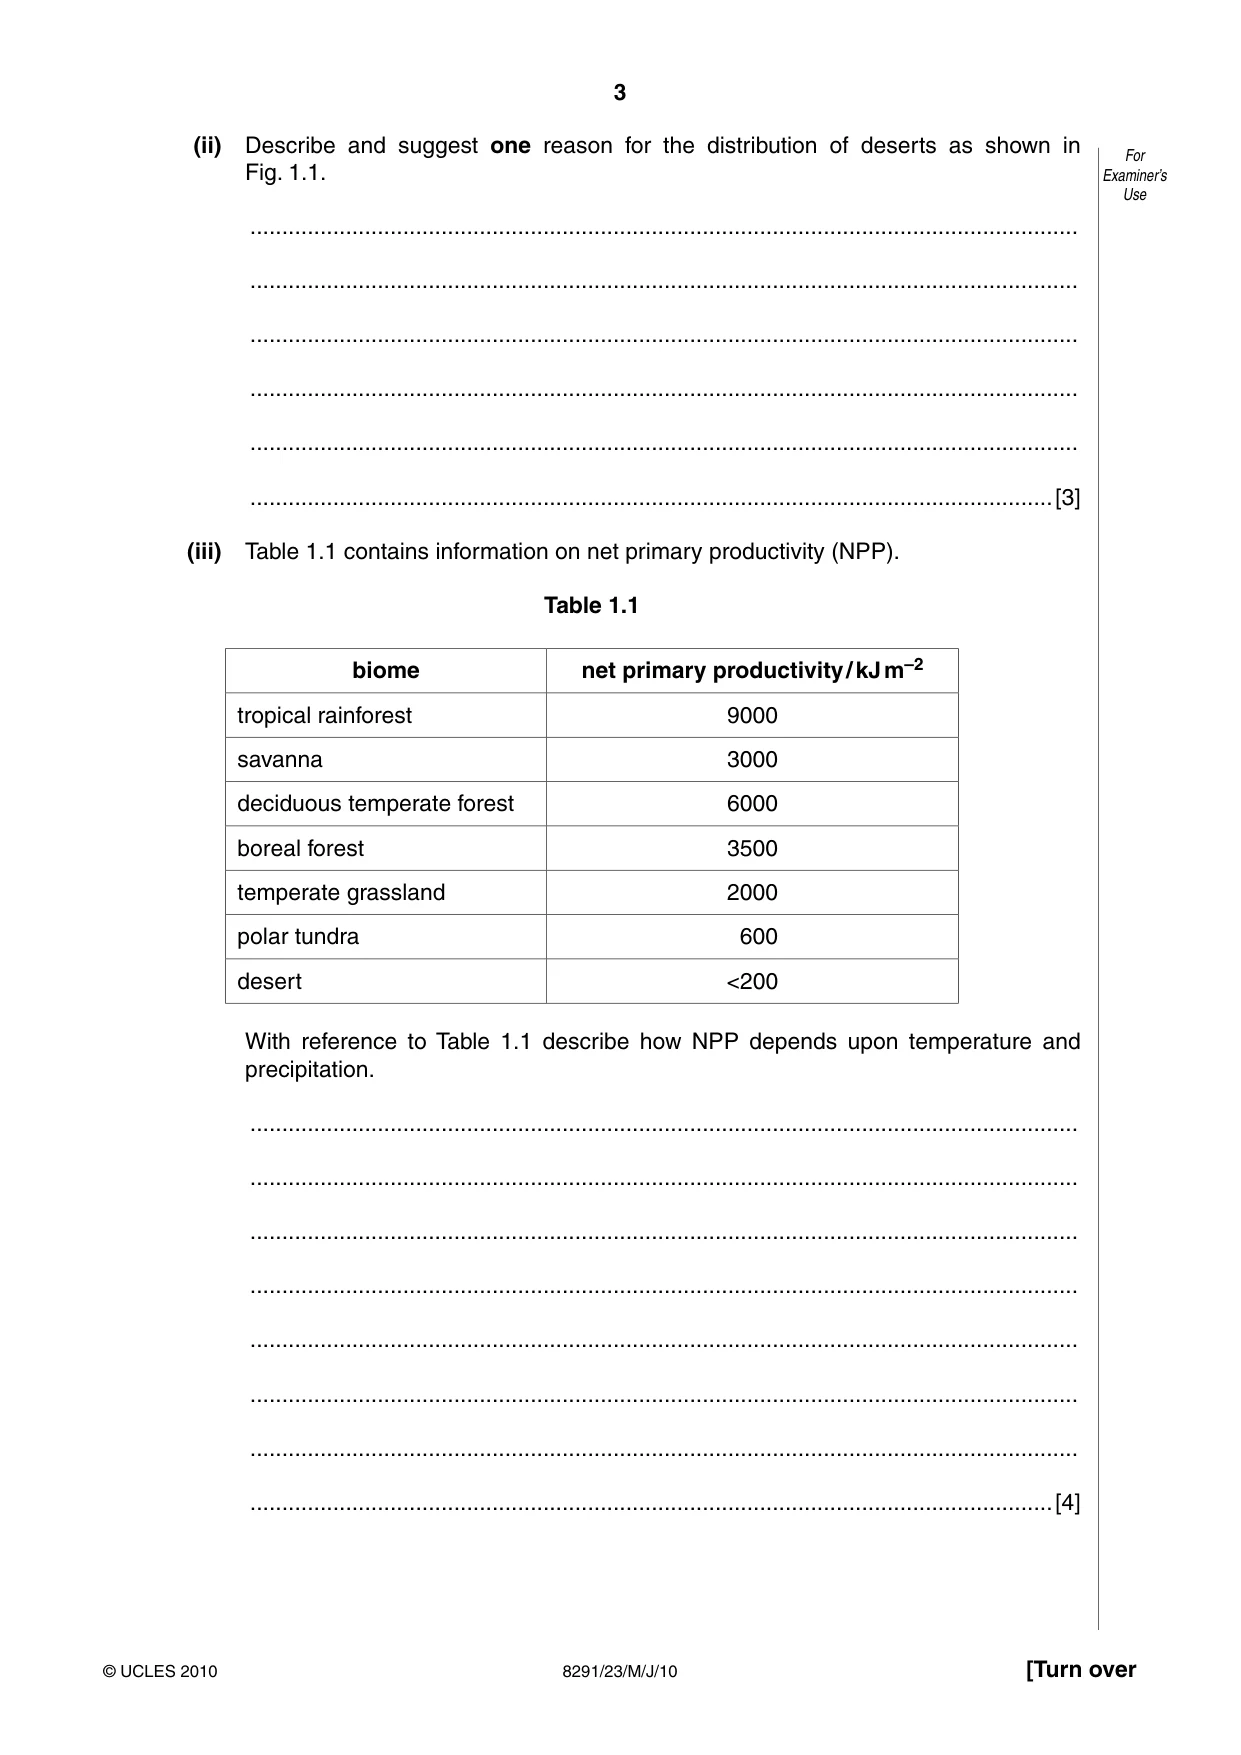
3 8291/23/M/J/10 © UCLES 2010 [Turn over For Examiner’s Use (ii) Describe and suggest one reason for the distribution of deserts as shown in Fig. 1.1. … … … … … …[3] (iii) Table 1.1 contains information on net primary productivity (NPP). Table 1.1 biome net primary productivity / kJ m–2 tropical rainforest 9000 savanna 3000 deciduous temperate forest 6000 boreal forest 3500 temperate grassland 2000 polar tundra 600 desert <200 With reference to Table 1.1 describe how NPP depends upon temperature and precipitation. … … … … … … … …[4]
Question paper, page 4
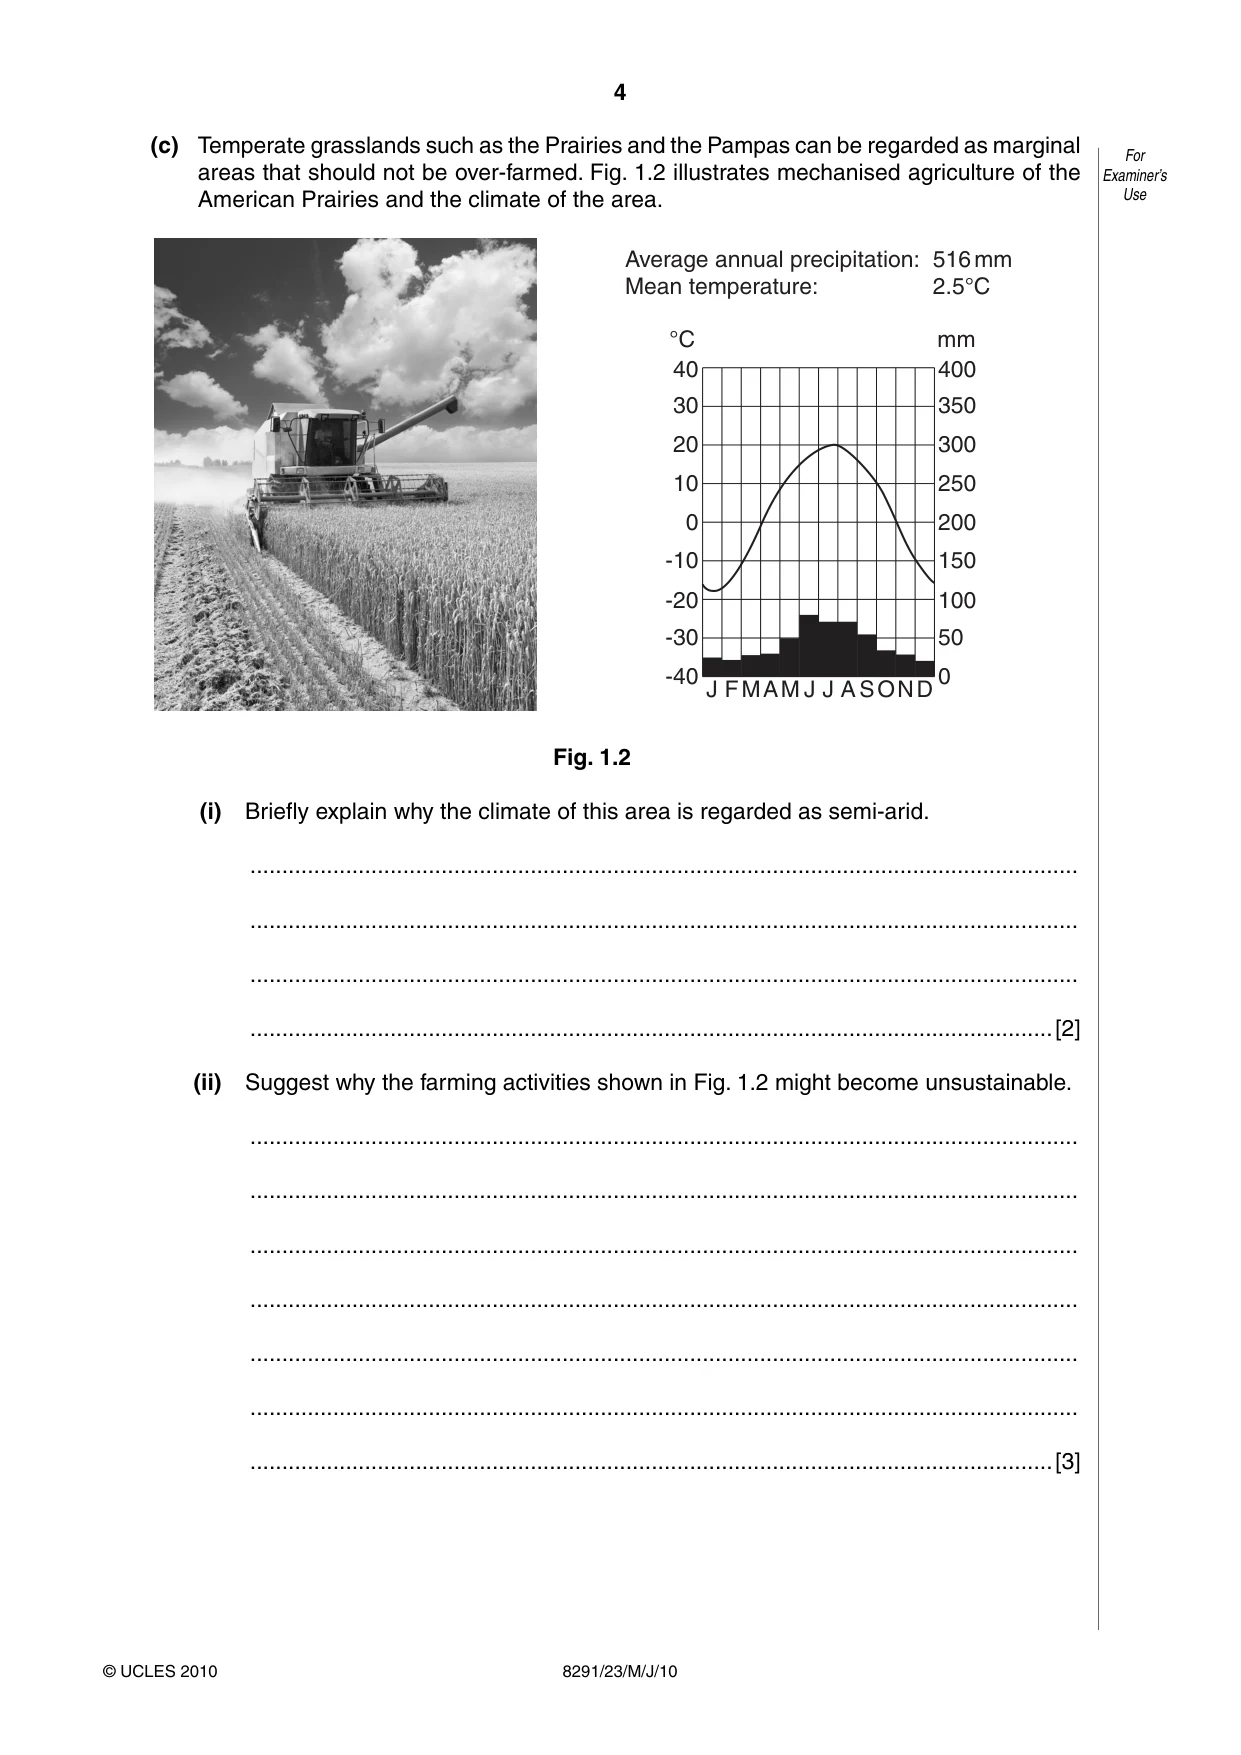
4 8291/23/M/J/10 © UCLES 2010 For Examiner’s Use (c) Temperate grasslands such as the Prairies and the Pampas can be regarded as marginal areas that should not be over-farmed. Fig. 1.2 illustrates mechanised agriculture of the American Prairies and the climate of the area. 0 50 100 150 200 250 300 350 400 -40 J FMAM J J A SOND -30 -20 -10 0 10 °C mm Average annual precipitation: Mean temperature: 516 mm 2.5°C 20 30 40 Fig. 1.2 (i) Briefly explain why the climate of this area is regarded as semi-arid. … … … …[2] (ii) Suggest why the farming activities shown in Fig. 1.2 might become unsustainable. … … … … … … …[3]
Question paper, page 5
5 8291/23/M/J/10 © UCLES 2010 [Turn over For Examiner’s Use (iii) Outline one method that could be used to maintain future crop production in the area shown in Fig. 1.2. … … … …[2] [Total: 20]
Question paper, page 6
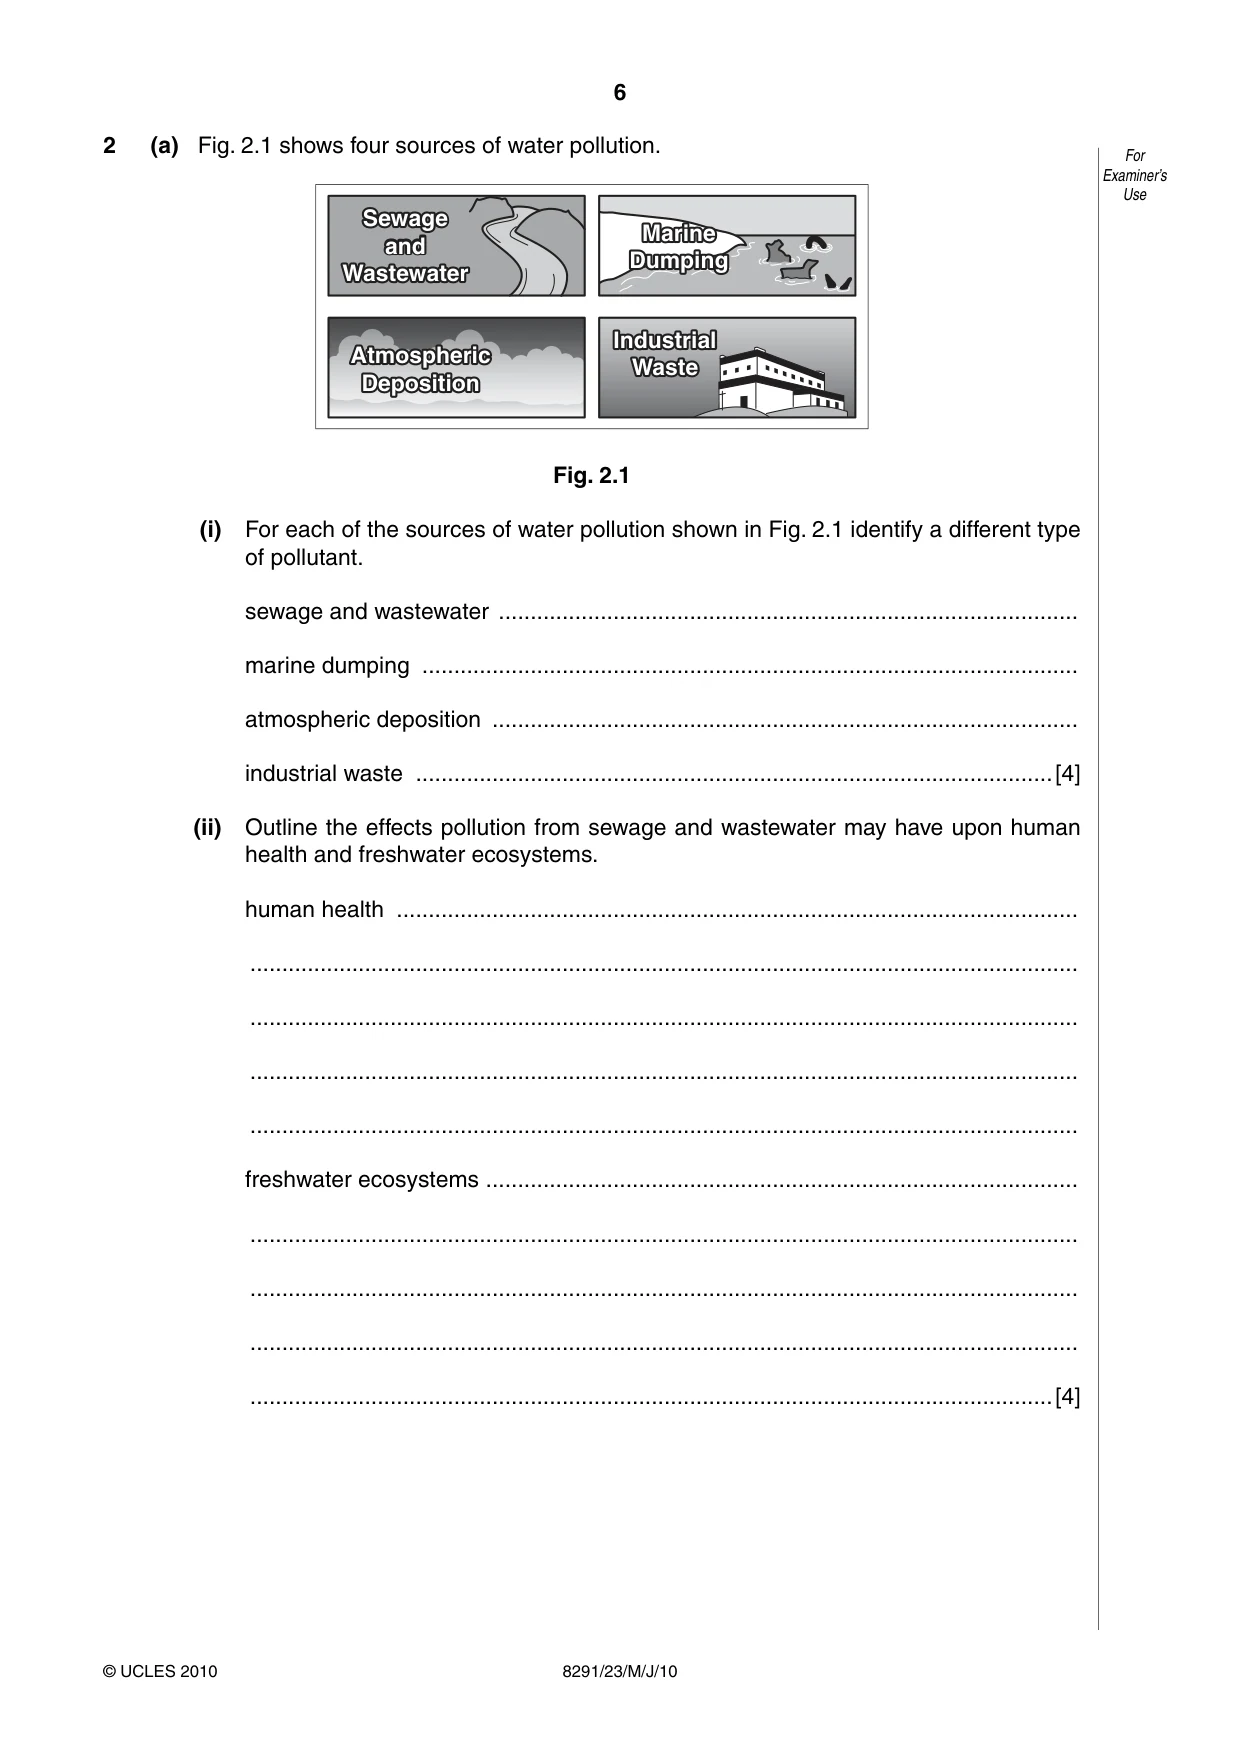
6 8291/23/M/J/10 © UCLES 2010 For Examiner’s Use 2 (a) Fig. 2.1 shows four sources of water pollution. Atmospheric Deposition Atmospheric Deposition Sewage and Wastewater Sewage and Wastewater Industrial Waste Industrial Waste Marine Dumping Marine Dumping Fig. 2.1 (i) For each of the sources of water pollution shown in Fig. 2.1 identify a different type of pollutant. sewage and wastewater … marine dumping … atmospheric deposition … industrial waste …[4] (ii) Outline the effects pollution from sewage and wastewater may have upon human health and freshwater ecosystems. human health … … … … … freshwater ecosystems … … … … …[4]
Question paper, page 7
7 8291/23/M/J/10 © UCLES 2010 [Turn over For Examiner’s Use (iii) Describe two effects marine dumping by ships at sea might have upon marine ecosystems. … … … … … … … …[4]
Question paper, page 8
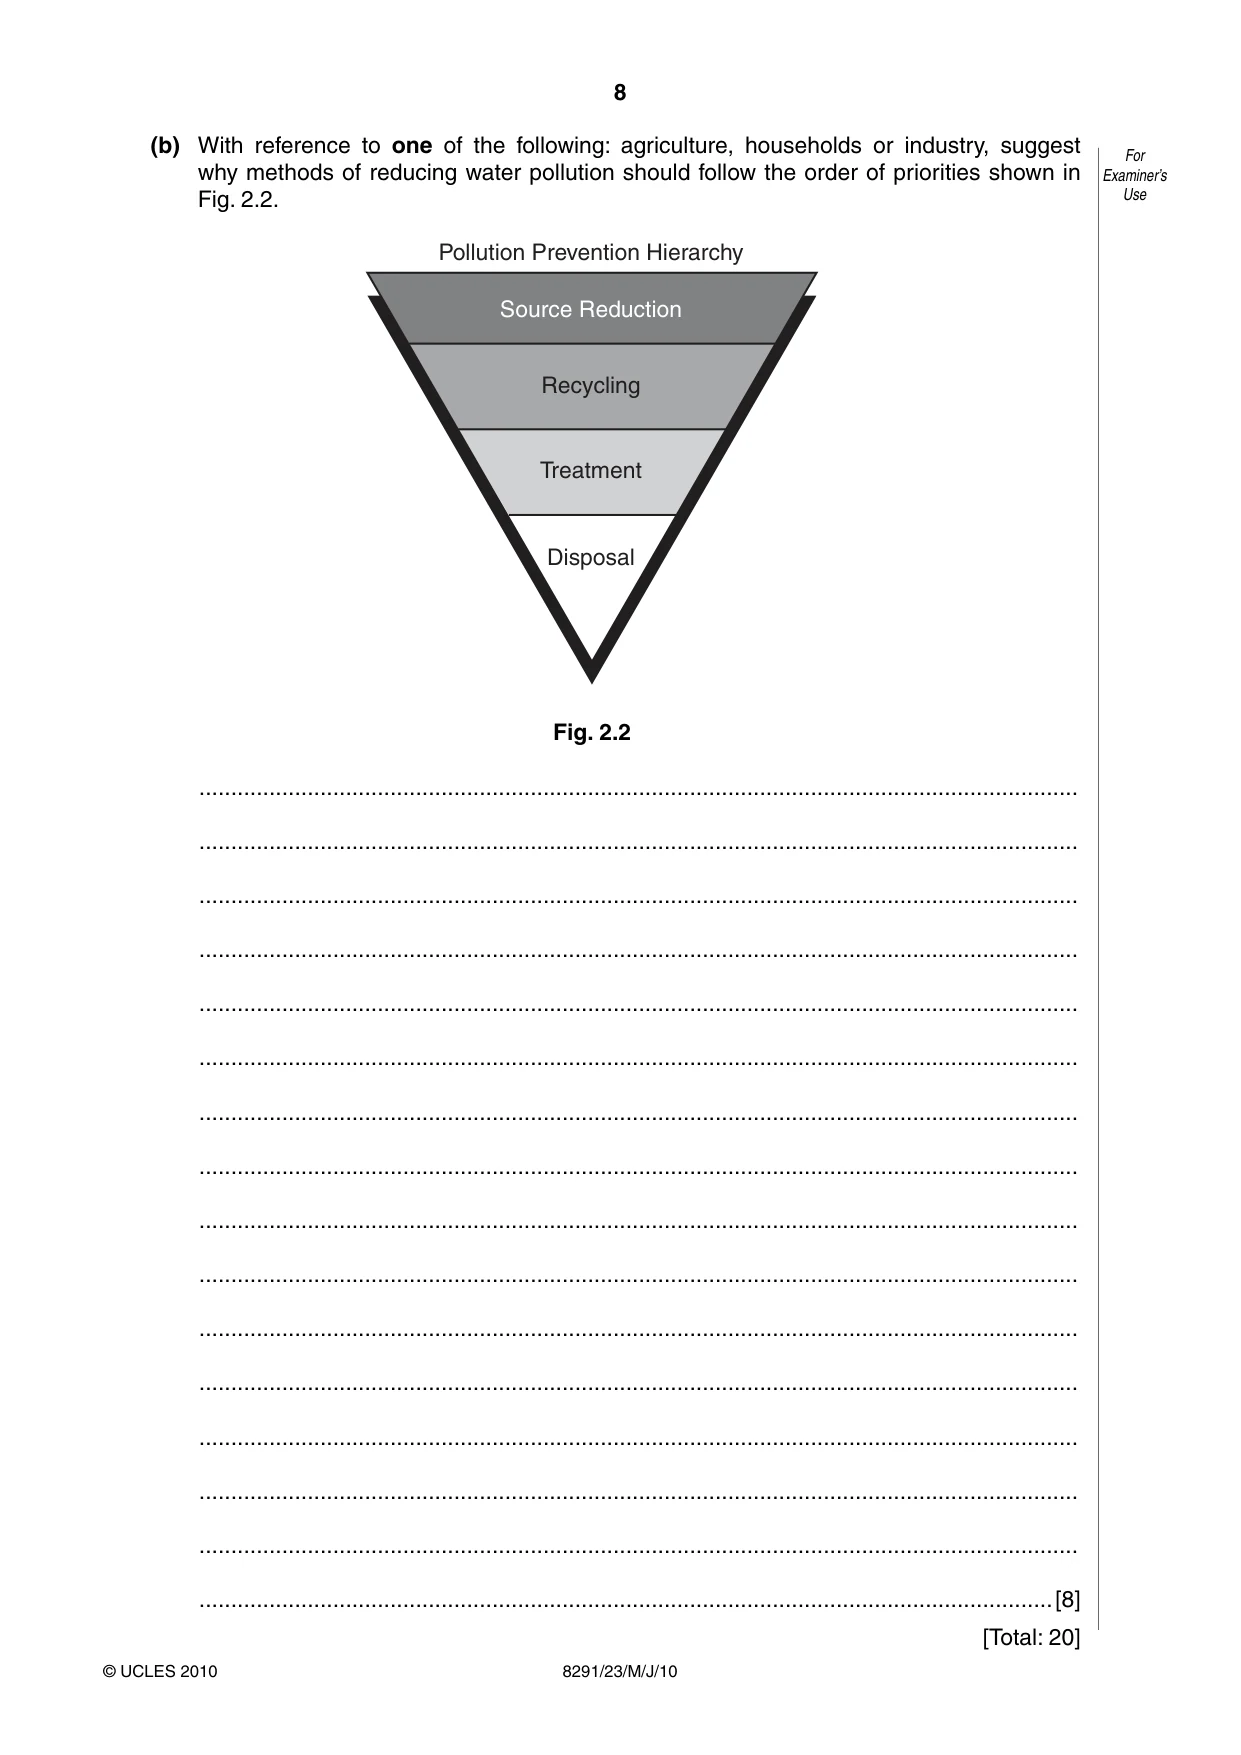
8 8291/23/M/J/10 © UCLES 2010 For Examiner’s Use (b) With reference to one of the following: agriculture, households or industry, suggest why methods of reducing water pollution should follow the order of priorities shown in Fig. 2.2. Source Reduction Recycling Pollution Prevention Hierarchy Treatment Disposal Fig. 2.2 … … … … … … … … … … … … … … … …[8] [Total: 20]
Question paper, page 9
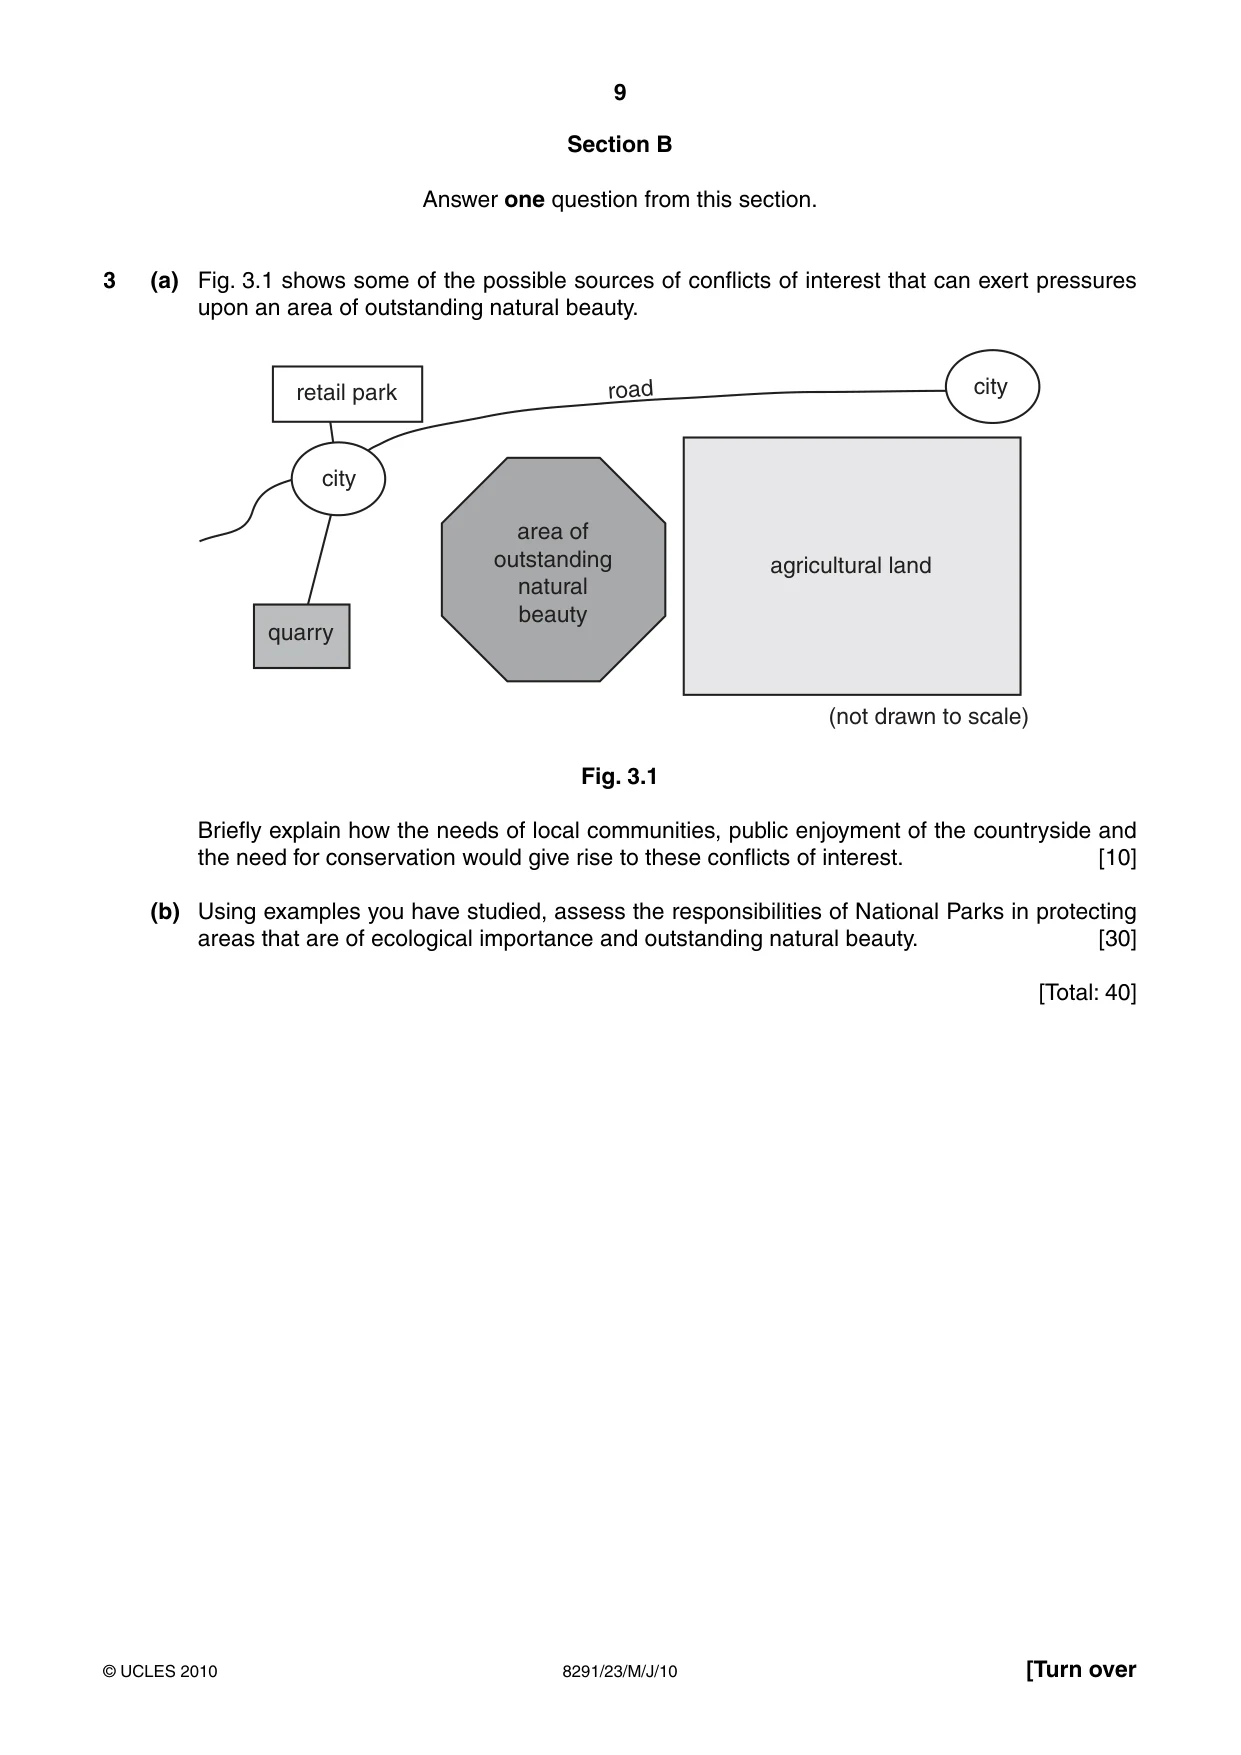
9 8291/23/M/J/10 © UCLES 2010 [Turn over Section B Answer one question from this section. 3 (a) Fig. 3.1 shows some of the possible sources of conflicts of interest that can exert pressures upon an area of outstanding natural beauty. retail park city city quarry road area of outstanding natural beauty agricultural land (not drawn to scale) Fig. 3.1 Briefly explain how the needs of local communities, public enjoyment of the countryside and the need for conservation would give rise to these conflicts of interest. [10] (b) Using examples you have studied, assess the responsibilities of National Parks in protecting areas that are of ecological importance and outstanding natural beauty. [30] [Total: 40]
Question paper, page 10
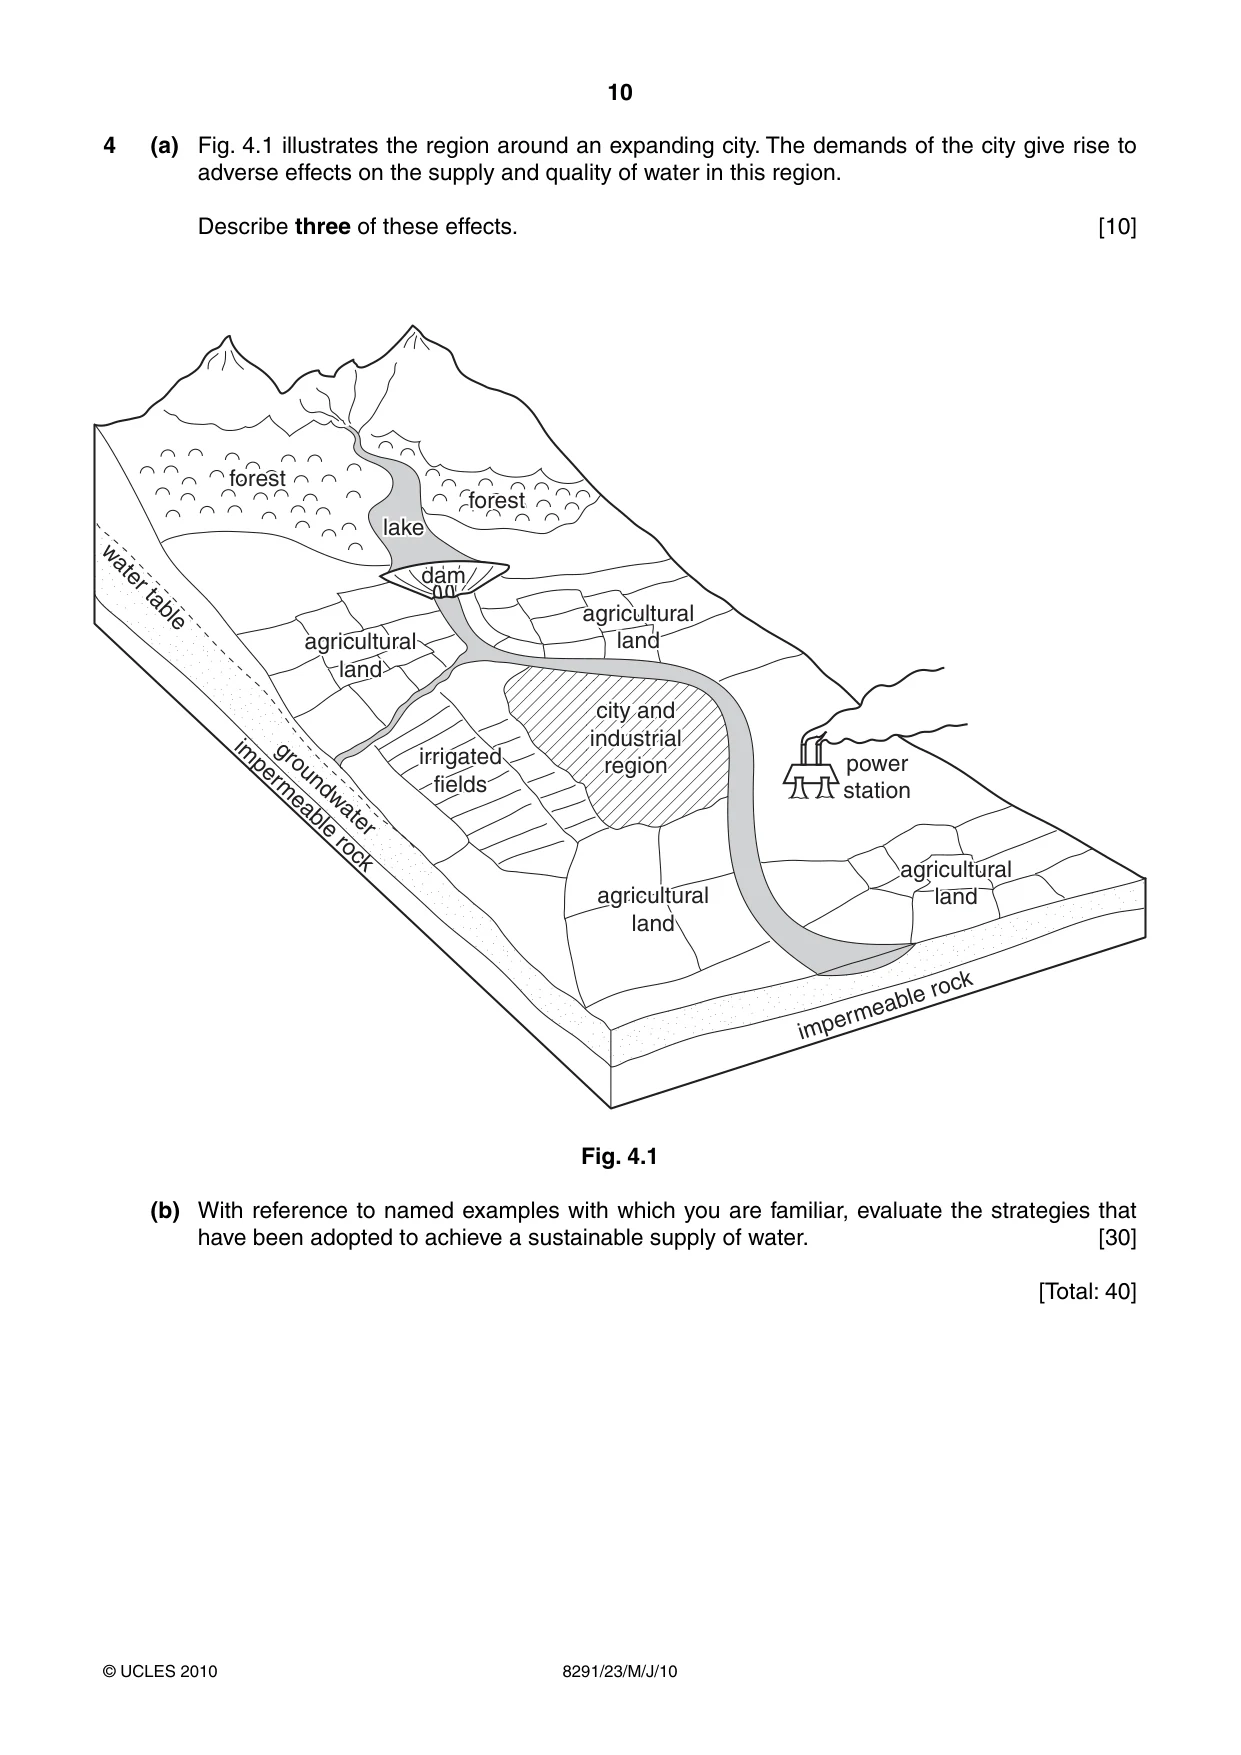
10 8291/23/M/J/10 © UCLES 2010 4 (a) Fig. 4.1 illustrates the region around an expanding city. The demands of the city give rise to adverse effects on the supply and quality of water in this region. Describe three of these effects. [10] city and industrial region irrigated fields agricultural land agricultural land agricultural land lake forest dam agricultural land power station city and industrial region irrigated fields groundwater water table groundwater water table impermeable rock impermeable rock agricultural land agricultural land agricultural land lake forest forest forest dam agricultural land power station Fig. 4.1 (b) With reference to named examples with which you are familiar, evaluate the strategies that have been adopted to achieve a sustainable supply of water. [30] [Total: 40]
Question paper, page 11
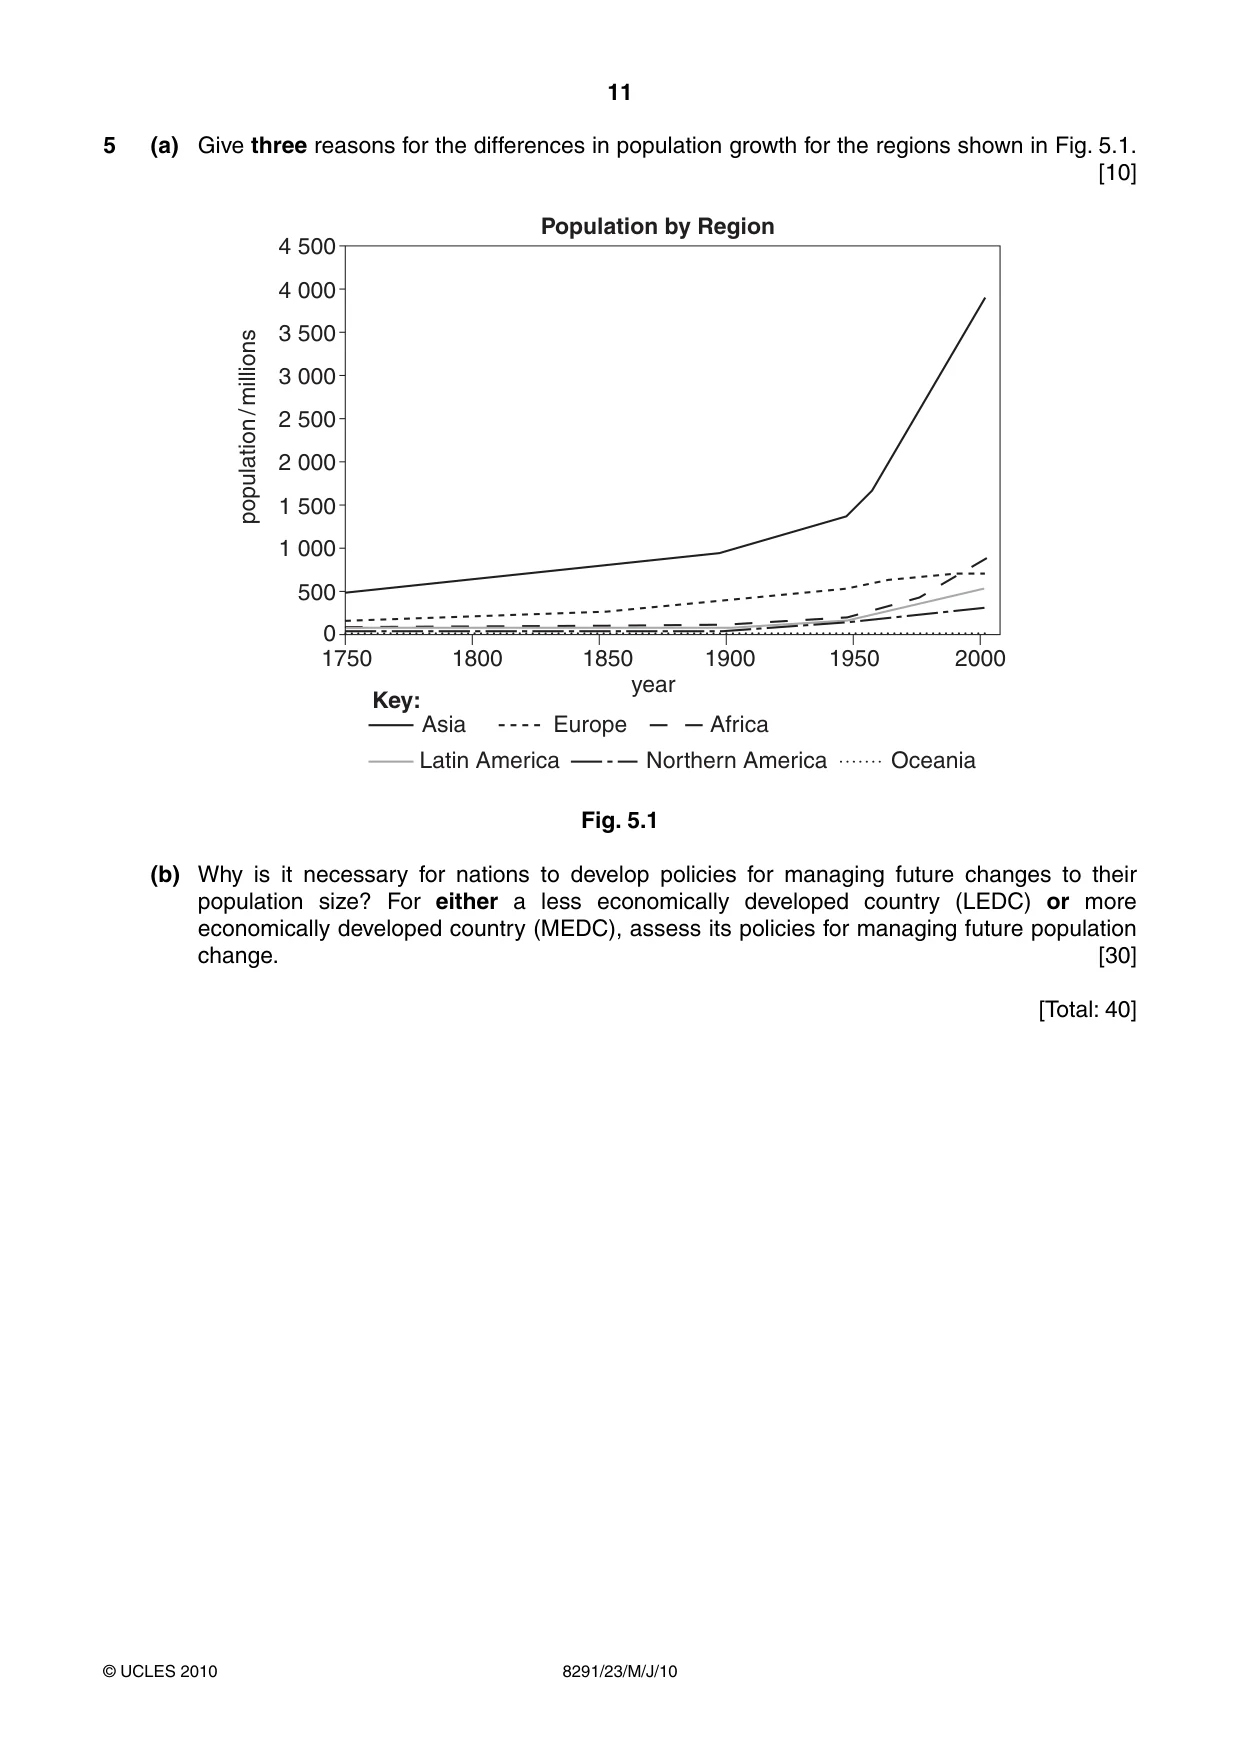
11 8291/23/M/J/10 © UCLES 2010 5 (a) Give three reasons for the differences in population growth for the regions shown in Fig. 5.1. [10] 4 500 4 000 3 500 3 000 2 500 population / millions 2 000 1 500 1 000 500 0 1750 Asia Europe Key: Africa year Latin America Northern America Oceania 1800 1850 1900 Population by Region 1950 2000 Fig. 5.1 (b) Why is it necessary for nations to develop policies for managing future changes to their population size? For either a less economically developed country (LEDC) or more economically developed country (MEDC), assess its policies for managing future population change. [30] [Total: 40]
Question paper, page 12
12 8291/23/M/J/10 © UCLES 2010 BLANK PAGE Copyright Acknowledgements: Question 1c © Grafissimo; Combine Working on a Wheat Field; iStockphoto 000007156402. Question 2b © www.coolschool.ca/lor/GEO12/unit10/u10I04.htm. Permission to reproduce items where third-party owned material protected by copyright is included has been sought and cleared where possible. Every reasonable effort has been made by the publisher (UCLES) to trace copyright holders, but if any items requiring clearance have unwittingly been included, the publisher will be pleased to make amends at the earliest possible opportunity. University of Cambridge International Examinations is part of the Cambridge Assessment Group. Cambridge Assessment is the brand name of University of Cambridge Local Examinations Syndicate (UCLES), which is itself a department of the University of Cambridge.
Mark scheme, page 1
UNIVERSITY OF CAMBRIDGE INTERNATIONAL EXAMINATIONS GCE Advanced Subsidiary Level MARK SCHEME for the May/June 2010 question paper for the guidance of teachers 8291 ENVIRONMENTAL MANAGEMENT 8291/23 Paper 23, maximum raw mark 80 This mark scheme is published as an aid to teachers and candidates, to indicate the requirements of the examination. It shows the basis on which Examiners were instructed to award marks. It does not indicate the details of the discussions that took place at an Examiners’ meeting before marking began, which would have considered the acceptability of alternative answers. Mark schemes must be read in conjunction with the question papers and the report on the examination. • CIE will not enter into discussions or correspondence in connection with these mark schemes. CIE is publishing the mark schemes for the May/June 2010 question papers for most IGCSE, GCE Advanced Level and Advanced Subsidiary Level syllabuses and some Ordinary Level syllabuses.
Mark scheme, page 2
Page 2 Mark Scheme: Teachers’ version Syllabus Paper GCE AS LEVEL – May/June 2010 8291 23 © UCLES 2010 Section A (Answer all questions in this section) 1 (a) What is meant by the terms biome, net primary productivity (NPP) and biomass? [3] One mark for each biome – a broad area containing similar soils, climate and vegetation groups NPP – the amount of energy passed from producers onto the next trophic level or the total amount of energy fixed by green plants minus that lost through respiration biomass – the total mass (dry) of living organisms in a community or area (b) Fig. 1.1 shows the locations of some of the world’s major biomes. (i) Name one biome associated with each of the following climatic conditions: [3] One mark for each correct answer. • hot summers, warm winters and a small amount of summer rainfall savanna • cool short summers, very cold winters, small amounts of summer rainfall tundra • hot and moist in every month tropical rainforest (ii) Describe and suggest one reason for the distribution of deserts as shown in Fig. 1.1. [3] Award 1 mark for distribution and 2 marks for reasons. Deserts can be continental interior/tropical high pressure zone/rainshadow/tropical west coast of continents. Continental interior areas are distant form maritime air masses e.g. Gobi. High pressure or anticyclonic have descending air which is heated adiabatically thereby reducing its humidity e.g. Sahara. Rain shadow air dries as it descends on the leeward side of a mountain range e.g. Patagonia. coastal moist maritime air is cooled by cold ocean currents thereby losing their moisture; they are dry when they reach a land mass e.g. Atacama. (iii) Table 1.1 contains information on net primary productivity (NPP). With reference to Table 1.1 describe how NPP depends upon temperature and precipitation. [4] precipitation humid areas such as TRF and temperate forest high NPPs = 1 mark; whilst desert, savanna, temperate grasslands (the latter two are marginal areas often irrigated) are low = 1 mark temperature NPP and temperature have a less secure correlation; e.g. TRF, deciduous forest and tundra show an expected pattern but deserts and savanna are affected by a lack of precipitation
Mark scheme, page 3
Page 3 Mark Scheme: Teachers’ version Syllabus Paper GCE AS LEVEL – May/June 2010 8291 23 © UCLES 2010 (c) Temperate grasslands such as the Prairies and the Pampas can be regarded as marginal areas that should not be over-farmed. Fig. 1.2 illustrates mechanised agriculture of the American Prairies and the climate of the area. (i) Briefly explain why the climate of this area is regarded as semi-arid. [2] Summer rainfall losses due to evaporation (1 mark); recognition of the dryness of the climate (1 mark). (ii) Suggest why the farming activities shown in Fig. 1.2 might become unsustainable. [3] Extensive arable farming/highly mechanised with clear skies/hot summers, this combination places a limit on continued agricultural activity. (iii) Outline one method that could be used to maintain future crop production in the depicted area in Fig. 1.2. [2] Credit 1 mark for a correct method and 1 for its justification. Moisture is a major factor and irrigation is the better answer; other points could include: less intensive farming; crop rotation; fertilisation accompanied by irrigation. [Total: 20] 2 (a) Fig. 2.1 shows four sources of water pollution. (i) For each of the sources of water pollution shown in Fig. 2.1 identify a different type of pollutant. [4] Sewage and waste water: detergents, ammonia, organic contamination, phosphates. Marine dumping: oil, hydrocarbons, sewage and waste water derivatives. Atmospheric deposition: components of acid rain, dilute sulphur acid etc. Industrial waste: iron, salts metals acids. (ii) Outline the effects pollution from sewage and wastewater may have upon human health and freshwater ecosystems. [4] Award one mark for a brief statement or the effect and one mark for the elaboration. Human health: waterborne diseases in the supply of drinking water such as dysentery, cholera. Freshwater ecosystems: via eutrophication and organic blooms the loss of plant life, disruption to food chains etc. (iii) Describe two effects marine dumping by ships at sea might have upon marine ecosystems. [4] Credit 2 marks for each; one mark for a brief statement and two for a developed point. Only credit references to marine pollution. Likely references are: oil, litter, sewage from ships, war relics (bombs etc). Ecosystems can include food chains as well as effects of sea life and birds.
Mark scheme, page 4
Page 4 Mark Scheme: Teachers’ version Syllabus Paper GCE AS LEVEL – May/June 2010 8291 23 © UCLES 2010 (b) With reference to one of the following: agriculture, households or industry, suggest why methods of reducing water pollution should follow the order of priorities shown in Fig. 2.2. [8] This question invites some discussion of the four points in the triangle. It suggests that effective pollution prevention should start at the source thereby reducing the total amount. Recycling is seen as a priority in reducing the total amount. Treatment and disposal deal with the remainder and items that cannot be recycled or are difficult to reduce at the source. Illustrations must be derived from one of the three sources. Notionally award 4 marks for an understanding of the priorities and 4 for marks how it might be applied. Refine the marks by using the bands below. 6–8 marks Answers express a clear understanding of the four priorities and use examples to illustrate these priorities. Good use is made of exemplar material. 3–5 marks Answers will consider at least two of the priorities. Exemplar material may be detached from the priorities and be weakly utilised. 1–2 marks Answers will consider at least one of the priorities but the descriptions may be brief and exemplar material poorly used. [Total: 20]
Mark scheme, page 5
Page 5 Mark Scheme: Teachers’ version Syllabus Paper GCE AS LEVEL – May/June 2010 8291 23 © UCLES 2010 Section B Answer one question from this section. 3 (a) Fig. 3.1 shows some of the possible sources of conflicts of interest that can exert pressures upon an area of outstanding natural beauty. Briefly explain how the needs of local communities, public enjoyment of the countryside and the need for conservation would give rise to these conflicts of interest. [10] The question is concerned with how conflicts of interest arise with respect to the area of outstanding natural beauty. The map illustrates how a number of economic, social and recreational interests could conflict with the need to conserve an area: • employment needs are found in the retail park, quarry and farms • recreational need from people in the cities, gaining access to the park from the road • economic pressures exerted by the need for land from farms, the quarry, the retail park and urban expansion • other problems are obtained from noise, pollution and public misuse of the area of outstanding natural beauty. 8–10 marks An equal balance should be given to each conflict of interest with reference to identifying which components conflict with conserving the area of natural beauty. Expect high quality analysis and use of the model in this band. 4–7 marks Answers may correctly identify the various conflicts of interest but lack certainty about why and its effects. Other answers may develop one or two area of conflict. 1–3 marks Answers may cover one point or show a lack of understanding. Expect brief descriptions or unsubstantiated lists.
Mark scheme, page 6
Page 6 Mark Scheme: Teachers’ version Syllabus Paper GCE AS LEVEL – May/June 2010 8291 23 © UCLES 2010 (b) Using examples you have studied, assess the responsibilities of National Parks in protecting areas that are of ecological importance and outstanding natural beauty. [30] Candidates should be able to develop examples with which they are familiar. Most National Parks are areas of ecological importance and this forms an important focus of the question. Such areas include: tropical rain forests (e.g. Gola), wild and scenic landscapes (Yosemite, Lake District), unique environments (Galapagos, Nature Reserves, Coral reef, wetlands) etc. Answers should: Identify more than one example. Explain why it is ecologically important and of outstanding natural beauty. Describe the pressures it is under from human activity. To explain the role of the National Park answers should outline and explain: • its designation as a National Park • its public management policies (e.g. public access, information, ecotourism, honeypots, restrictions, education) • its role in maintaining research e.g. sites of special scientific interest, preservation and conservation. Finally the degree of success of the National Park should be assessed. This can be done within each part of the essay or as an evaluative conclusion to the essay. Band 1 Answers should be clear about the role of National Park designation for the area they have chosen. They must consider the roles of research and conservation along with the need to both attract and manage visitors. There should be a strong element of evaluation. [25–30] Band 3 Answers may be poorly balanced by focussing more upon issues than the role of the National Park. Other answers may lack detail but consider all parts of the question. Assessments of success or failure may be poor. [13–18] Band 4 Answers should have some relevance but are likely to be brief and lack evaluative comment. [6–12] [Total: 40]
Mark scheme, page 7
Page 7 Mark Scheme: Teachers’ version Syllabus Paper GCE AS LEVEL – May/June 2010 8291 23 © UCLES 2010 4 (a) Fig. 4.1 illustrates the region around an expanding city. The demands of the city give rise to adverse effects on the supply and quality of water in this region. Describe three of these effects. [10] The map contains information on three sources of water: a reservoir, a river and groundwater. Increasing demand for water is because of domestic need, industrial use and farming. Water supplies refer to supply and quality. Effects include: • a reduction in reservoir water with possible effects on river discharge • a lowering of the water table • contamination of ground water from the urban area and farming • river contamination • less water for irrigation • credit other valid effects. Credit 1 mark for identifying the effect and 2 marks for the amplification. 8–10 marks Answers will identify three effects and provide a full amplification considering both supply and quality. 4–7 marks Answers will identify at least two effects with weaknesses in the consideration of quality and supply. Answers that only refer to one type of effect fall into this band. 1–3 marks Answers will identify one effect and the amplification of quality and supply will be weak. Maximum of 3 marks for one well developed identification.
Mark scheme, page 8
Page 8 Mark Scheme: Teachers’ version Syllabus Paper GCE AS LEVEL – May/June 2010 8291 23 © UCLES 2010 (b) With reference to named examples with which you are familiar evaluate the strategies that have been adopted to achieve a sustainable supply of water. [30] The answer should contain reference to supply and quality in relation to demand. For many nations water is a scarce commodity, thus the importance of how present supplies are obtained and the impact of future demand upon supplies. The difference between LEDCs and MEDCs is largely a matter of the scale of the demand and ability of nations to meet their demand. Actual methods are not always unique to one group of nations. As candidates have the option of selecting their own examples the following points should relate to the chosen examples. Examples of major projects can include: dams and reservoirs, desalinisation, tube wells, ground water extraction etc. Answers should balance: Description where it is, its construction, the factors that needed to be taken into account for its development. Explanation why and how it has been developed e.g. needs/supply and demand. Who is it for; domestic/industrial or agricultural use. Advantages should include the criteria used to assess its success which go beyond supplying domestic and economic needs (e.g. reservoirs for recreation). Evaluations should review the positive and negative effects of the selected schemes. Band 1 Answers should express a clear understanding of sustainable water supplies in terms of both quantity and quality. Examples will be well selected and there will be both positive and negative evaluation. [25–30] Band 3 Answers may have unclear reference to the examples and lack clarity on sustainability. Relevant but superficial answers and bullet point answers lie in this band. Expect weak evaluation. [13–18] Band 4 Answers should be relevant and make reference to few water supply schemes. Other answers may be brief and superficial. Case study development will be limited as will evaluation. [6–12] [Total: 40]
Mark scheme, page 9
Page 9 Mark Scheme: Teachers’ version Syllabus Paper GCE AS LEVEL – May/June 2010 8291 23 © UCLES 2010 5 (a) Give three reasons for the differences in population growth for the continents shown in Fig. 5.1. [10] This question should not involve a continent by continent comparison. The prime reasons do draw out differences between LEDCs and MEDCs but regions should be used as exemplars of the reasons. • Variations in population size mean that Asia has a larger growth rate than continents with a lower population size (e.g. Europe). • LEDCs have high birth rates and falling death rates. A post 1950s phenomenon; thus a steepening of their growth trend. • MEDCs have had low birth and death rates for a long time; thus their steady low growth rates. • Credit other reasons or valid sub-divisions of these bullet points. 8–10 marks Answers clearly consider three reasons and use the continental areas as exemplars. 4–7 marks Stronger answers give reasons but the analysis and use of exemplars is weak. Weaker answers provide a weak survey of each continent. 1–3 marks Answers are either very weak in their selection of reasons or only develop one reason.
Mark scheme, page 10
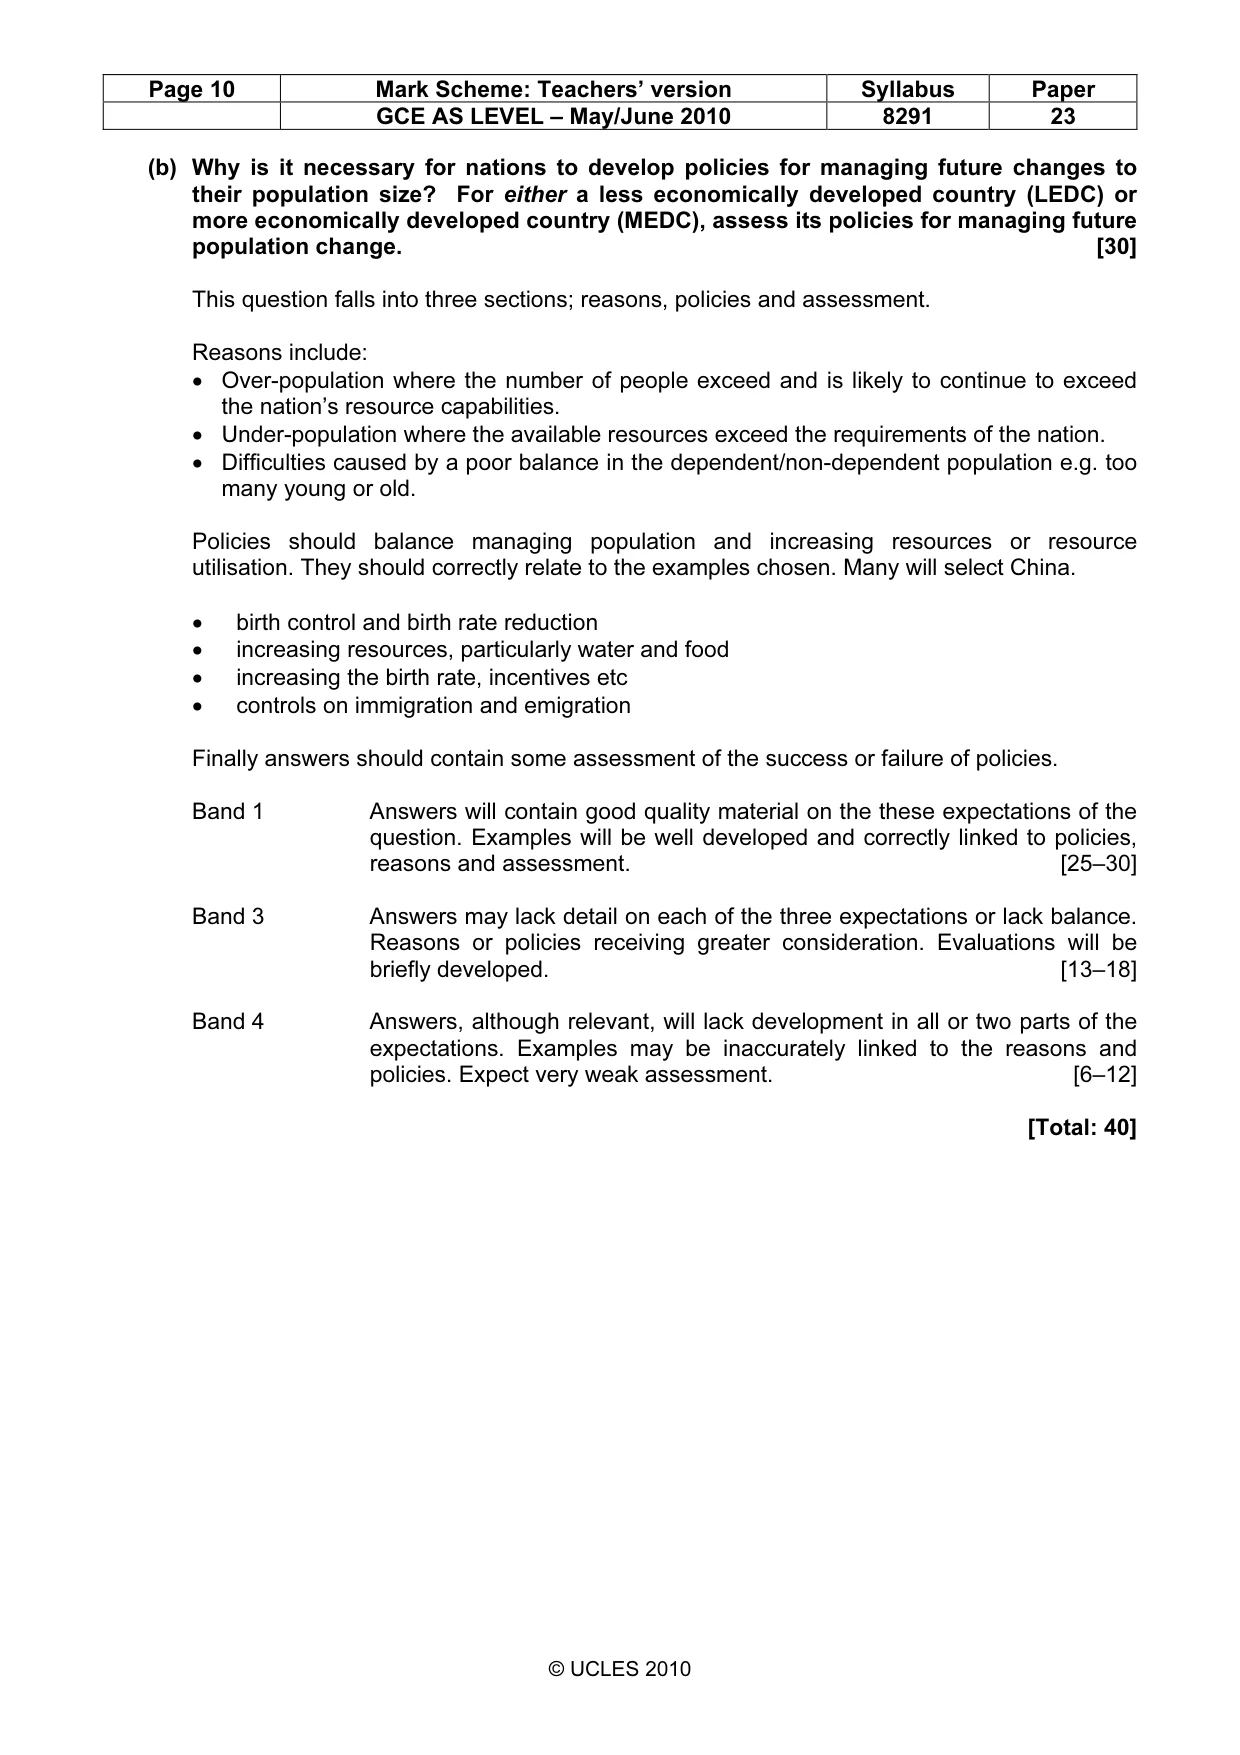
Page 10 Mark Scheme: Teachers’ version Syllabus Paper GCE AS LEVEL – May/June 2010 8291 23 © UCLES 2010 (b) Why is it necessary for nations to develop policies for managing future changes to their population size? For either a less economically developed country (LEDC) or more economically developed country (MEDC), assess its policies for managing future population change. [30] This question falls into three sections; reasons, policies and assessment. Reasons include: • Over-population where the number of people exceed and is likely to continue to exceed the nation’s resource capabilities. • Under-population where the available resources exceed the requirements of the nation. • Difficulties caused by a poor balance in the dependent/non-dependent population e.g. too many young or old. Policies should balance managing population and increasing resources or resource utilisation. They should correctly relate to the examples chosen. Many will select China. • birth control and birth rate reduction • increasing resources, particularly water and food • increasing the birth rate, incentives etc • controls on immigration and emigration Finally answers should contain some assessment of the success or failure of policies. Band 1 Answers will contain good quality material on the these expectations of the question. Examples will be well developed and correctly linked to policies, reasons and assessment. [25–30] Band 3 Answers may lack detail on each of the three expectations or lack balance. Reasons or policies receiving greater consideration. Evaluations will be briefly developed. [13–18] Band 4 Answers, although relevant, will lack development in all or two parts of the expectations. Examples may be inaccurately linked to the reasons and policies. Expect very weak assessment. [6–12] [Total: 40]
Mark scheme, page 11
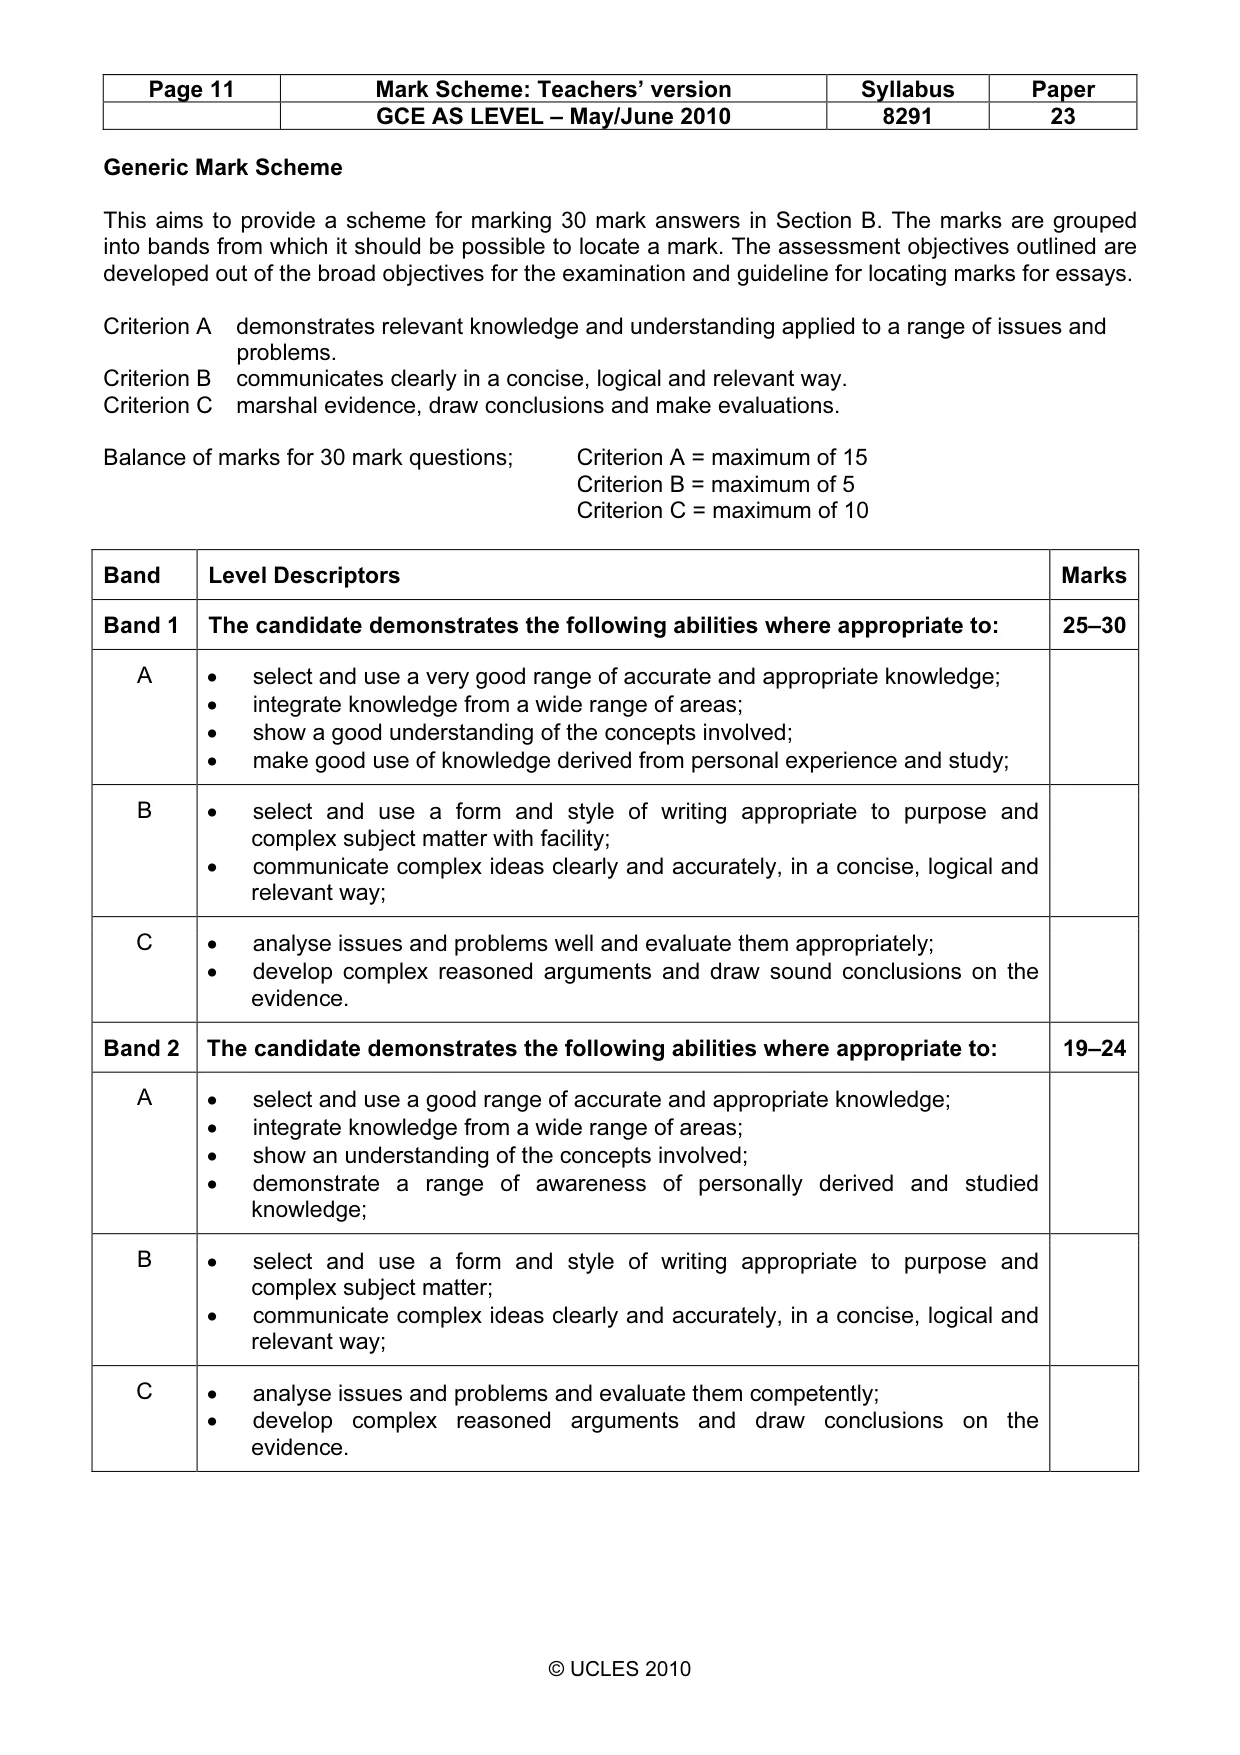
Page 11 Mark Scheme: Teachers’ version Syllabus Paper GCE AS LEVEL – May/June 2010 8291 23 © UCLES 2010 Generic Mark Scheme This aims to provide a scheme for marking 30 mark answers in Section B. The marks are grouped into bands from which it should be possible to locate a mark. The assessment objectives outlined are developed out of the broad objectives for the examination and guideline for locating marks for essays. Criterion A demonstrates relevant knowledge and understanding applied to a range of issues and problems. Criterion B communicates clearly in a concise, logical and relevant way. Criterion C marshal evidence, draw conclusions and make evaluations. Balance of marks for 30 mark questions; Criterion A = maximum of 15 Criterion B = maximum of 5 Criterion C = maximum of 10 Band Level Descriptors Marks Band 1 The candidate demonstrates the following abilities where appropriate to: 25–30 A • select and use a very good range of accurate and appropriate knowledge; • integrate knowledge from a wide range of areas; • show a good understanding of the concepts involved; • make good use of knowledge derived from personal experience and study; B • select and use a form and style of writing appropriate to purpose and complex subject matter with facility; • communicate complex ideas clearly and accurately, in a concise, logical and relevant way; C • analyse issues and problems well and evaluate them appropriately; • develop complex reasoned arguments and draw sound conclusions on the evidence. Band 2 The candidate demonstrates the following abilities where appropriate to: 19–24 A • select and use a good range of accurate and appropriate knowledge; • integrate knowledge from a wide range of areas; • show an understanding of the concepts involved; • demonstrate a range of awareness of personally derived and studied knowledge; B • select and use a form and style of writing appropriate to purpose and complex subject matter; • communicate complex ideas clearly and accurately, in a concise, logical and relevant way; C • analyse issues and problems and evaluate them competently; • develop complex reasoned arguments and draw conclusions on the evidence.
Mark scheme, page 12
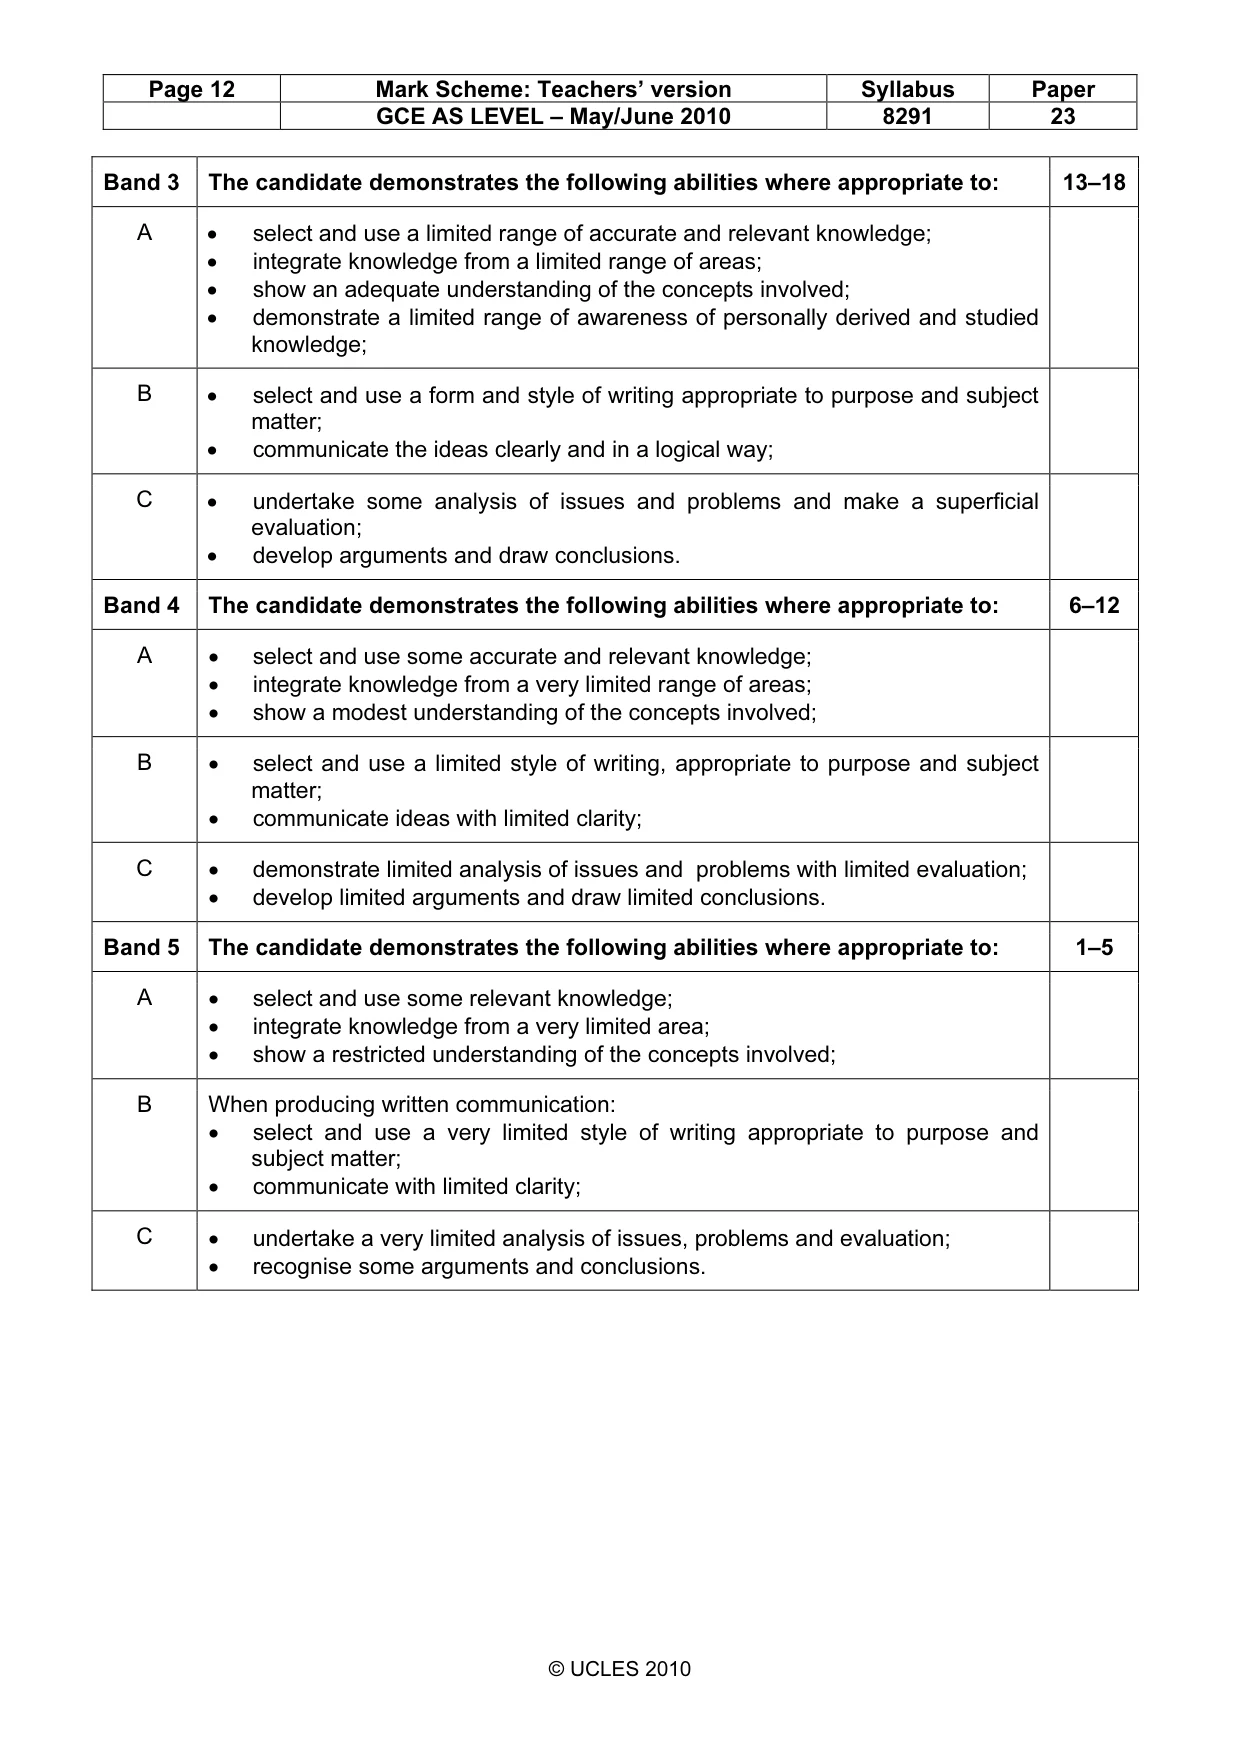
Page 12 Mark Scheme: Teachers’ version Syllabus Paper GCE AS LEVEL – May/June 2010 8291 23 © UCLES 2010 Band 3 The candidate demonstrates the following abilities where appropriate to: 13–18 A • select and use a limited range of accurate and relevant knowledge; • integrate knowledge from a limited range of areas; • show an adequate understanding of the concepts involved; • demonstrate a limited range of awareness of personally derived and studied knowledge; B • select and use a form and style of writing appropriate to purpose and subject matter; • communicate the ideas clearly and in a logical way; C • undertake some analysis of issues and problems and make a superficial evaluation; • develop arguments and draw conclusions. Band 4 The candidate demonstrates the following abilities where appropriate to: 6–12 A • select and use some accurate and relevant knowledge; • integrate knowledge from a very limited range of areas; • show a modest understanding of the concepts involved; B • select and use a limited style of writing, appropriate to purpose and subject matter; • communicate ideas with limited clarity; C • demonstrate limited analysis of issues and problems with limited evaluation; • develop limited arguments and draw limited conclusions. Band 5 The candidate demonstrates the following abilities where appropriate to: 1–5 A • select and use some relevant knowledge; • integrate knowledge from a very limited area; • show a restricted understanding of the concepts involved; B When producing written communication: • select and use a very limited style of writing appropriate to purpose and subject matter; • communicate with limited clarity; C • undertake a very limited analysis of issues, problems and evaluation; • recognise some arguments and conclusions.
What you needed in this session
Cambridge’s own grade thresholds for 2010 May/June, Paper 2 · Variant 3. A higher threshold means an easier paper — the bar moves with how the cohort did.