Cambridge A Level Environmental Management (AS only) 8291 — 2010 May/June Paper 1 · Variant 1
8291/11/M/J/10 · 80 marks · ≈90 min
The question paper and its mark scheme, free to read here and free to download. This is Cambridge’s own paper, exactly as it was sat.
Question paper12 pages





Mark scheme10 pages
Answers below. Sit the paper first if you are practising.

Paper as text
Question paper, page 1
This document consists of 9 printed pages and 3 blank pages. DC (SM/CGW) 17033/2 © UCLES 2010 [Turn over UNIVERSITY OF CAMBRIDGE INTERNATIONAL EXAMINATIONS General Certificate of Education Advanced Subsidiary Level READ THESE INSTRUCTIONS FIRST Write your Centre number, candidate number and name on all the work you hand in. Write in dark blue or black pen. You may use a soft pencil for any diagrams, graphs, tables or rough working. Do not use staples, paper clips, highlighters, glue or correction fluid. DO NOT WRITE IN ANY BARCODES. Section A Answer all questions. Write your answers in the spaces provided on the question paper. Section B Answer one question from this section. Answer the question on the separate answer paper provided. At the end of the examination, 1. fasten all separate answer paper securely to the question paper; 2. enter the question number from Section B in the grid opposite. CANDIDATE NAME CENTRE NUMBER CANDIDATE NUMBER ENVIRONMENTAL MANAGEMENT 8291/11 Paper 1 Lithosphere and Atmosphere May/June 2010 1 hour 30 minutes Additional Materials: Answer Booklet/Paper * 1 1 6 1 6 2 0 1 0 5 * For Examiner’s Use Section A 1 2 Section B Total
Question paper, page 2
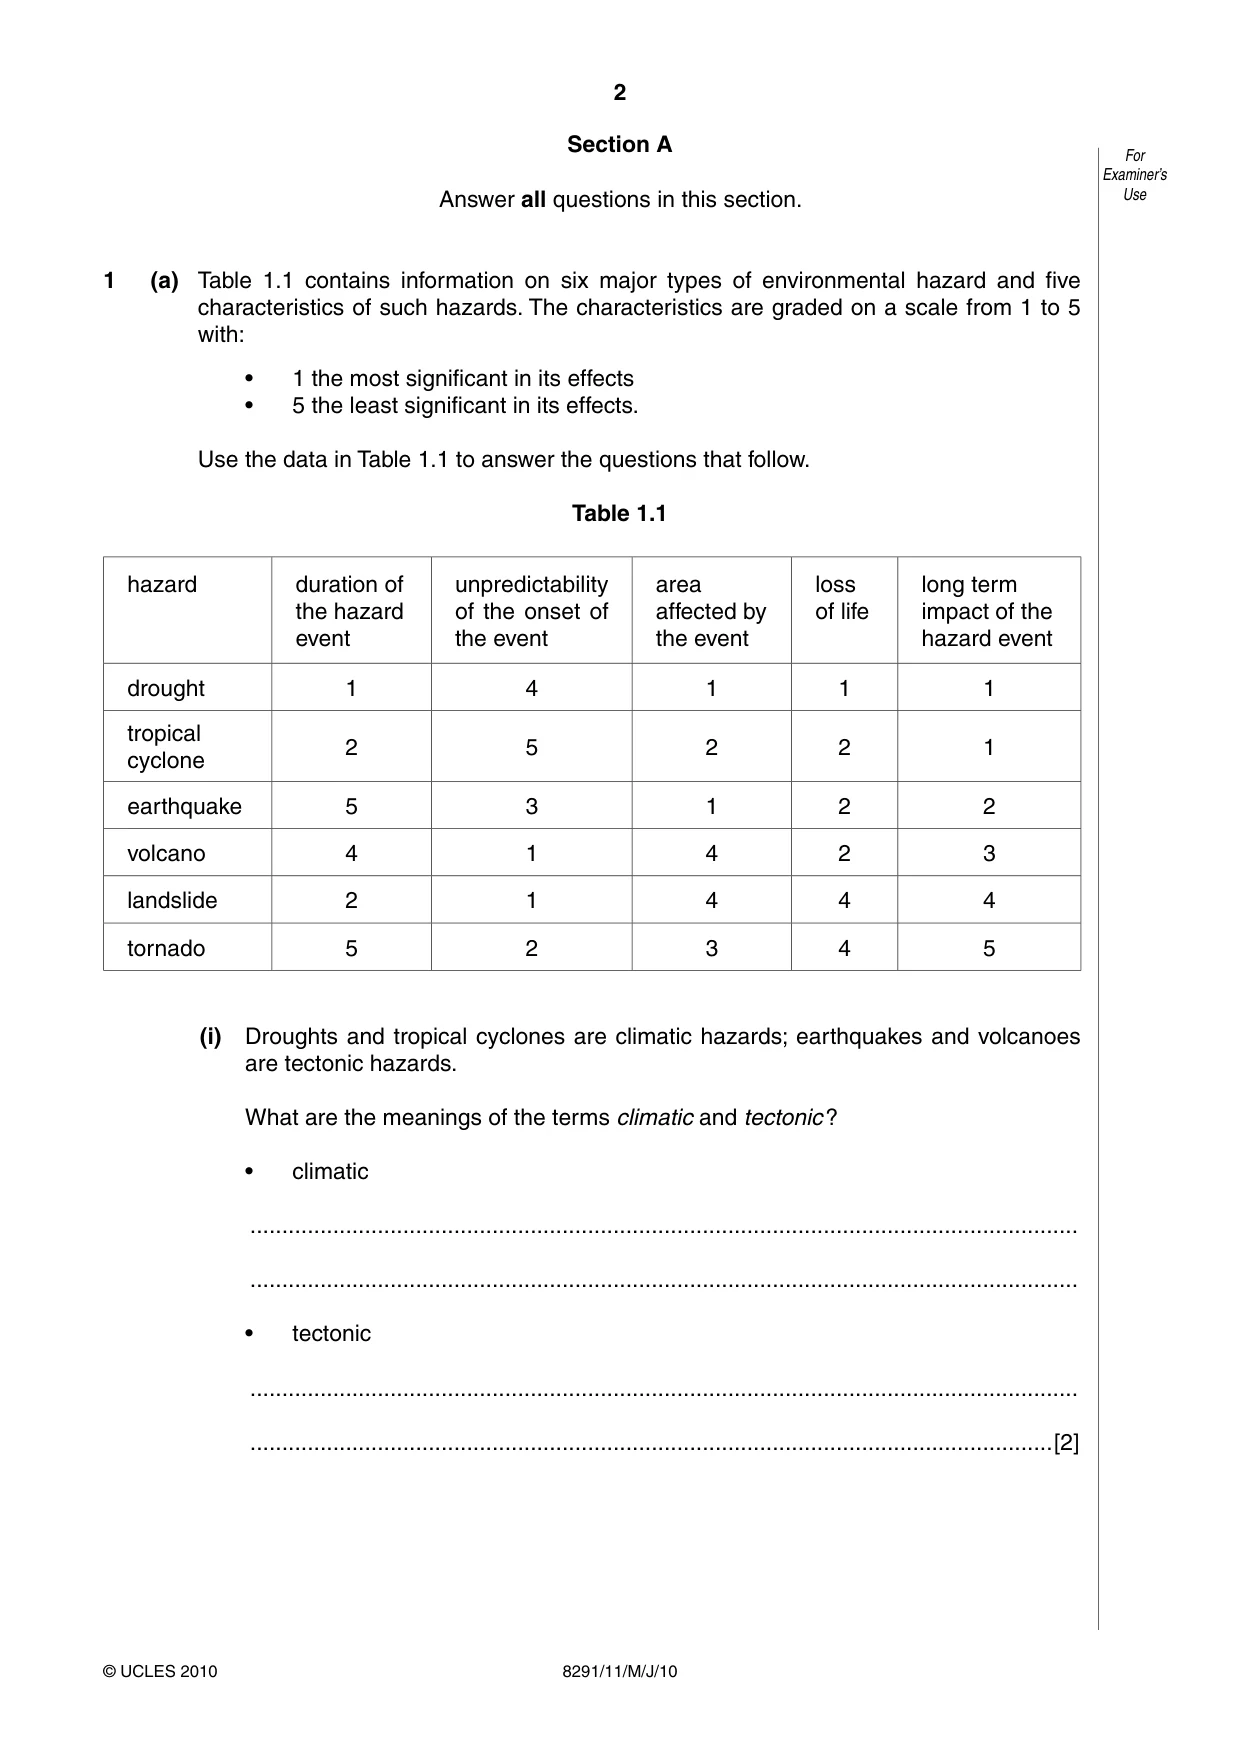
2 8291/11/M/J/10 For Examiner’s Use © UCLES 2010 Section A Answer all questions in this section. 1 (a) Table 1.1 contains information on six major types of environmental hazard and five characteristics of such hazards. The characteristics are graded on a scale from 1 to 5 with: • 1 the most significant in its effects • 5 the least significant in its effects. Use the data in Table 1.1 to answer the questions that follow. Table 1.1 hazard duration of the hazard event unpredictability of the onset of the event area affected by the event loss of life long term impact of the hazard event drought 1 4 1 1 1 tropical cyclone 2 5 2 2 1 earthquake 5 3 1 2 2 volcano 4 1 4 2 3 landslide 2 1 4 4 4 tornado 5 2 3 4 5 (i) Droughts and tropical cyclones are climatic hazards; earthquakes and volcanoes are tectonic hazards. What are the meanings of the terms climatic and tectonic ? • climatic … … • tectonic … …[2]
Question paper, page 3
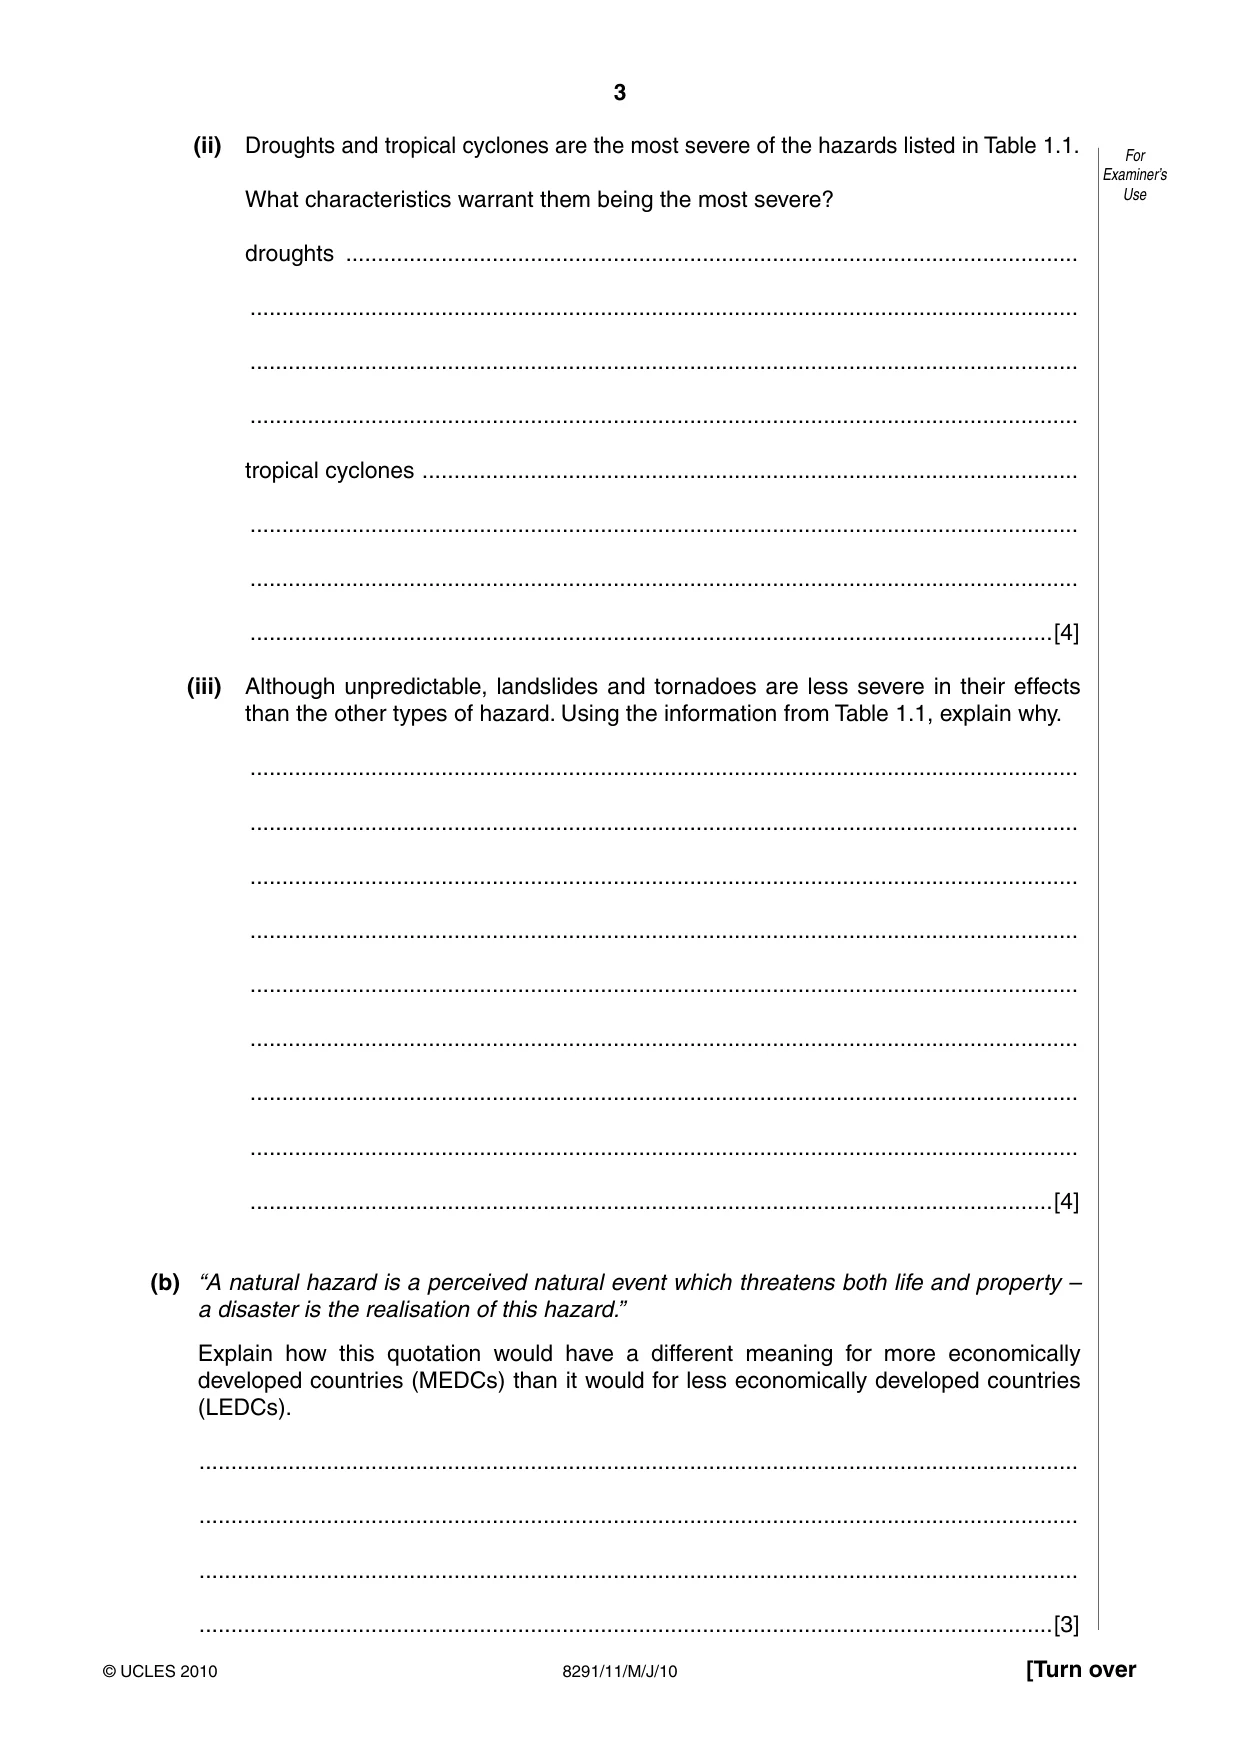
3 8291/11/M/J/10 [Turn over For Examiner’s Use © UCLES 2010 (ii) Droughts and tropical cyclones are the most severe of the hazards listed in Table 1.1. What characteristics warrant them being the most severe? droughts … … … … tropical cyclones … … … …[4] (iii) Although unpredictable, landslides and tornadoes are less severe in their effects than the other types of hazard. Using the information from Table 1.1, explain why. … … … … … … … … …[4] (b) “A natural hazard is a perceived natural event which threatens both life and property – a disaster is the realisation of this hazard.” Explain how this quotation would have a different meaning for more economically developed countries (MEDCs) than it would for less economically developed countries (LEDCs). … … … …[3]
Question paper, page 4
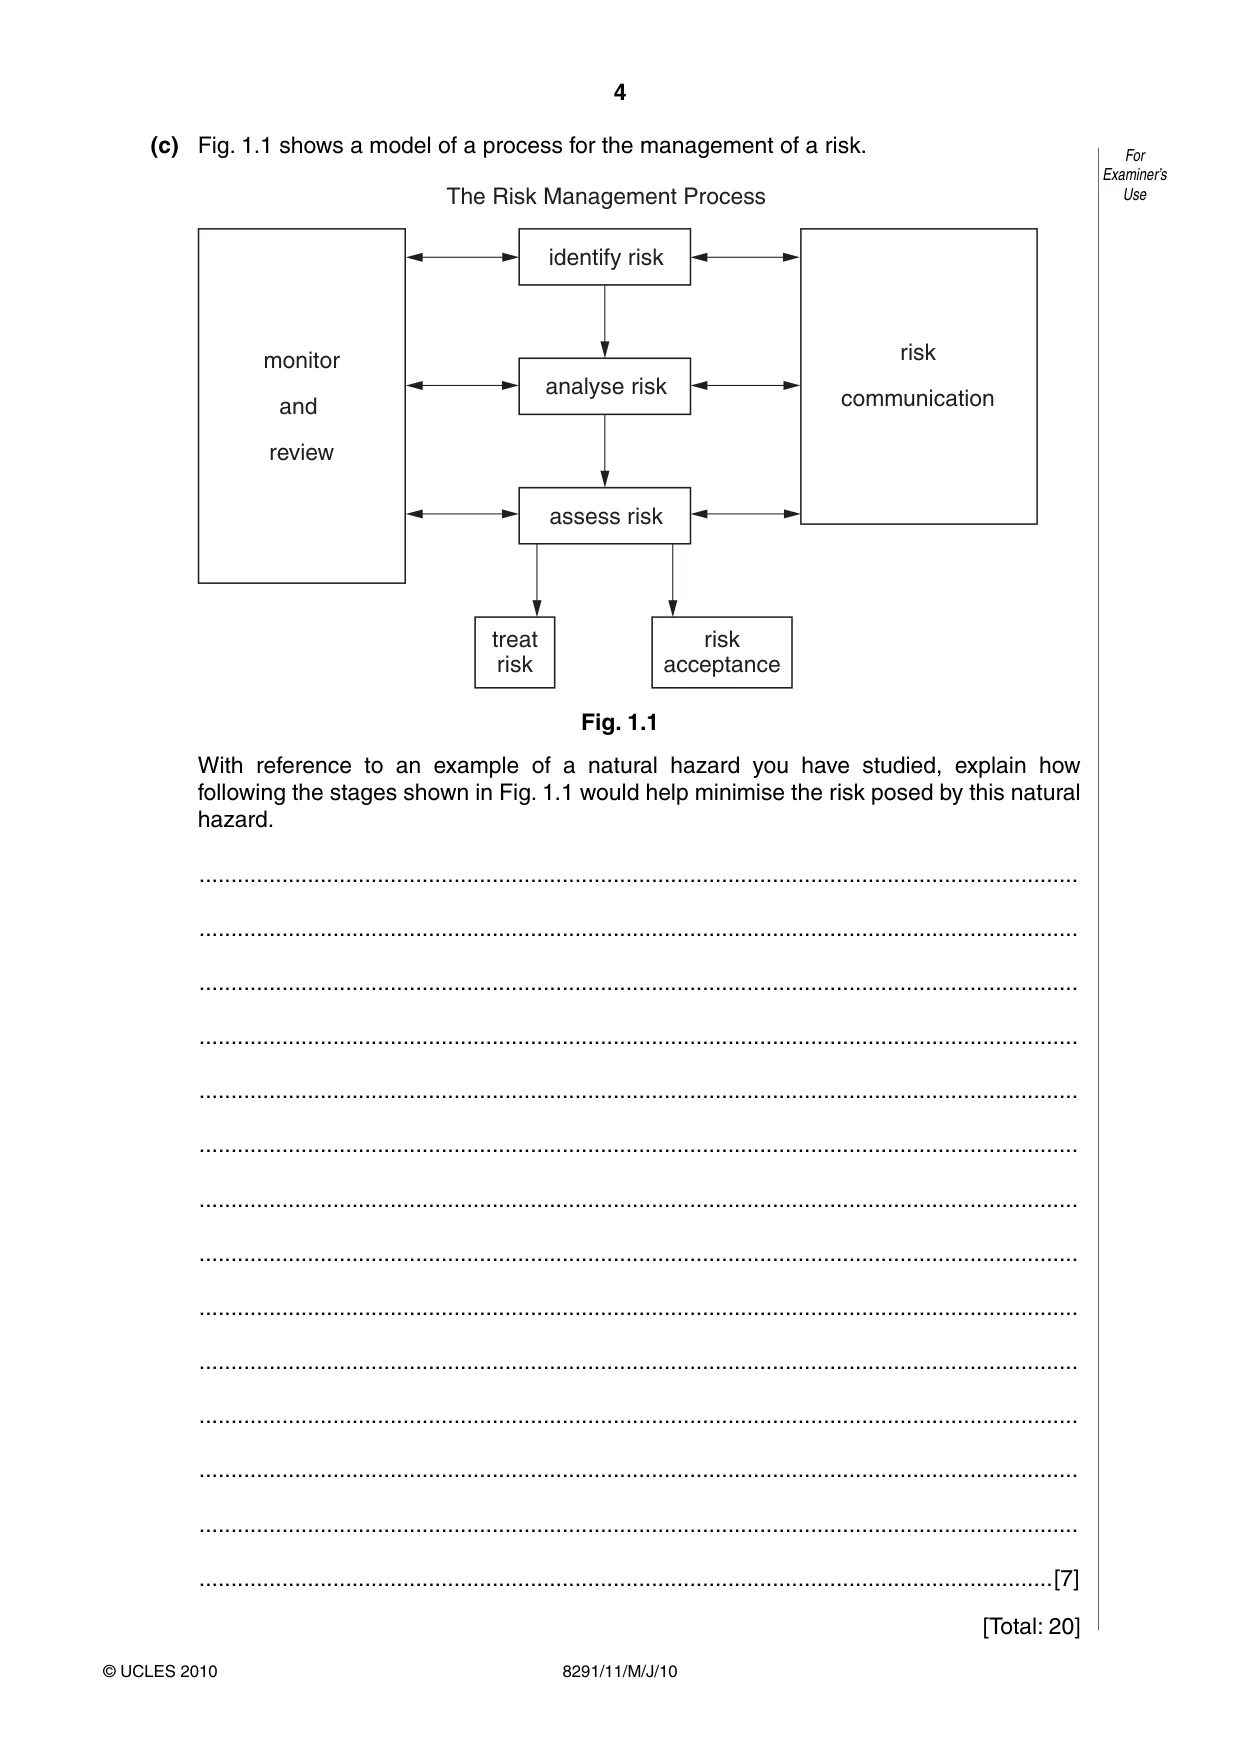
4 8291/11/M/J/10 For Examiner’s Use © UCLES 2010 (c) Fig. 1.1 shows a model of a process for the management of a risk. monitor and review risk communication identify risk The Risk Management Process analyse risk assess risk treat risk risk acceptance Fig. 1.1 With reference to an example of a natural hazard you have studied, explain how following the stages shown in Fig. 1.1 would help minimise the risk posed by this natural hazard. … … … … … … … … … … … … … …[7] [Total: 20]
Question paper, page 5
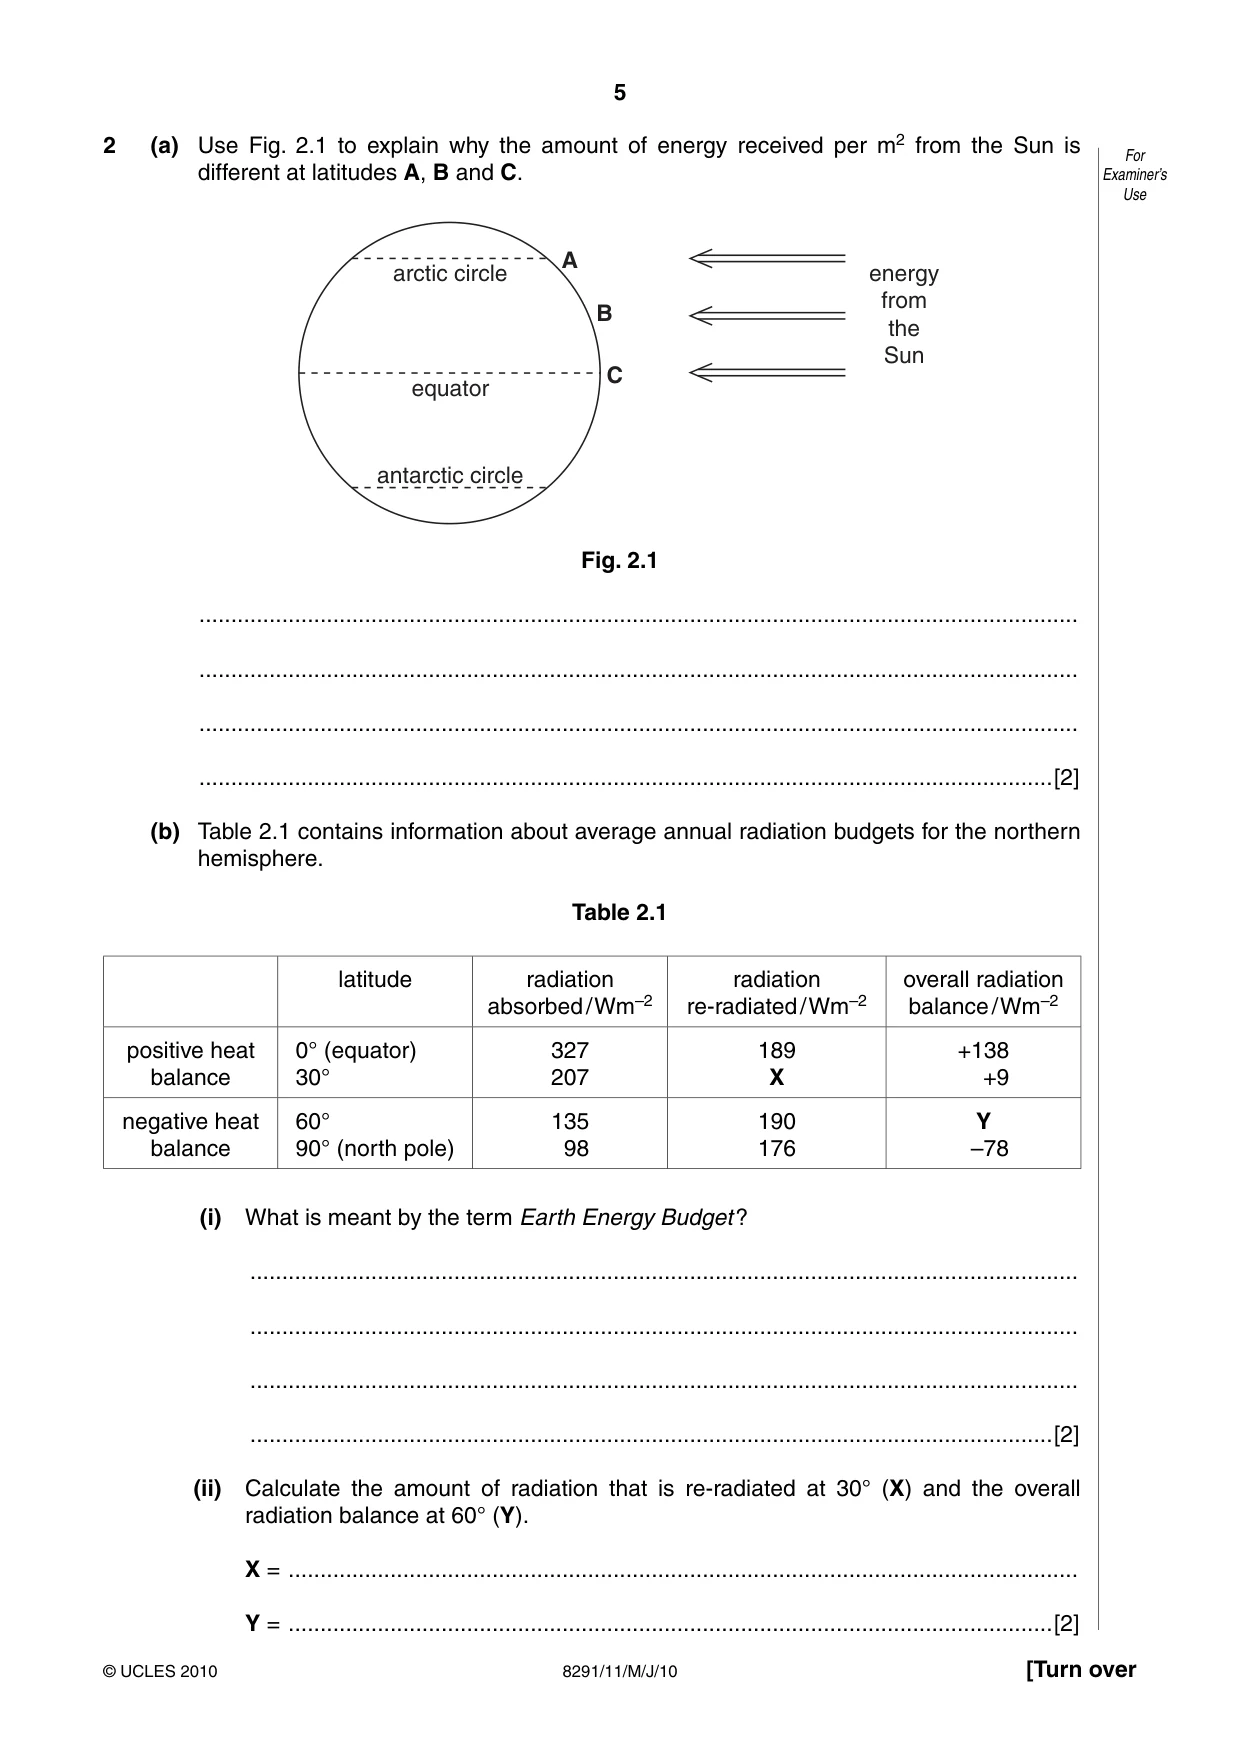
5 8291/11/M/J/10 [Turn over For Examiner’s Use © UCLES 2010 2 (a) Use Fig. 2.1 to explain why the amount of energy received per m2 from the Sun is different at latitudes A, B and C. arctic circle equator C B A energy from the Sun antarctic circle Fig. 2.1 … … … …[2] (b) Table 2.1 contains information about average annual radiation budgets for the northern hemisphere. Table 2.1 latitude radiation absorbed / Wm–2 radiation re-radiated / Wm–2 overall radiation balance / Wm–2 positive heat balance 0° (equator) 30° 327 207 189 X +138 +9 negative heat balance 60° 90° (north pole) 135 98 190 176 Y –78 (i) What is meant by the term Earth Energy Budget ? … … … …[2] (ii) Calculate the amount of radiation that is re-radiated at 30° (X) and the overall radiation balance at 60° (Y). X = … Y = …[2]
Question paper, page 6
6 8291/11/M/J/10 For Examiner’s Use © UCLES 2010 (iii) Which of the two factors, radiation absorbed or radiation re-radiated, is principally responsible for the differences in the overall radiation balance? …[1] (iv) Suggest one reason that would explain the overall radiation balance of +9 Wm–2 at 30° N. … …[1] (v) Suggest two processes, other than the energy received per m2, that would contribute to the radiation balance of +138 Wm–2 at the Equator and the balance of –78 Wm–2 at the North Pole. … … … … … … … …[4]
Question paper, page 7
7 8291/11/M/J/10 [Turn over For Examiner’s Use © UCLES 2010 (c) Explain how human activity is currently altering the Earth’s energy budget and describe two effects this alteration might have on the global environment. … … … … … … … … … … … … … … … …[8] [Total: 20]
Question paper, page 8
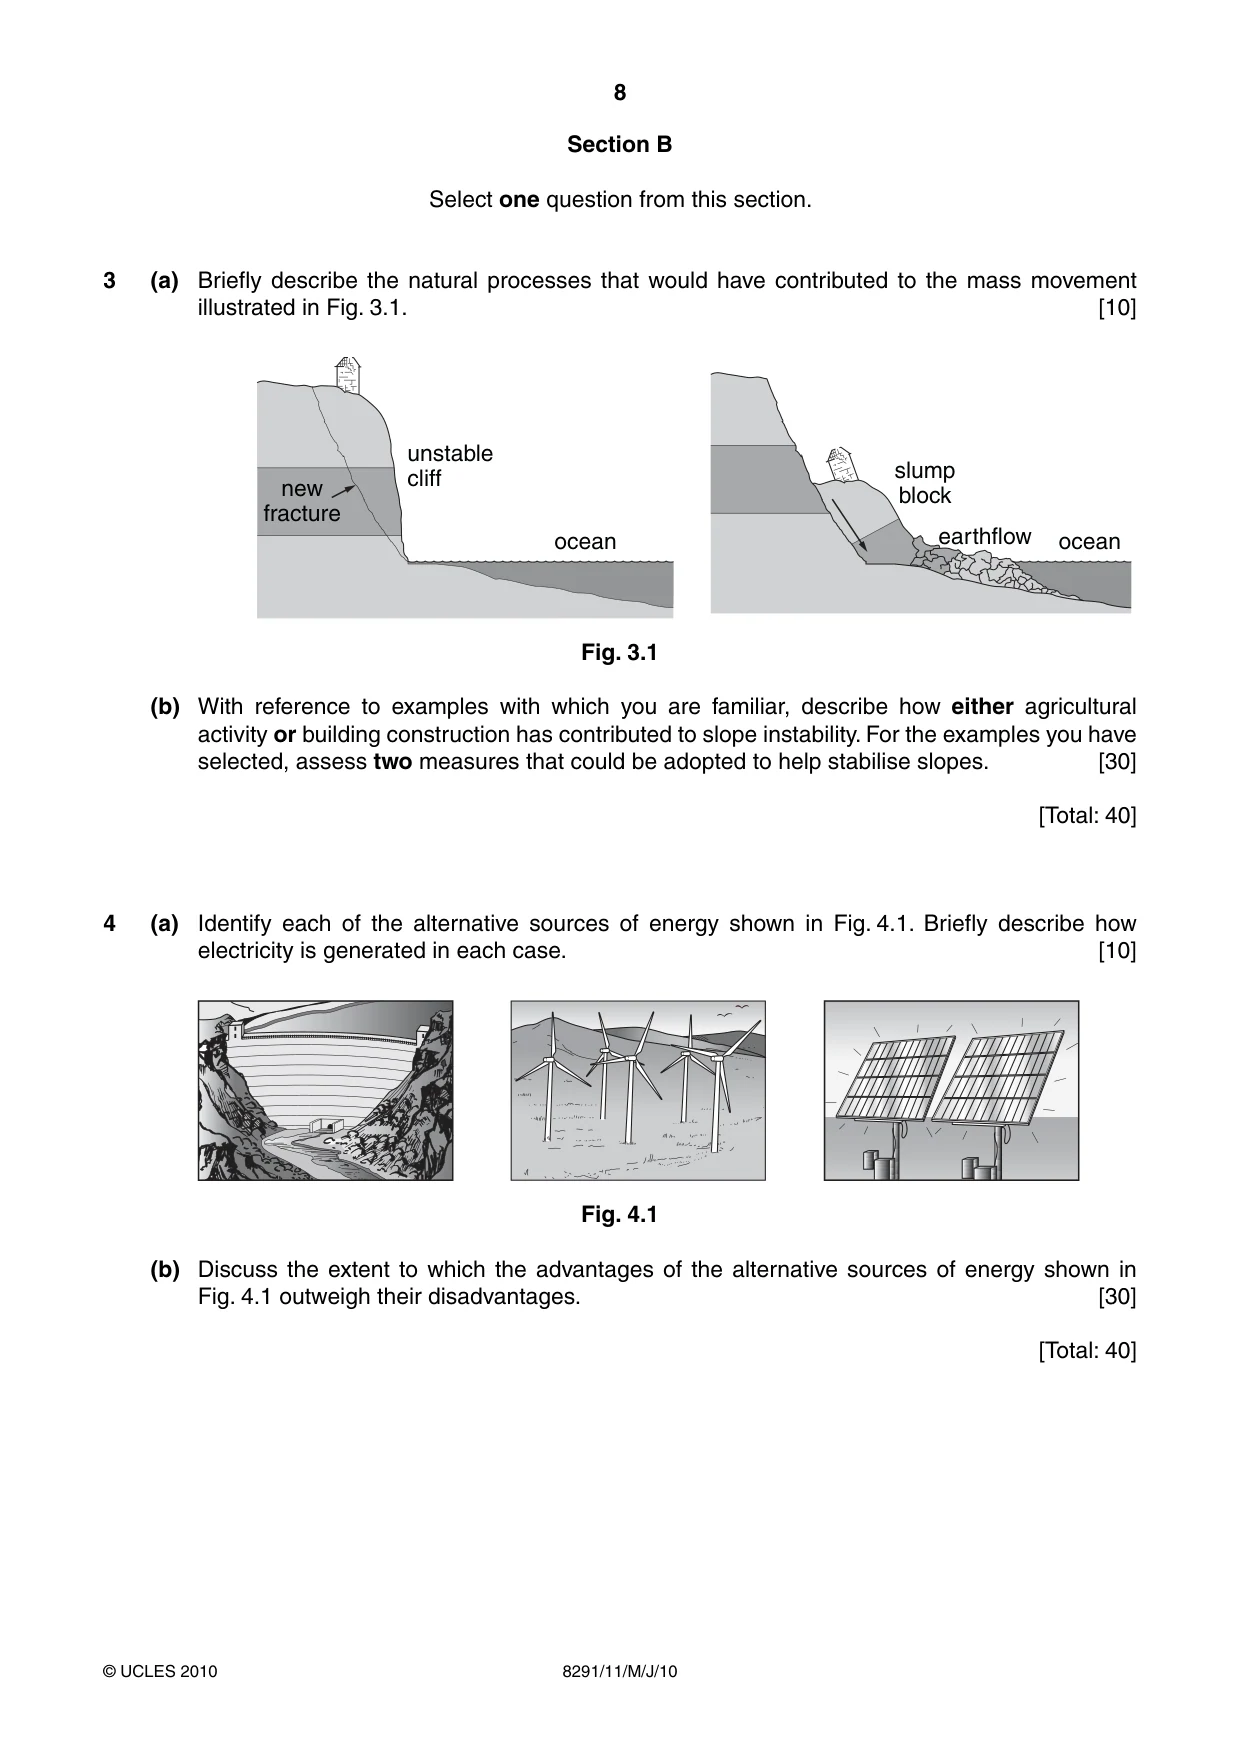
8 8291/11/M/J/10 © UCLES 2010 Section B Select one question from this section. 3 (a) Briefly describe the natural processes that would have contributed to the mass movement illustrated in Fig. 3.1. [10] unstable cliff ocean slump block earthflow ocean new fracture Fig. 3.1 (b) With reference to examples with which you are familiar, describe how either agricultural activity or building construction has contributed to slope instability. For the examples you have selected, assess two measures that could be adopted to help stabilise slopes. [30] [Total: 40] 4 (a) Identify each of the alternative sources of energy shown in Fig. 4.1. Briefly describe how electricity is generated in each case. [10] Fig. 4.1 (b) Discuss the extent to which the advantages of the alternative sources of energy shown in Fig. 4.1 outweigh their disadvantages. [30] [Total: 40]
Question paper, page 9
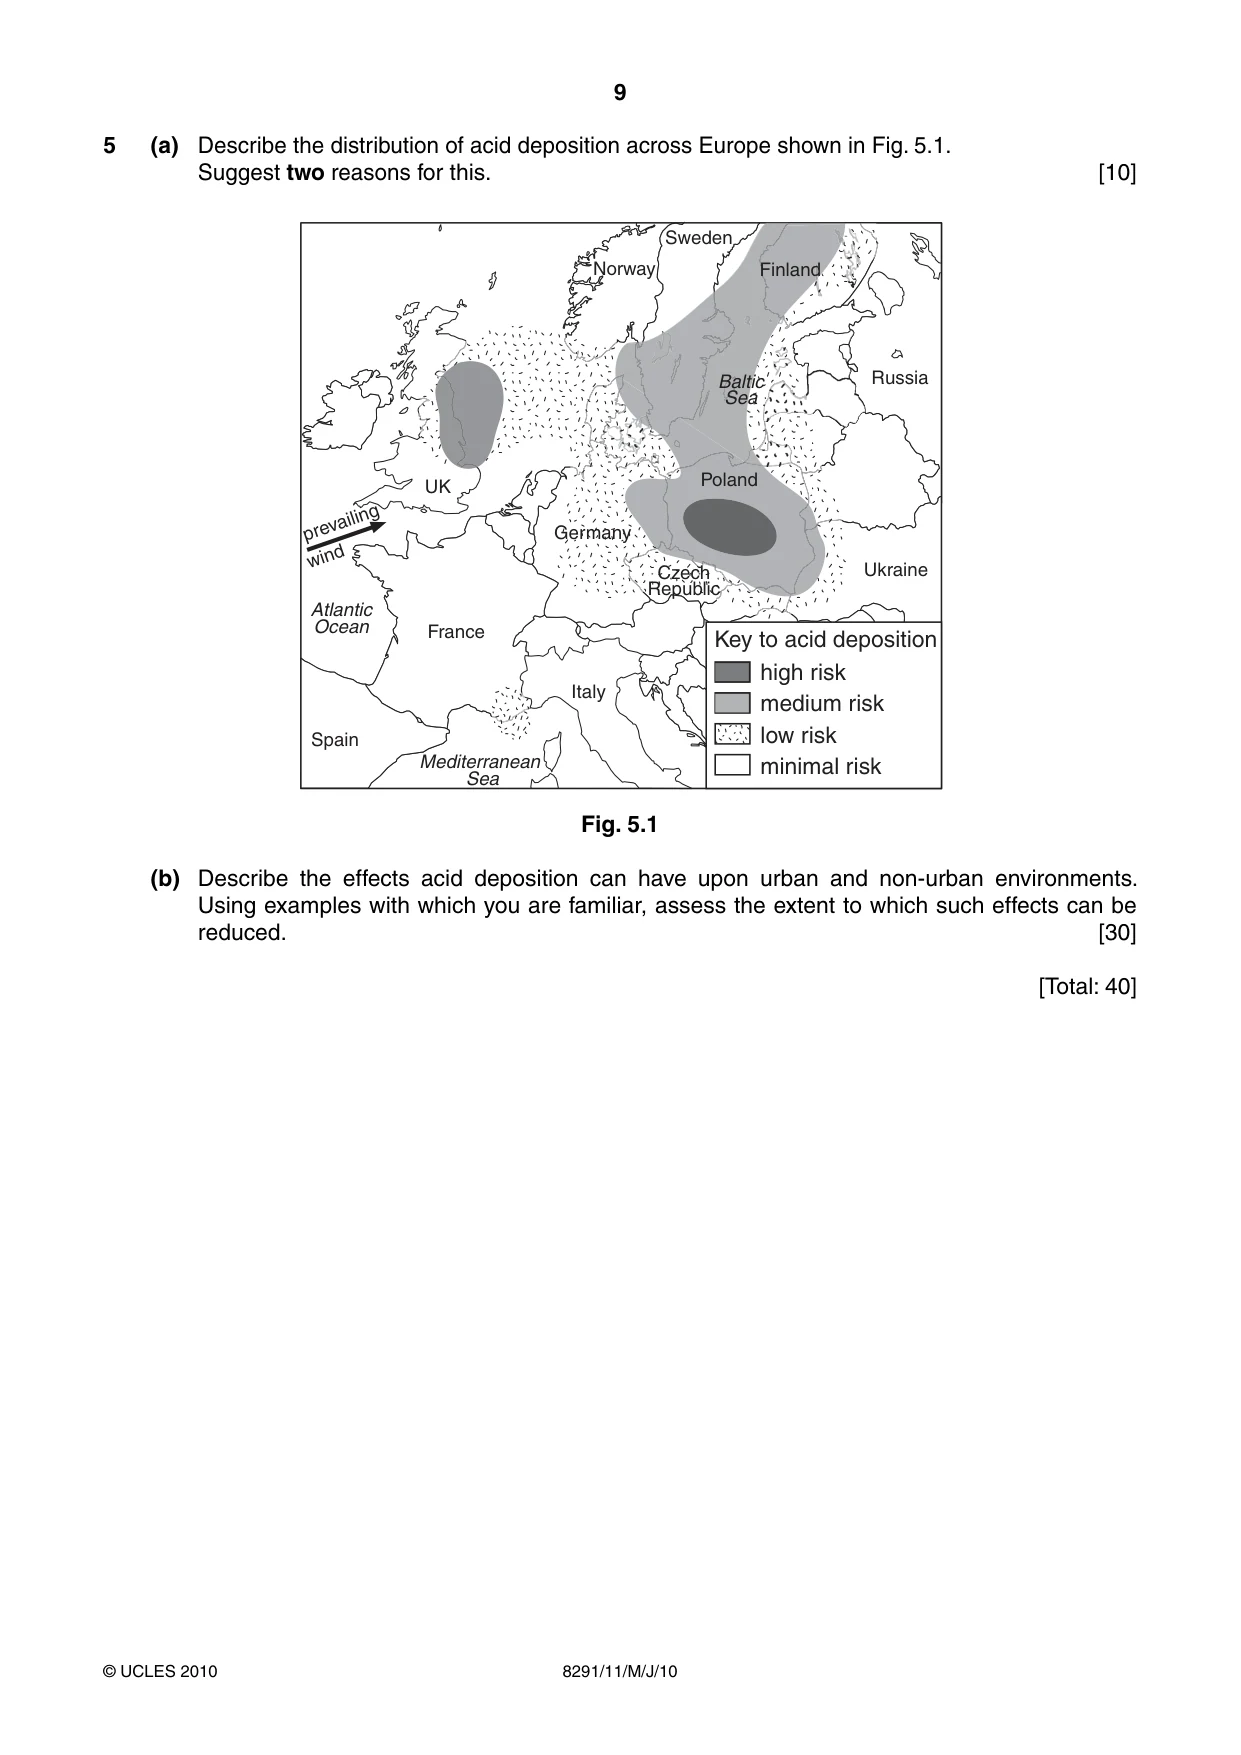
9 8291/11/M/J/10 © UCLES 2010 5 (a) Describe the distribution of acid deposition across Europe shown in Fig. 5.1. Suggest two reasons for this. [10] Norway Sweden Finland Poland UK France prevailing wind Spain Italy Russia Ukraine Germany Czech Republic Baltic Sea Mediterranean Sea Atlantic Ocean high risk Key to acid deposition medium risk low risk minimal risk Fig. 5.1 (b) Describe the effects acid deposition can have upon urban and non-urban environments. Using examples with which you are familiar, assess the extent to which such effects can be reduced. [30] [Total: 40]
Question paper, page 10
10 8291/11/M/J/10 © UCLES 2010 BLANK PAGE
Question paper, page 11
11 8291/11/M/J/10 © UCLES 2010 BLANK PAGE
Question paper, page 12
12 8291/11/M/J/10 © UCLES 2010 BLANK PAGE Copyright Acknowledgements: Question 1 © S. Frampton et al; Hazards ; Hodder & Stoughton; 2005. Question 2 © K Byrne: Environmental Science ; Thomas Nelson & Sons; 2001. Question 3 © seis.natsci.csulb.edu/…/cveep5diagram.gif Question 5 © www.advancedbuildings.org/img/sola\rpower.jpg © energy-consultancy.eu/ © www.planetsource.com/files/2007/07/wind-farm.jpg Permission to reproduce items where third-party owned material protected by copyright is included has been sought and cleared where possible. Every reasonable effort has been made by the publisher (UCLES) to trace copyright holders, but if any items requiring clearance have unwittingly been included, the publisher will be pleased to make amends at the earliest possible opportunity. University of Cambridge International Examinations is part of the Cambridge Assessment Group. Cambridge Assessment is the brand name of University of Cambridge Local Examinations Syndicate (UCLES), which is itself a department of the University of Cambridge.
Mark scheme, page 1
UNIVERSITY OF CAMBRIDGE INTERNATIONAL EXAMINATIONS GCE Advanced Subsidiary Level MARK SCHEME for the May/June 2010 question paper for the guidance of teachers 8291 ENVIRONMENTAL MANAGEMENT 8291/11 Paper 11, maximum raw mark 80 This mark scheme is published as an aid to teachers and candidates, to indicate the requirements of the examination. It shows the basis on which Examiners were instructed to award marks. It does not indicate the details of the discussions that took place at an Examiners’ meeting before marking began, which would have considered the acceptability of alternative answers. Mark schemes must be read in conjunction with the question papers and the report on the examination. • CIE will not enter into discussions or correspondence in connection with these mark schemes. CIE is publishing the mark schemes for the May/June 2010 question papers for most IGCSE, GCE Advanced Level and Advanced Subsidiary Level syllabuses and some Ordinary Level syllabuses.
Mark scheme, page 2
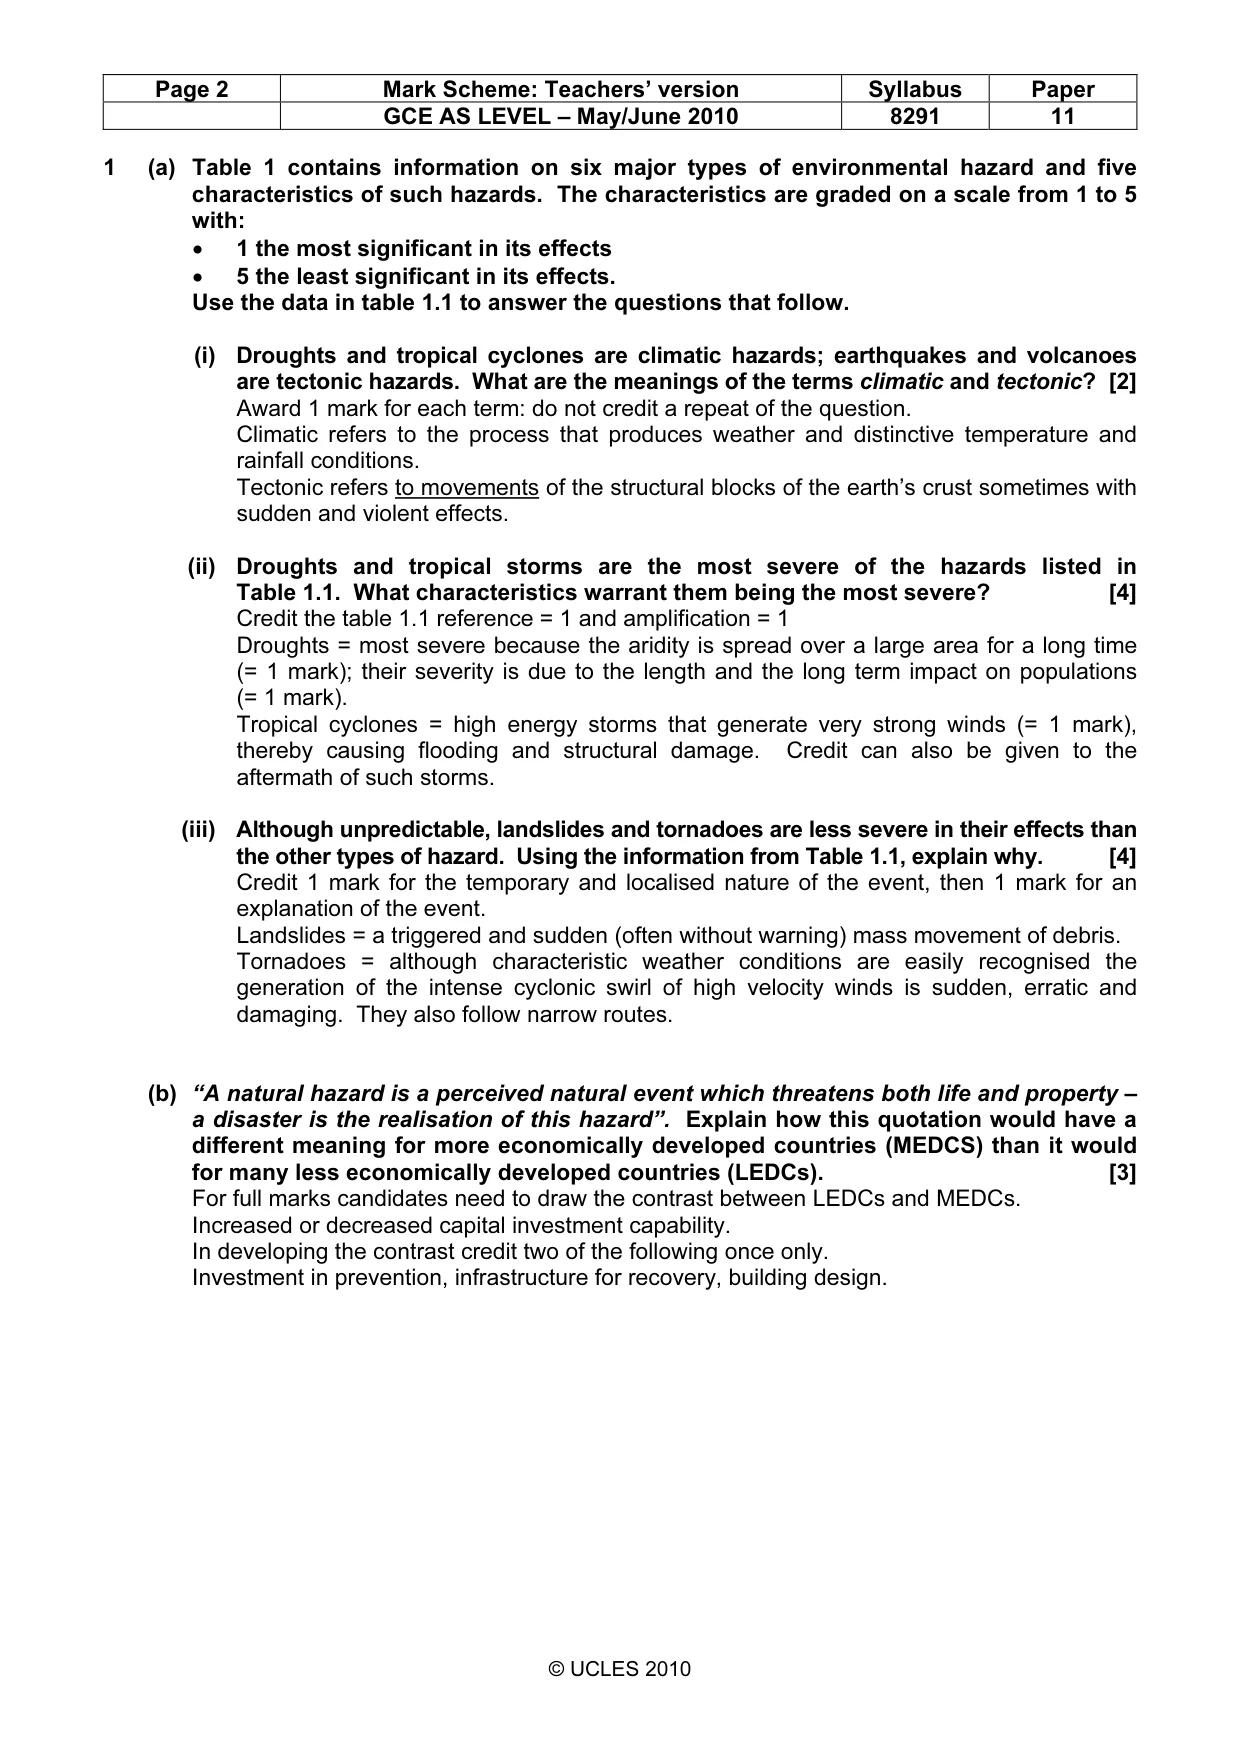
Page 2 Mark Scheme: Teachers’ version Syllabus Paper GCE AS LEVEL – May/June 2010 8291 11 © UCLES 2010 1 (a) Table 1 contains information on six major types of environmental hazard and five characteristics of such hazards. The characteristics are graded on a scale from 1 to 5 with: • 1 the most significant in its effects • 5 the least significant in its effects. Use the data in table 1.1 to answer the questions that follow. (i) Droughts and tropical cyclones are climatic hazards; earthquakes and volcanoes are tectonic hazards. What are the meanings of the terms climatic and tectonic? [2] Award 1 mark for each term: do not credit a repeat of the question. Climatic refers to the process that produces weather and distinctive temperature and rainfall conditions. Tectonic refers to movements of the structural blocks of the earth’s crust sometimes with sudden and violent effects. (ii) Droughts and tropical storms are the most severe of the hazards listed in Table 1.1. What characteristics warrant them being the most severe? [4] Credit the table 1.1 reference = 1 and amplification = 1 Droughts = most severe because the aridity is spread over a large area for a long time (= 1 mark); their severity is due to the length and the long term impact on populations (= 1 mark). Tropical cyclones = high energy storms that generate very strong winds (= 1 mark), thereby causing flooding and structural damage. Credit can also be given to the aftermath of such storms. (iii) Although unpredictable, landslides and tornadoes are less severe in their effects than the other types of hazard. Using the information from Table 1.1, explain why. [4] Credit 1 mark for the temporary and localised nature of the event, then 1 mark for an explanation of the event. Landslides = a triggered and sudden (often without warning) mass movement of debris. Tornadoes = although characteristic weather conditions are easily recognised the generation of the intense cyclonic swirl of high velocity winds is sudden, erratic and damaging. They also follow narrow routes. (b) “A natural hazard is a perceived natural event which threatens both life and property – a disaster is the realisation of this hazard”. Explain how this quotation would have a different meaning for more economically developed countries (MEDCS) than it would for many less economically developed countries (LEDCs). [3] For full marks candidates need to draw the contrast between LEDCs and MEDCs. Increased or decreased capital investment capability. In developing the contrast credit two of the following once only. Investment in prevention, infrastructure for recovery, building design.
Mark scheme, page 3
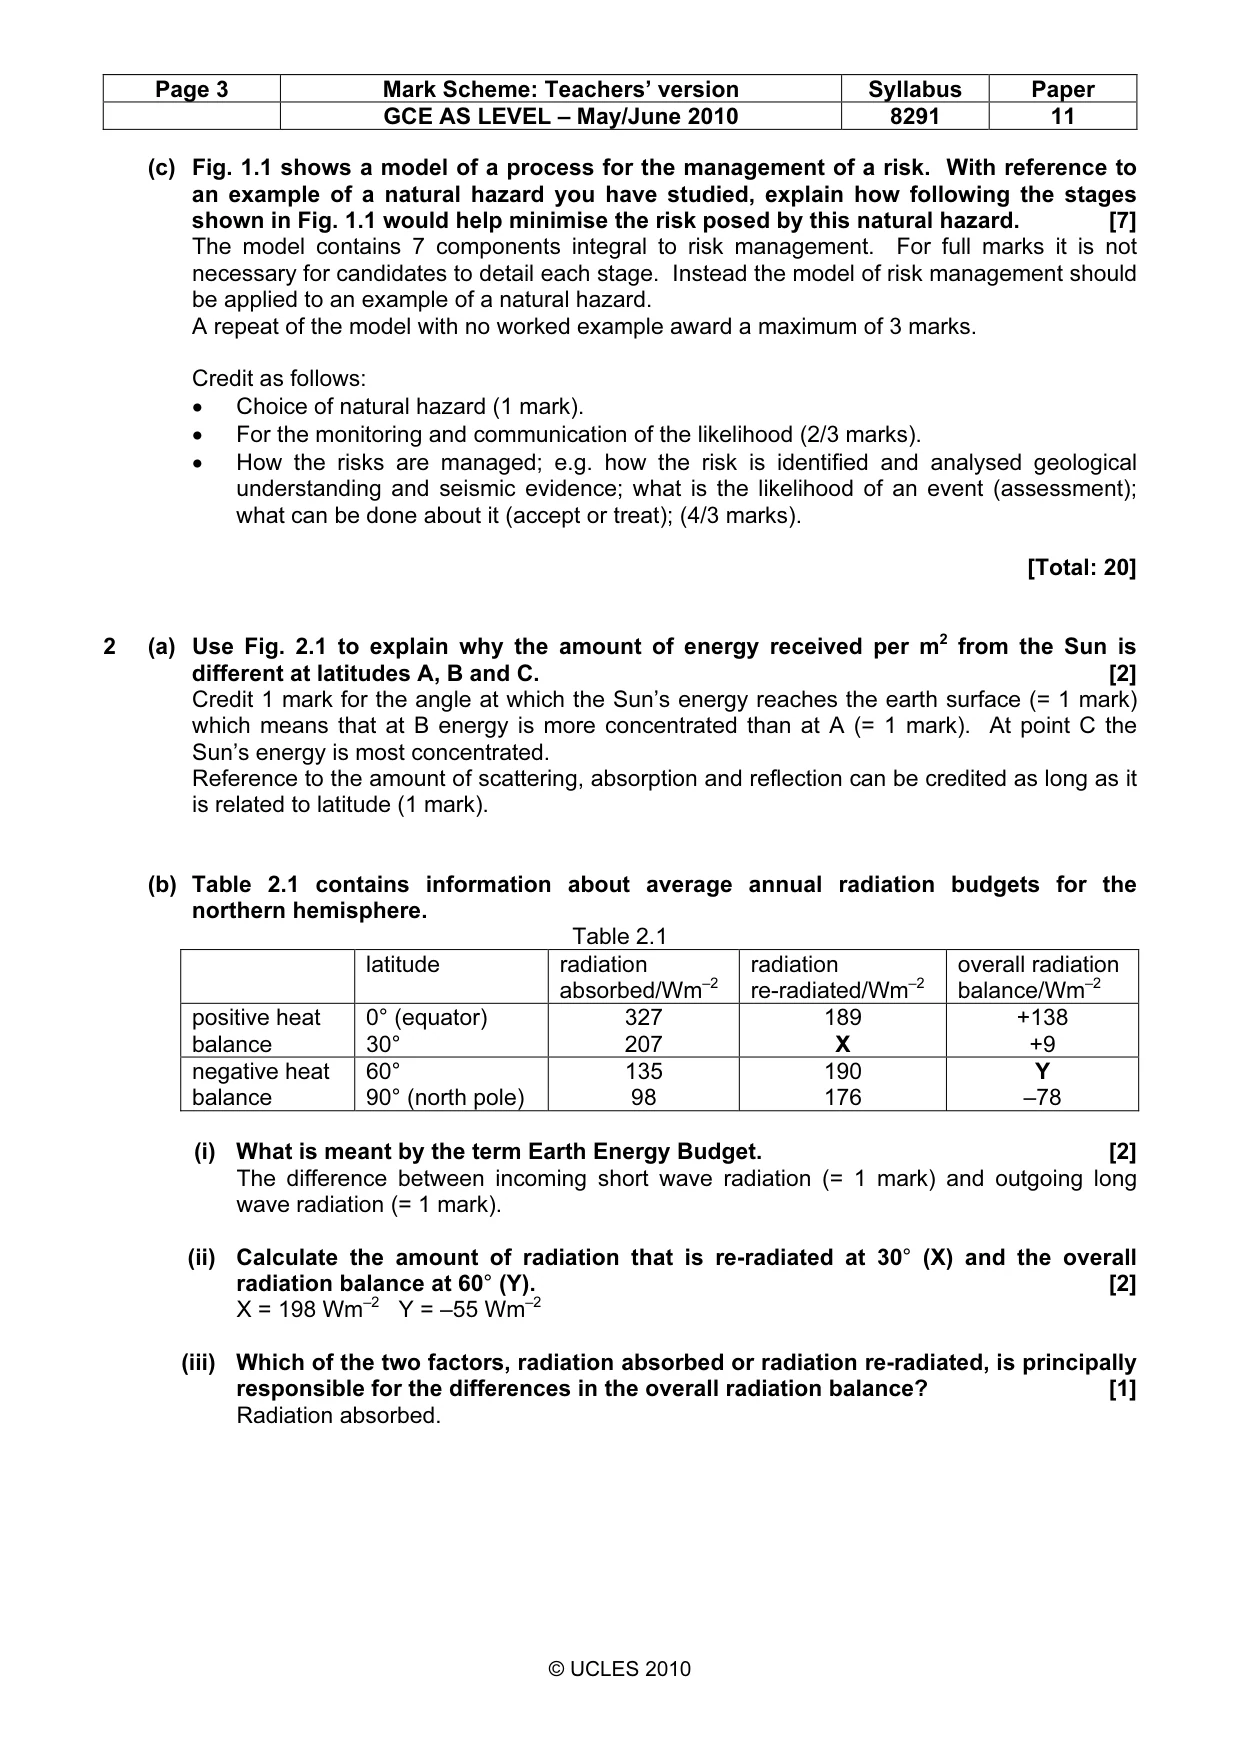
Page 3 Mark Scheme: Teachers’ version Syllabus Paper GCE AS LEVEL – May/June 2010 8291 11 © UCLES 2010 (c) Fig. 1.1 shows a model of a process for the management of a risk. With reference to an example of a natural hazard you have studied, explain how following the stages shown in Fig. 1.1 would help minimise the risk posed by this natural hazard. [7] The model contains 7 components integral to risk management. For full marks it is not necessary for candidates to detail each stage. Instead the model of risk management should be applied to an example of a natural hazard. A repeat of the model with no worked example award a maximum of 3 marks. Credit as follows: • Choice of natural hazard (1 mark). • For the monitoring and communication of the likelihood (2/3 marks). • How the risks are managed; e.g. how the risk is identified and analysed geological understanding and seismic evidence; what is the likelihood of an event (assessment); what can be done about it (accept or treat); (4/3 marks). [Total: 20] 2 (a) Use Fig. 2.1 to explain why the amount of energy received per m2 from the Sun is different at latitudes A, B and C. [2] Credit 1 mark for the angle at which the Sun’s energy reaches the earth surface (= 1 mark) which means that at B energy is more concentrated than at A (= 1 mark). At point C the Sun’s energy is most concentrated. Reference to the amount of scattering, absorption and reflection can be credited as long as it is related to latitude (1 mark). (b) Table 2.1 contains information about average annual radiation budgets for the northern hemisphere. Table 2.1 latitude radiation absorbed/Wm–2 radiation re-radiated/Wm–2 overall radiation balance/Wm–2 positive heat balance 0° (equator) 30° 327 207 189 X +138 +9 negative heat balance 60° 90° (north pole) 135 98 190 176 Y –78 (i) What is meant by the term Earth Energy Budget. [2] The difference between incoming short wave radiation (= 1 mark) and outgoing long wave radiation (= 1 mark). (ii) Calculate the amount of radiation that is re-radiated at 30° (X) and the overall radiation balance at 60° (Y). [2] X = 198 Wm–2 Y = –55 Wm–2 (iii) Which of the two factors, radiation absorbed or radiation re-radiated, is principally responsible for the differences in the overall radiation balance? [1] Radiation absorbed.
Mark scheme, page 4
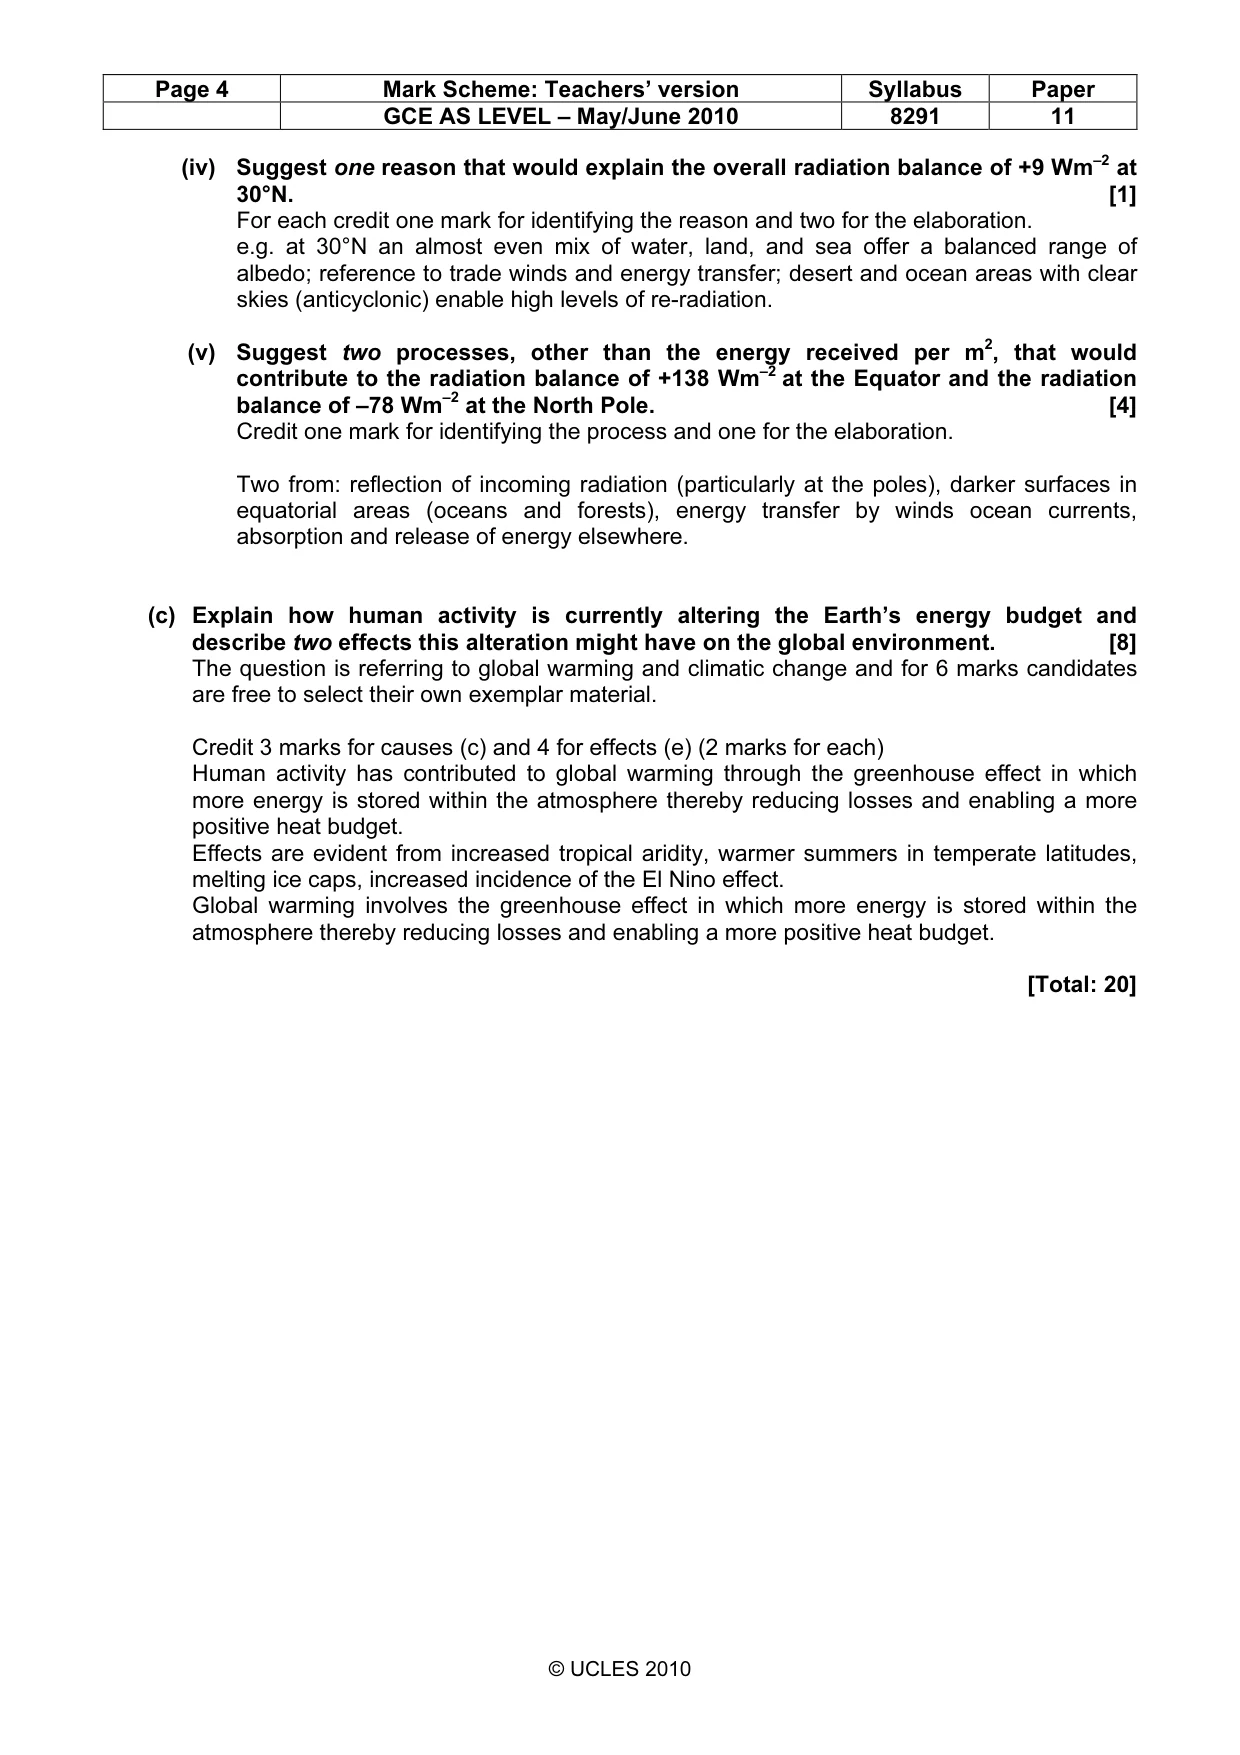
Page 4 Mark Scheme: Teachers’ version Syllabus Paper GCE AS LEVEL – May/June 2010 8291 11 © UCLES 2010 (iv) Suggest one reason that would explain the overall radiation balance of +9 Wm–2 at 30°N. [1] For each credit one mark for identifying the reason and two for the elaboration. e.g. at 30°N an almost even mix of water, land, and sea offer a balanced range of albedo; reference to trade winds and energy transfer; desert and ocean areas with clear skies (anticyclonic) enable high levels of re-radiation. (v) Suggest two processes, other than the energy received per m2, that would contribute to the radiation balance of +138 Wm–2 at the Equator and the radiation balance of –78 Wm–2 at the North Pole. [4] Credit one mark for identifying the process and one for the elaboration. Two from: reflection of incoming radiation (particularly at the poles), darker surfaces in equatorial areas (oceans and forests), energy transfer by winds ocean currents, absorption and release of energy elsewhere. (c) Explain how human activity is currently altering the Earth’s energy budget and describe two effects this alteration might have on the global environment. [8] The question is referring to global warming and climatic change and for 6 marks candidates are free to select their own exemplar material. Credit 3 marks for causes (c) and 4 for effects (e) (2 marks for each) Human activity has contributed to global warming through the greenhouse effect in which more energy is stored within the atmosphere thereby reducing losses and enabling a more positive heat budget. Effects are evident from increased tropical aridity, warmer summers in temperate latitudes, melting ice caps, increased incidence of the El Nino effect. Global warming involves the greenhouse effect in which more energy is stored within the atmosphere thereby reducing losses and enabling a more positive heat budget. [Total: 20]
Mark scheme, page 5
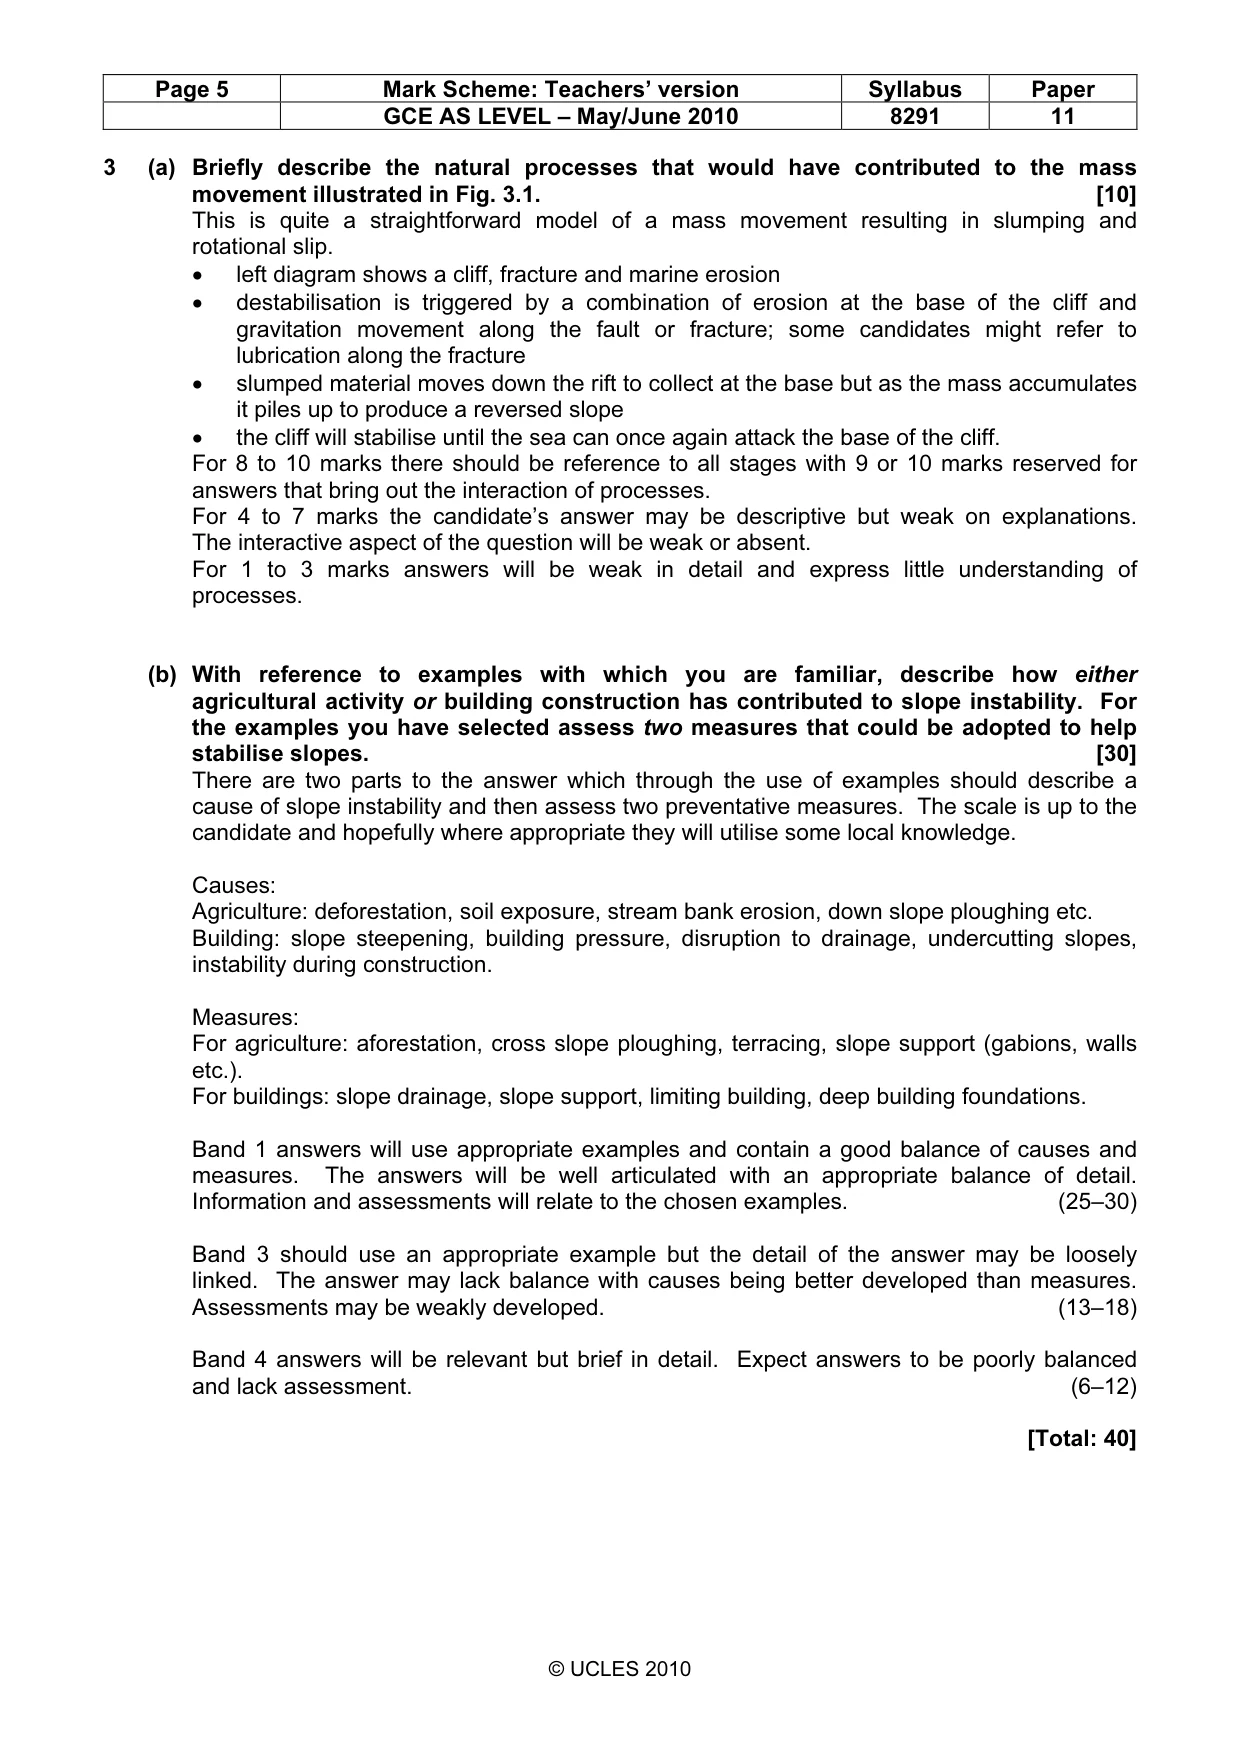
Page 5 Mark Scheme: Teachers’ version Syllabus Paper GCE AS LEVEL – May/June 2010 8291 11 © UCLES 2010 3 (a) Briefly describe the natural processes that would have contributed to the mass movement illustrated in Fig. 3.1. [10] This is quite a straightforward model of a mass movement resulting in slumping and rotational slip. • left diagram shows a cliff, fracture and marine erosion • destabilisation is triggered by a combination of erosion at the base of the cliff and gravitation movement along the fault or fracture; some candidates might refer to lubrication along the fracture • slumped material moves down the rift to collect at the base but as the mass accumulates it piles up to produce a reversed slope • the cliff will stabilise until the sea can once again attack the base of the cliff. For 8 to 10 marks there should be reference to all stages with 9 or 10 marks reserved for answers that bring out the interaction of processes. For 4 to 7 marks the candidate’s answer may be descriptive but weak on explanations. The interactive aspect of the question will be weak or absent. For 1 to 3 marks answers will be weak in detail and express little understanding of processes. (b) With reference to examples with which you are familiar, describe how either agricultural activity or building construction has contributed to slope instability. For the examples you have selected assess two measures that could be adopted to help stabilise slopes. [30] There are two parts to the answer which through the use of examples should describe a cause of slope instability and then assess two preventative measures. The scale is up to the candidate and hopefully where appropriate they will utilise some local knowledge. Causes: Agriculture: deforestation, soil exposure, stream bank erosion, down slope ploughing etc. Building: slope steepening, building pressure, disruption to drainage, undercutting slopes, instability during construction. Measures: For agriculture: aforestation, cross slope ploughing, terracing, slope support (gabions, walls etc.). For buildings: slope drainage, slope support, limiting building, deep building foundations. Band 1 answers will use appropriate examples and contain a good balance of causes and measures. The answers will be well articulated with an appropriate balance of detail. Information and assessments will relate to the chosen examples. (25–30) Band 3 should use an appropriate example but the detail of the answer may be loosely linked. The answer may lack balance with causes being better developed than measures. Assessments may be weakly developed. (13–18) Band 4 answers will be relevant but brief in detail. Expect answers to be poorly balanced and lack assessment. (6–12) [Total: 40]
Mark scheme, page 6
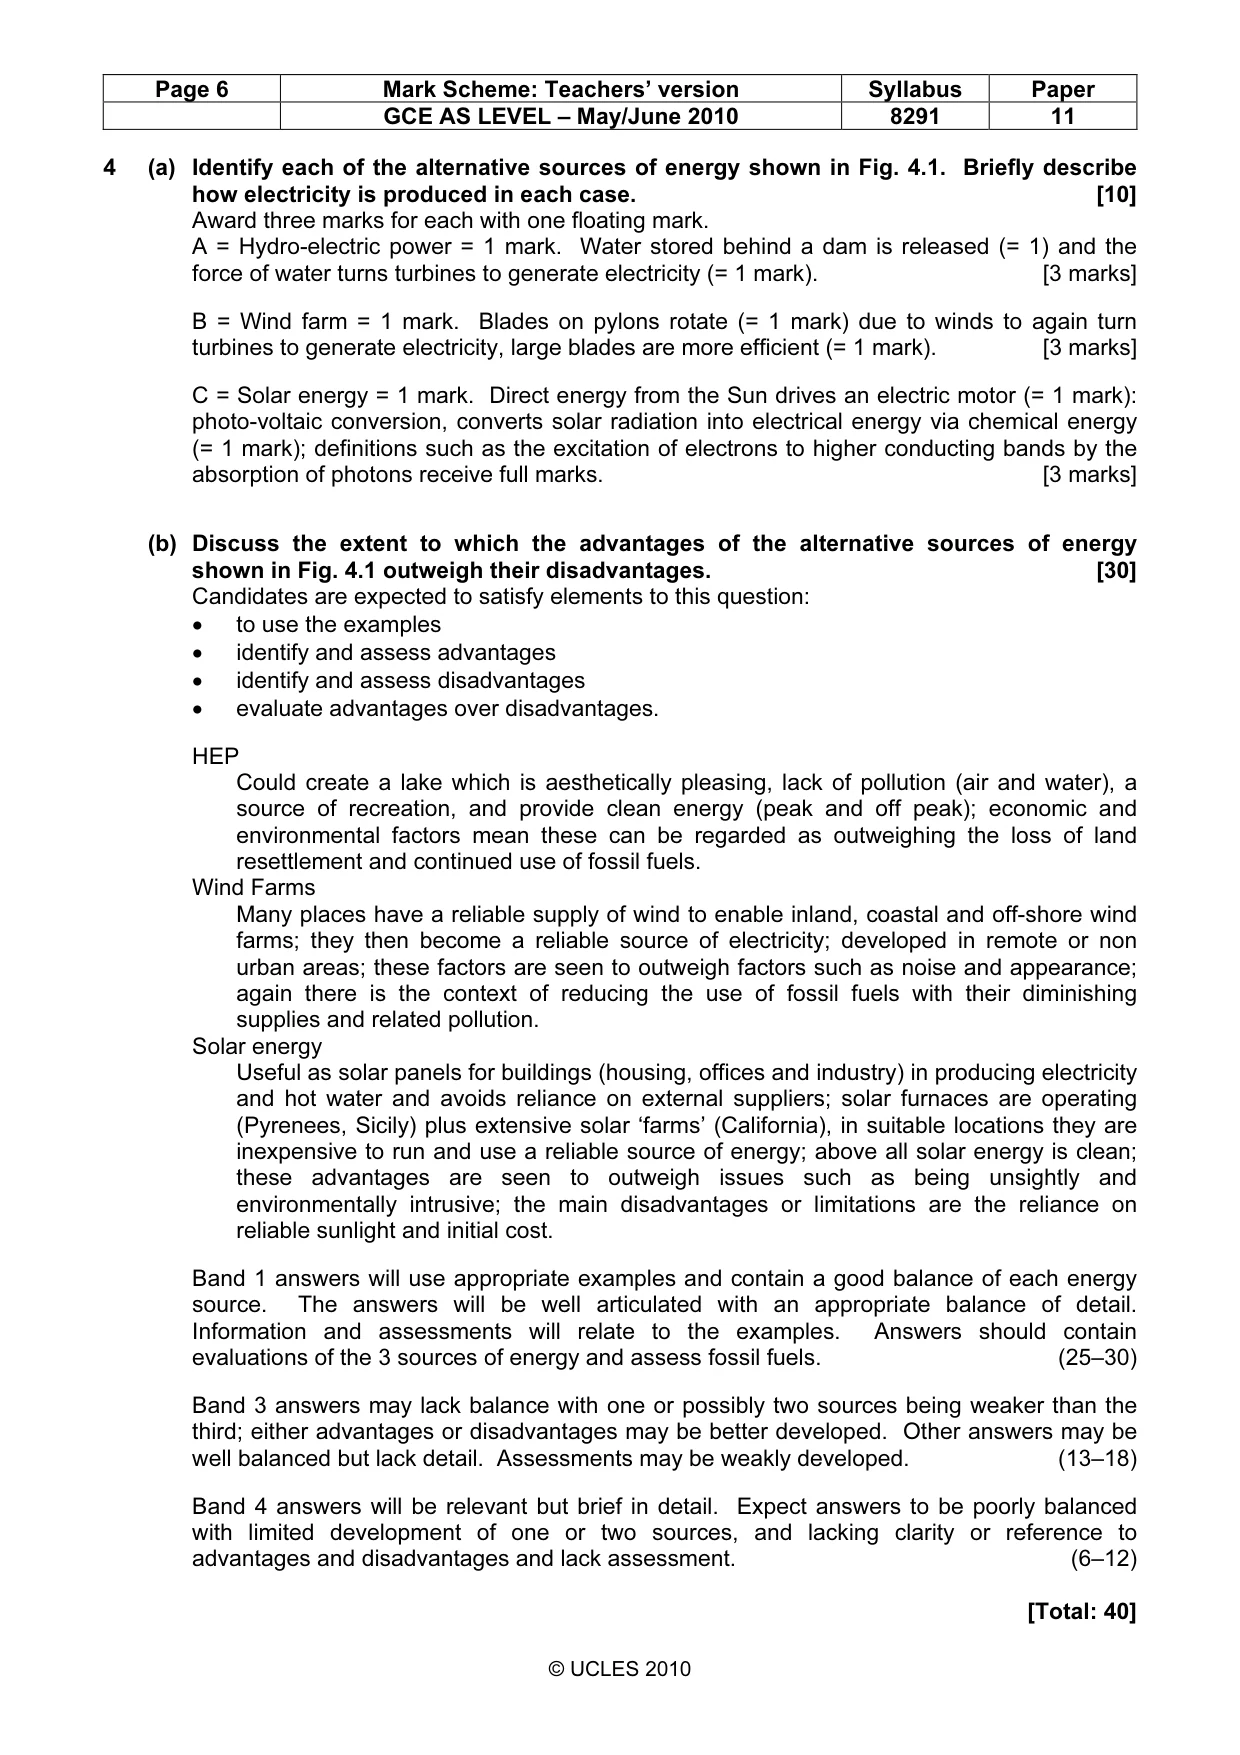
Page 6 Mark Scheme: Teachers’ version Syllabus Paper GCE AS LEVEL – May/June 2010 8291 11 © UCLES 2010 4 (a) Identify each of the alternative sources of energy shown in Fig. 4.1. Briefly describe how electricity is produced in each case. [10] Award three marks for each with one floating mark. A = Hydro-electric power = 1 mark. Water stored behind a dam is released (= 1) and the force of water turns turbines to generate electricity (= 1 mark). [3 marks] B = Wind farm = 1 mark. Blades on pylons rotate (= 1 mark) due to winds to again turn turbines to generate electricity, large blades are more efficient (= 1 mark). [3 marks] C = Solar energy = 1 mark. Direct energy from the Sun drives an electric motor (= 1 mark): photo-voltaic conversion, converts solar radiation into electrical energy via chemical energy (= 1 mark); definitions such as the excitation of electrons to higher conducting bands by the absorption of photons receive full marks. [3 marks] (b) Discuss the extent to which the advantages of the alternative sources of energy shown in Fig. 4.1 outweigh their disadvantages. [30] Candidates are expected to satisfy elements to this question: • to use the examples • identify and assess advantages • identify and assess disadvantages • evaluate advantages over disadvantages. HEP Could create a lake which is aesthetically pleasing, lack of pollution (air and water), a source of recreation, and provide clean energy (peak and off peak); economic and environmental factors mean these can be regarded as outweighing the loss of land resettlement and continued use of fossil fuels. Wind Farms Many places have a reliable supply of wind to enable inland, coastal and off-shore wind farms; they then become a reliable source of electricity; developed in remote or non urban areas; these factors are seen to outweigh factors such as noise and appearance; again there is the context of reducing the use of fossil fuels with their diminishing supplies and related pollution. Solar energy Useful as solar panels for buildings (housing, offices and industry) in producing electricity and hot water and avoids reliance on external suppliers; solar furnaces are operating (Pyrenees, Sicily) plus extensive solar ‘farms’ (California), in suitable locations they are inexpensive to run and use a reliable source of energy; above all solar energy is clean; these advantages are seen to outweigh issues such as being unsightly and environmentally intrusive; the main disadvantages or limitations are the reliance on reliable sunlight and initial cost. Band 1 answers will use appropriate examples and contain a good balance of each energy source. The answers will be well articulated with an appropriate balance of detail. Information and assessments will relate to the examples. Answers should contain evaluations of the 3 sources of energy and assess fossil fuels. (25–30) Band 3 answers may lack balance with one or possibly two sources being weaker than the third; either advantages or disadvantages may be better developed. Other answers may be well balanced but lack detail. Assessments may be weakly developed. (13–18) Band 4 answers will be relevant but brief in detail. Expect answers to be poorly balanced with limited development of one or two sources, and lacking clarity or reference to advantages and disadvantages and lack assessment. (6–12) [Total: 40]
Mark scheme, page 7
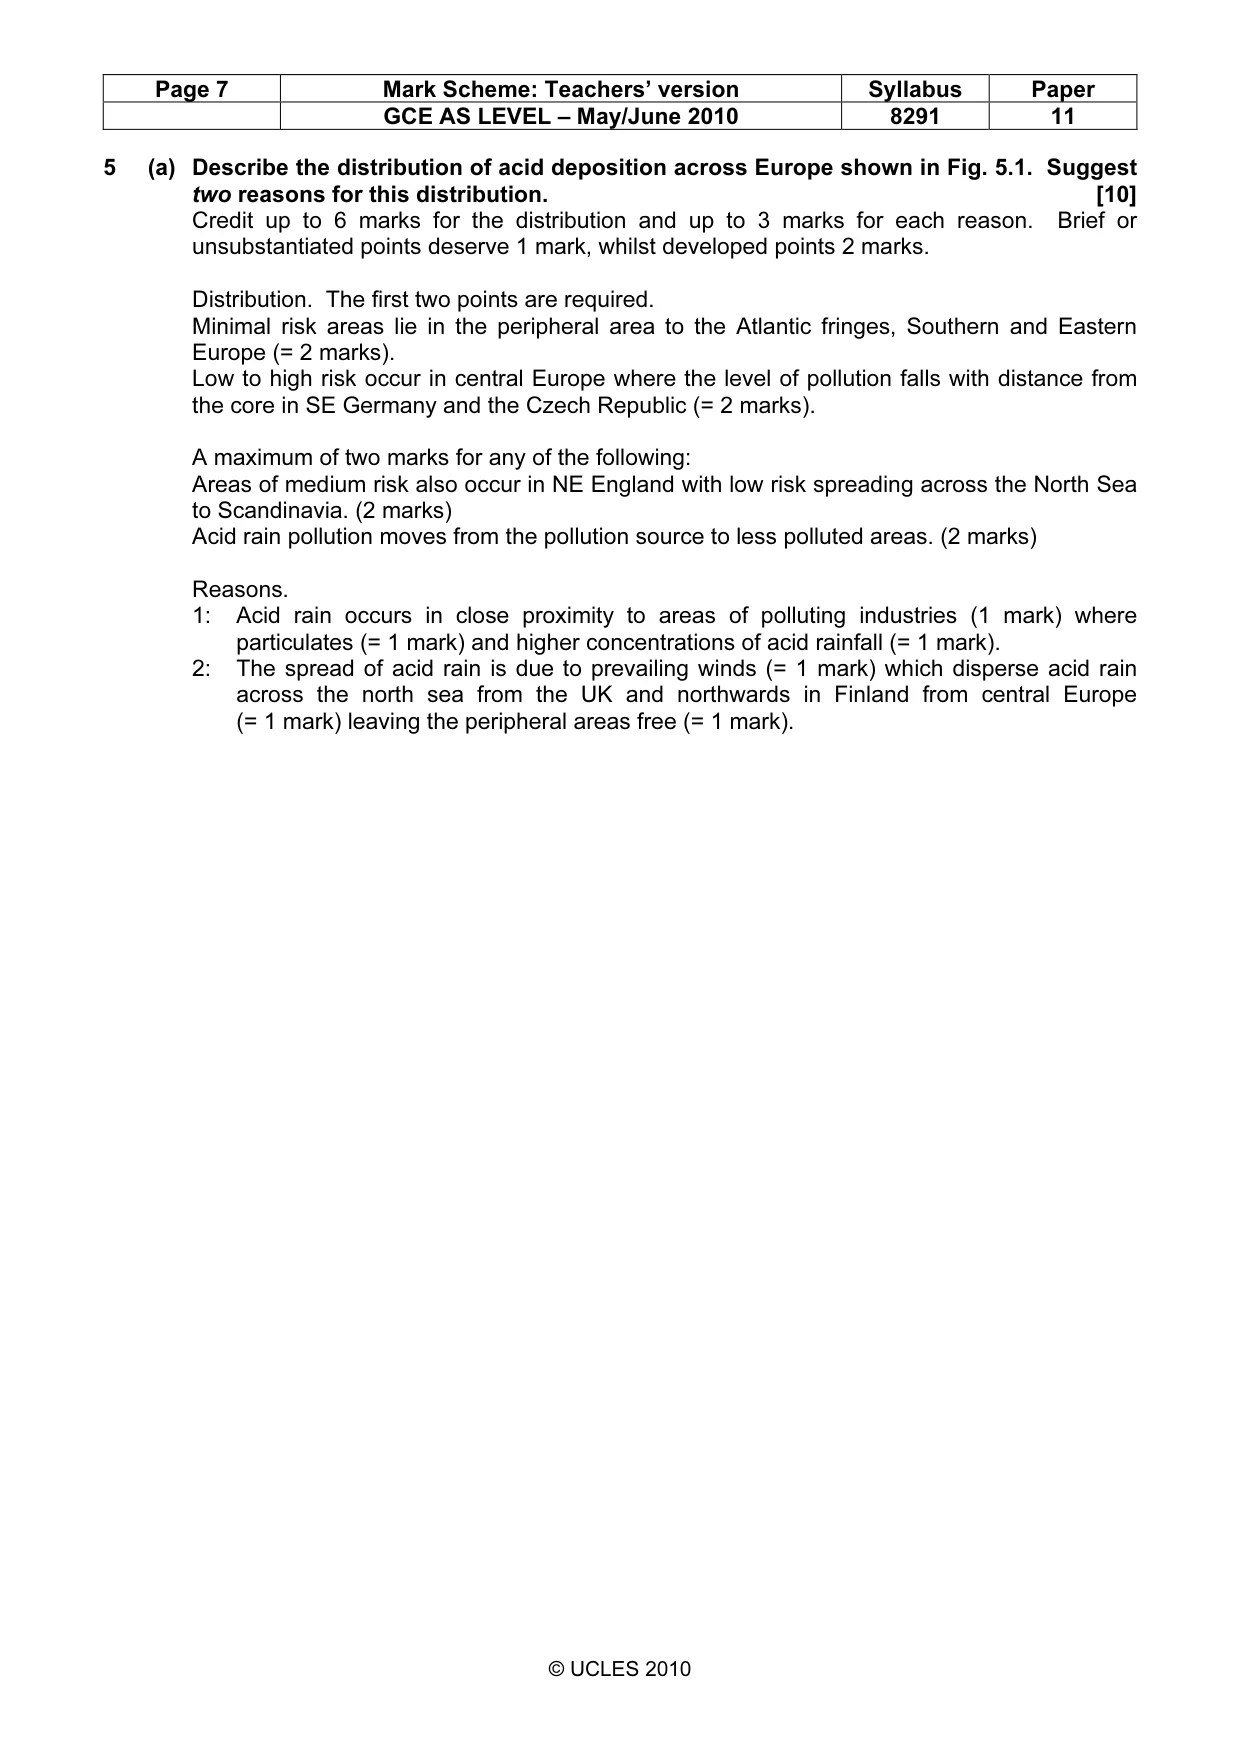
Page 7 Mark Scheme: Teachers’ version Syllabus Paper GCE AS LEVEL – May/June 2010 8291 11 © UCLES 2010 5 (a) Describe the distribution of acid deposition across Europe shown in Fig. 5.1. Suggest two reasons for this distribution. [10] Credit up to 6 marks for the distribution and up to 3 marks for each reason. Brief or unsubstantiated points deserve 1 mark, whilst developed points 2 marks. Distribution. The first two points are required. Minimal risk areas lie in the peripheral area to the Atlantic fringes, Southern and Eastern Europe (= 2 marks). Low to high risk occur in central Europe where the level of pollution falls with distance from the core in SE Germany and the Czech Republic (= 2 marks). A maximum of two marks for any of the following: Areas of medium risk also occur in NE England with low risk spreading across the North Sea to Scandinavia. (2 marks) Acid rain pollution moves from the pollution source to less polluted areas. (2 marks) Reasons. 1: Acid rain occurs in close proximity to areas of polluting industries (1 mark) where particulates (= 1 mark) and higher concentrations of acid rainfall (= 1 mark). 2: The spread of acid rain is due to prevailing winds (= 1 mark) which disperse acid rain across the north sea from the UK and northwards in Finland from central Europe (= 1 mark) leaving the peripheral areas free (= 1 mark).
Mark scheme, page 8
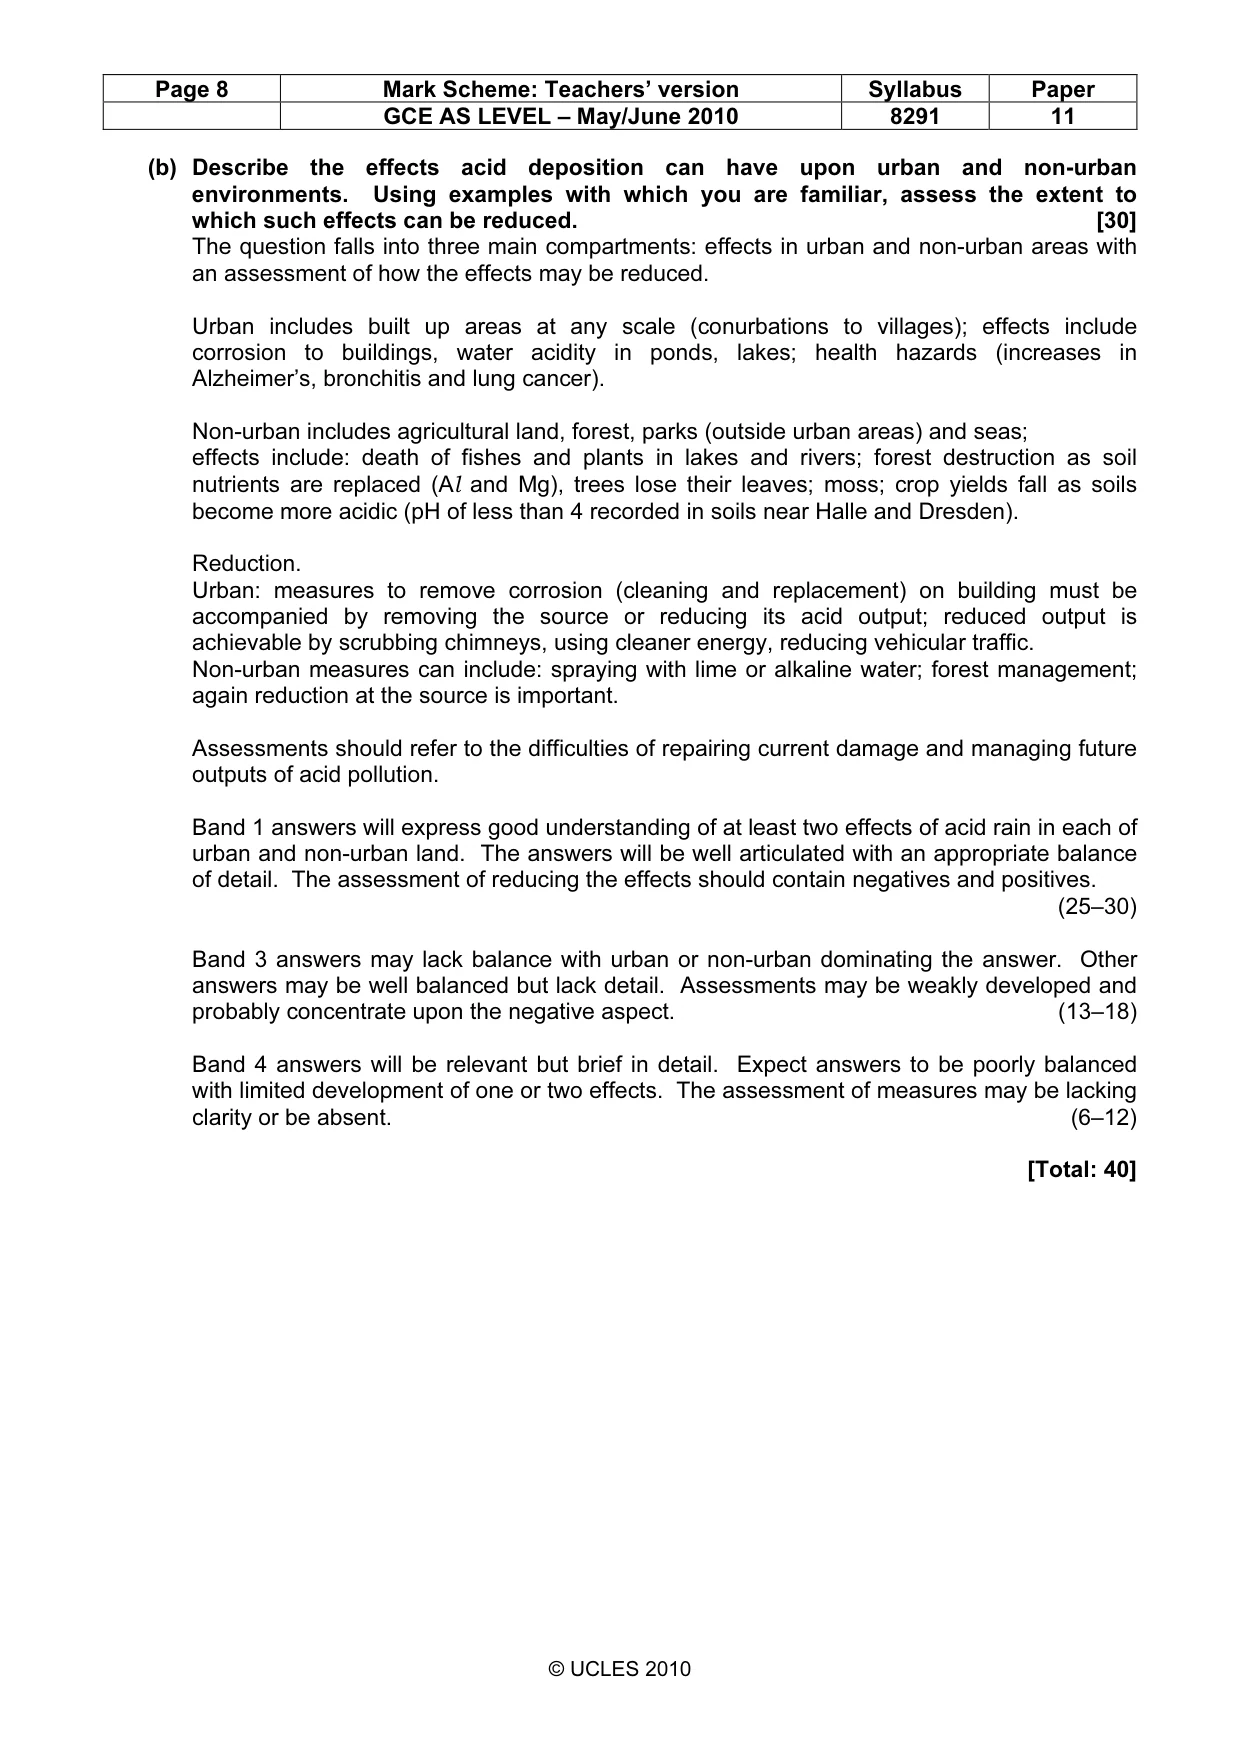
Page 8 Mark Scheme: Teachers’ version Syllabus Paper GCE AS LEVEL – May/June 2010 8291 11 © UCLES 2010 (b) Describe the effects acid deposition can have upon urban and non-urban environments. Using examples with which you are familiar, assess the extent to which such effects can be reduced. [30] The question falls into three main compartments: effects in urban and non-urban areas with an assessment of how the effects may be reduced. Urban includes built up areas at any scale (conurbations to villages); effects include corrosion to buildings, water acidity in ponds, lakes; health hazards (increases in Alzheimer’s, bronchitis and lung cancer). Non-urban includes agricultural land, forest, parks (outside urban areas) and seas; effects include: death of fishes and plants in lakes and rivers; forest destruction as soil nutrients are replaced (Al and Mg), trees lose their leaves; moss; crop yields fall as soils become more acidic (pH of less than 4 recorded in soils near Halle and Dresden). Reduction. Urban: measures to remove corrosion (cleaning and replacement) on building must be accompanied by removing the source or reducing its acid output; reduced output is achievable by scrubbing chimneys, using cleaner energy, reducing vehicular traffic. Non-urban measures can include: spraying with lime or alkaline water; forest management; again reduction at the source is important. Assessments should refer to the difficulties of repairing current damage and managing future outputs of acid pollution. Band 1 answers will express good understanding of at least two effects of acid rain in each of urban and non-urban land. The answers will be well articulated with an appropriate balance of detail. The assessment of reducing the effects should contain negatives and positives. (25–30) Band 3 answers may lack balance with urban or non-urban dominating the answer. Other answers may be well balanced but lack detail. Assessments may be weakly developed and probably concentrate upon the negative aspect. (13–18) Band 4 answers will be relevant but brief in detail. Expect answers to be poorly balanced with limited development of one or two effects. The assessment of measures may be lacking clarity or be absent. (6–12) [Total: 40]
Mark scheme, page 9
Page 9 Mark Scheme: Teachers’ version Syllabus Paper GCE AS LEVEL – May/June 2010 8291 11 © UCLES 2010 Generic Mark Scheme This aims to provide a scheme for marking 30 mark answers in Section B. The marks are grouped into bands from which it should be possible to locate a mark. The assessment objectives outlined are developed out of the broad objectives for the examination and guideline for locating marks for essays. Criterion A. Demonstrates relevant knowledge and understanding applied to a range of issues and problems. Criterion B. Communicates clearly in a concise, logical and relevant way. Criterion C. Marshal evidence, draw conclusions and make evaluations. Balance of marks for 30 mark questions; Criterion A = maximum of 15 Criterion B = maximum of 5 Criterion C = maximum of 10 Band Level Descriptors Marks Band 1 The candidate demonstrates the following abilities where appropriate to: 25–30 A • select and use a very good range of accurate and appropriate knowledge; • integrate knowledge from a wide range of areas; • show a good understanding of the concepts involved; • make good use of knowledge derived from personal experience and study; B • select and use a form and style of writing appropriate to purpose and complex subject matter with facility; • communicate complex ideas clearly and accurately, in a concise, logical and relevant way; C • analyse issues and problems well and evaluate them appropriately; • develop complex reasoned arguments and draw sound conclusions on the evidence; Band The candidate demonstrates the following abilities where appropriate to: 19–24 A • select and use a good range of accurate and appropriate knowledge; • integrate knowledge from a wide range of areas; • show an understanding of the concepts involved; • demonstrate a range of awareness of personally derived and studied knowledge; B • select and use a form and style of writing appropriate to purpose and complex subject matter; • communicate complex ideas clearly and accurately, in a concise, logical and relevant way; C • analyse issues and problems and evaluate them competently; • develop complex reasoned arguments and draw conclusions on the evidence; Band 3 The candidate demonstrates the following abilities where appropriate to: 13–18 A • Select and use some accurate and relevant knowledge. integrate knowledge from a limited range of areas; • show an adequate understanding of the concepts involved; • demonstrate a limited range of awareness of personally derived and studied knowledge; B • select and use a form and style of writing appropriate to purpose and subject matter; • communicate the ideas clearly and in a logical way C • undertake some analysis of issues and problems and make a superficial evaluation; • develop arguments and draw conclusions;
Mark scheme, page 10
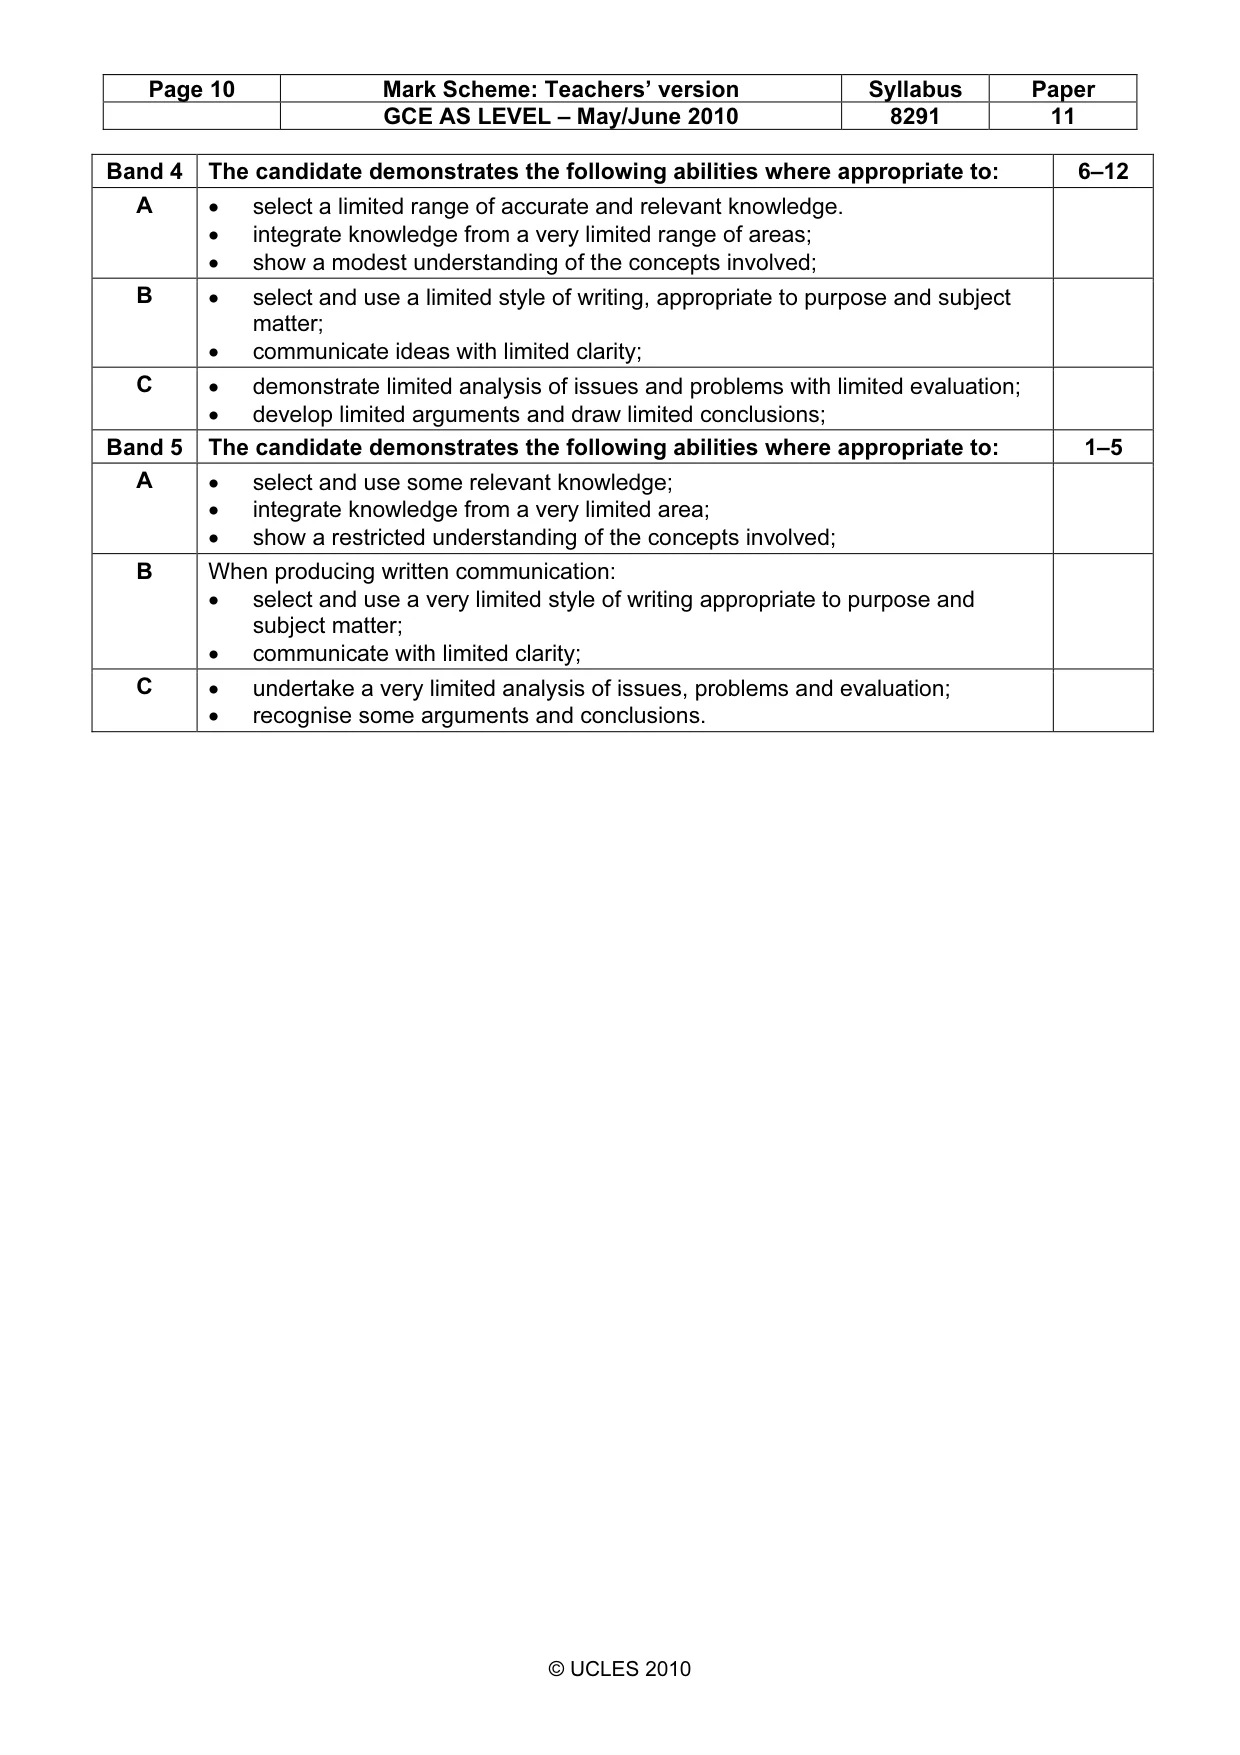
Page 10 Mark Scheme: Teachers’ version Syllabus Paper GCE AS LEVEL – May/June 2010 8291 11 © UCLES 2010 Band 4 The candidate demonstrates the following abilities where appropriate to: 6–12 A • select a limited range of accurate and relevant knowledge. • integrate knowledge from a very limited range of areas; • show a modest understanding of the concepts involved; B • select and use a limited style of writing, appropriate to purpose and subject matter; • communicate ideas with limited clarity; C • demonstrate limited analysis of issues and problems with limited evaluation; • develop limited arguments and draw limited conclusions; Band 5 The candidate demonstrates the following abilities where appropriate to: 1–5 A • select and use some relevant knowledge; • integrate knowledge from a very limited area; • show a restricted understanding of the concepts involved; B When producing written communication: • select and use a very limited style of writing appropriate to purpose and subject matter; • communicate with limited clarity; C • undertake a very limited analysis of issues, problems and evaluation; • recognise some arguments and conclusions.
What you needed in this session
Cambridge’s own grade thresholds for 2010 May/June, Paper 1 · Variant 1. A higher threshold means an easier paper — the bar moves with how the cohort did.