Cambridge A Level Environmental Management (AS only) 8291 — 2010 May/June Paper 1 · Variant 3
8291/13/M/J/10 · 80 marks · ≈90 min
The question paper and its mark scheme, free to read here and free to download. This is Cambridge’s own paper, exactly as it was sat.
Question paper12 pages




Mark scheme8 pages
Answers below. Sit the paper first if you are practising.

Paper as text
Question paper, page 1
This document consists of 11 printed pages and 1 blank page. DC (AC/SW) 27294 © UCLES 2010 [Turn over UNIVERSITY OF CAMBRIDGE INTERNATIONAL EXAMINATIONS General Certificate of Education Advanced Subsidiary Level READ THESE INSTRUCTIONS FIRST Write your Centre number, candidate number and name on all the work you hand in. Write in dark blue or black pen. You may use a soft pencil for any diagrams, graphs, tables or rough working. Do not use staples, paper clips, highlighters, glue or correction fluid. DO NOT WRITE IN ANY BARCODES. Section A Answer all questions. Write your answers in the spaces provided on the question paper. Section B Answer one question from this section. Answer the question on the separate answer paper provided. At the end of the examination, 1. fasten all separate answer paper securely to the question paper; 2. enter the question number from Section B in the grid opposite. ENVIRONMENTAL MANAGEMENT 8291/13 Paper 1 Lithosphere and Atmosphere May/June 2010 1 hour 30 minutes Additional Materials: Answer Booklet/Paper For Examiner’s Use Section A 1 2 Section B Total * 6 9 1 9 4 2 5 3 2 6 *
Question paper, page 2
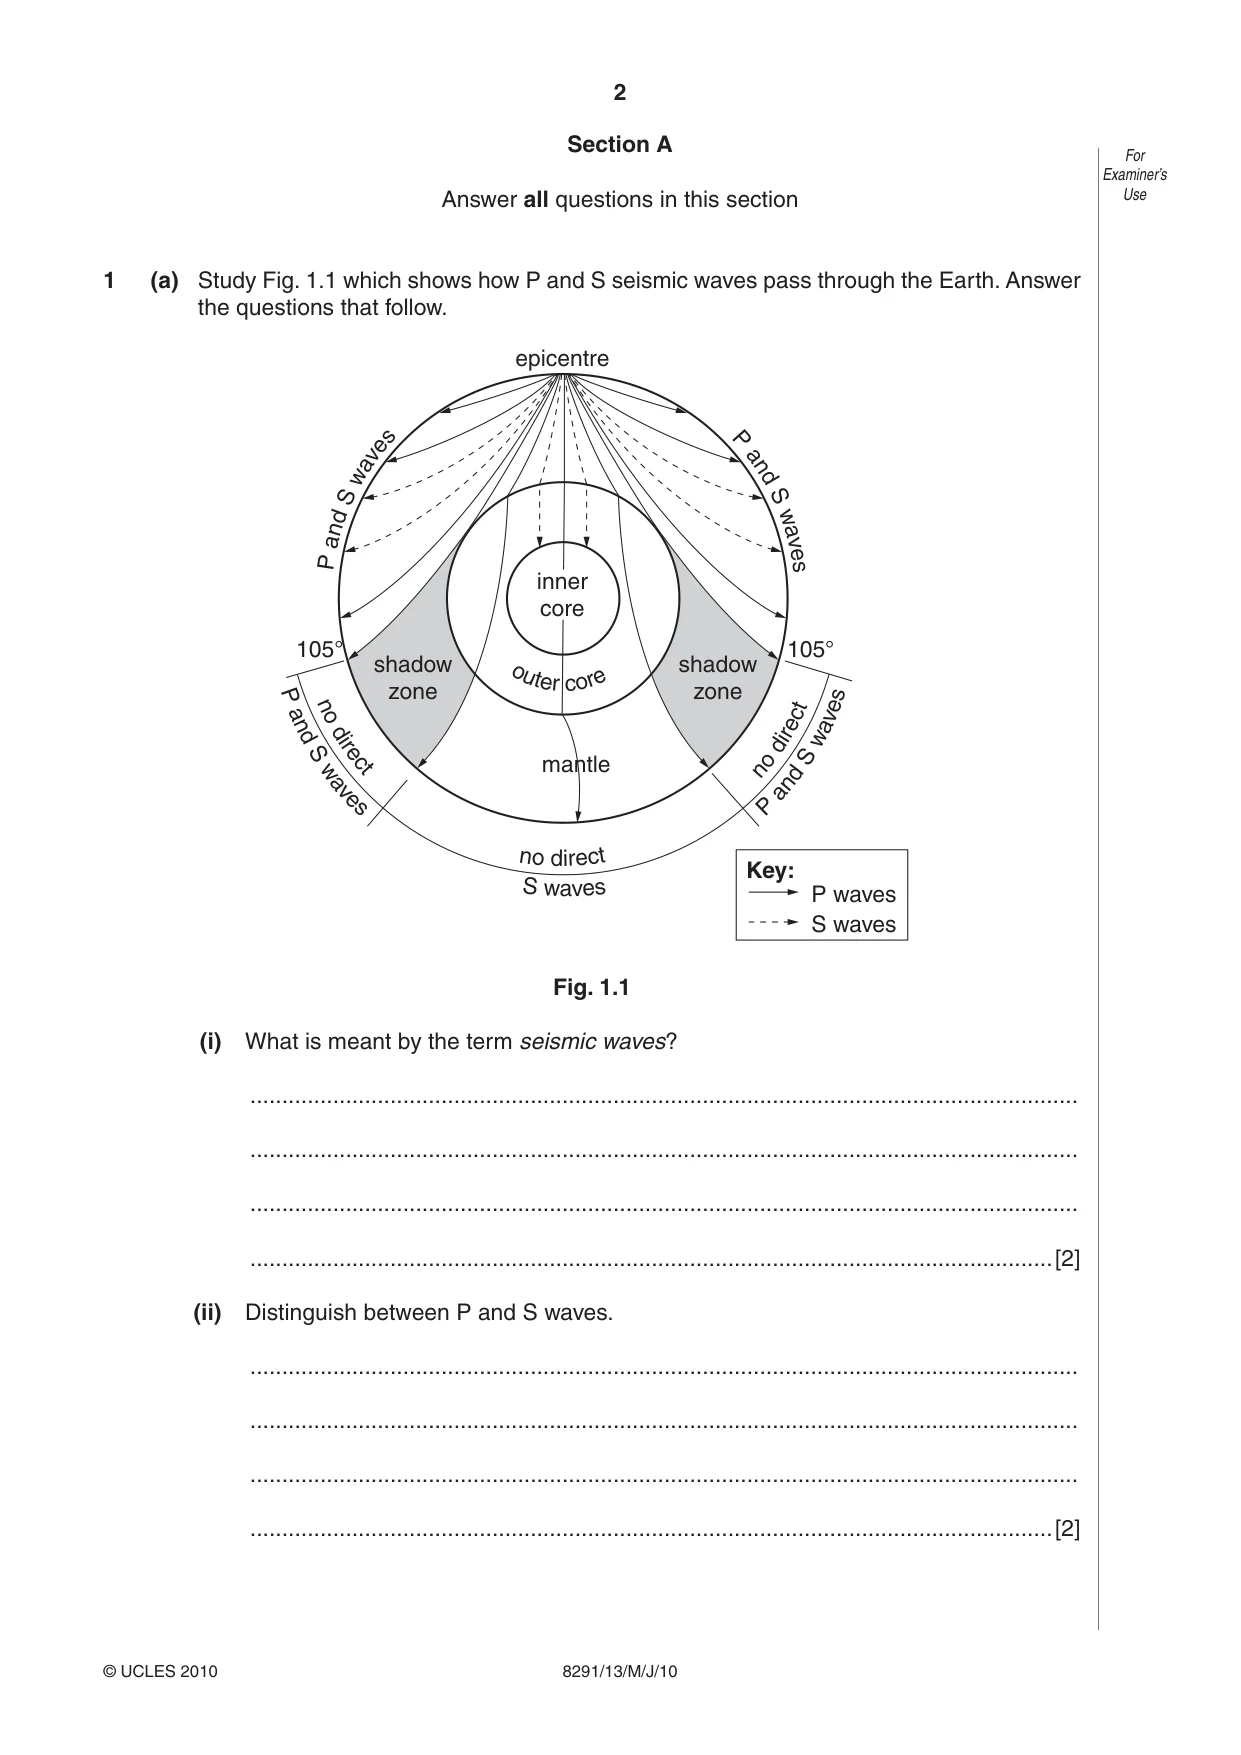
2 For Examiner’s Use © UCLES 2010 8291/13/M/J/10 Section A Answer all questions in this section 1 (a) Study Fig. 1.1 which shows how P and S seismic waves pass through the Earth. Answer the questions that follow. o u t e r c o r e epicentre shadow zone shadow zone mantle P a n d S w a v e s P a n d S w a v e s n o di re ct P an d S w a v e s n o di re ct S wa ve s n o di re ct P an d S w a v e s 105° 105° P waves Key: S waves inner core Fig. 1.1 (i) What is meant by the term seismic waves? … … … …[2] (ii) Distinguish between P and S waves. … … … …[2]
Question paper, page 3
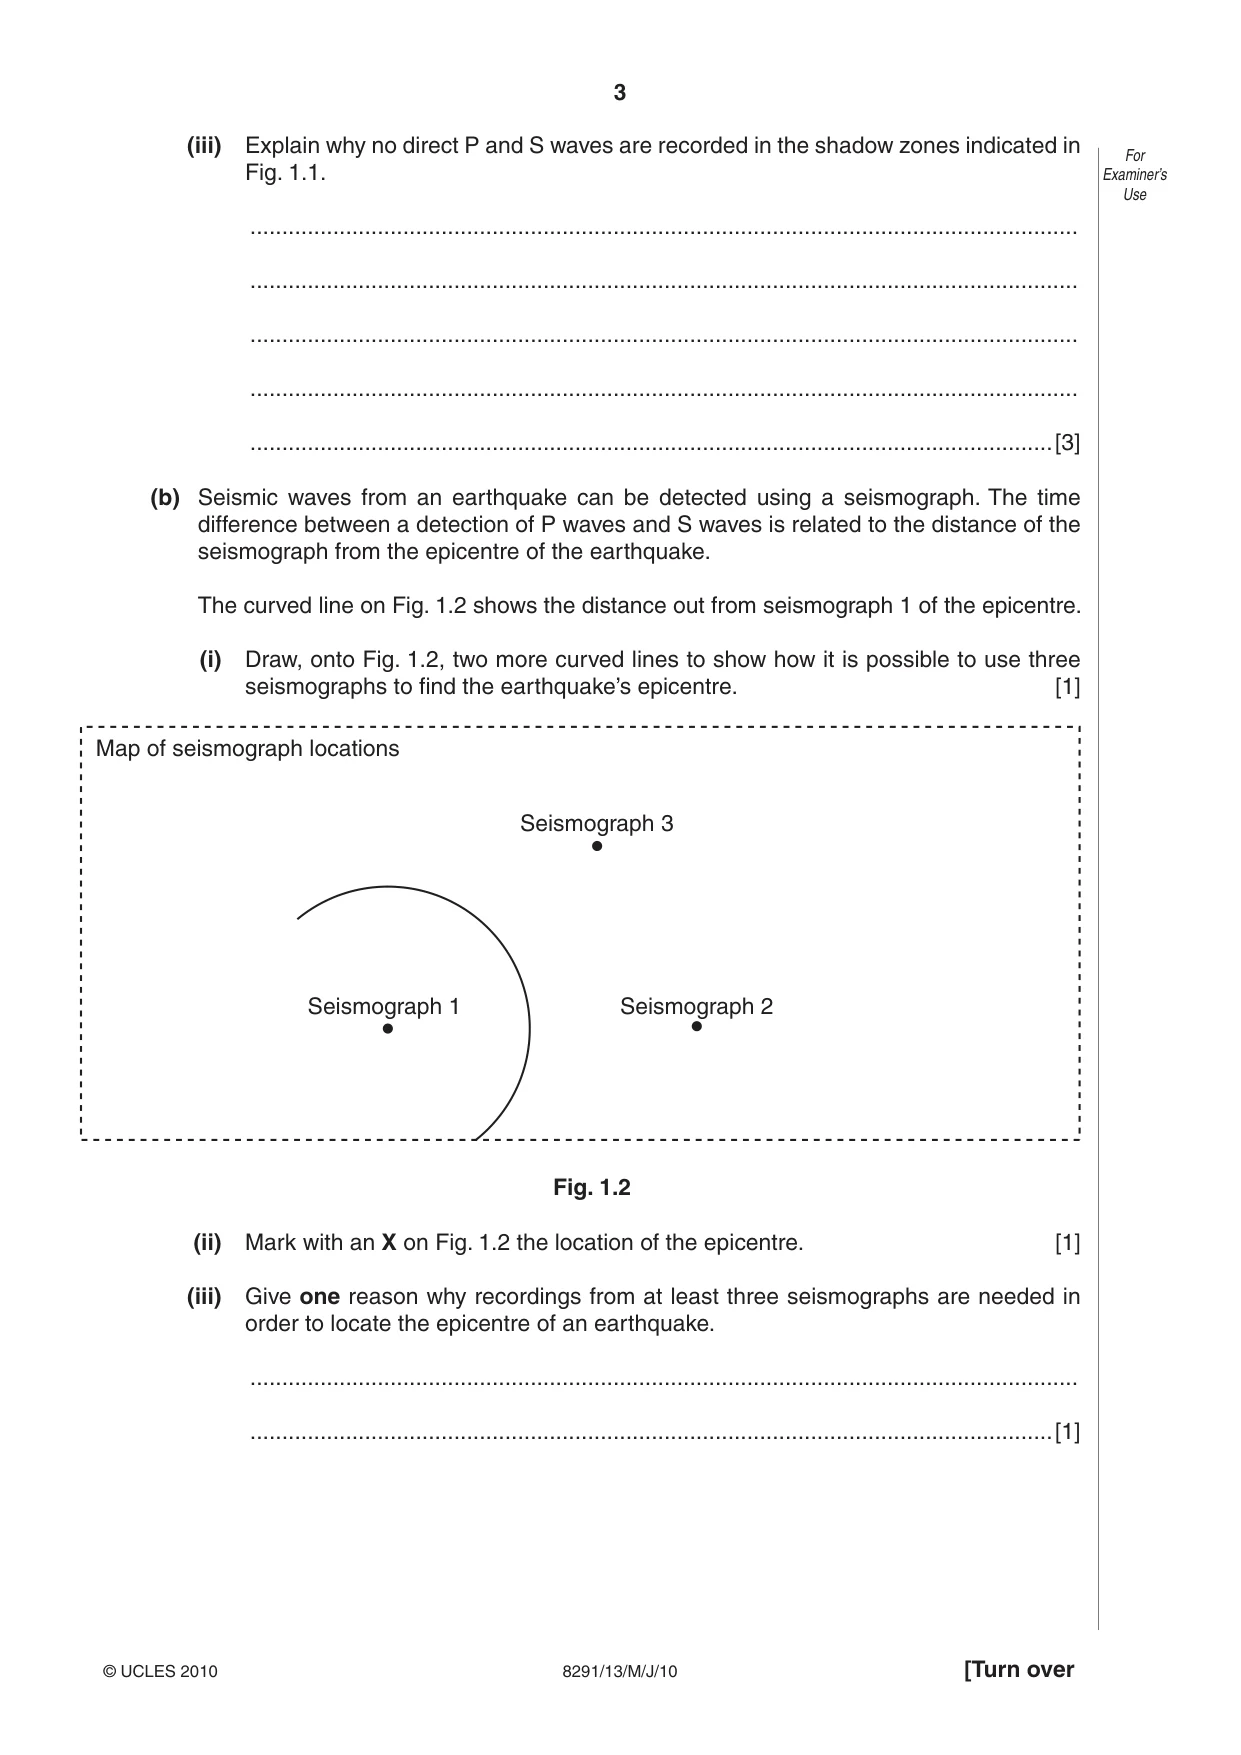
3 [Turn over For Examiner’s Use © UCLES 2010 8291/13/M/J/10 (iii) Explain why no direct P and S waves are recorded in the shadow zones indicated in Fig. 1.1. … … … … …[3] (b) Seismic waves from an earthquake can be detected using a seismograph. The time difference between a detection of P waves and S waves is related to the distance of the seismograph from the epicentre of the earthquake. The curved line on Fig. 1.2 shows the distance out from seismograph 1 of the epicentre. (i) Draw, onto Fig. 1.2, two more curved lines to show how it is possible to use three seismographs to find the earthquake’s epicentre. [1] Seismograph 3 Map of seismograph locations Seismograph 1 Seismograph 2 Fig. 1.2 (ii) Mark with an X on Fig. 1.2 the location of the epicentre. [1] (iii) Give one reason why recordings from at least three seismographs are needed in order to locate the epicentre of an earthquake. … …[1]
Question paper, page 4
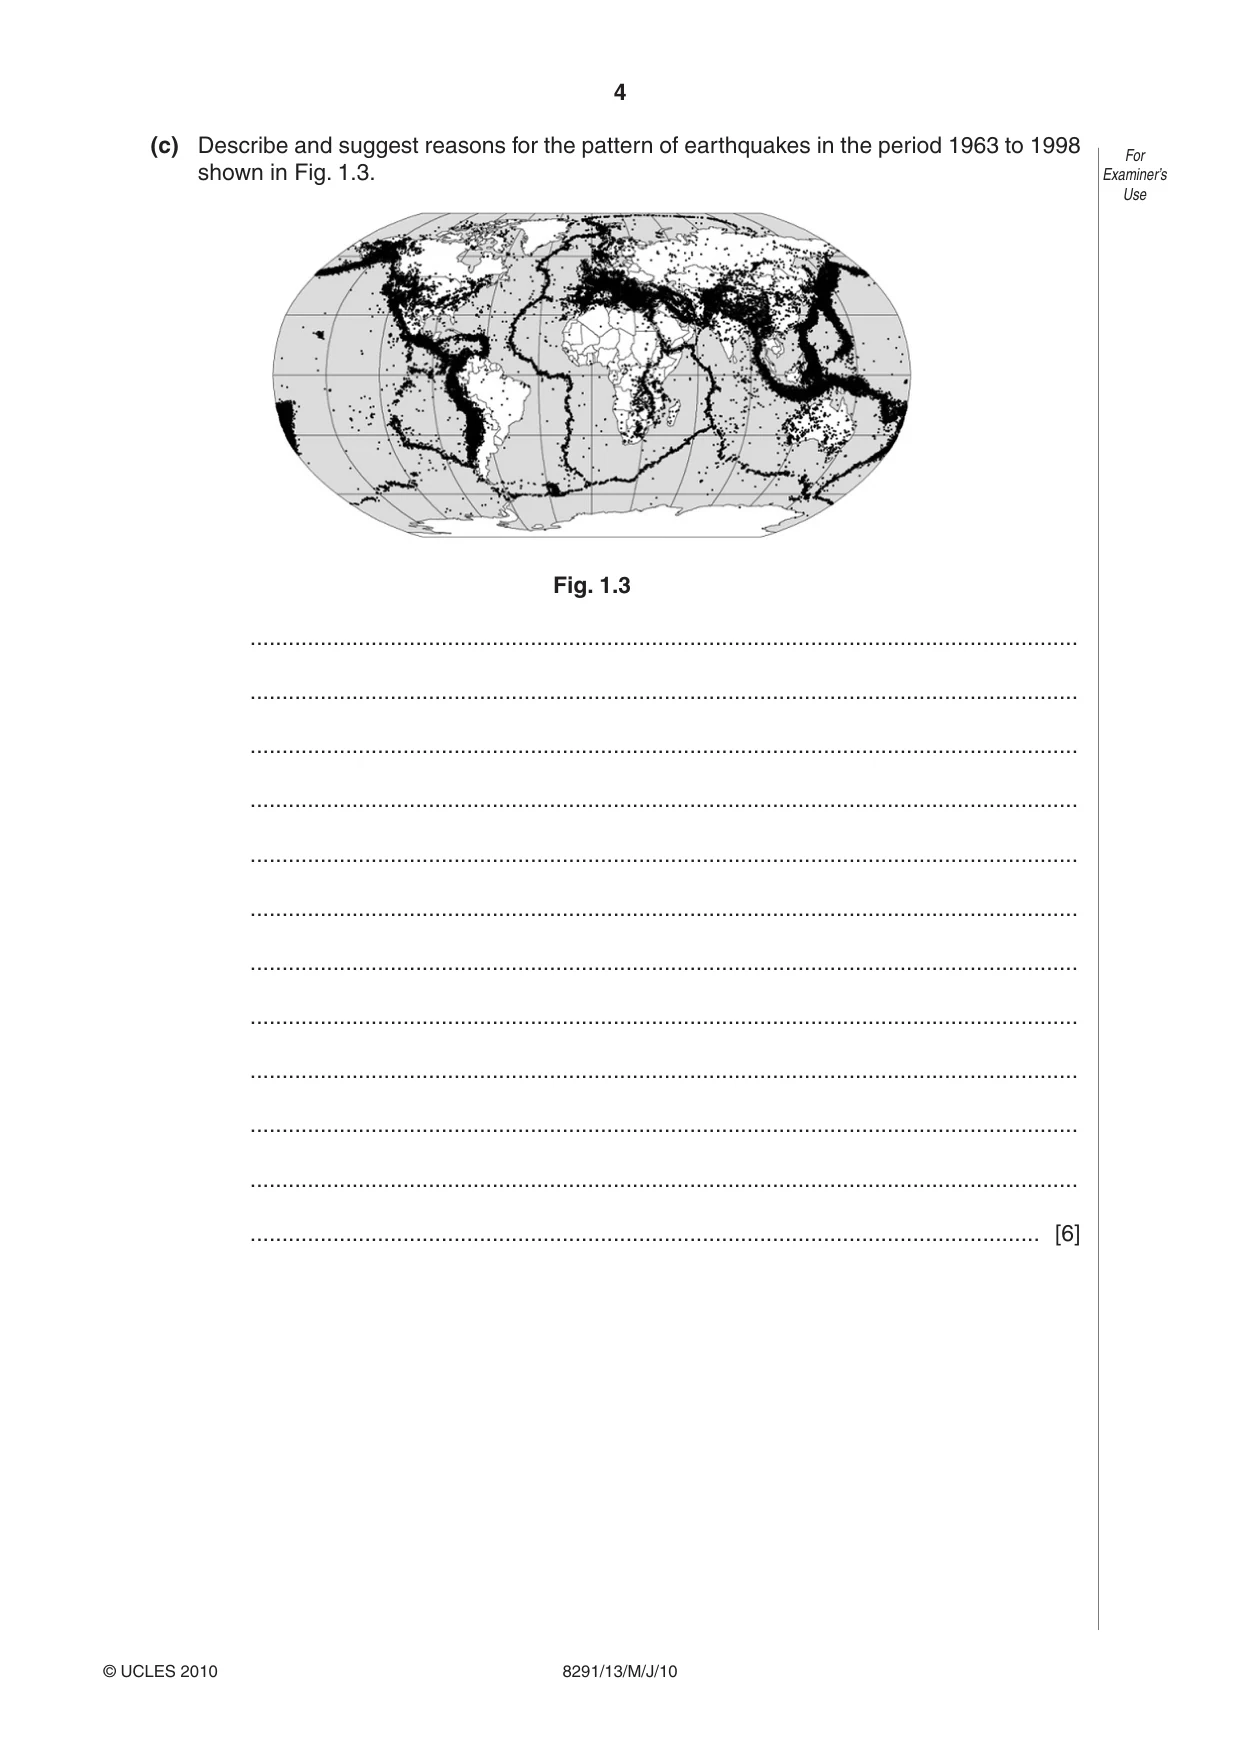
4 For Examiner’s Use © UCLES 2010 8291/13/M/J/10 (c) Describe and suggest reasons for the pattern of earthquakes in the period 1963 to 1998 shown in Fig. 1.3. Fig. 1.3 … … … … … … … … … … … … [6]
Question paper, page 5
5 [Turn over For Examiner’s Use © UCLES 2010 8291/13/M/J/10 (d) Describe and justify two methods that can be used to predict the likelihood of a future earthquake in a given locality. … … … … … … … … …[4] [Total: 20]
Question paper, page 6
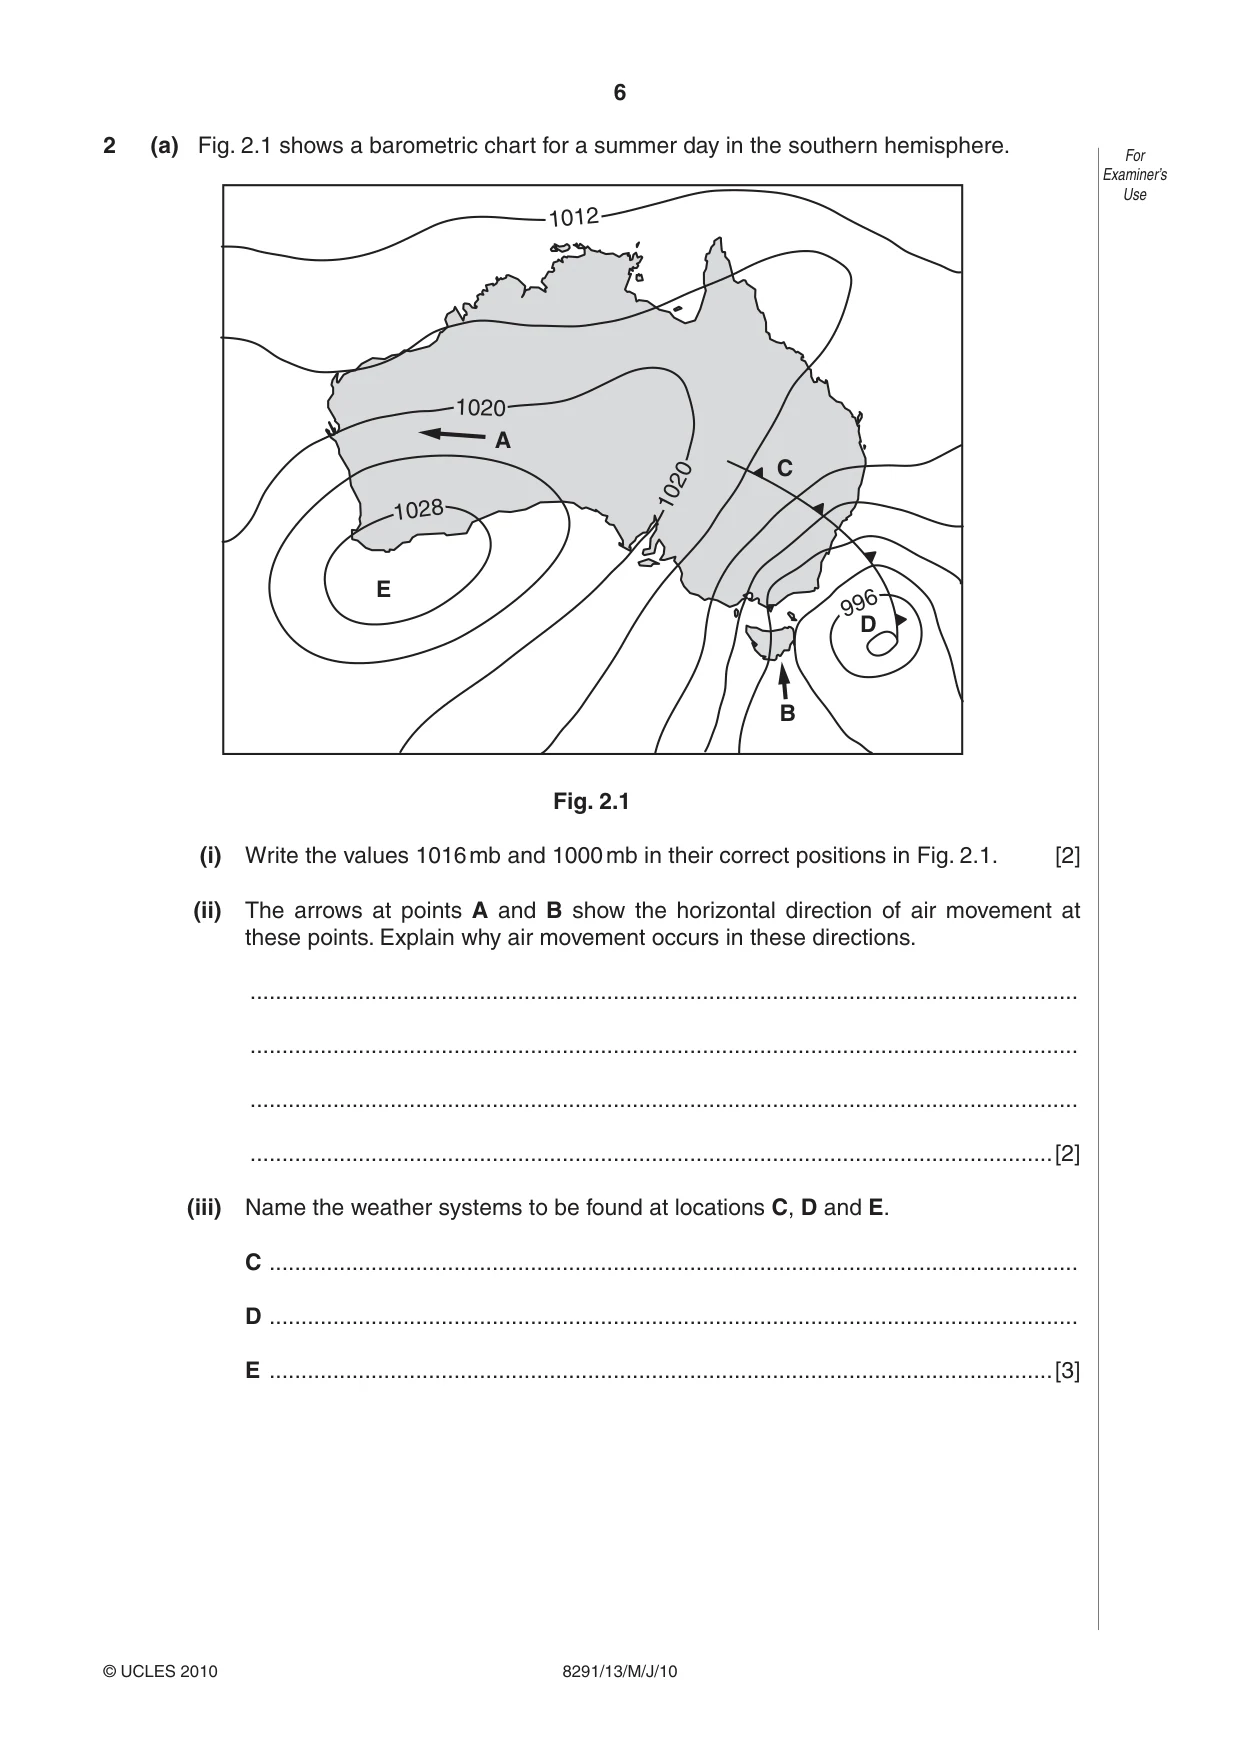
6 For Examiner’s Use © UCLES 2010 8291/13/M/J/10 2 (a) Fig. 2.1 shows a barometric chart for a summer day in the southern hemisphere. 1012 1020 1020 996 1028 A E B D C Fig. 2.1 (i) Write the values 1016 mb and 1000 mb in their correct positions in Fig. 2.1. [2] (ii) The arrows at points A and B show the horizontal direction of air movement at these points. Explain why air movement occurs in these directions. … … … …[2] (iii) Name the weather systems to be found at locations C, D and E. C … D … E …[3]
Question paper, page 7
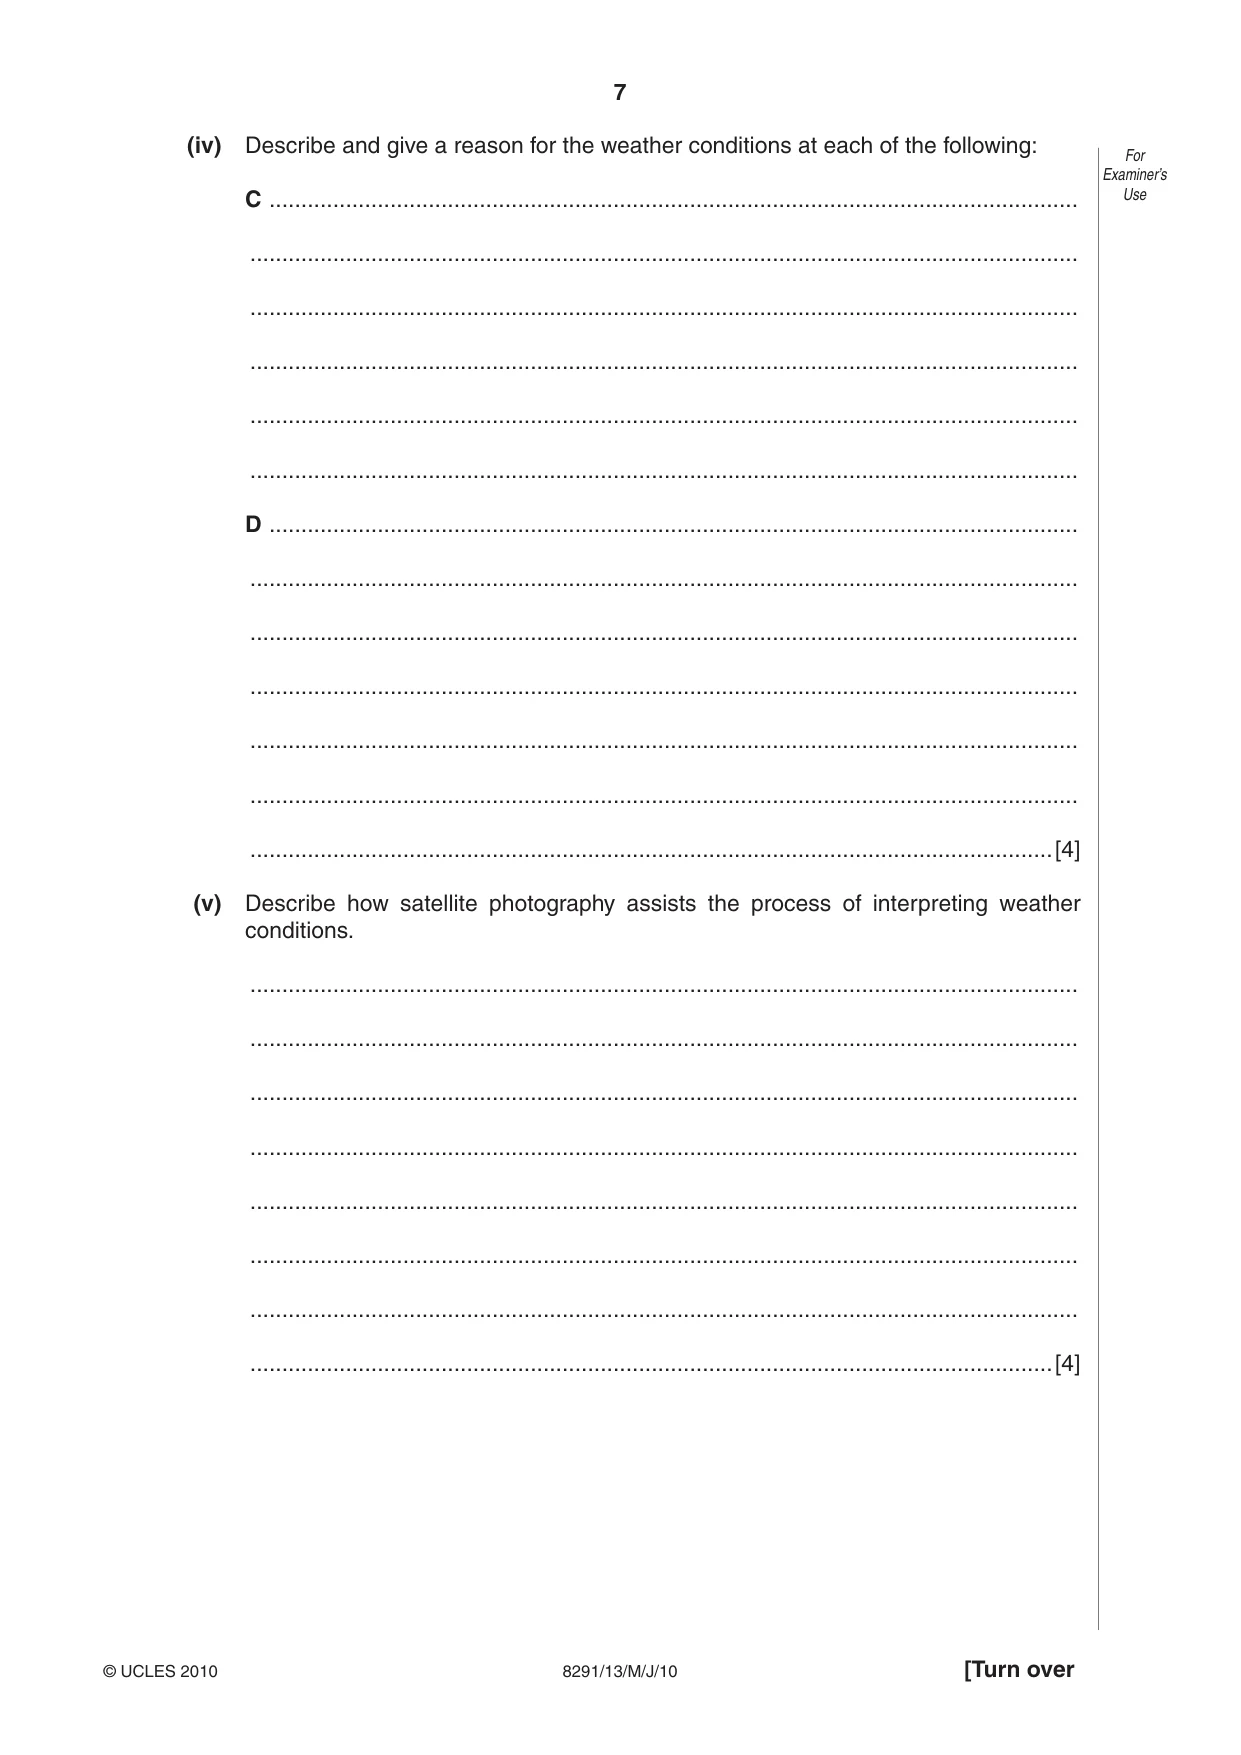
7 [Turn over For Examiner’s Use © UCLES 2010 8291/13/M/J/10 (iv) Describe and give a reason for the weather conditions at each of the following: C … … … … … … D … … … … … … …[4] (v) Describe how satellite photography assists the process of interpreting weather conditions. … … … … … … … …[4]
Question paper, page 8
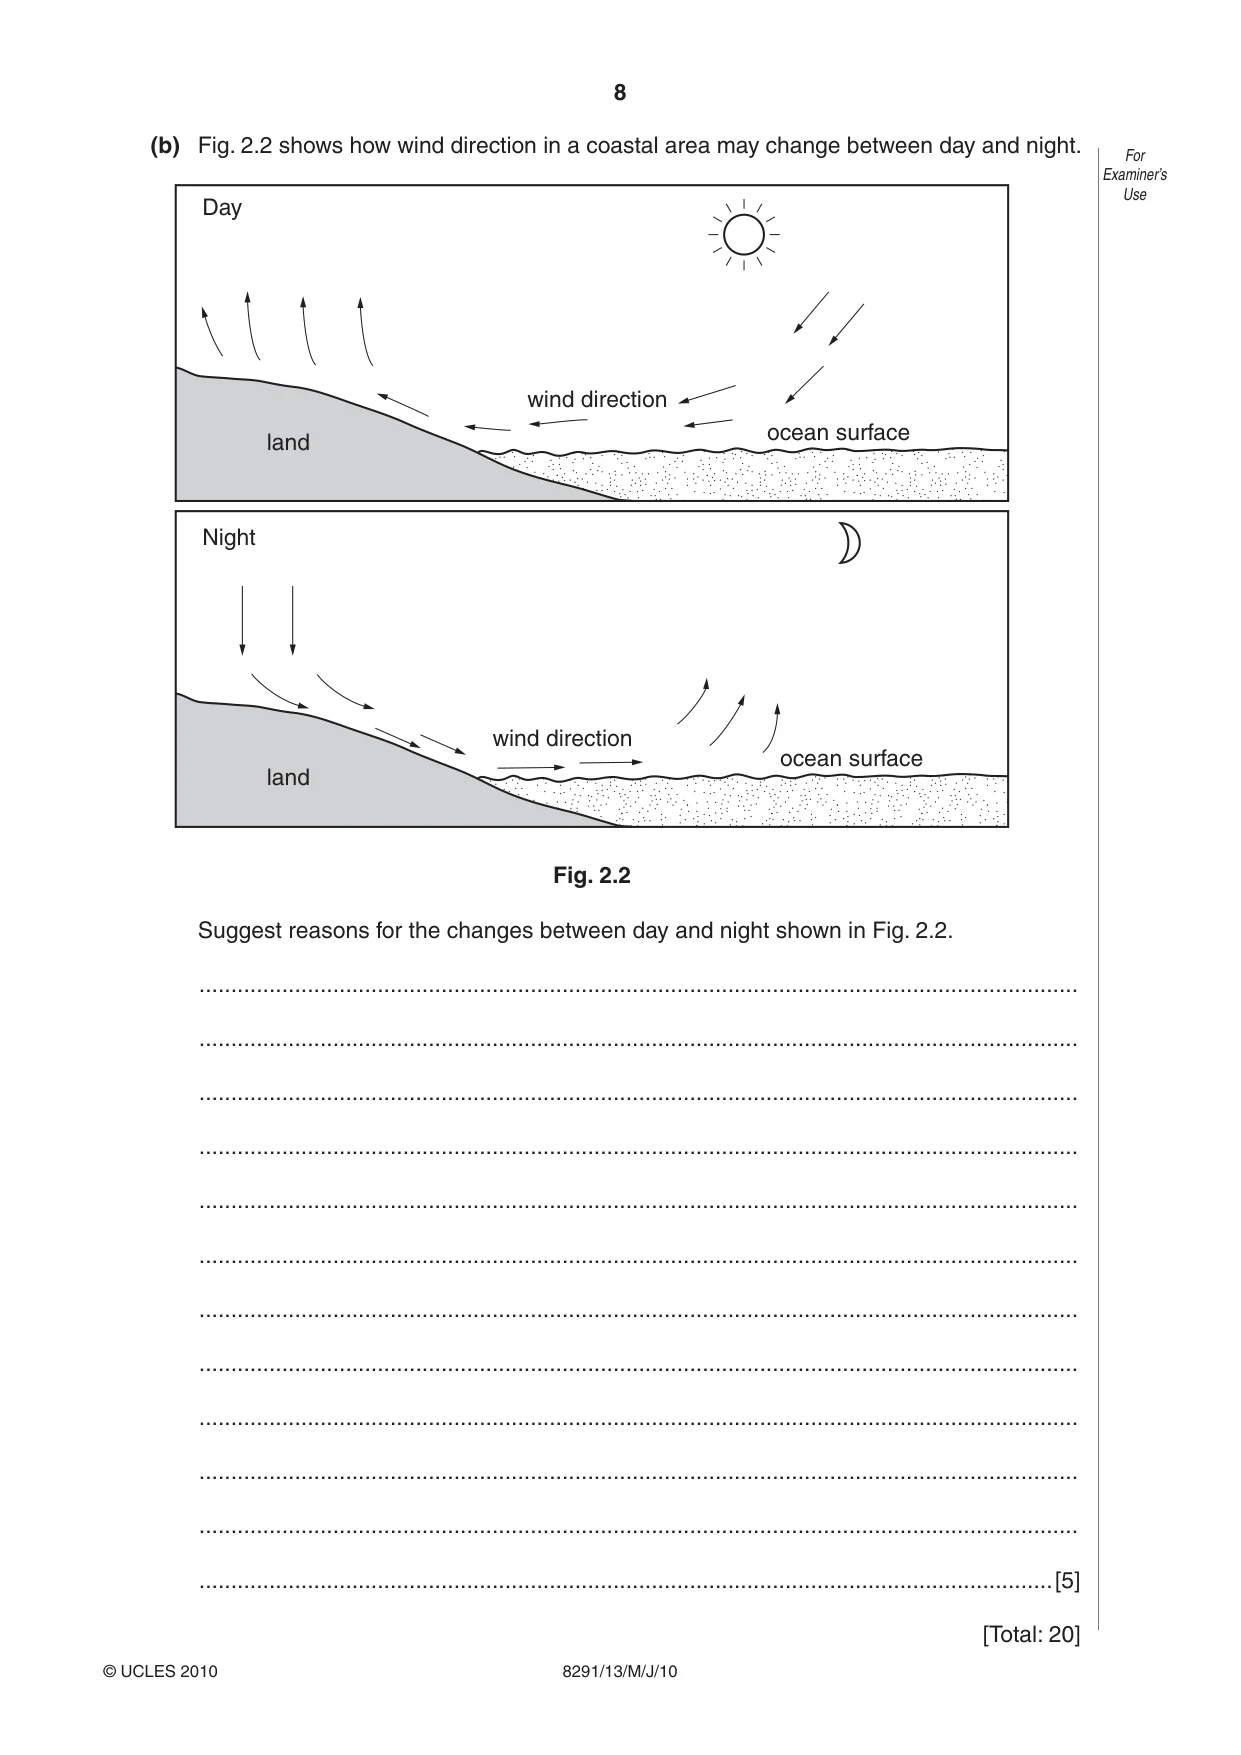
8 For Examiner’s Use © UCLES 2010 8291/13/M/J/10 (b) Fig. 2.2 shows how wind direction in a coastal area may change between day and night. wind direction ocean surface ocean surface wind direction Night land land Day Fig. 2.2 Suggest reasons for the changes between day and night shown in Fig. 2.2. … … … … … … … … … … … …[5] [Total: 20]
Question paper, page 9
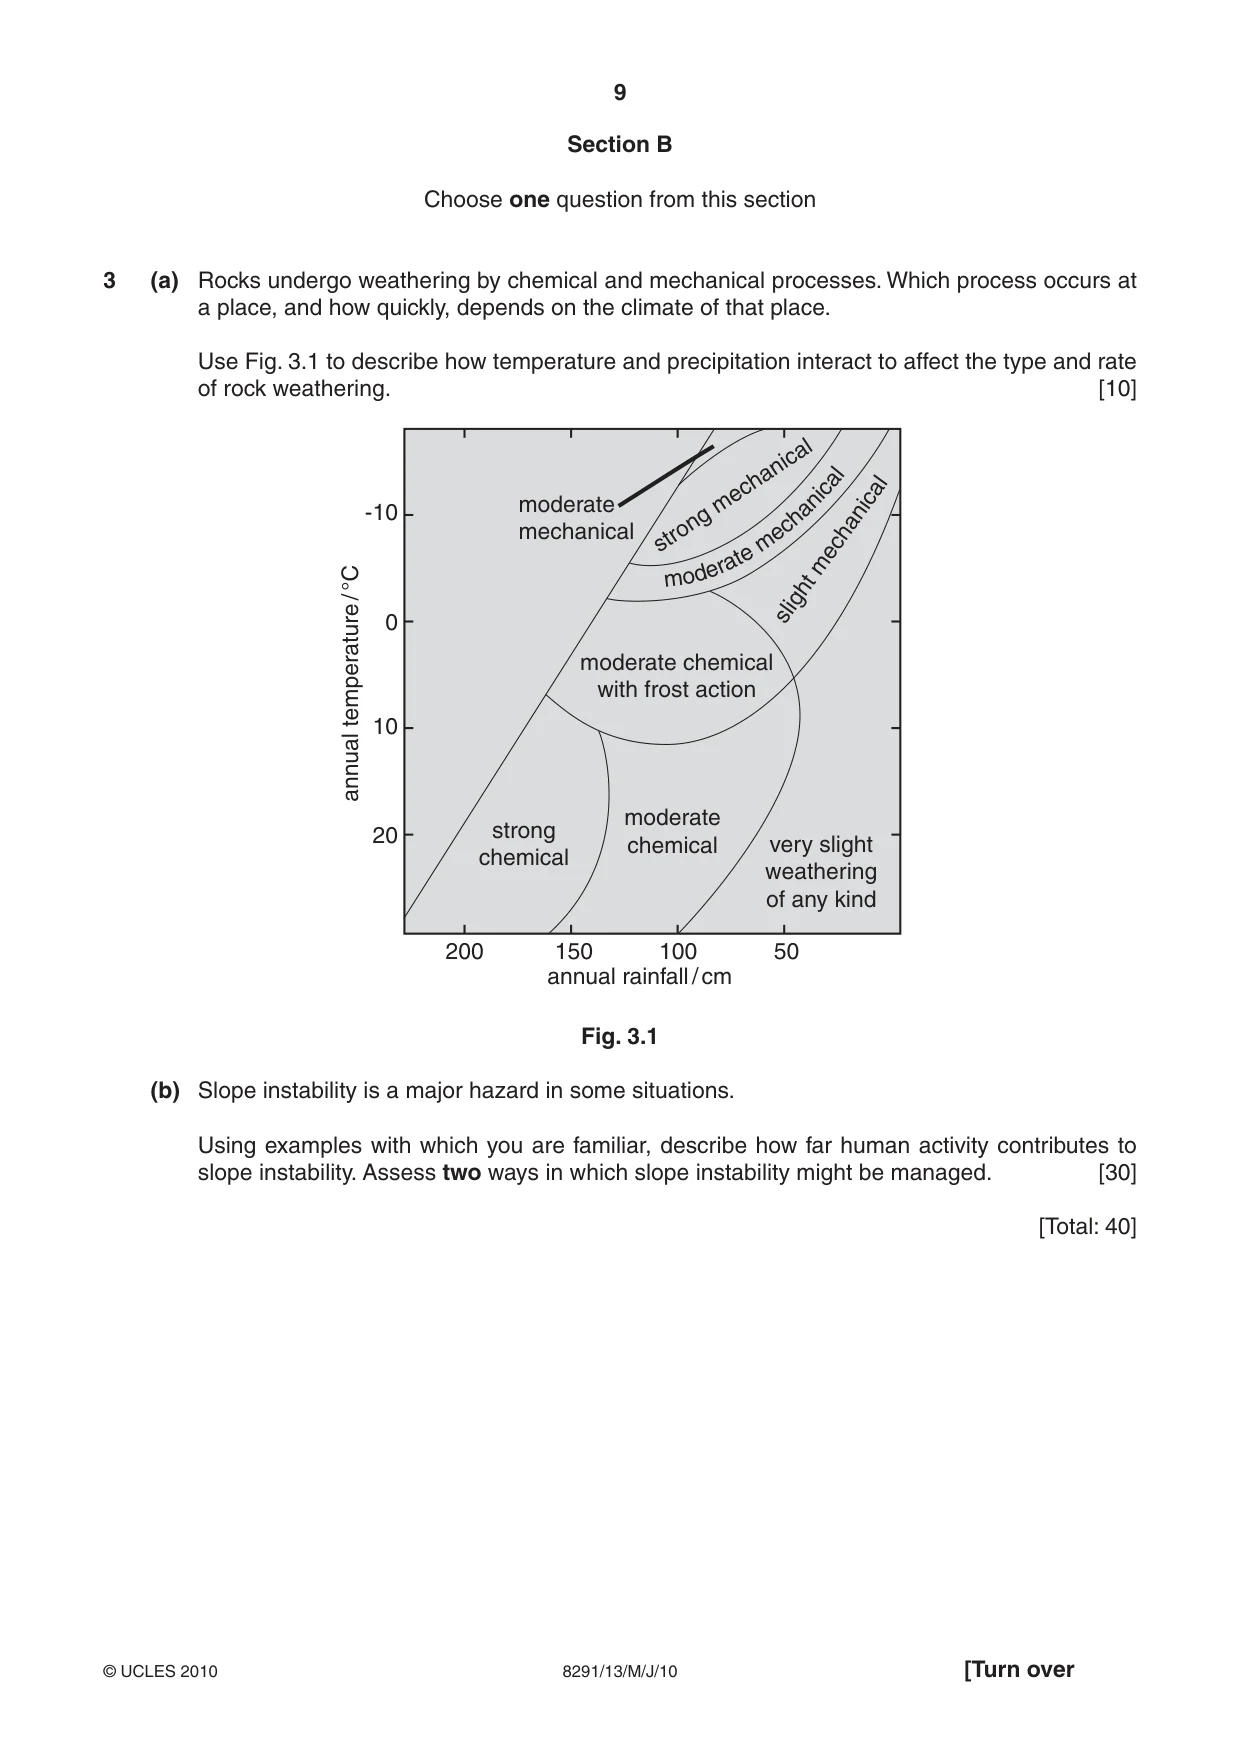
9 © UCLES 2010 [Turn over 8291/13/M/J/10 Section B Choose one question from this section 3 (a) Rocks undergo weathering by chemical and mechanical processes. Which process occurs at a place, and how quickly, depends on the climate of that place. Use Fig. 3.1 to describe how temperature and precipitation interact to affect the type and rate of rock weathering. [10] moderate chemical with frost action moderate mechanical strong chemical 200 20 10 0 -10 150 annual rainfall / cm annual temperature / °C 100 50 moderate chemical very slight weathering of any kind strong mechanical slight mechanical m o d e ra te m ec ha nic al Fig. 3.1 (b) Slope instability is a major hazard in some situations. Using examples with which you are familiar, describe how far human activity contributes to slope instability. Assess two ways in which slope instability might be managed. [30] [Total: 40]
Question paper, page 10
10 8291/13/M/J/10 © UCLES 2010 4 (a) Carbon monoxide, nitrogen oxides and sulphur dioxide contribute to the atmospheric pollution of many cities. Briefly describe the sources and effects of these types of pollution. [10] (b) With reference to urban areas with which you are familiar, describe and evaluate the strategies that have been adopted to reduce atmospheric pollution. [30] [Total: 40]
Question paper, page 11
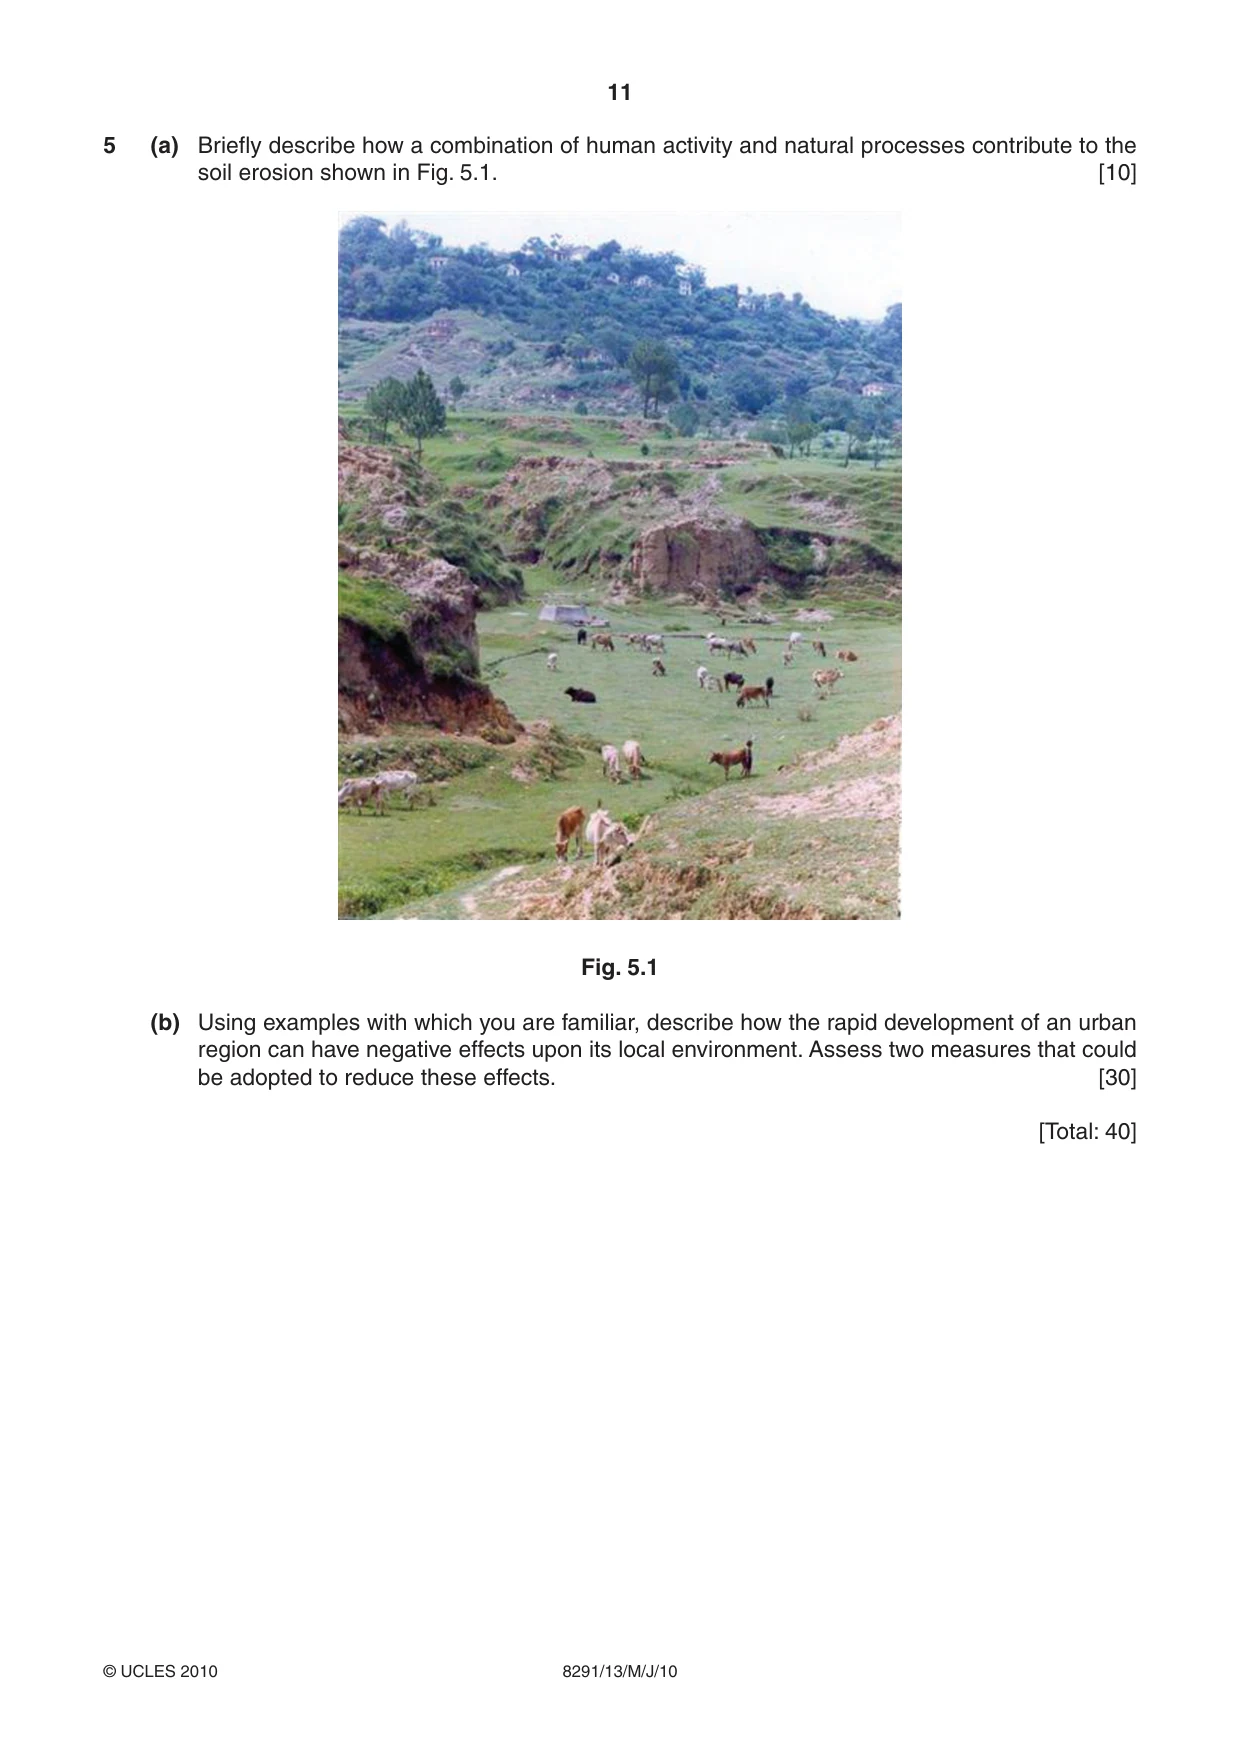
11 8291/13/M/J/10 © UCLES 2010 5 (a) Briefly describe how a combination of human activity and natural processes contribute to the soil erosion shown in Fig. 5.1. [10] Fig. 5.1 (b) Using examples with which you are familiar, describe how the rapid development of an urban region can have negative effects upon its local environment. Assess two measures that could be adopted to reduce these effects. [30] [Total: 40]
Question paper, page 12
12 8291/13/M/J/10 © UCLES 2010 BLANK PAGE Copyright Acknowledgements: Question 1c © www.mysciencebox.org/book/export/html/S26. Question 5 © www.portal.unesco.org/science/fr/ev.php_url_ID=4639&url_Do=Do_Topic&url_section=201.html. Permission to reproduce items where third-party owned material protected by copyright is included has been sought and cleared where possible. Every reasonable effort has been made by the publisher (UCLES) to trace copyright holders, but if any items requiring clearance have unwittingly been included, the publisher will be pleased to make amends at the earliest possible opportunity. University of Cambridge International Examinations is part of the Cambridge Assessment Group. Cambridge Assessment is the brand name of University of Cambridge Local Examinations Syndicate (UCLES), which is itself a department of the University of Cambridge.
Mark scheme, page 1
UNIVERSITY OF CAMBRIDGE INTERNATIONAL EXAMINATIONS GCE Advanced Subsidiary Level MARK SCHEME for the May/June 2010 question paper for the guidance of teachers 8291 ENVIRONMENTAL MANAGEMENT 8291/13 Paper 13, maximum raw mark 80 This mark scheme is published as an aid to teachers and candidates, to indicate the requirements of the examination. It shows the basis on which Examiners were instructed to award marks. It does not indicate the details of the discussions that took place at an Examiners’ meeting before marking began, which would have considered the acceptability of alternative answers. Mark schemes must be read in conjunction with the question papers and the report on the examination. • CIE will not enter into discussions or correspondence in connection with these mark schemes. CIE is publishing the mark schemes for the May/June 2010 question papers for most IGCSE, GCE Advanced Level and Advanced Subsidiary Level syllabuses and some Ordinary Level syllabuses.
Mark scheme, page 2
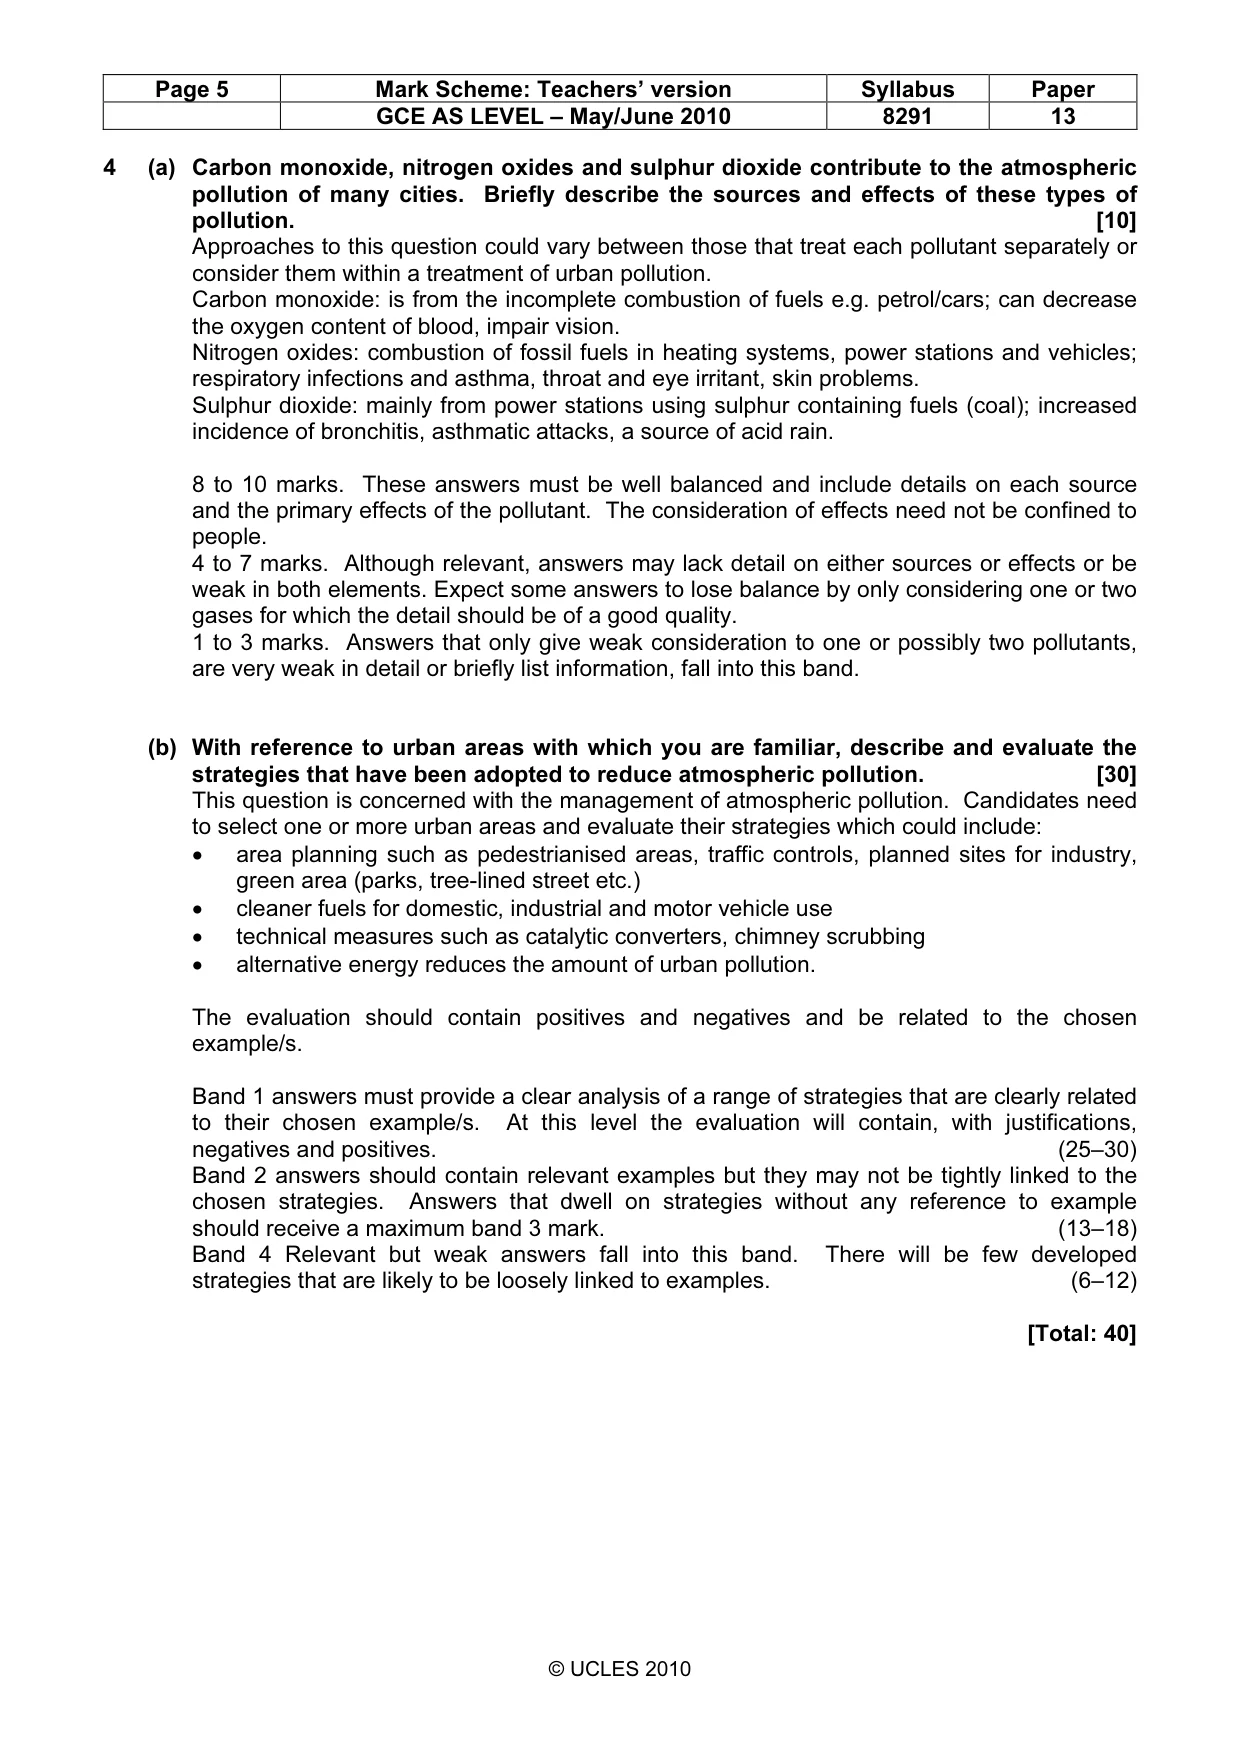
Page 2 Mark Scheme: Teachers’ version Syllabus Paper GCE AS LEVEL – May/June 2010 8291 13 © UCLES 2010 1 (a) Study Fig. 1.1 which shows how P and S seismic waves pass through the Earth. Answer the questions that follow. (i) What is meant by the term seismic waves? [2] Award two marks for a well developed answer and one for a brief statement e.g. shock waves or vibrations (1 mark) propagated by tectonic activity (1 mark). (ii) Distinguish between P and S waves. [2] Credit any two distinctive features; one of each from: speed; time of arrival; wave length; wave type (P & S or transverse/longitudinal). (iii) Explain why no direct P and S waves are recorded in the shadow zones indicated in Fig. 1.1. [3] Credit: 1 mark for the effect of wave refraction at the liquid outer core/mantle boundary; 1 mark for P waves being refracted and passing through liquids; S wave dissipating and not passing through liquids. (b) Seismic waves from an earthquake can be detected using a seismograph. The time difference between a detection of P waves and S waves is related to the distance of the seismograph from the epicentre of the earthquake. The curved line on Fig. 1.2 shows the distance out from seismograph 1 of the epicentre. (i) Draw onto Fig. 1.2 two more curved lines to show how it is possible to use three seismographs to find the earthquake’s epicentre. [1] One mark for drawing the two curves. (ii) Mark with an X on Fig. 1.2 the location of the epicentre. [1] Within the intersection of the three curves. (iii) Give one reason why recordings from at least three seismographs are needed in order to locate the epicentre of an earthquake. [1] Two curves would show a large area of overlap (accept an illustration) but do not accept ‘would not show the location’. The curves locate a point. (c) Describe and suggest reasons for the pattern of earthquakes in the period 1963 to 1998 shown in Fig. 1.3. [6] Credit: description 3/4 and reasons 4/3; up to a maximum of 6 marks. Description: at convergent, divergent and transform boundaries plus a broad dispersion within plates = 3 marks. If only at plate boundaries then 1 mark, but also found within plates = 1 mark. (d) Describe and justify two methods that can be used to predict the likelihood of a future earthquake in a given locality. [4] The question is concerned with prediction. For each of the two methods, credit 1 mark for a brief statement or name and 1 mark for its qualification: seismic gaps, history, pre-shocks; there is no time scale to this and candidates may well allude to the unpredictability of earthquakes which is not needed. [Total: 20]
Mark scheme, page 3
Page 3 Mark Scheme: Teachers’ version Syllabus Paper GCE AS LEVEL – May/June 2010 8291 13 © UCLES 2010 2 (a) Fig. 2.1 shows a barometric chart for a summer day in the southern hemisphere. (i) Write the values 1016mb and 1000mb in their correct locations in Fig. 2.1. [2] 1 mark for each correct location. (ii) The arrows at points A and B show the horizontal direction of air movement at these points. Explain why air movement occurs in these directions. [2] One mark for the coriolis force and one for a correct but brief elaboration e.g. pressure gradient. (iii) Name the weather systems to be found at locations C, D and E. [3] C Cold front D Depression or low pressure system E Anticyclone or high pressure system (iv) Describe and give a reason for the weather conditions at each of the following: [4] For four marks do not expect an in-depth answer. Cold front (C): cold air meets (undercuts) warm air (1) warm air rises to produce condensation particles and precipitation (1). Cyclone or depression (D): air circulates around a low pressure vortex (1), air rises to produce cloud and rain (1) or credit reference to strong winds and unstable conditions. (v) Describe how satellite photography assists the process of interpreting weather conditions. [4] 1 mark for each of four relevant points. Satellite photographs show cloud as white and clear sky darker (1). The pattern formed by clouds indicates wind direction (1), then credit 1/2 marks for reference to weather conditions leaving 1 mark reserved for satellite photographs assisting surface observations. (b) Fig. 2.2 shows how wind direction in a coastal area may change between day and night. Suggest reasons for the changes between day and night shown in Fig. 2.2. [5] One mark for recognising land and sea breezes as a diurnal change under clear skies or anticyclonic conditions (1). Day: land heats causing localised low pressure (1) draws air in from the cooler ocean area (higher pressure). Candidates may well refer to air density rather than pressure. Night: do not credit any simple and simplistic statements such as ‘it reverses’. Cold air moves out to the ocean area which is of lower pressure or density. [Total: 20]
Mark scheme, page 4
Page 4 Mark Scheme: Teachers’ version Syllabus Paper GCE AS LEVEL – May/June 2010 8291 13 © UCLES 2010 3 (a) Rocks undergo weathering by chemical and mechanical processes. Which process occurs at a place, and how quickly, depends on the climate of that place. Use Fig. 3.1 to describe how temperature and precipitation interact to affect the type and rate of rock weathering. [10] The standard Peltier model that relates types of weathering to temperature and moisture. Strong chemical weathering being at high temperatures and precipitation and the strongest mechanical processes being frost action where temperatures fluctuate above and below freezing point. The model actually stresses the role of moisture. Candidates may opt to move around the chart and should be awarded up to 10 marks as long as the interaction of temperature and precipitation are satisfied. Award 8 to 10 marks for well balanced answers that bring out the interaction of temperature and moisture and stress both the extremes and intermediate conditions. There should be some reference to chemical and mechanical processes. Award 4 to 7 marks for answers that are relevant but are either poorly balanced or are brief on processes. If the two extremes are mentioned but intermediate conditions ignored then award a maximum of 7 marks. Award 1 to 3 marks for brief answers which may wander aimlessly around the chart. Answers in this category will clearly lack an understanding of weathering processes but may gain credit for identifying positions on the chart. (b) Slope instability is a major hazard in some situations. Using examples with which you are familiar, describe how far human activity contributes to slope instability. Assess two ways in which slope instability might be managed. [30] The answer falls into two parts and notionally 2/3 of the marks are for the first part. Candidates need to choose more than one example to satisfy the question. The question is concerned with the factors that render land unstable and liable to movement. Such instability can be triggered by natural and human factors: Human Activity: building construction, road and rail (cuttings) and agriculture. Natural Processes are triggered by human activity: dry and wet mass movements on sloping land, cliffs (inland and coastal), rivers, volcanic activity and earthquakes. Only two management strategies are needed and should be linked to the hazards already described. These strategies need coordination, planning and investment and can include: aforestation, slope reinforcement (revetments, gabions etc.), improved agricultural practice, slope drainage or even doing nothing and moving people. Band 1 answers should contain two developed points. The causes and effects of the hazards given full coverage with clear reference to how such hazards can be managed. These answers should have strong coverage of processes linked to examples with strong assessments. (25–30) Band 3 answers may lack balance between cause, processes, effects and management. Some answers may be descriptive rather than analytical descriptions or poorly balanced with weak development of exemplar material. (13–18) Band 4. At the top of this band the answer should be relevant. However answers are likely to be brief, possibly list material and often be superficial. There may be little reference to examples. (6–12) [Total: 40]
Mark scheme, page 5
Page 5 Mark Scheme: Teachers’ version Syllabus Paper GCE AS LEVEL – May/June 2010 8291 13 © UCLES 2010 4 (a) Carbon monoxide, nitrogen oxides and sulphur dioxide contribute to the atmospheric pollution of many cities. Briefly describe the sources and effects of these types of pollution. [10] Approaches to this question could vary between those that treat each pollutant separately or consider them within a treatment of urban pollution. Carbon monoxide: is from the incomplete combustion of fuels e.g. petrol/cars; can decrease the oxygen content of blood, impair vision. Nitrogen oxides: combustion of fossil fuels in heating systems, power stations and vehicles; respiratory infections and asthma, throat and eye irritant, skin problems. Sulphur dioxide: mainly from power stations using sulphur containing fuels (coal); increased incidence of bronchitis, asthmatic attacks, a source of acid rain. 8 to 10 marks. These answers must be well balanced and include details on each source and the primary effects of the pollutant. The consideration of effects need not be confined to people. 4 to 7 marks. Although relevant, answers may lack detail on either sources or effects or be weak in both elements. Expect some answers to lose balance by only considering one or two gases for which the detail should be of a good quality. 1 to 3 marks. Answers that only give weak consideration to one or possibly two pollutants, are very weak in detail or briefly list information, fall into this band. (b) With reference to urban areas with which you are familiar, describe and evaluate the strategies that have been adopted to reduce atmospheric pollution. [30] This question is concerned with the management of atmospheric pollution. Candidates need to select one or more urban areas and evaluate their strategies which could include: • area planning such as pedestrianised areas, traffic controls, planned sites for industry, green area (parks, tree-lined street etc.) • cleaner fuels for domestic, industrial and motor vehicle use • technical measures such as catalytic converters, chimney scrubbing • alternative energy reduces the amount of urban pollution. The evaluation should contain positives and negatives and be related to the chosen example/s. Band 1 answers must provide a clear analysis of a range of strategies that are clearly related to their chosen example/s. At this level the evaluation will contain, with justifications, negatives and positives. (25–30) Band 2 answers should contain relevant examples but they may not be tightly linked to the chosen strategies. Answers that dwell on strategies without any reference to example should receive a maximum band 3 mark. (13–18) Band 4 Relevant but weak answers fall into this band. There will be few developed strategies that are likely to be loosely linked to examples. (6–12) [Total: 40]
Mark scheme, page 6
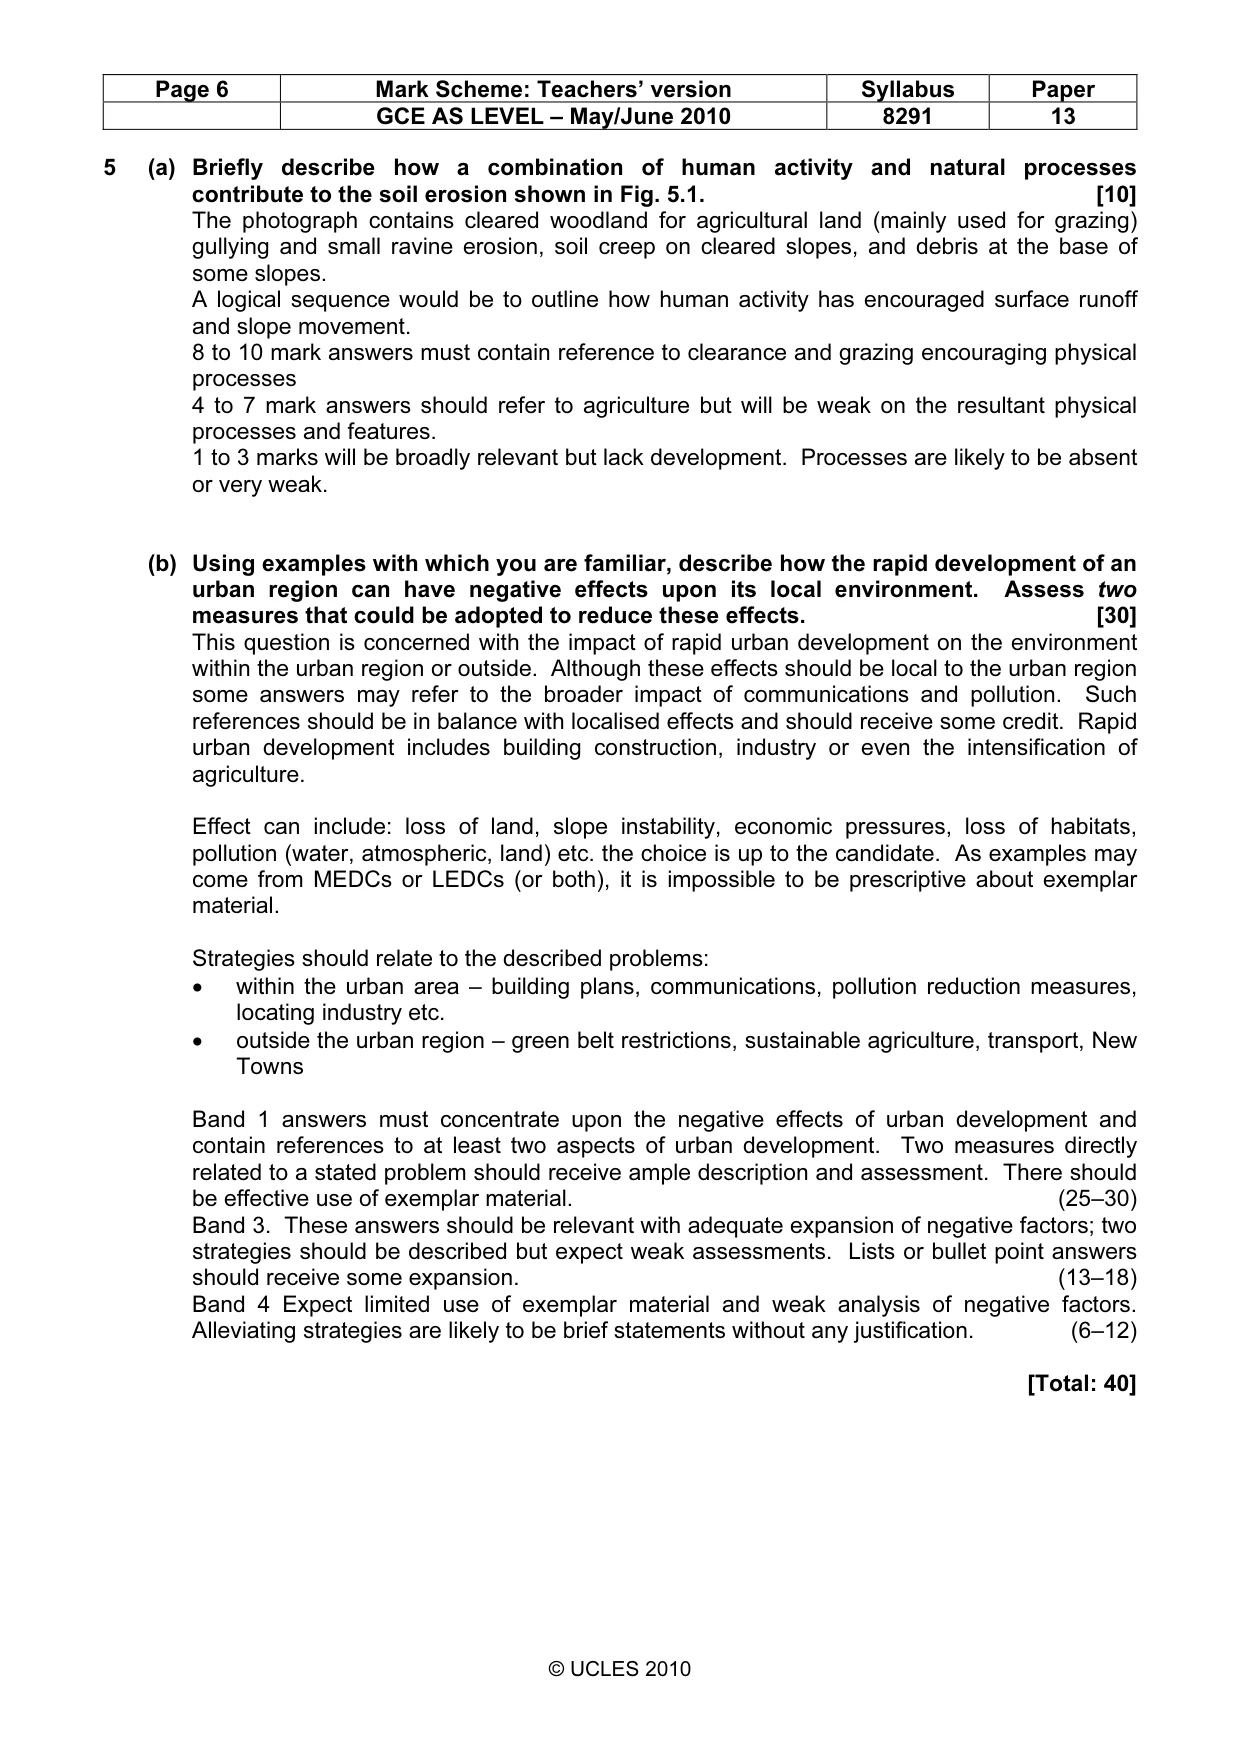
Page 6 Mark Scheme: Teachers’ version Syllabus Paper GCE AS LEVEL – May/June 2010 8291 13 © UCLES 2010 5 (a) Briefly describe how a combination of human activity and natural processes contribute to the soil erosion shown in Fig. 5.1. [10] The photograph contains cleared woodland for agricultural land (mainly used for grazing) gullying and small ravine erosion, soil creep on cleared slopes, and debris at the base of some slopes. A logical sequence would be to outline how human activity has encouraged surface runoff and slope movement. 8 to 10 mark answers must contain reference to clearance and grazing encouraging physical processes 4 to 7 mark answers should refer to agriculture but will be weak on the resultant physical processes and features. 1 to 3 marks will be broadly relevant but lack development. Processes are likely to be absent or very weak. (b) Using examples with which you are familiar, describe how the rapid development of an urban region can have negative effects upon its local environment. Assess two measures that could be adopted to reduce these effects. [30] This question is concerned with the impact of rapid urban development on the environment within the urban region or outside. Although these effects should be local to the urban region some answers may refer to the broader impact of communications and pollution. Such references should be in balance with localised effects and should receive some credit. Rapid urban development includes building construction, industry or even the intensification of agriculture. Effect can include: loss of land, slope instability, economic pressures, loss of habitats, pollution (water, atmospheric, land) etc. the choice is up to the candidate. As examples may come from MEDCs or LEDCs (or both), it is impossible to be prescriptive about exemplar material. Strategies should relate to the described problems: • within the urban area – building plans, communications, pollution reduction measures, locating industry etc. • outside the urban region – green belt restrictions, sustainable agriculture, transport, New Towns Band 1 answers must concentrate upon the negative effects of urban development and contain references to at least two aspects of urban development. Two measures directly related to a stated problem should receive ample description and assessment. There should be effective use of exemplar material. (25–30) Band 3. These answers should be relevant with adequate expansion of negative factors; two strategies should be described but expect weak assessments. Lists or bullet point answers should receive some expansion. (13–18) Band 4 Expect limited use of exemplar material and weak analysis of negative factors. Alleviating strategies are likely to be brief statements without any justification. (6–12) [Total: 40]
Mark scheme, page 7
Page 7 Mark Scheme: Teachers’ version Syllabus Paper GCE AS LEVEL – May/June 2010 8291 13 © UCLES 2010 Generic Mark Scheme This aims to provide a scheme for marking 30 mark answers in Section B. The marks are grouped into bands from which it should be possible to locate a mark. The assessment objectives outlined are developed out of the broad objectives for the examination and guideline for locating marks for essays. Criterion A. Demonstrates relevant knowledge and understanding applied to a range of issues and problems. Criterion B. Communicates clearly in a concise, logical and relevant way. Criterion C. Marshall evidence, draw conclusions and make evaluations. Balance of marks for 30 mark questions; Criterion A = maximum of 15 Criterion B = maximum of 5 Criterion C = maximum of 10 Band Level Descriptors Marks Band 1 The candidate demonstrates the following abilities where appropriate to: 25–30 A • select and use a very good range of accurate and appropriate knowledge; • integrate knowledge from a wide range of areas; • show a good understanding of the concepts involved; • make good use of knowledge derived from personal experience and study; B • select and use a form and style of writing appropriate to purpose and complex subject matter with facility; • communicate complex ideas clearly and accurately, in a concise, logical and relevant way; C • analyse issues and problems well and evaluate them appropriately; • develop complex reasoned arguments and draw sound conclusions on the evidence; Band The candidate demonstrates the following abilities where appropriate to: 19–24 A • select and use a good range of accurate and appropriate knowledge; • integrate knowledge from a wide range of areas; • show an understanding of the concepts involved; • demonstrate a range of awareness of personally derived and studied knowledge; B • select and use a form and style of writing appropriate to purpose and complex subject matter; • communicate complex ideas clearly and accurately, in a concise, logical and relevant way; C • analyse issues and problems and evaluate them competently; • develop complex reasoned arguments and draw conclusions on the evidence; Band 3 The candidate demonstrates the following abilities where appropriate to: 13–18 A • select and use some accurate and relevant knowledge. integrate knowledge from a limited range of areas; • show an adequate understanding of the concepts involved; • demonstrate a limited range of awareness of personally derived and studied knowledge; B • select and use a form and style of writing appropriate to purpose and subject matter; • communicate the ideas clearly and in a logical way C • undertake some analysis of issues and problems and make a superficial evaluation; • develop arguments and draw conclusions;
Mark scheme, page 8
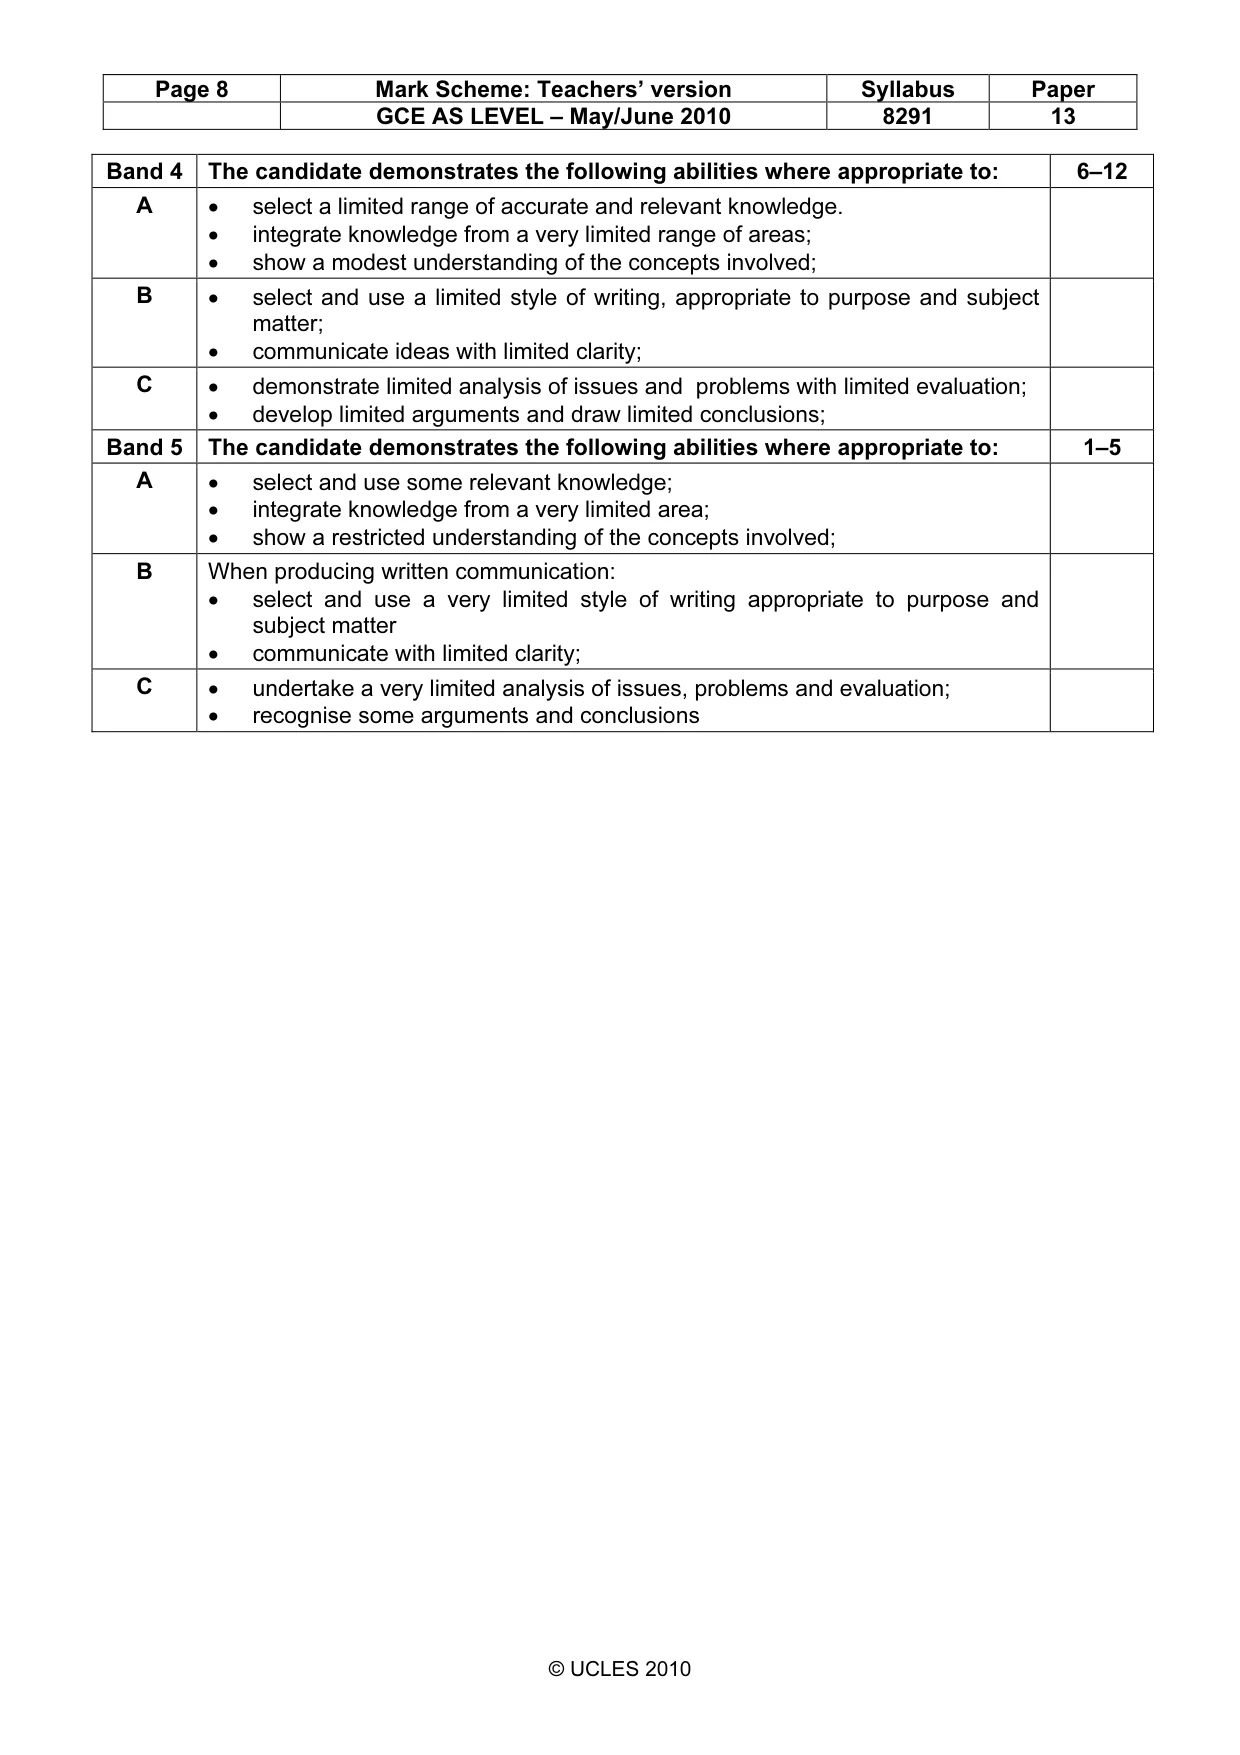
Page 8 Mark Scheme: Teachers’ version Syllabus Paper GCE AS LEVEL – May/June 2010 8291 13 © UCLES 2010 Band 4 The candidate demonstrates the following abilities where appropriate to: 6–12 A • select a limited range of accurate and relevant knowledge. • integrate knowledge from a very limited range of areas; • show a modest understanding of the concepts involved; B • select and use a limited style of writing, appropriate to purpose and subject matter; • communicate ideas with limited clarity; C • demonstrate limited analysis of issues and problems with limited evaluation; • develop limited arguments and draw limited conclusions; Band 5 The candidate demonstrates the following abilities where appropriate to: 1–5 A • select and use some relevant knowledge; • integrate knowledge from a very limited area; • show a restricted understanding of the concepts involved; B When producing written communication: • select and use a very limited style of writing appropriate to purpose and subject matter • communicate with limited clarity; C • undertake a very limited analysis of issues, problems and evaluation; • recognise some arguments and conclusions
What you needed in this session
Cambridge’s own grade thresholds for 2010 May/June, Paper 1 · Variant 3. A higher threshold means an easier paper — the bar moves with how the cohort did.