Cambridge A Level Economics 9708 — 2022 Oct/Nov Paper 4 · Variant 3
9708/43/O/N/22 · 7 questions · 70 marks · ≈79 min
The question paper and its mark scheme, free to read here and free to download. This is Cambridge’s own paper, exactly as it was sat.
Question paper4 pages

Mark scheme22 pages
Answers below. Sit the paper first if you are practising.









Questions as text
Q1 · The Hidden Cost of Palm Oil Worldwide production of palm oil has been increasing for many…
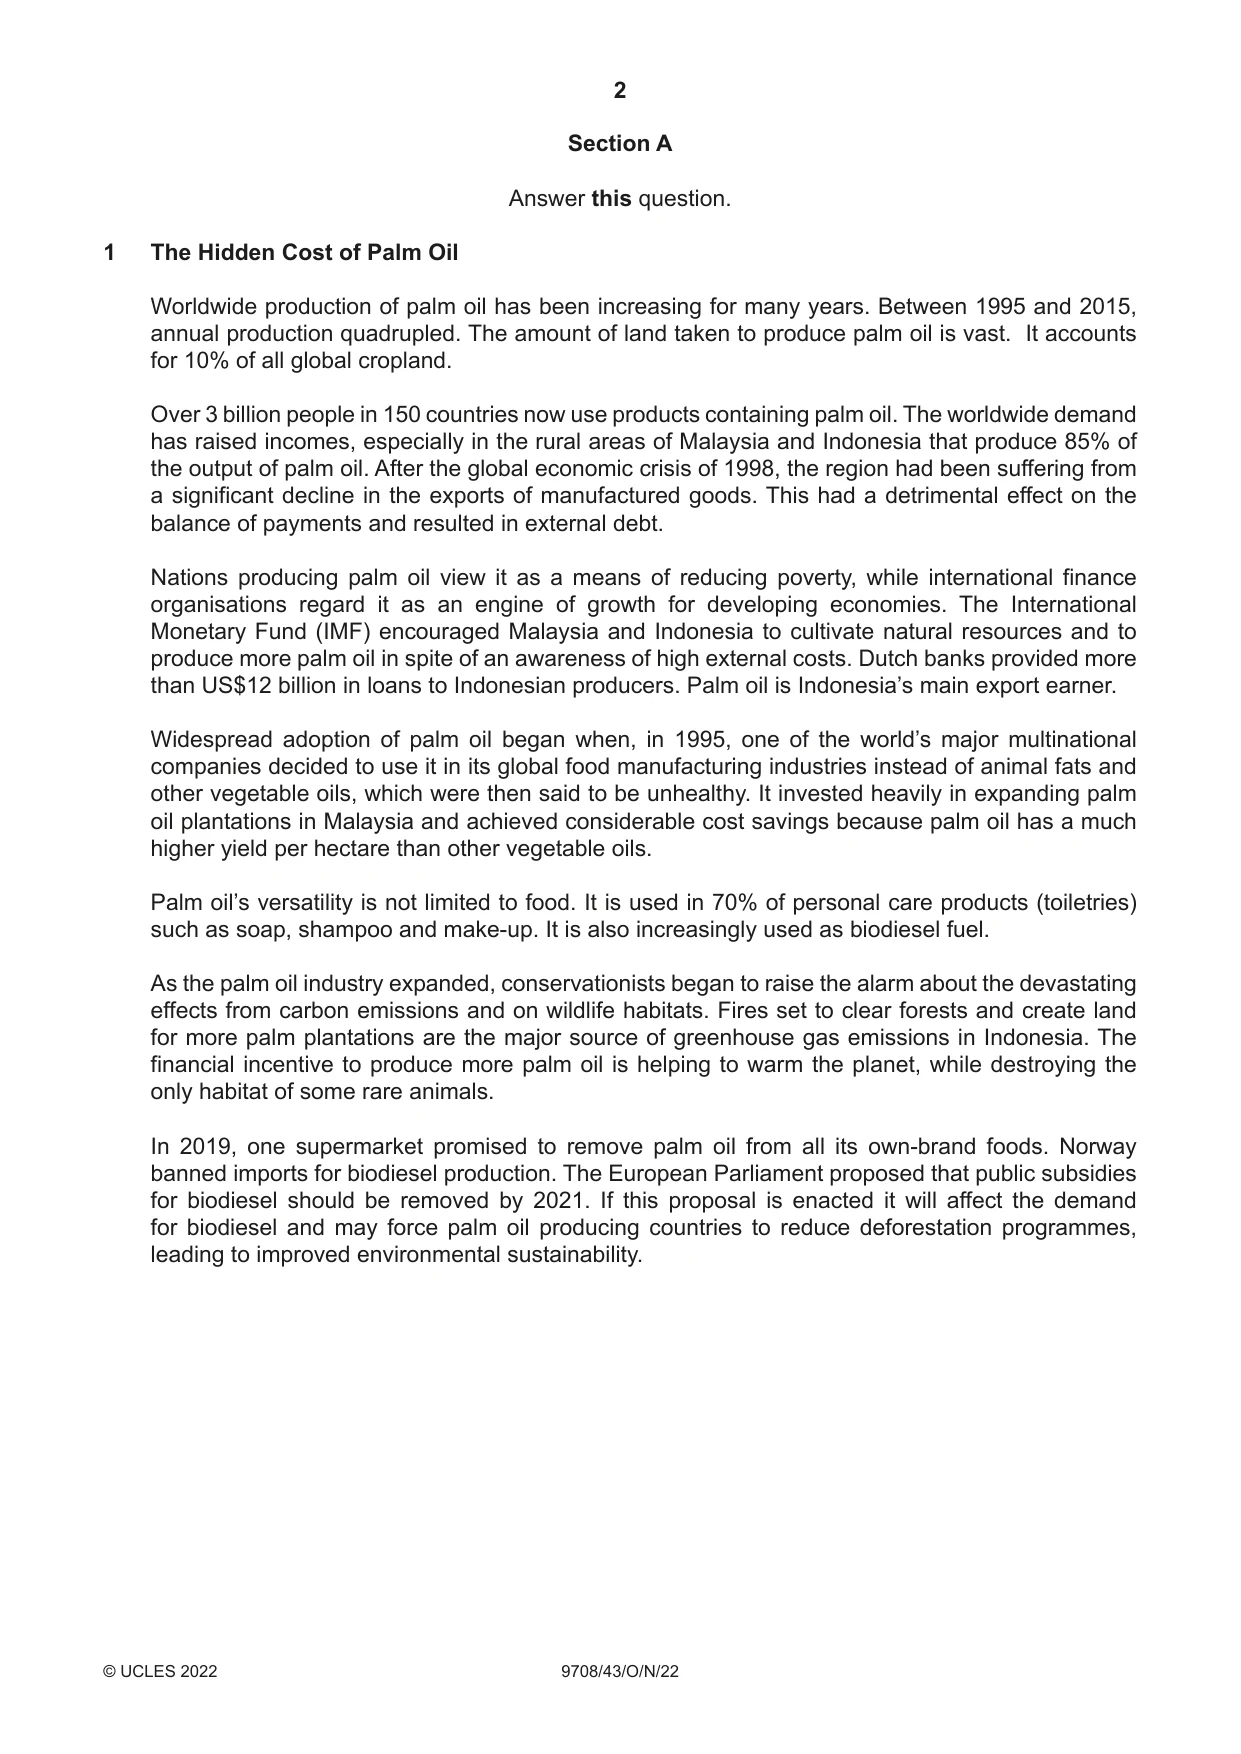
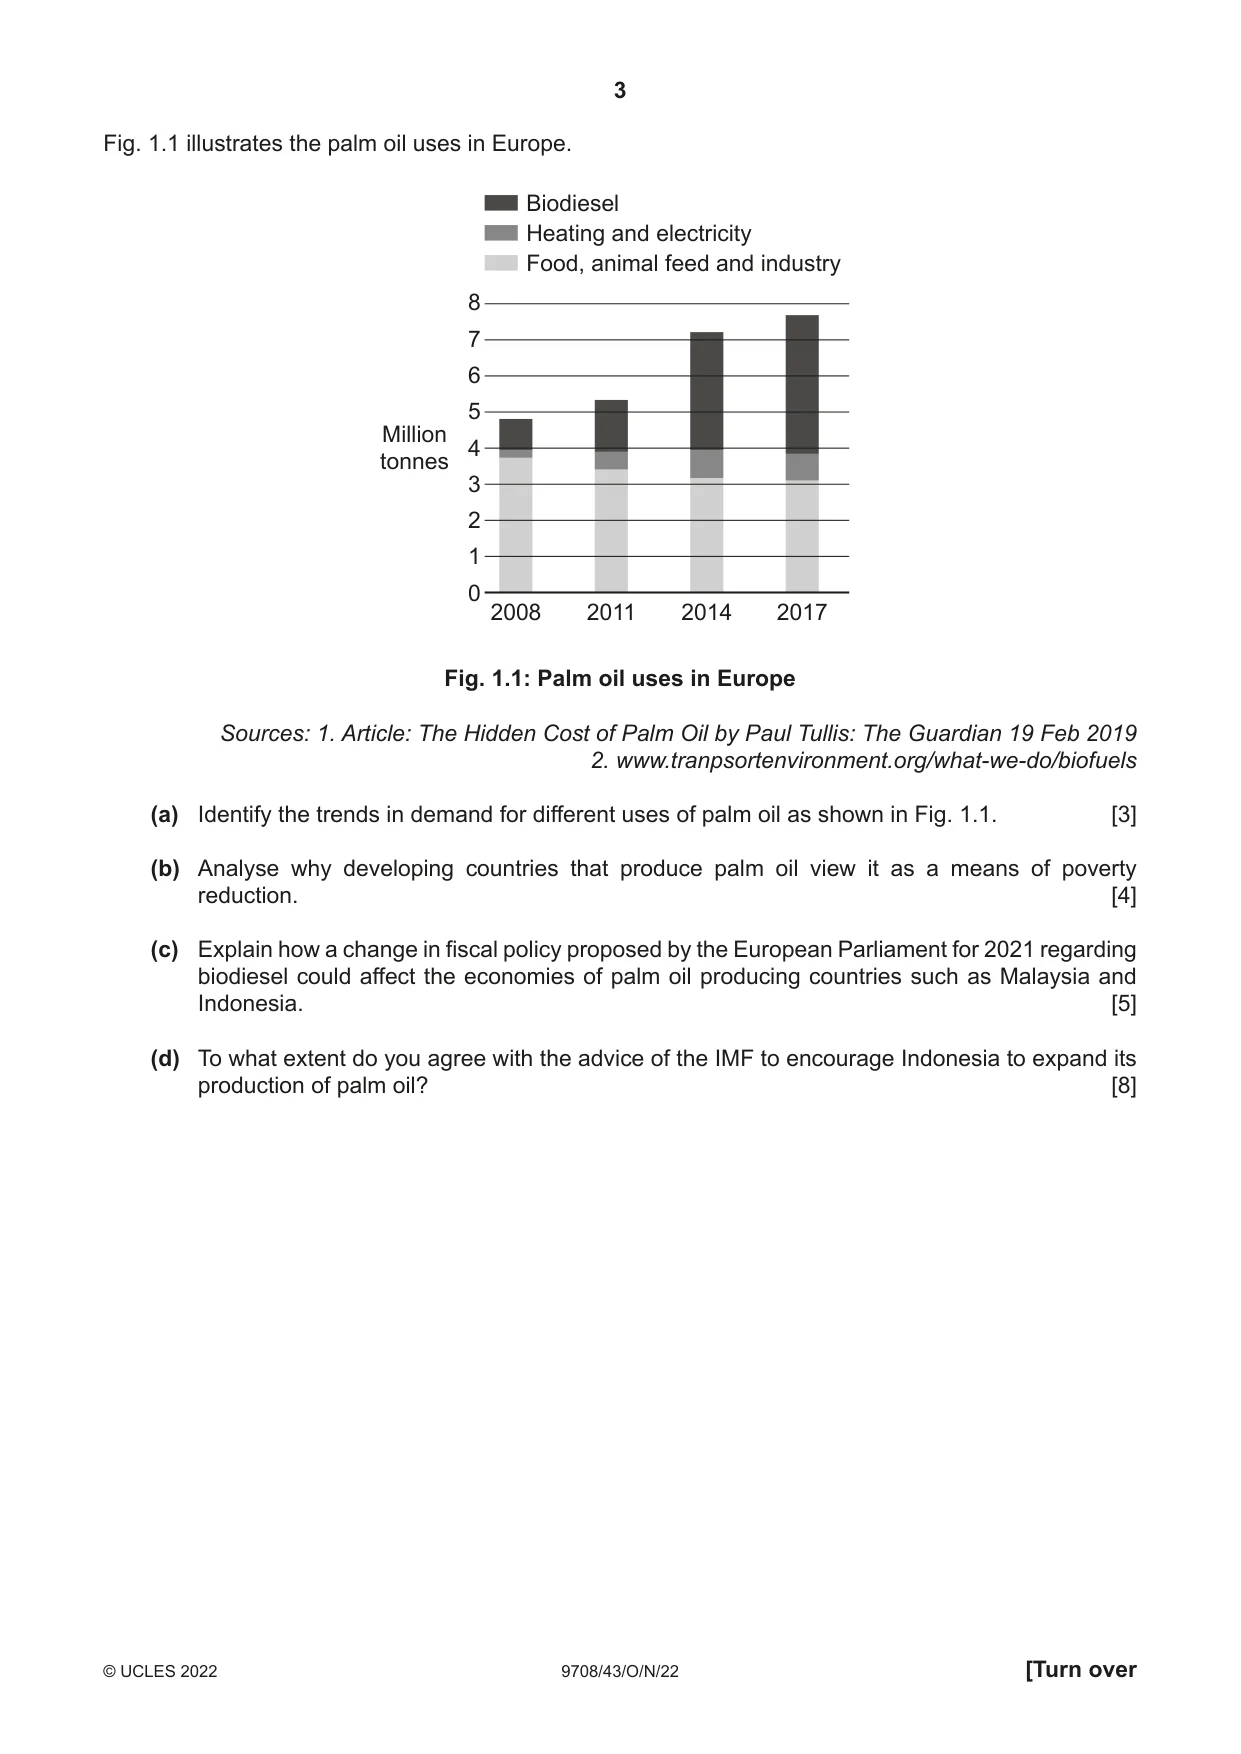
1 The Hidden Cost of Palm Oil Worldwide production of palm oil has been increasing for many years. Between 1995 and 2015, annual production quadrupled. The amount of land taken to produce palm oil is vast. It accounts for 10% of all global cropland. Over 3 billion people in 150 countries now use products containing palm oil. The worldwide demand has raised incomes, especially in the rural areas of Malaysia and Indonesia that produce 85% of the output of palm oil. After the global economic crisis of 1998, the region had been suffering from a significant decline in the exports of manufactured goods. This had a detrimental effect on the balance of payments and resulted in external debt. Nations producing palm oil view it as a means of reducing poverty, while international finance organisations regard it as an engine of growth for developing economies. The International Monetary Fund (IMF) encouraged Malaysia and Indonesia to cultivate natural resources and to produce more palm oil in spite of an awareness of high external costs. Dutch banks provided more than US$12 billion in loans to Indonesian producers. Palm oil is Indonesia’s main export earner. Widespread adoption of palm oil began when, in 1995, one of the world’s major multinational companies decided to use it in its global food manufacturing industries instead of animal fats and other vegetable oils, which were then said to be unhealthy. It invested heavily in expanding palm oil plantations in Malaysia and achieved considerable cost savings because palm oil has a much higher yield per hectare than other vegetable oils. Palm oil’s versatility is not limited to food. It is used in 70% of personal care products (toiletries) such as soap, shampoo and make-up. It is also increasingly used as biodiesel fuel. As the palm oil industry expanded, conservationists began to raise the alarm about the devastating effects from carbon emissions and on wildlife habitats. Fires set to clear forests and create land for more palm plantations are the major source of greenhouse gas emissions in Indonesia. The financial incentive to produce more palm oil is helping to warm the planet, while destroying the only habitat of some rare animals. In 2019, one supermarket promised to remove palm oil from all its own-brand foods. Norway banned imports for biodiesel production. The European Parliament proposed that public subsidies for biodiesel should be removed by 2021. If this proposal is enacted it will affect the demand for biodiesel and may force palm oil producing countries to reduce deforestation programmes, leading to improved environmental sustainability. Fig. 1.1 illustrates the palm oil uses in Europe. Biodiesel Heating and electricity Food, animal feed and industry 8 7 6 5 Million 4 tonnes 3 2 1 0 2008 2011 2014 2017 Fig. 1.1: Palm oil uses in Europe Sources: 1. Article: The Hidden Cost of Palm Oil by Paul Tullis: The Guardian 19 Feb 2019 2. www.tranpsortenvironment.org/what-we-do/biofuels (a) Identify the trends in demand for different uses of palm oil as shown in Fig. 1.1. [3] (b) Analyse why developing countries that produce palm oil view it as a means of poverty reduction. [4] (c) Explain how a change in fiscal policy proposed by the European Parliament for 2021 regarding biodiesel could affect the economies of palm oil producing countries such as Malaysia and Indonesia. [5] (d) To what extent do you agree with the advice of the IMF to encourage Indonesia to expand its production of palm oil? [8]
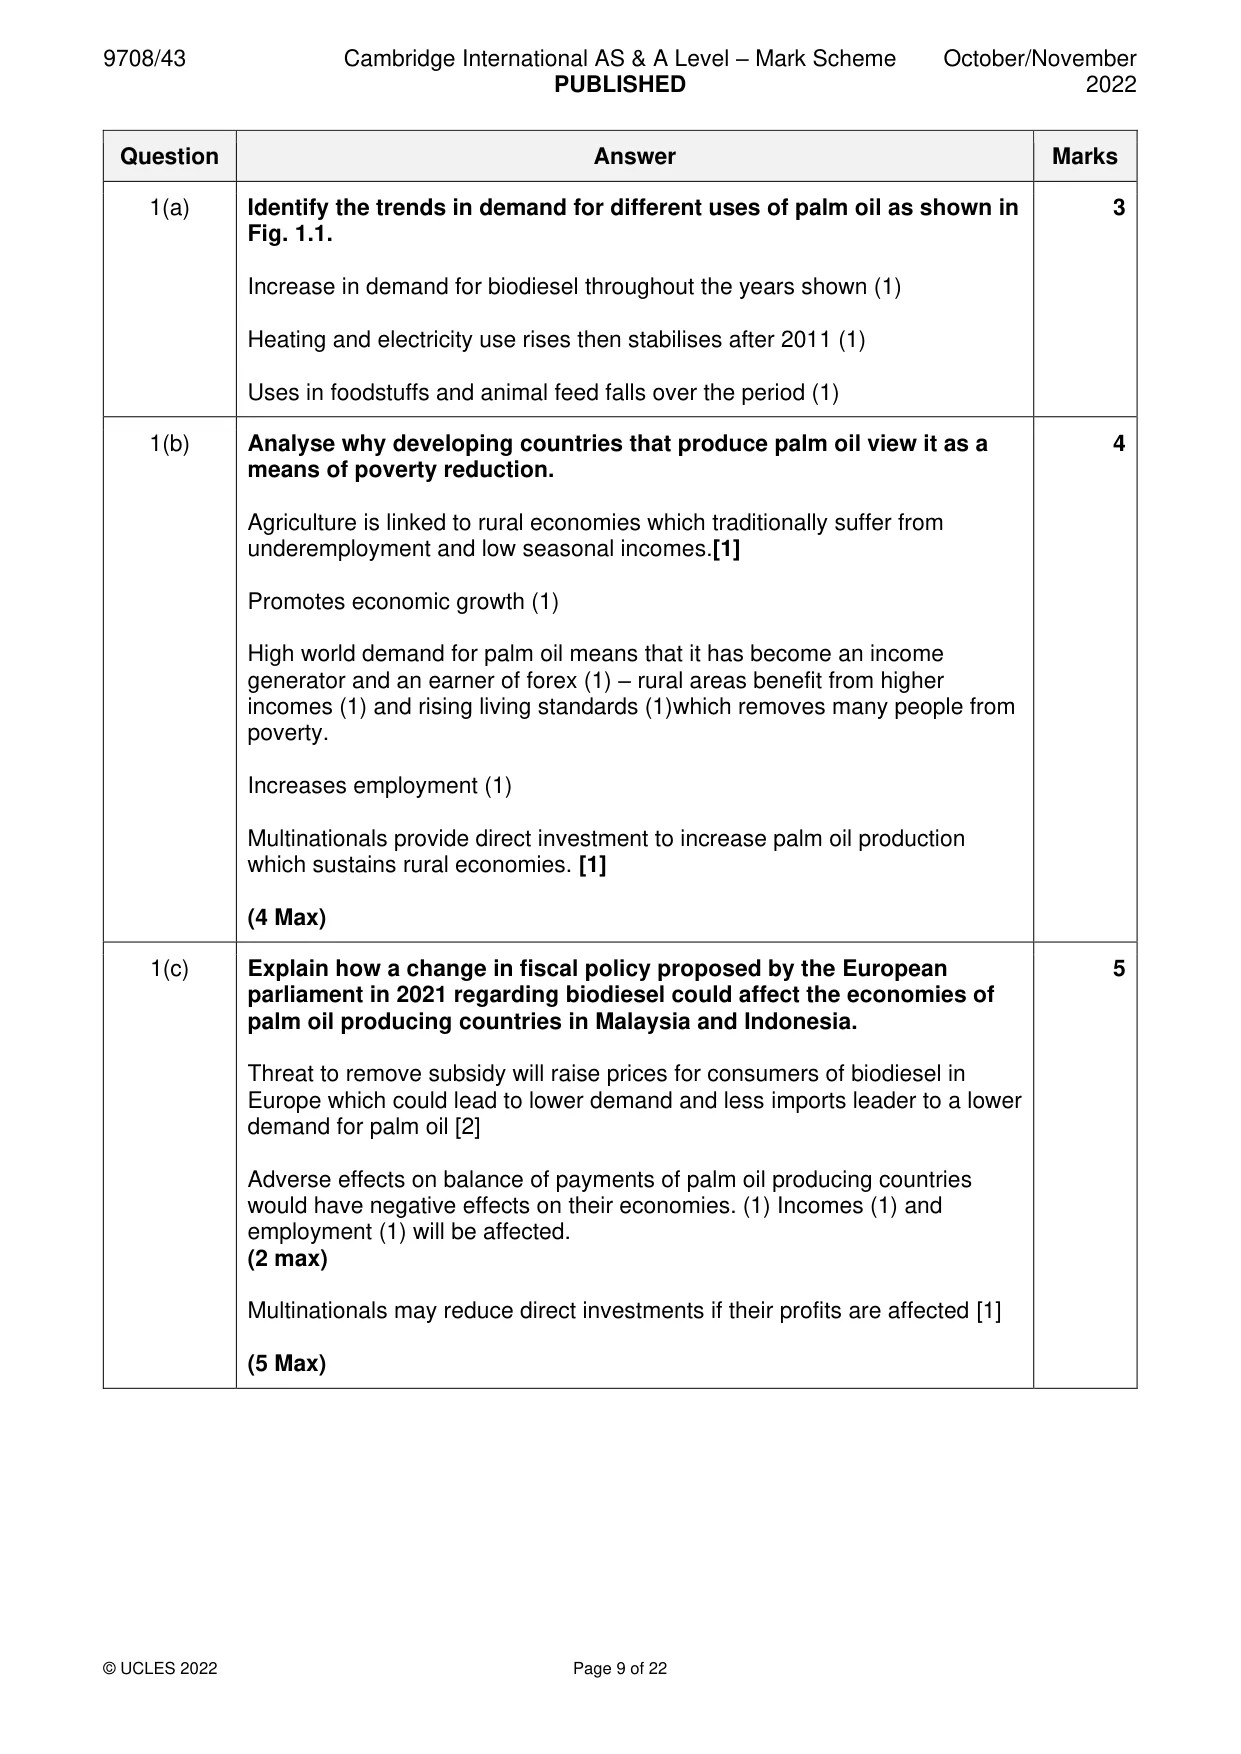
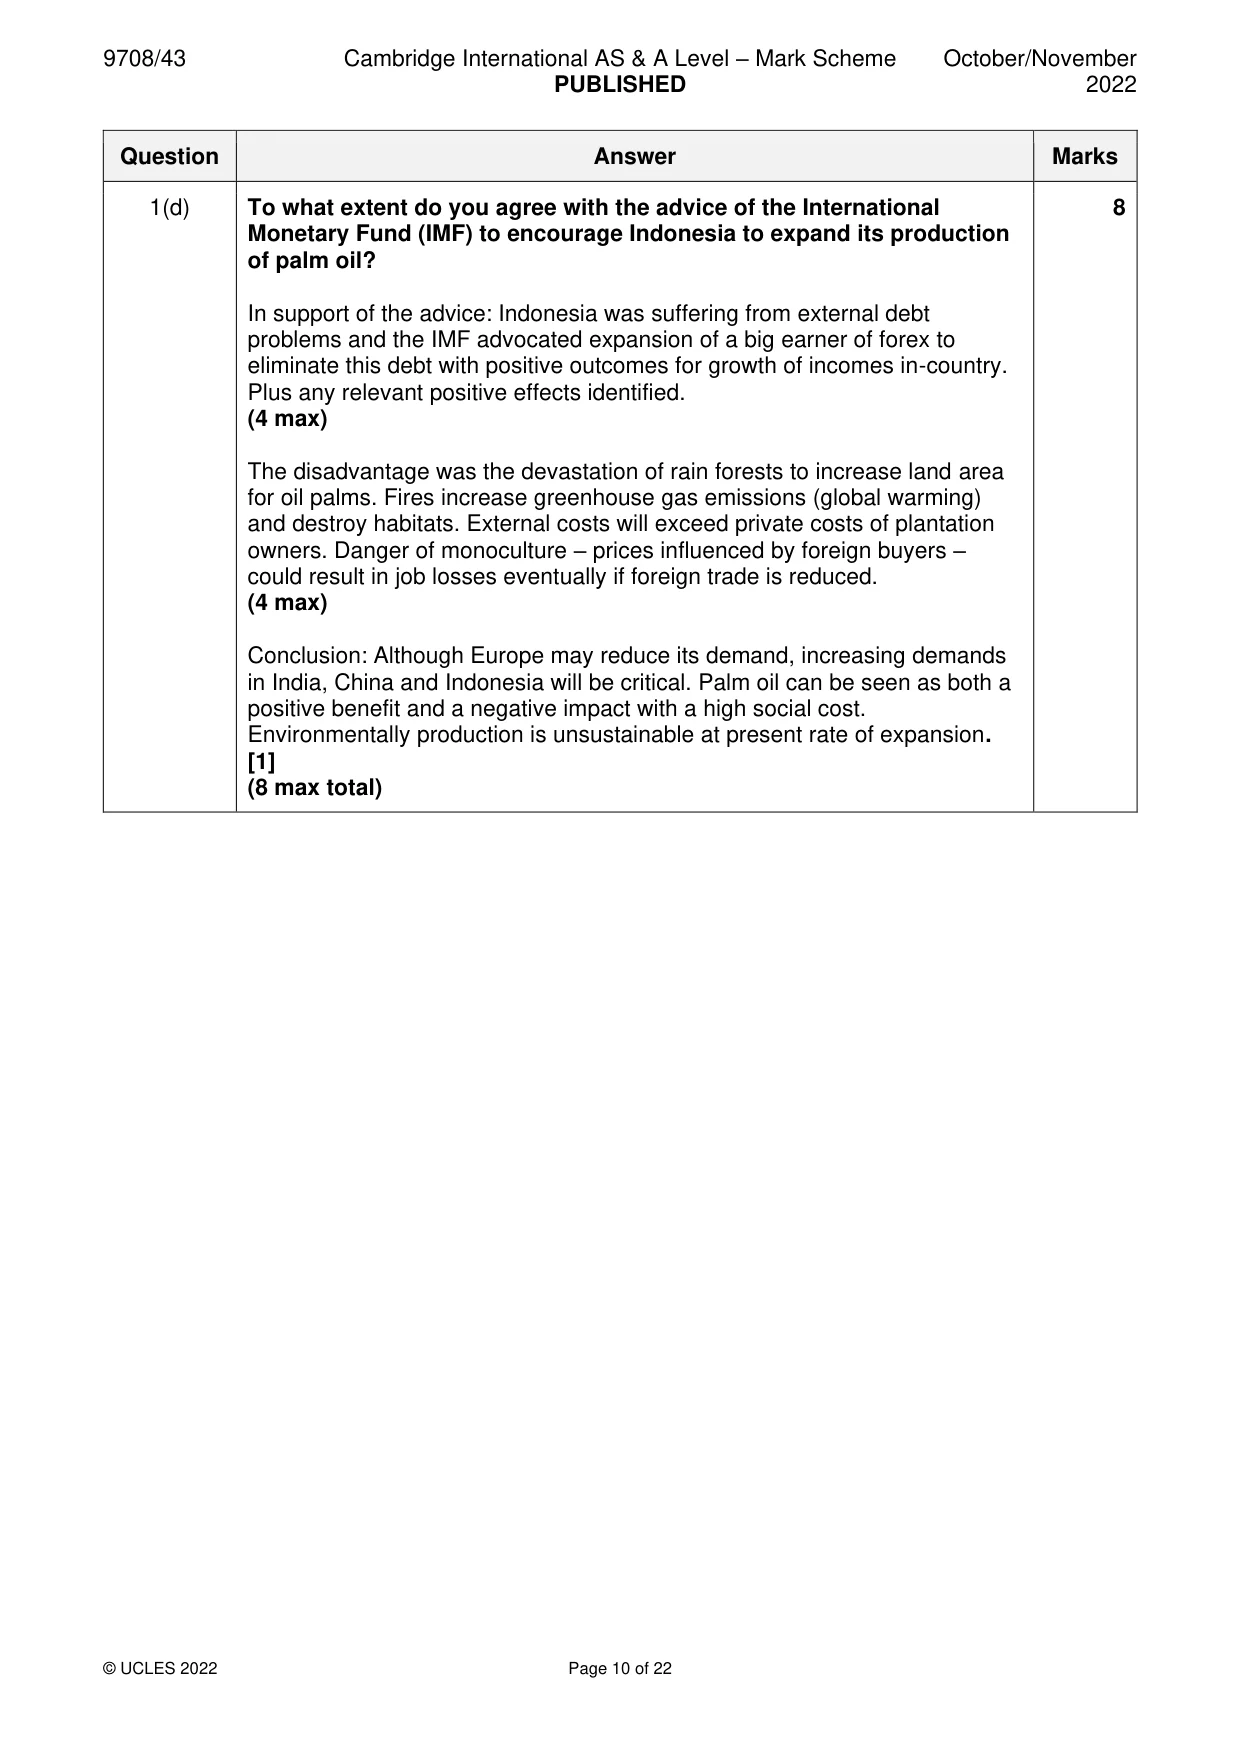
Mark scheme: Question Answer Marks 1(a) Identify the trends in demand for different uses of palm oil as shown in 3 Fig. 1.1. Increase in demand for biodiesel throughout the years shown (1) Heating and electricity use rises then stabilises after 2011 (1) Uses in foodstuffs and animal feed falls over the period (1) 1(b) Analyse why developing countries that produce palm oil view it as a 4 means of poverty reduction. Agriculture is linked to rural economies which traditionally suffer from underemployment and low seasonal incomes.[1] Promotes economic growth (1) High world demand for palm oil means that it has become an income generator and an earner of forex (1) – rural areas benefit from higher incomes (1) and rising living standards (1)which removes many people from poverty. Increases employment (1) Multinationals provide direct investment to increase palm oil production which sustains rural economies. [1] (4 Max) 1(c) Explain how a change in fiscal policy proposed by the European 5 parliament in 2021 regarding biodiesel could affect the economies of palm oil producing countries in Malaysia and Indonesia. Threat to remove subsidy will raise prices for consumers of biodiesel in Europe which could lead to lower demand and less imports leader to a lower demand for palm oil [2] Adverse effects on balance of payments of palm oil producing countries would have negative effects on their economies. (1) Incomes (1) and employment (1) will be affected. (2 max) Multinationals may reduce direct investments if their profits are affected [1] (5 Max) 1(d) To what extent do you agree with the advice of the International 8 Monetary Fund (IMF) to encourage Indonesia to expand its production of palm oil? In support of the advice: Indonesia was suffering from external debt problems and the IMF advocated expansion of a big earner of forex to eliminate this debt with positive outcomes for growth of incomes in-country. Plus any relevant positive effects identified. (4 max) The disadvantage was the devastation of rain forests to increase land area for oil palms. Fires increase greenhouse gas emissions (global warming) and destroy habitats. External costs will exceed private costs of plantation owners. Danger of monoculture – prices influenced by foreign buyers – could result in job losses eventually if foreign trade is reduced. (4 max) Conclusion: Although Europe may reduce its demand, increasing demands in India, China and Indonesia will be critical. Palm oil can be seen as both a positive benefit and a negative impact with a high social cost. Environmentally production is unsustainable at present rate of expansion. [1] (8 max total)
More questions on Private costs and benefits, externalities and social costs and benefits
Q2 · Consider why it is important for a government to use cost benefit analysis when deciding…
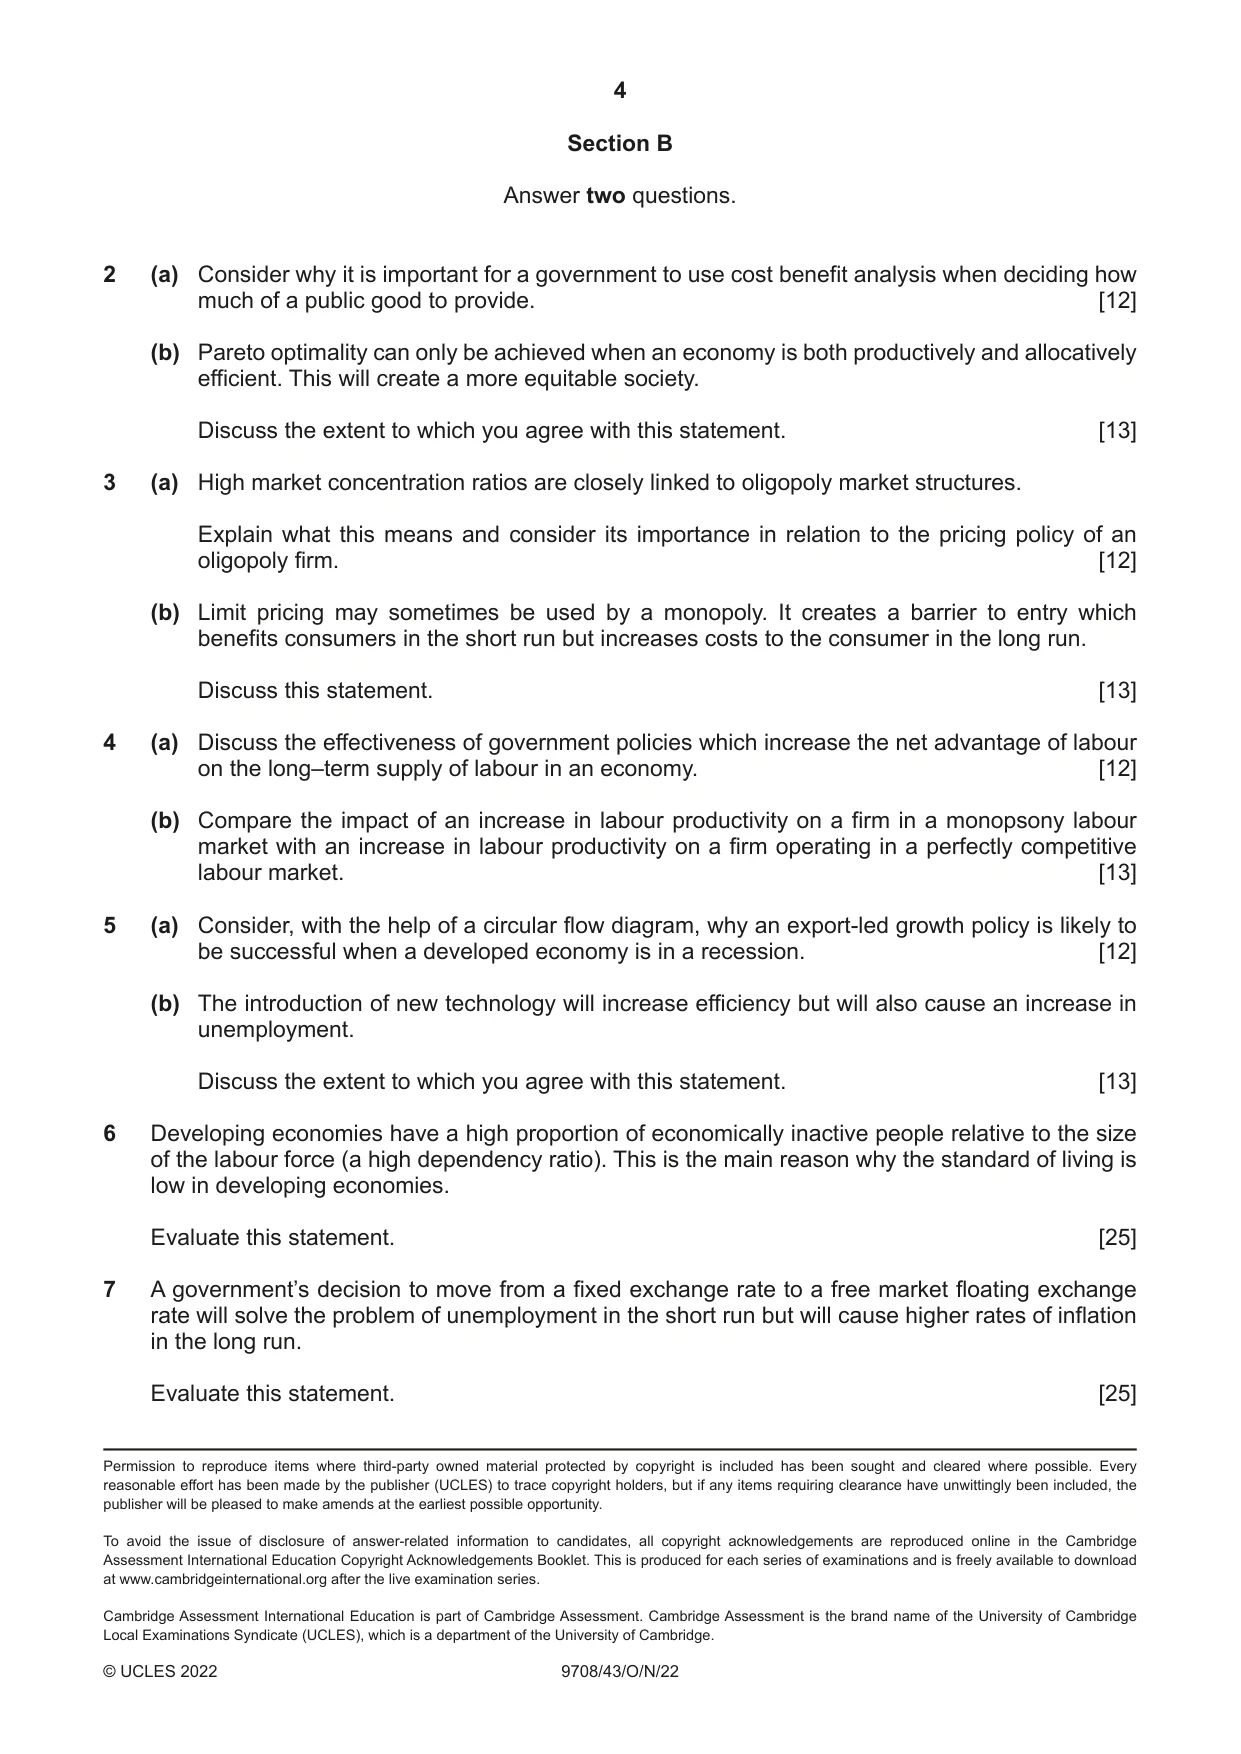
2 (a) Consider why it is important for a government to use cost benefit analysis when deciding how much of a public good to provide. [12] (b) Pareto optimality can only be achieved when an economy is both productively and allocatively efficient. This will create a more equitable society. Discuss the extent to which you agree with this statement. [13]
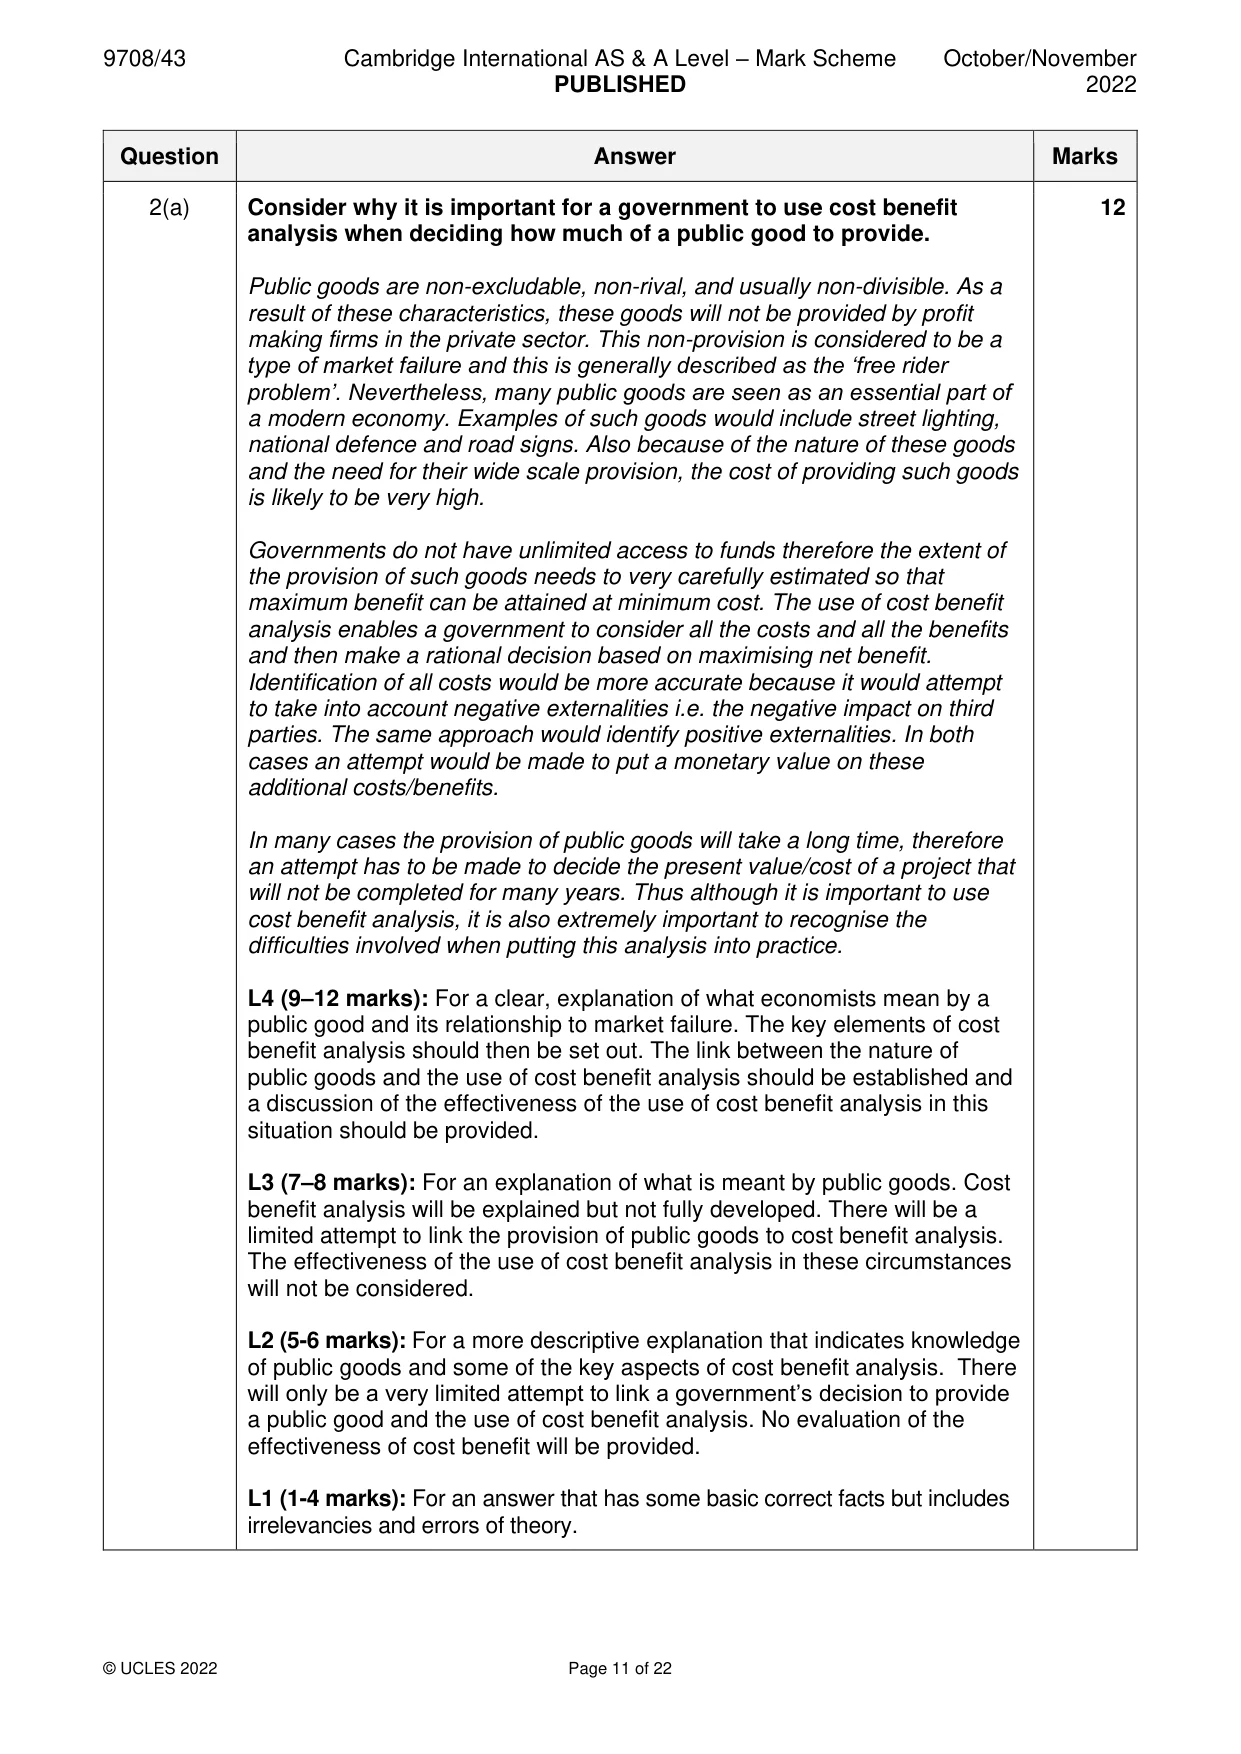
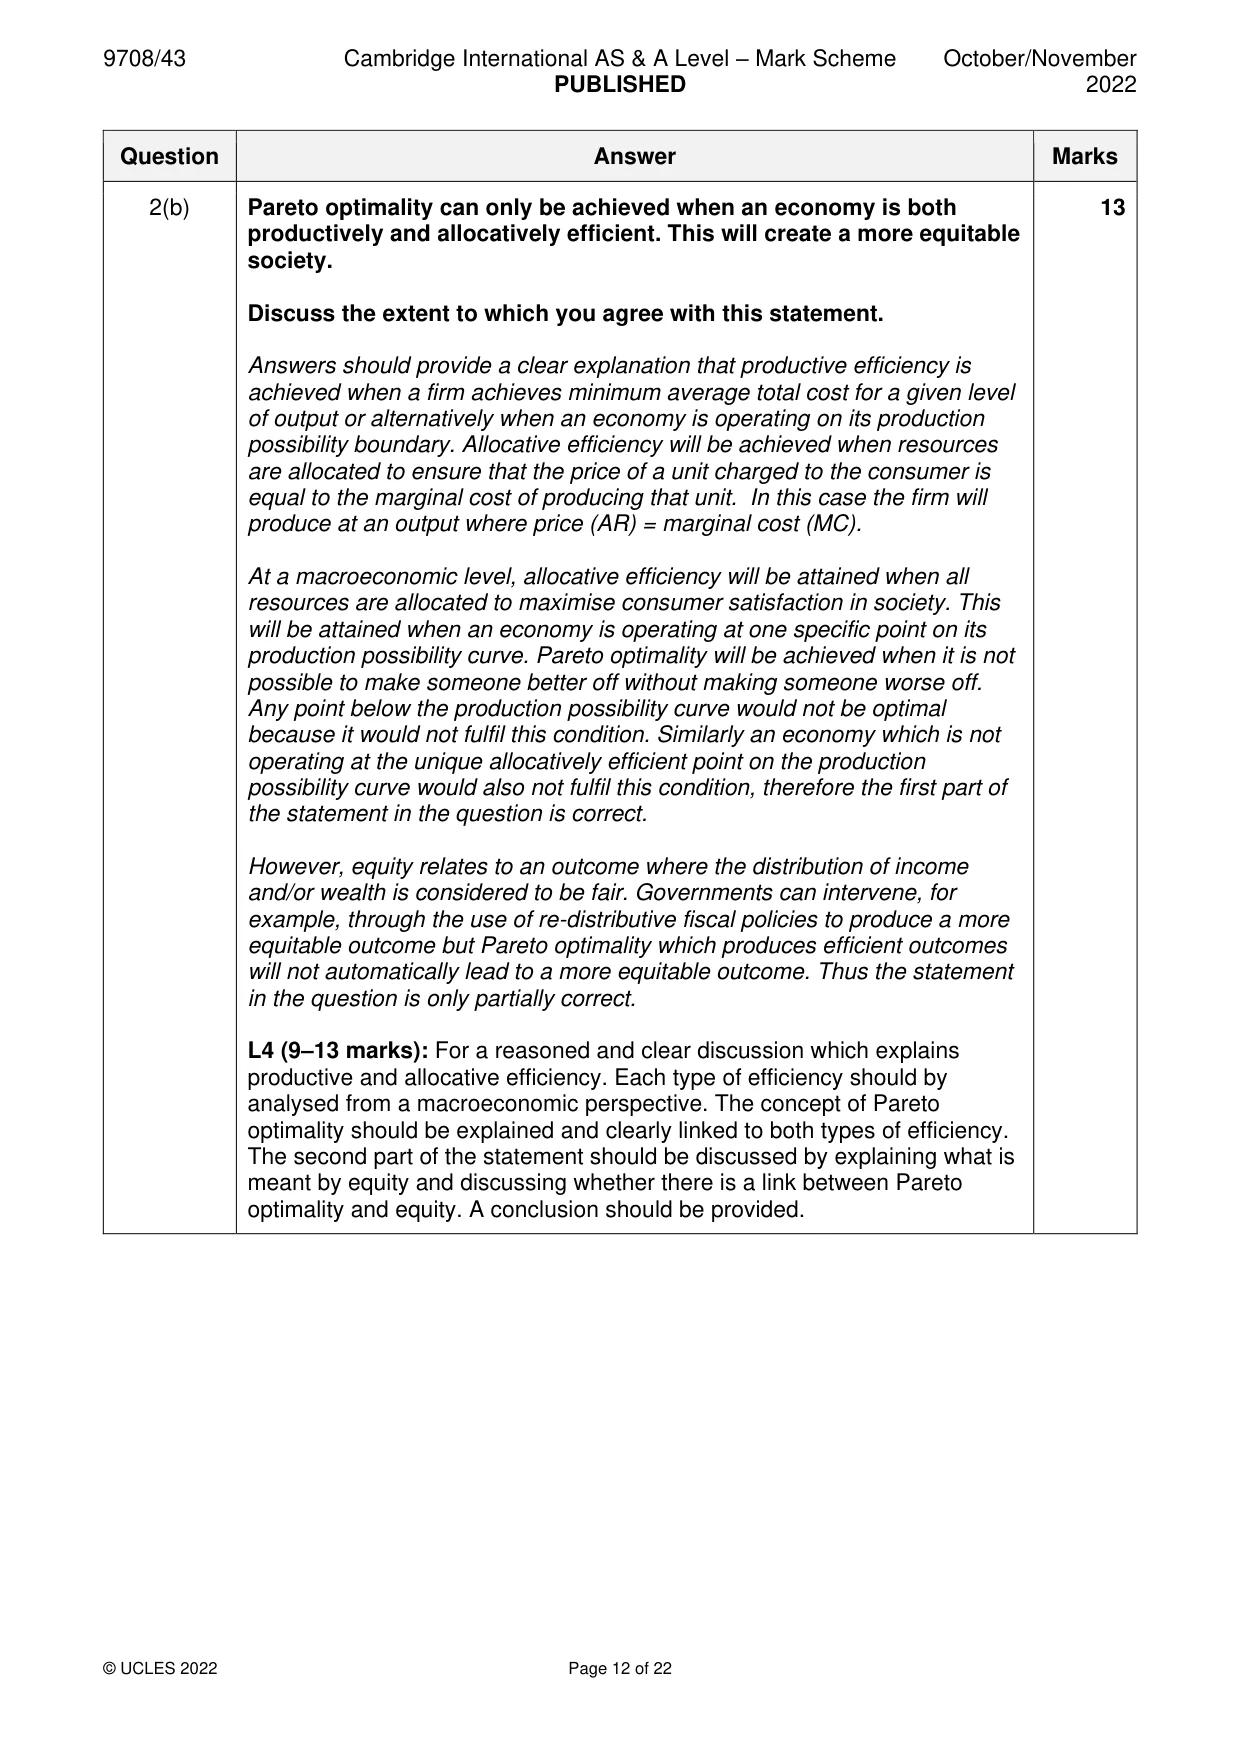
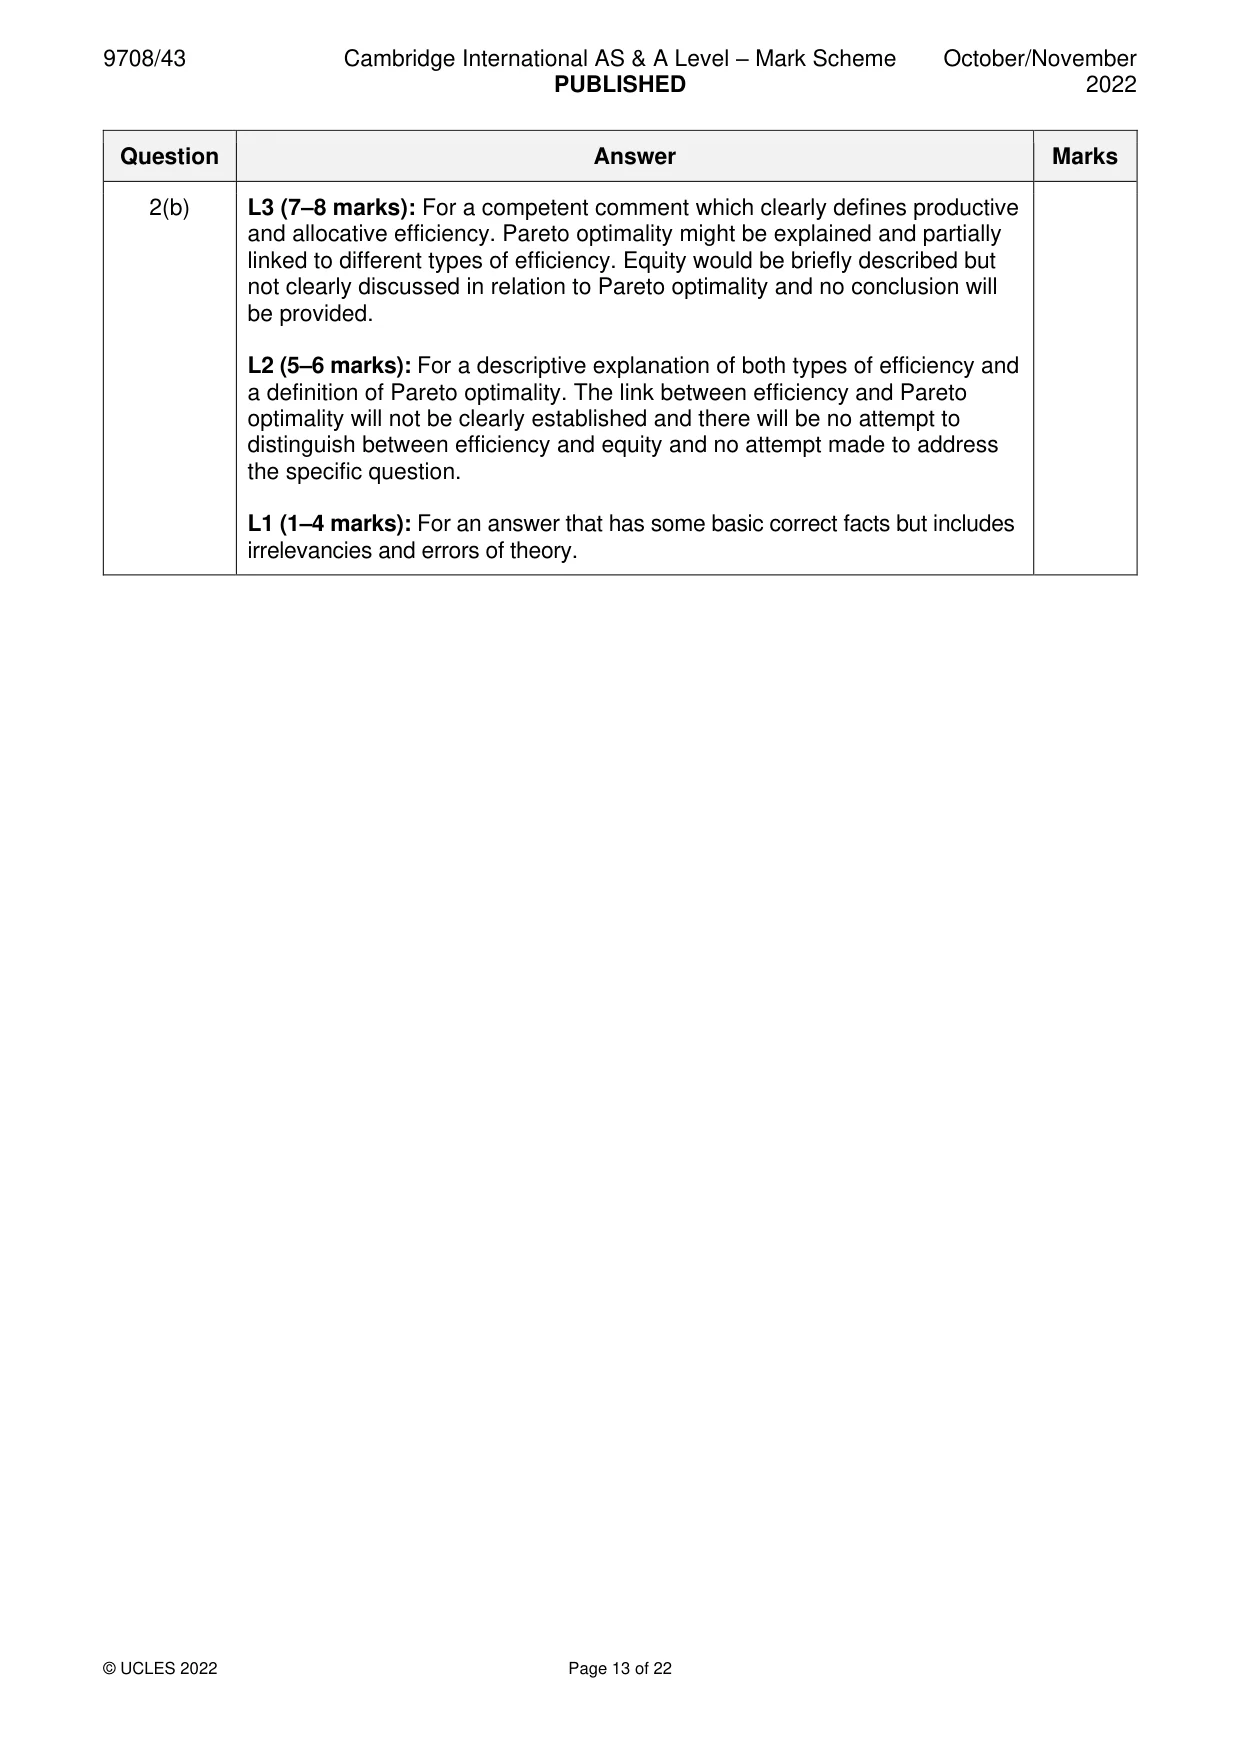
Mark scheme: 2(a) Consider why it is important for a government to use cost benefit 12 analysis when deciding how much of a public good to provide. Public goods are non-excludable, non-rival, and usually non-divisible. As a result of these characteristics, these goods will not be provided by profit making firms in the private sector. This non-provision is considered to be a type of market failure and this is generally described as the ‘free rider problem’. Nevertheless, many public goods are seen as an essential part of a modern economy. Examples of such goods would include street lighting, national defence and road signs. Also because of the nature of these goods and the need for their wide scale provision, the cost of providing such goods is likely to be very high. Governments do not have unlimited access to funds therefore the extent of the provision of such goods needs to very carefully estimated so that maximum benefit can be attained at minimum cost. The use of cost benefit analysis enables a government to consider all the costs and all the benefits and then make a rational decision based on maximising net benefit. Identification of all costs would be more accurate because it would attempt to take into account negative externalities i.e. the negative impact on third parties. The same approach would identify positive externalities. In both cases an attempt would be made to put a monetary value on these additional costs/benefits. In many cases the provision of public goods will take a long time, therefore an attempt has to be made to decide the present value/cost of a project that will not be completed for many years. Thus although it is important to use cost benefit analysis, it is also extremely important to recognise the difficulties involved when putting this analysis into practice. L4 (9–12 marks): For a clear, explanation of what economists mean by a public good and its relationship to market failure. The key elements of cost benefit analysis should then be set out. The link between the nature of public goods and the use of cost benefit analysis should be established and a discussion of the effectiveness of the use of cost benefit analysis in this situation should be provided. L3 (7–8 marks): For an explanation of what is meant by public goods. Cost benefit analysis will be explained but not fully developed. There will be a limited attempt to link the provision of public goods to cost benefit analysis. The effectiveness of the use of cost benefit analysis in these circumstances will not be considered. L2 (5-6 marks): For a more descriptive explanation that indicates knowledge of public goods and some of the key aspects of cost benefit analysis. There will only be a very limited attempt to link a government’s decision to provide a public good and the use of cost benefit analysis. No evaluation of the effectiveness of cost benefit will be provided. L1 (1-4 marks): For an answer that has some basic correct facts but includes irrelevancies and errors of theory. 2(b) Pareto optimality can only be achieved when an economy is both 13 productively and allocatively efficient. This will create a more equitable society. Discuss the extent to which you agree with this statement. Answers should provide a clear explanation that productive efficiency is achieved when a firm achieves minimum average total cost for a given level of output or alternatively when an economy is operating on its production possibility boundary. Allocative efficiency will be achieved when resources are allocated to ensure that the price of a unit charged to the consumer is equal to the marginal cost of producing that unit. In this case the firm will produce at an output where price (AR) = marginal cost (MC). At a macroeconomic level, allocative efficiency will be attained when all resources are allocated to maximise consumer satisfaction in society. This will be attained when an economy is operating at one specific point on its production possibility curve. Pareto optimality will be achieved when it is not possible to make someone better off without making someone worse off. Any point below the production possibility curve would not be optimal because it would not fulfil this condition. Similarly an economy which is not operating at the unique allocatively efficient point on the production possibility curve would also not fulfil this condition, therefore the first part of the statement in the question is correct. However, equity relates to an outcome where the distribution of income and/or wealth is considered to be fair. Governments can intervene, for example, through the use of re-distributive fiscal policies to produce a more equitable outcome but Pareto optimality which produces efficient outcomes will not automatically lead to a more equitable outcome. Thus the statement in the question is only partially correct. L4 (9–13 marks): For a reasoned and clear discussion which explains productive and allocative efficiency. Each type of efficiency should by analysed from a macroeconomic perspective. The concept of Pareto optimality should be explained and clearly linked to both types of efficiency. The second part of the statement should be discussed by explaining what is meant by equity and discussing whether there is a link between Pareto optimality and equity. A conclusion should be provided. 2(b) L3 (7–8 marks): For a competent comment which clearly defines productive and allocative efficiency. Pareto optimality might be explained and partially linked to different types of efficiency. Equity would be briefly described but not clearly discussed in relation to Pareto optimality and no conclusion will be provided. L2 (5–6 marks): For a descriptive explanation of both types of efficiency and a definition of Pareto optimality. The link between efficiency and Pareto optimality will not be clearly established and there will be no attempt to distinguish between efficiency and equity and no attempt made to address the specific question. L1 (1–4 marks): For an answer that has some basic correct facts but includes irrelevancies and errors of theory.
Q3 · High market concentration ratios are closely linked to oligopoly market structures
3 (a) High market concentration ratios are closely linked to oligopoly market structures. Explain what this means and consider its importance in relation to the pricing policy of an oligopoly firm. [12] (b) Limit pricing may sometimes be used by a monopoly. It creates a barrier to entry which benefits consumers in the short run but increases costs to the consumer in the long run. Discuss this statement. [13]
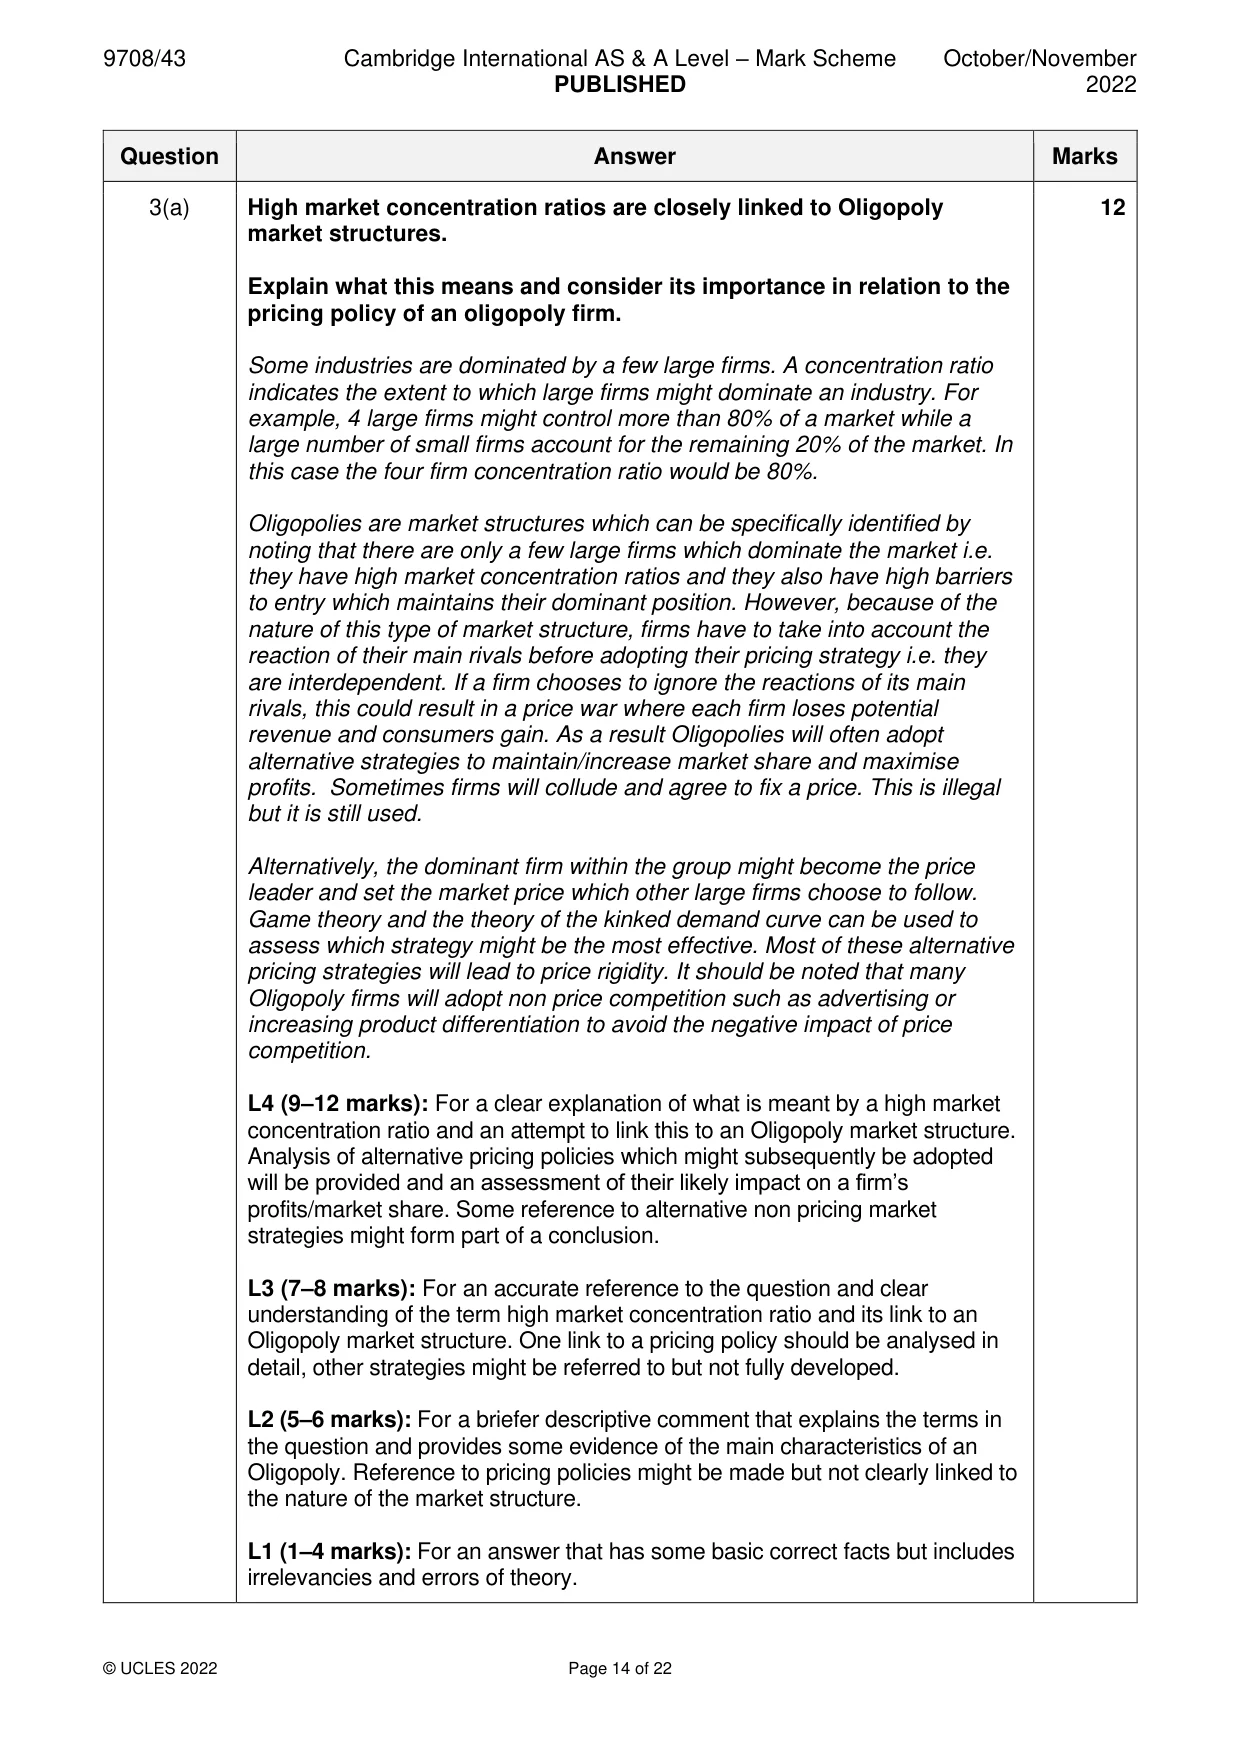
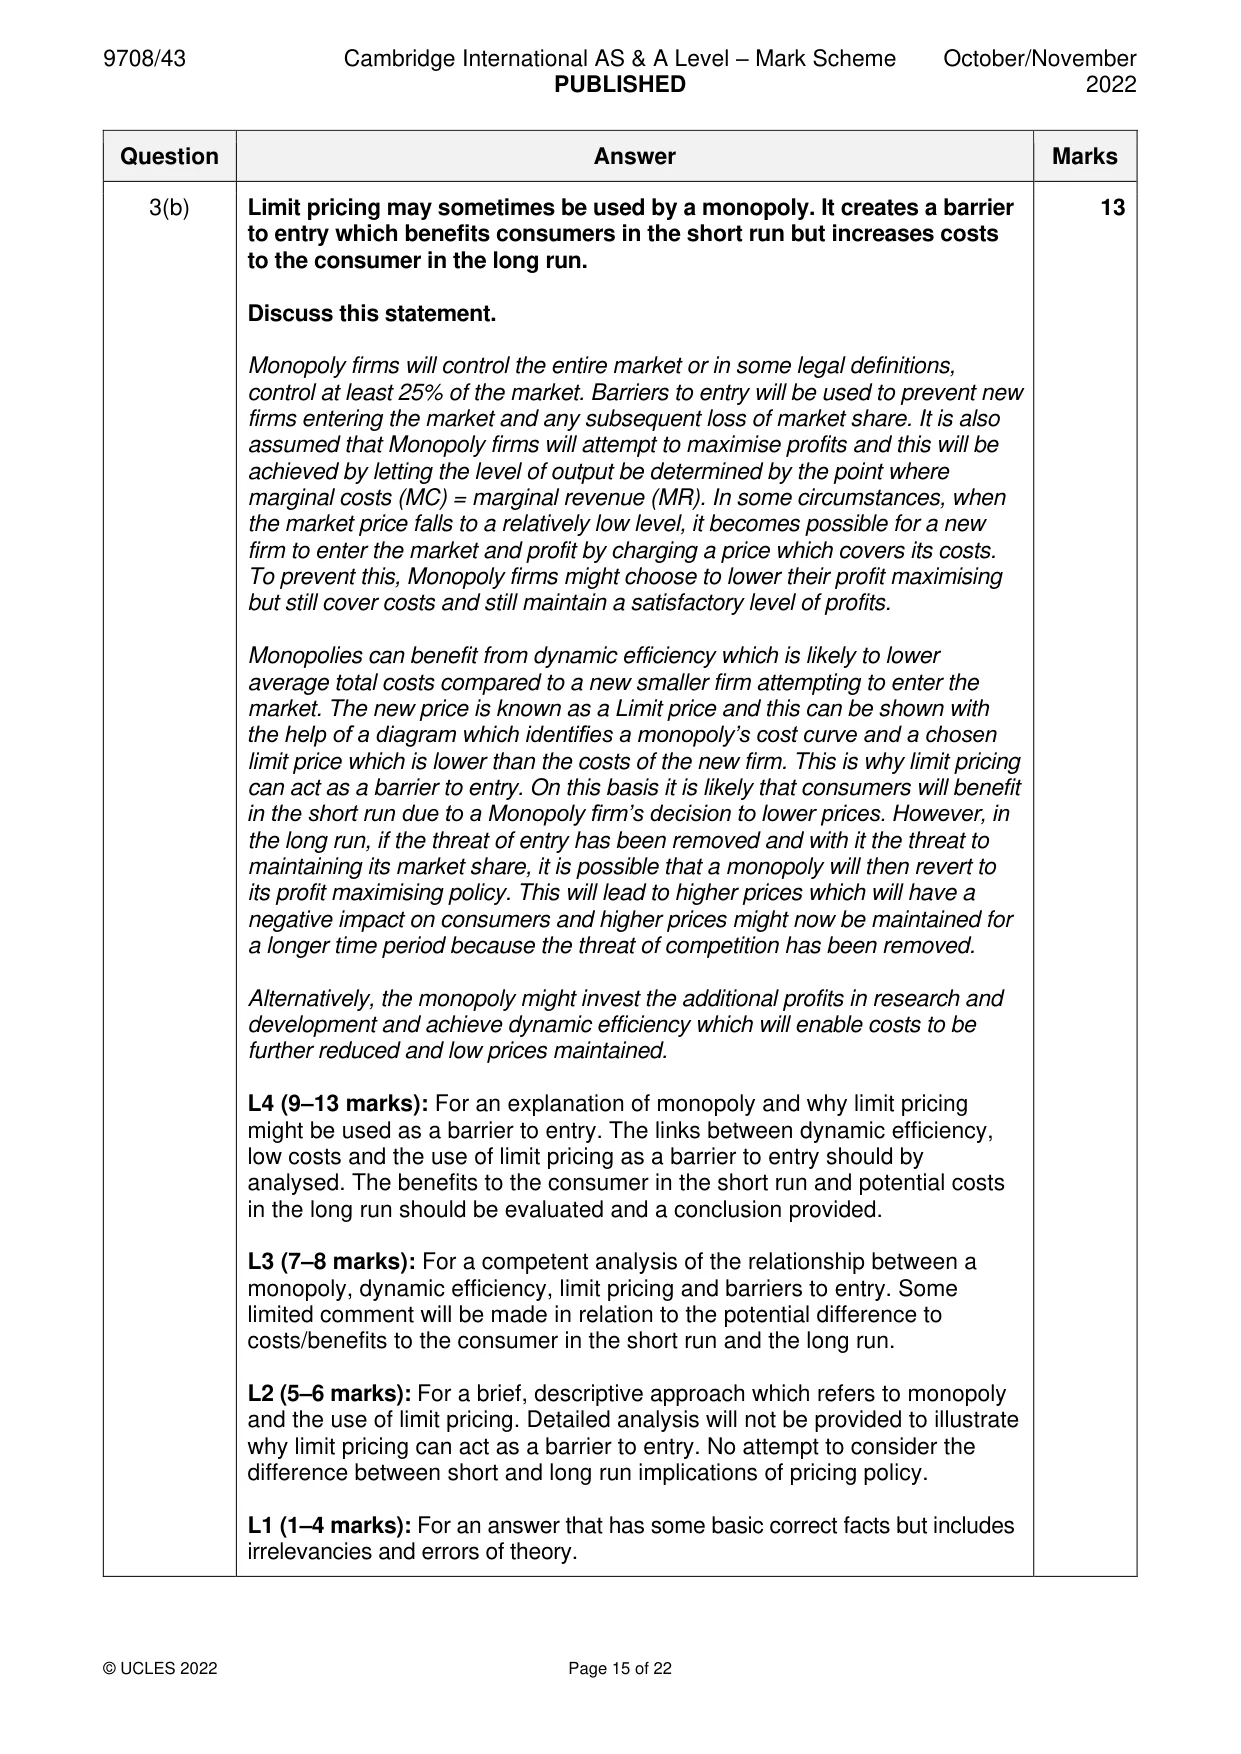
Mark scheme: 3(a) High market concentration ratios are closely linked to Oligopoly 12 market structures. Explain what this means and consider its importance in relation to the pricing policy of an oligopoly firm. Some industries are dominated by a few large firms. A concentration ratio indicates the extent to which large firms might dominate an industry. For example, 4 large firms might control more than 80% of a market while a large number of small firms account for the remaining 20% of the market. In this case the four firm concentration ratio would be 80%. Oligopolies are market structures which can be specifically identified by noting that there are only a few large firms which dominate the market i.e. they have high market concentration ratios and they also have high barriers to entry which maintains their dominant position. However, because of the nature of this type of market structure, firms have to take into account the reaction of their main rivals before adopting their pricing strategy i.e. they are interdependent. If a firm chooses to ignore the reactions of its main rivals, this could result in a price war where each firm loses potential revenue and consumers gain. As a result Oligopolies will often adopt alternative strategies to maintain/increase market share and maximise profits. Sometimes firms will collude and agree to fix a price. This is illegal but it is still used. Alternatively, the dominant firm within the group might become the price leader and set the market price which other large firms choose to follow. Game theory and the theory of the kinked demand curve can be used to assess which strategy might be the most effective. Most of these alternative pricing strategies will lead to price rigidity. It should be noted that many Oligopoly firms will adopt non price competition such as advertising or increasing product differentiation to avoid the negative impact of price competition. L4 (9–12 marks): For a clear explanation of what is meant by a high market concentration ratio and an attempt to link this to an Oligopoly market structure. Analysis of alternative pricing policies which might subsequently be adopted will be provided and an assessment of their likely impact on a firm’s profits/market share. Some reference to alternative non pricing market strategies might form part of a conclusion. L3 (7–8 marks): For an accurate reference to the question and clear understanding of the term high market concentration ratio and its link to an Oligopoly market structure. One link to a pricing policy should be analysed in detail, other strategies might be referred to but not fully developed. L2 (5–6 marks): For a briefer descriptive comment that explains the terms in the question and provides some evidence of the main characteristics of an Oligopoly. Reference to pricing policies might be made but not clearly linked to the nature of the market structure. L1 (1–4 marks): For an answer that has some basic correct facts but includes irrelevancies and errors of theory. 3(b) Limit pricing may sometimes be used by a monopoly. It creates a barrier 13 to entry which benefits consumers in the short run but increases costs to the consumer in the long run. Discuss this statement. Monopoly firms will control the entire market or in some legal definitions, control at least 25% of the market. Barriers to entry will be used to prevent new firms entering the market and any subsequent loss of market share. It is also assumed that Monopoly firms will attempt to maximise profits and this will be achieved by letting the level of output be determined by the point where marginal costs (MC) = marginal revenue (MR). In some circumstances, when the market price falls to a relatively low level, it becomes possible for a new firm to enter the market and profit by charging a price which covers its costs. To prevent this, Monopoly firms might choose to lower their profit maximising but still cover costs and still maintain a satisfactory level of profits. Monopolies can benefit from dynamic efficiency which is likely to lower average total costs compared to a new smaller firm attempting to enter the market. The new price is known as a Limit price and this can be shown with the help of a diagram which identifies a monopoly’s cost curve and a chosen limit price which is lower than the costs of the new firm. This is why limit pricing can act as a barrier to entry. On this basis it is likely that consumers will benefit in the short run due to a Monopoly firm’s decision to lower prices. However, in the long run, if the threat of entry has been removed and with it the threat to maintaining its market share, it is possible that a monopoly will then revert to its profit maximising policy. This will lead to higher prices which will have a negative impact on consumers and higher prices might now be maintained for a longer time period because the threat of competition has been removed. Alternatively, the monopoly might invest the additional profits in research and development and achieve dynamic efficiency which will enable costs to be further reduced and low prices maintained. L4 (9–13 marks): For an explanation of monopoly and why limit pricing might be used as a barrier to entry. The links between dynamic efficiency, low costs and the use of limit pricing as a barrier to entry should by analysed. The benefits to the consumer in the short run and potential costs in the long run should be evaluated and a conclusion provided. L3 (7–8 marks): For a competent analysis of the relationship between a monopoly, dynamic efficiency, limit pricing and barriers to entry. Some limited comment will be made in relation to the potential difference to costs/benefits to the consumer in the short run and the long run. L2 (5–6 marks): For a brief, descriptive approach which refers to monopoly and the use of limit pricing. Detailed analysis will not be provided to illustrate why limit pricing can act as a barrier to entry. No attempt to consider the difference between short and long run implications of pricing policy. L1 (1–4 marks): For an answer that has some basic correct facts but includes irrelevancies and errors of theory.
Q4 · Discuss the effectiveness of government policies which increase the net advantage of…
4 (a) Discuss the effectiveness of government policies which increase the net advantage of labour on the long–term supply of labour in an economy. [12] (b) Compare the impact of an increase in labour productivity on a firm in a monopsony labour market with an increase in labour productivity on a firm operating in a perfectly competitive labour market. [13]
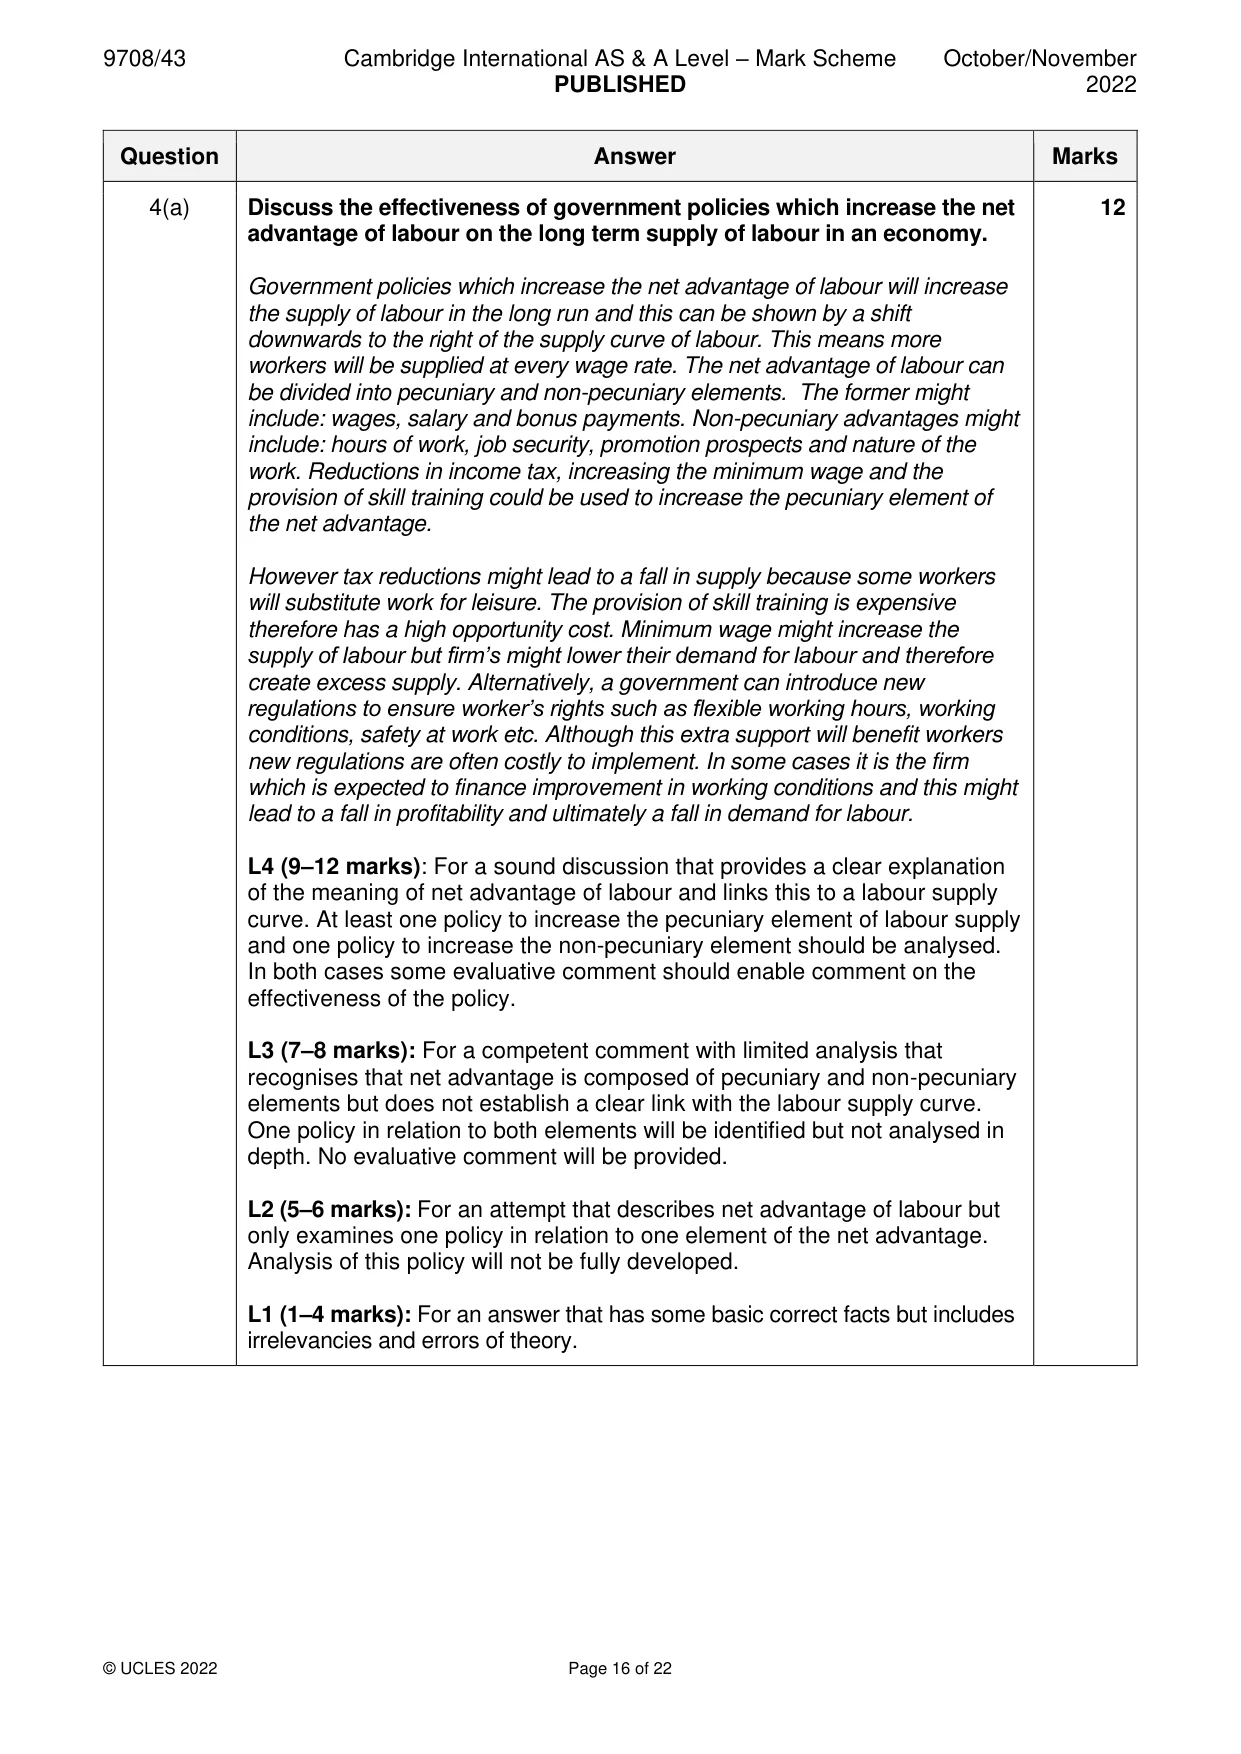
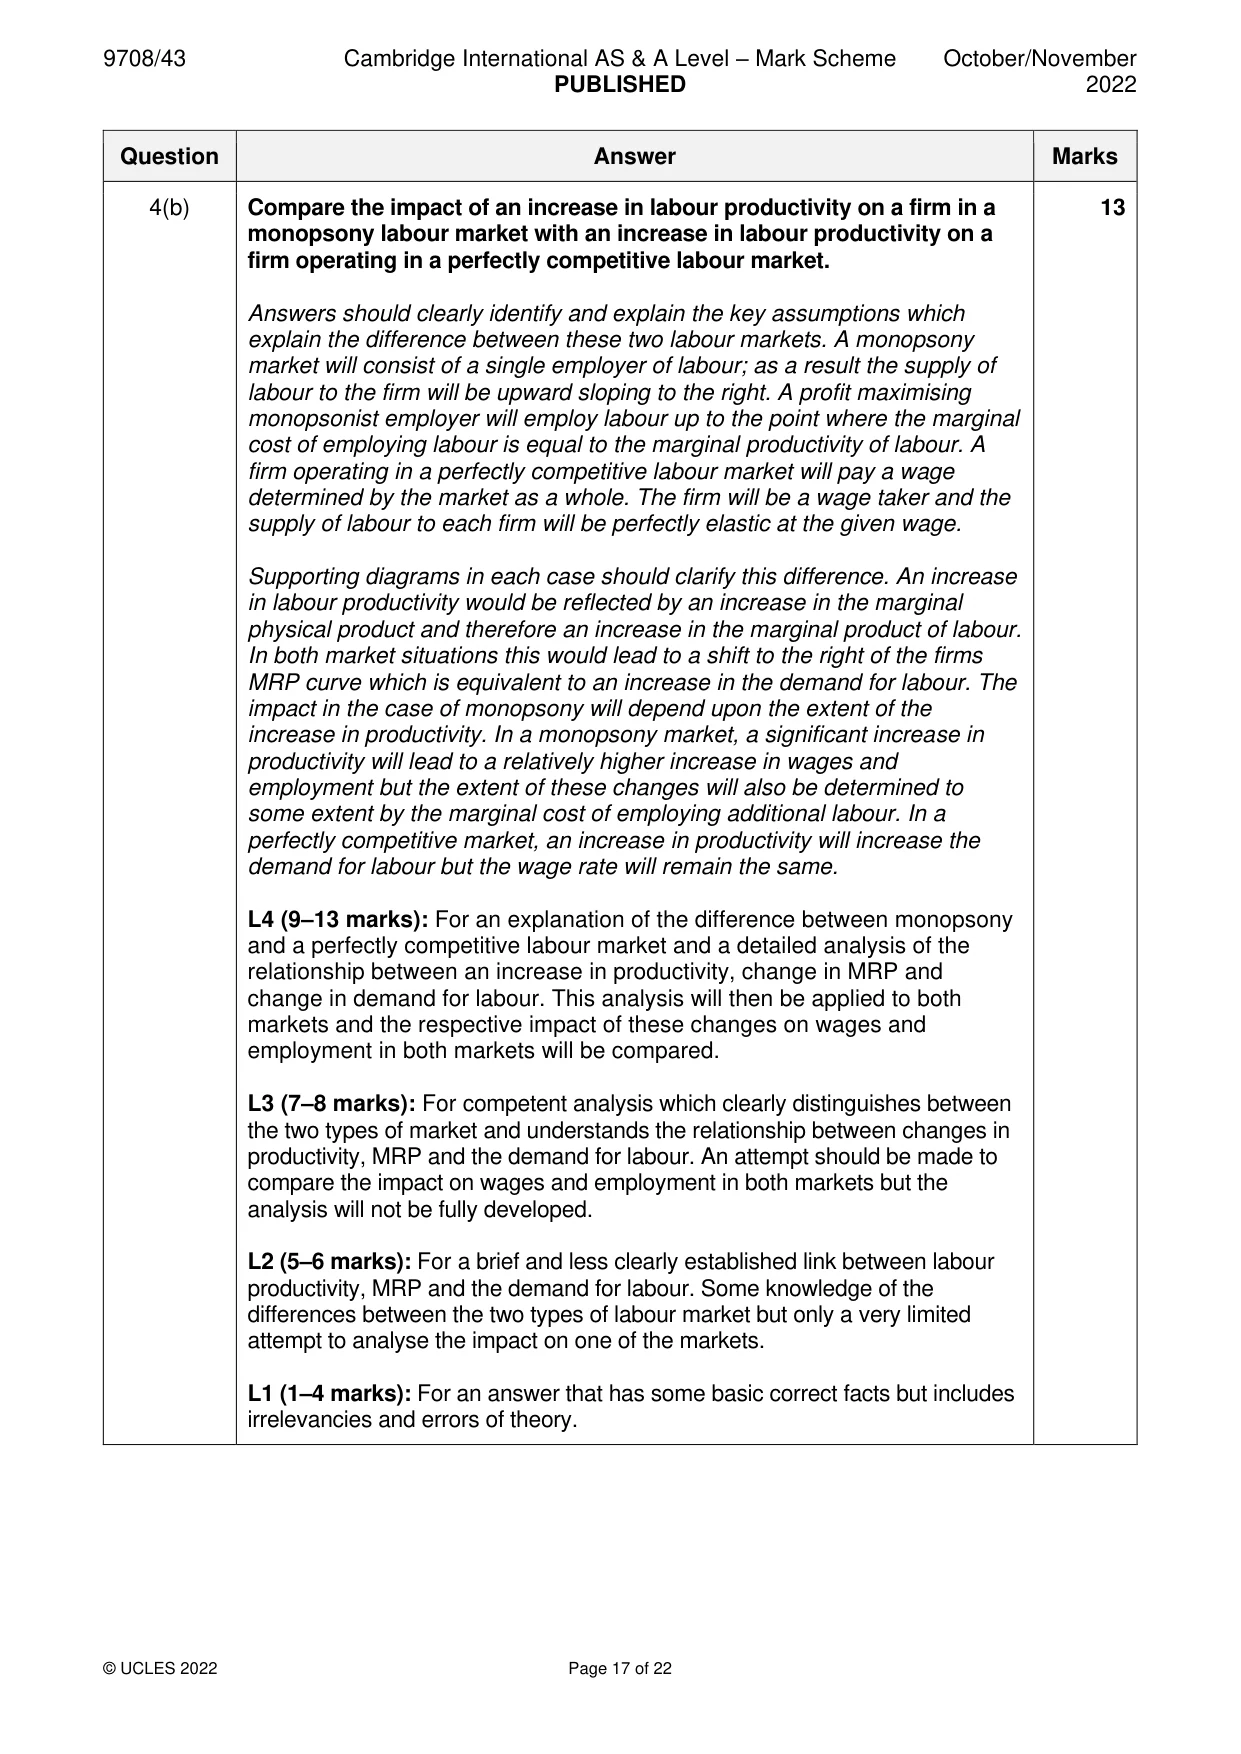
Mark scheme: 4(a) Discuss the effectiveness of government policies which increase the net 12 advantage of labour on the long term supply of labour in an economy. Government policies which increase the net advantage of labour will increase the supply of labour in the long run and this can be shown by a shift downwards to the right of the supply curve of labour. This means more workers will be supplied at every wage rate. The net advantage of labour can be divided into pecuniary and non-pecuniary elements. The former might include: wages, salary and bonus payments. Non-pecuniary advantages might include: hours of work, job security, promotion prospects and nature of the work. Reductions in income tax, increasing the minimum wage and the provision of skill training could be used to increase the pecuniary element of the net advantage. However tax reductions might lead to a fall in supply because some workers will substitute work for leisure. The provision of skill training is expensive therefore has a high opportunity cost. Minimum wage might increase the supply of labour but firm’s might lower their demand for labour and therefore create excess supply. Alternatively, a government can introduce new regulations to ensure worker’s rights such as flexible working hours, working conditions, safety at work etc. Although this extra support will benefit workers new regulations are often costly to implement. In some cases it is the firm which is expected to finance improvement in working conditions and this might lead to a fall in profitability and ultimately a fall in demand for labour. L4 (9–12 marks): For a sound discussion that provides a clear explanation of the meaning of net advantage of labour and links this to a labour supply curve. At least one policy to increase the pecuniary element of labour supply and one policy to increase the non-pecuniary element should be analysed. In both cases some evaluative comment should enable comment on the effectiveness of the policy. L3 (7–8 marks): For a competent comment with limited analysis that recognises that net advantage is composed of pecuniary and non-pecuniary elements but does not establish a clear link with the labour supply curve. One policy in relation to both elements will be identified but not analysed in depth. No evaluative comment will be provided. L2 (5–6 marks): For an attempt that describes net advantage of labour but only examines one policy in relation to one element of the net advantage. Analysis of this policy will not be fully developed. L1 (1–4 marks): For an answer that has some basic correct facts but includes irrelevancies and errors of theory. 4(b) Compare the impact of an increase in labour productivity on a firm in a 13 monopsony labour market with an increase in labour productivity on a firm operating in a perfectly competitive labour market. Answers should clearly identify and explain the key assumptions which explain the difference between these two labour markets. A monopsony market will consist of a single employer of labour; as a result the supply of labour to the firm will be upward sloping to the right. A profit maximising monopsonist employer will employ labour up to the point where the marginal cost of employing labour is equal to the marginal productivity of labour. A firm operating in a perfectly competitive labour market will pay a wage determined by the market as a whole. The firm will be a wage taker and the supply of labour to each firm will be perfectly elastic at the given wage. Supporting diagrams in each case should clarify this difference. An increase in labour productivity would be reflected by an increase in the marginal physical product and therefore an increase in the marginal product of labour. In both market situations this would lead to a shift to the right of the firms MRP curve which is equivalent to an increase in the demand for labour. The impact in the case of monopsony will depend upon the extent of the increase in productivity. In a monopsony market, a significant increase in productivity will lead to a relatively higher increase in wages and employment but the extent of these changes will also be determined to some extent by the marginal cost of employing additional labour. In a perfectly competitive market, an increase in productivity will increase the demand for labour but the wage rate will remain the same. L4 (9–13 marks): For an explanation of the difference between monopsony and a perfectly competitive labour market and a detailed analysis of the relationship between an increase in productivity, change in MRP and change in demand for labour. This analysis will then be applied to both markets and the respective impact of these changes on wages and employment in both markets will be compared. L3 (7–8 marks): For competent analysis which clearly distinguishes between the two types of market and understands the relationship between changes in productivity, MRP and the demand for labour. An attempt should be made to compare the impact on wages and employment in both markets but the analysis will not be fully developed. L2 (5–6 marks): For a brief and less clearly established link between labour productivity, MRP and the demand for labour. Some knowledge of the differences between the two types of labour market but only a very limited attempt to analyse the impact on one of the markets. L1 (1–4 marks): For an answer that has some basic correct facts but includes irrelevancies and errors of theory.
Q5 · Consider, with the help of a circular flow diagram, why an export-led growth policy is…
5 (a) Consider, with the help of a circular flow diagram, why an export-led growth policy is likely to be successful when a developed economy is in a recession. [12] (b) The introduction of new technology will increase efficiency but will also cause an increase in unemployment. Discuss the extent to which you agree with this statement. [13]
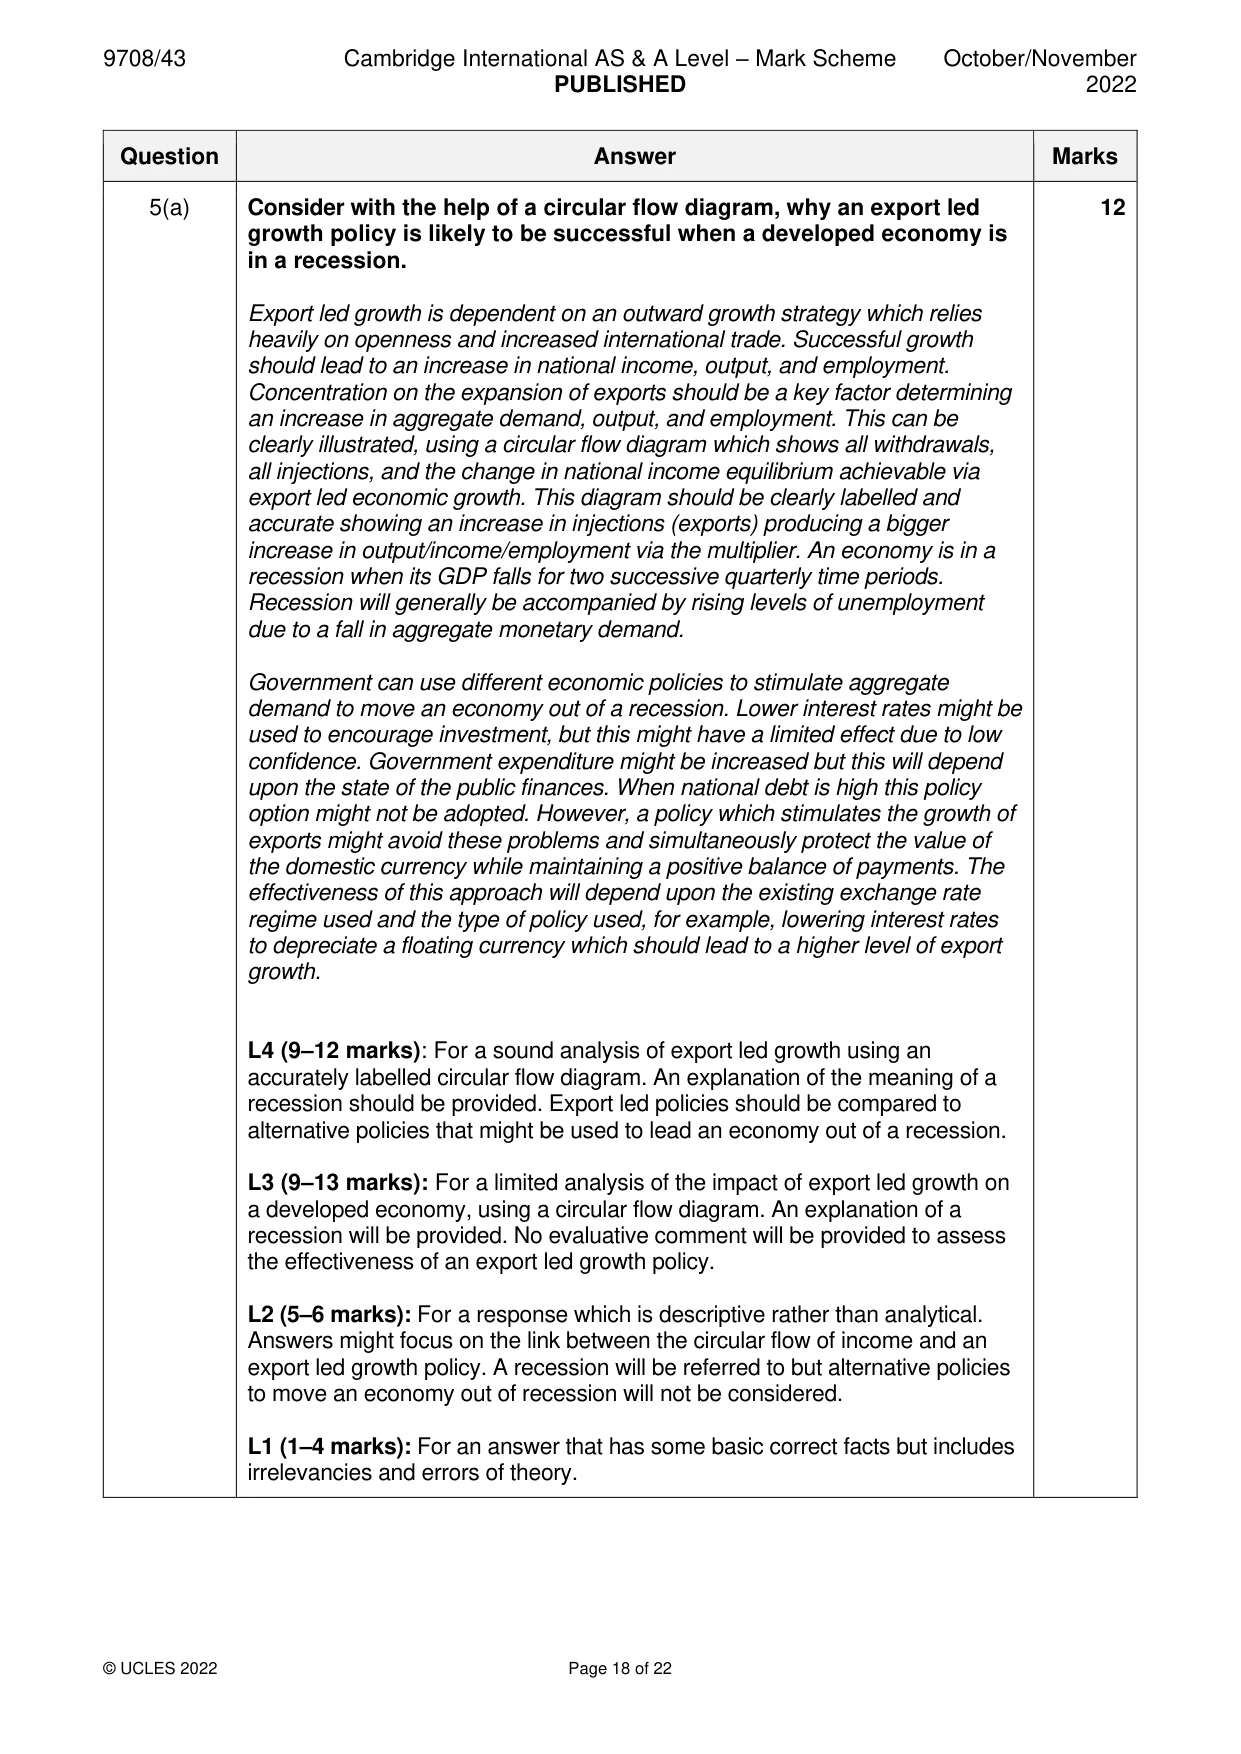
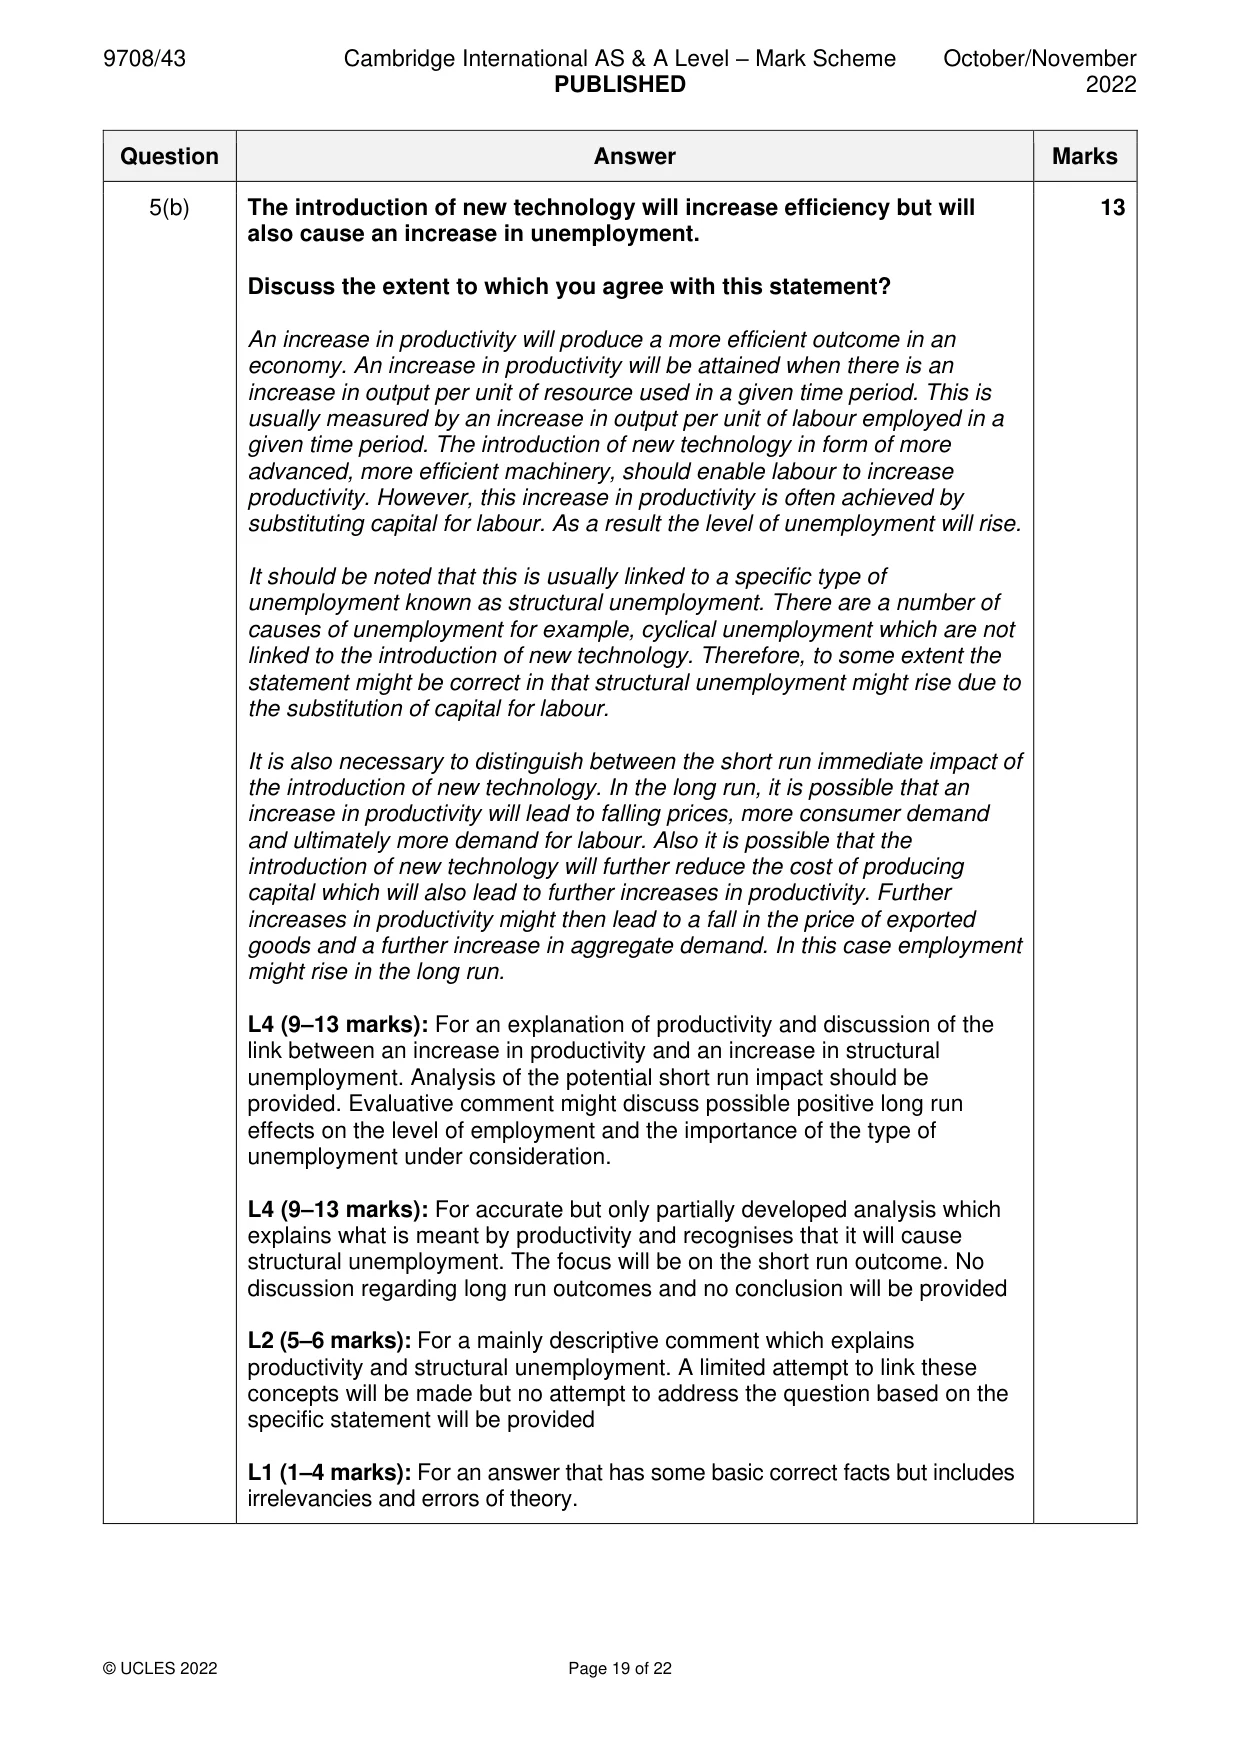
Mark scheme: 5(a) Consider with the help of a circular flow diagram, why an export led 12 growth policy is likely to be successful when a developed economy is in a recession. Export led growth is dependent on an outward growth strategy which relies heavily on openness and increased international trade. Successful growth should lead to an increase in national income, output, and employment. Concentration on the expansion of exports should be a key factor determining an increase in aggregate demand, output, and employment. This can be clearly illustrated, using a circular flow diagram which shows all withdrawals, all injections, and the change in national income equilibrium achievable via export led economic growth. This diagram should be clearly labelled and accurate showing an increase in injections (exports) producing a bigger increase in output/income/employment via the multiplier. An economy is in a recession when its GDP falls for two successive quarterly time periods. Recession will generally be accompanied by rising levels of unemployment due to a fall in aggregate monetary demand. Government can use different economic policies to stimulate aggregate demand to move an economy out of a recession. Lower interest rates might be used to encourage investment, but this might have a limited effect due to low confidence. Government expenditure might be increased but this will depend upon the state of the public finances. When national debt is high this policy option might not be adopted. However, a policy which stimulates the growth of exports might avoid these problems and simultaneously protect the value of the domestic currency while maintaining a positive balance of payments. The effectiveness of this approach will depend upon the existing exchange rate regime used and the type of policy used, for example, lowering interest rates to depreciate a floating currency which should lead to a higher level of export growth. L4 (9–12 marks): For a sound analysis of export led growth using an accurately labelled circular flow diagram. An explanation of the meaning of a recession should be provided. Export led policies should be compared to alternative policies that might be used to lead an economy out of a recession. L3 (9–13 marks): For a limited analysis of the impact of export led growth on a developed economy, using a circular flow diagram. An explanation of a recession will be provided. No evaluative comment will be provided to assess the effectiveness of an export led growth policy. L2 (5–6 marks): For a response which is descriptive rather than analytical. Answers might focus on the link between the circular flow of income and an export led growth policy. A recession will be referred to but alternative policies to move an economy out of recession will not be considered. L1 (1–4 marks): For an answer that has some basic correct facts but includes irrelevancies and errors of theory. 5(b) The introduction of new technology will increase efficiency but will 13 also cause an increase in unemployment. Discuss the extent to which you agree with this statement? An increase in productivity will produce a more efficient outcome in an economy. An increase in productivity will be attained when there is an increase in output per unit of resource used in a given time period. This is usually measured by an increase in output per unit of labour employed in a given time period. The introduction of new technology in form of more advanced, more efficient machinery, should enable labour to increase productivity. However, this increase in productivity is often achieved by substituting capital for labour. As a result the level of unemployment will rise. It should be noted that this is usually linked to a specific type of unemployment known as structural unemployment. There are a number of causes of unemployment for example, cyclical unemployment which are not linked to the introduction of new technology. Therefore, to some extent the statement might be correct in that structural unemployment might rise due to the substitution of capital for labour. It is also necessary to distinguish between the short run immediate impact of the introduction of new technology. In the long run, it is possible that an increase in productivity will lead to falling prices, more consumer demand and ultimately more demand for labour. Also it is possible that the introduction of new technology will further reduce the cost of producing capital which will also lead to further increases in productivity. Further increases in productivity might then lead to a fall in the price of exported goods and a further increase in aggregate demand. In this case employment might rise in the long run. L4 (9–13 marks): For an explanation of productivity and discussion of the link between an increase in productivity and an increase in structural unemployment. Analysis of the potential short run impact should be provided. Evaluative comment might discuss possible positive long run effects on the level of employment and the importance of the type of unemployment under consideration. L4 (9–13 marks): For accurate but only partially developed analysis which explains what is meant by productivity and recognises that it will cause structural unemployment. The focus will be on the short run outcome. No discussion regarding long run outcomes and no conclusion will be provided L2 (5–6 marks): For a mainly descriptive comment which explains productivity and structural unemployment. A limited attempt to link these concepts will be made but no attempt to address the question based on the specific statement will be provided L1 (1–4 marks): For an answer that has some basic correct facts but includes irrelevancies and errors of theory.
Q6 · Developing economies have a high proportion of economically inactive people relative to…
6 Developing economies have a high proportion of economically inactive people relative to the size of the labour force (a high dependency ratio). This is the main reason why the standard of living is low in developing economies. Evaluate this statement. [25]
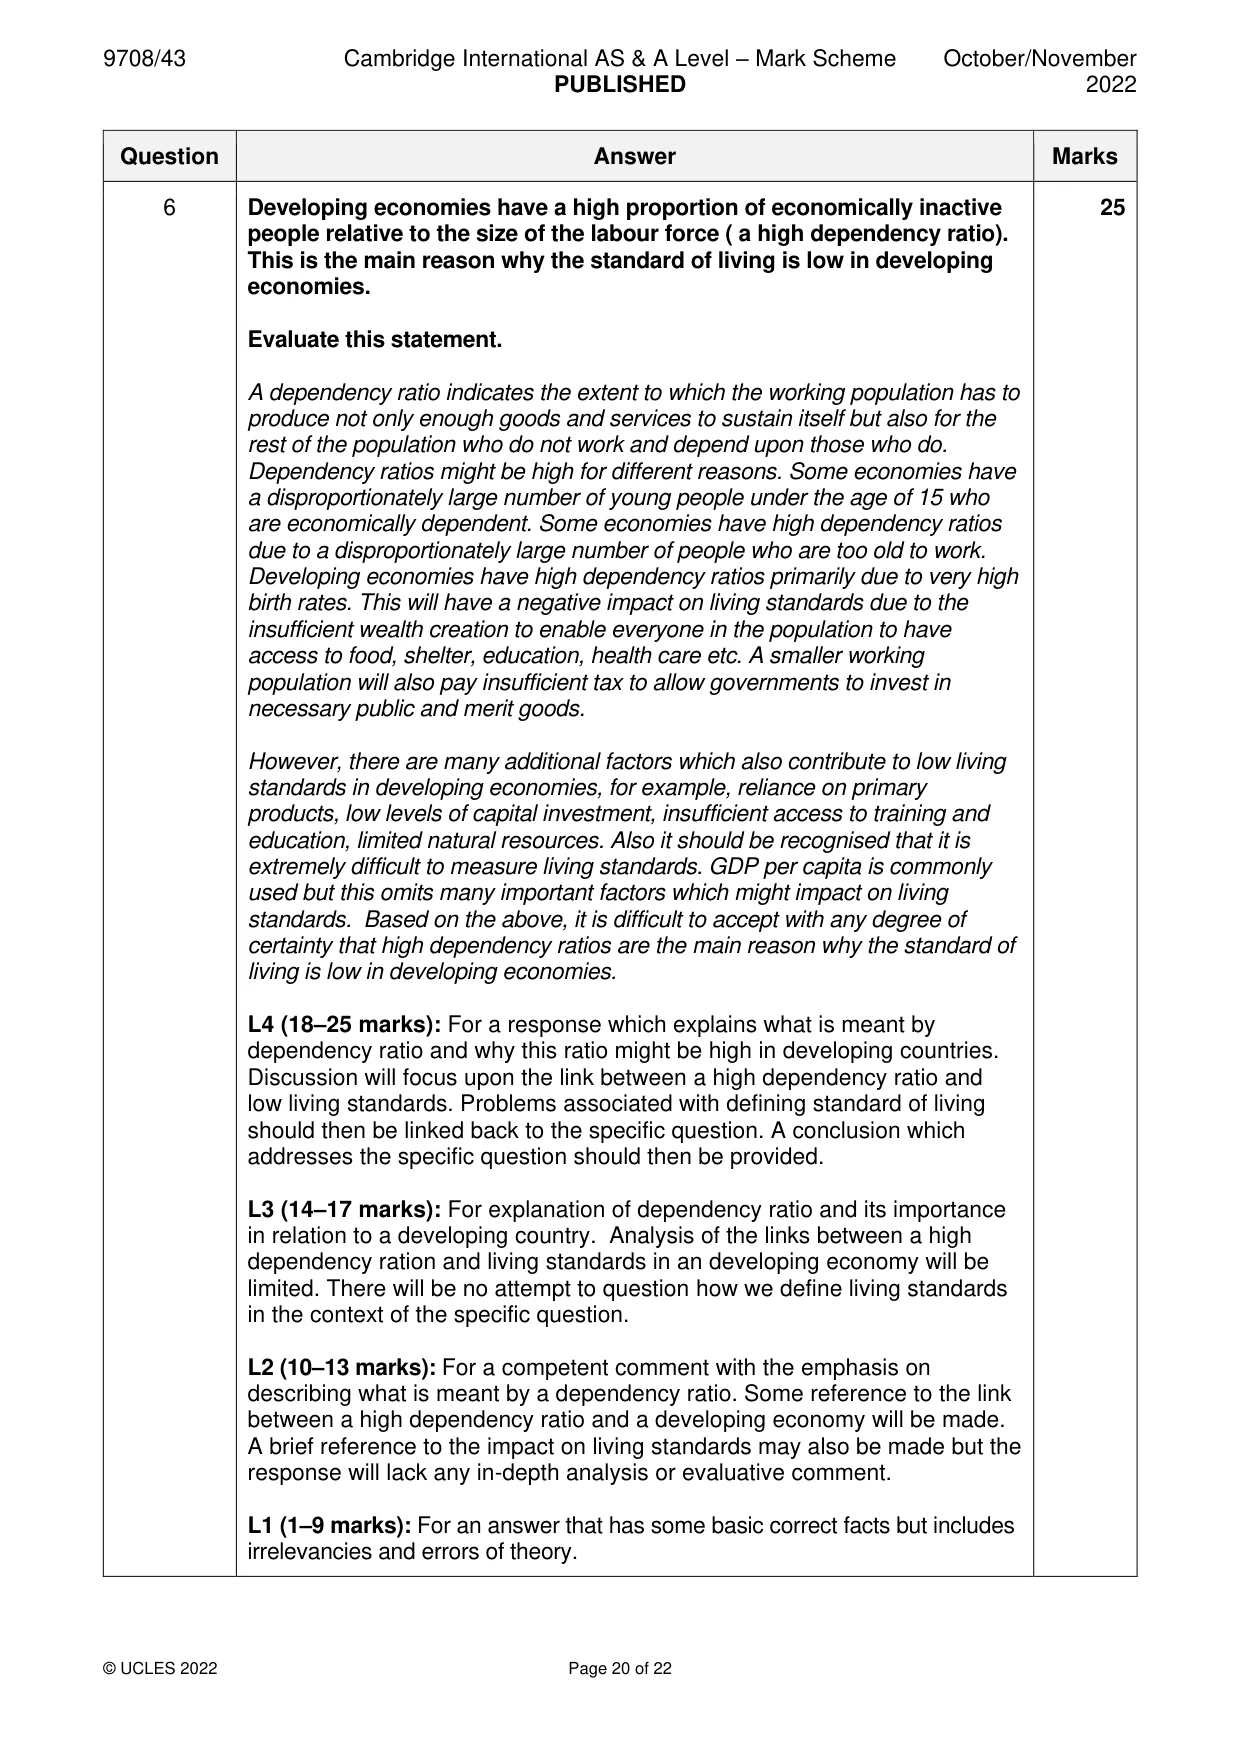
Mark scheme: 6 Developing economies have a high proportion of economically inactive 25 people relative to the size of the labour force ( a high dependency ratio). This is the main reason why the standard of living is low in developing economies. Evaluate this statement. A dependency ratio indicates the extent to which the working population has to produce not only enough goods and services to sustain itself but also for the rest of the population who do not work and depend upon those who do. Dependency ratios might be high for different reasons. Some economies have a disproportionately large number of young people under the age of 15 who are economically dependent. Some economies have high dependency ratios due to a disproportionately large number of people who are too old to work. Developing economies have high dependency ratios primarily due to very high birth rates. This will have a negative impact on living standards due to the insufficient wealth creation to enable everyone in the population to have access to food, shelter, education, health care etc. A smaller working population will also pay insufficient tax to allow governments to invest in necessary public and merit goods. However, there are many additional factors which also contribute to low living standards in developing economies, for example, reliance on primary products, low levels of capital investment, insufficient access to training and education, limited natural resources. Also it should be recognised that it is extremely difficult to measure living standards. GDP per capita is commonly used but this omits many important factors which might impact on living standards. Based on the above, it is difficult to accept with any degree of certainty that high dependency ratios are the main reason why the standard of living is low in developing economies. L4 (18–25 marks): For a response which explains what is meant by dependency ratio and why this ratio might be high in developing countries. Discussion will focus upon the link between a high dependency ratio and low living standards. Problems associated with defining standard of living should then be linked back to the specific question. A conclusion which addresses the specific question should then be provided. L3 (14–17 marks): For explanation of dependency ratio and its importance in relation to a developing country. Analysis of the links between a high dependency ration and living standards in an developing economy will be limited. There will be no attempt to question how we define living standards in the context of the specific question. L2 (10–13 marks): For a competent comment with the emphasis on describing what is meant by a dependency ratio. Some reference to the link between a high dependency ratio and a developing economy will be made. A brief reference to the impact on living standards may also be made but the response will lack any in-depth analysis or evaluative comment. L1 (1–9 marks): For an answer that has some basic correct facts but includes irrelevancies and errors of theory.
Q7 · A government’s decision to move from a fixed exchange rate to a free market floating…
7 A government’s decision to move from a fixed exchange rate to a free market floating exchange rate will solve the problem of unemployment in the short run but will cause higher rates of inflation in the long run. Evaluate this statement. [25]
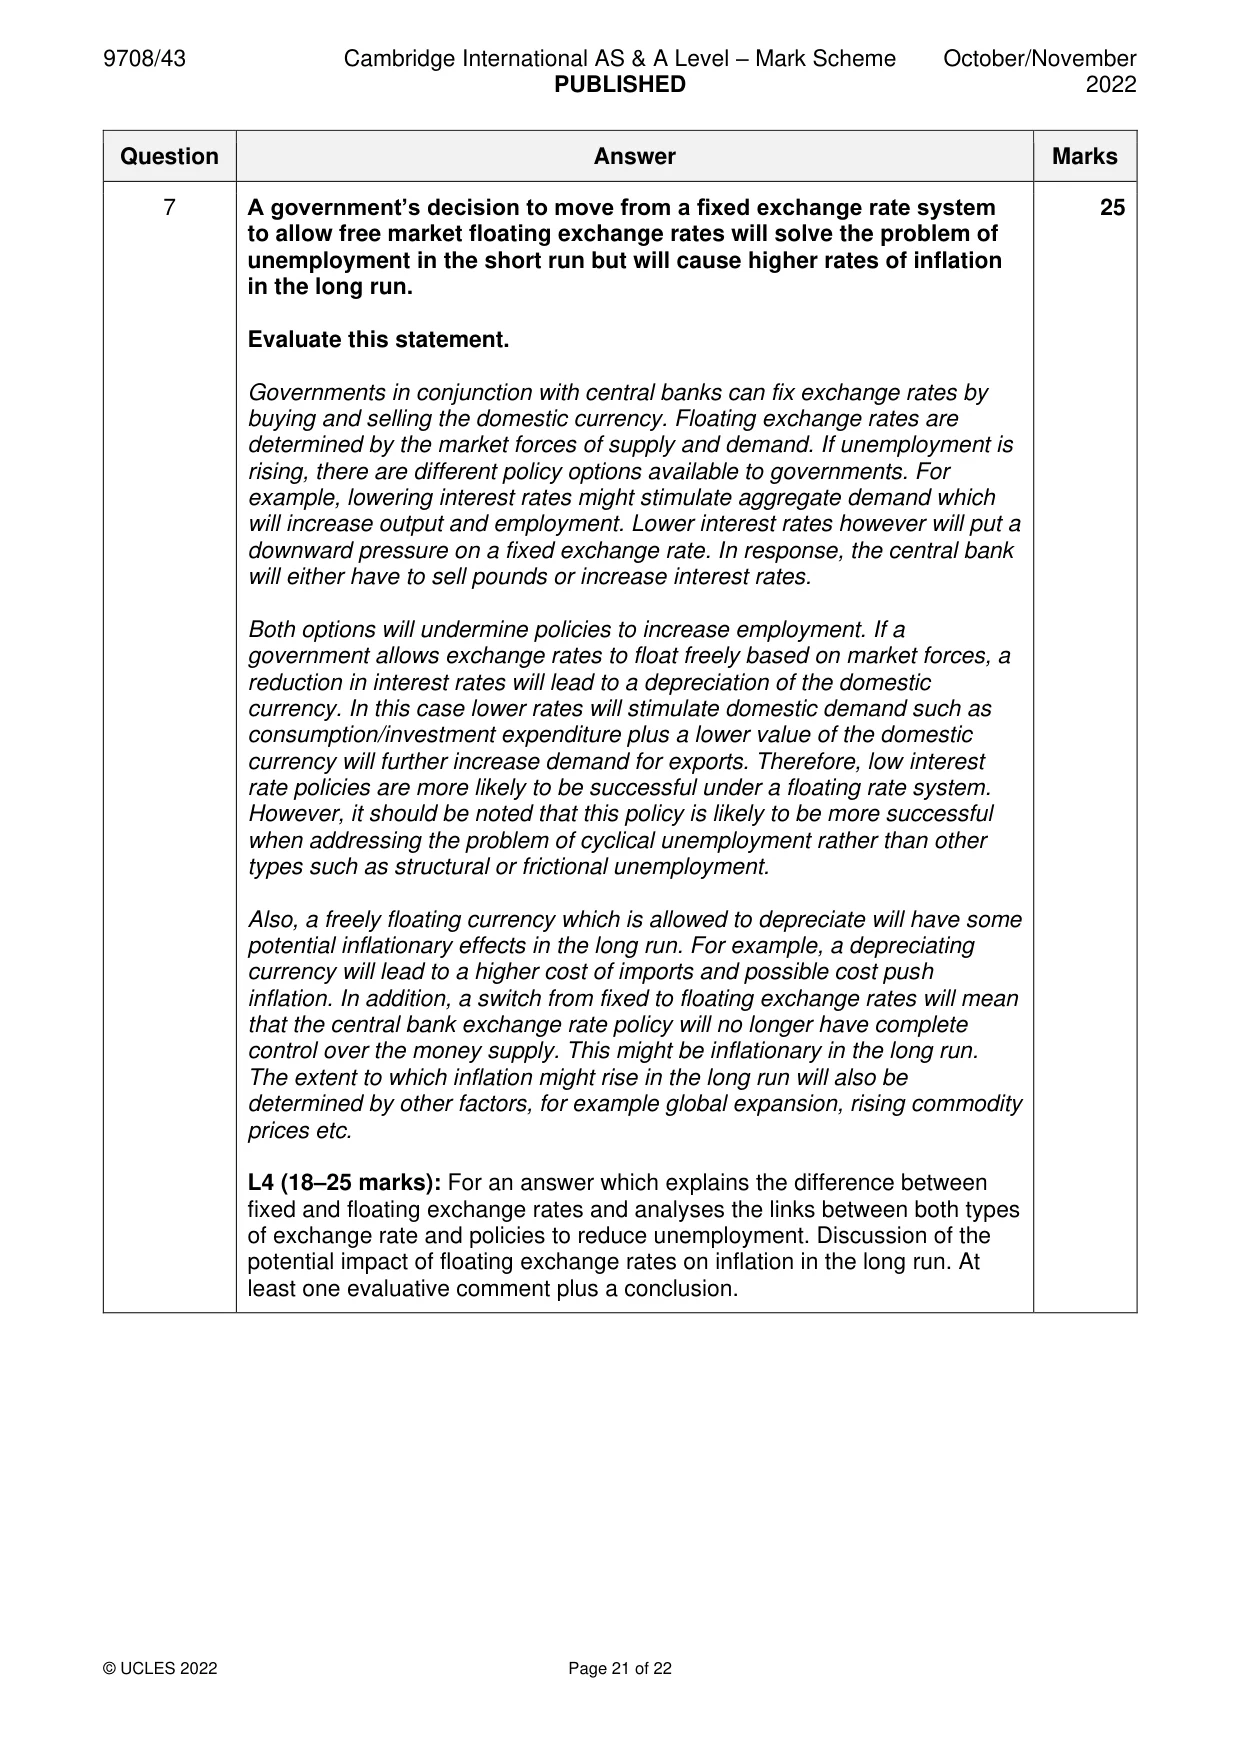
Mark scheme: 7 A government’s decision to move from a fixed exchange rate system 25 to allow free market floating exchange rates will solve the problem of unemployment in the short run but will cause higher rates of inflation in the long run. Evaluate this statement. Governments in conjunction with central banks can fix exchange rates by buying and selling the domestic currency. Floating exchange rates are determined by the market forces of supply and demand. If unemployment is rising, there are different policy options available to governments. For example, lowering interest rates might stimulate aggregate demand which will increase output and employment. Lower interest rates however will put a downward pressure on a fixed exchange rate. In response, the central bank will either have to sell pounds or increase interest rates. Both options will undermine policies to increase employment. If a government allows exchange rates to float freely based on market forces, a reduction in interest rates will lead to a depreciation of the domestic currency. In this case lower rates will stimulate domestic demand such as consumption/investment expenditure plus a lower value of the domestic currency will further increase demand for exports. Therefore, low interest rate policies are more likely to be successful under a floating rate system. However, it should be noted that this policy is likely to be more successful when addressing the problem of cyclical unemployment rather than other types such as structural or frictional unemployment. Also, a freely floating currency which is allowed to depreciate will have some potential inflationary effects in the long run. For example, a depreciating currency will lead to a higher cost of imports and possible cost push inflation. In addition, a switch from fixed to floating exchange rates will mean that the central bank exchange rate policy will no longer have complete control over the money supply. This might be inflationary in the long run. The extent to which inflation might rise in the long run will also be determined by other factors, for example global expansion, rising commodity prices etc. L4 (18–25 marks): For an answer which explains the difference between fixed and floating exchange rates and analyses the links between both types of exchange rate and policies to reduce unemployment. Discussion of the potential impact of floating exchange rates on inflation in the long run. At least one evaluative comment plus a conclusion. 7 L3 (14–17 marks): For a clear analysis of the relationships between policies adopted to solve the problem of unemployment and different exchange rate regimes. The potential problem of inflation, relating to the switch to a floating exchange will not be fully discussed and no evaluative comment will be provided or used to provide a conclusion. L2 (10–13 marks): For a less well-developed comment which describes different exchange rate regimes and policies used to reduce unemployment. Links between different exchange rates and the potential impact on inflation in the long run will not be fully analysed. L1 (1–9 marks): For an answer that shows some knowledge but does not indicate that the question has been fully grasped or where the answer is mostly irrelevant.
What was in this paper
The subtopics covered by these 7 questions, and how many questions each got. Open one in a new tab to see every Cambridge question on it.
What you needed in this session
Cambridge’s own grade thresholds for 2022 Oct/Nov, Paper 4 · Variant 3. A higher threshold means an easier paper — the bar moves with how the cohort did.