Cambridge A Level Economics 9708 — 2024 Feb/March Paper 3 · Variant 2
9708/32/F/M/24 · 30 marks · ≈34 min
The question paper and its mark scheme, free to read here and free to download. This is Cambridge’s own paper, exactly as it was sat.
Question paper12 pages




Mark scheme3 pages
Answers below. Sit the paper first if you are practising.

Paper as text
Question paper, page 1
This document has 12 pages. Any blank pages are indicated. IB24 03_9708_32/RP © UCLES 2024 [Turn over *8674842092* Cambridge International AS & A Level ECONOMICS 9708/32 Paper 3 A Level Multiple Choice February/March 2024 1 hour 15 minutes You must answer on the multiple choice answer sheet. You will need: Multiple choice answer sheet Soft clean eraser Soft pencil (type B or HB is recommended) INSTRUCTIONS There are thirty questions on this paper. Answer all questions. For each question there are four possible answers A, B, C and D. Choose the one you consider correct and record your choice in soft pencil on the multiple choice answer sheet. Follow the instructions on the multiple choice answer sheet. Write in soft pencil. Write your name, centre number and candidate number on the multiple choice answer sheet in the spaces provided unless this has been done for you. Do not use correction fluid. Do not write on any bar codes. You may use a calculator. INFORMATION The total mark for this paper is 30. Each correct answer will score one mark. Any rough working should be done on this question paper.
Question paper, page 2
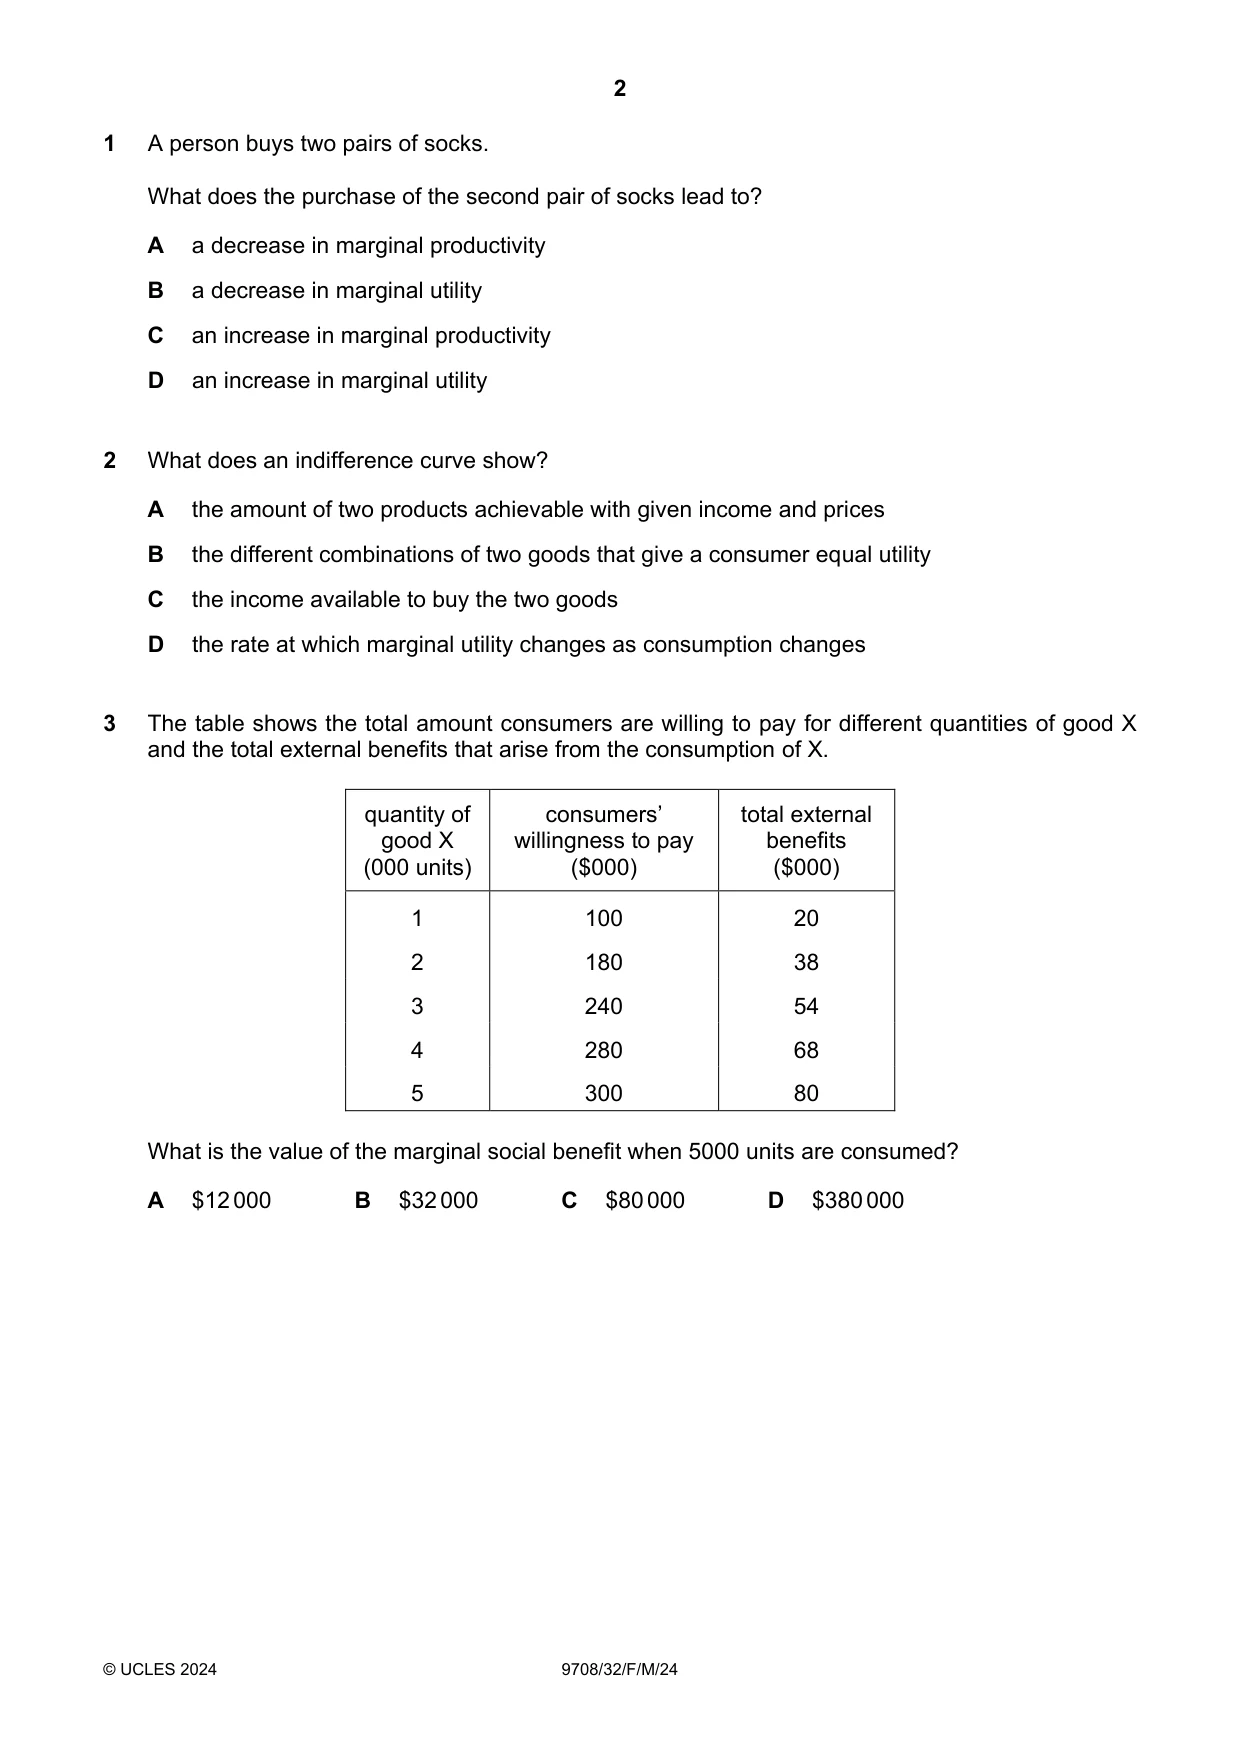
2 © UCLES 2024 9708/32/F/M/24 1 A person buys two pairs of socks. What does the purchase of the second pair of socks lead to? A a decrease in marginal productivity B a decrease in marginal utility C an increase in marginal productivity D an increase in marginal utility 2 What does an indifference curve show? A the amount of two products achievable with given income and prices B the different combinations of two goods that give a consumer equal utility C the income available to buy the two goods D the rate at which marginal utility changes as consumption changes 3 The table shows the total amount consumers are willing to pay for different quantities of good X and the total external benefits that arise from the consumption of X. quantity of good X (000 units) consumers’ willingness to pay ($000) total external benefits ($000) 1 100 20 2 180 38 3 240 54 4 280 68 5 300 80 What is the value of the marginal social benefit when 5000 units are consumed? A $12 000 B $32 000 C $80 000 D $380 000
Question paper, page 3
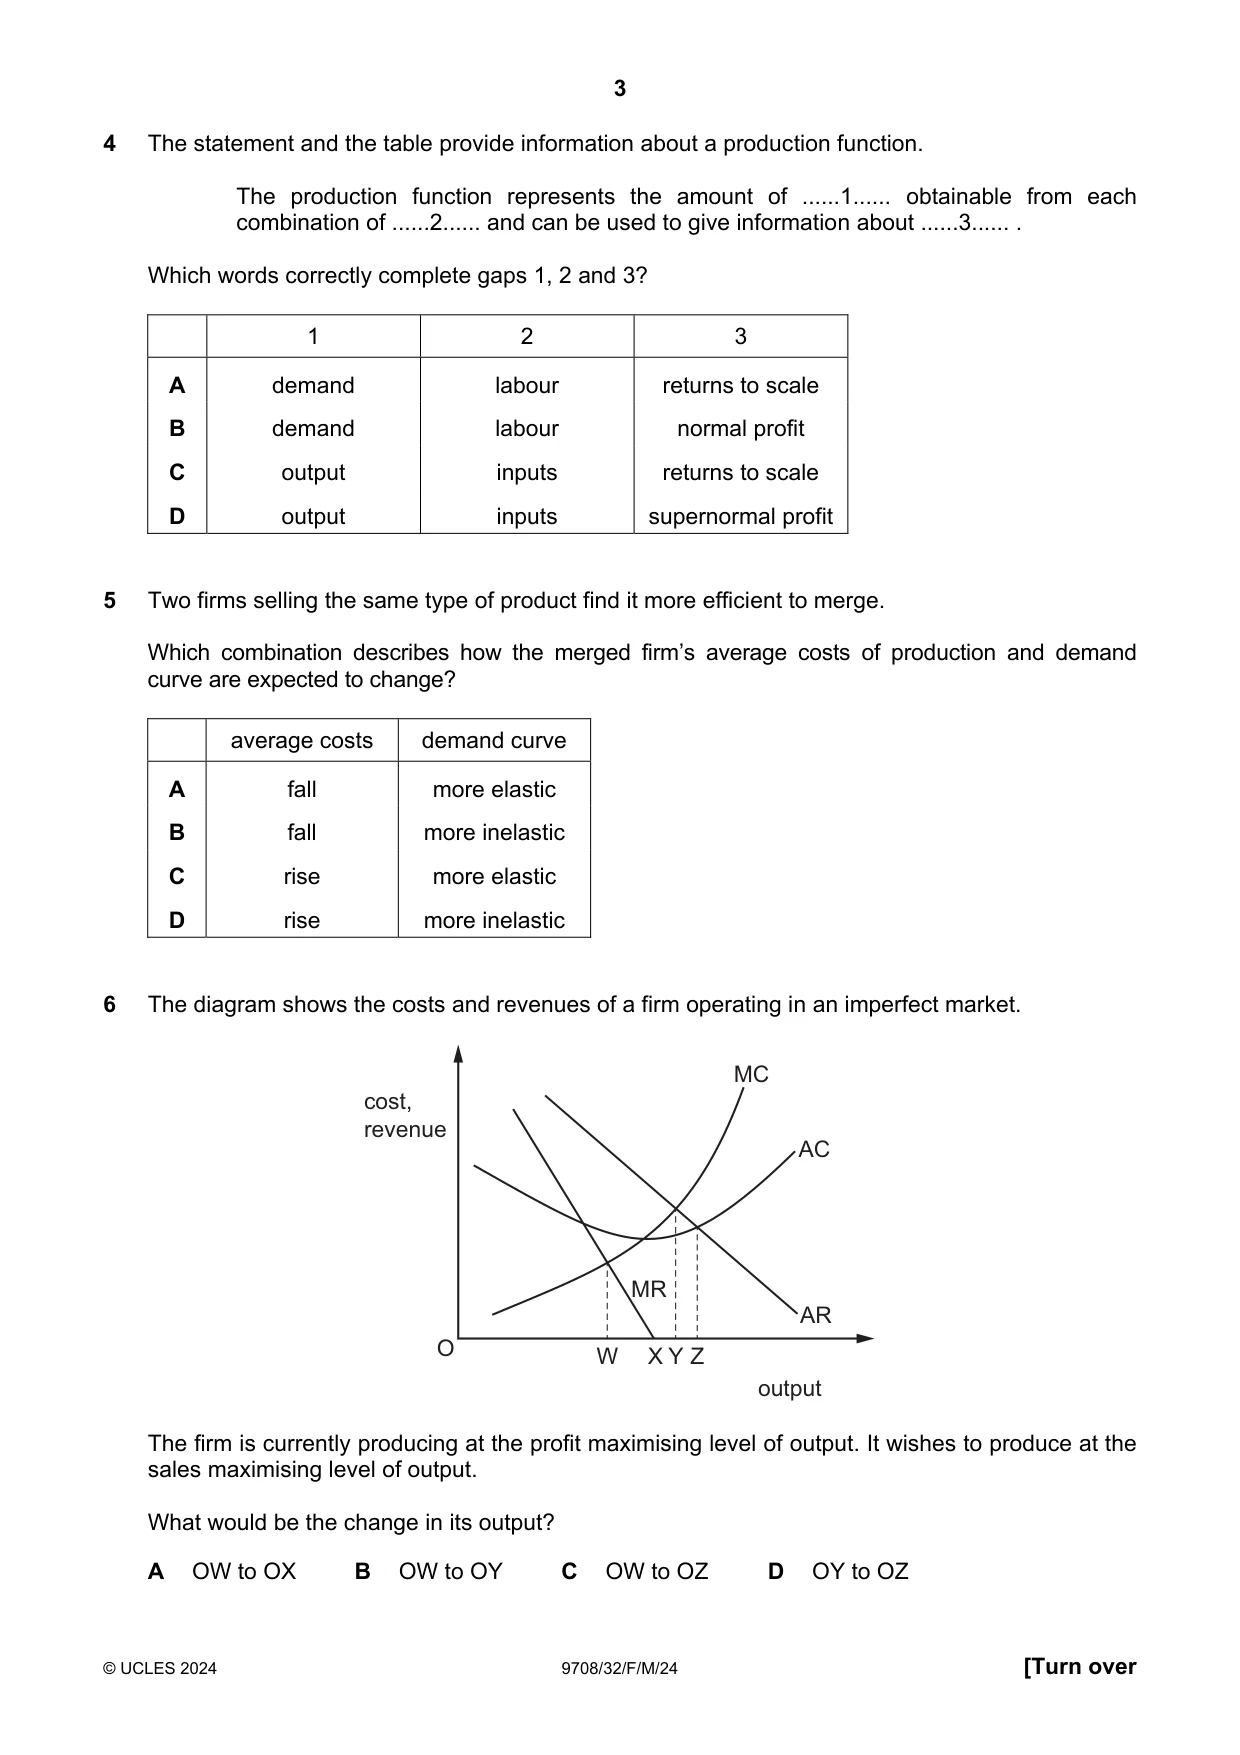
3 © UCLES 2024 9708/32/F/M/24 [Turn over 4 The statement and the table provide information about a production function. The production function represents the amount of …1… obtainable from each combination of …2… and can be used to give information about …3… . Which words correctly complete gaps 1, 2 and 3? 1 2 3 A demand labour returns to scale B demand labour normal profit C output inputs returns to scale D output inputs supernormal profit 5 Two firms selling the same type of product find it more efficient to merge. Which combination describes how the merged firm’s average costs of production and demand curve are expected to change? average costs demand curve A fall more elastic B fall more inelastic C rise more elastic D rise more inelastic 6 The diagram shows the costs and revenues of a firm operating in an imperfect market. O cost, revenue output W Y X Z MR AR AC MC The firm is currently producing at the profit maximising level of output. It wishes to produce at the sales maximising level of output. What would be the change in its output? A OW to OX B OW to OY C OW to OZ D OY to OZ
Question paper, page 4
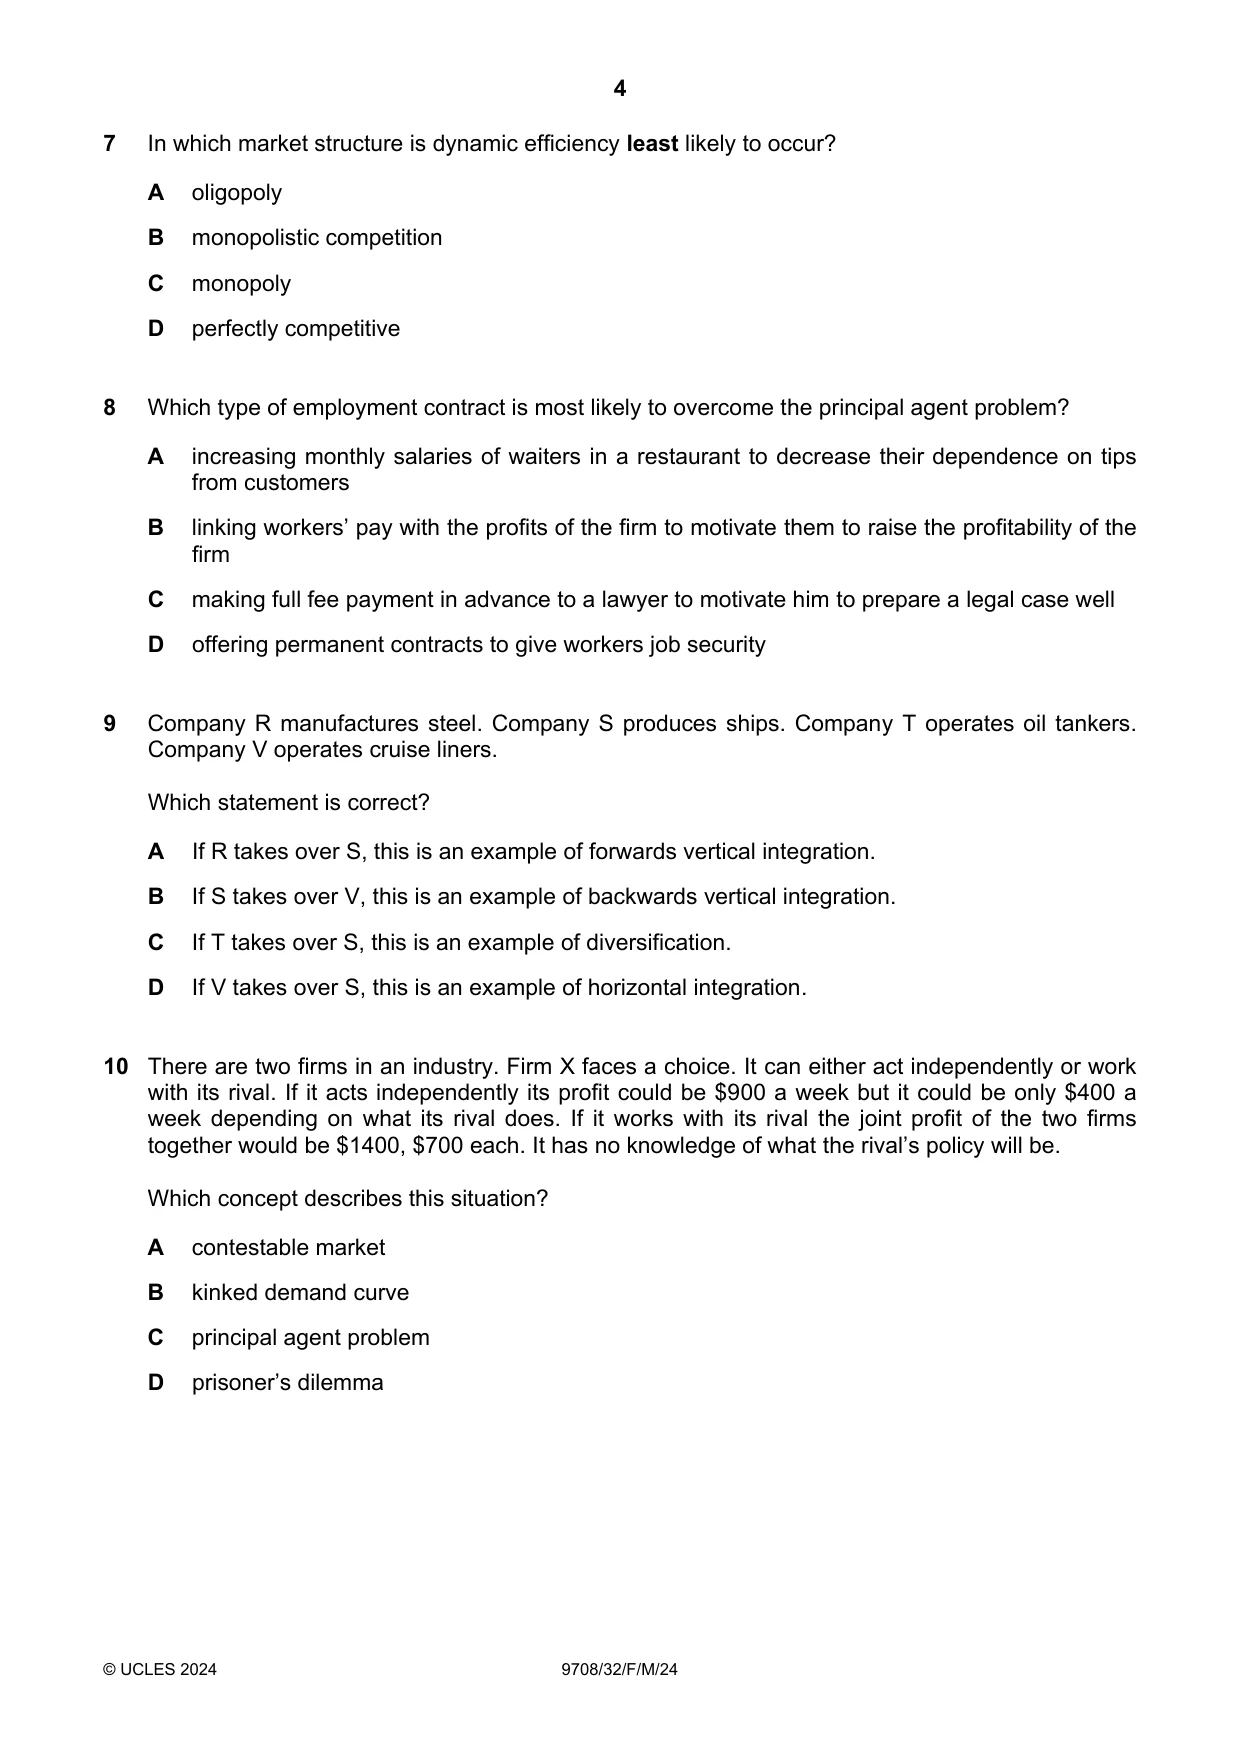
4 © UCLES 2024 9708/32/F/M/24 7 In which market structure is dynamic efficiency least likely to occur? A oligopoly B monopolistic competition C monopoly D perfectly competitive 8 Which type of employment contract is most likely to overcome the principal agent problem? A increasing monthly salaries of waiters in a restaurant to decrease their dependence on tips from customers B linking workers’ pay with the profits of the firm to motivate them to raise the profitability of the firm C making full fee payment in advance to a lawyer to motivate him to prepare a legal case well D offering permanent contracts to give workers job security 9 Company R manufactures steel. Company S produces ships. Company T operates oil tankers. Company V operates cruise liners. Which statement is correct? A If R takes over S, this is an example of forwards vertical integration. B If S takes over V, this is an example of backwards vertical integration. C If T takes over S, this is an example of diversification. D If V takes over S, this is an example of horizontal integration. 10 There are two firms in an industry. Firm X faces a choice. It can either act independently or work with its rival. If it acts independently its profit could be $900 a week but it could be only $400 a week depending on what its rival does. If it works with its rival the joint profit of the two firms together would be $1400, $700 each. It has no knowledge of what the rival’s policy will be. Which concept describes this situation? A contestable market B kinked demand curve C principal agent problem D prisoner’s dilemma
Question paper, page 5
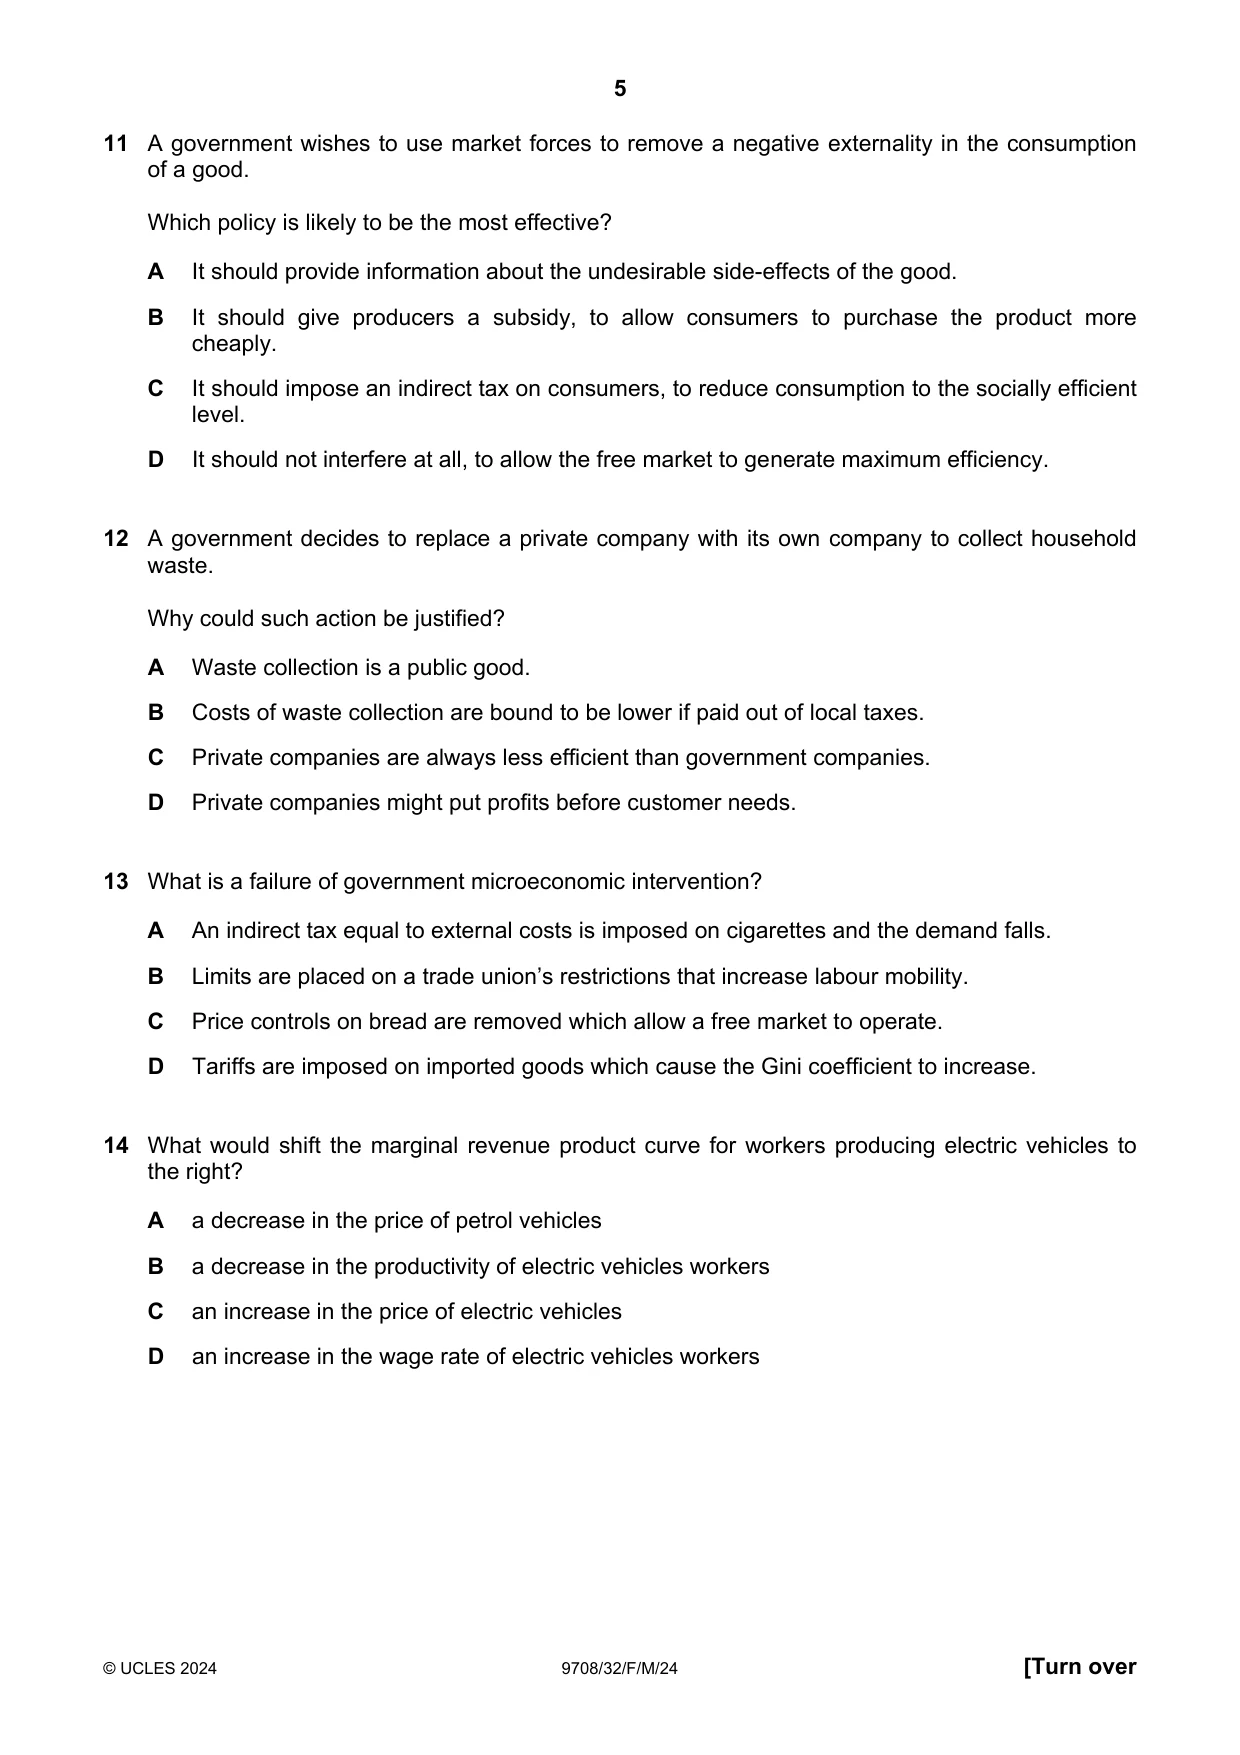
5 © UCLES 2024 9708/32/F/M/24 [Turn over 11 A government wishes to use market forces to remove a negative externality in the consumption of a good. Which policy is likely to be the most effective? A It should provide information about the undesirable side-effects of the good. B It should give producers a subsidy, to allow consumers to purchase the product more cheaply. C It should impose an indirect tax on consumers, to reduce consumption to the socially efficient level. D It should not interfere at all, to allow the free market to generate maximum efficiency. 12 A government decides to replace a private company with its own company to collect household waste. Why could such action be justified? A Waste collection is a public good. B Costs of waste collection are bound to be lower if paid out of local taxes. C Private companies are always less efficient than government companies. D Private companies might put profits before customer needs. 13 What is a failure of government microeconomic intervention? A An indirect tax equal to external costs is imposed on cigarettes and the demand falls. B Limits are placed on a trade union’s restrictions that increase labour mobility. C Price controls on bread are removed which allow a free market to operate. D Tariffs are imposed on imported goods which cause the Gini coefficient to increase. 14 What would shift the marginal revenue product curve for workers producing electric vehicles to the right? A a decrease in the price of petrol vehicles B a decrease in the productivity of electric vehicles workers C an increase in the price of electric vehicles D an increase in the wage rate of electric vehicles workers
Question paper, page 6
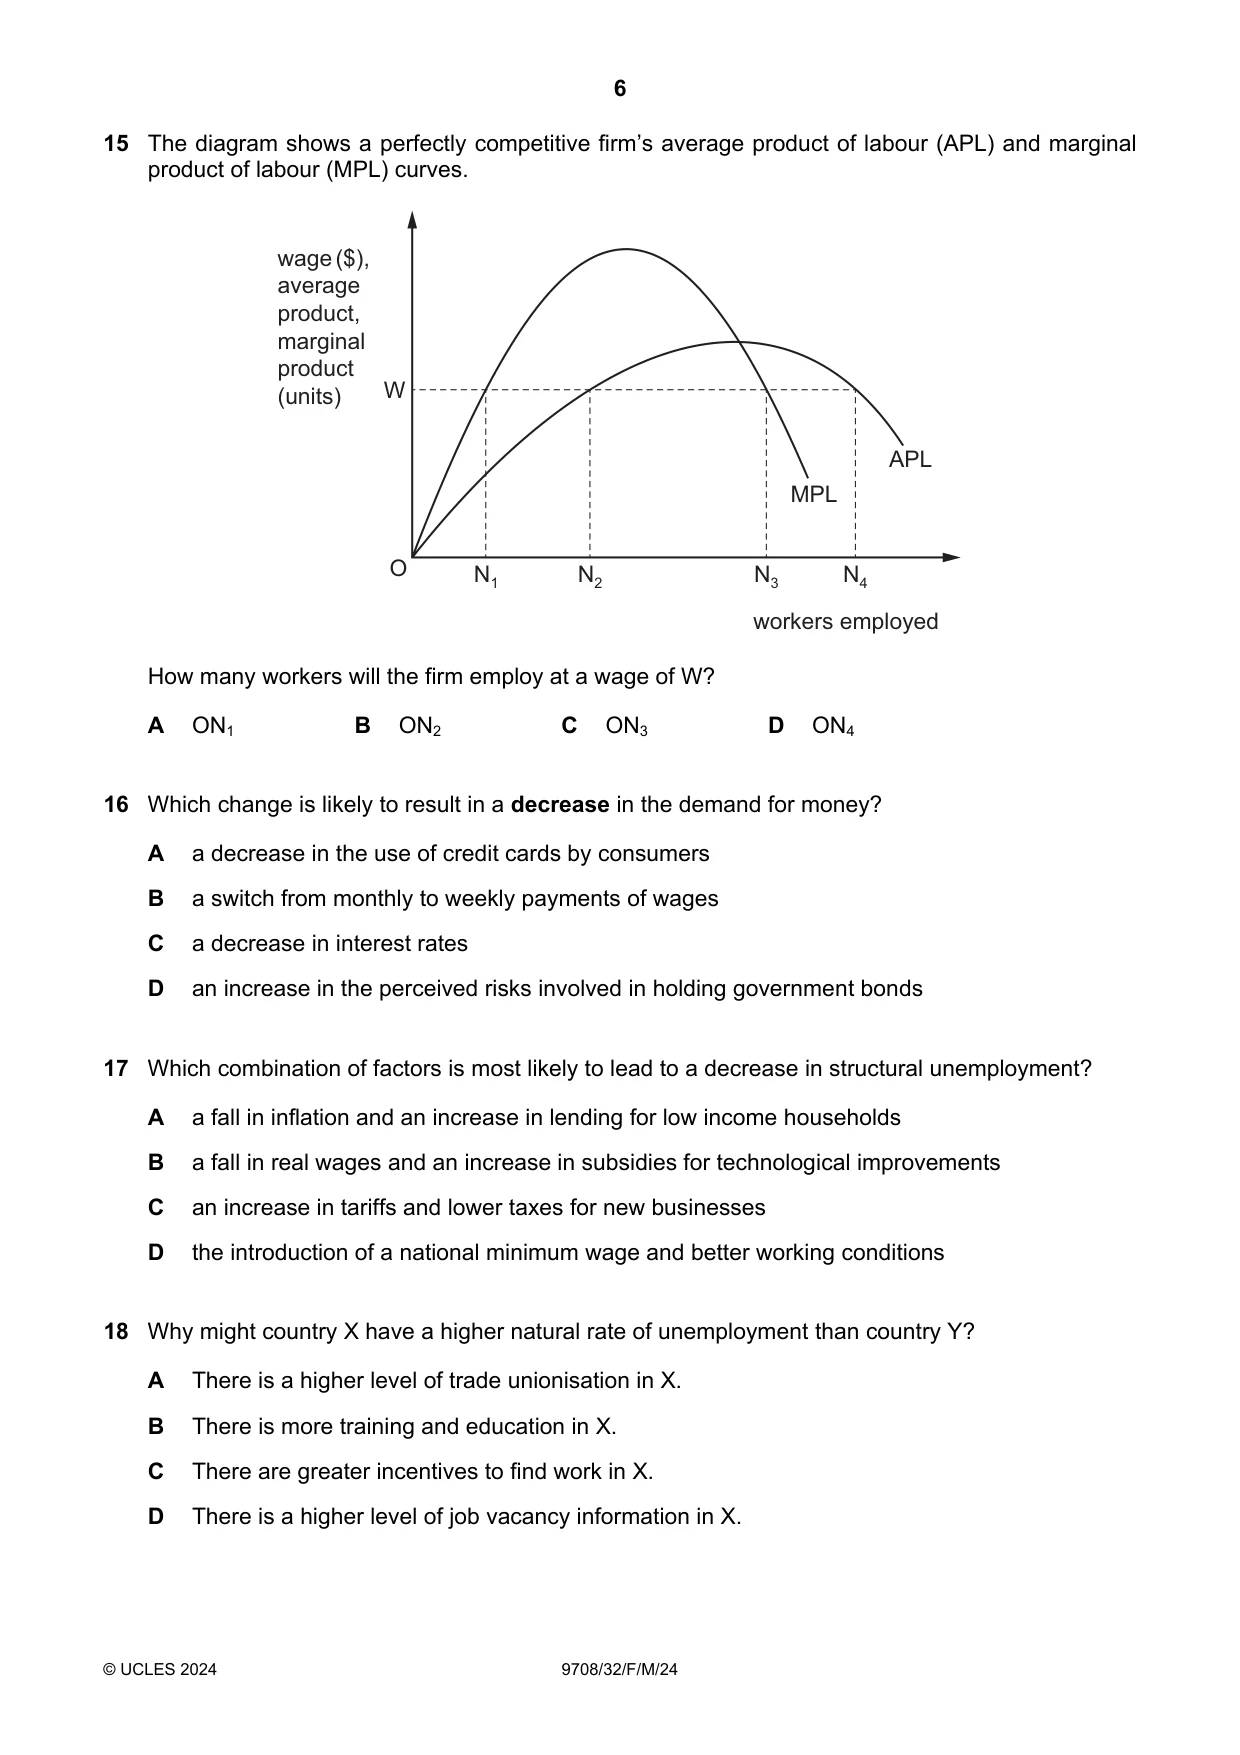
6 © UCLES 2024 9708/32/F/M/24 15 The diagram shows a perfectly competitive firm’s average product of labour (APL) and marginal product of labour (MPL) curves. O W N1 N2 N3 N4 MPL workers employed APL wage ($), average product, marginal product (units) How many workers will the firm employ at a wage of W? A ON1 B ON2 C ON3 D ON4 16 Which change is likely to result in a decrease in the demand for money? A a decrease in the use of credit cards by consumers B a switch from monthly to weekly payments of wages C a decrease in interest rates D an increase in the perceived risks involved in holding government bonds 17 Which combination of factors is most likely to lead to a decrease in structural unemployment? A a fall in inflation and an increase in lending for low income households B a fall in real wages and an increase in subsidies for technological improvements C an increase in tariffs and lower taxes for new businesses D the introduction of a national minimum wage and better working conditions 18 Why might country X have a higher natural rate of unemployment than country Y? A There is a higher level of trade unionisation in X. B There is more training and education in X. C There are greater incentives to find work in X. D There is a higher level of job vacancy information in X.
Question paper, page 7
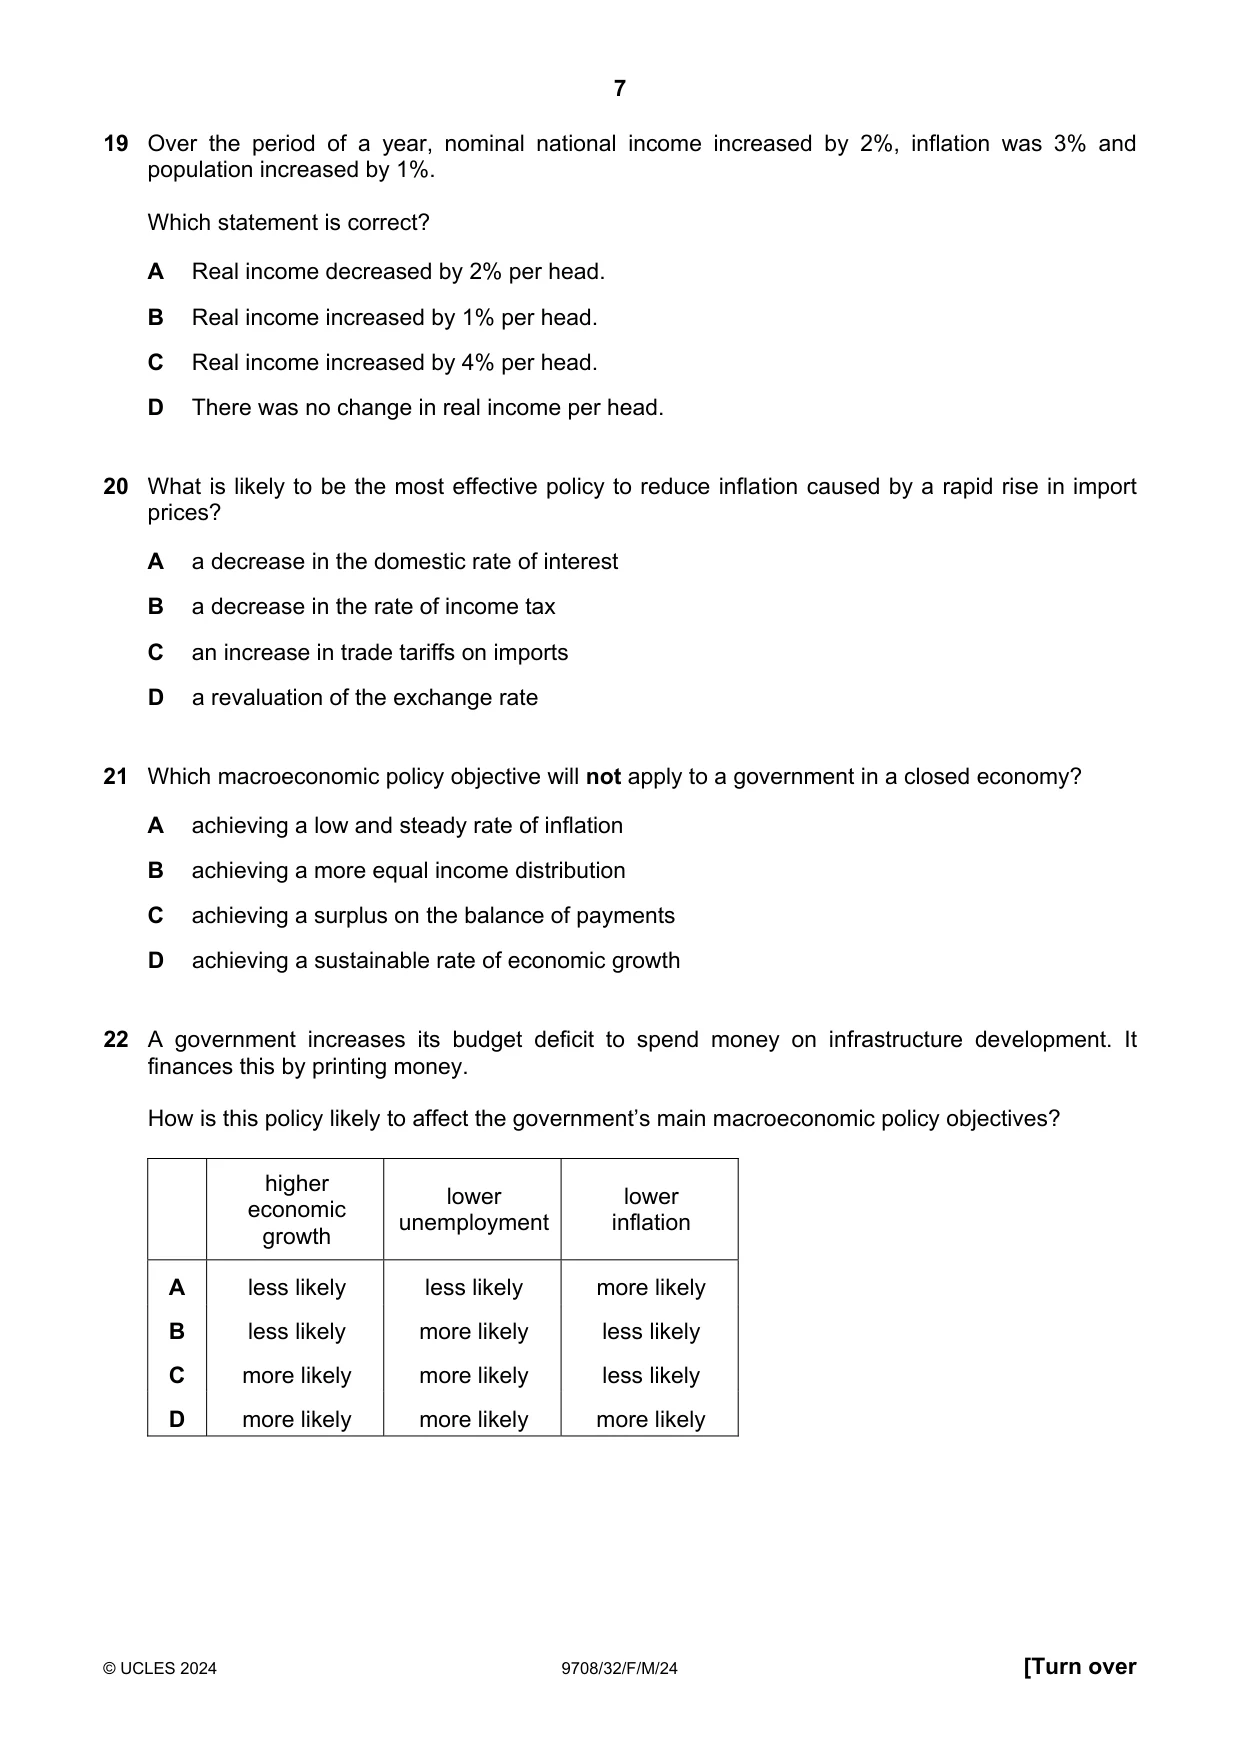
7 © UCLES 2024 9708/32/F/M/24 [Turn over 19 Over the period of a year, nominal national income increased by 2%, inflation was 3% and population increased by 1%. Which statement is correct? A Real income decreased by 2% per head. B Real income increased by 1% per head. C Real income increased by 4% per head. D There was no change in real income per head. 20 What is likely to be the most effective policy to reduce inflation caused by a rapid rise in import prices? A a decrease in the domestic rate of interest B a decrease in the rate of income tax C an increase in trade tariffs on imports D a revaluation of the exchange rate 21 Which macroeconomic policy objective will not apply to a government in a closed economy? A achieving a low and steady rate of inflation B achieving a more equal income distribution C achieving a surplus on the balance of payments D achieving a sustainable rate of economic growth 22 A government increases its budget deficit to spend money on infrastructure development. It finances this by printing money. How is this policy likely to affect the government’s main macroeconomic policy objectives? higher economic growth lower unemployment lower inflation A less likely less likely more likely B less likely more likely less likely C more likely more likely less likely D more likely more likely more likely
Question paper, page 8
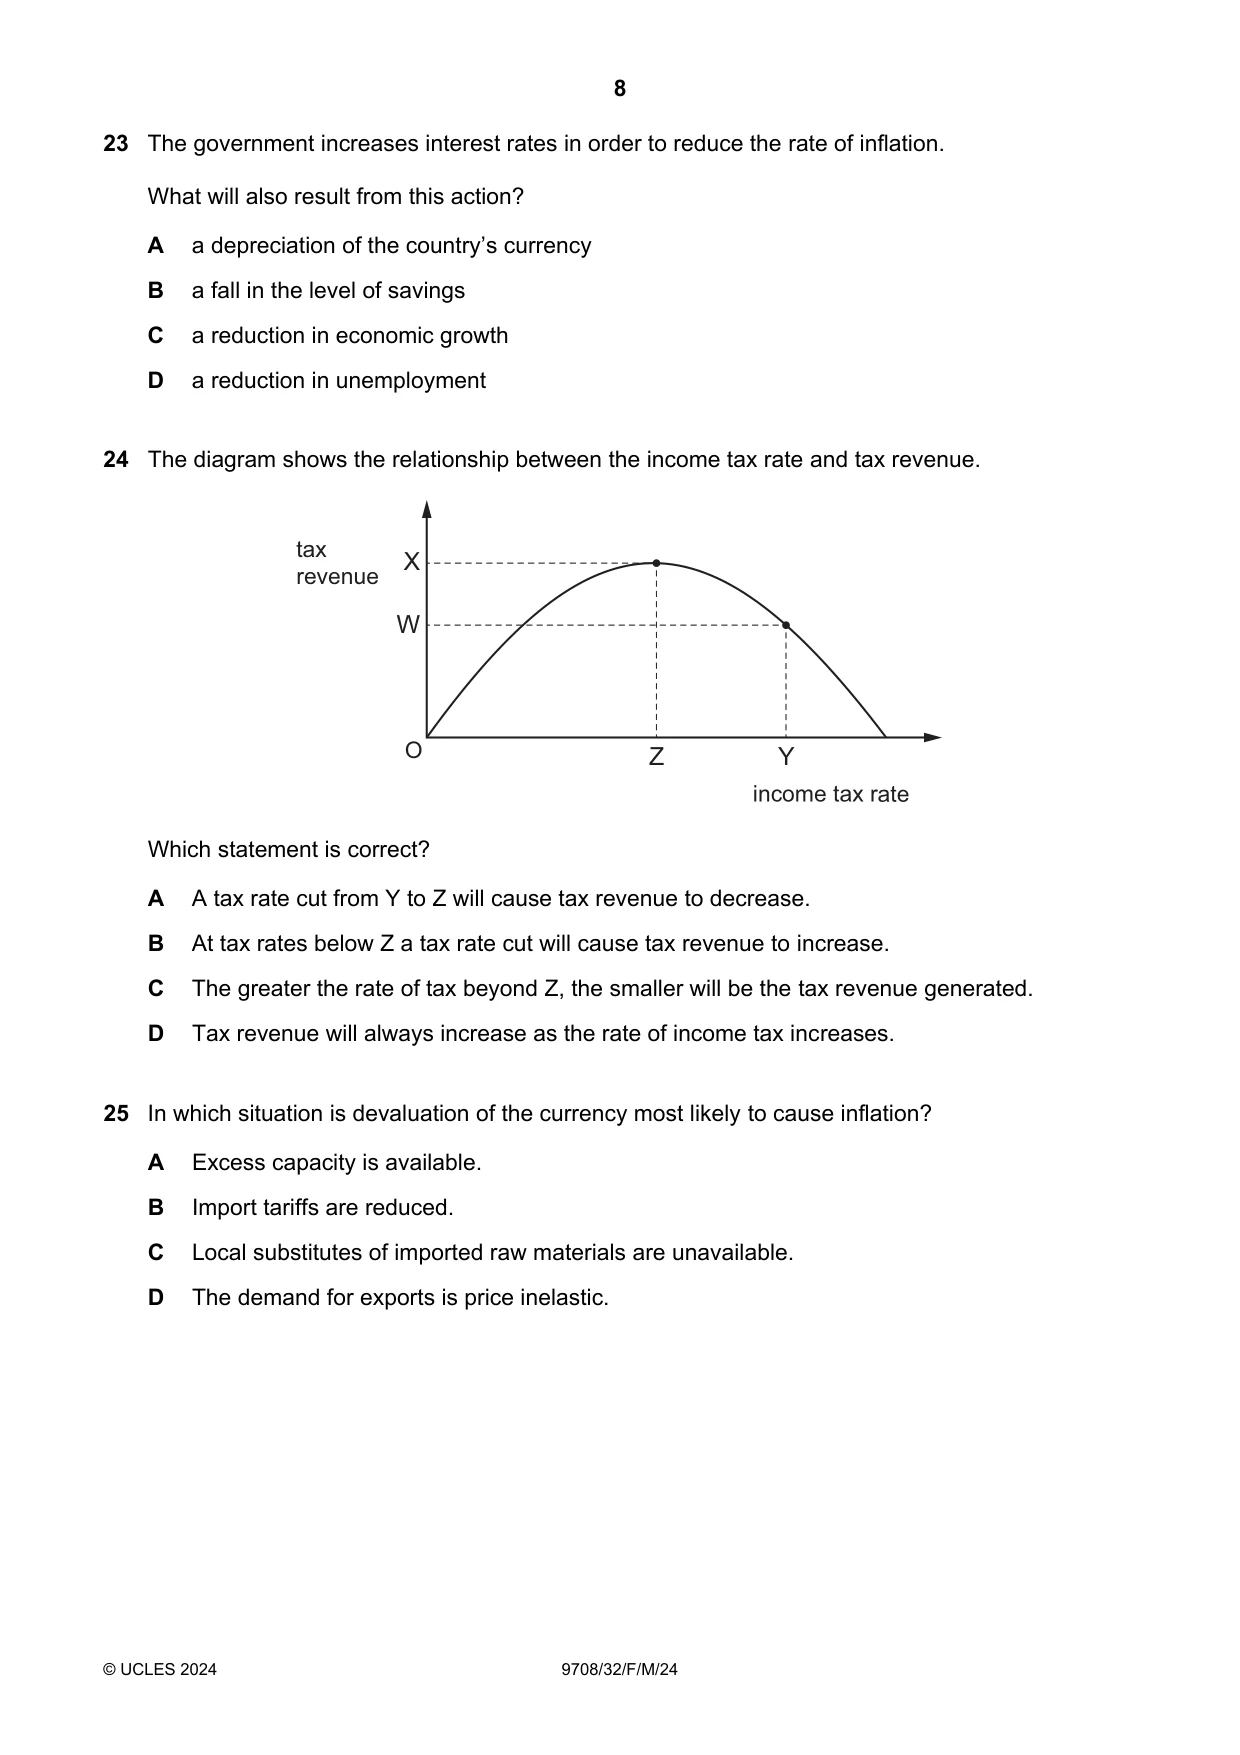
8 © UCLES 2024 9708/32/F/M/24 23 The government increases interest rates in order to reduce the rate of inflation. What will also result from this action? A a depreciation of the country’s currency B a fall in the level of savings C a reduction in economic growth D a reduction in unemployment 24 The diagram shows the relationship between the income tax rate and tax revenue. tax revenue income tax rate O X W Z Y Which statement is correct? A A tax rate cut from Y to Z will cause tax revenue to decrease. B At tax rates below Z a tax rate cut will cause tax revenue to increase. C The greater the rate of tax beyond Z, the smaller will be the tax revenue generated. D Tax revenue will always increase as the rate of income tax increases. 25 In which situation is devaluation of the currency most likely to cause inflation? A Excess capacity is available. B Import tariffs are reduced. C Local substitutes of imported raw materials are unavailable. D The demand for exports is price inelastic.
Question paper, page 9
9 © UCLES 2024 9708/32/F/M/24 [Turn over 26 A country imports most of the raw materials used as factor inputs. Which policy is most likely to control cost-push inflation? A an appreciation of the exchange rate B an increase in the rate of income tax C an increase in the rate of interest D an increase in the rate of sales tax 27 Germany, one of the world’s strongest trading nations, achieved a surplus on current account of the balance of payments in 2021–2022. Which income flow would not have been included in the calculation of Germany’s current account? A Declining sales of German cars for export overseas. B Falling earnings of foreign exchange from visitors to Germany. C Increasing transfers of aid to less developed countries. D Investment in a natural gas pipeline link to its main foreign supplier. 28 A country maintains its foreign exchange rate against the United States dollar, within a narrow but changing band. What is this type of exchange rate? A fixed B floating C managed float D trade-weighted
Question paper, page 10
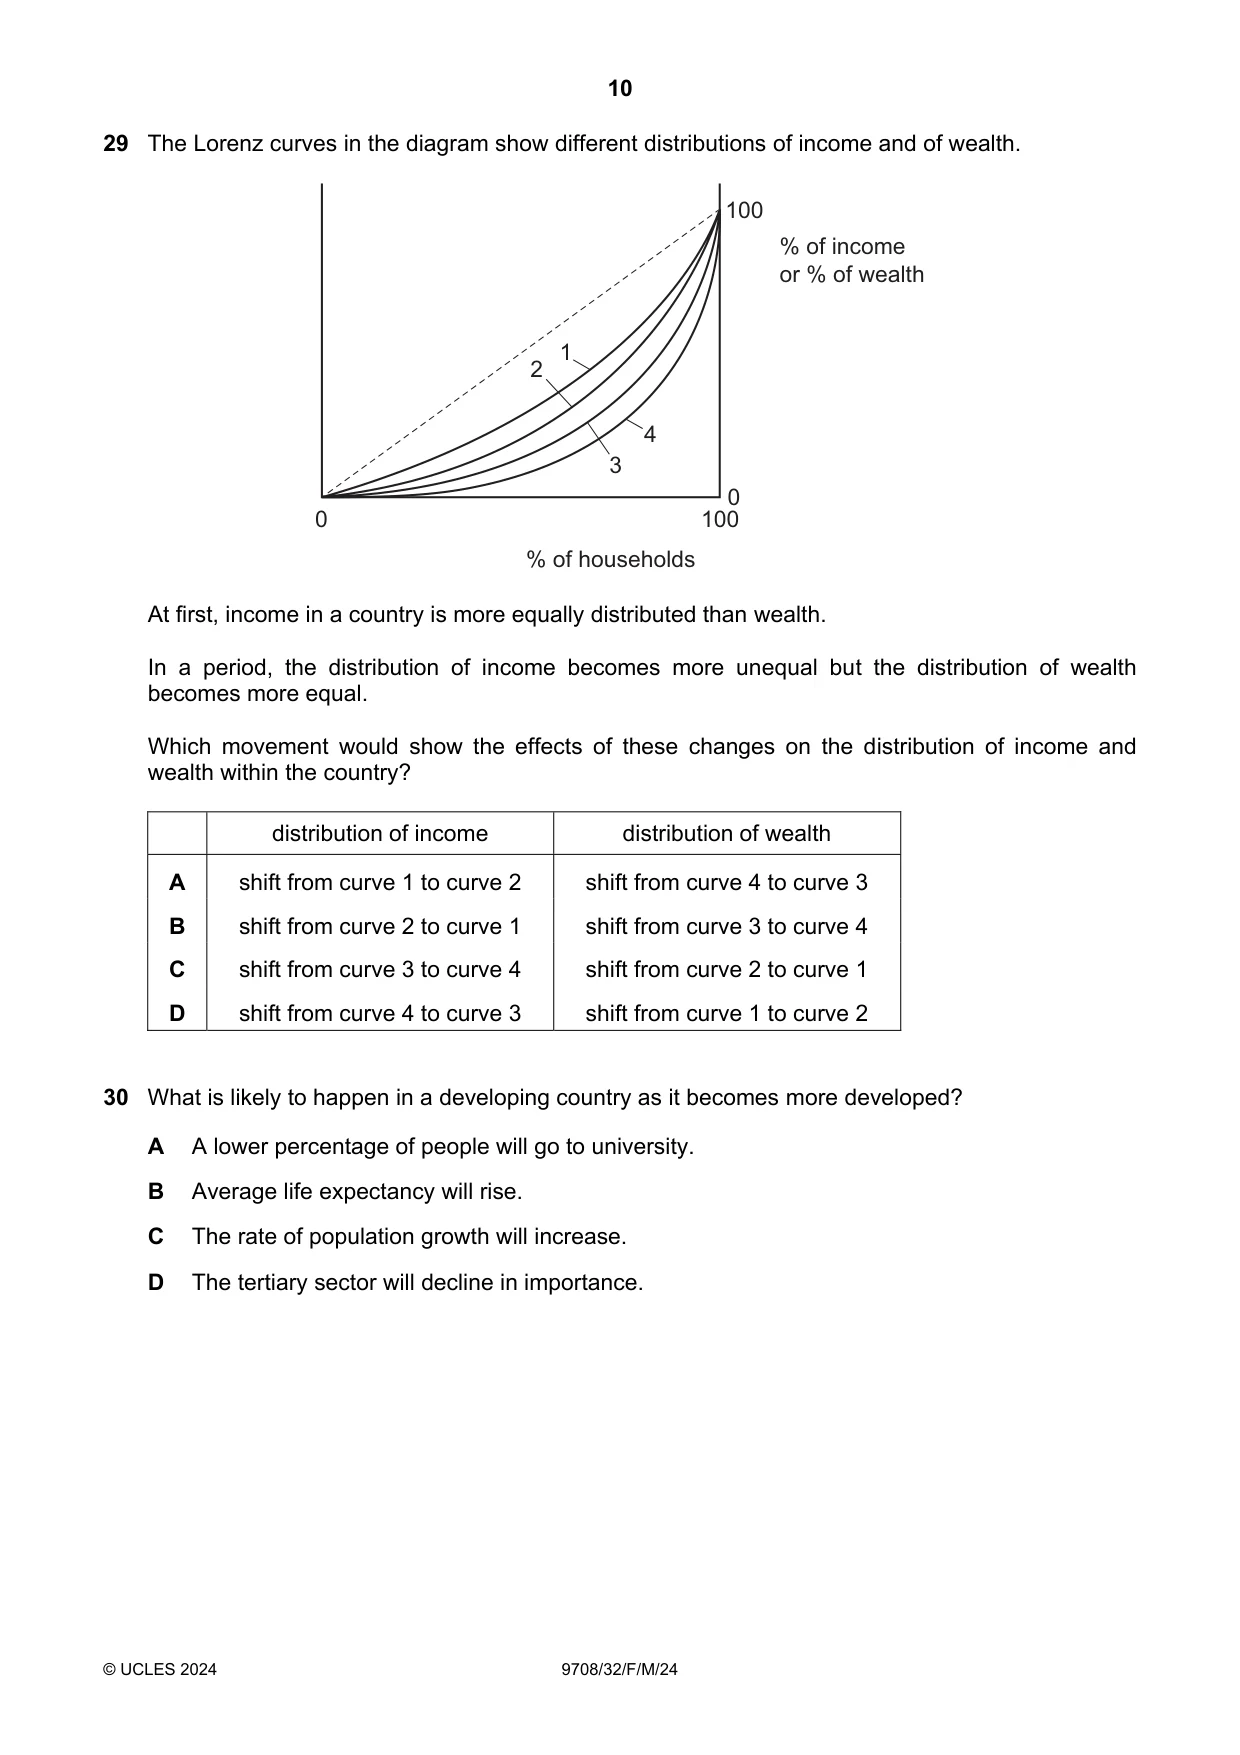
10 © UCLES 2024 9708/32/F/M/24 29 The Lorenz curves in the diagram show different distributions of income and of wealth. 100 100 0 0 % of households % of income or % of wealth 1 2 3 4 At first, income in a country is more equally distributed than wealth. In a period, the distribution of income becomes more unequal but the distribution of wealth becomes more equal. Which movement would show the effects of these changes on the distribution of income and wealth within the country? distribution of income distribution of wealth A shift from curve 1 to curve 2 shift from curve 4 to curve 3 B shift from curve 2 to curve 1 shift from curve 3 to curve 4 C shift from curve 3 to curve 4 shift from curve 2 to curve 1 D shift from curve 4 to curve 3 shift from curve 1 to curve 2 30 What is likely to happen in a developing country as it becomes more developed? A A lower percentage of people will go to university. B Average life expectancy will rise. C The rate of population growth will increase. D The tertiary sector will decline in importance.
Question paper, page 11
11 © UCLES 2024 9708/32/F/M/24 BLANK PAGE
Question paper, page 12
12 Permission to reproduce items where third-party owned material protected by copyright is included has been sought and cleared where possible. Every reasonable effort has been made by the publisher (UCLES) to trace copyright holders, but if any items requiring clearance have unwittingly been included, the publisher will be pleased to make amends at the earliest possible opportunity. To avoid the issue of disclosure of answer-related information to candidates, all copyright acknowledgements are reproduced online in the Cambridge Assessment International Education Copyright Acknowledgements Booklet. This is produced for each series of examinations and is freely available to download at www.cambridgeinternational.org after the live examination series. Cambridge Assessment International Education is part of Cambridge Assessment. Cambridge Assessment is the brand name of the University of Cambridge Local Examinations Syndicate (UCLES), which is a department of the University of Cambridge. © UCLES 2024 9708/32/F/M/24 BLANK PAGE
Mark scheme, page 1
This document consists of 3 printed pages. © Cambridge University Press & Assessment 2024 [Turn over Cambridge International AS & A Level ECONOMICS 9708/32 Paper 3 A Level Multiple Choice February/March 2024 MARK SCHEME Maximum Mark: 30 Published This mark scheme is published as an aid to teachers and candidates, to indicate the requirements of the examination. Mark schemes should be read in conjunction with the question paper and the Principal Examiner Report for Teachers. Cambridge International will not enter into discussions about these mark schemes. Cambridge International is publishing the mark schemes for the February/March 2024 series for most Cambridge IGCSE, Cambridge International A and AS Level components, and some Cambridge O Level components.
Mark scheme, page 2
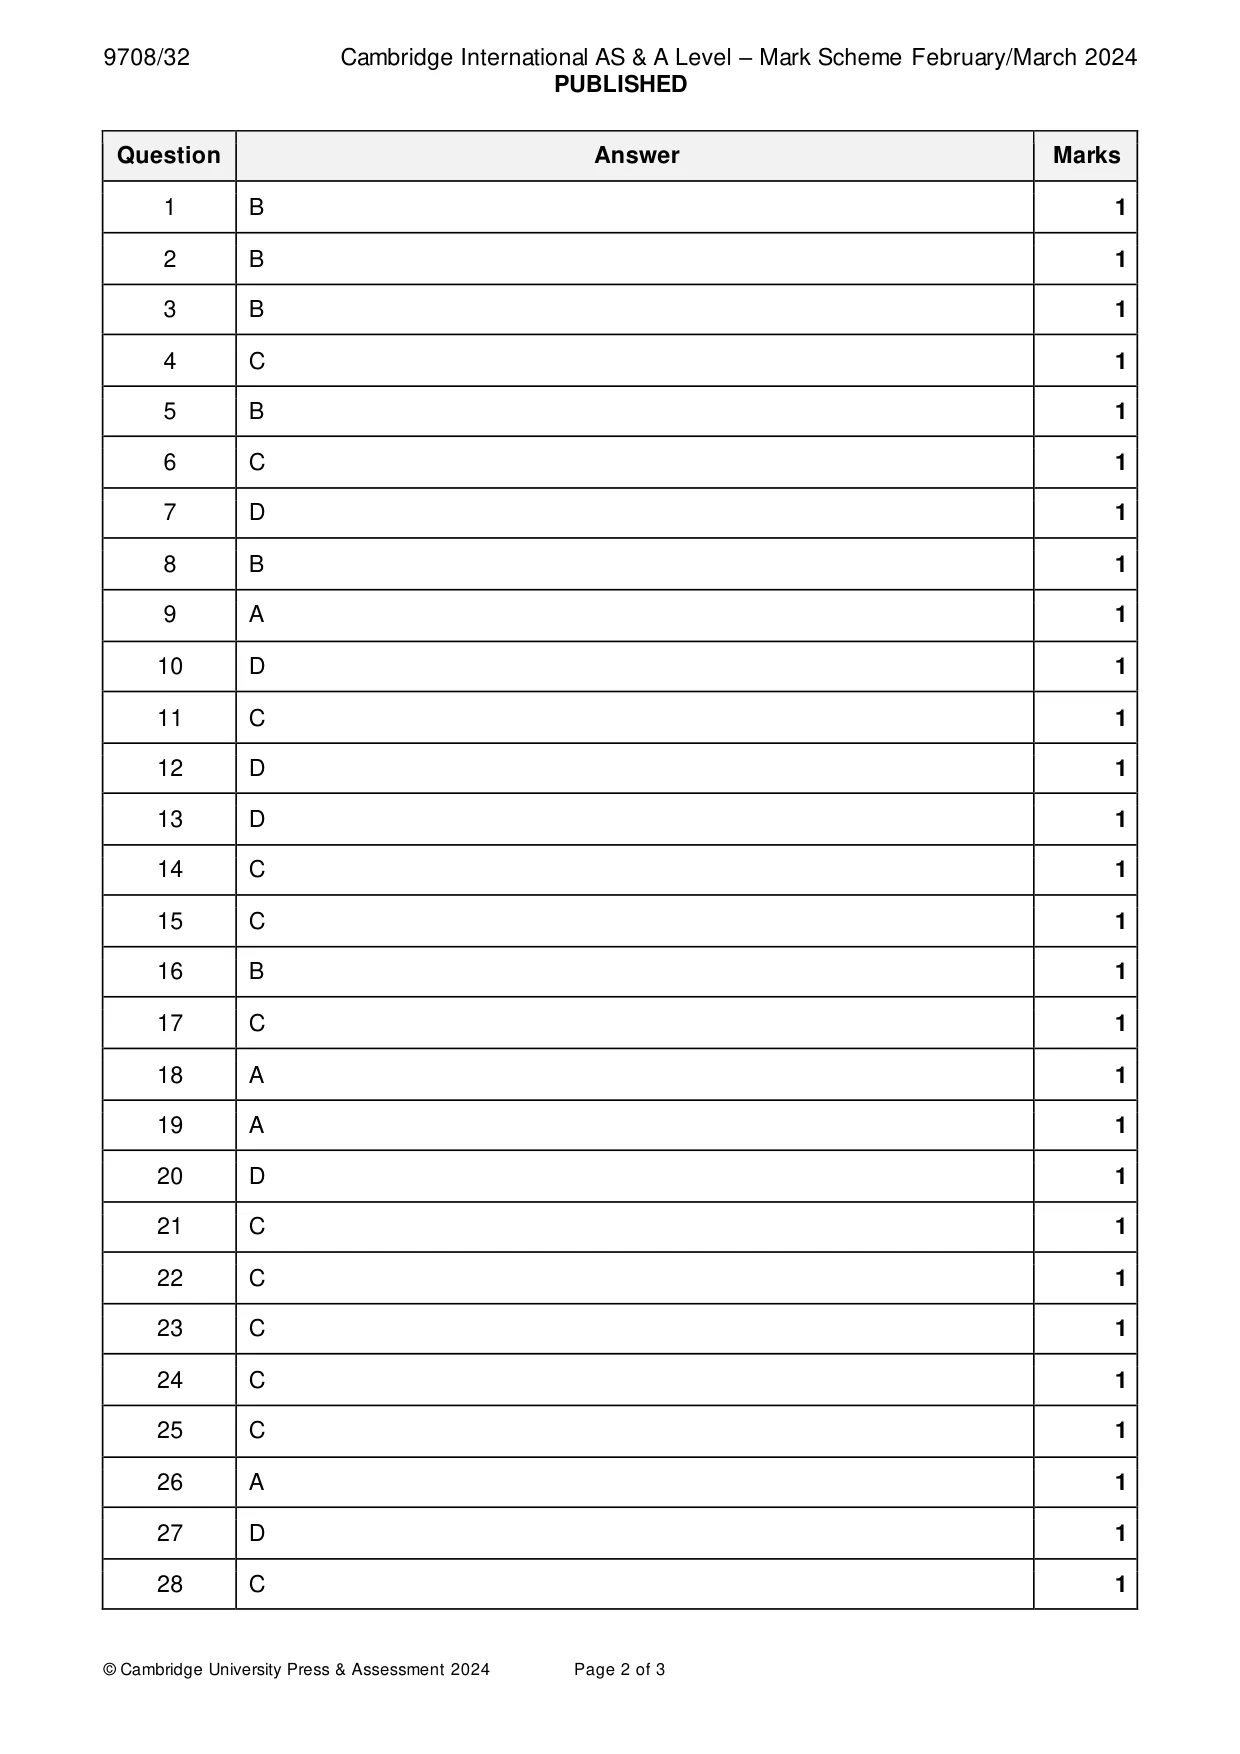
9708/32 Cambridge International AS & A Level – Mark Scheme PUBLISHED February/March 2024 © Cambridge University Press & Assessment 2024 Page 2 of 3 Question Answer Marks 1 B 1 2 B 1 3 B 1 4 C 1 5 B 1 6 C 1 7 D 1 8 B 1 9 A 1 10 D 1 11 C 1 12 D 1 13 D 1 14 C 1 15 C 1 16 B 1 17 C 1 18 A 1 19 A 1 20 D 1 21 C 1 22 C 1 23 C 1 24 C 1 25 C 1 26 A 1 27 D 1 28 C 1
Mark scheme, page 3
9708/32 Cambridge International AS & A Level – Mark Scheme PUBLISHED February/March 2024 © Cambridge University Press & Assessment 2024 Page 3 of 3 Question Answer Marks 29 A 1 30 B 1
What you needed in this session
Cambridge’s own grade thresholds for 2024 Feb/March, Paper 3 · Variant 2. A higher threshold means an easier paper — the bar moves with how the cohort did.