Cambridge A Level Chemistry 9701 — 2023 May/June Paper 5 · Variant 3
9701/53/M/J/23 · 3 questions · 30 marks · ≈34 min
The question paper and its mark scheme, free to read here and free to download. This is Cambridge’s own paper, exactly as it was sat.
Question paper16 pages



Mark scheme8 pages
Answers below. Sit the paper first if you are practising.
Questions as text
Q1 · The partition coefficient, Kpc, shows the distribution of a solute between two immiscible…
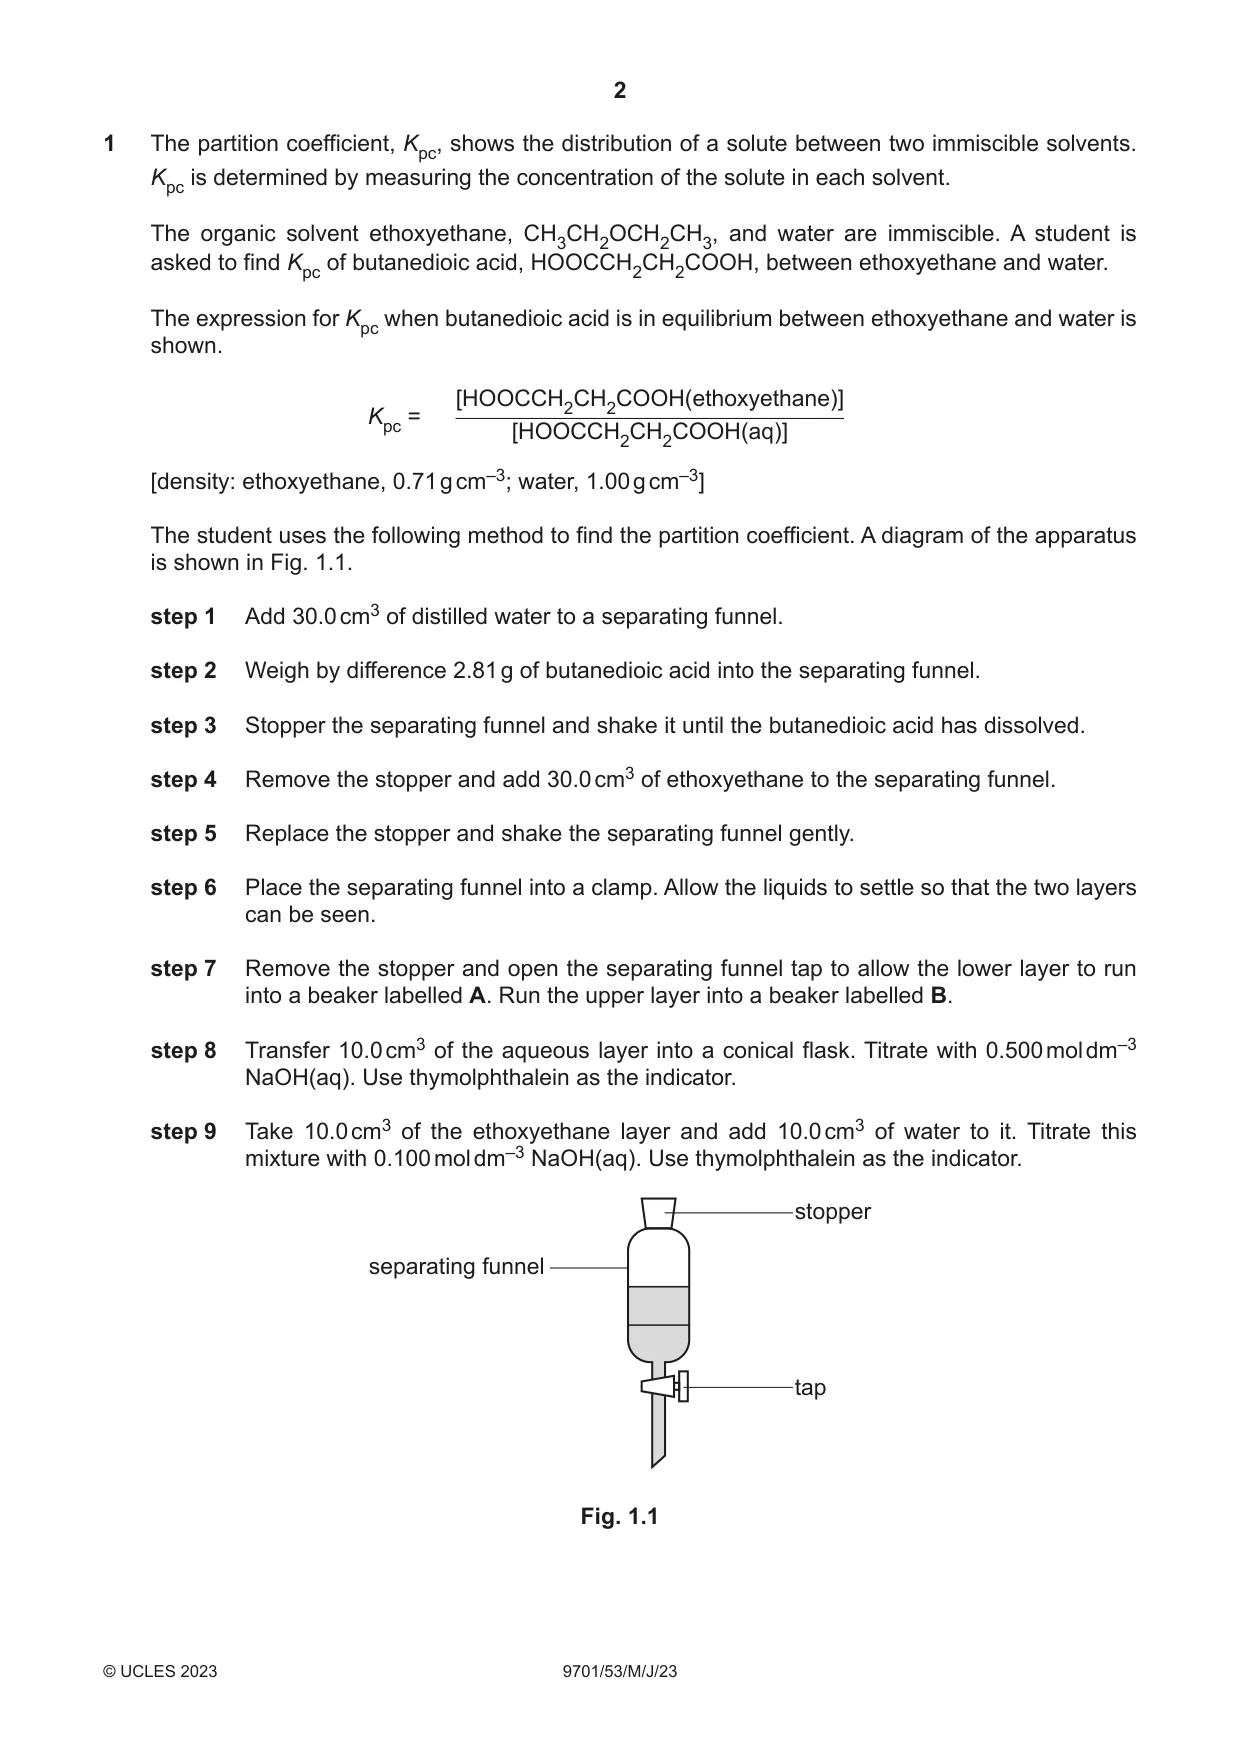
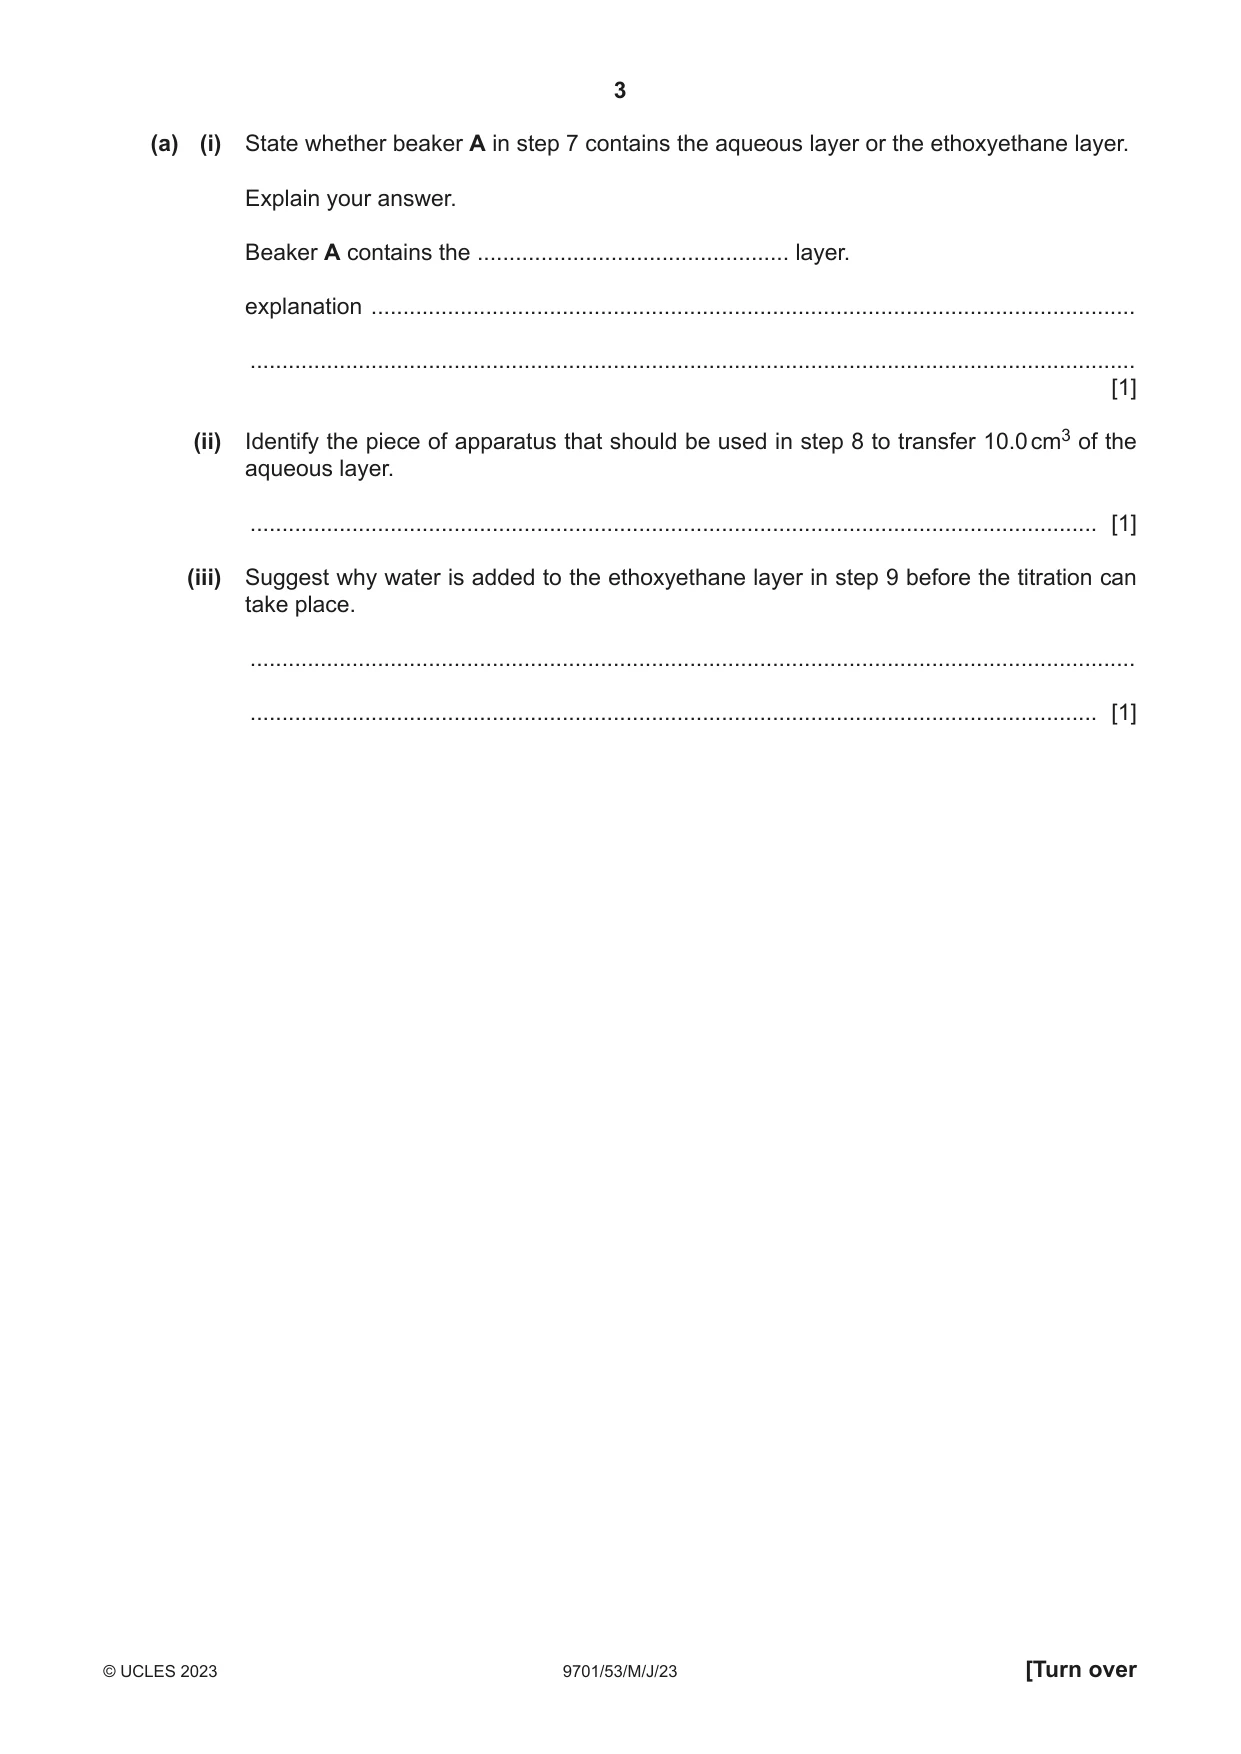
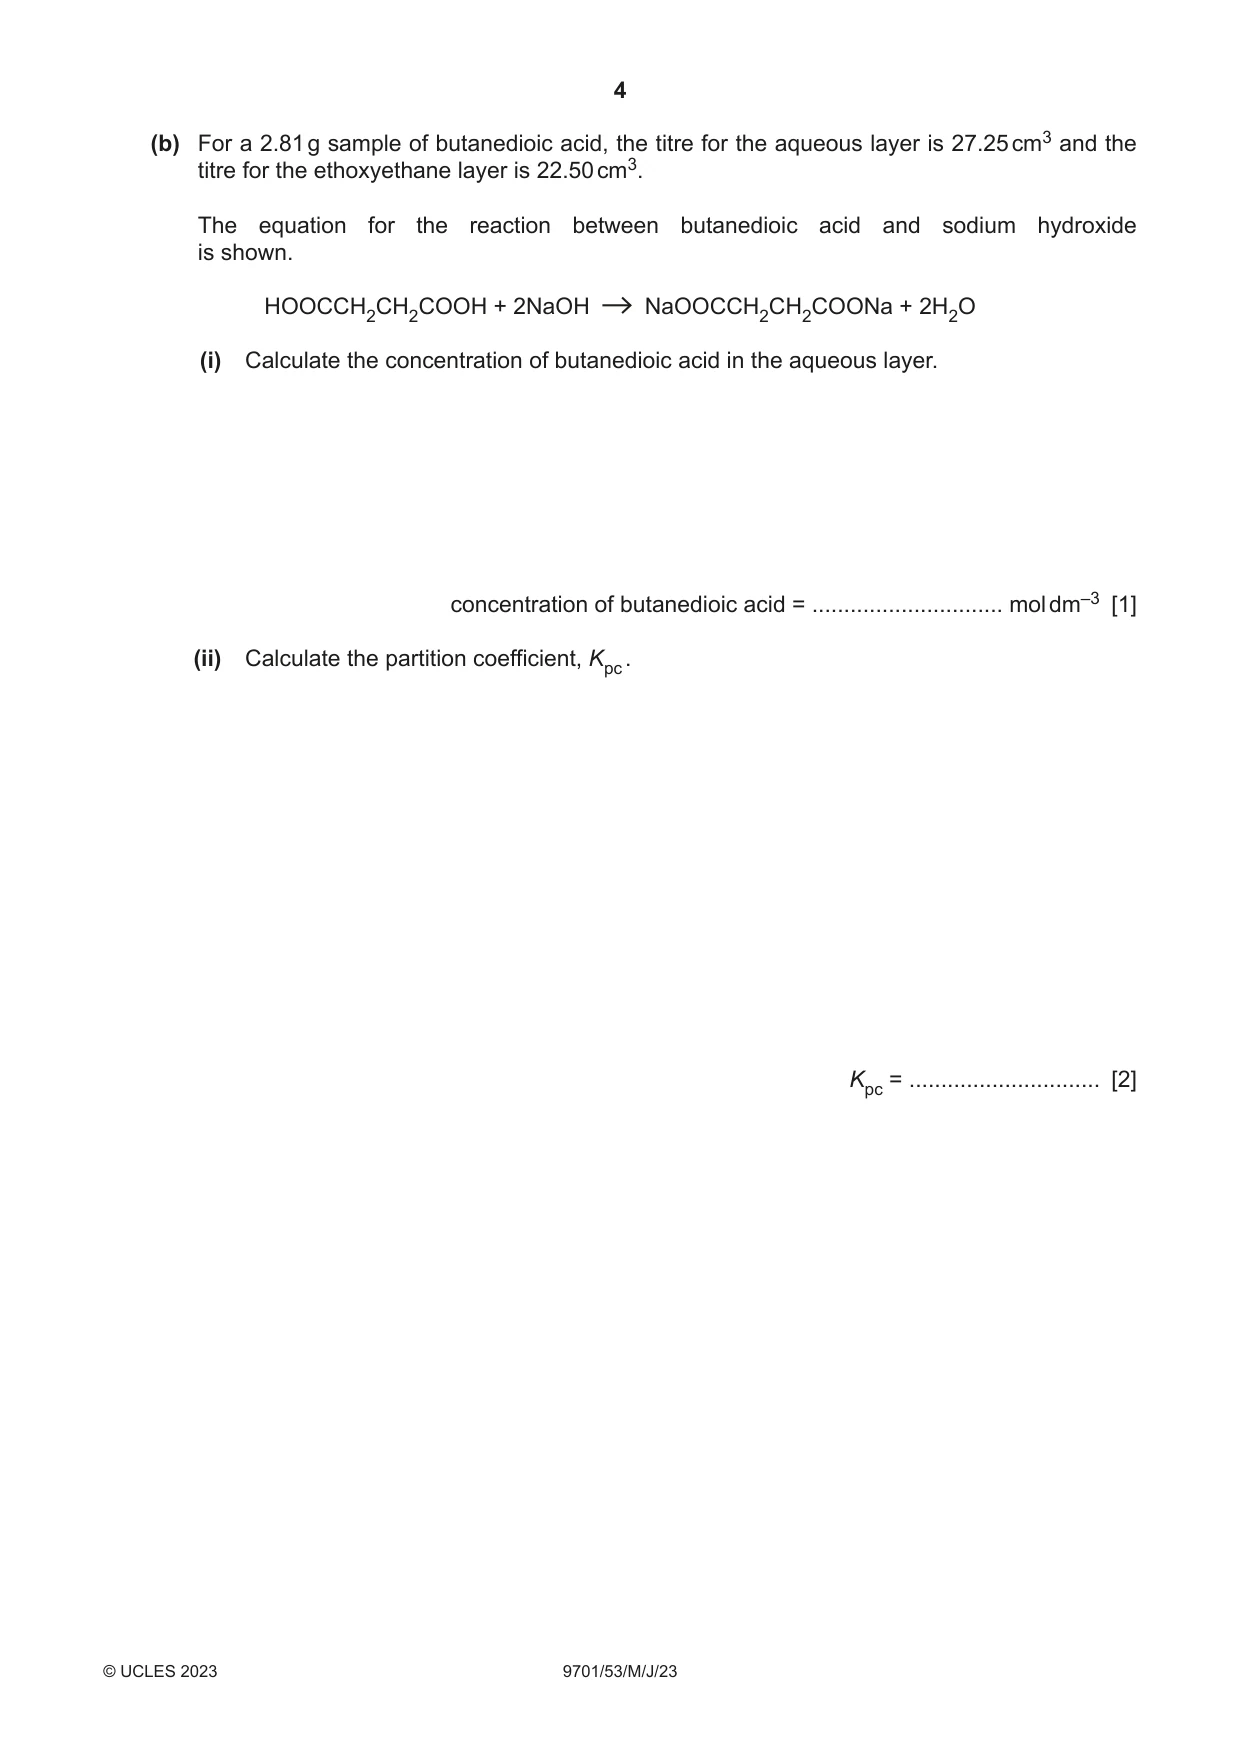
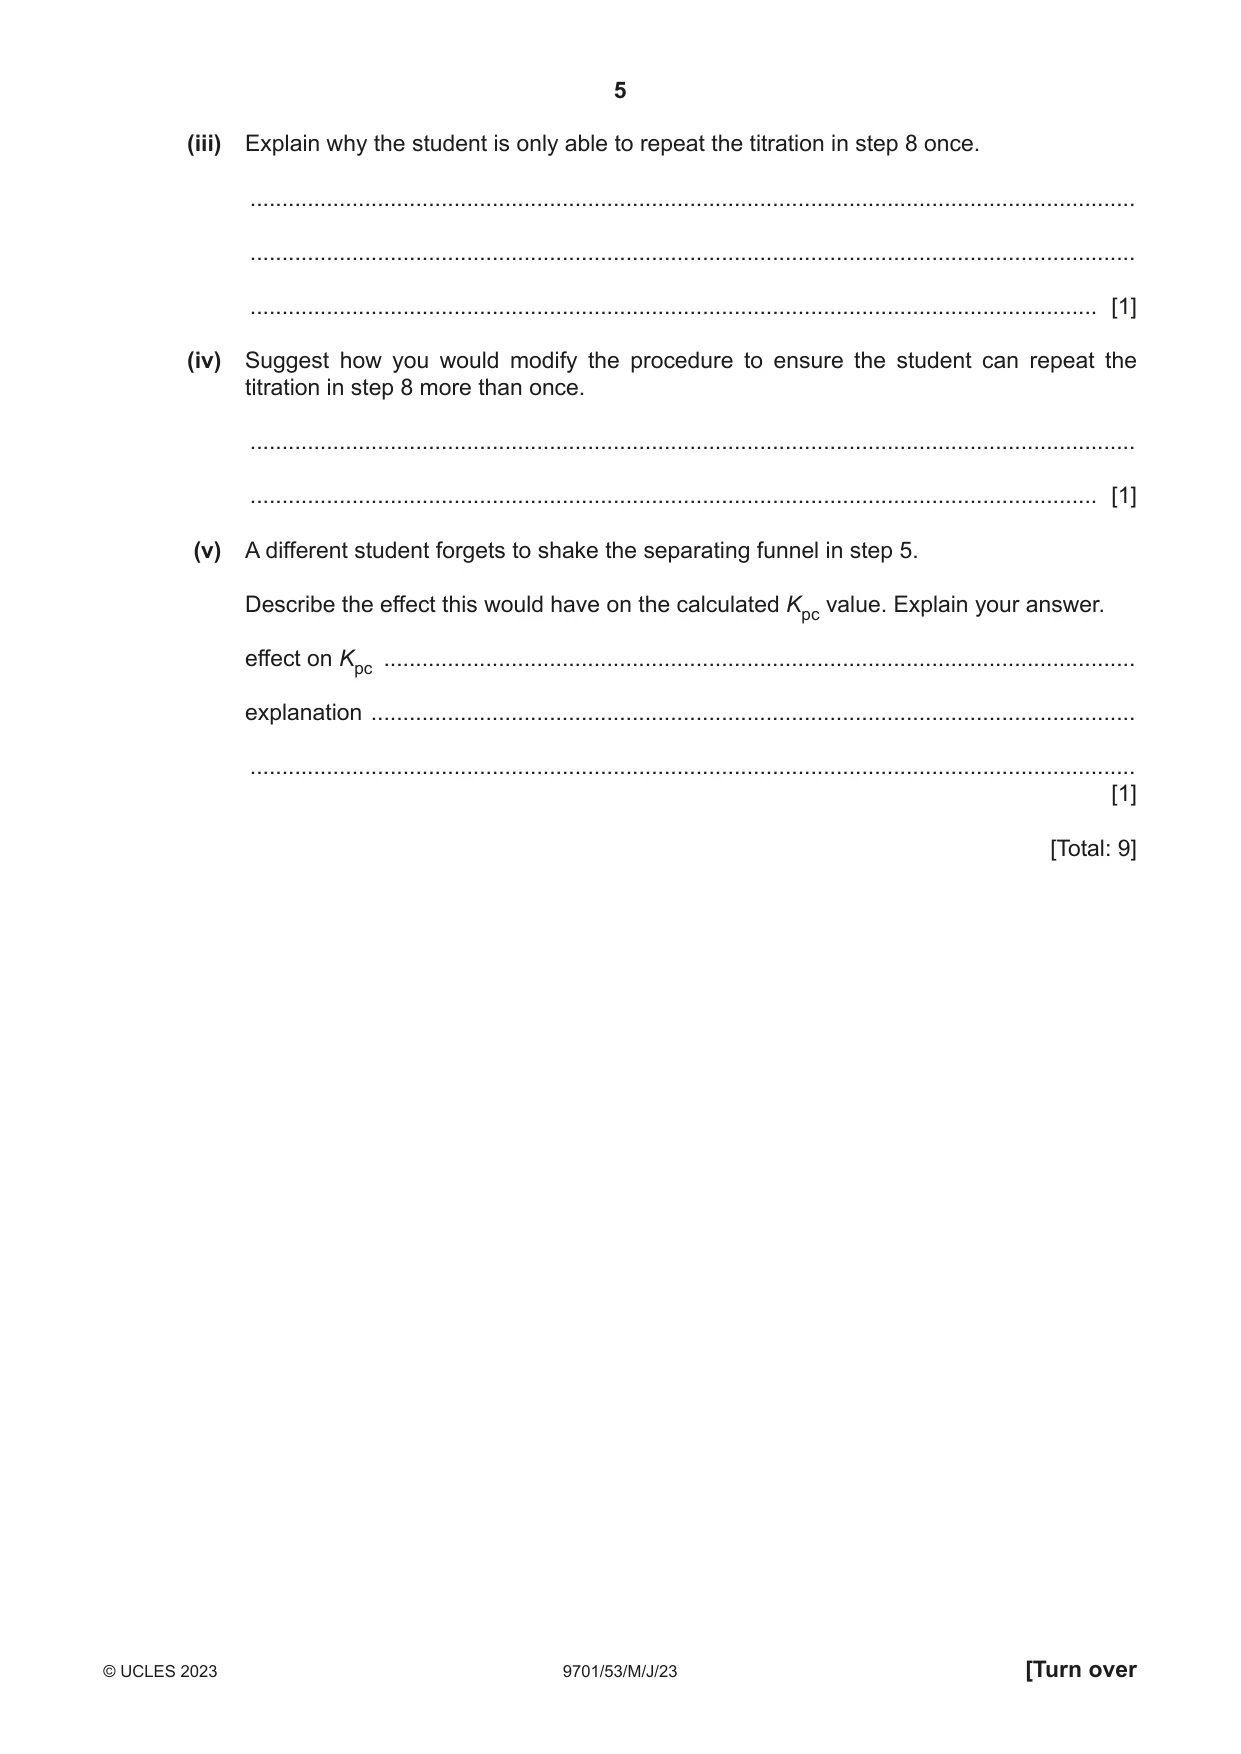
1 The partition coefficient, Kpc, shows the distribution of a solute between two immiscible solvents. Kpc is determined by measuring the concentration of the solute in each solvent. The organic solvent ethoxyethane, CH3CH2OCH2CH3, and water are immiscible. A student is asked to find Kpc of butanedioic acid, HOOCCH2CH2COOH, between ethoxyethane and water. The expression for Kpc when butanedioic acid is in equilibrium between ethoxyethane and water is shown. [HOOCCH2CH2COOH(ethoxyethane)] Kpc = [HOOCCH2CH2COOH(aq)] [density: ethoxyethane, 0.71 g cm–3; water, 1.00 g cm–3] The student uses the following method to find the partition coefficient. A diagram of the apparatus is shown in Fig. 1.1. step 1 Add 30.0 cm3 of distilled water to a separating funnel. step 2 Weigh by difference 2.81 g of butanedioic acid into the separating funnel. step 3 Stopper the separating funnel and shake it until the butanedioic acid has dissolved. step 4 Remove the stopper and add 30.0 cm3 of ethoxyethane to the separating funnel. step 5 Replace the stopper and shake the separating funnel gently. step 6 Place the separating funnel into a clamp. Allow the liquids to settle so that the two layers can be seen. step 7 Remove the stopper and open the separating funnel tap to allow the lower layer to run into a beaker labelled A. Run the upper layer into a beaker labelled B. step 8 Transfer 10.0 cm3 of the aqueous layer into a conical flask. Titrate with 0.500 mol dm–3 NaOH(aq). Use thymolphthalein as the indicator. step 9 Take 10.0 cm3 of the ethoxyethane layer and add 10.0 cm3 of water to it. Titrate this mixture with 0.100 mol dm–3 NaOH(aq). Use thymolphthalein as the indicator. stopper separating funnel tap Fig. 1.1 (a) (i) State whether beaker A in step 7 contains the aqueous layer or the ethoxyethane layer. Explain your answer. Beaker A contains the ................................................. layer. explanation ........................................................................................................................ ........................................................................................................................................... [1] (ii) Identify the piece of apparatus that should be used in step 8 to transfer 10.0 cm3 of the aqueous layer. ..................................................................................................................................... [1] (iii) Suggest why water is added to the ethoxyethane layer in step 9 before the titration can take place. ........................................................................................................................................... ..................................................................................................................................... [1] (b) For a 2.81 g sample of butanedioic acid, the titre for the aqueous layer is 27.25 cm3 and the titre for the ethoxyethane layer is 22.50 cm3. The equation for the reaction between butanedioic acid and sodium hydroxide is shown. HOOCCH2CH2COOH + 2NaOH NaOOCCH2CH2COONa + 2H2O (i) Calculate the concentration of butanedioic acid in the aqueous layer. concentration of butanedioic acid = .............................. mol dm–3 [1] (ii) Calculate the partition coefficient, Kpc . Kpc = .............................. [2] (iii) Explain why the student is only able to repeat the titration in step 8 once. ........................................................................................................................................... ........................................................................................................................................... ..................................................................................................................................... [1] (iv) Suggest how you would modify the procedure to ensure the student can repeat the titration in step 8 more than once. ........................................................................................................................................... ..................................................................................................................................... [1] (v) A different student forgets to shake the separating funnel in step 5. Describe the effect this would have on the calculated Kpc value. Explain your answer. effect on Kpc ...................................................................................................................... explanation ........................................................................................................................ ........................................................................................................................................... [1] [Total: 9]
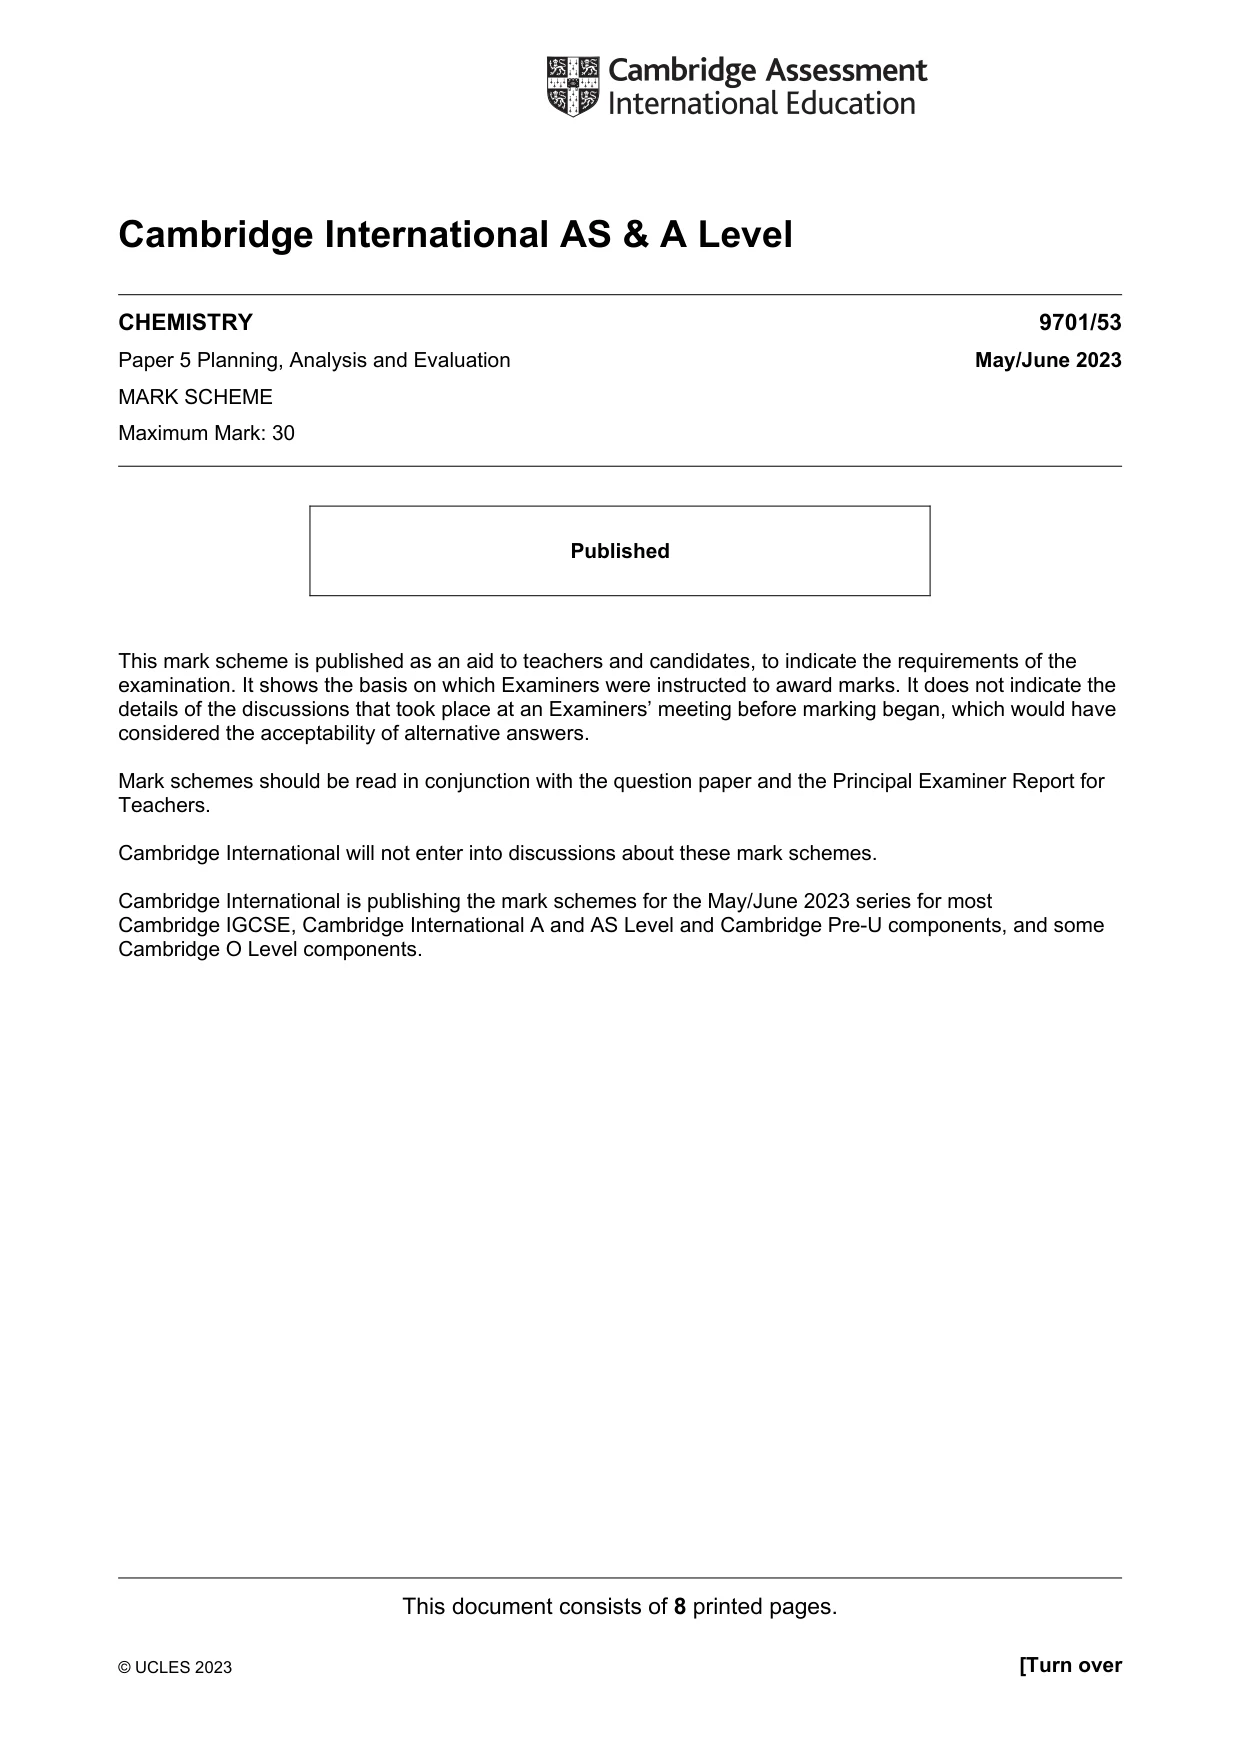
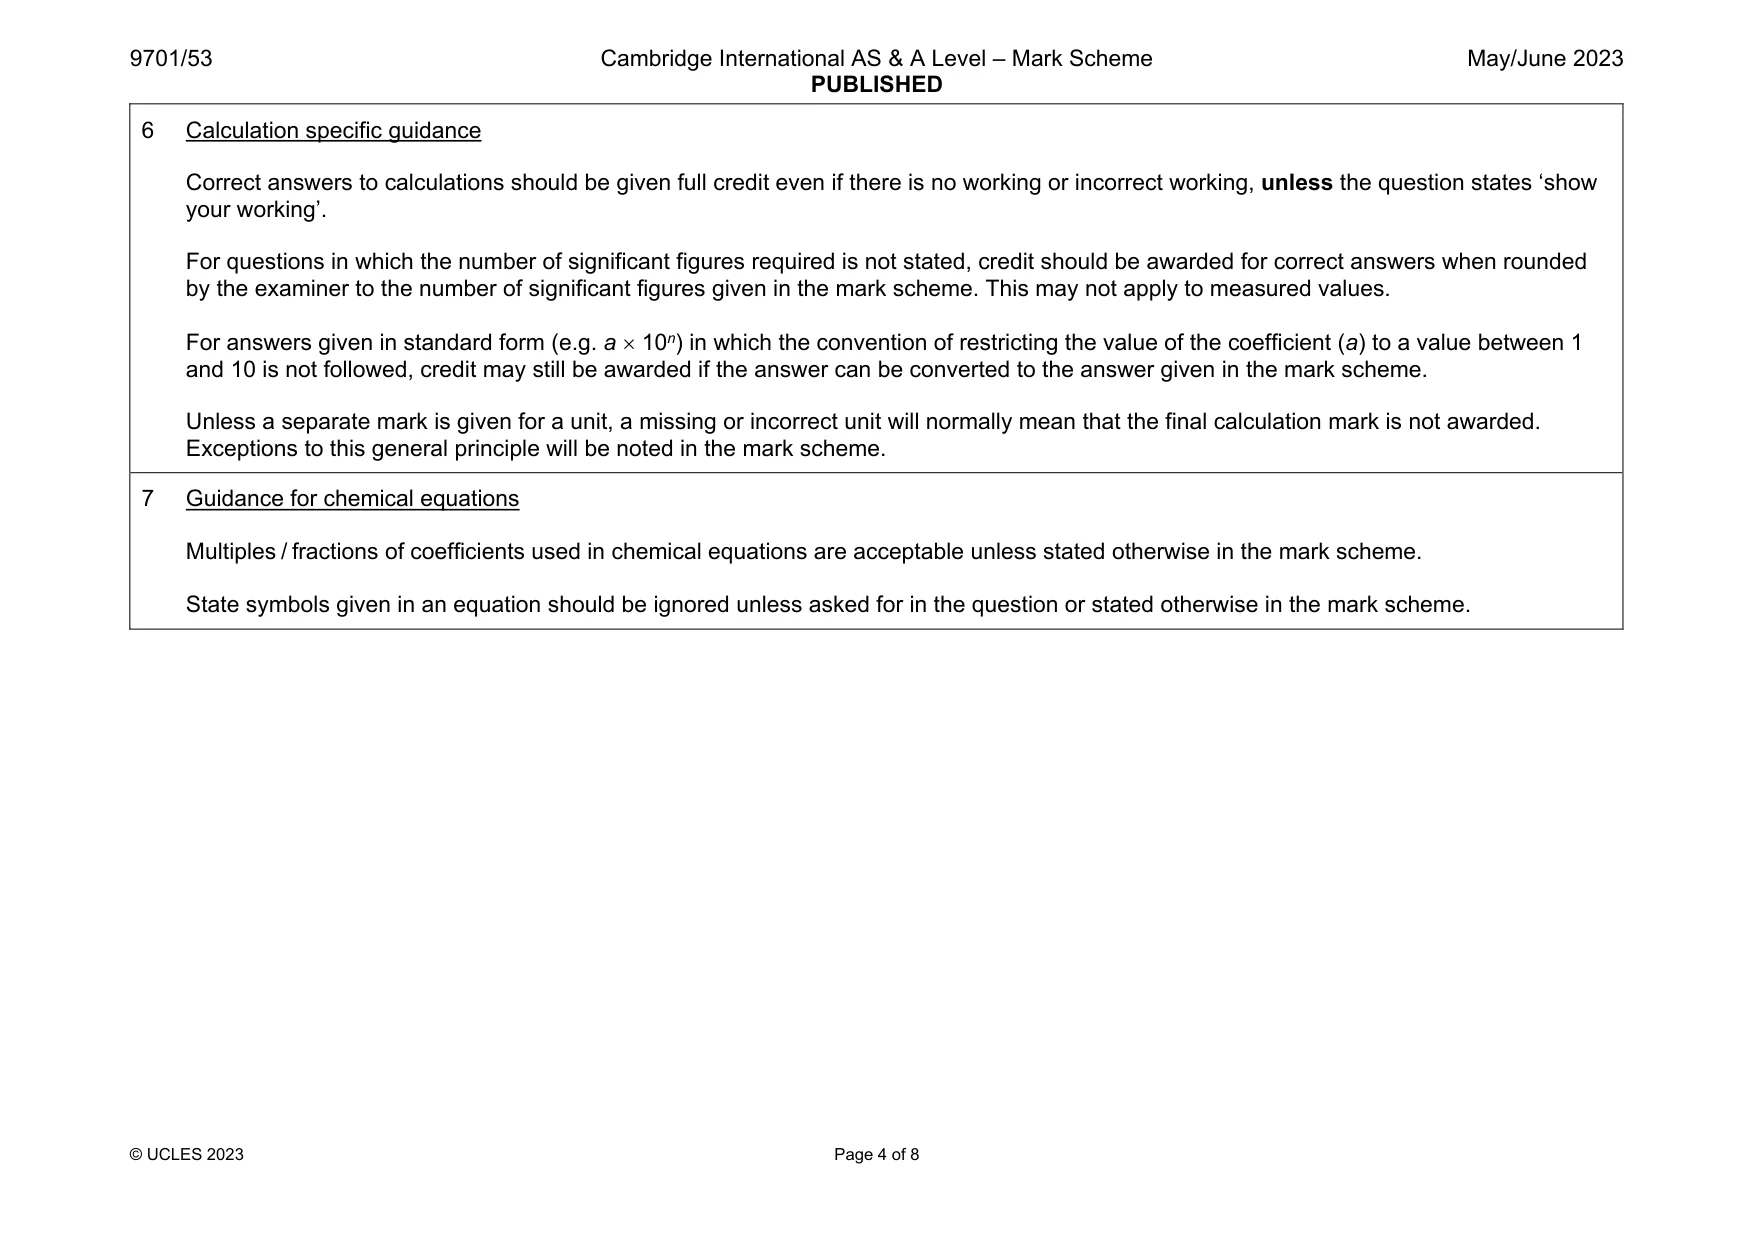
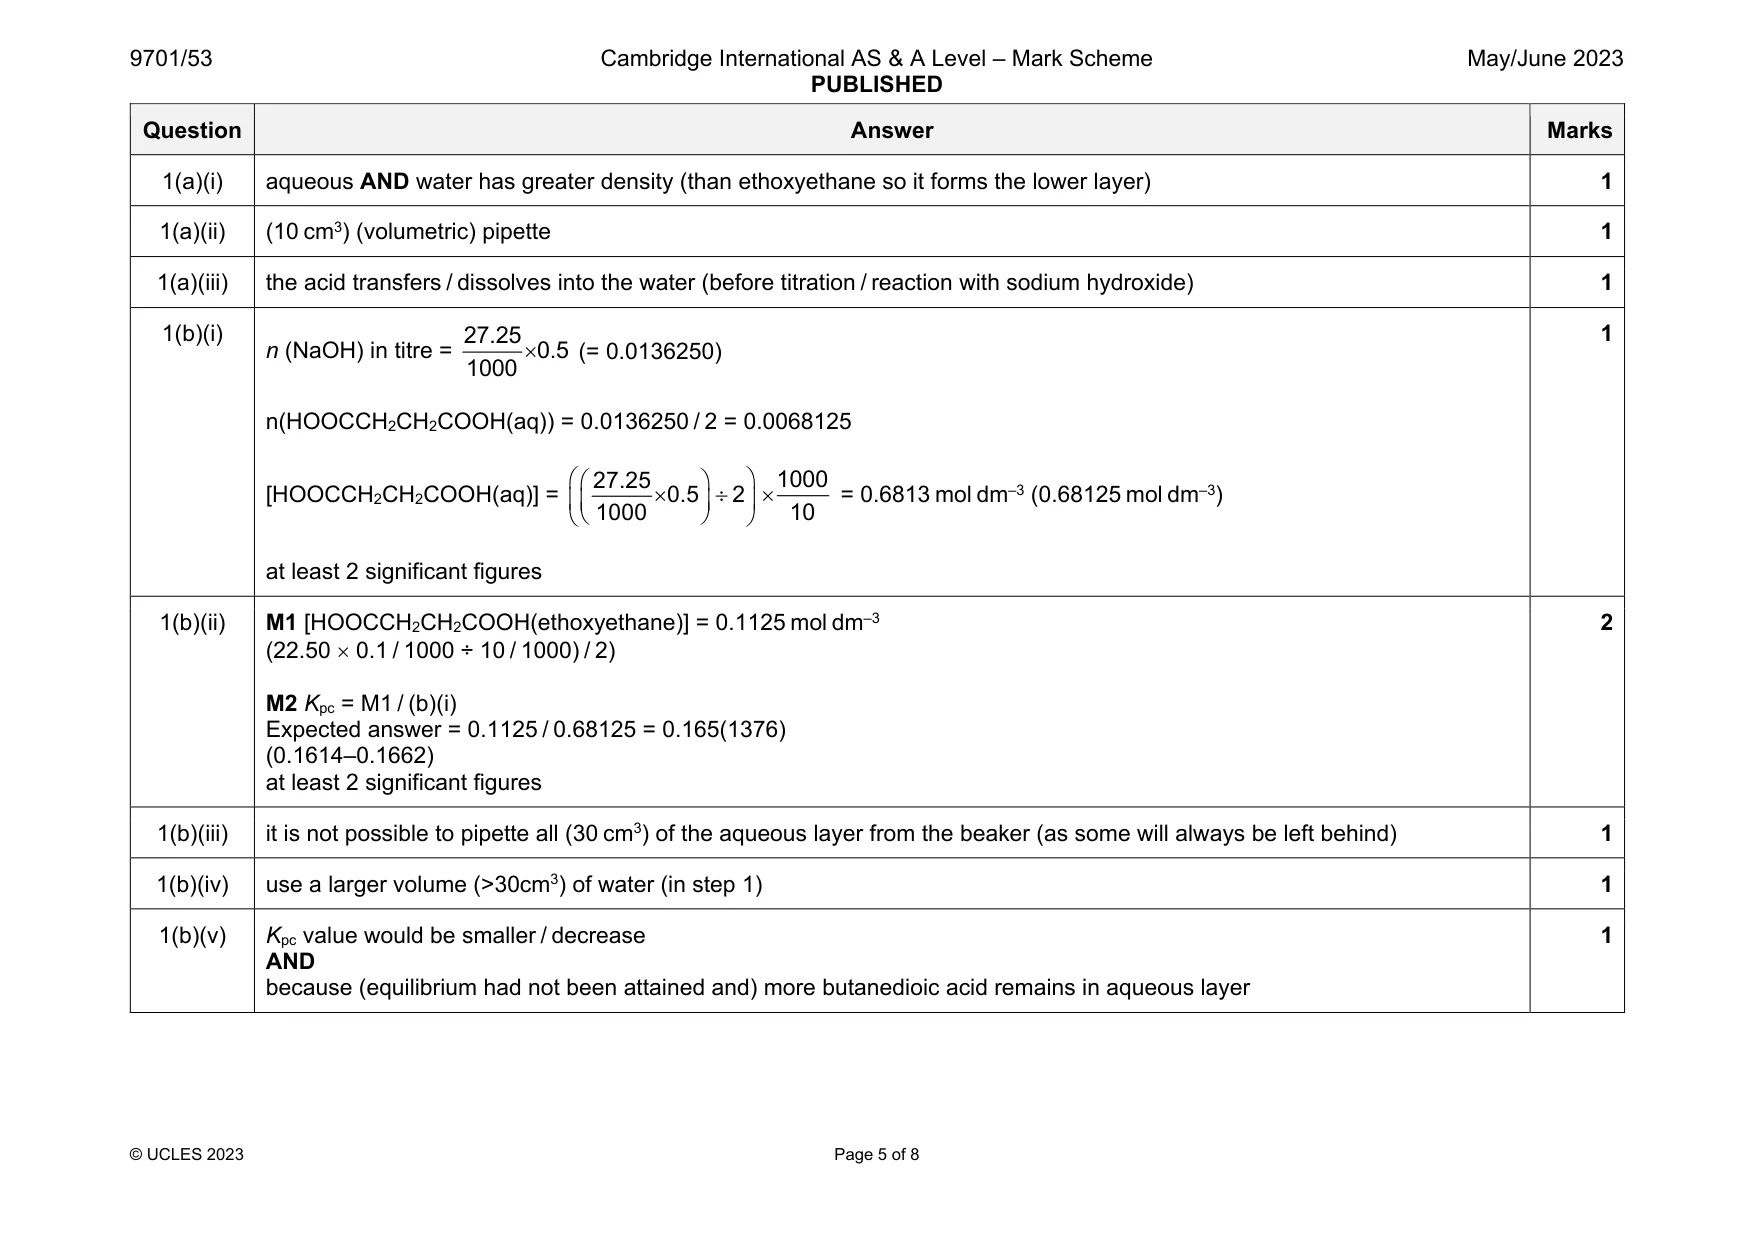
Mark scheme: 1(a)(i) aqueous AND water has greater density (than ethoxyethane so it forms the lower layer) 1 1(a)(ii) (10 cm3) (volumetric) pipette 1 1(a)(iii) the acid transfers / dissolves into the water (before titration / reaction with sodium hydroxide) 1 1(b)(i) n (NaOH) in titre = 27.25 0.5 1000 (= 0.0136250) n(HOOCCH2CH2COOH(aq)) = 0.0136250 / 2 = 0.0068125 [HOOCCH2CH2COOH(aq)] = 27.25 0.5 2 1000 1000 10 = 0.6813 mol dm–3 (0.68125 mol dm–3) at least 2 significant figures 1 1(b)(ii) M1 [HOOCCH2CH2COOH(ethoxyethane)] = 0.1125 mol dm–3 (22.50 0.1 / 1000 ÷ 10 / 1000) / 2) M2 Kpc = M1 / (b)(i) Expected answer = 0.1125 / 0.68125 = 0.165(1376) (0.1614–0.1662) at least 2 significant figures 2 1(b)(iii) it is not possible to pipette all (30 cm3) of the aqueous layer from the beaker (as some will always be left behind) 1 1(b)(iv) use a larger volume (>30cm3) of water (in step 1) 1 1(b)(v) Kpc value would be smaller / decrease AND because (equilibrium had not been attained and) more butanedioic acid remains in aqueous layer 1
Q2 · Paper chromatography can be used to separate the individual amino acids formed when…
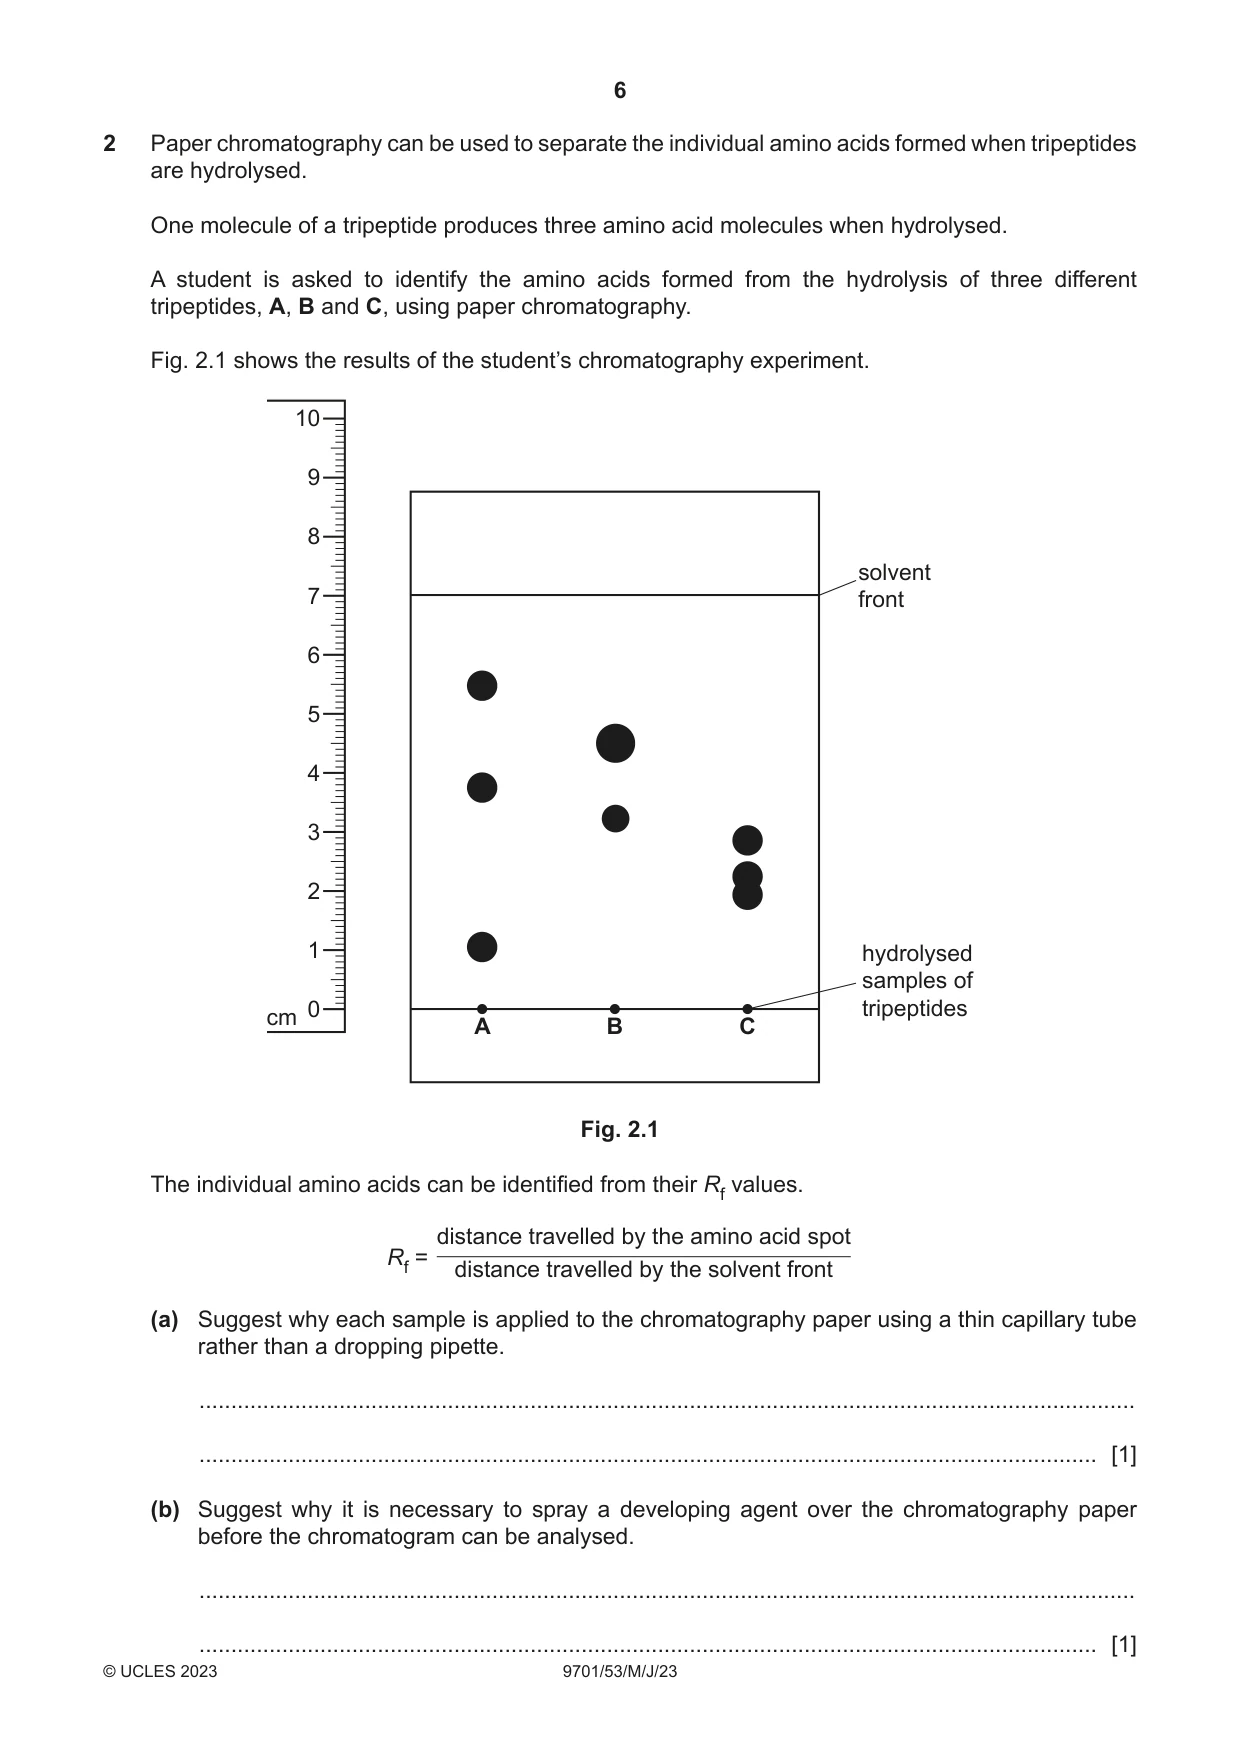
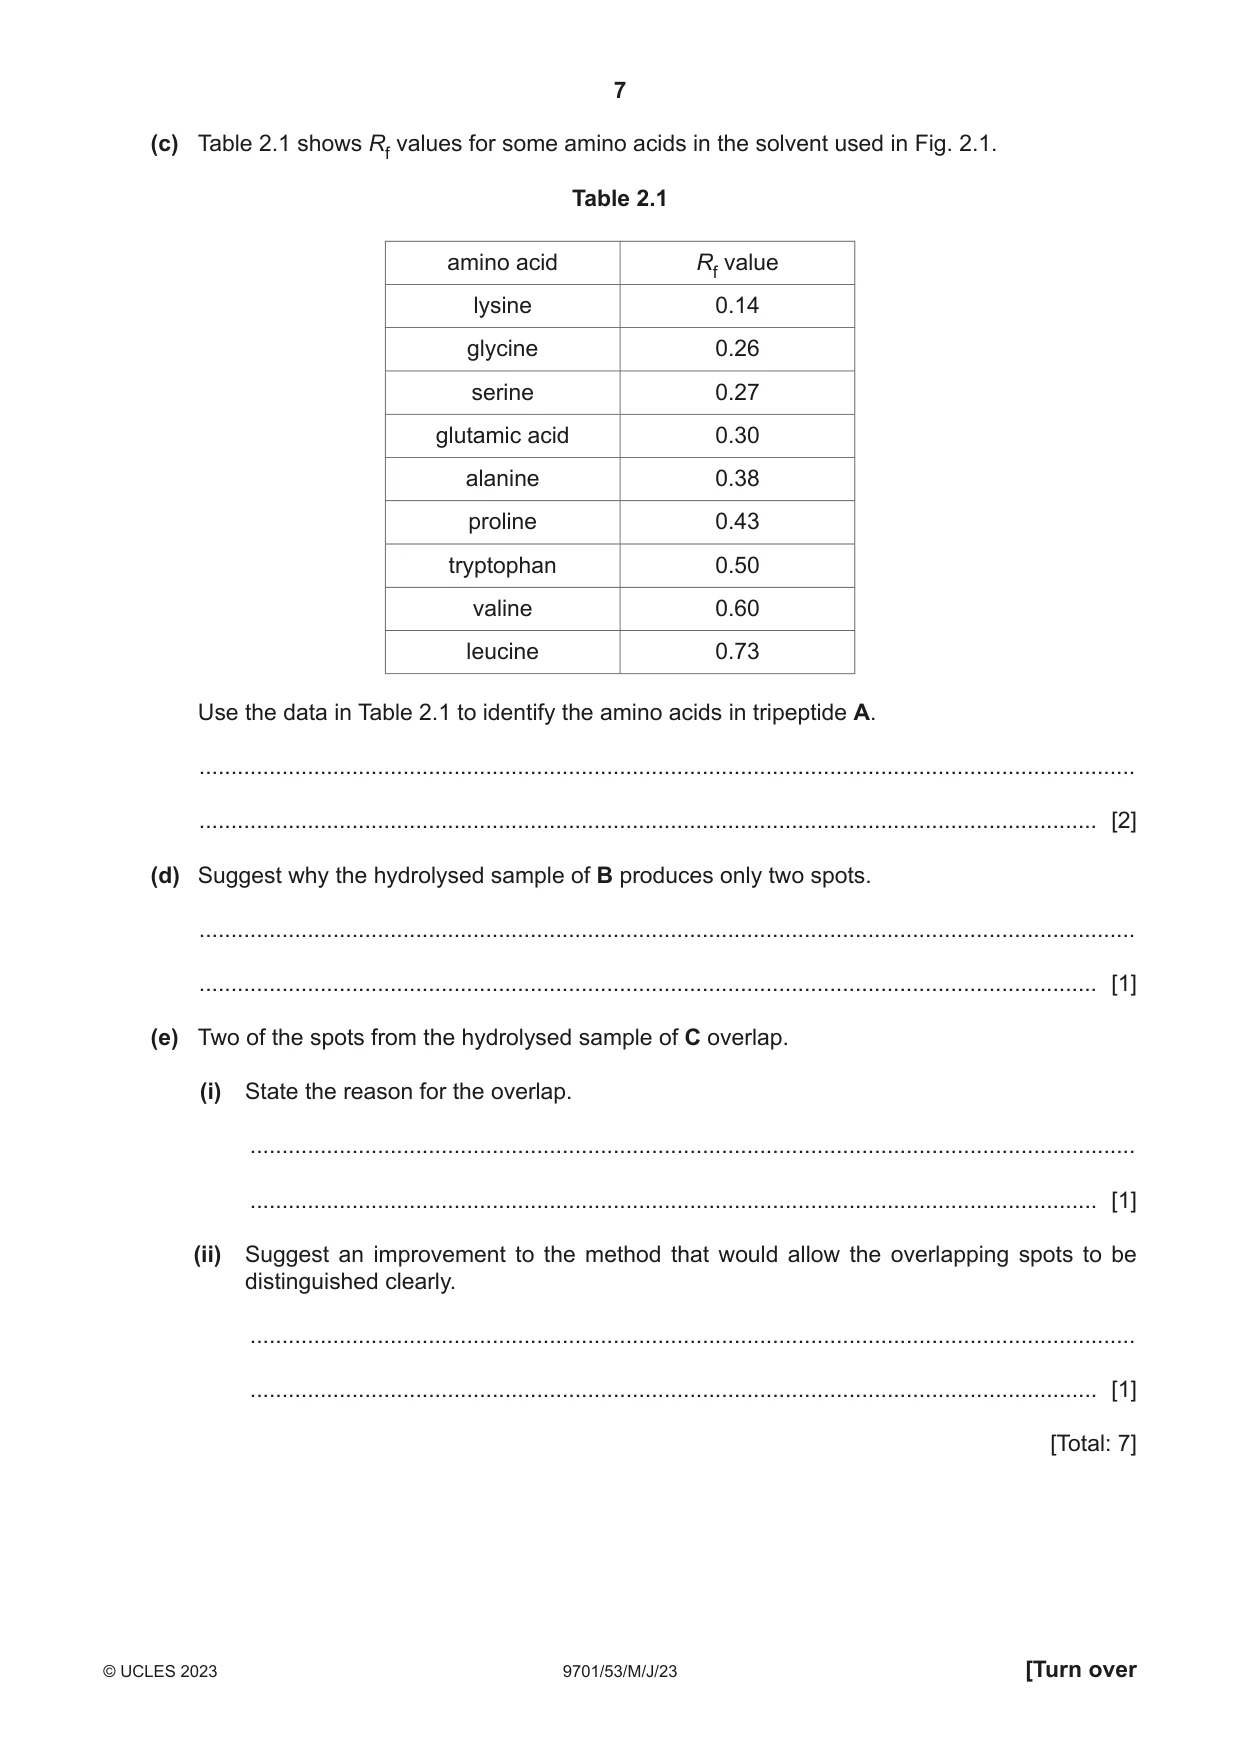
2 Paper chromatography can be used to separate the individual amino acids formed when tripeptides are hydrolysed. One molecule of a tripeptide produces three amino acid molecules when hydrolysed. A student is asked to identify the amino acids formed from the hydrolysis of three different tripeptides, A, B and C, using paper chromatography. Fig. 2.1 shows the results of the student’s chromatography experiment. 10 9 8 solvent 7 front 6 5 4 3 2 1 hydrolysed samples of 0 tripeptides cm A B C Fig. 2.1 The individual amino acids can be identified from their Rf values. distance travelled by the amino acid spot Rf = distance travelled by the solvent front (a) Suggest why each sample is applied to the chromatography paper using a thin capillary tube rather than a dropping pipette. ................................................................................................................................................... ............................................................................................................................................. [1] (b) Suggest why it is necessary to spray a developing agent over the chromatography paper before the chromatogram can be analysed. ................................................................................................................................................... ............................................................................................................................................. [1] (c) Table 2.1 shows Rf values for some amino acids in the solvent used in Fig. 2.1. Table 2.1 amino acid Rf value lysine 0.14 glycine 0.26 serine 0.27 glutamic acid 0.30 alanine 0.38 proline 0.43 tryptophan 0.50 valine 0.60 leucine 0.73 Use the data in Table 2.1 to identify the amino acids in tripeptide A. ................................................................................................................................................... ............................................................................................................................................. [2] (d) Suggest why the hydrolysed sample of B produces only two spots. ................................................................................................................................................... ............................................................................................................................................. [1] (e) Two of the spots from the hydrolysed sample of C overlap. (i) State the reason for the overlap. ........................................................................................................................................... ..................................................................................................................................... [1] (ii) Suggest an improvement to the method that would allow the overlapping spots to be distinguished clearly. ........................................................................................................................................... ..................................................................................................................................... [1] [Total: 7]
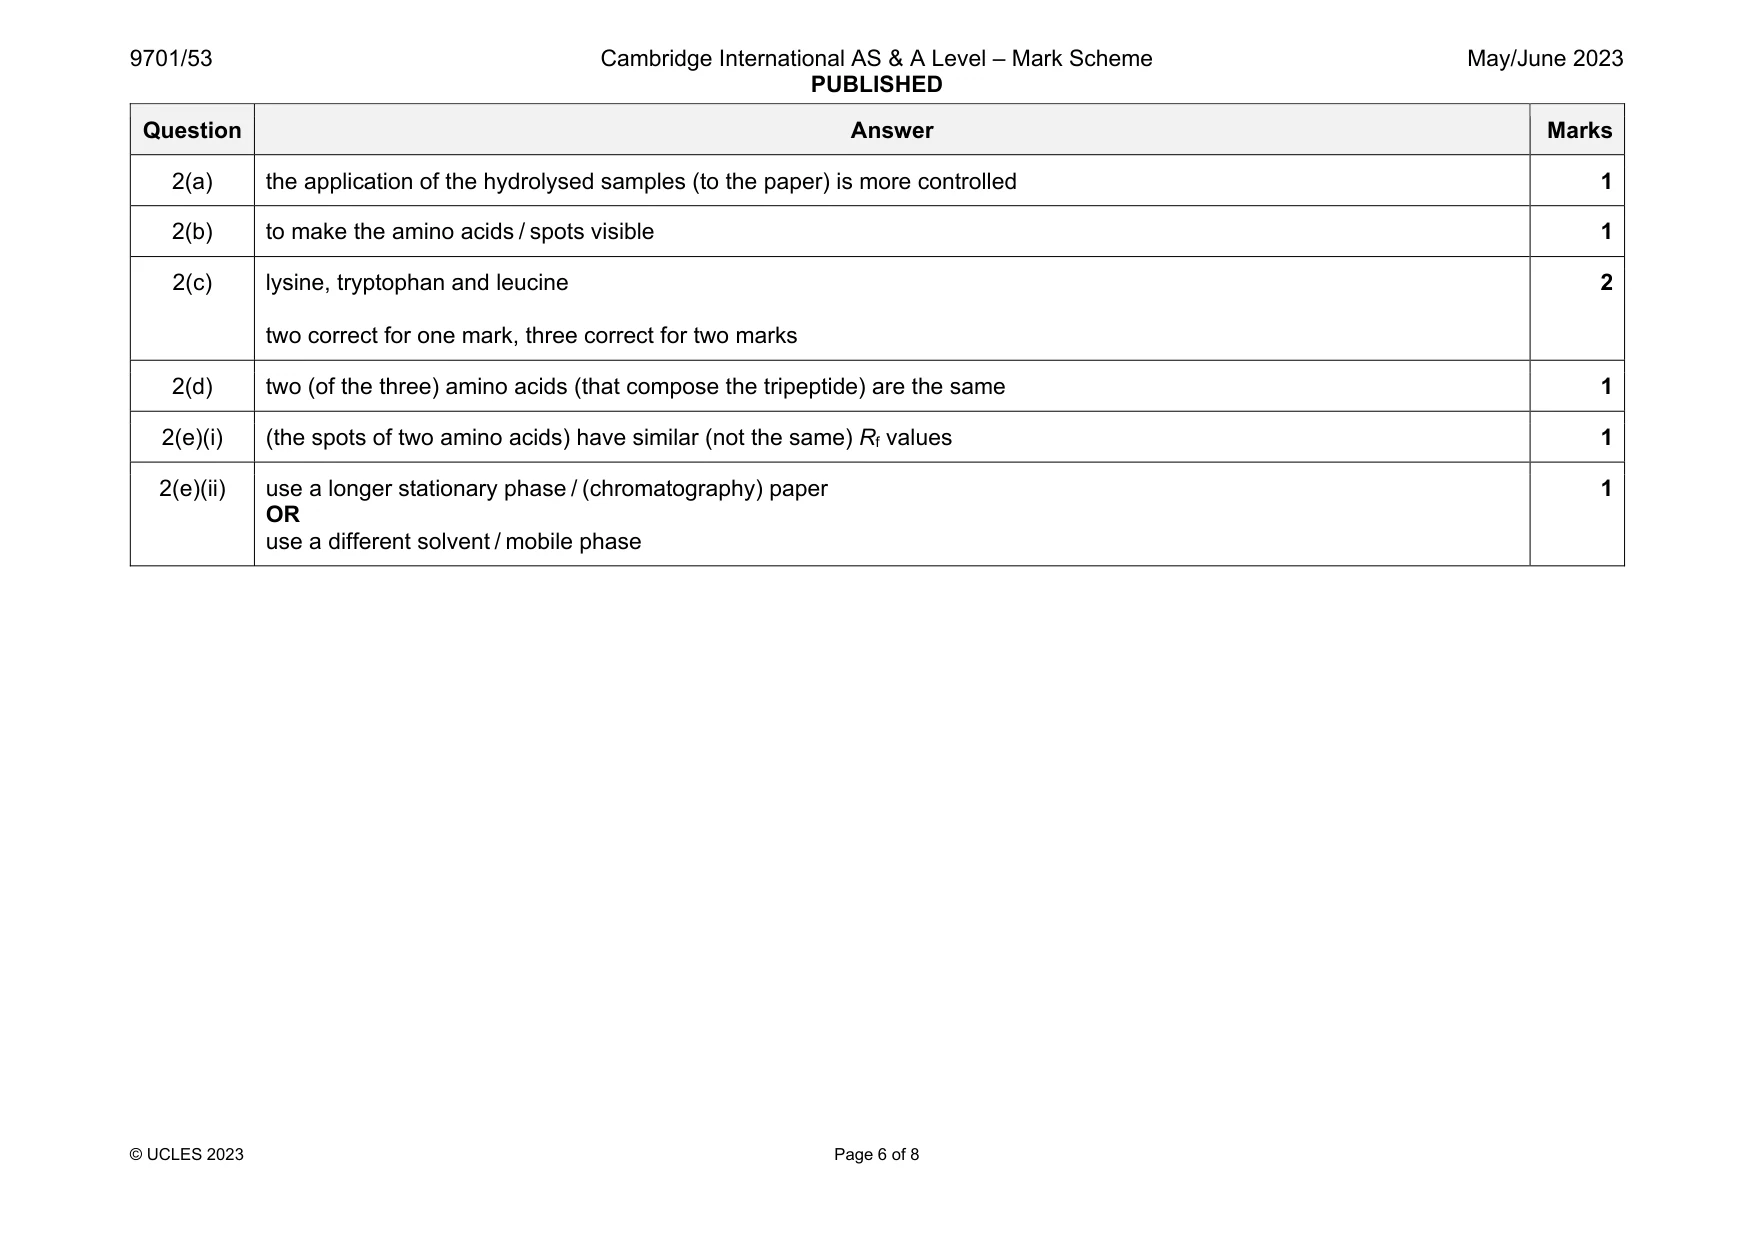
Mark scheme: 2(a) the application of the hydrolysed samples (to the paper) is more controlled 1 2(b) to make the amino acids / spots visible 1 2(c) lysine, tryptophan and leucine two correct for one mark, three correct for two marks 2 2(d) two (of the three) amino acids (that compose the tripeptide) are the same 1 2(e)(i) (the spots of two amino acids) have similar (not the same) Rf values 1 2(e)(ii) use a longer stationary phase / (chromatography) paper OR use a different solvent / mobile phase 1
Q3 · A scientist is asked to find the rate of decomposition of an aromatic diazonium compound…
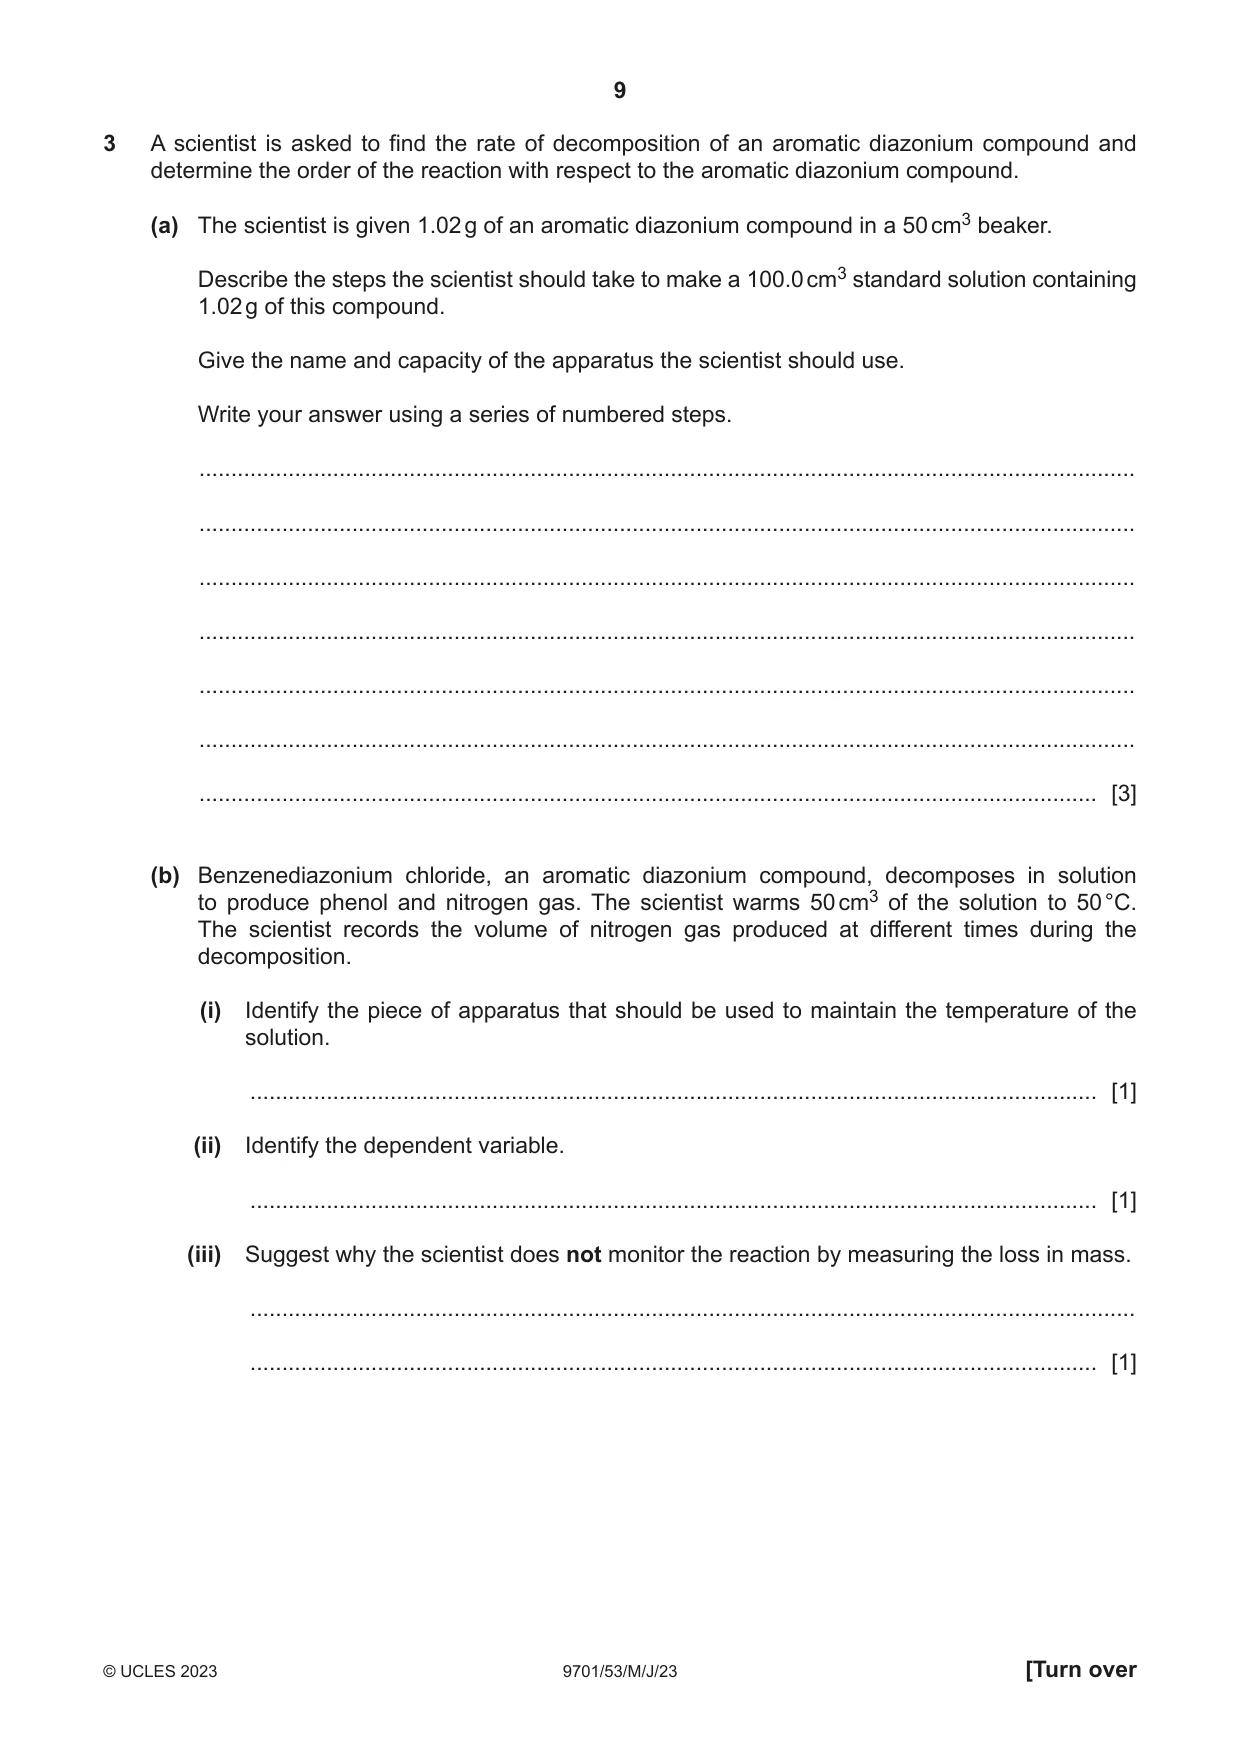
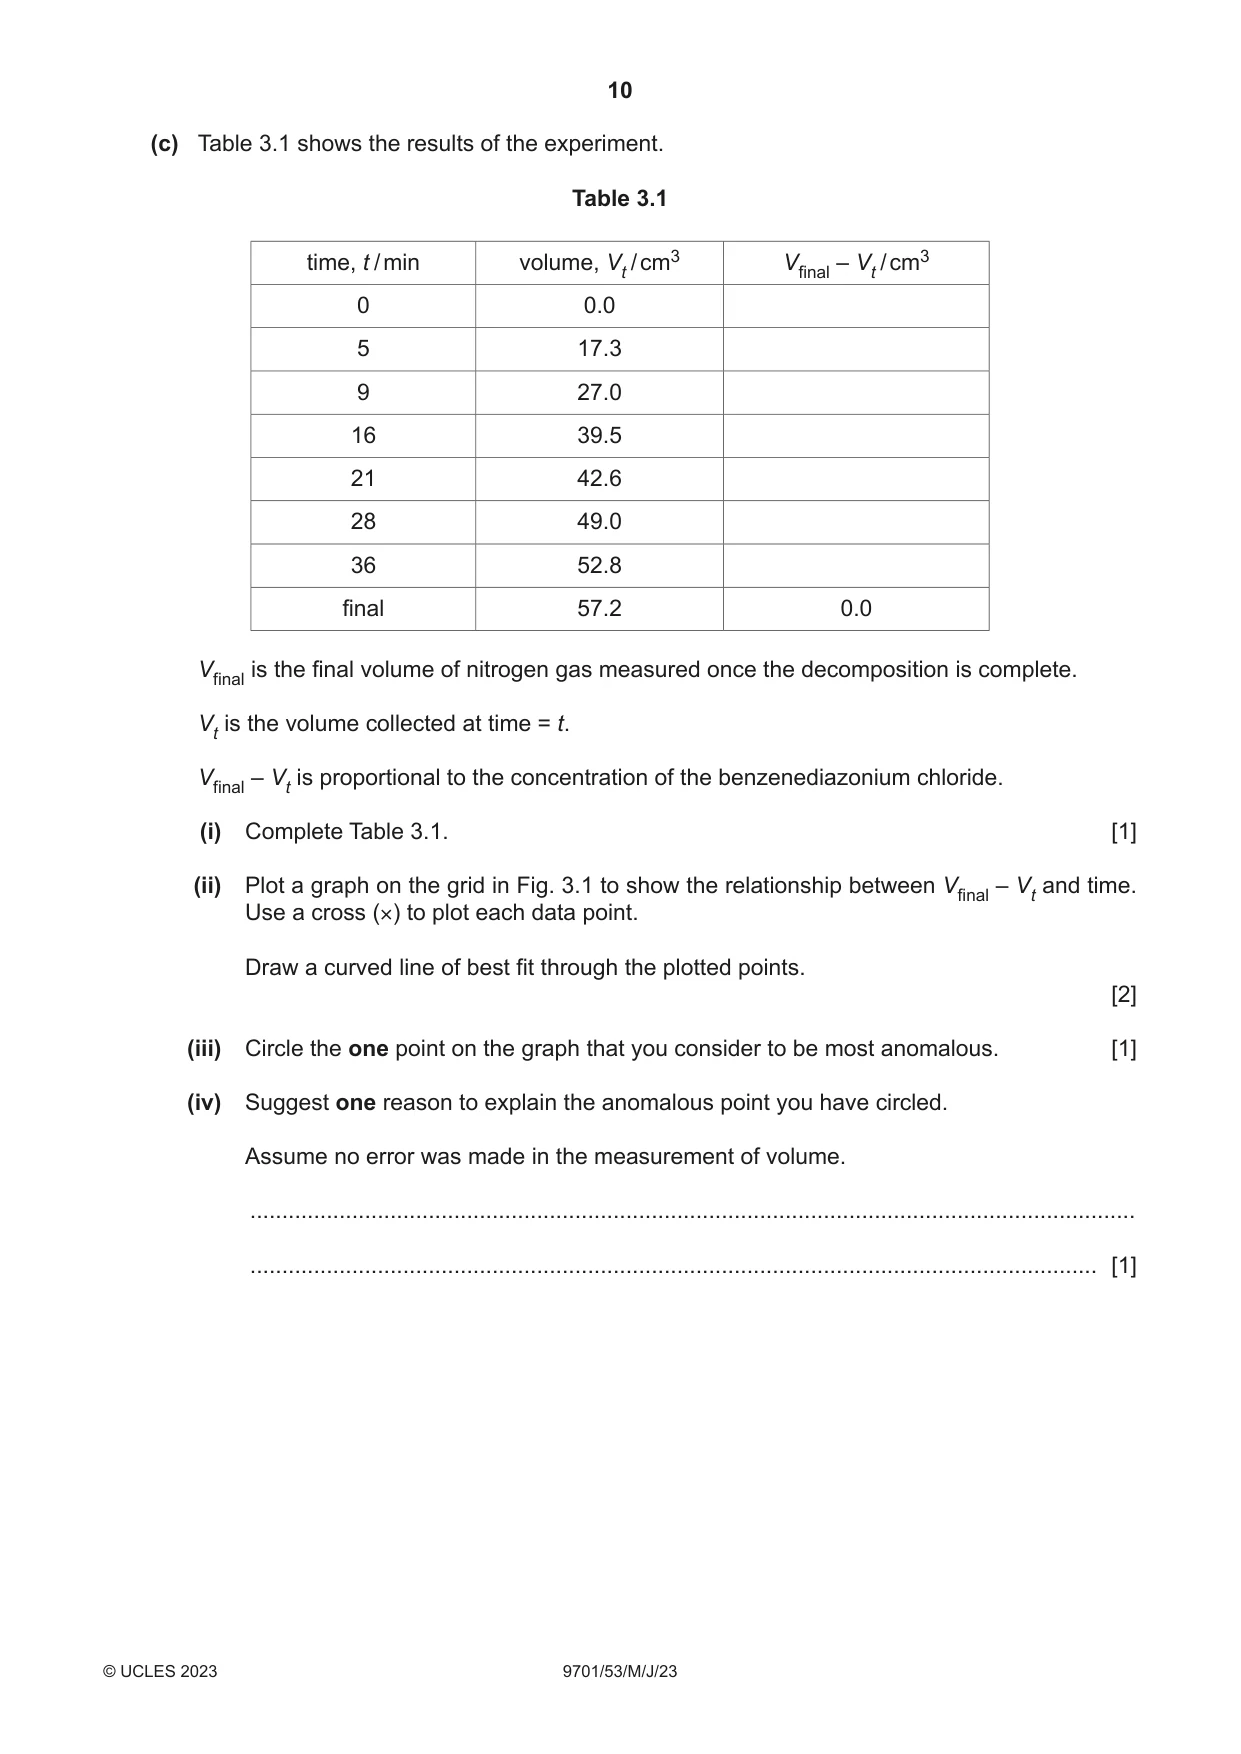
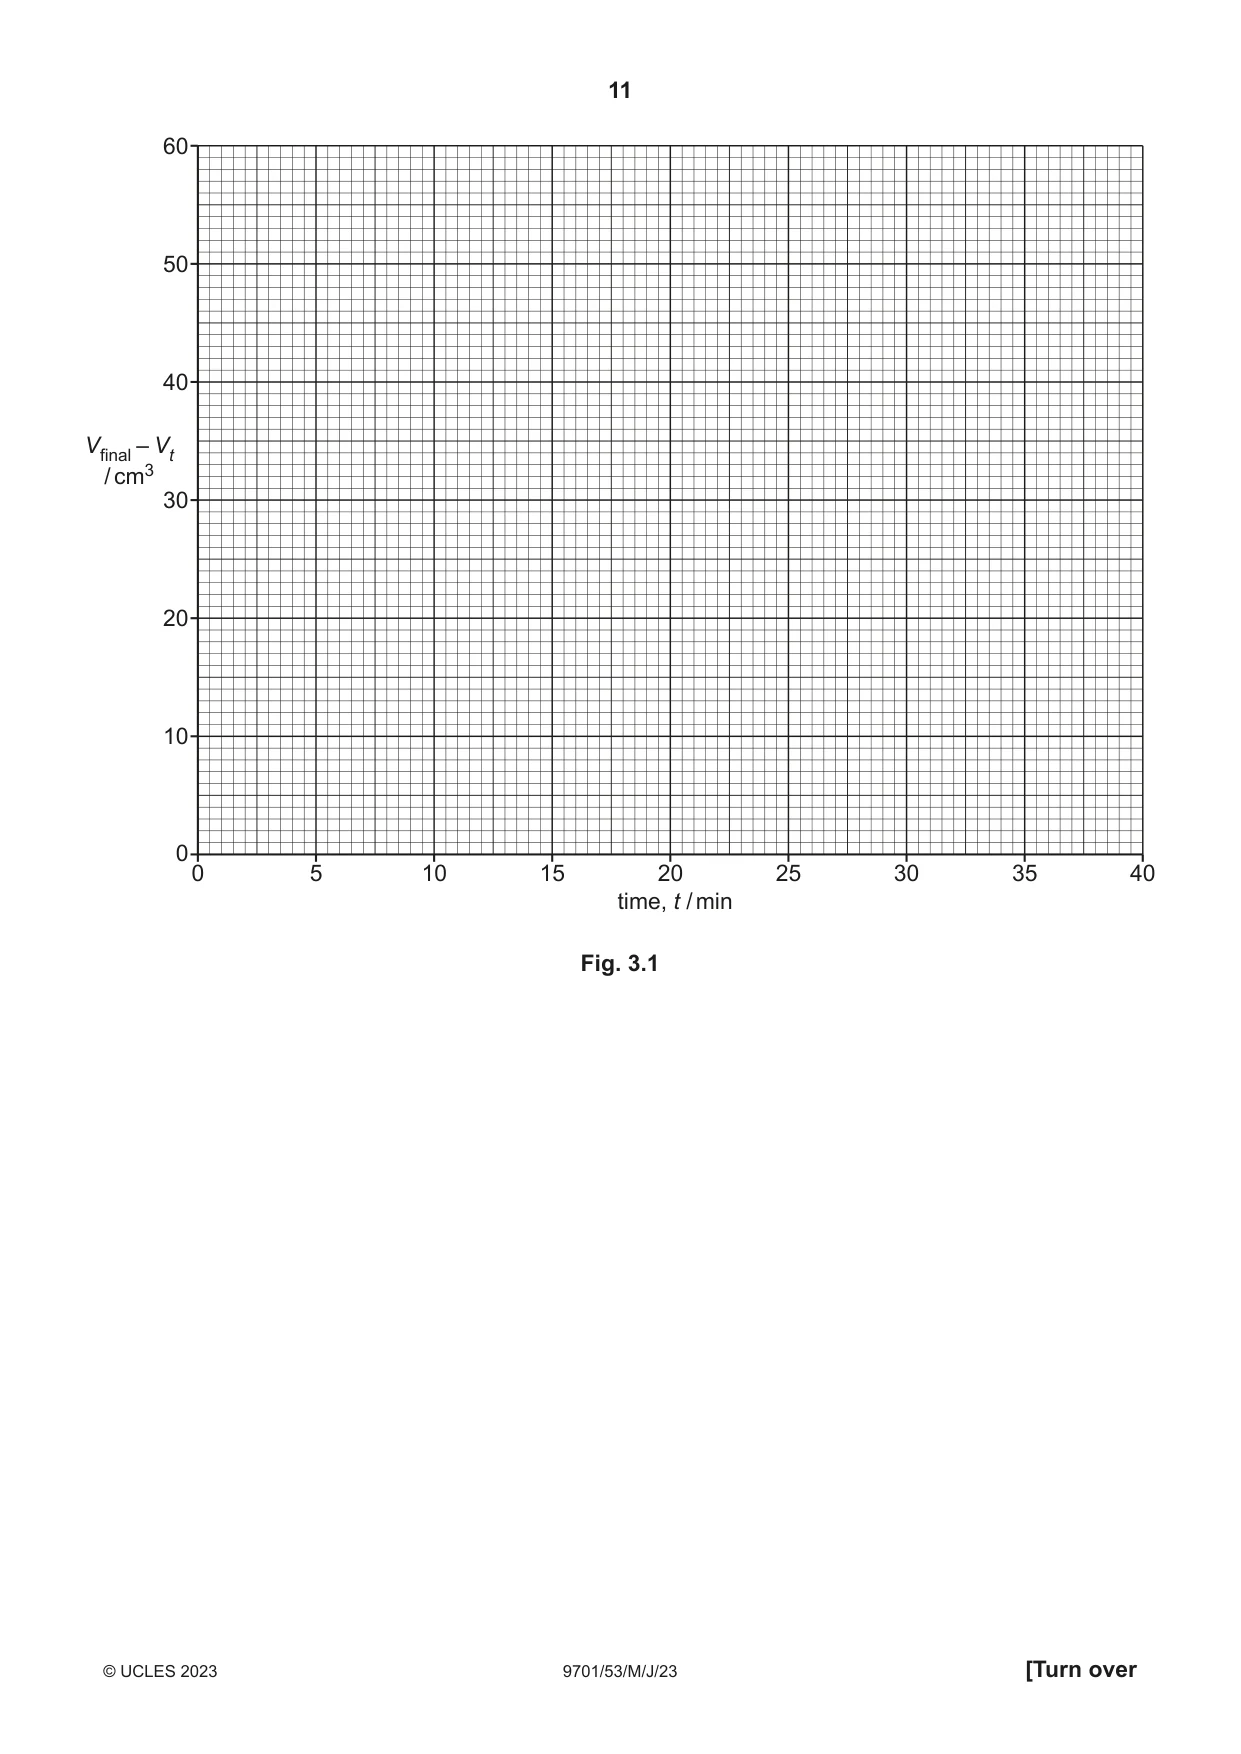
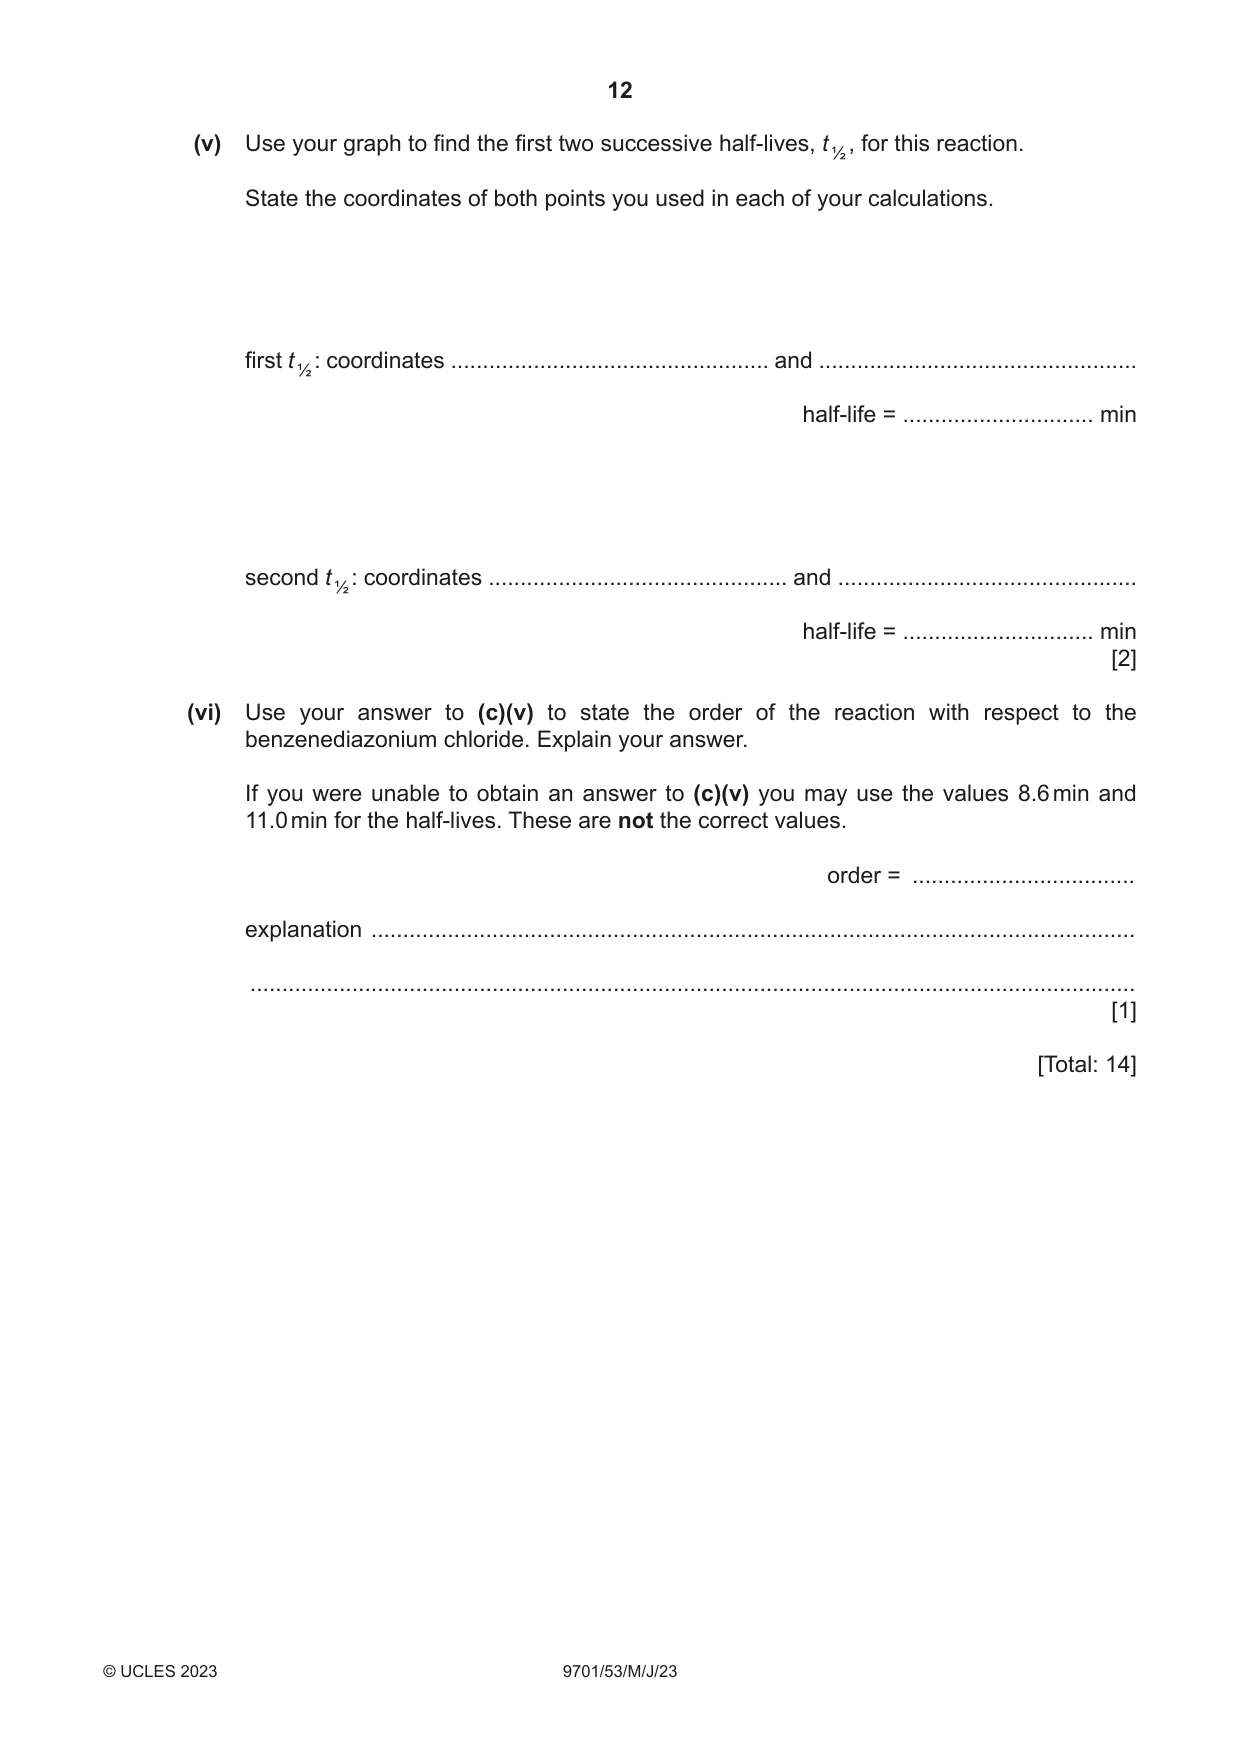
3 A scientist is asked to find the rate of decomposition of an aromatic diazonium compound and determine the order of the reaction with respect to the aromatic diazonium compound. (a) The scientist is given 1.02 g of an aromatic diazonium compound in a 50 cm3 beaker. Describe the steps the scientist should take to make a 100.0 cm3 standard solution containing 1.02 g of this compound. Give the name and capacity of the apparatus the scientist should use. Write your answer using a series of numbered steps. ................................................................................................................................................... ................................................................................................................................................... ................................................................................................................................................... ................................................................................................................................................... ................................................................................................................................................... ................................................................................................................................................... ............................................................................................................................................. [3] (b) Benzenediazonium chloride, an aromatic diazonium compound, decomposes in solution to produce phenol and nitrogen gas. The scientist warms 50 cm3 of the solution to 50 °C. The scientist records the volume of nitrogen gas produced at different times during the decomposition. (i) Identify the piece of apparatus that should be used to maintain the temperature of the solution. ..................................................................................................................................... [1] (ii) Identify the dependent variable. ..................................................................................................................................... [1] (iii) Suggest why the scientist does not monitor the reaction by measuring the loss in mass. ........................................................................................................................................... ..................................................................................................................................... [1] (c) Table 3.1 shows the results of the experiment. Table 3.1 time, t / min volume, Vt / cm3 Vfinal – Vt / cm3 0 0.0 5 17.3 9 27.0 16 39.5 21 42.6 28 49.0 36 52.8 final 57.2 0.0 Vfinal is the final volume of nitrogen gas measured once the decomposition is complete. Vt is the volume collected at time = t. Vfinal – Vt is proportional to the concentration of the benzenediazonium chloride. (i) Complete Table 3.1. [1] (ii) Plot a graph on the grid in Fig. 3.1 to show the relationship between Vfinal – Vt and time. Use a cross (×) to plot each data point. Draw a curved line of best fit through the plotted points. [2] (iii) Circle the one point on the graph that you consider to be most anomalous. [1] (iv) Suggest one reason to explain the anomalous point you have circled. Assume no error was made in the measurement of volume. ........................................................................................................................................... ..................................................................................................................................... [1] 60 50 40 Vfinal – Vt / cm3 30 20 10 0 0 5 10 15 20 25 30 35 40 time, t / min Fig. 3.1
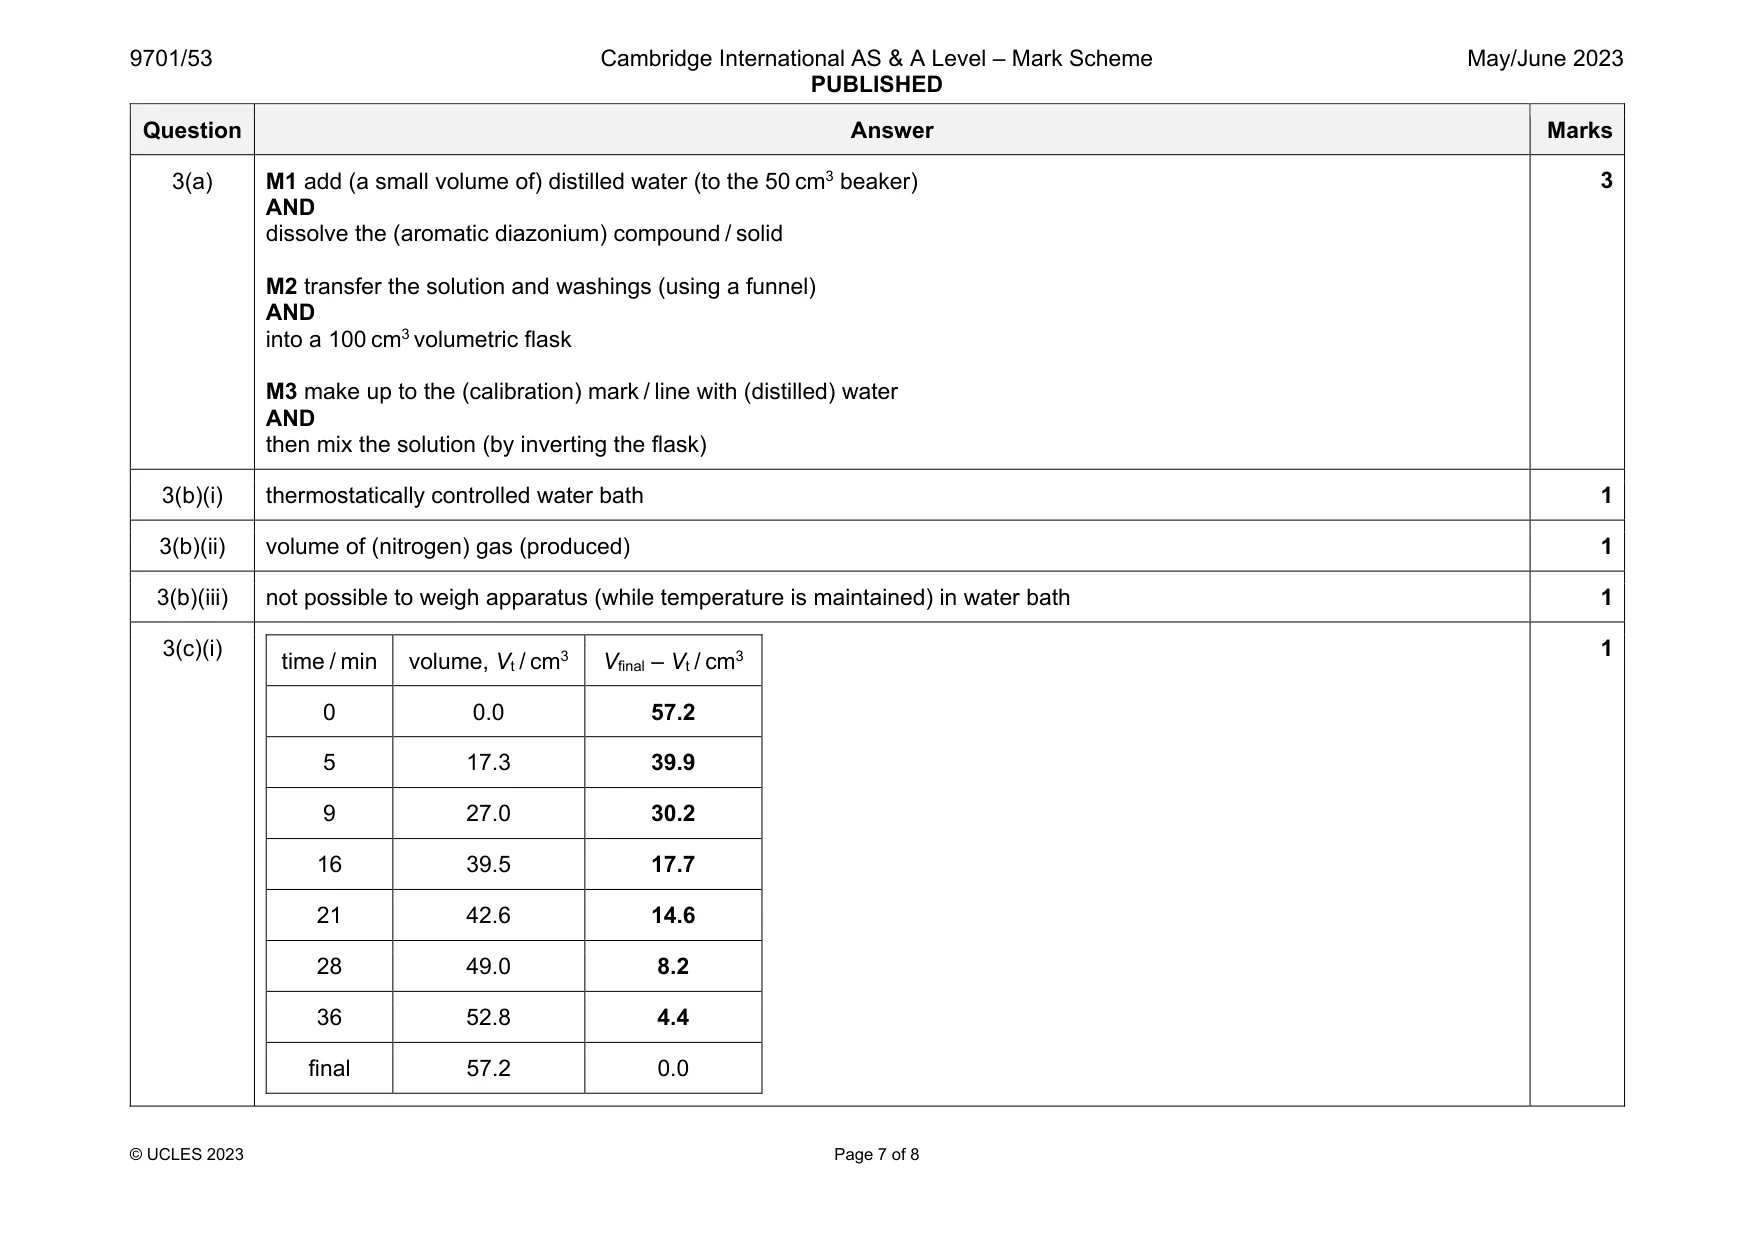
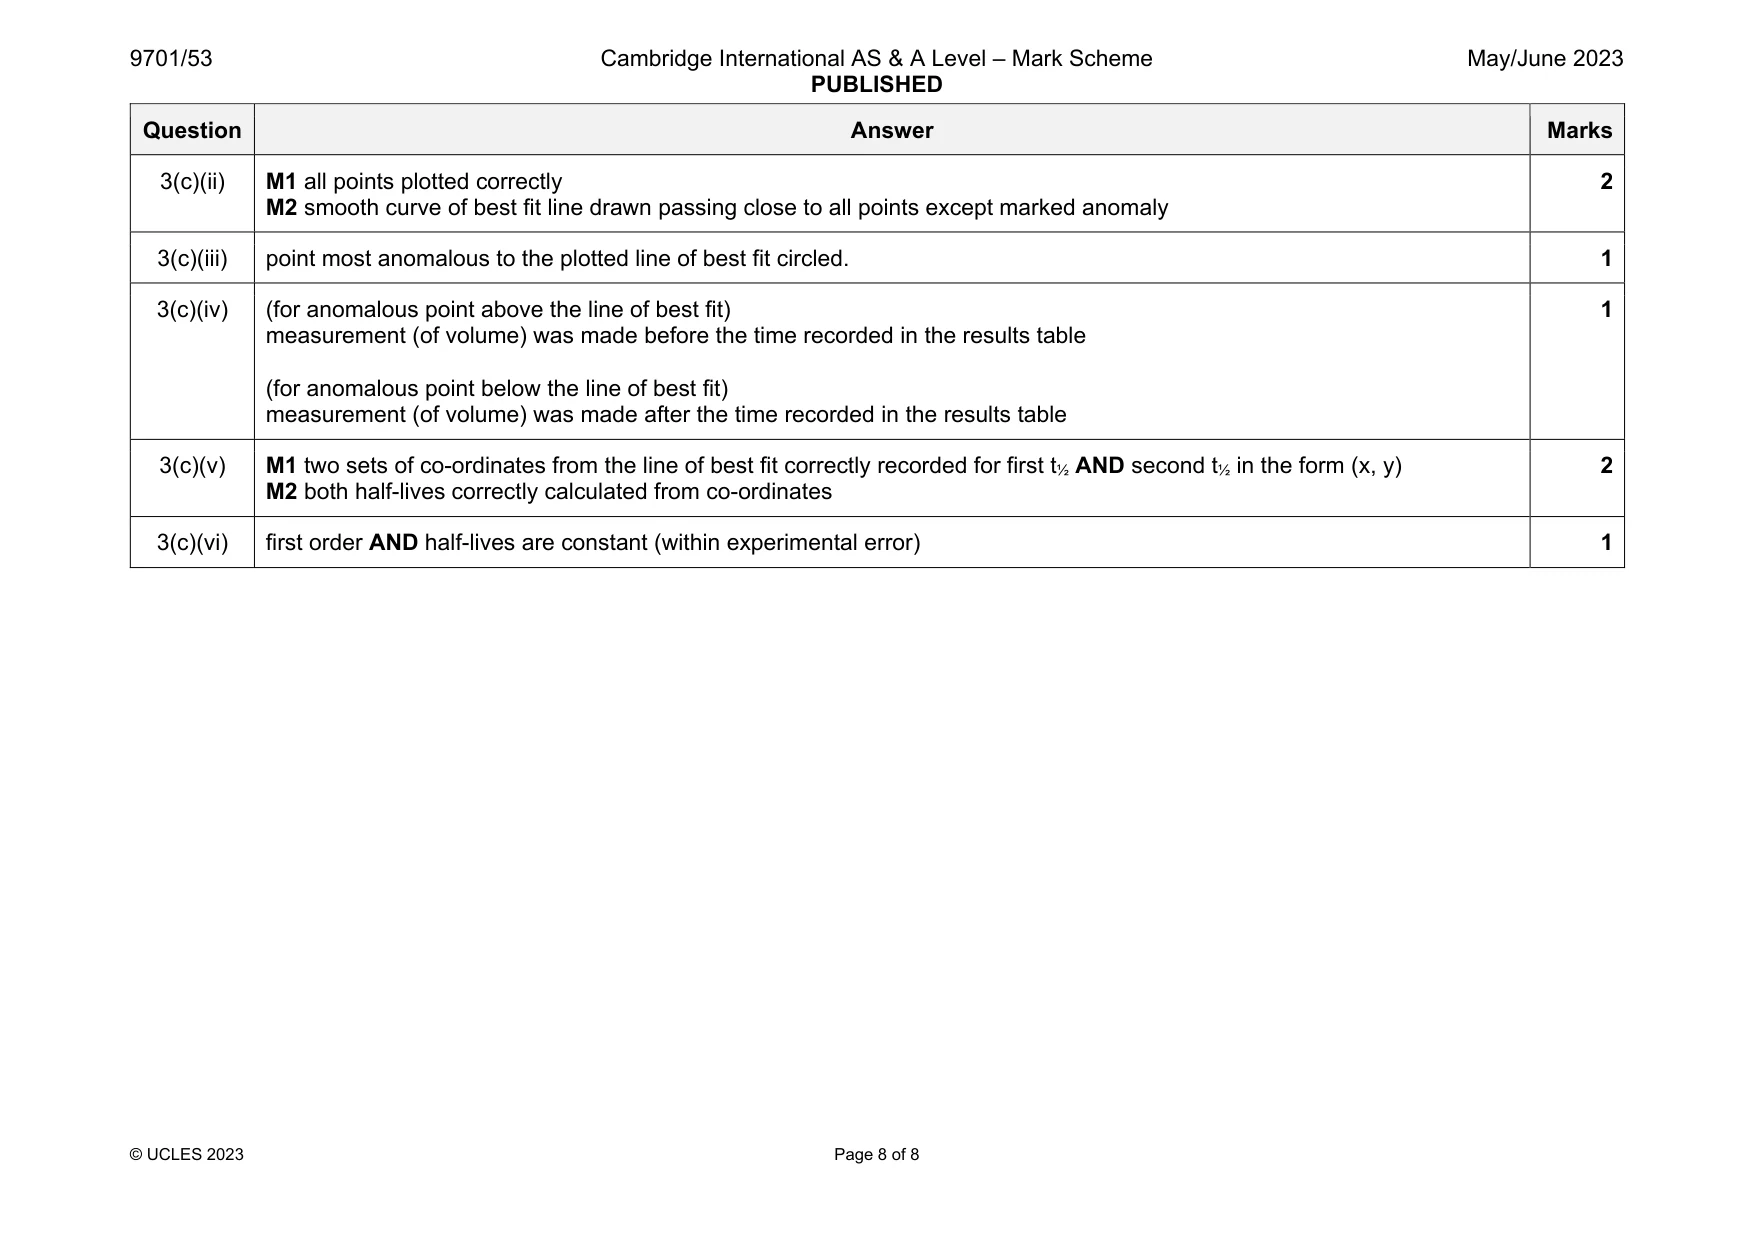
Mark scheme: 3(a) M1 add (a small volume of) distilled water (to the 50 cm3 beaker) AND dissolve the (aromatic diazonium) compound / solid M2 transfer the solution and washings (using a funnel) AND into a 100 cm3 volumetric flask M3 make up to the (calibration) mark / line with (distilled) water AND then mix the solution (by inverting the flask) 3(b)(i) thermostatically controlled water bath 1 3(b)(ii) volume of (nitrogen) gas (produced) 1 3(b)(iii) not possible to weigh apparatus (while temperature is maintained) in water bath 1 3(c)(i) time / min volume, Vt / cm3 Vfinal – Vt / cm3 0 0.0 57.2 5 17.3 39.9 9 27.0 30.2 16 39.5 17.7 21 42.6 14.6 28 49.0 8.2 36 52.8 4.4 final 57.2 0.0 1 Question Answer Marks 3(c)(ii) M1 all points plotted correctly M2 smooth curve of best fit line drawn passing close to all points except marked anomaly 2 3(c)(iii) point most anomalous to the plotted line of best fit circled. 1 3(c)(iv) (for anomalous point above the line of best fit) measurement (of volume) was made before the time recorded in the results table (for anomalous point below the line of best fit) measurement (of volume) was made after the time recorded in the results table 1 3(c)(v) M1 two sets of co-ordinates from the line of best fit correctly recorded for first t½ AND second t½ in the form (x, y) M2 both half-lives correctly calculated from co-ordinates 2 3(c)(vi) first order AND half-lives are constant (within experimental error) 1
What was in this paper
The subtopics covered by these 3 questions, and how many questions each got. Open one in a new tab to see every Cambridge question on it.
What you needed in this session
Cambridge’s own grade thresholds for 2023 May/June, Paper 5 · Variant 3. A higher threshold means an easier paper — the bar moves with how the cohort did.